Embed Size (px)
Citation preview

Spectroscopy
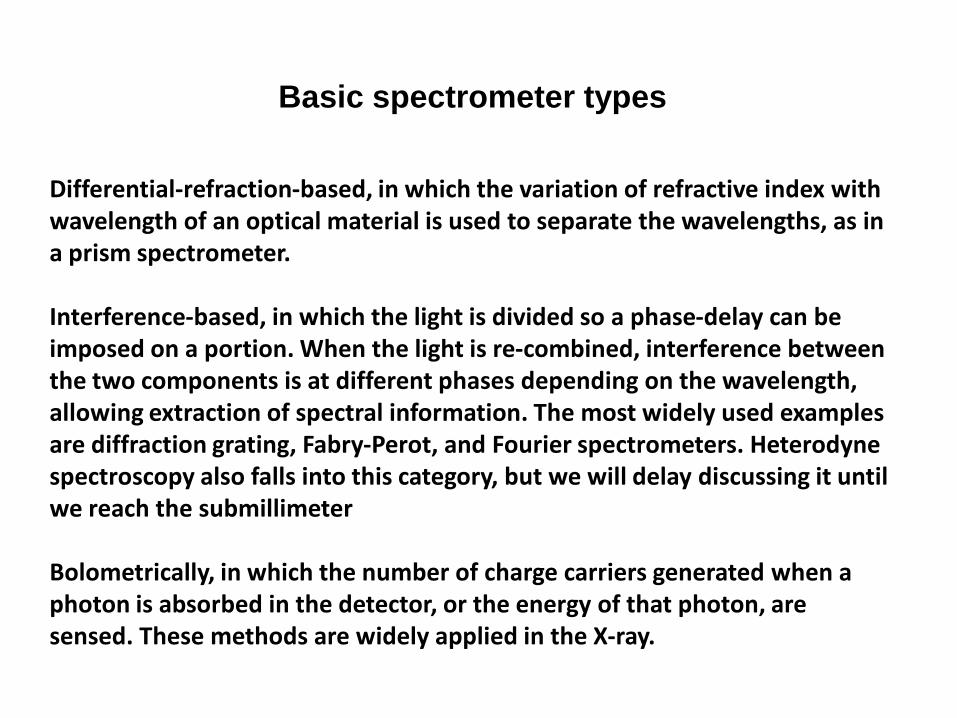
Differential-refraction-based, in which the variation of refractive index with wavelength of an optical material is used to separate the wavelengths, as in a prism spectrometer. Interference-based, in which the light is divided so a phase-delay can be imposed on a portion. When the light is re-combined, interference between the two components is at different phases depending on the wavelength, allowing extraction of spectral information. The most widely used examples are diffraction grating, Fabry-Perot, and Fourier spectrometers. Heterodyne spectroscopy also falls into this category, but we will delay discussing it until we reach the submillimeter Bolometrically, in which the number of charge carriers generated when a photon is absorbed in the detector, or the energy of that photon, are sensed. These methods are widely applied in the X-ray.
Basic spectrometer types
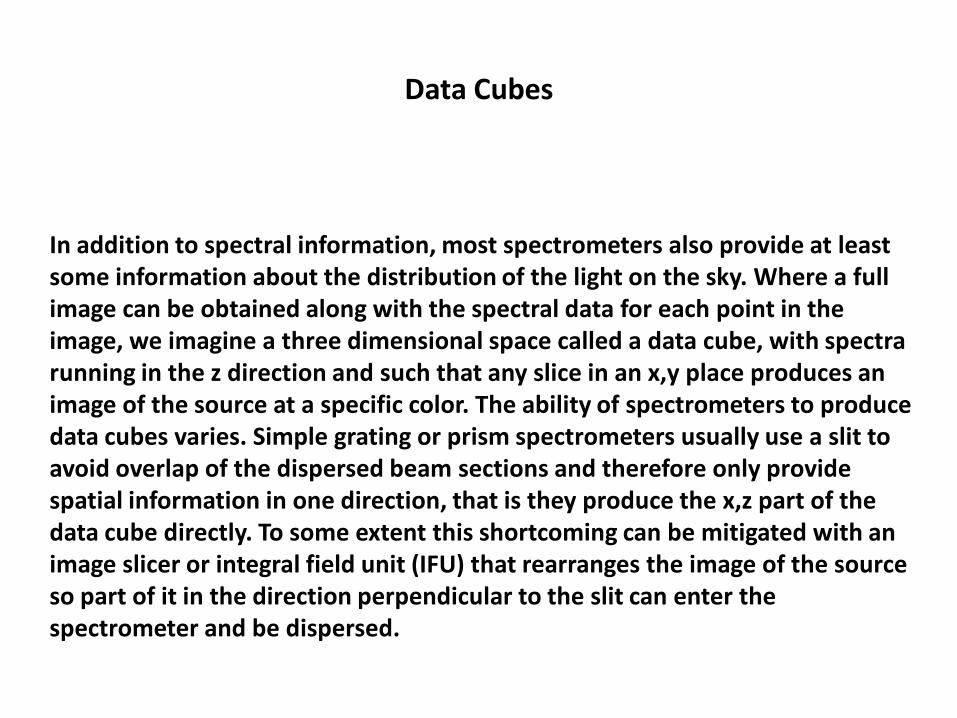
Data Cubes
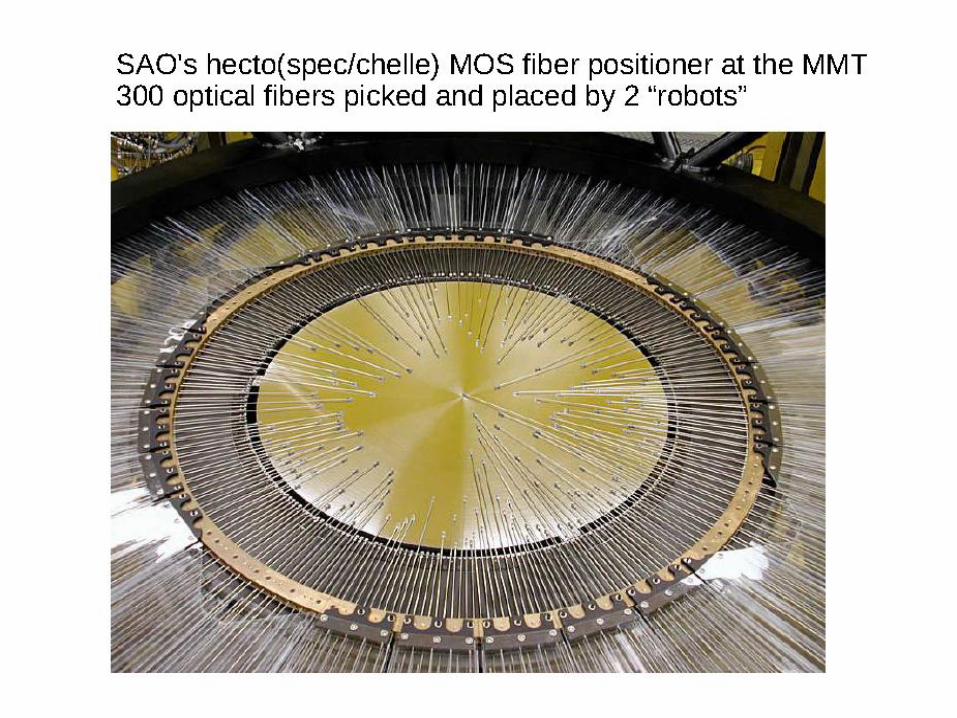
In addition to spectral information, most spectrometers also provide at least some information about the distribution of the light on the sky. Where a full image can be obtained along with the spectral data for each point in the image, we imagine a three dimensional space called a data cube, with spectra running in the z direction and such that any slice in an x,y place produces an image of the source at a specific color. The ability of spectrometers to produce data cubes varies. Simple grating or prism spectrometers usually use a slit to avoid overlap of the dispersed beam sections and therefore only provide spatial information in one direction, that is they produce the x,z part of the data cube directly. To some extent this shortcoming can be mitigated with an image slicer or integral field unit (IFU) that rearranges the image of the source so part of it in the direction perpendicular to the slit can enter the spectrometer and be dispersed.
)2()(2
2
2
2
1
2
2
12
C
B
C
BAn
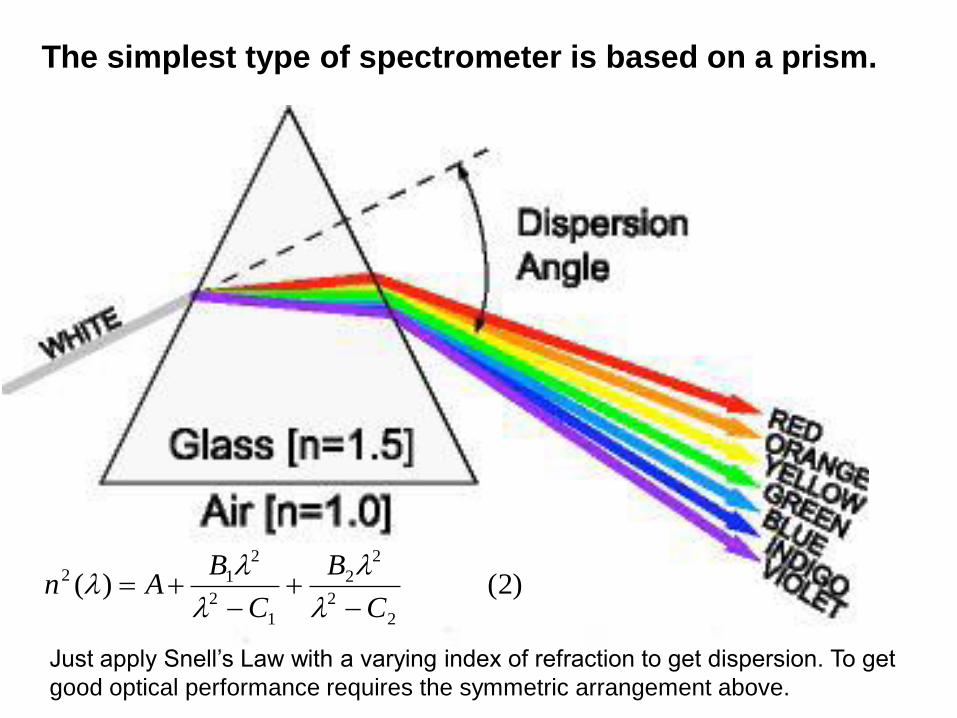
The simplest type of spectrometer is based on a prism.
Just apply Snell’s Law with a varying index of refraction to get dispersion. To get
good optical performance requires the symmetric arrangement above.
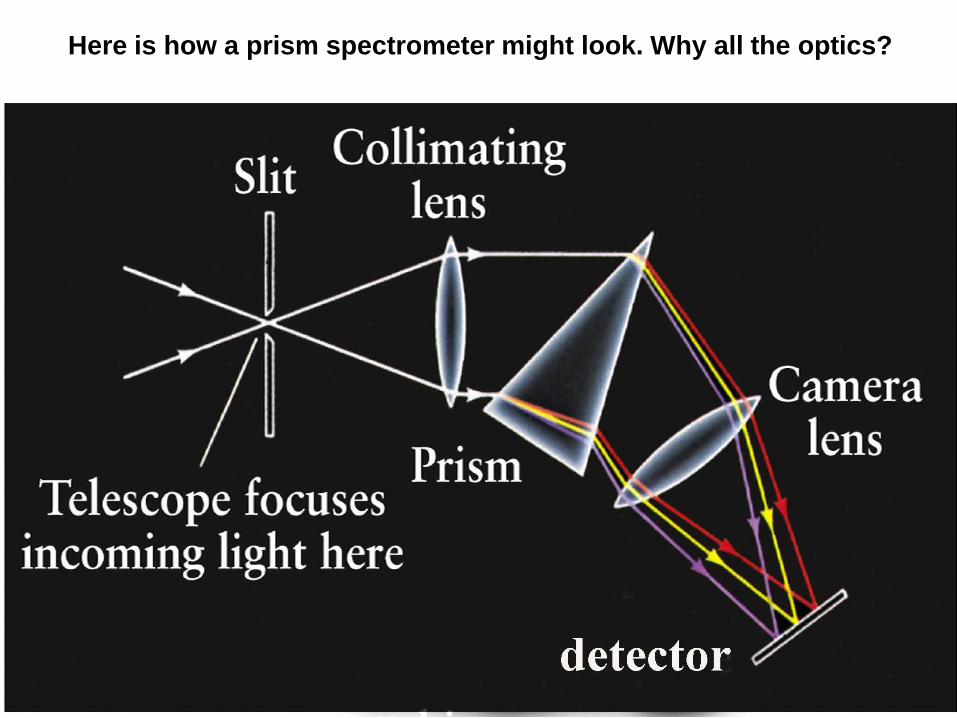
Here is how a prism spectrometer might look. Why all the optics?
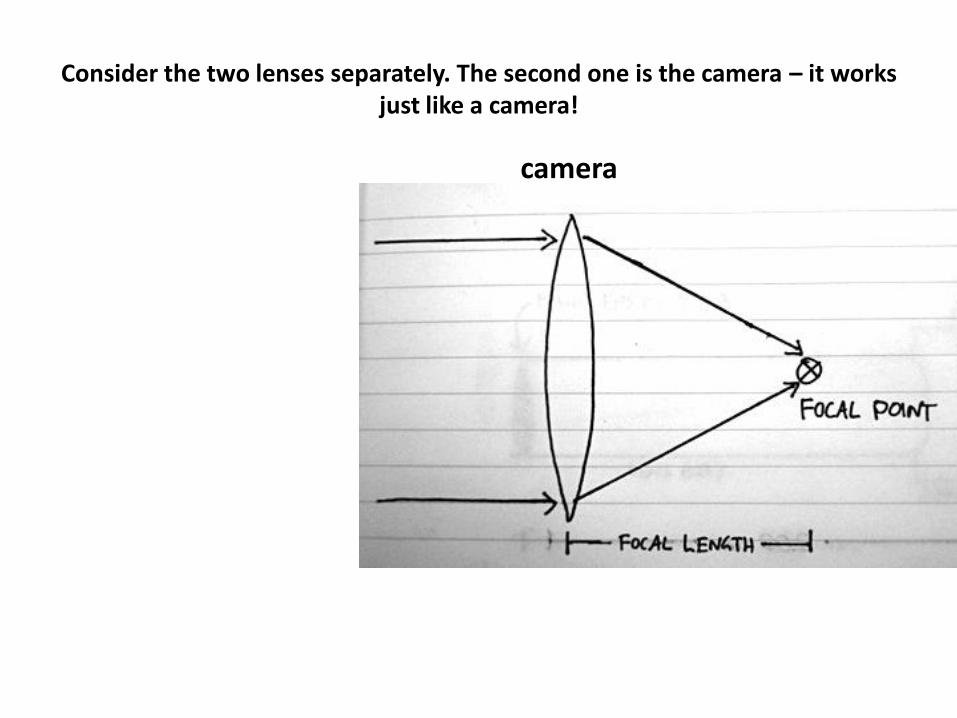
Consider the two lenses separately. The second one is the camera – it works just like a camera!
camera
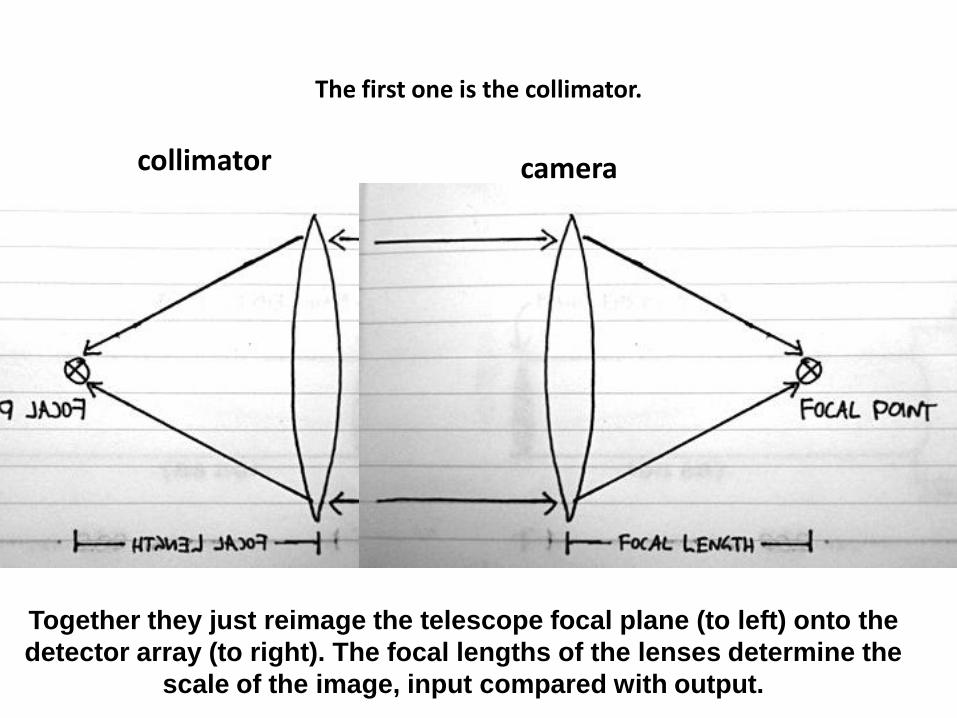
The first one is the collimator.
camera collimator
Together they just reimage the telescope focal plane (to left) onto the
detector array (to right). The focal lengths of the lenses determine the
scale of the image, input compared with output.
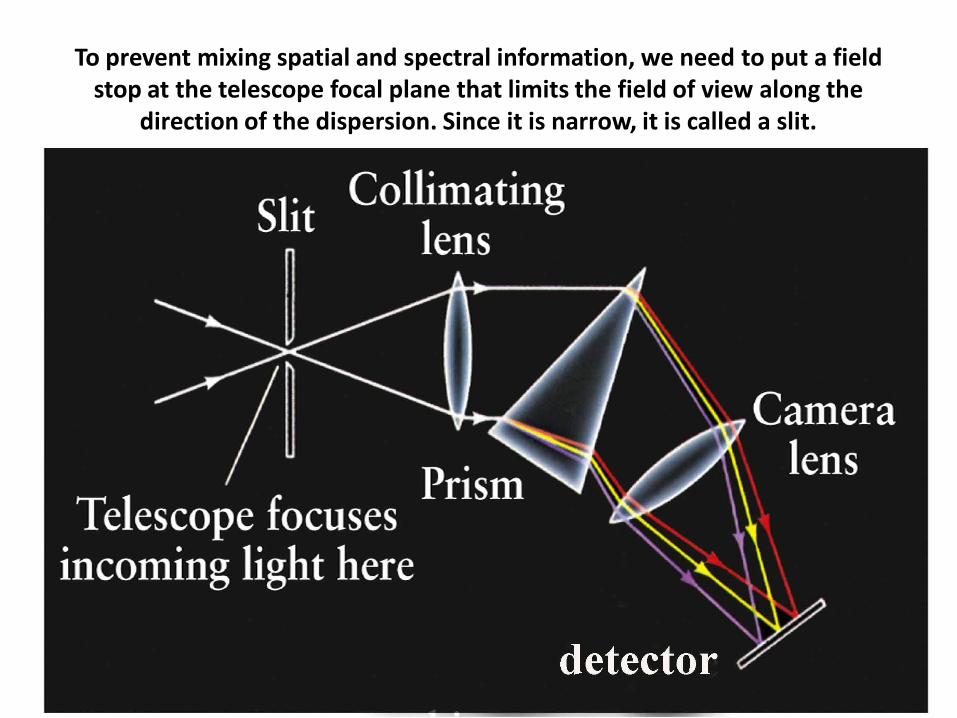
To prevent mixing spatial and spectral information, we need to put a field stop at the telescope focal plane that limits the field of view along the
direction of the dispersion. Since it is narrow, it is called a slit.
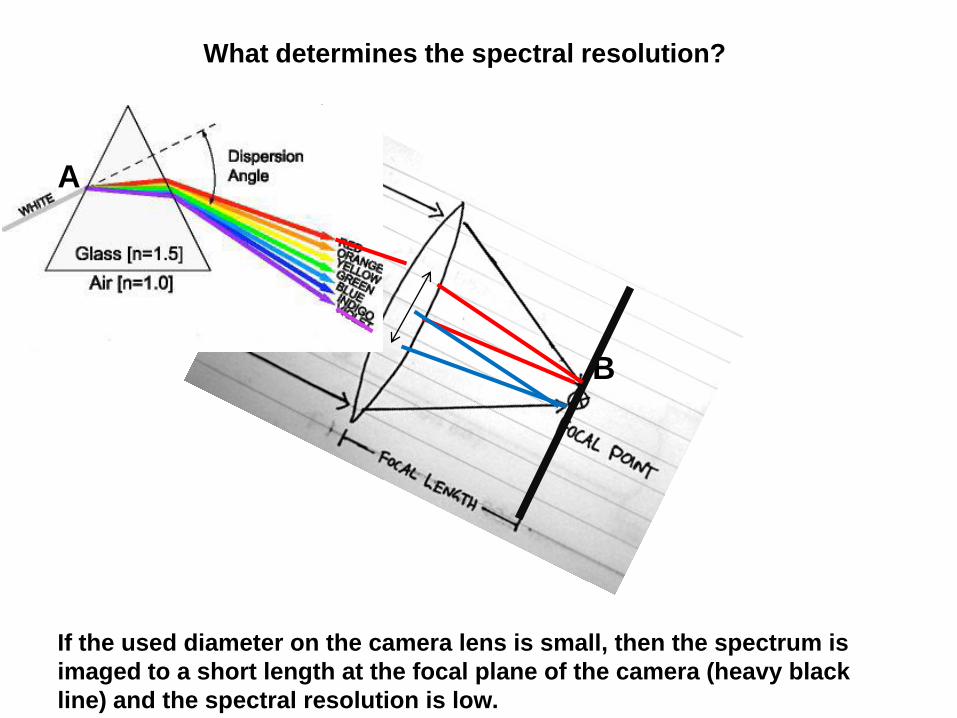
What determines the spectral resolution?
A
B
If the used diameter on the camera lens is small, then the spectrum is
imaged to a short length at the focal plane of the camera (heavy black
line) and the spectral resolution is low.
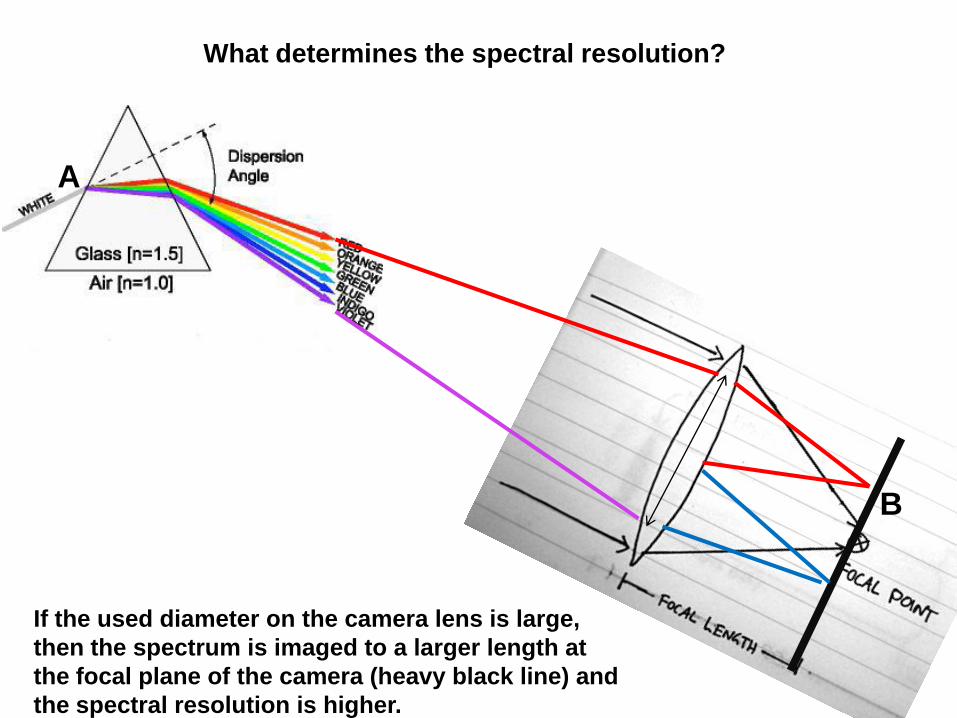
What determines the spectral resolution?
A
B
If the used diameter on the camera lens is large,
then the spectrum is imaged to a larger length at
the focal plane of the camera (heavy black line) and
the spectral resolution is higher.
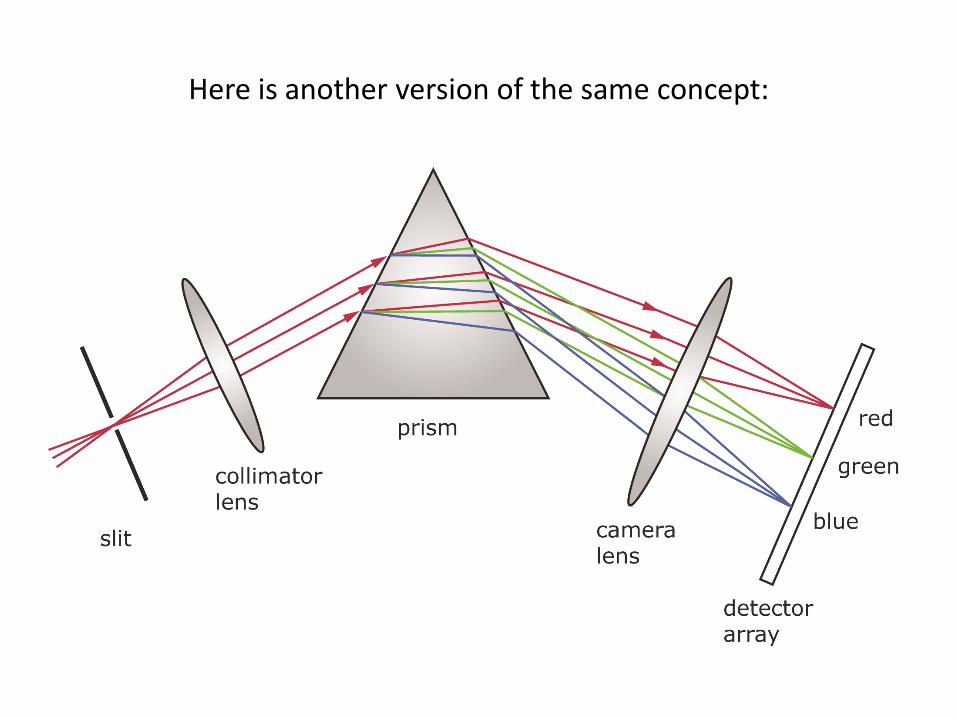
Here is another version of the same concept:
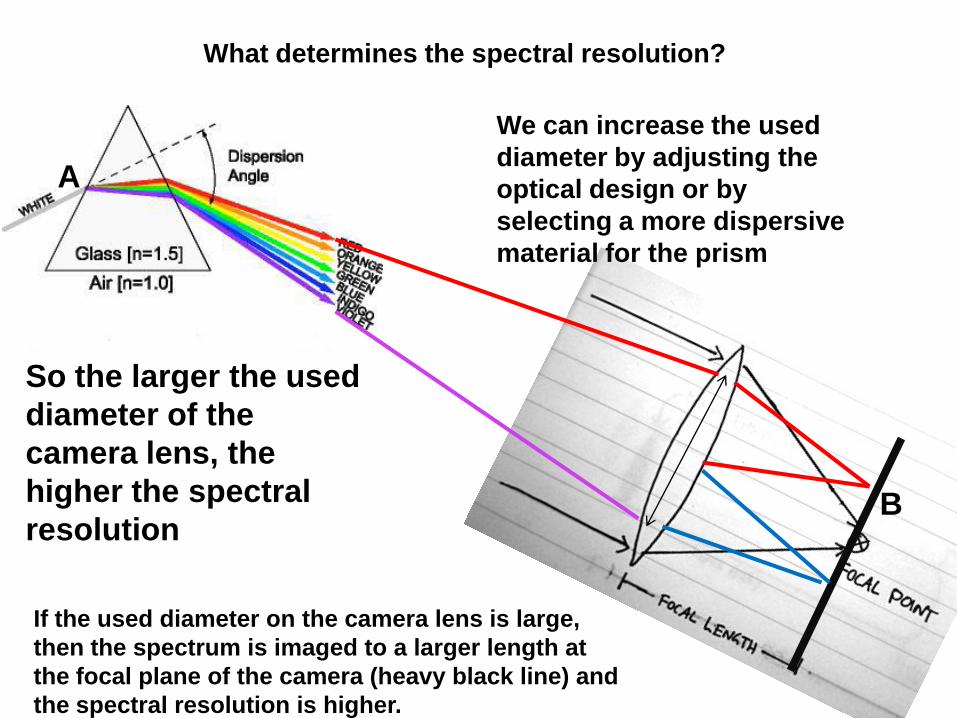
What determines the spectral resolution?
A
B
If the used diameter on the camera lens is large,
then the spectrum is imaged to a larger length at
the focal plane of the camera (heavy black line) and
the spectral resolution is higher.
So the larger the used
diameter of the
camera lens, the
higher the spectral
resolution
We can increase the used
diameter by adjusting the
optical design or by
selecting a more dispersive
material for the prism
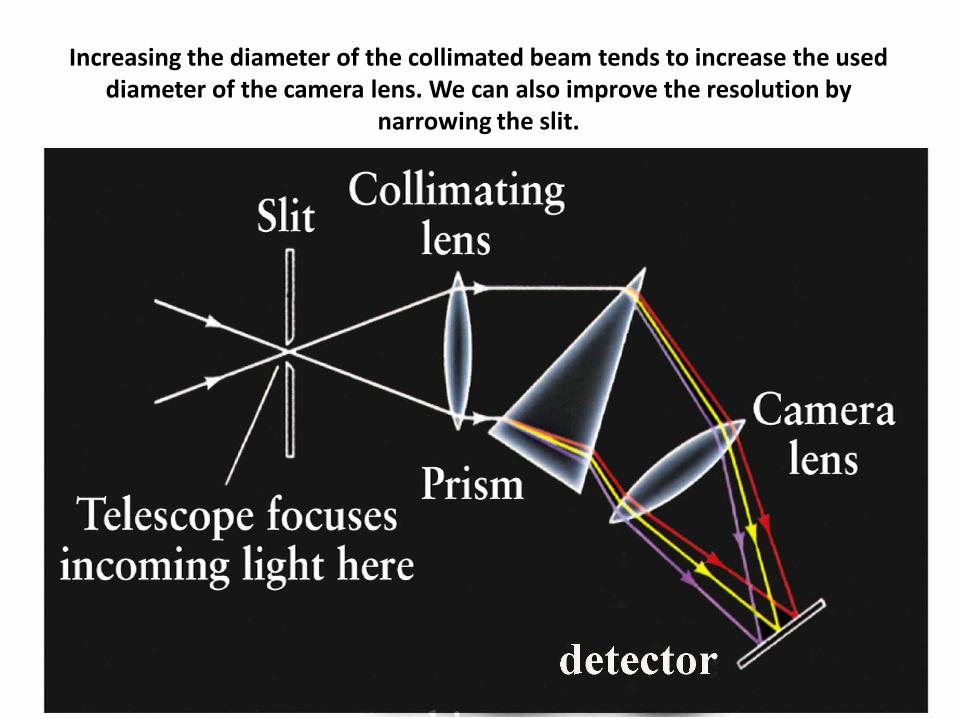
Increasing the diameter of the collimated beam tends to increase the used diameter of the camera lens. We can also improve the resolution by
narrowing the slit.
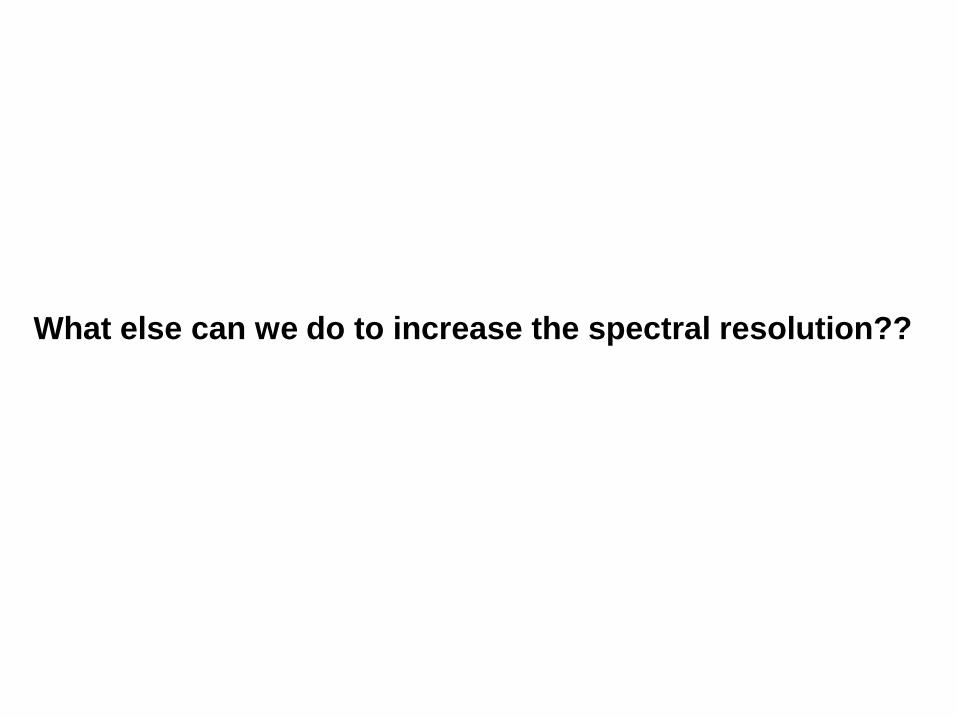
What else can we do to increase the spectral resolution??

Nothing!!!!
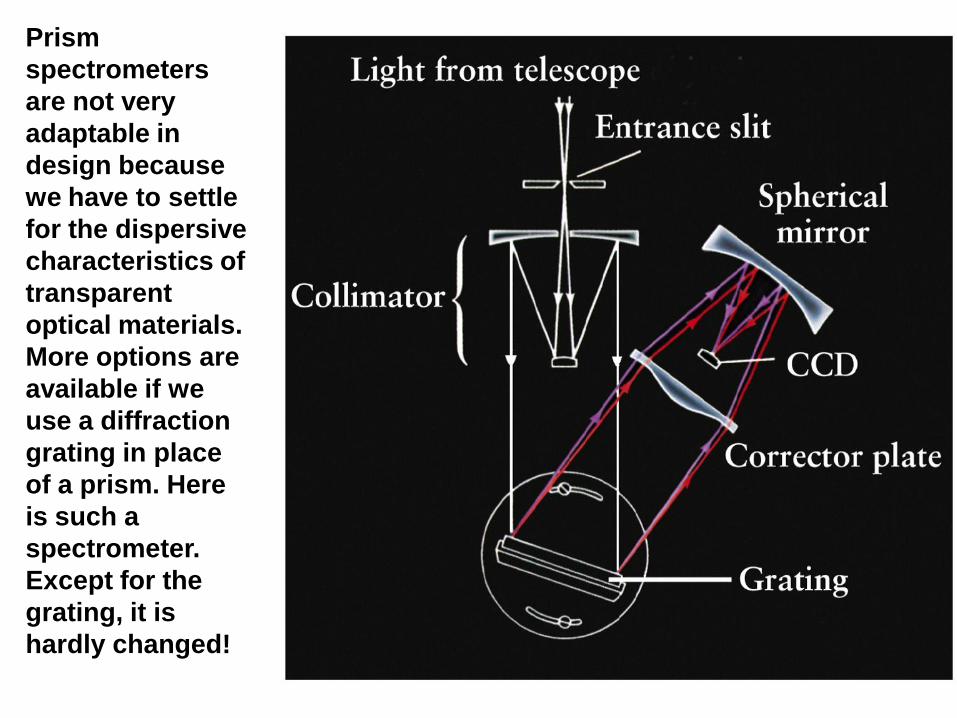
Prism
spectrometers
are not very
adaptable in
design because
we have to settle
for the dispersive
characteristics of
transparent
optical materials.
More options are
available if we
use a diffraction
grating in place
of a prism. Here
is such a
spectrometer.
Except for the
grating, it is
hardly changed!
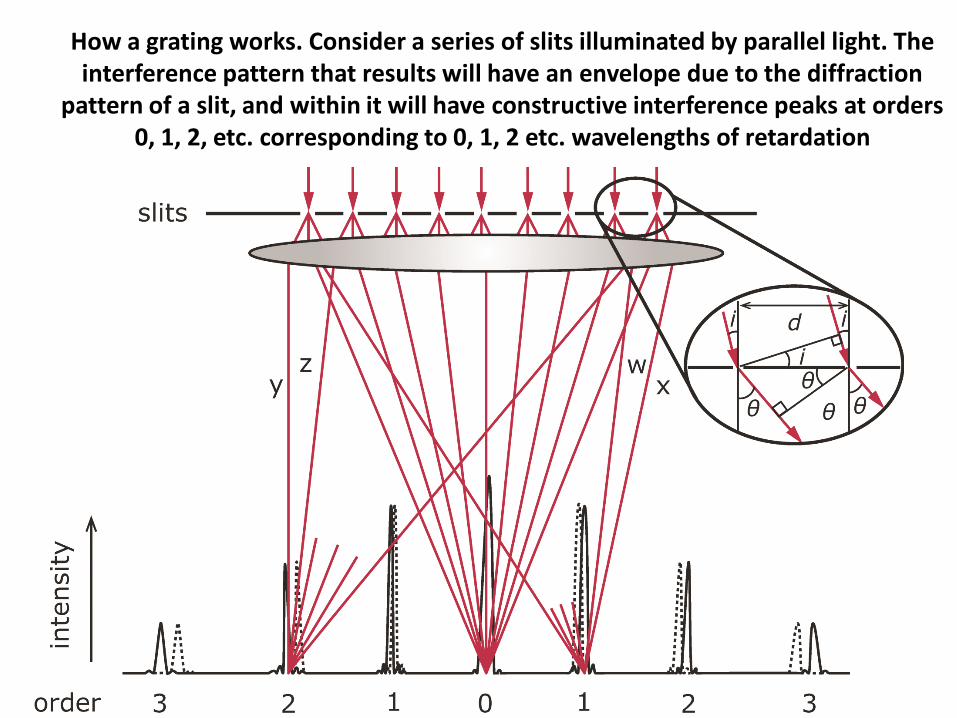
How a grating works. Consider a series of slits illuminated by parallel light. The interference pattern that results will have an envelope due to the diffraction
pattern of a slit, and within it will have constructive interference peaks at orders 0, 1, 2, etc. corresponding to 0, 1, 2 etc. wavelengths of retardation
)3(sinsin didp
)6(sin
sin
sinsin
)2/(sin
)2/(sin)(
2
2
2
2
22
d
dN
aNa
AAI
)7(sin
sinsin
)(2
2
0
2
w
w
IaI slit
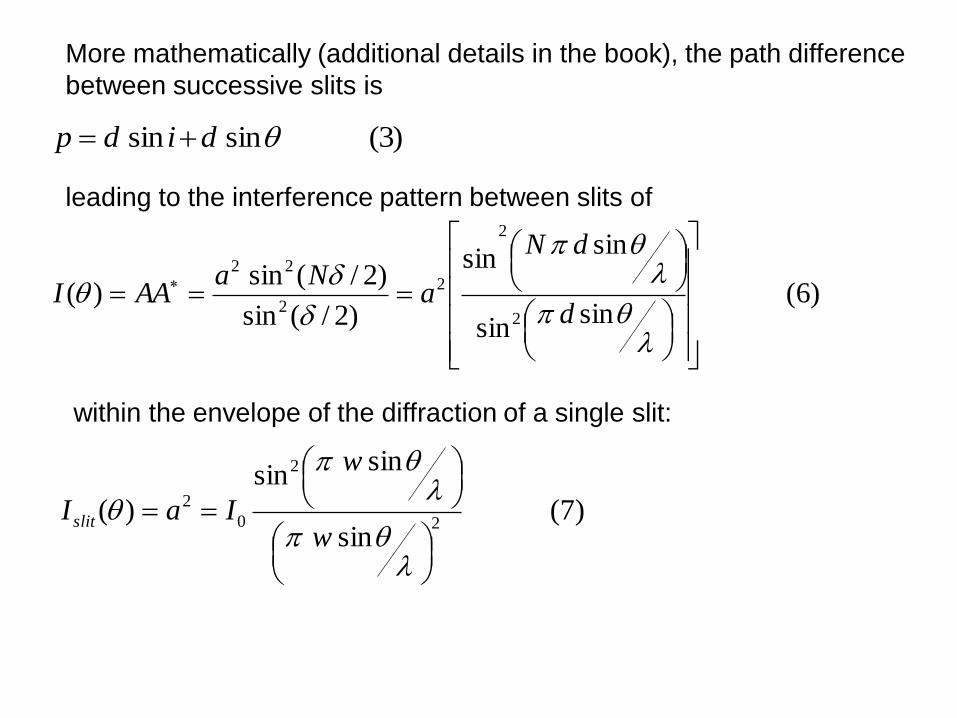
More mathematically (additional details in the book), the path difference
between successive slits is
leading to the interference pattern between slits of
within the envelope of the diffraction of a single slit:
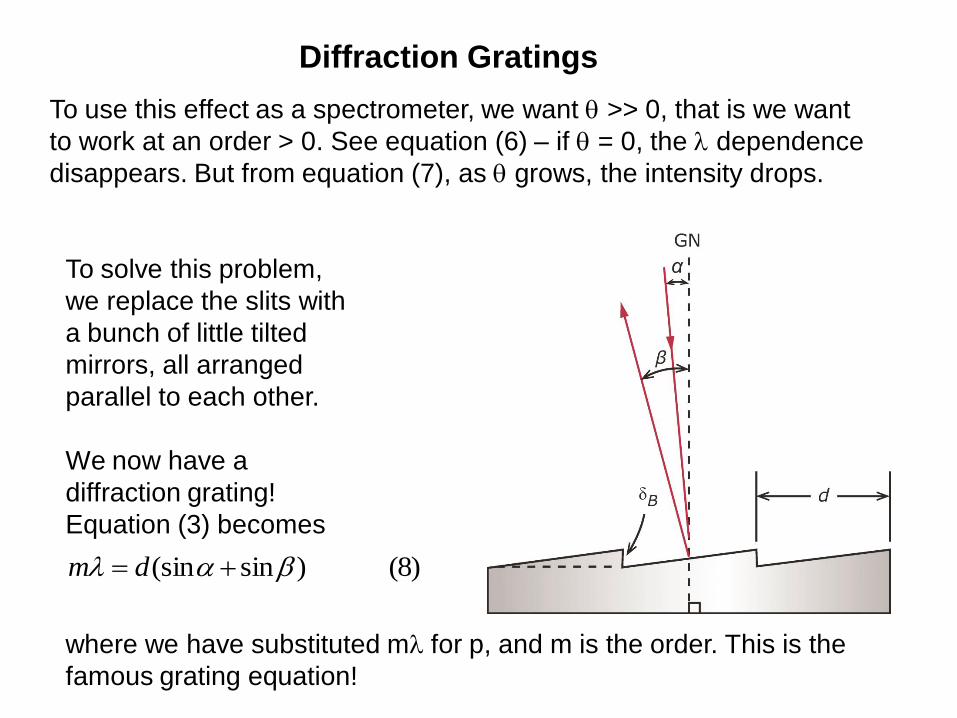
To use this effect as a spectrometer, we want >> 0, that is we want
to work at an order > 0. See equation (6) – if = 0, the dependence
disappears. But from equation (7), as grows, the intensity drops.
To solve this problem,
we replace the slits with
a bunch of little tilted
mirrors, all arranged
parallel to each other.
We now have a
diffraction grating!
Equation (3) becomes
)8()sin(sin dm
where we have substituted m for p, and m is the order. This is the
famous grating equation!
Diffraction Gratings
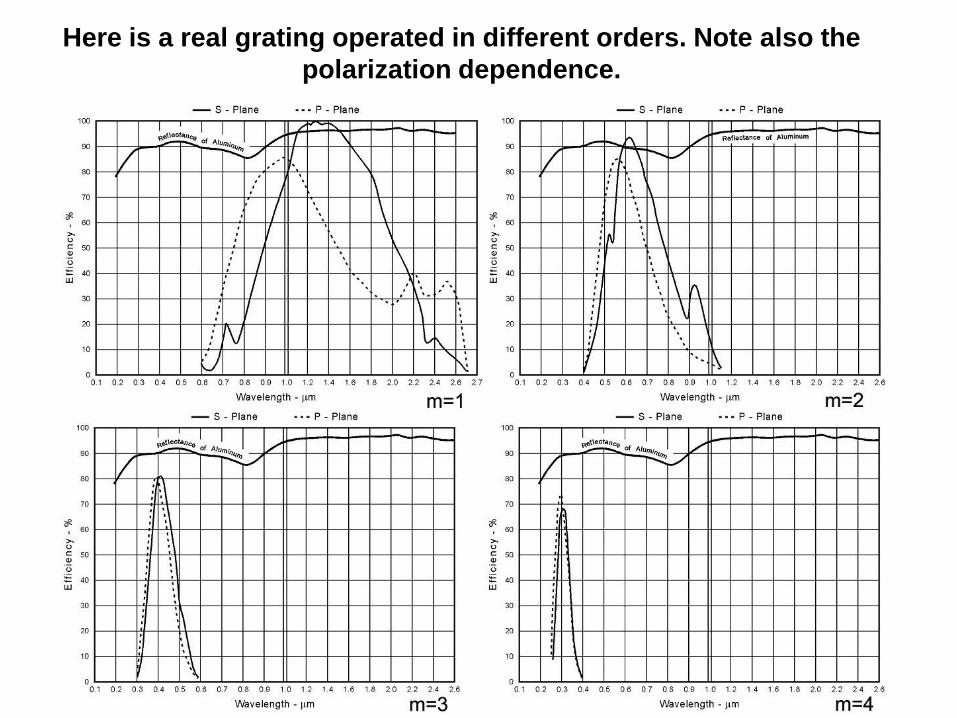
Here is a real grating operated in different orders. Note also the
polarization dependence.
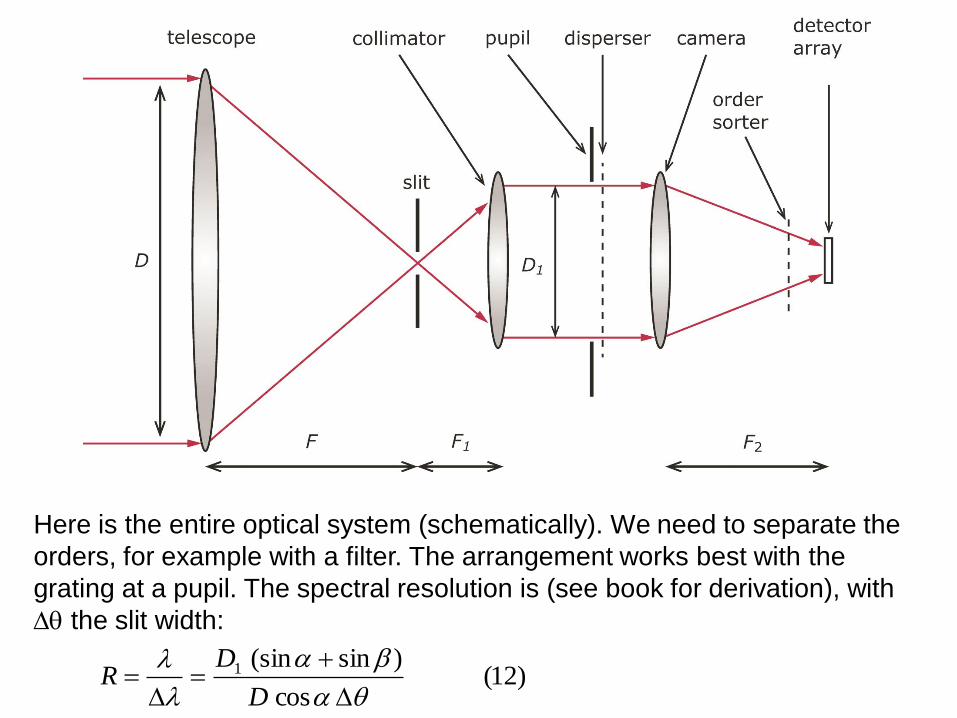
)12(cos
)sin(sin1
D
DR
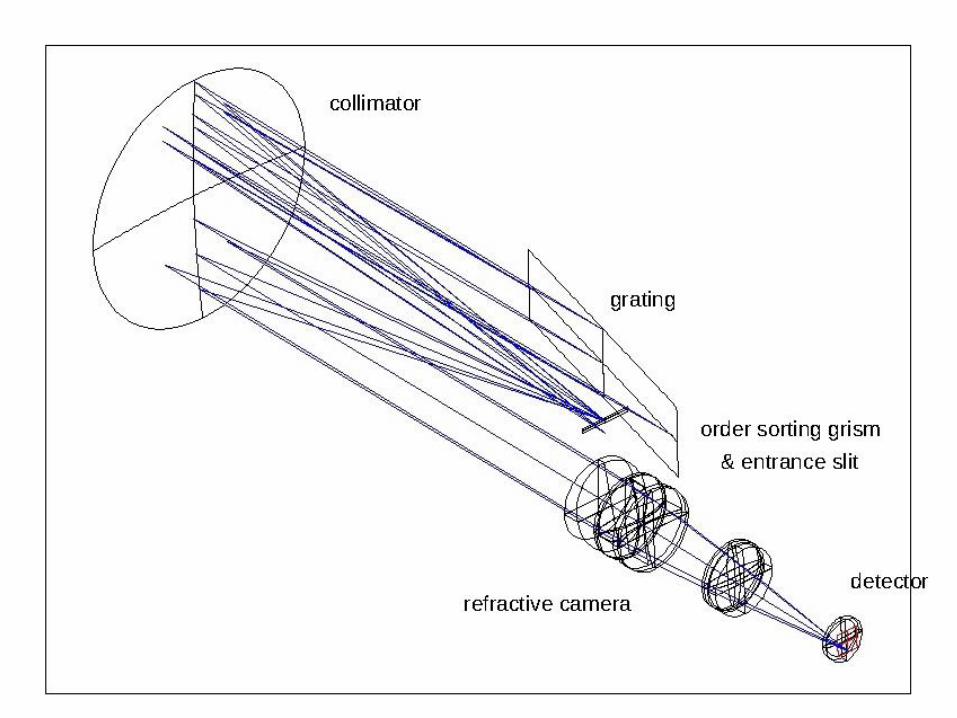
Here is the entire optical system (schematically). We need to separate the
orders, for example with a filter. The arrangement works best with the
grating at a pupil. The spectral resolution is (see book for derivation), with
the slit width:
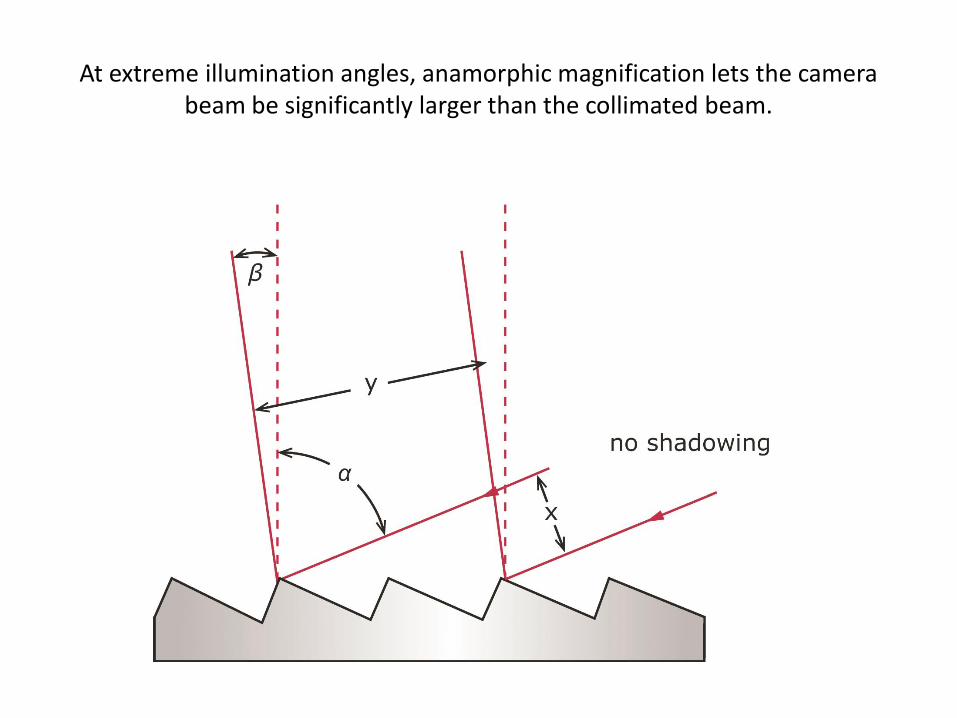
At extreme illumination angles, anamorphic magnification lets the camera beam be significantly larger than the collimated beam.
This remains simple, just as we found for the prism spectrograph. For example,
The resolution: 1.) goes inversely as the size of the telescope
(assuming equal projected slit width); 2.) increases with increasing
tilt of the grating; 3.) goes inversely as the field projected onto the
sky, i.e., the slit width; and 4.) goes in proportion to the diameter of
the beam delivered to the camera.
In exchange for our “designer disperser” we have to separate its
orders.
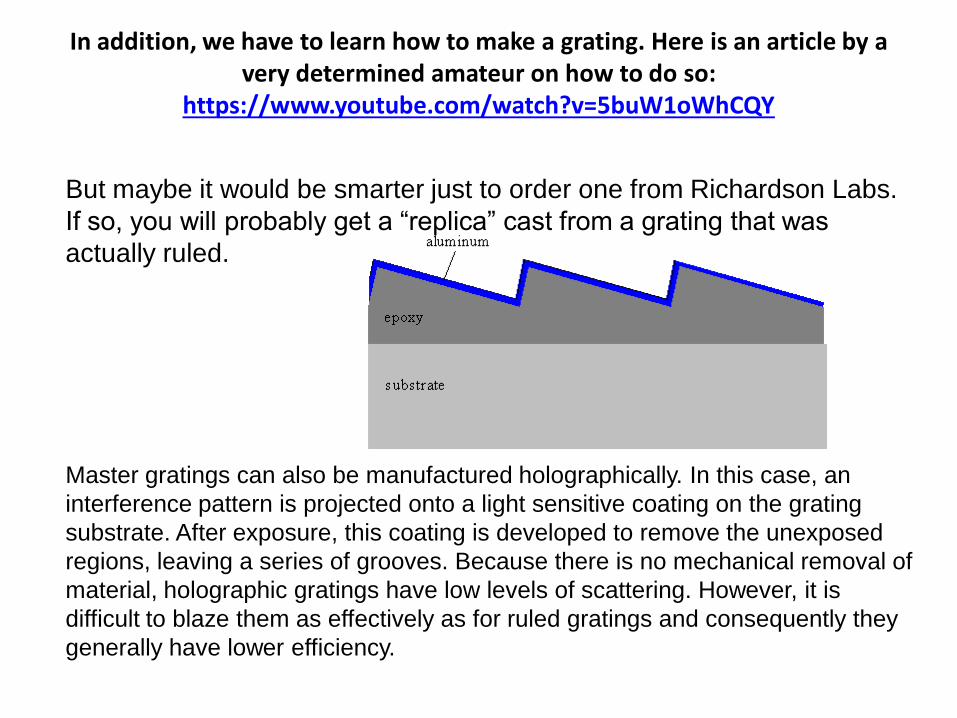
In addition, we have to learn how to make a grating. Here is an article by a very determined amateur on how to do so:
https://www.youtube.com/watch?v=5buW1oWhCQY
But maybe it would be smarter just to order one from Richardson Labs.
If so, you will probably get a “replica” cast from a grating that was
actually ruled.
Master gratings can also be manufactured holographically. In this case, an
interference pattern is projected onto a light sensitive coating on the grating
substrate. After exposure, this coating is developed to remove the unexposed
regions, leaving a series of grooves. Because there is no mechanical removal of
material, holographic gratings have low levels of scattering. However, it is
difficult to blaze them as effectively as for ruled gratings and consequently they
generally have lower efficiency.
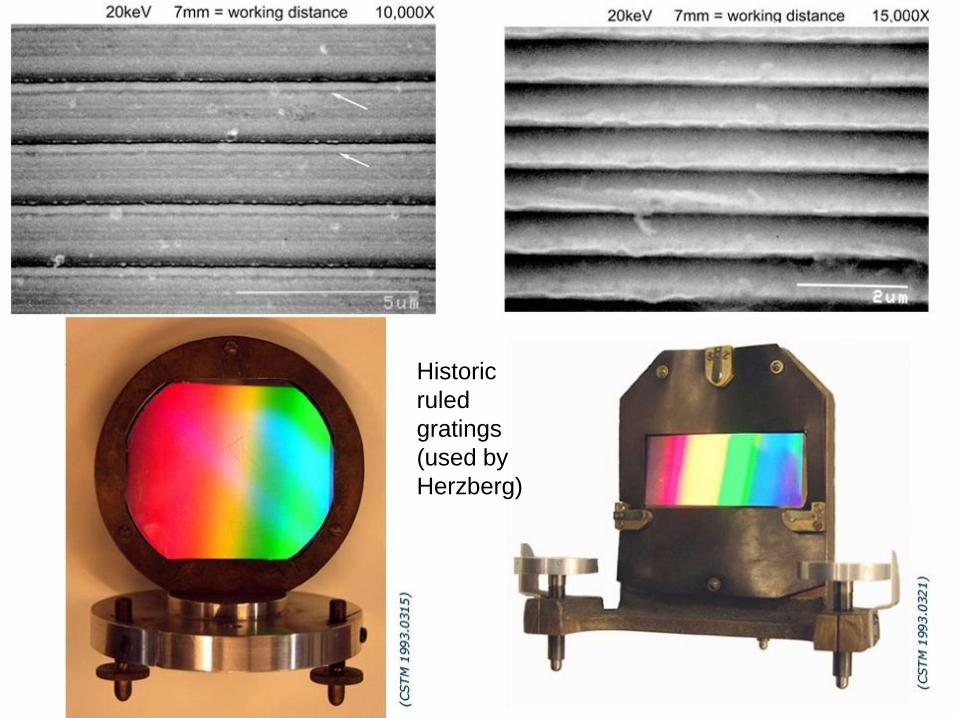
Historic
ruled
gratings
(used by
Herzberg)
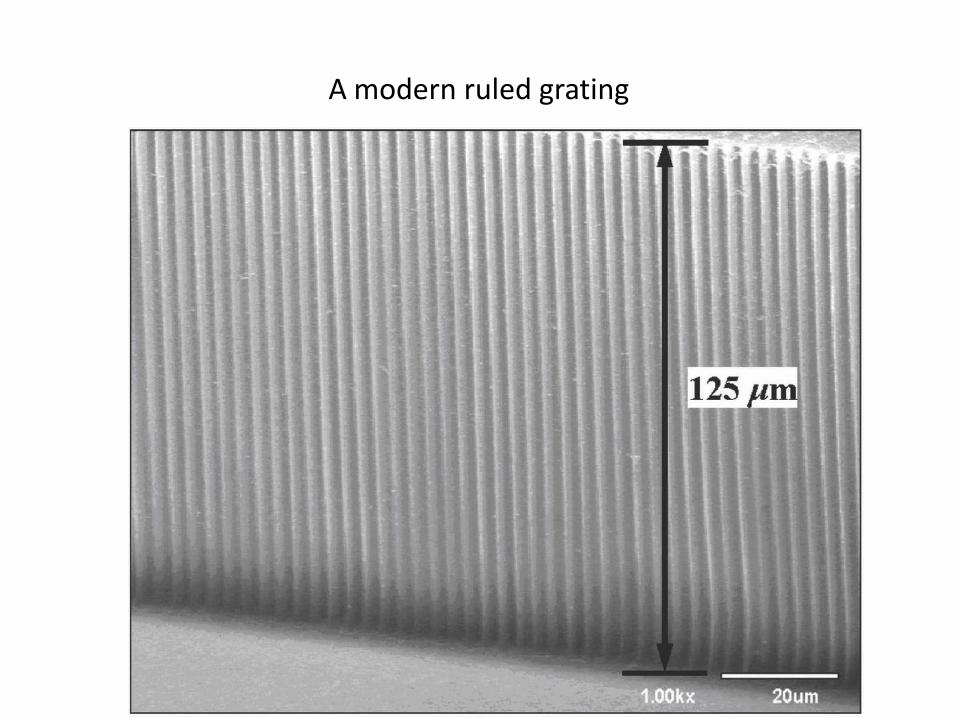
A modern ruled grating
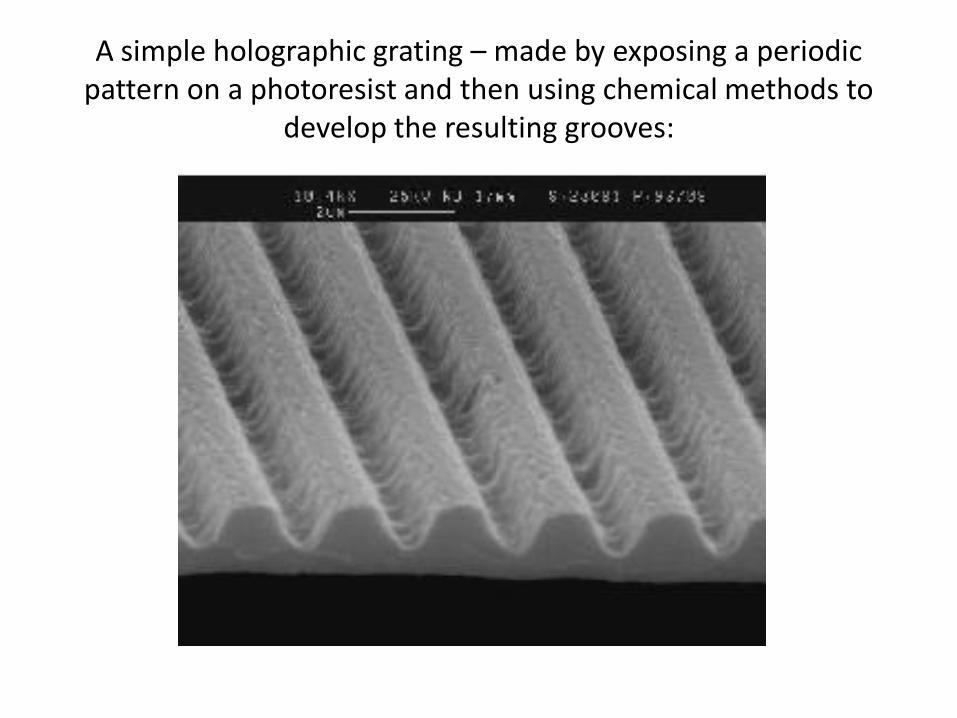
A simple holographic grating – made by exposing a periodic pattern on a photoresist and then using chemical methods to
develop the resulting grooves:
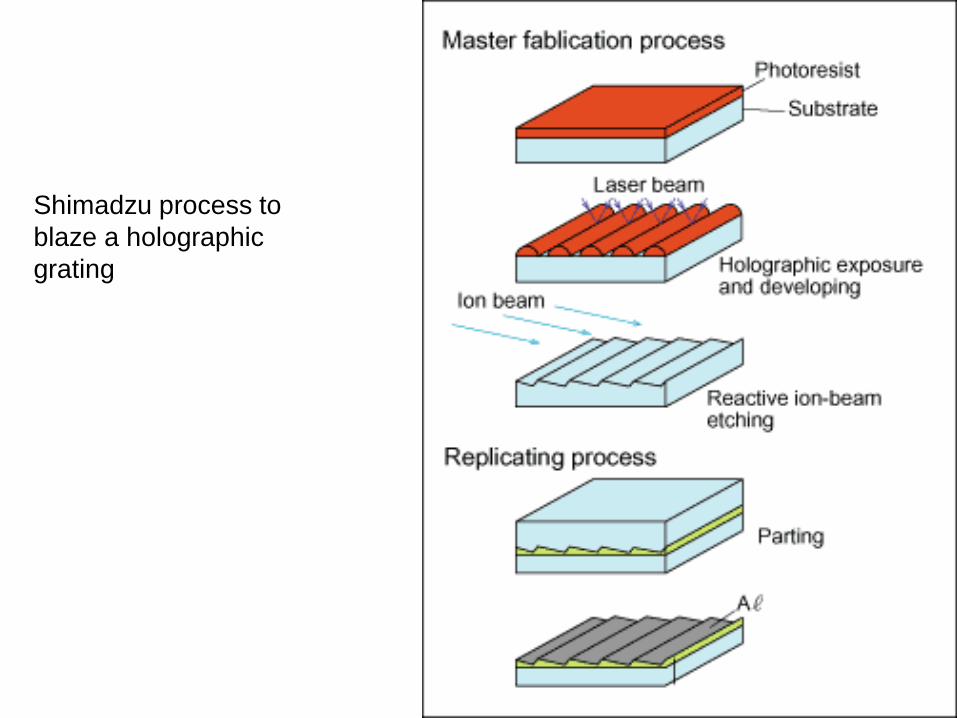
Shimadzu process to
blaze a holographic
grating
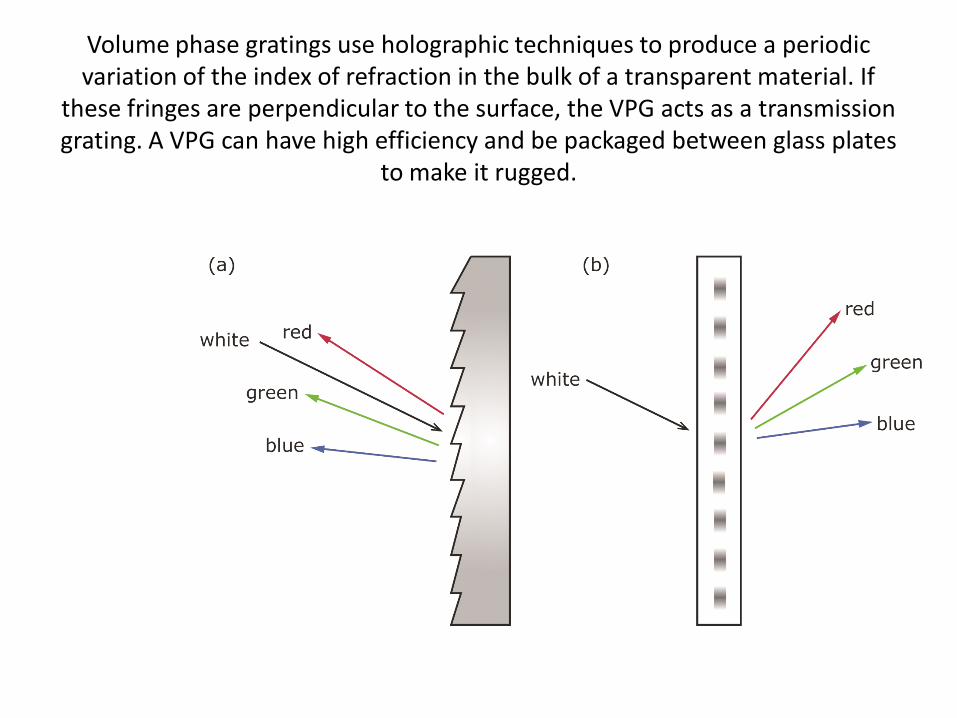
Volume phase gratings use holographic techniques to produce a periodic variation of the index of refraction in the bulk of a transparent material. If
these fringes are perpendicular to the surface, the VPG acts as a transmission grating. A VPG can have high efficiency and be packaged between glass plates
to make it rugged.
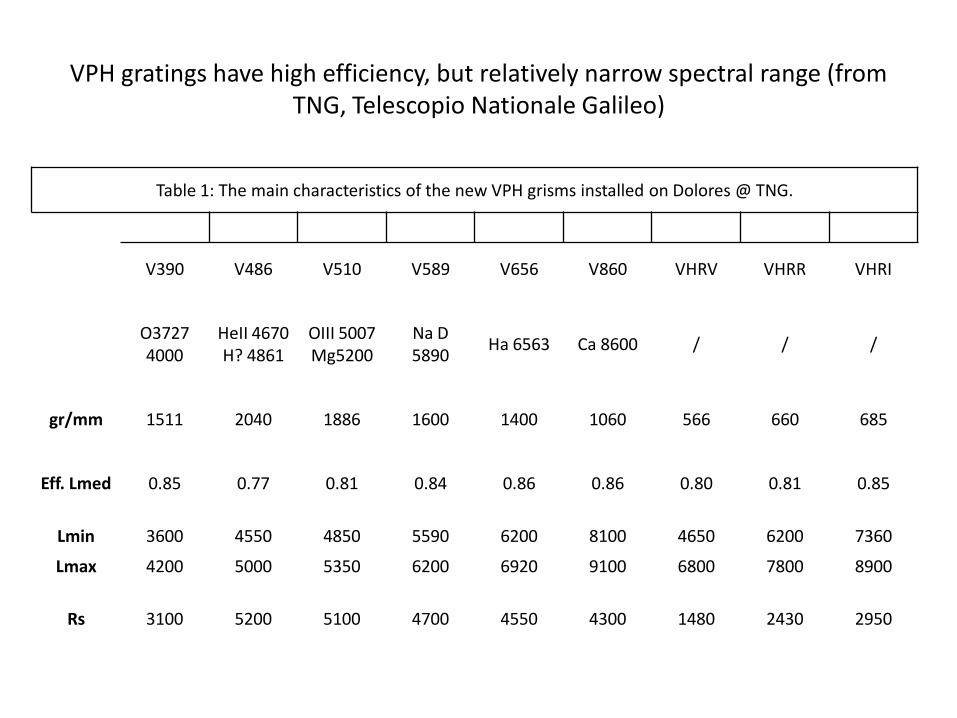
VPH gratings have high efficiency, but relatively narrow spectral range (from TNG, Telescopio Nationale Galileo)
Table 1: The main characteristics of the new VPH grisms installed on Dolores @ TNG.
V390 V486 V510 V589 V656 V860 VHRV VHRR VHRI
O3727 4000
HeII 4670 H? 4861
OIII 5007 Mg5200
Na D 5890
Ha 6563 Ca 8600 / / /
gr/mm 1511 2040 1886 1600 1400 1060 566 660 685
Eff. Lmed 0.85 0.77 0.81 0.84 0.86 0.86 0.80 0.81 0.85
Lmin 3600 4550 4850 5590 6200 8100 4650 6200 7360
Lmax 4200 5000 5350 6200 6920 9100 6800 7800 8900
Rs 3100 5200 5100 4700 4550 4300 1480 2430
2950
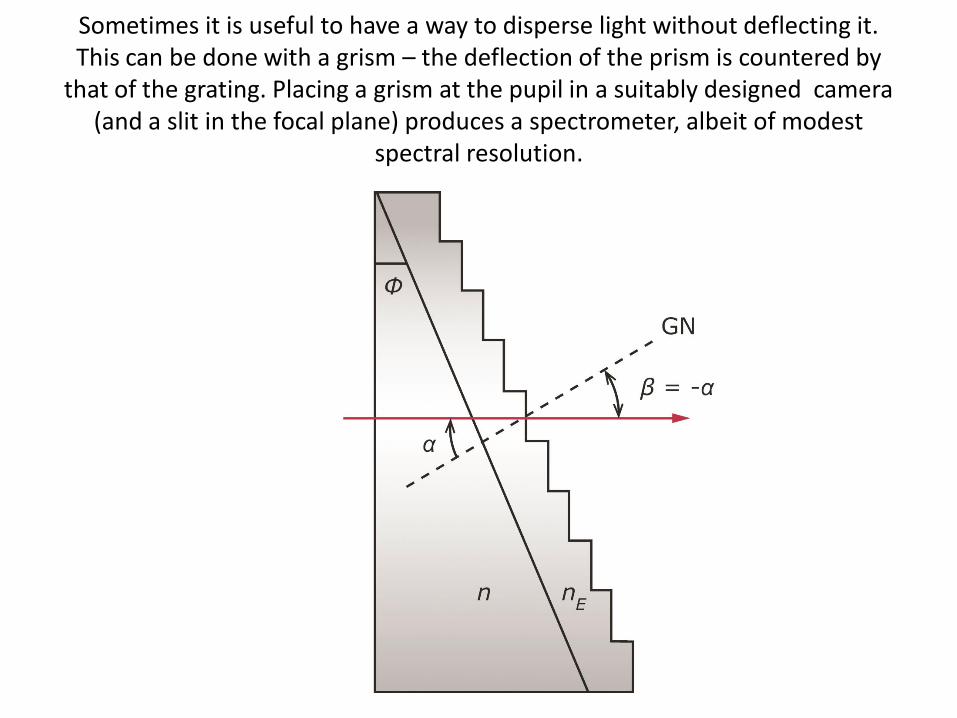
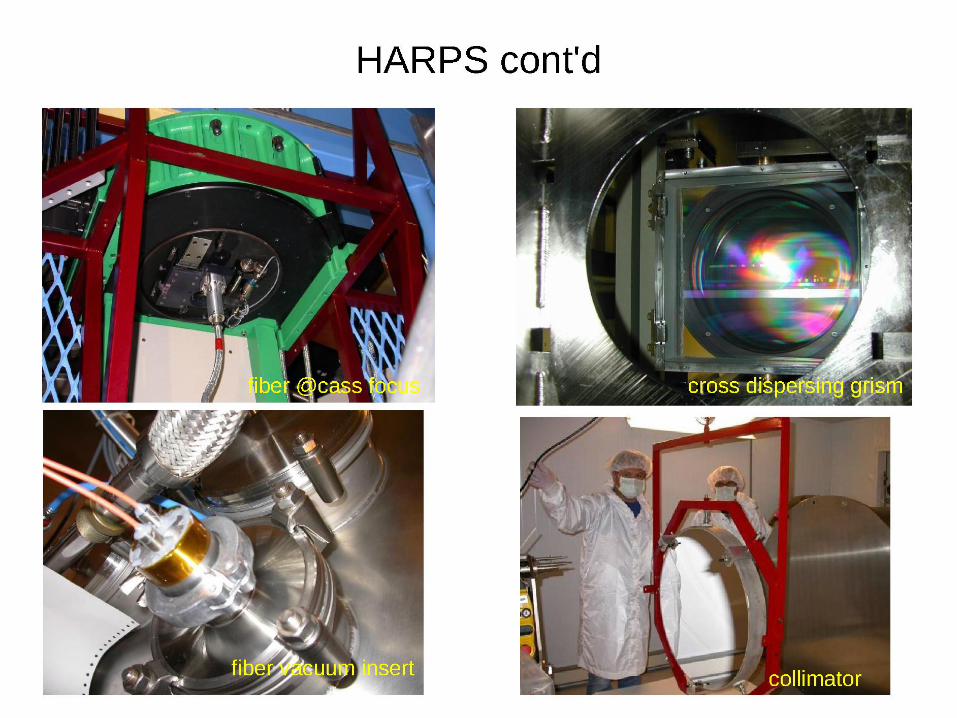
Sometimes it is useful to have a way to disperse light without deflecting it. This can be done with a grism – the deflection of the prism is countered by
that of the grating. Placing a grism at the pupil in a suitably designed camera (and a slit in the focal plane) produces a spectrometer, albeit of modest
spectral resolution.
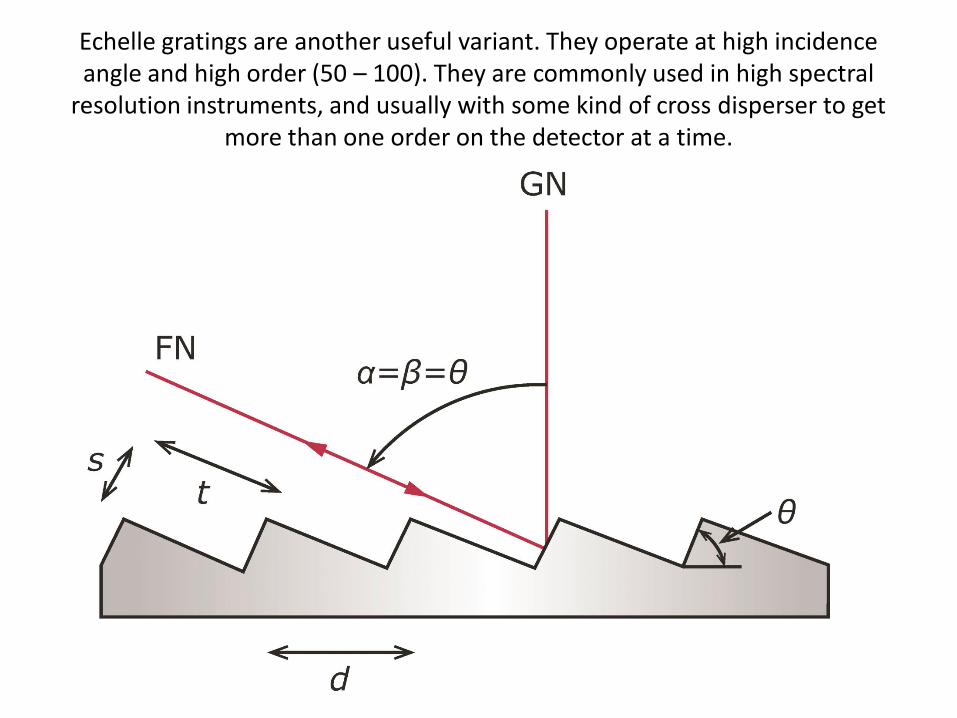
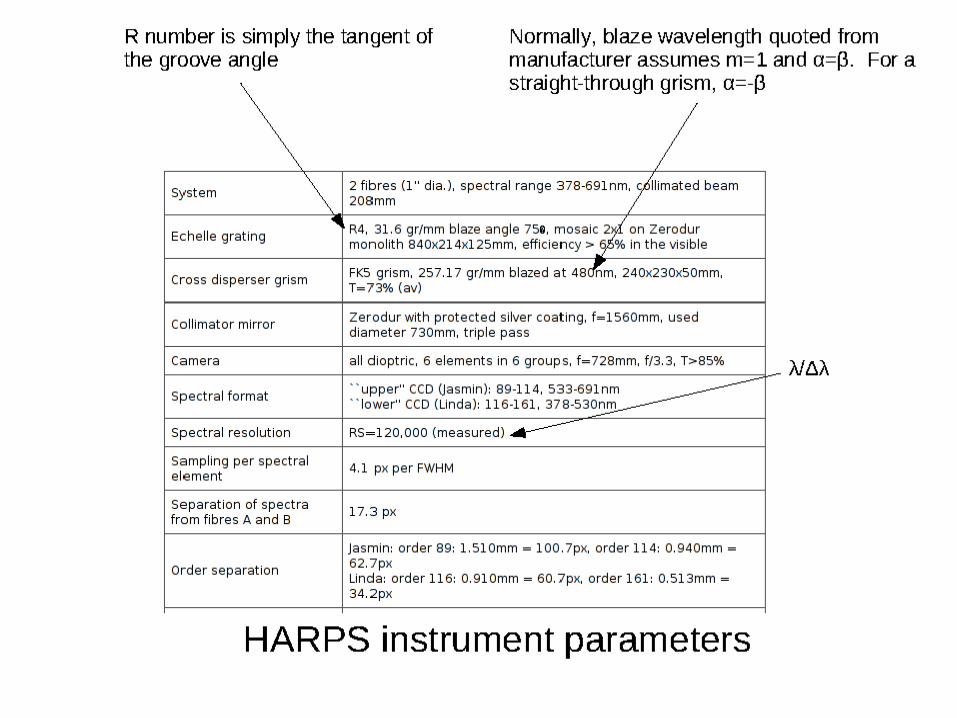
Echelle gratings are another useful variant. They operate at high incidence angle and high order (50 – 100). They are commonly used in high spectral
resolution instruments, and usually with some kind of cross disperser to get more than one order on the detector at a time.
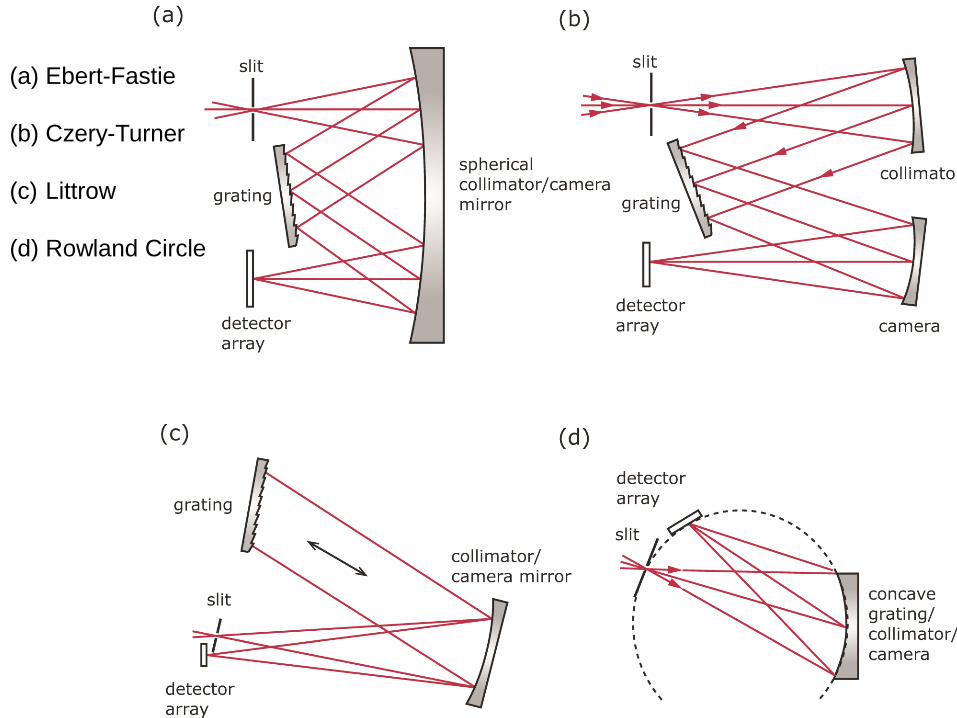
(a) Ebert-Fastie
(b) Czery-Turner
(c) Littrow
(d) Rowland Circle
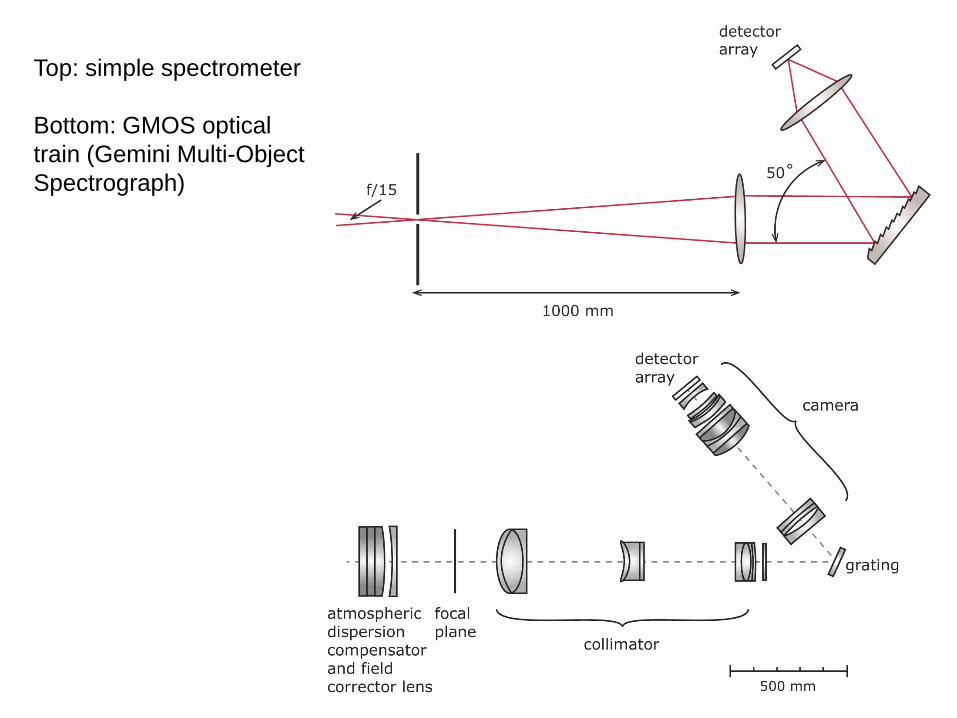
Top: simple spectrometer
Bottom: GMOS optical
train (Gemini Multi-Object
Spectrograph)
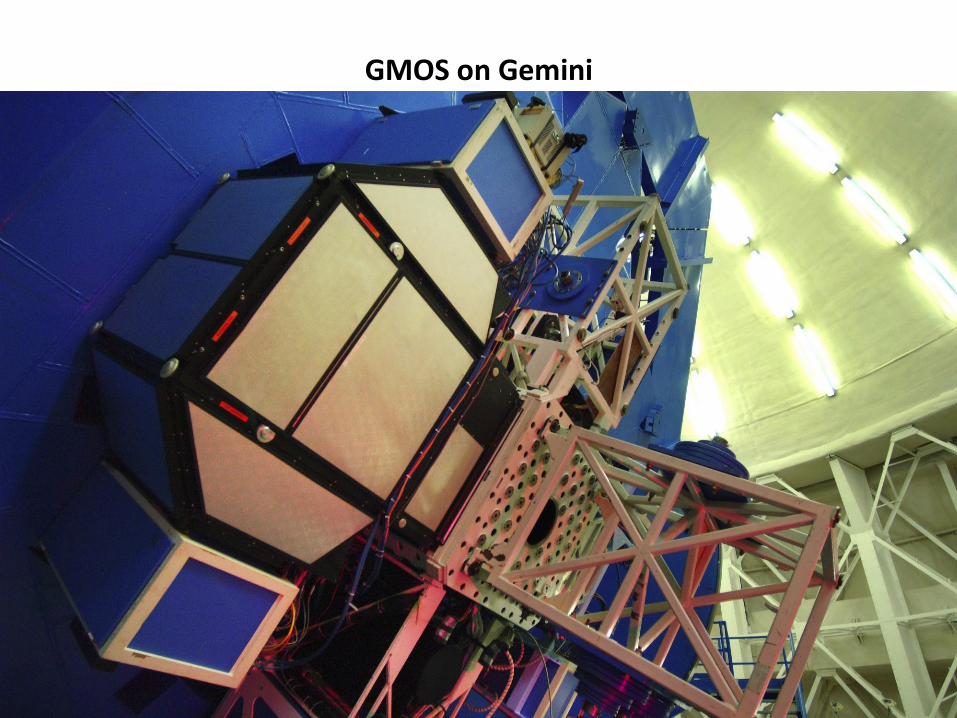
GMOS on Gemini
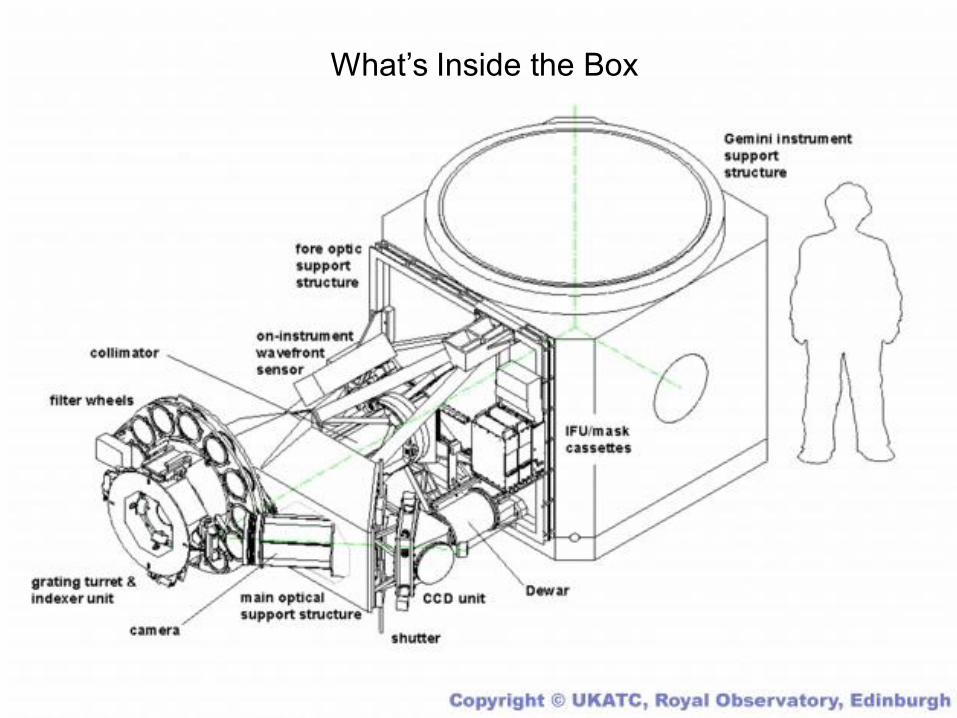
What’s Inside the Box
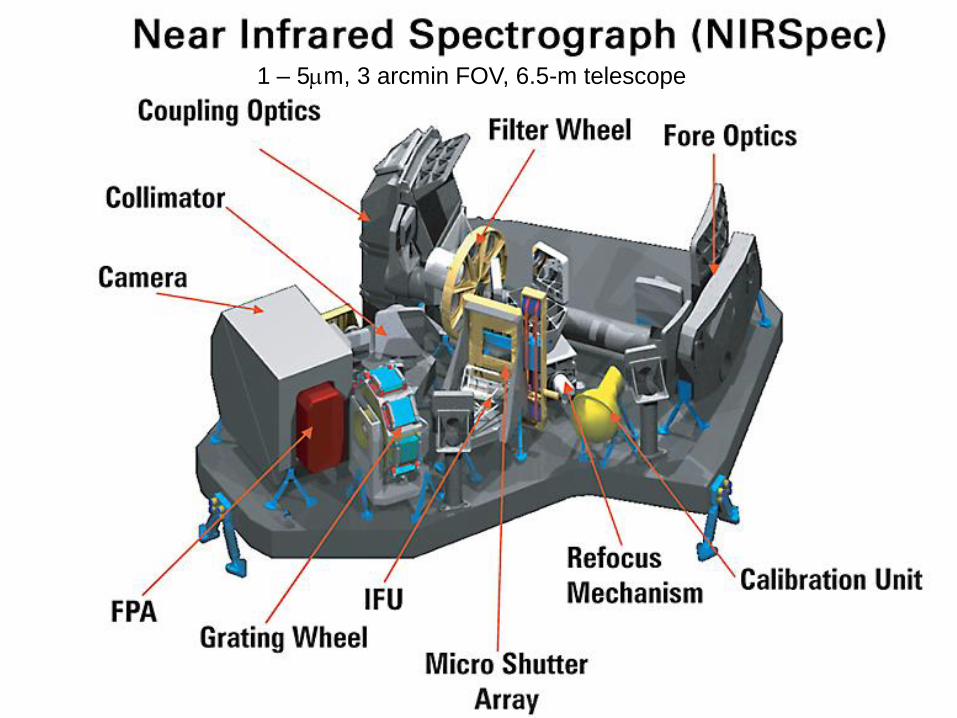
1 – 5mm, 3 arcmin FOV, 6.5-m telescope
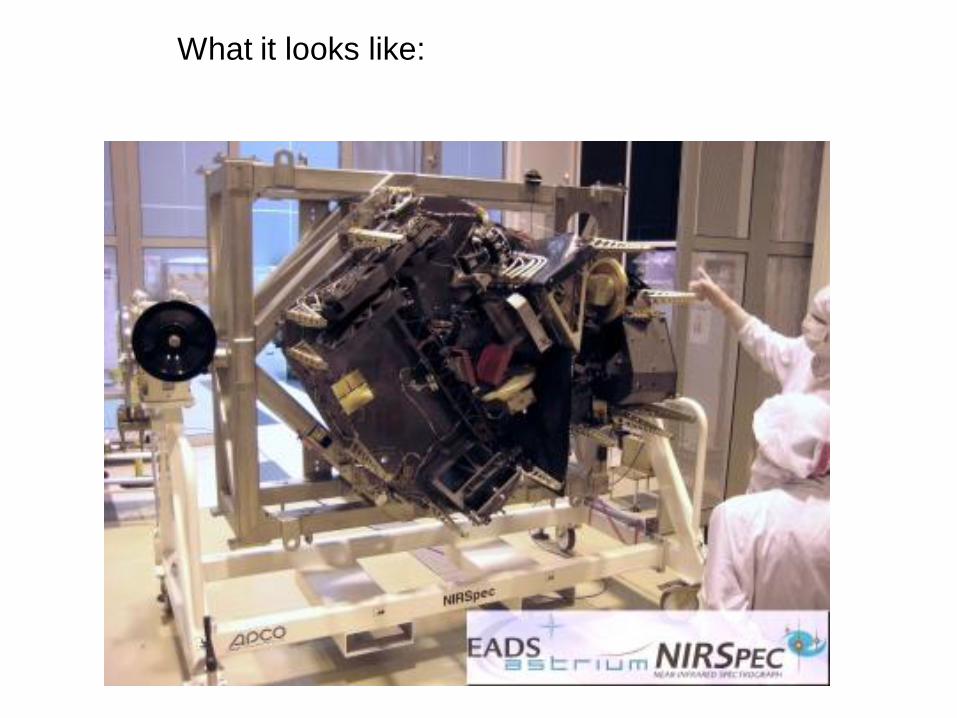
What it looks like:
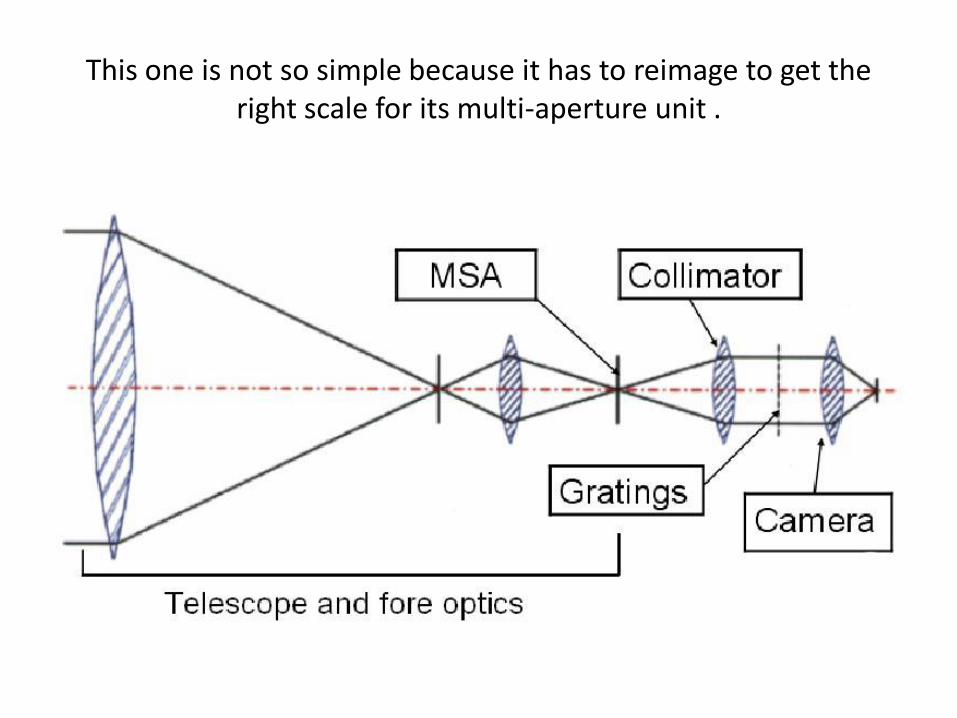
This one is not so simple because it has to reimage to get the right scale for its multi-aperture unit .
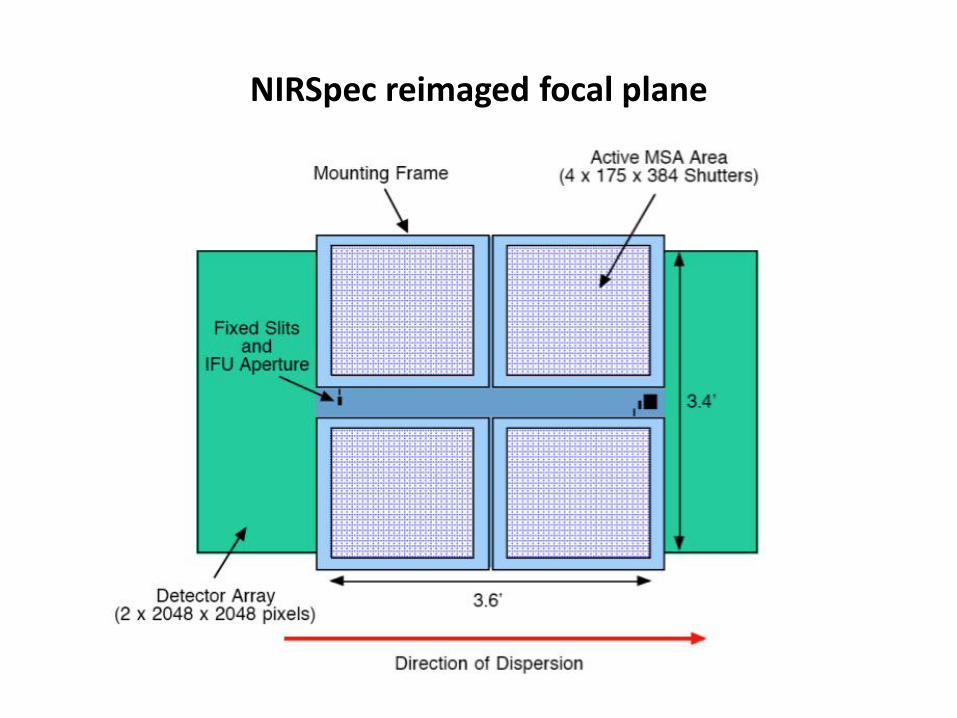
NIRSpec reimaged focal plane
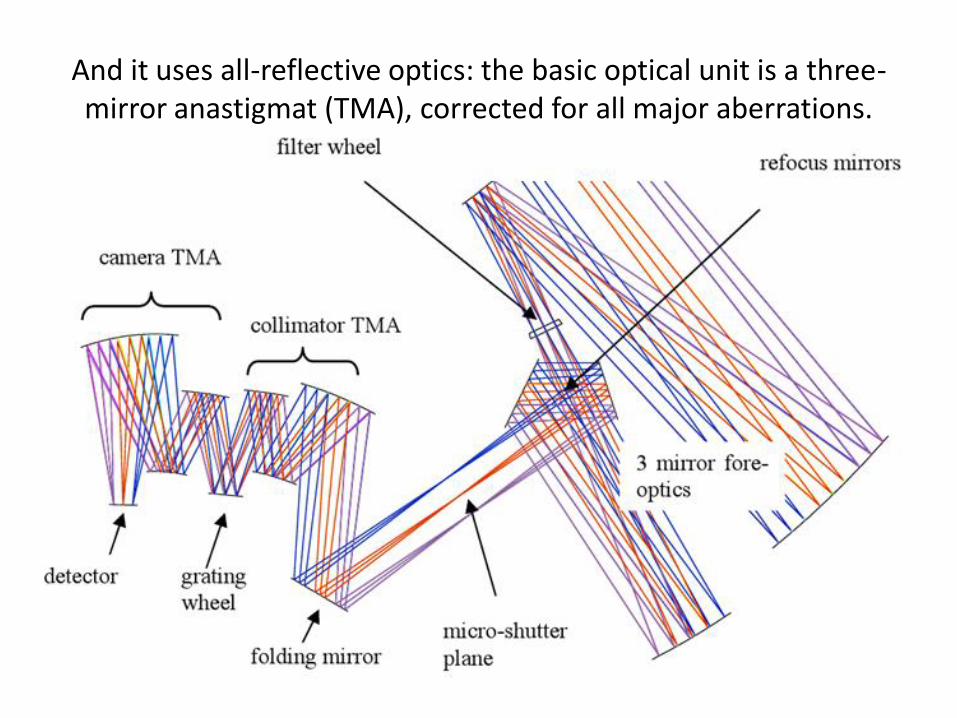
And it uses all-reflective optics: the basic optical unit is a three-mirror anastigmat (TMA), corrected for all major aberrations.
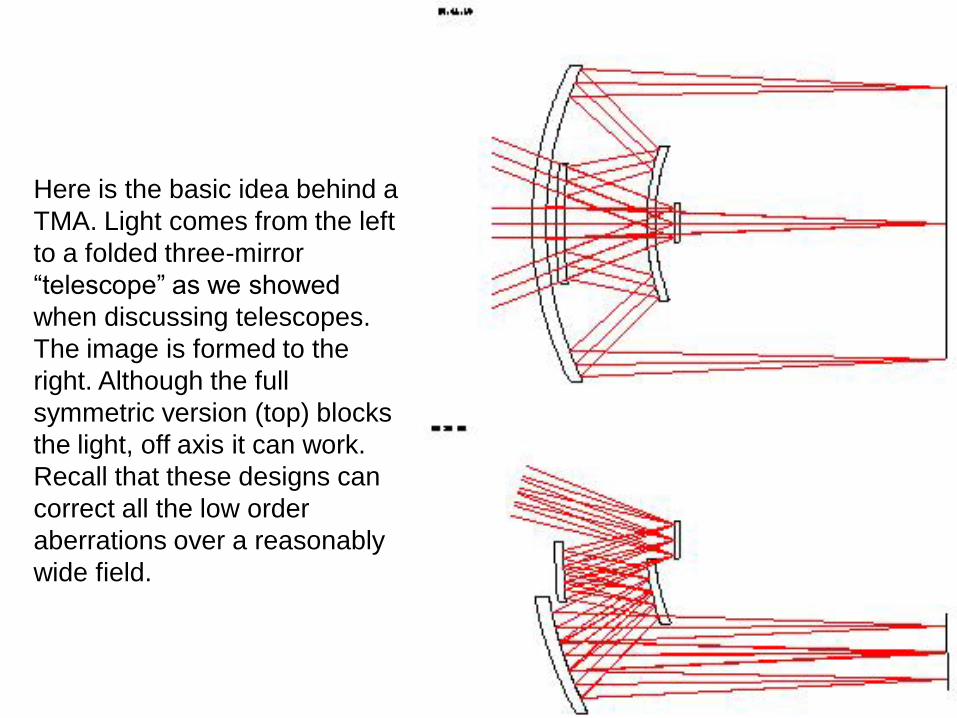
Here is the basic idea behind a
TMA. Light comes from the left
to a folded three-mirror
“telescope” as we showed
when discussing telescopes.
The image is formed to the
right. Although the full
symmetric version (top) blocks
the light, off axis it can work.
Recall that these designs can
correct all the low order
aberrations over a reasonably
wide field.
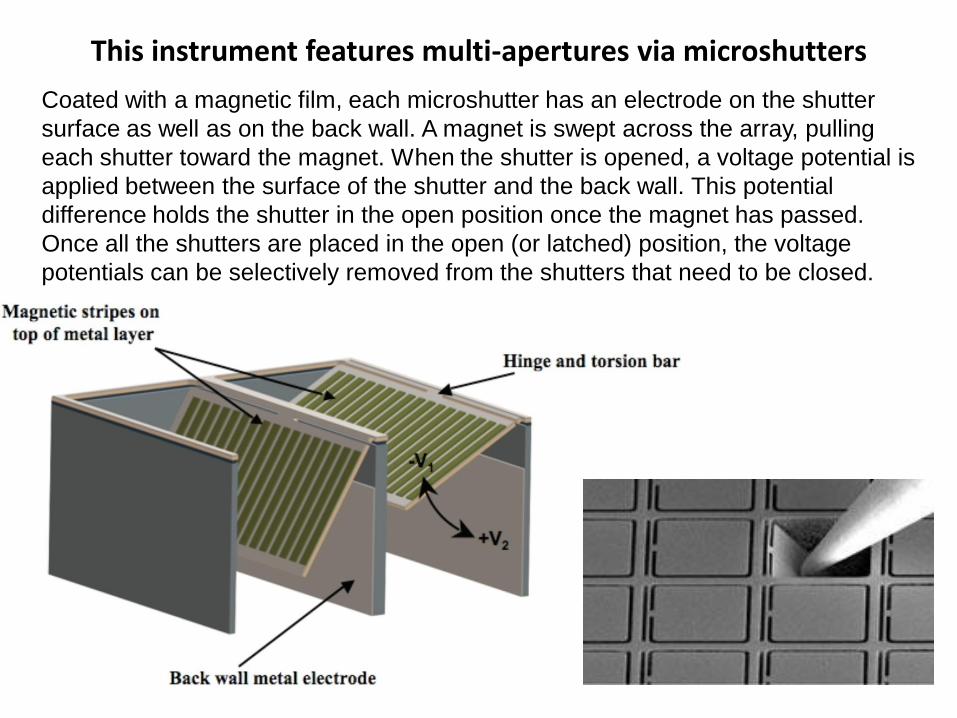
This instrument features multi-apertures via microshutters
Coated with a magnetic film, each microshutter has an electrode on the shutter
surface as well as on the back wall. A magnet is swept across the array, pulling
each shutter toward the magnet. When the shutter is opened, a voltage potential is
applied between the surface of the shutter and the back wall. This potential
difference holds the shutter in the open position once the magnet has passed.
Once all the shutters are placed in the open (or latched) position, the voltage
potentials can be selectively removed from the shutters that need to be closed.
Grating Spectrometer Warts
Grating spectrographs are subject to all the standard aberrations: spherical, coma,
astigmatism. In many cases, slight degradations of the images are hidden because
of the relatively large pixels and the effects of the slit and spectral dispersion.
Distortion, however, is critical. The extreme f/numbers required for good matching of
the pixels of the detector to the projected slit can result in a substantial level of
distortion. Distortion must be corrected very carefully in data reduction. A key step in
the analysis of spectroscopic data is to conduct a fit to the apparent wavelengths of
lines from a calibration source and to correct the spectra for the indicated errors in
the wavelength scale.
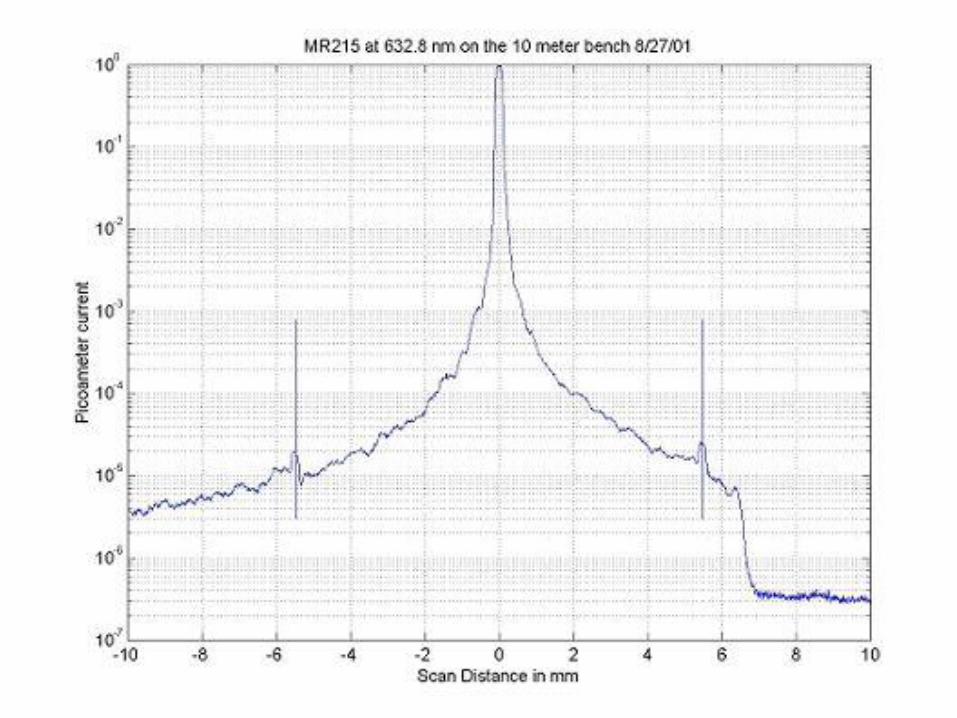
Ghosts
There can also be optical issues associated directly with the grating. Periodic errors
in the groove spacing produce spurious lines offset from the real one and that are
called ghosts.
• Rowland ghosts result from large-scale periodic errors, on the scales of millimeters.
They are located symmetrically around the real line, spaced from it according to the
period of the error and with intensity that increases with the amplitude of the error.
• Lyman ghosts are farther from the real line and result from periodic errors on
smaller scales, just a few times the groove spacing. Satellite lines are close to the
real one and arise from a small number of randomly misplaced grooves
• The relative intensity of some forms of ghosts grows fairly rapidly with increasing
order of the real line, so although they are unimportant in low-order instruments they
may be significant with high-order echelle gratings.
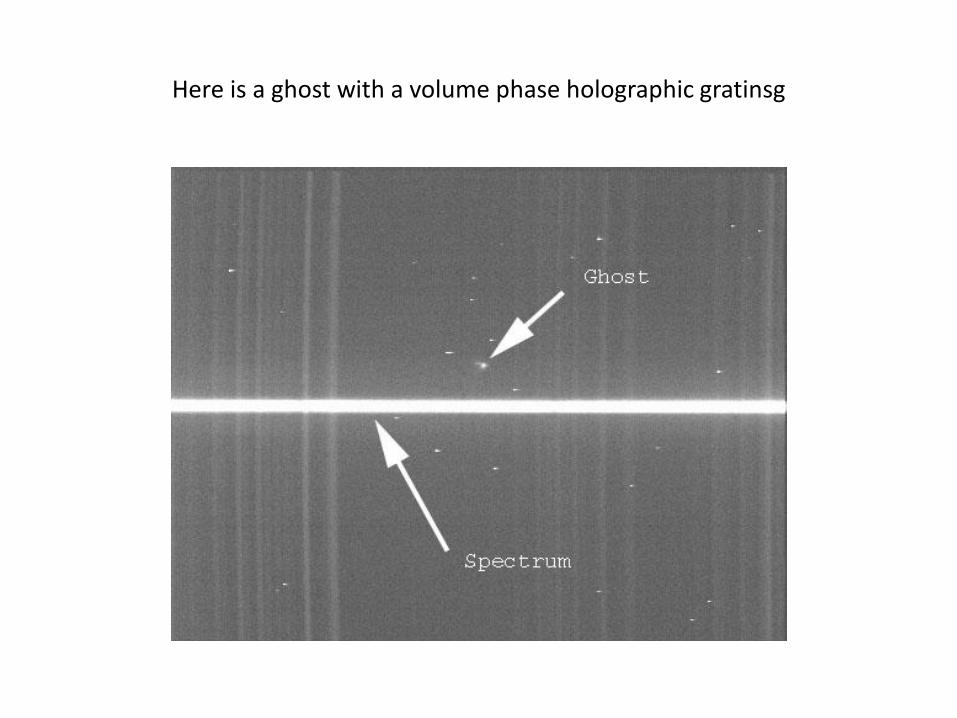
Here is a ghost with a volume phase holographic gratinsg
Scattered Light
Spectrometers are also subject to scattered light. Unlike imagers, where the two-
dimensional character of the data allows removing scattered light as a natural
process during data reduction, spectrometers are basically one-dimensional
instruments and it can persist into the final reduced spectra and be difficult to
identify. A spectrograph with significant scattered light in its spectra can give
erroneous readings for fundamental properties such as equivalent widths of spectral
lines; the scattered light will be removed from the lines and spread into a pseudo-
continuum. Scattered light can be measured by putting a filter into the beam that
blocks all light short (or long) of some wavelength and then measuring any residual
spectrum in the blocked range.
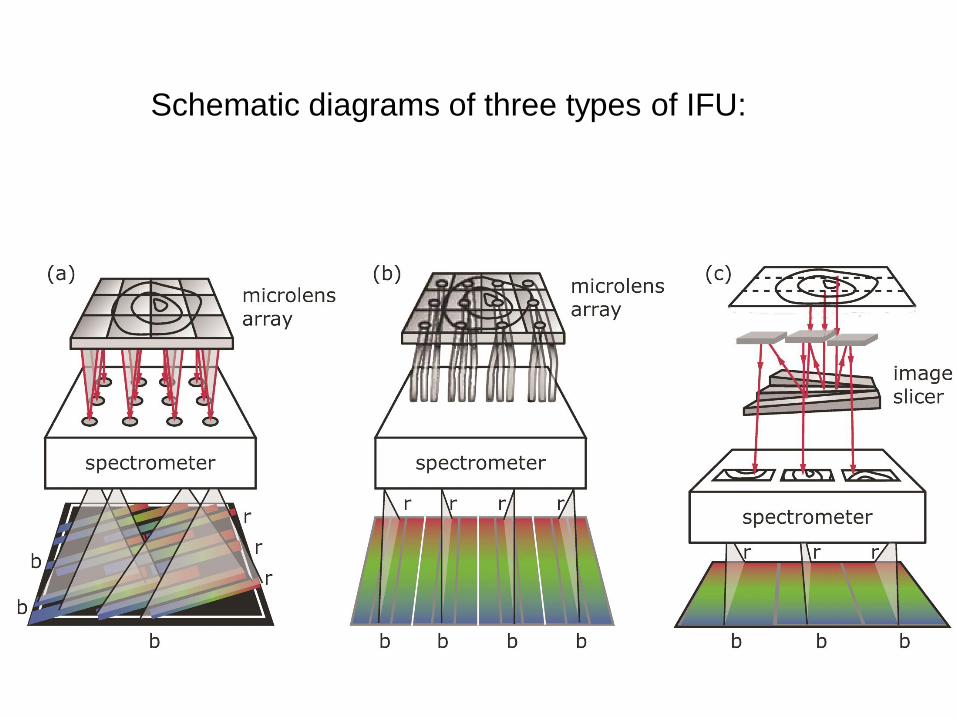
Schematic diagrams of three types of IFU:
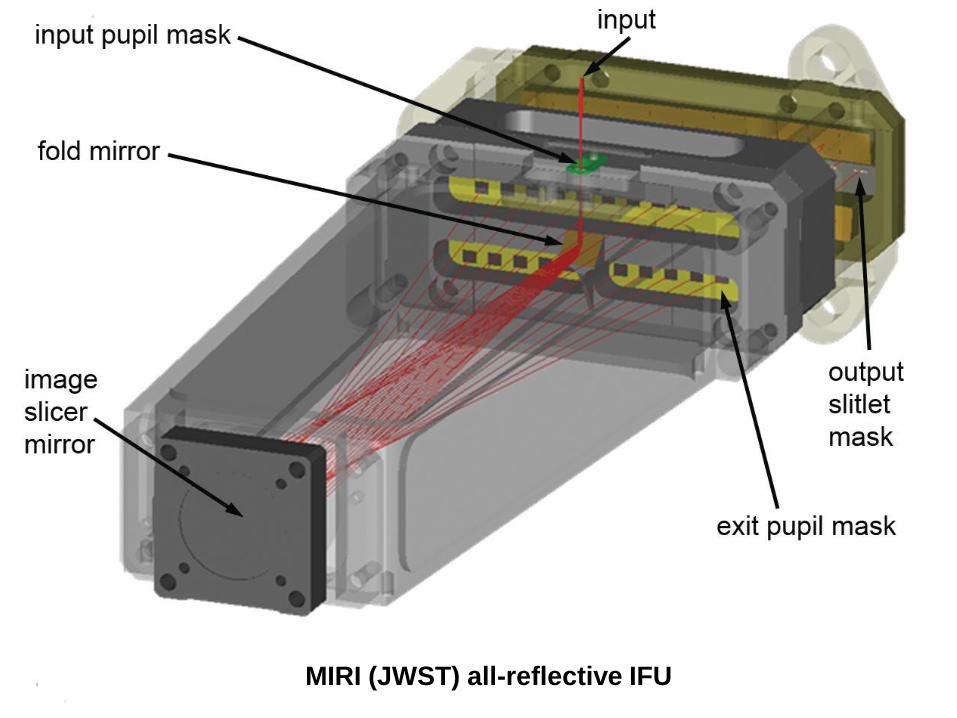
MIRI (JWST) all-reflective IFU
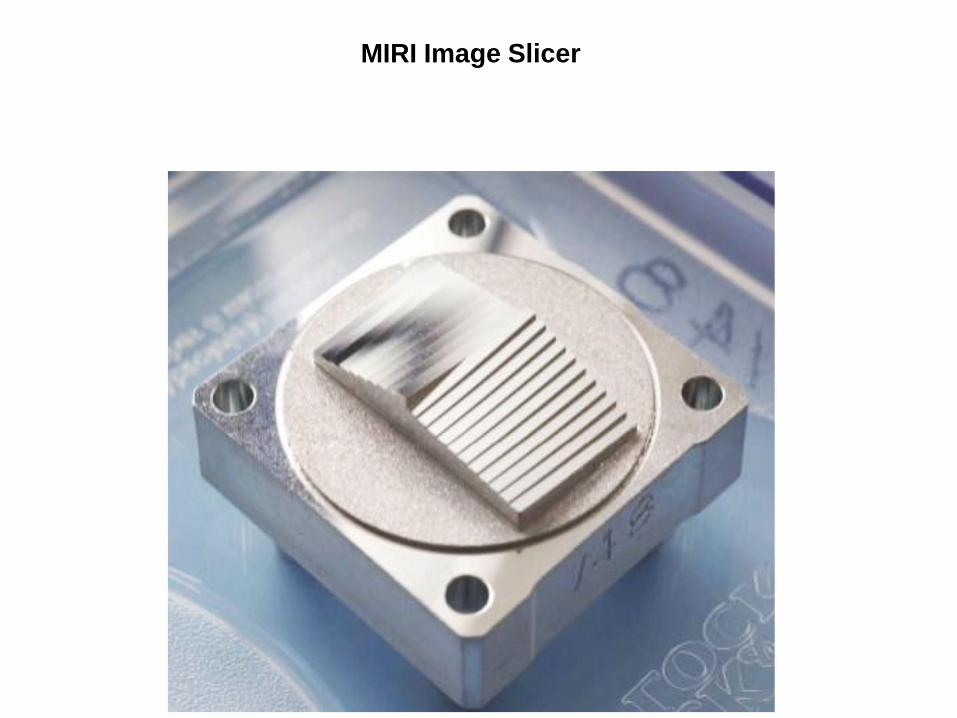
MIRI Image Slicer
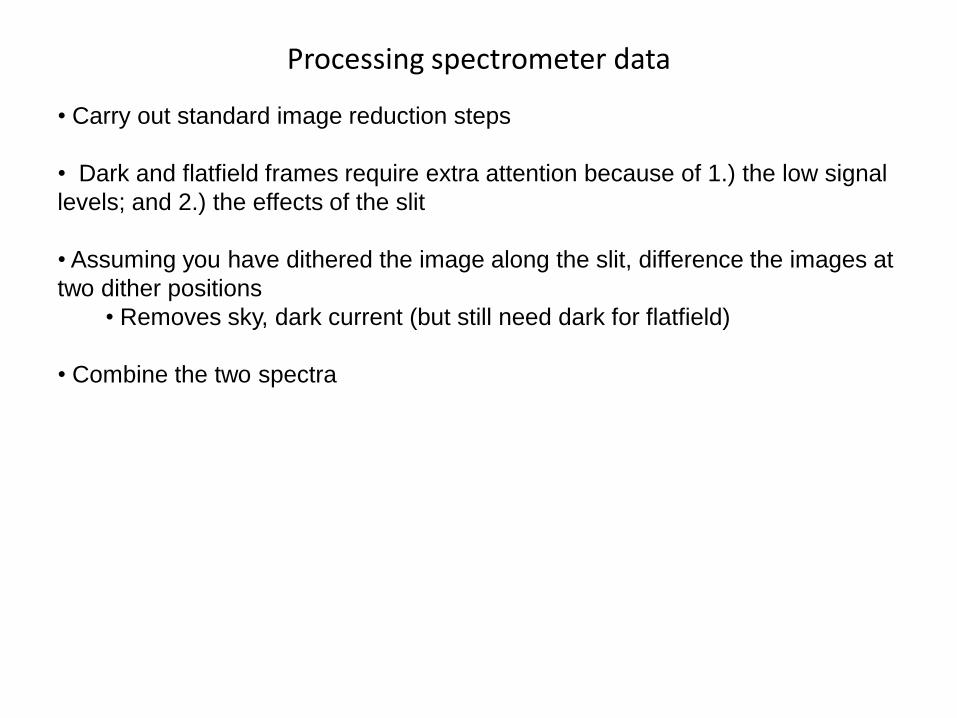
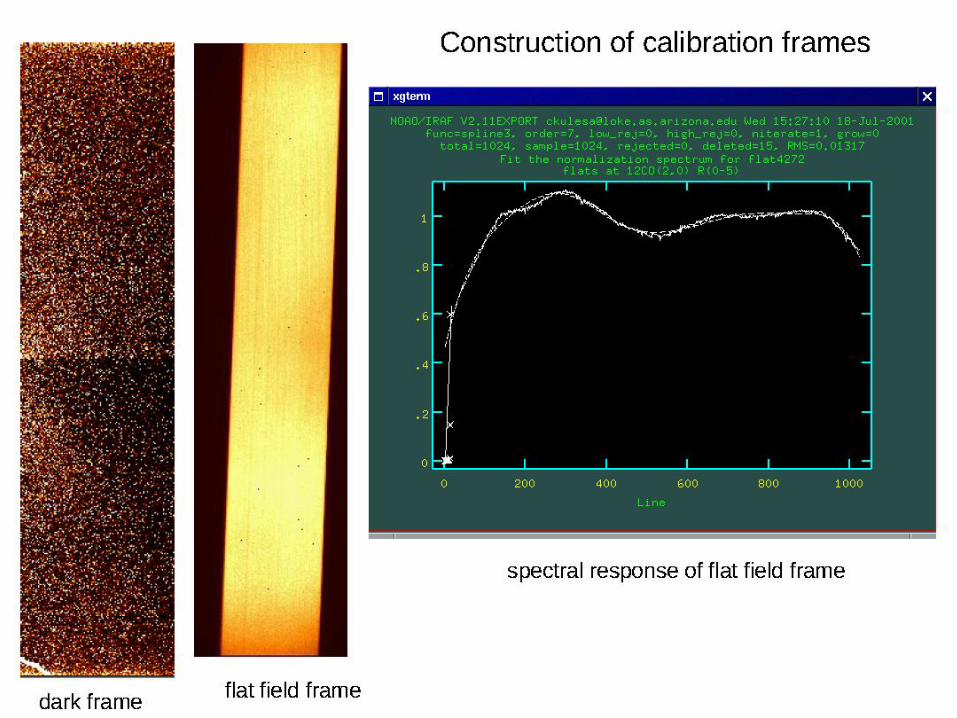
Processing spectrometer data
• Carry out standard image reduction steps
• Dark and flatfield frames require extra attention because of 1.) the low signal
levels; and 2.) the effects of the slit
• Assuming you have dithered the image along the slit, difference the images at
two dither positions
• Removes sky, dark current (but still need dark for flatfield)
• Combine the two spectra
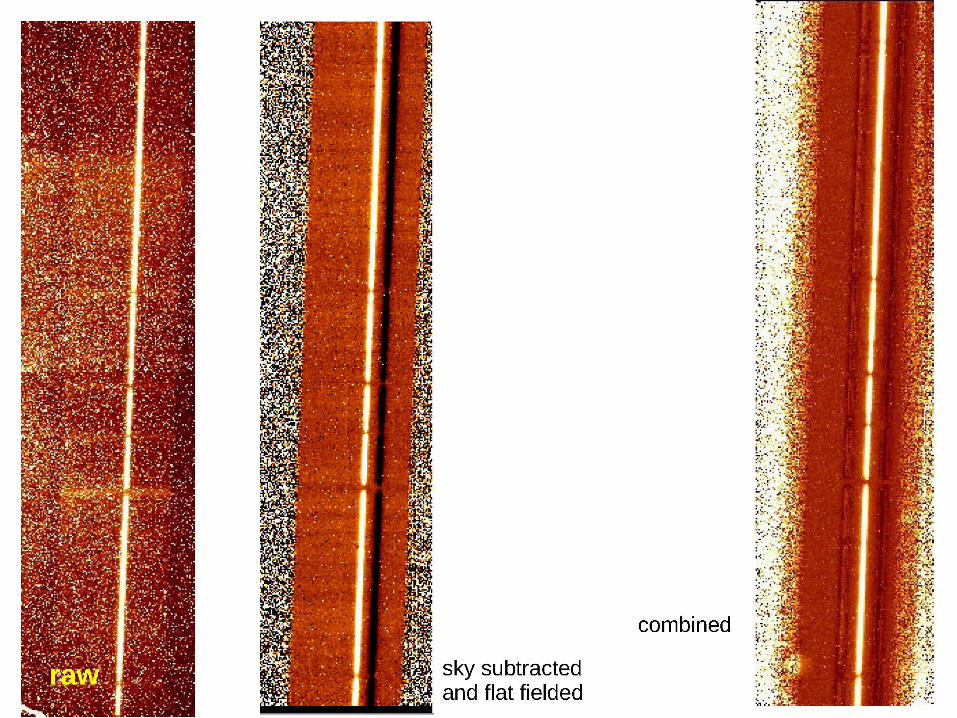
• “Trace” the spectrum to allow fitting any distortions in its shape along the
dispersion direction
• Extract it, and extract similar signals along “sky”; if necessary, subtract
“sky” from the spectrum (if the first differencing worked well this may not be
needed)
• Apply the flatfield frame (after subtracting the dark)
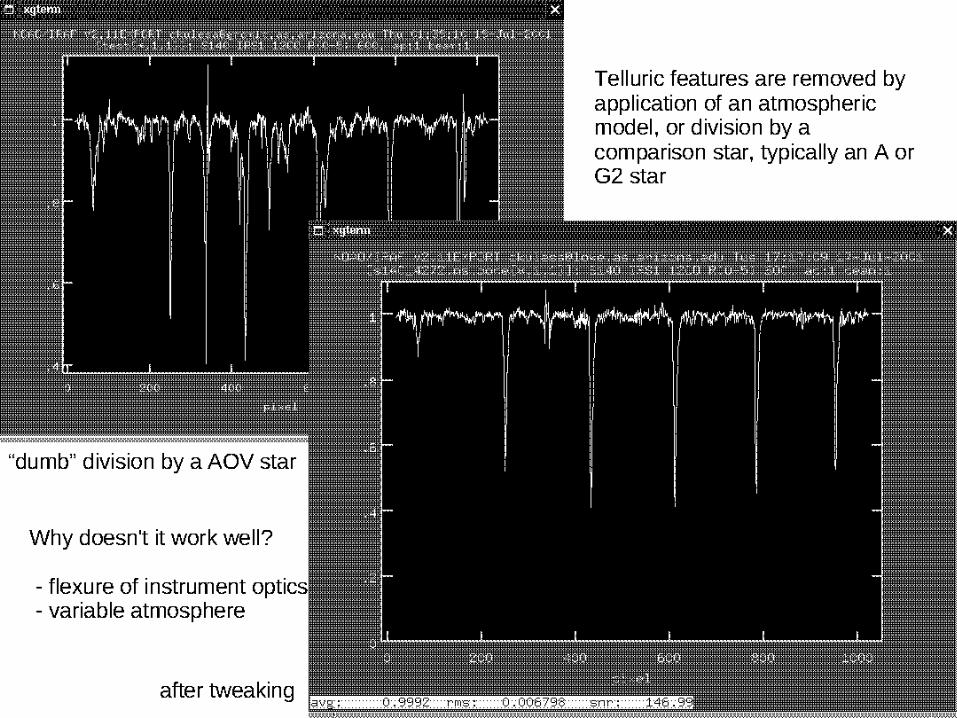
• Put the reference star spectrum through the same steps
• Divide the target spectrum by the reference star spectrum
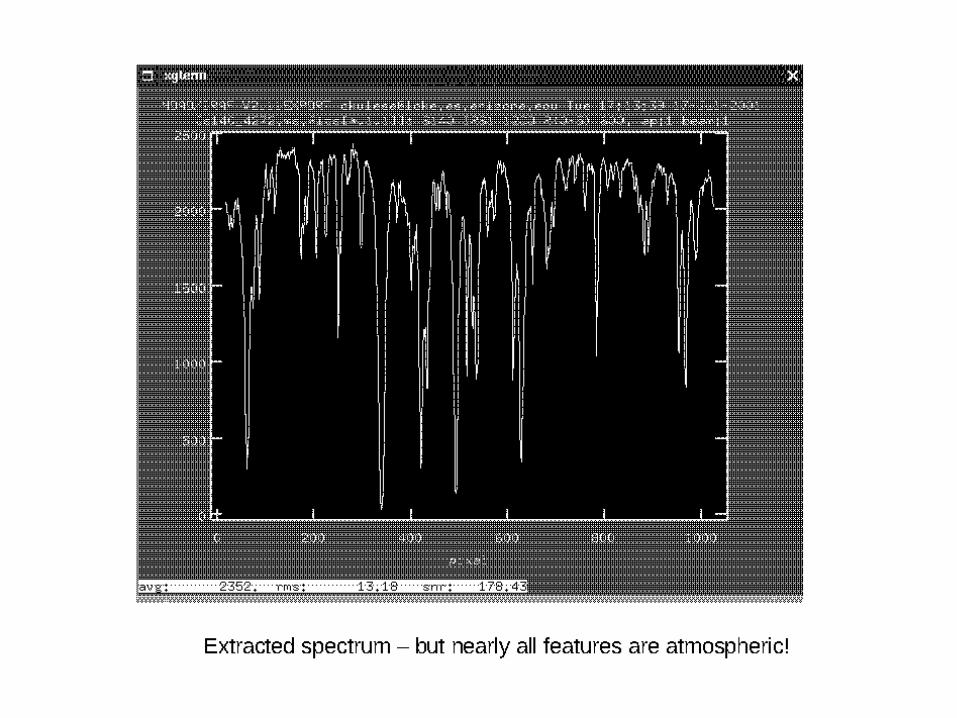
• Do a wavelength fit to a calibration lamp exposure (or in the NIR, the OH
lines from the sky)
• Use the fit to adjust the wavelengths in the observed spectrum
• Multiply by a template spectrum of the reference star
• If the slit and instrument transmission functions are well-known, the
resulting spectrum can be used for line ratios (where all the relevant lines
appear in a single spectrum)
• Often, though, we want to flux calibrate the spectrum. Rough values can
be obtained with care using the spectrometer as if it did photometry
• However, slit losses are usually variable
• It can be better to obtain an image and use it to normalize synthetic
photometry obtained from the spectrum
• This approach can be critical to getting calibrated results on an
extended object.
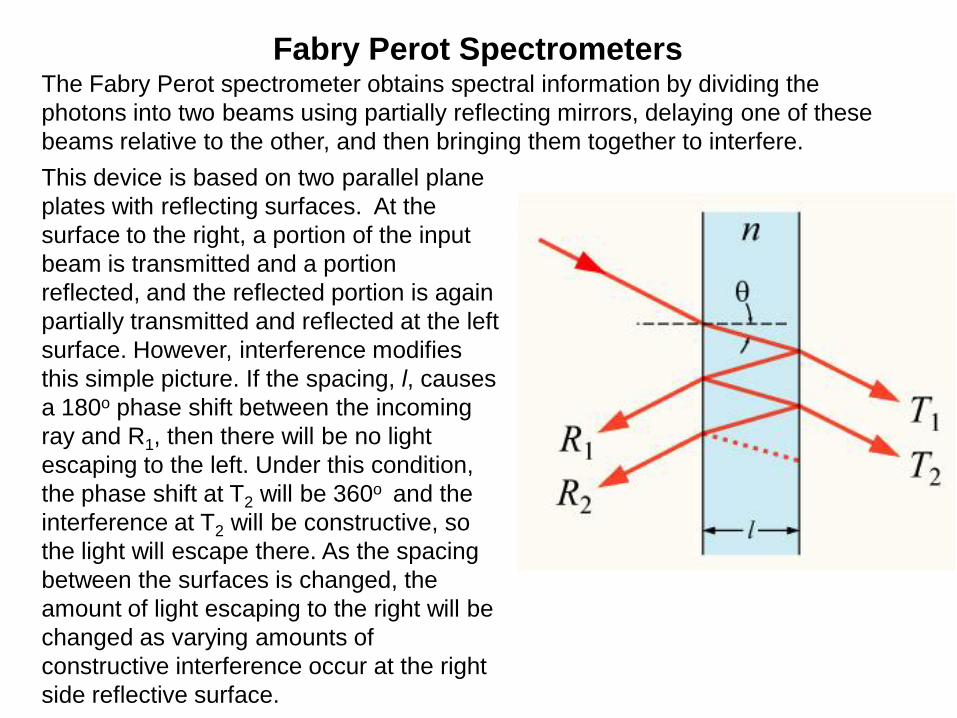
The Fabry Perot spectrometer obtains spectral information by dividing the
photons into two beams using partially reflecting mirrors, delaying one of these
beams relative to the other, and then bringing them together to interfere.
Fabry Perot Spectrometers
This device is based on two parallel plane
plates with reflecting surfaces. At the
surface to the right, a portion of the input
beam is transmitted and a portion
reflected, and the reflected portion is again
partially transmitted and reflected at the left
surface. However, interference modifies
this simple picture. If the spacing, l, causes
a 180o phase shift between the incoming
ray and R1, then there will be no light
escaping to the left. Under this condition,
the phase shift at T2 will be 360o and the
interference at T2 will be constructive, so
the light will escape there. As the spacing
between the surfaces is changed, the
amount of light escaping to the right will be
changed as varying amounts of
constructive interference occur at the right
side reflective surface.
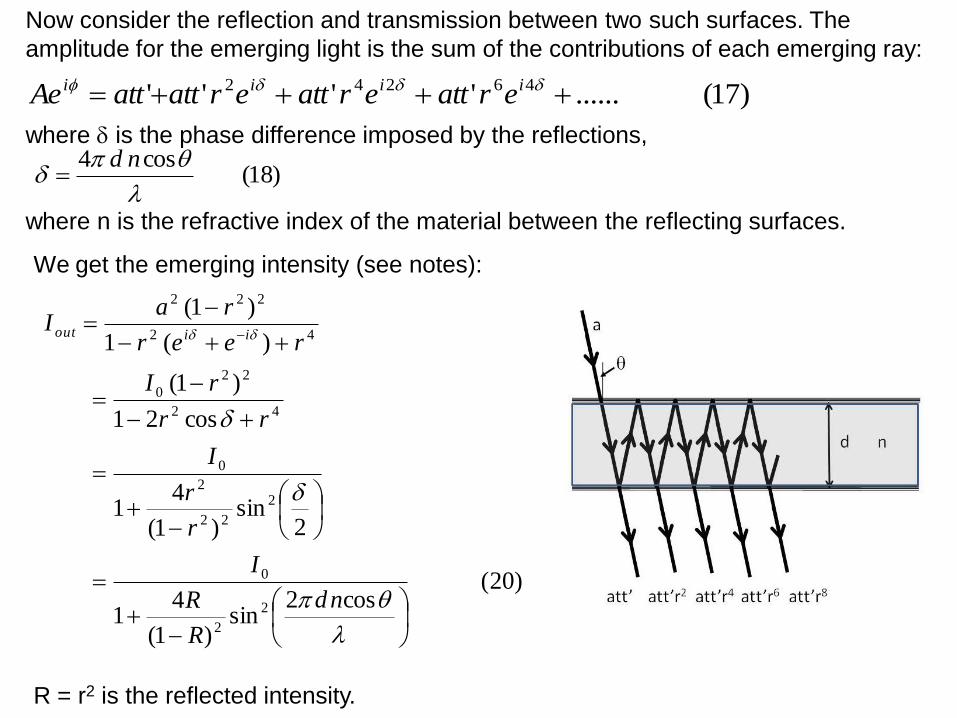
Now consider the reflection and transmission between two such surfaces. The
amplitude for the emerging light is the sum of the contributions of each emerging ray:
where is the phase difference imposed by the reflections,
where n is the refractive index of the material between the reflecting surfaces.
)17(......'''' 46242 iiii eratteratterattattAe
)18(cos4
nd
We get the emerging intensity (see notes):
R = r2 is the reflected intensity.
)20(cos2
sin)1(
41
2sin
)1(
41
cos21
)1(
)(1
)1(
2
2
0
2
22
2
0
42
22
0
42
222
nd
R
R
I
r
r
I
rr
rI
reer
raI
iiout
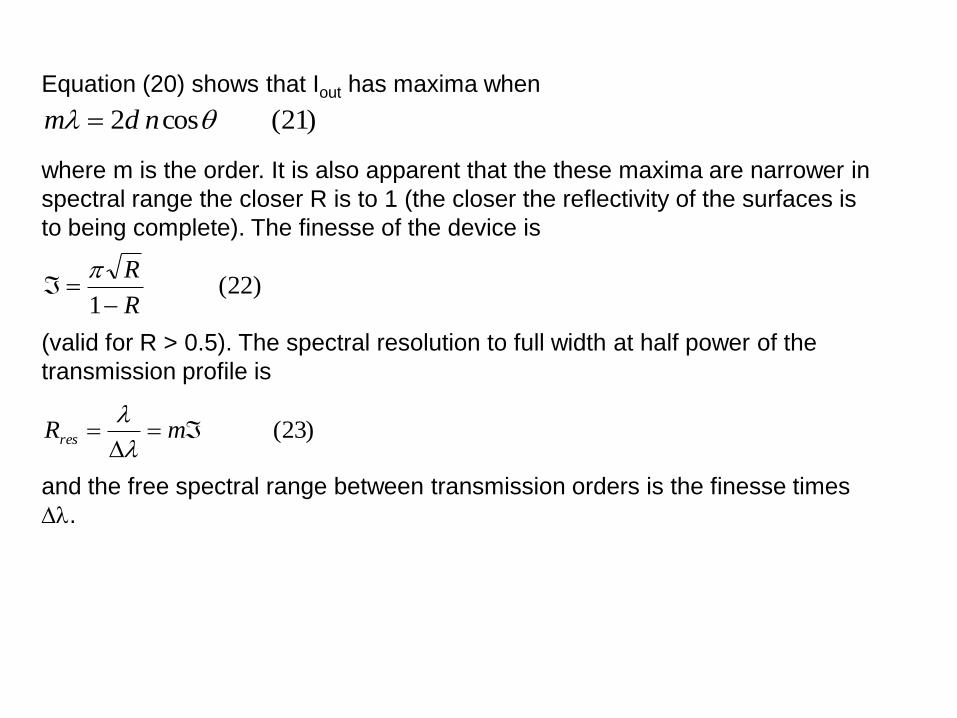
Equation (20) shows that Iout has maxima when
where m is the order. It is also apparent that the these maxima are narrower in
spectral range the closer R is to 1 (the closer the reflectivity of the surfaces is
to being complete). The finesse of the device is
(valid for R > 0.5). The spectral resolution to full width at half power of the
transmission profile is
and the free spectral range between transmission orders is the finesse times
.
)21(cos2 ndm
)22(1 R
R
)23(
mRres
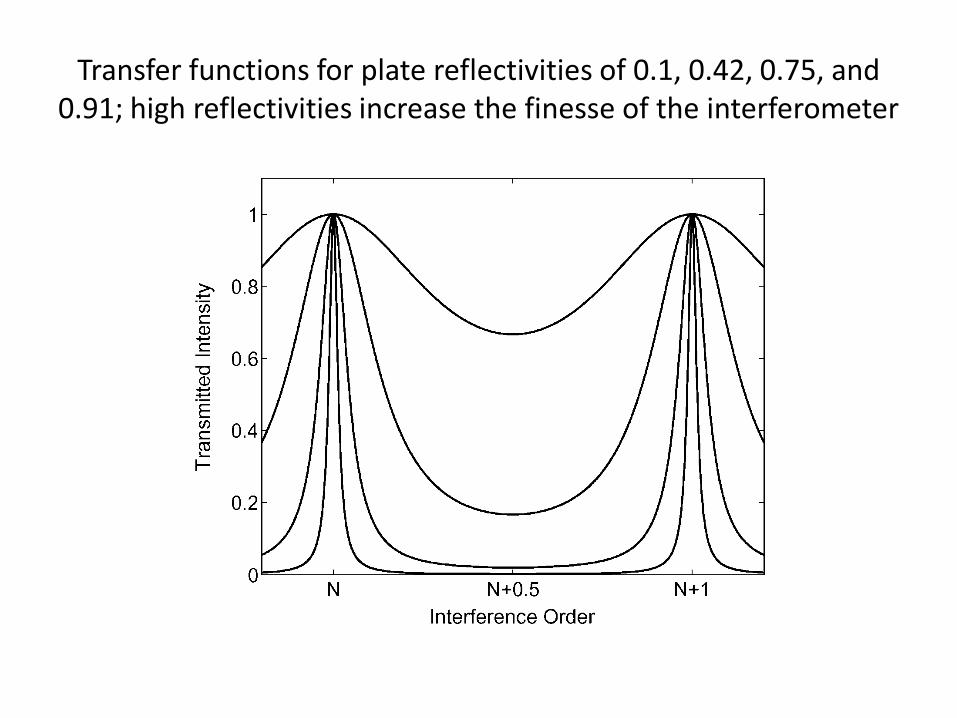
Transfer functions for plate reflectivities of 0.1, 0.42, 0.75, and 0.91; high reflectivities increase the finesse of the interferometer
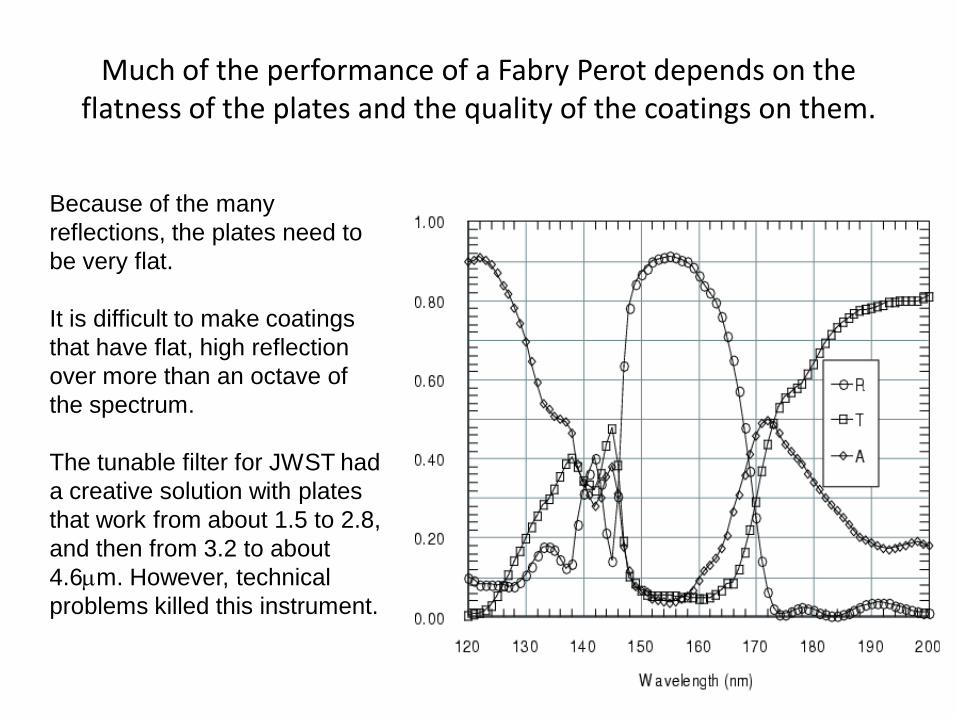
Much of the performance of a Fabry Perot depends on the flatness of the plates and the quality of the coatings on them.
Because of the many
reflections, the plates need to
be very flat.
It is difficult to make coatings
that have flat, high reflection
over more than an octave of
the spectrum.
The tunable filter for JWST had
a creative solution with plates
that work from about 1.5 to 2.8,
and then from 3.2 to about
4.6mm. However, technical
problems killed this instrument.
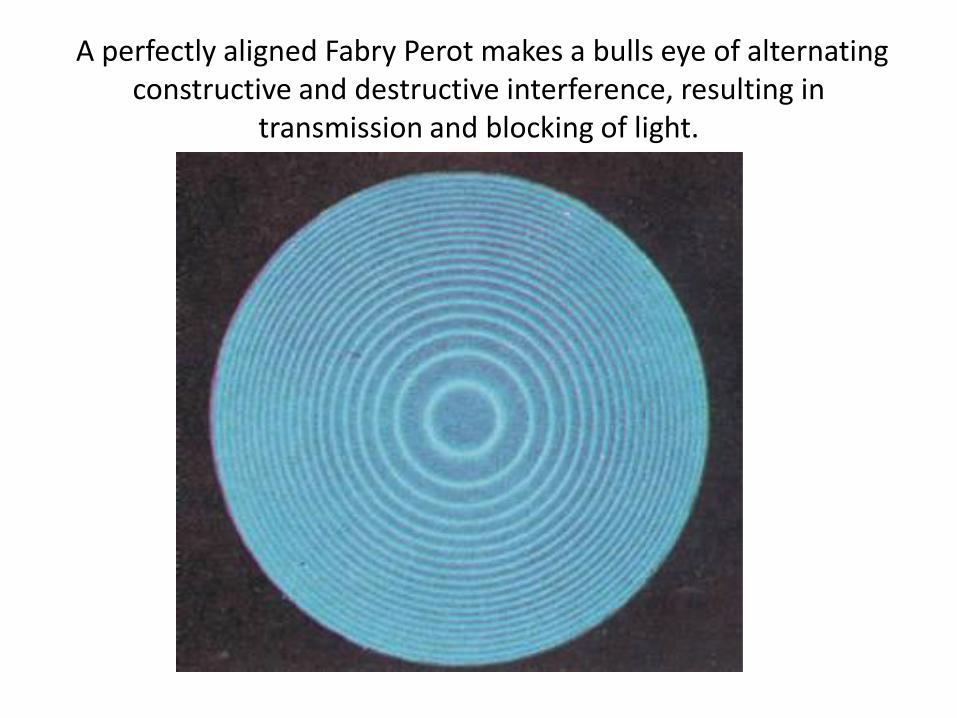
A perfectly aligned Fabry Perot makes a bulls eye of alternating constructive and destructive interference, resulting in
transmission and blocking of light.
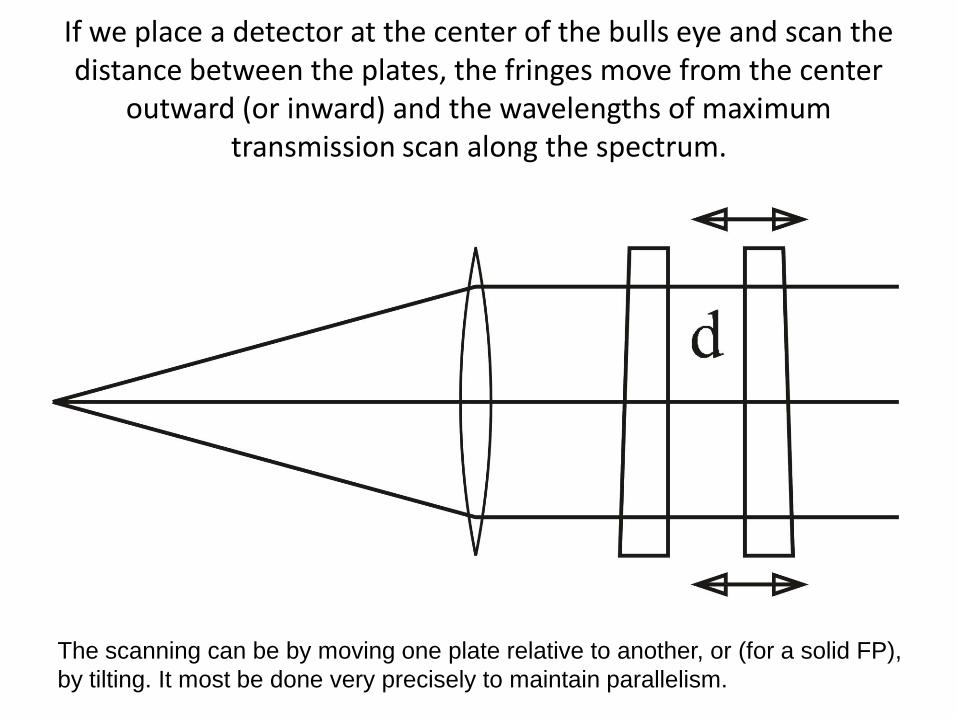
If we place a detector at the center of the bulls eye and scan the distance between the plates, the fringes move from the center
outward (or inward) and the wavelengths of maximum transmission scan along the spectrum.
The scanning can be by moving one plate relative to another, or (for a solid FP),
by tilting. It most be done very precisely to maintain parallelism.
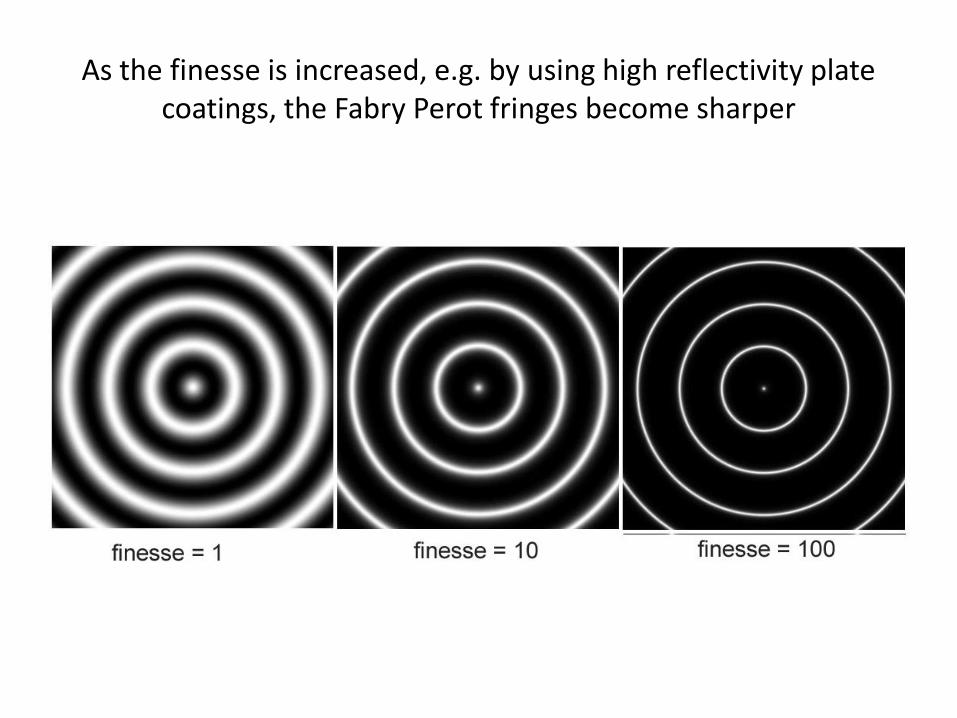
As the finesse is increased, e.g. by using high reflectivity plate coatings, the Fabry Perot fringes become sharper
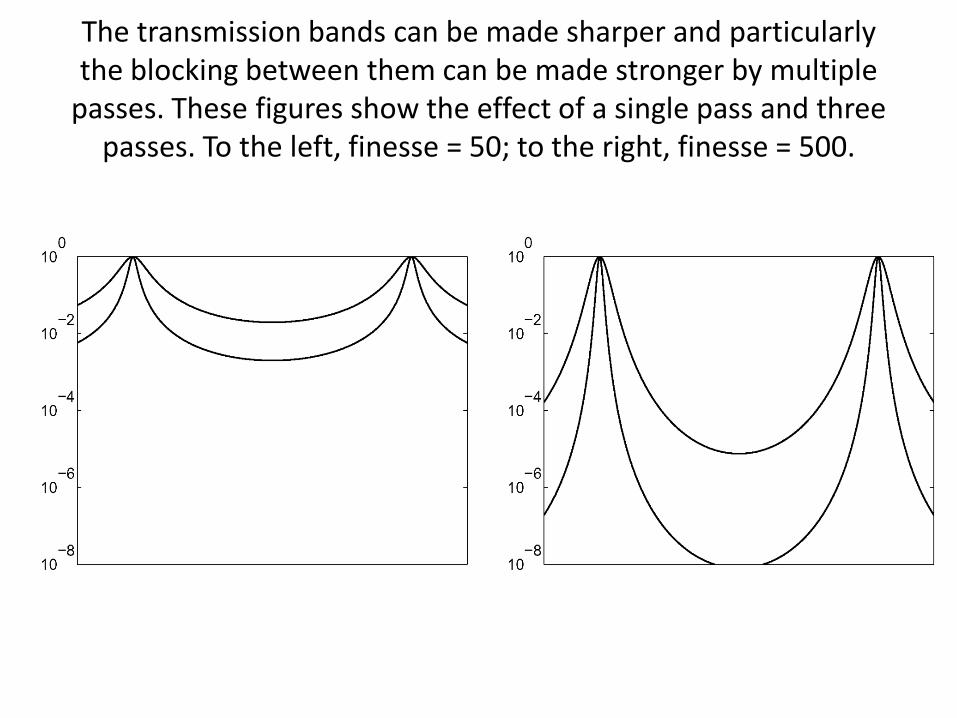
The transmission bands can be made sharper and particularly the blocking between them can be made stronger by multiple
passes. These figures show the effect of a single pass and three passes. To the left, finesse = 50; to the right, finesse = 500.
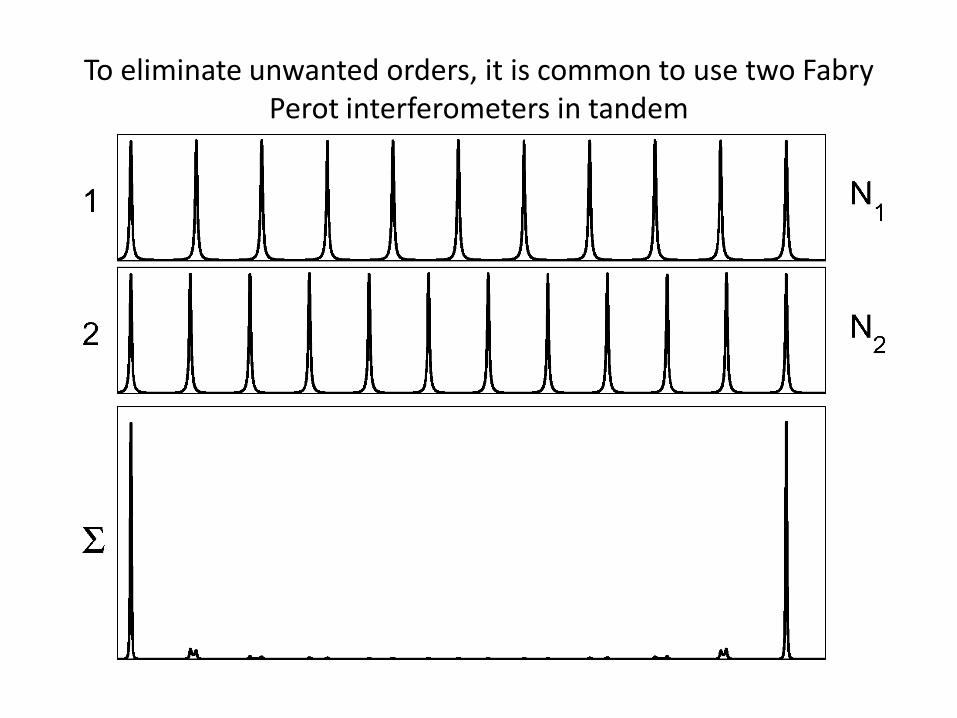
To eliminate unwanted orders, it is common to use two Fabry Perot interferometers in tandem
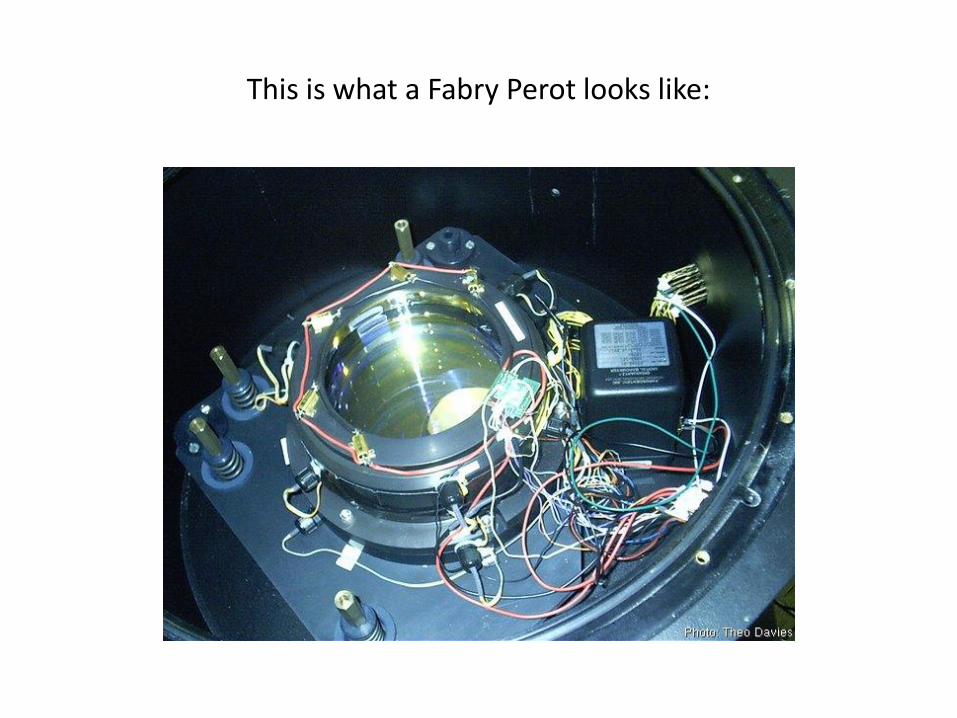
This is what a Fabry Perot looks like:
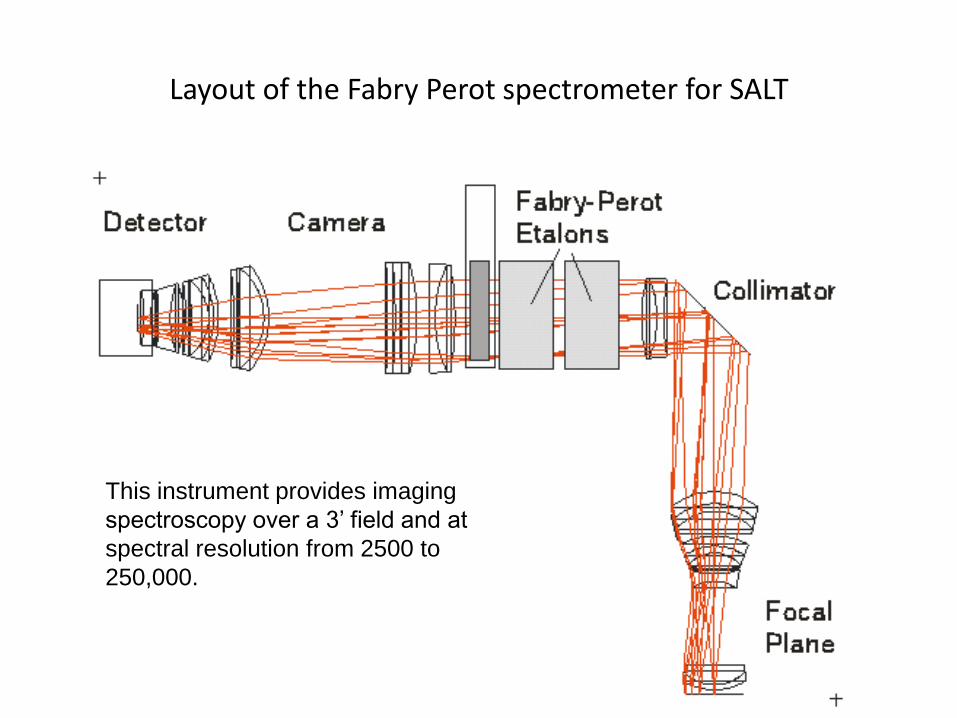
Layout of the Fabry Perot spectrometer for SALT
This instrument provides imaging
spectroscopy over a 3’ field and at
spectral resolution from 2500 to
250,000.
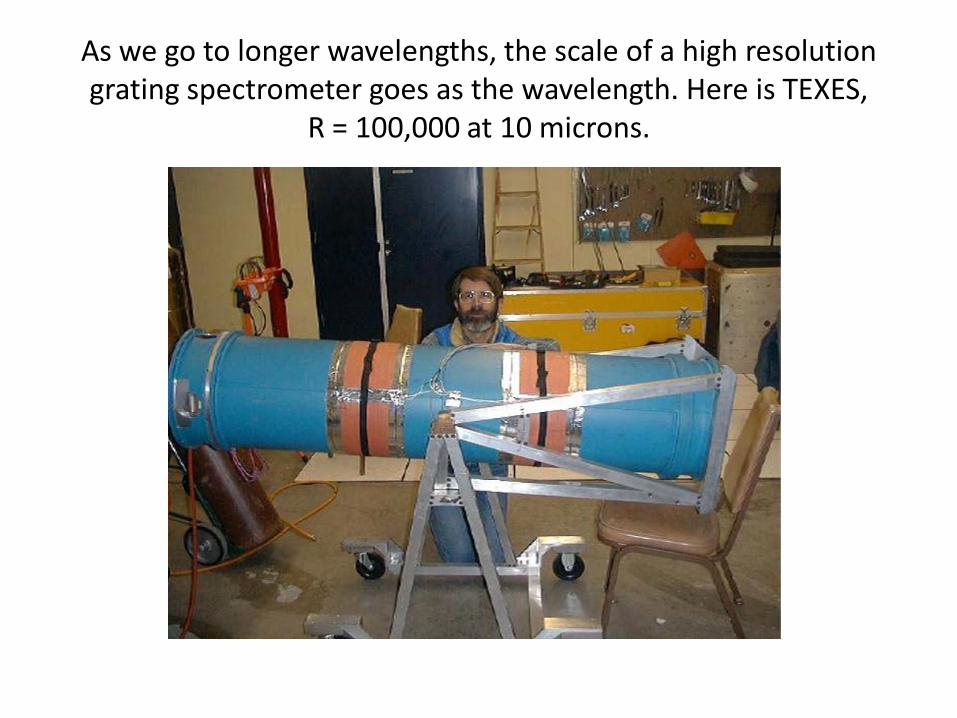
As we go to longer wavelengths, the scale of a high resolution grating spectrometer goes as the wavelength. Here is TEXES,
R = 100,000 at 10 microns.
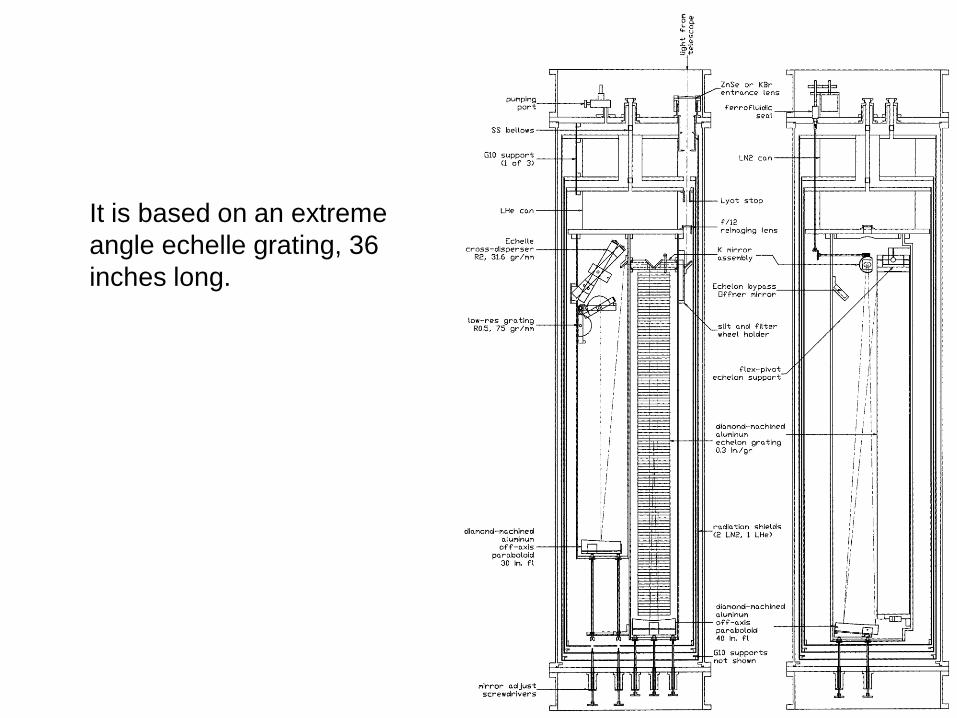
It is based on an extreme
angle echelle grating, 36
inches long.
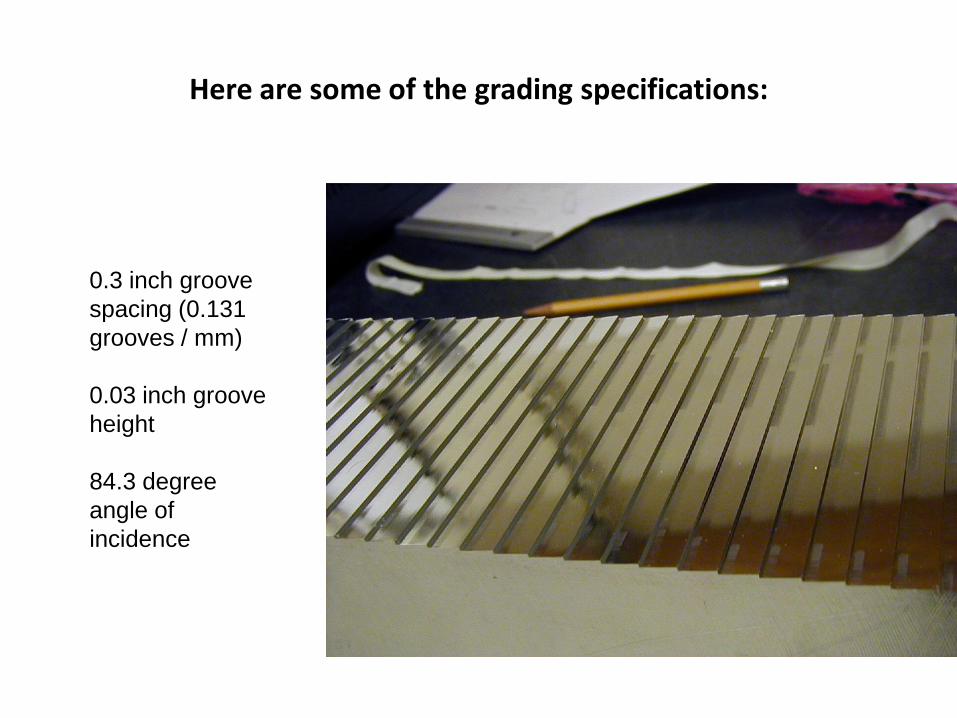
Here are some of the grading specifications:
0.3 inch groove
spacing (0.131
grooves / mm)
0.03 inch groove
height
84.3 degree
angle of
incidence
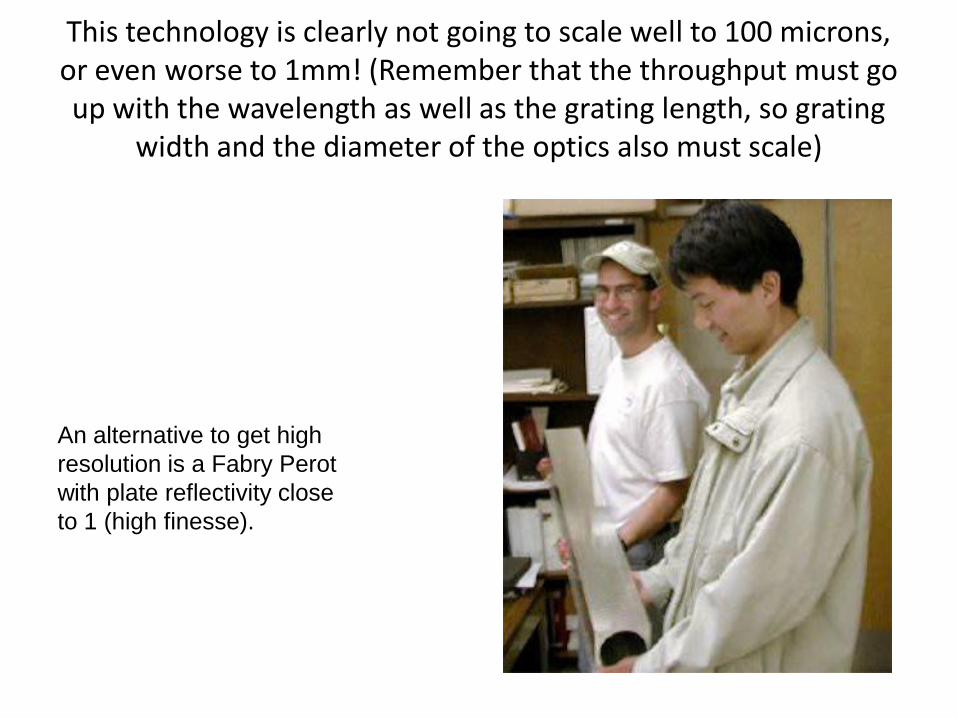
This technology is clearly not going to scale well to 100 microns, or even worse to 1mm! (Remember that the throughput must go up with the wavelength as well as the grating length, so grating
width and the diameter of the optics also must scale)
An alternative to get high
resolution is a Fabry Perot
with plate reflectivity close
to 1 (high finesse).
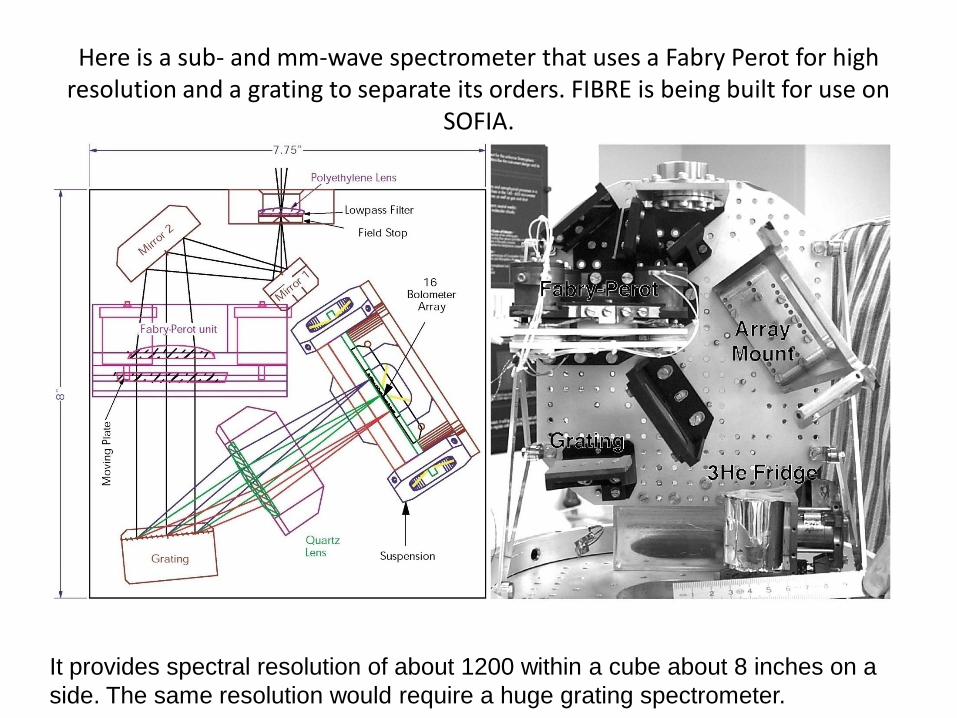
Here is a sub- and mm-wave spectrometer that uses a Fabry Perot for high resolution and a grating to separate its orders. FIBRE is being built for use on
SOFIA.
It provides spectral resolution of about 1200 within a cube about 8 inches on a
side. The same resolution would require a huge grating spectrometer.
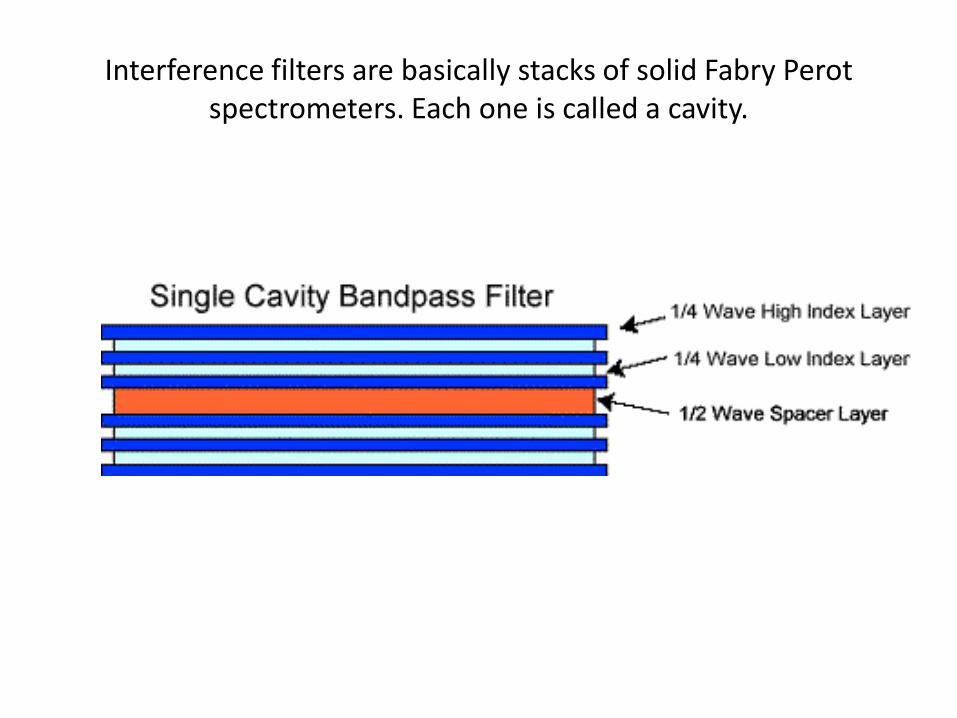
Interference filters are basically stacks of solid Fabry Perot spectrometers. Each one is called a cavity.
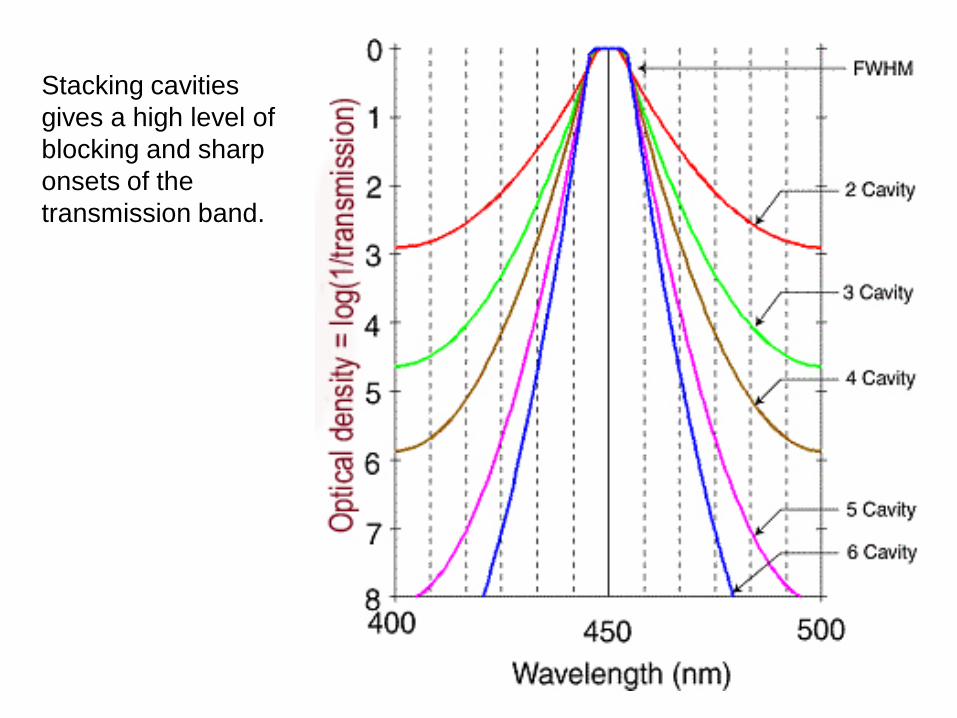
Stacking cavities
gives a high level of
blocking and sharp
onsets of the
transmission band.
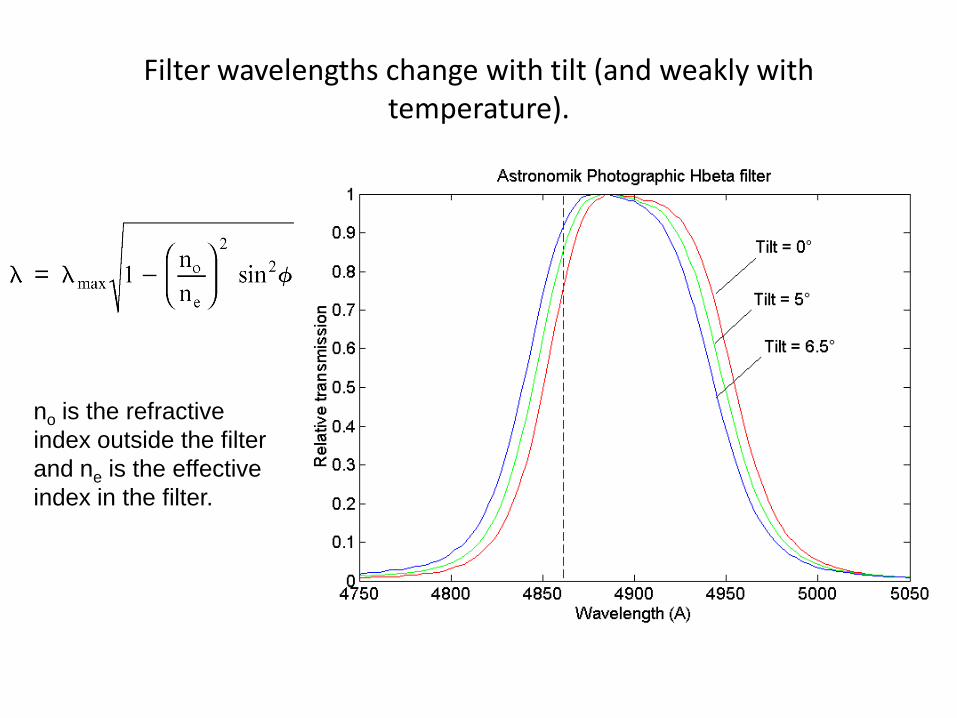
Filter wavelengths change with tilt (and weakly with temperature).
no is the refractive
index outside the filter
and ne is the effective
index in the filter.
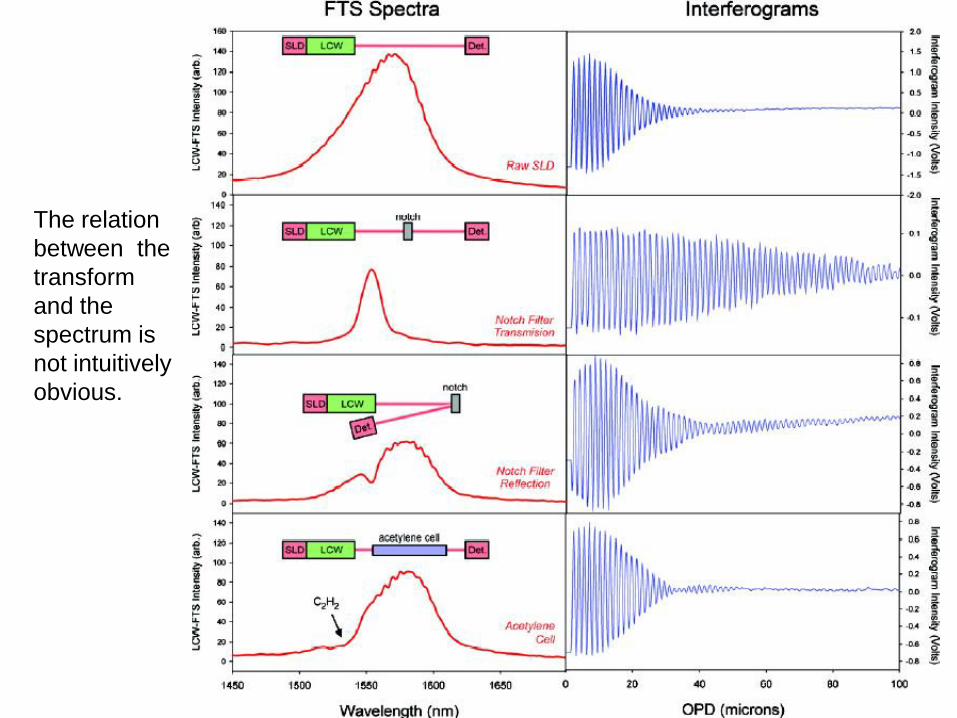
The relation
between the
transform
and the
spectrum is
not intuitively
obvious.
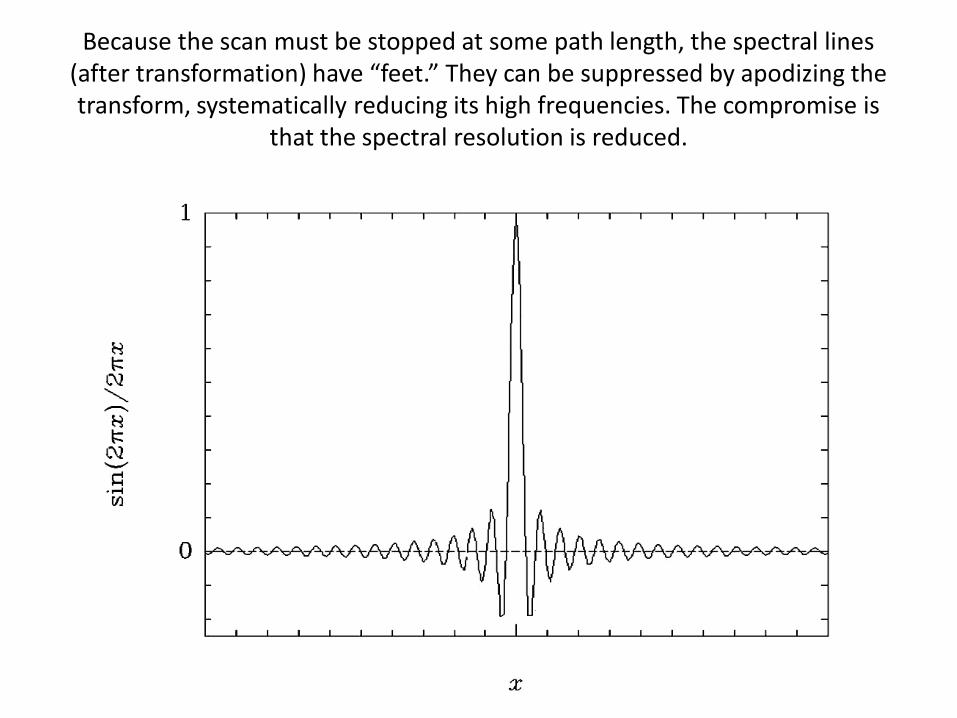
Because the scan must be stopped at some path length, the spectral lines (after transformation) have “feet.” They can be suppressed by apodizing the transform, systematically reducing its high frequencies. The compromise is
that the spectral resolution is reduced.
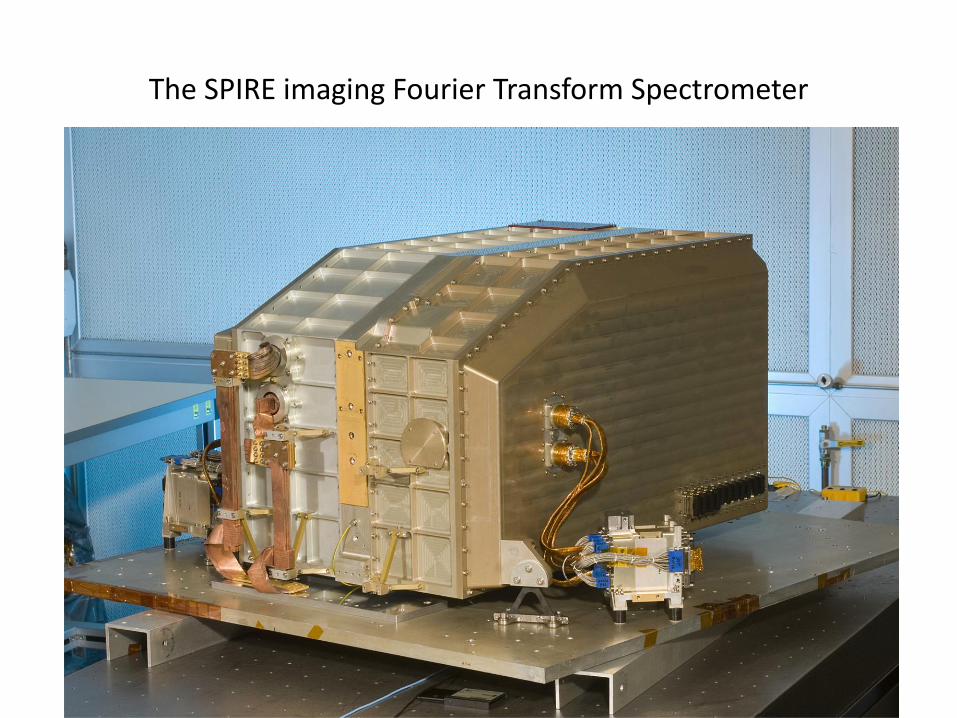
The SPIRE imaging Fourier Transform Spectrometer
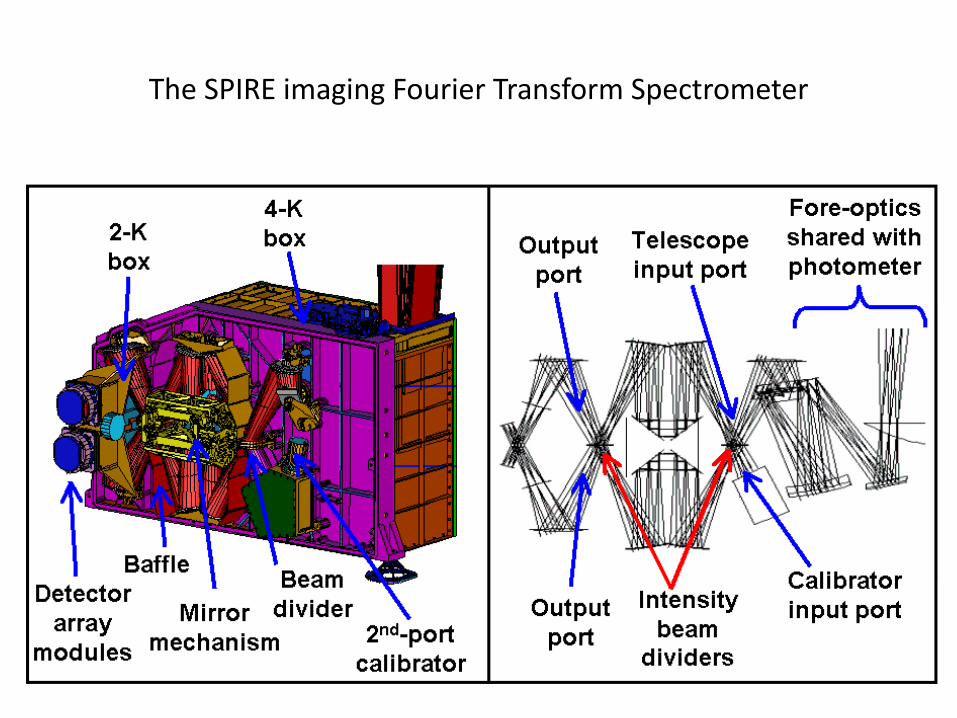
The SPIRE imaging Fourier Transform Spectrometer
End of Spectroscopy