Embed Size (px)
Citation preview
Spectrum Analysis of Hot Stars
R. Blomme
Royal Observatory of Belgium
On behalf of: R. Dorda, Y. Frémat, M. Gebran, E. Gosset, A. Herrero, V. Kalari, A. Lobel,
J. Maíz Apellániz, F. Martins, R. Monier, T. Morel, I. Negueruela, F. Royer,
T. Semaan, S. Simon-Diaz, A. Tkachenko, D. Volpi,
and the Gaia-ESO WG13 team
WG 13
Porto, 10-13 November 2014 Gaia-ESO Survey Second Science Meeting 2
WG 13: OBA Star Spectrum Analyses
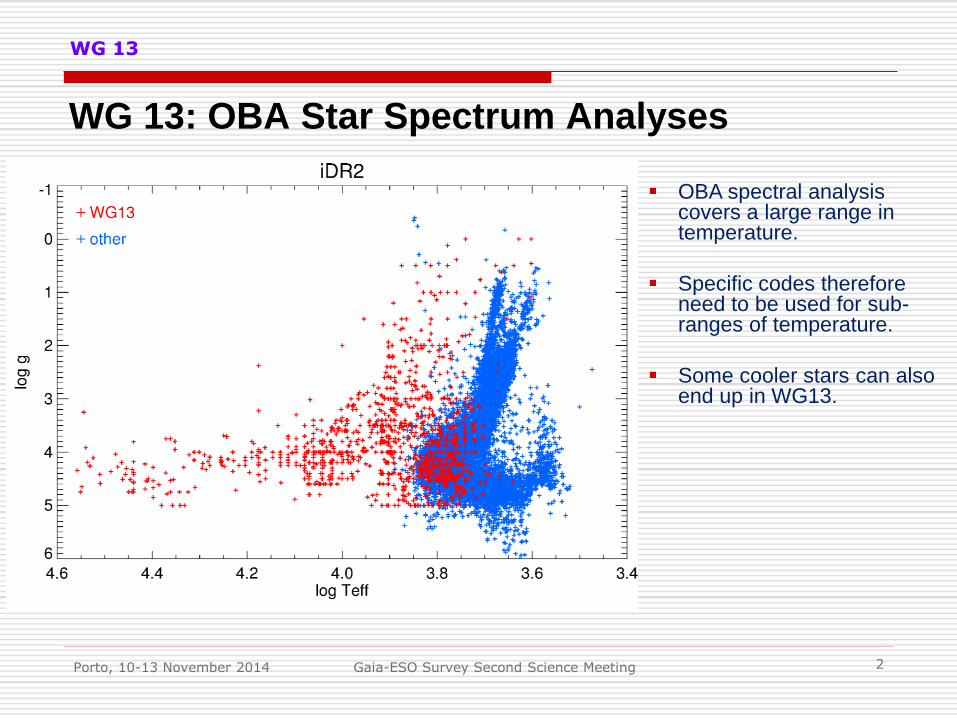
OBA spectral analysis covers a large range in temperature.
Specific codes therefore need to be used for sub-ranges of temperature.
Some cooler stars can also end up in WG13.
Workgroup nodes
Porto, 10-13 November 2014 Gaia-ESO Survey Second Science Meeting 3
Workgroup nodes
ROB (A. Lobel)
Models: Kurucz (LTE), refined grid
Scanspec: LTE spectrum synthesis
Compare EWs of selected lines
A-type stars
Liege (T. Morel, T. Semaan)
Models: Kurucz (LTE) or Tlusty (NLTE)
Synspec: NLTE spectrum synthesis
Compare spectral lines - shapes
B-type stars
In the OBA workgroup, each node uses its own techniques to determine stellar parameters and (possibly) abundances
Workgroup nodes
Porto, 10-13 November 2014 Gaia-ESO Survey Second Science Meeting 4
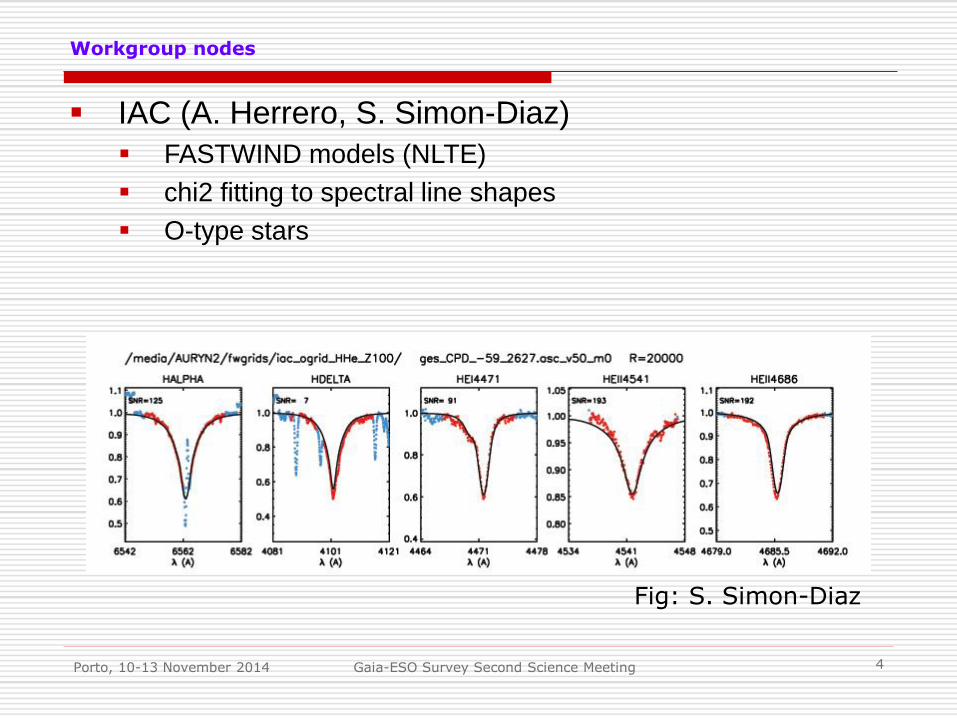
IAC (A. Herrero, S. Simon-Diaz)
FASTWIND models (NLTE)
chi2 fitting to spectral line shapes
O-type stars
Fig: S. Simon-Diaz
Workgroup nodes
Porto, 10-13 November 2014 Gaia-ESO Survey Second Science Meeting 5
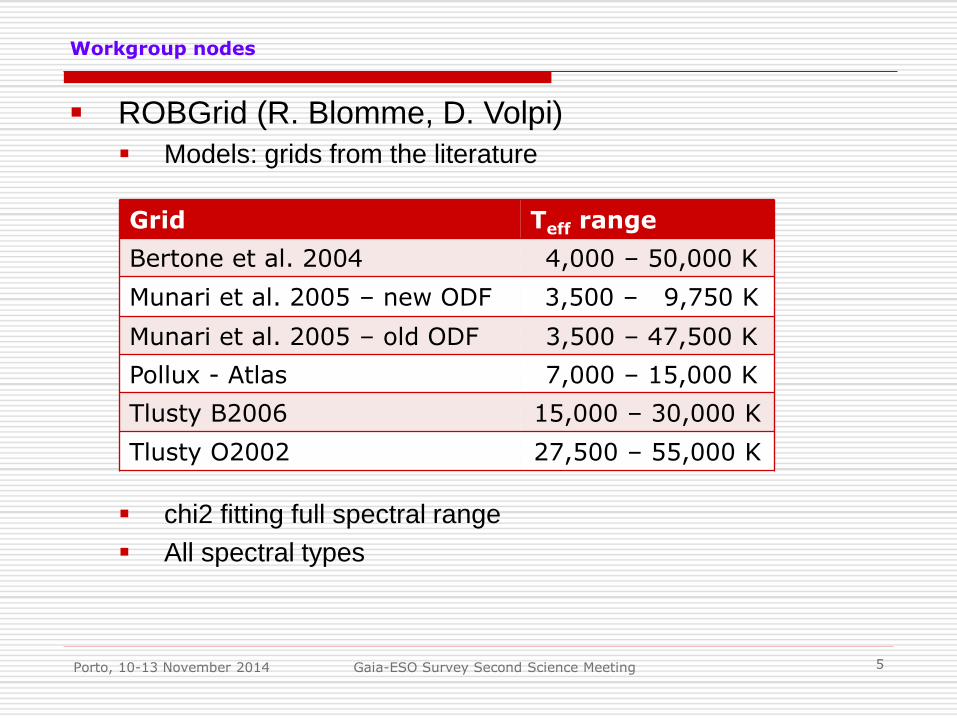
ROBGrid (R. Blomme, D. Volpi)
Models: grids from the literature
chi2 fitting full spectral range
All spectral types
Grid Teff range
Bertone et al. 2004 4,000 – 50,000 K
Munari et al. 2005 – new ODF 3,500 – 9,750 K
Munari et al. 2005 – old ODF 3,500 – 47,500 K
Pollux - Atlas 7,000 – 15,000 K
Tlusty B2006 15,000 – 30,000 K
Tlusty O2002 27,500 – 55,000 K
Gratings
Porto, 10-13 November 2014 Gaia-ESO Survey Second Science Meeting 6
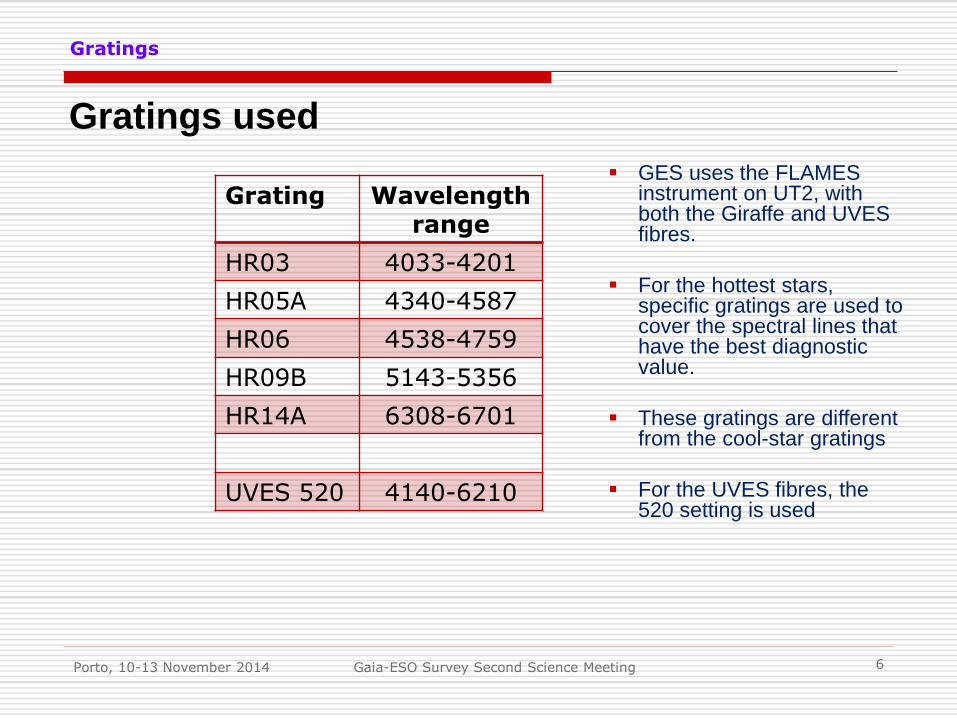
Gratings used
Grating Wavelength range
HR03 4033-4201
HR05A 4340-4587
HR06 4538-4759
HR09B 5143-5356
HR14A 6308-6701
UVES 520 4140-6210
GES uses the FLAMES instrument on UT2, with both the Giraffe and UVES fibres.
For the hottest stars, specific gratings are used to cover the spectral lines that have the best diagnostic value.
These gratings are different from the cool-star gratings
For the UVES fibres, the 520 setting is used
Clusters analyzed
Porto, 10-13 November 2014 Gaia-ESO Survey Second Science Meeting 7
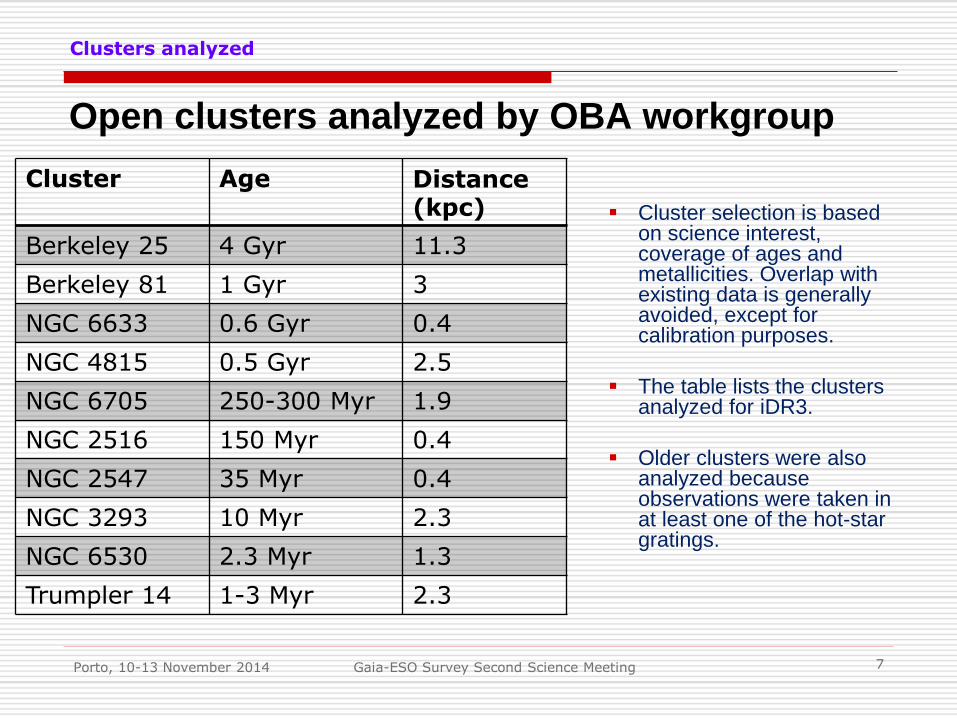
Open clusters analyzed by OBA workgroup
Cluster Age Distance (kpc)
Berkeley 25 4 Gyr 11.3
Berkeley 81 1 Gyr 3
NGC 6633 0.6 Gyr 0.4
NGC 4815 0.5 Gyr 2.5
NGC 6705 250-300 Myr 1.9
NGC 2516 150 Myr 0.4
NGC 2547 35 Myr 0.4
NGC 3293 10 Myr 2.3
NGC 6530 2.3 Myr 1.3
Trumpler 14 1-3 Myr 2.3
Cluster selection is based on science interest, coverage of ages and metallicities. Overlap with existing data is generally avoided, except for calibration purposes.
The table lists the clusters analyzed for iDR3.
Older clusters were also analyzed because observations were taken in at least one of the hot-star gratings.
Signal-to-noise ratio problem
S/N problem
Gaia-ESO Survey Second Science Meeting 8
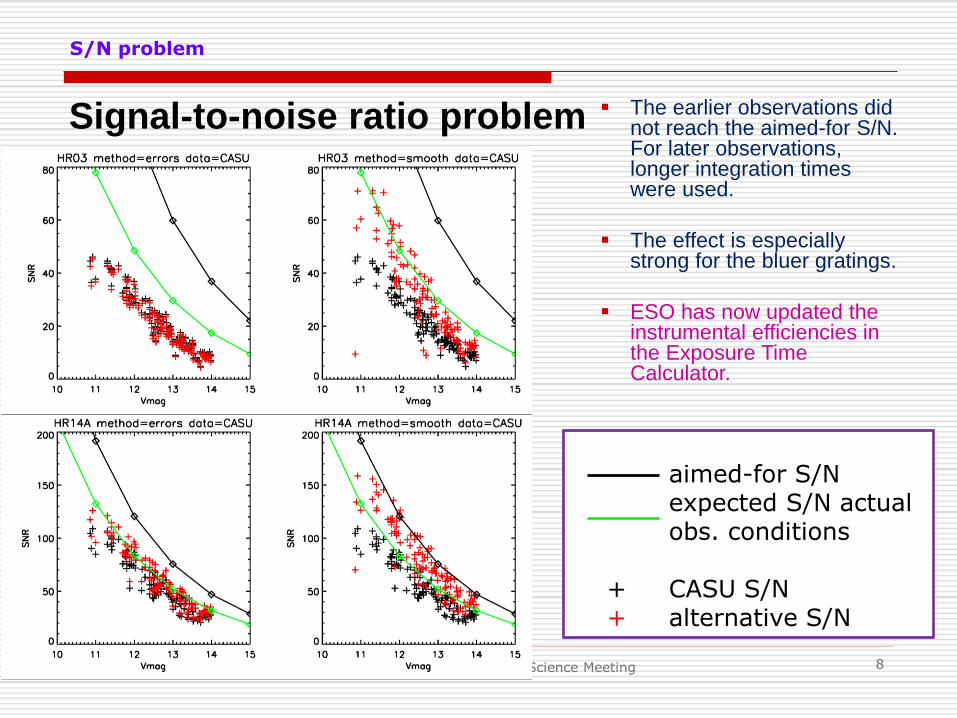
aimed-for S/N expected S/N actual obs. conditions + CASU S/N + alternative S/N
The earlier observations did not reach the aimed-for S/N. For later observations, longer integration times were used.
The effect is especially strong for the bluer gratings.
ESO has now updated the instrumental efficiencies in the Exposure Time Calculator.
Porto, 10-13 November 2014
Continuum problem
Porto, 10-13 November 2014 Gaia-ESO Survey Second Science Meeting 9
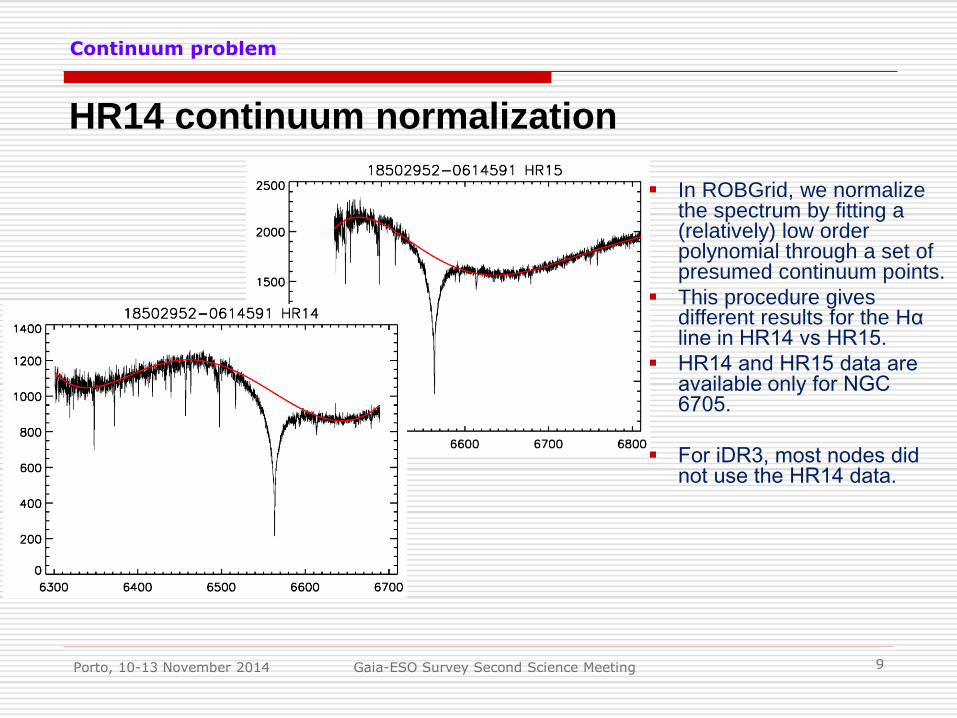
HR14 continuum normalization
In ROBGrid, we normalize the spectrum by fitting a (relatively) low order polynomial through a set of presumed continuum points.
This procedure gives different results for the Hα line in HR14 vs HR15.
HR14 and HR15 data are available only for NGC 6705.
For iDR3, most nodes did not use the HR14 data.
Continuum problem
Porto, 10-13 November 2014 Gaia-ESO Survey Second Science Meeting 10
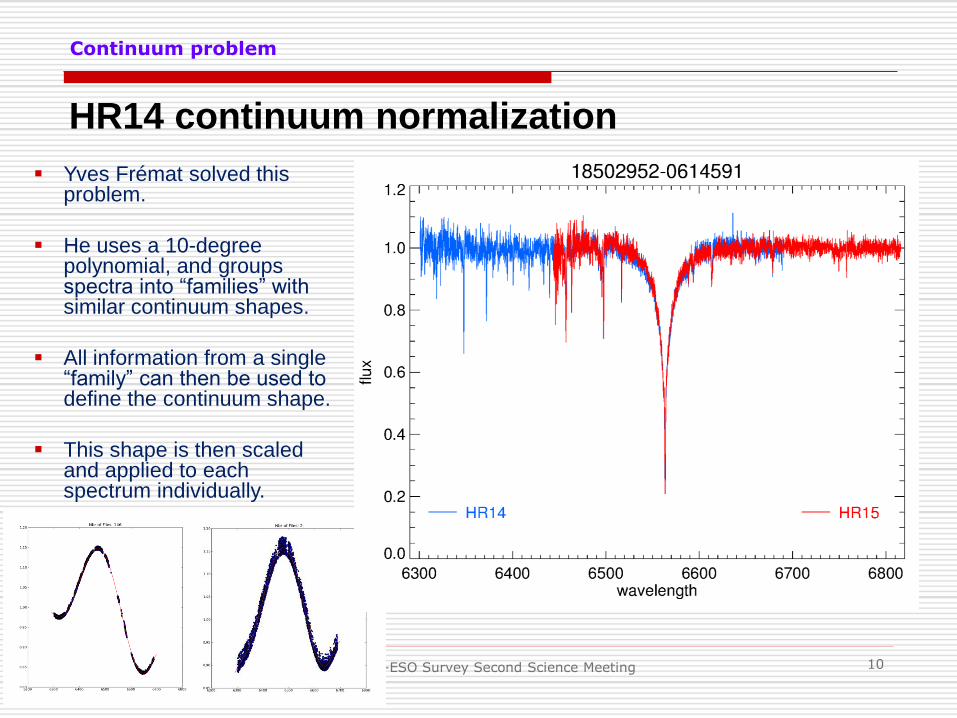
HR14 continuum normalization
Yves Frémat solved this problem.
He uses a 10-degree polynomial, and groups spectra into “families” with similar continuum shapes.
All information from a single “family” can then be used to define the continuum shape.
This shape is then scaled and applied to each spectrum individually.
Results
Porto, 10-13 November 2014 Gaia-ESO Survey Second Science Meeting 11
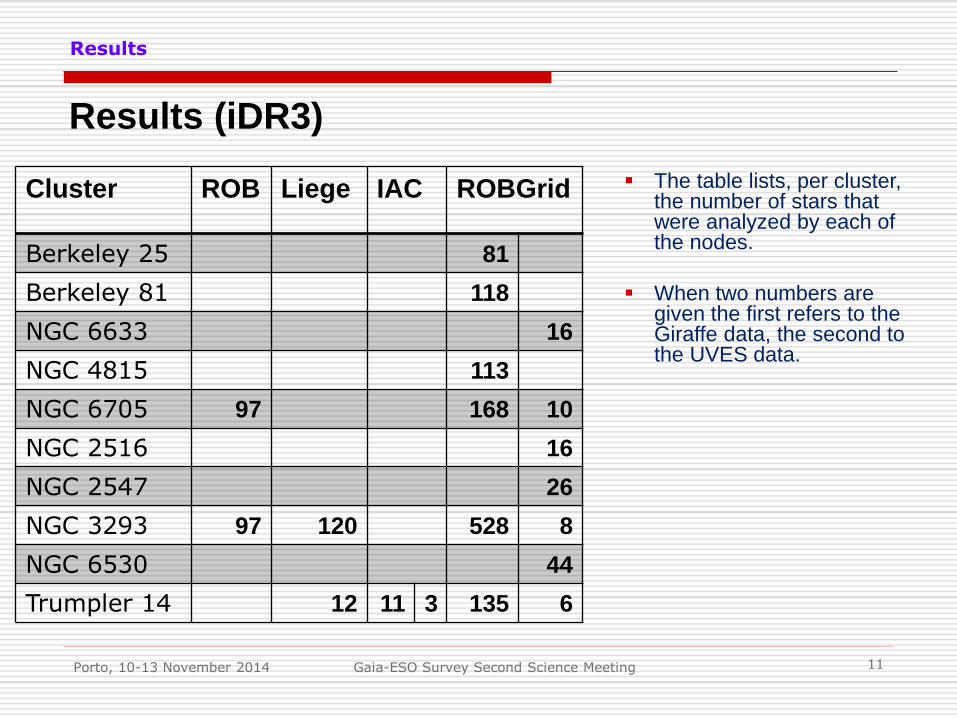
Results (iDR3)
Cluster ROB Liege IAC ROBGrid
Berkeley 25 81
Berkeley 81 118
NGC 6633 16
NGC 4815 113
NGC 6705 97 168 10
NGC 2516 16
NGC 2547 26
NGC 3293 97 120 528 8
NGC 6530 44
Trumpler 14 12 11 3 135 6
The table lists, per cluster, the number of stars that were analyzed by each of the nodes.
When two numbers are given the first refers to the Giraffe data, the second to the UVES data.

Results
Porto, 10-13 November 2014 Gaia-ESO Survey Second Science Meeting 12
Results – parameters provided
Teff Log g Metal. Micro. Vsini Vrad Abund. Flags
ROBGrid
ROB [Fe/H]
Liege
He, Mg, Si
IAC He
All nodes provide Teff, log g and v sin i. Other parameters provided differ from one node to the other.
Comparison nodes
Porto, 10-13 November 2014 Gaia-ESO Survey Second Science Meeting 13
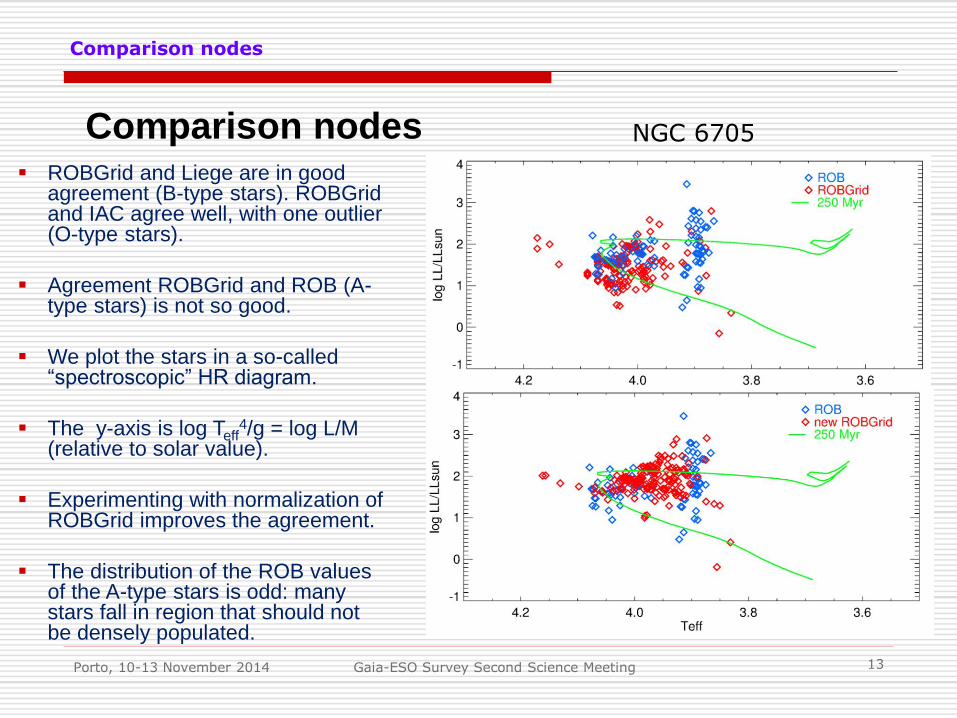
Comparison nodes
ROBGrid and Liege are in good agreement (B-type stars). ROBGrid and IAC agree well, with one outlier (O-type stars).
Agreement ROBGrid and ROB (A-type stars) is not so good.
We plot the stars in a so-called “spectroscopic” HR diagram.
The y-axis is log Teff4/g = log L/M
(relative to solar value).
Experimenting with normalization of ROBGrid improves the agreement.
The distribution of the ROB values of the A-type stars is odd: many stars fall in region that should not be densely populated.
NGC 6705
Homogenize results
Porto, 10-13 November 2014 Gaia-ESO Survey Second Science Meeting 14
Homogenization
If ROB, Liege or IAC values exist, use those
Use ROB if ROB-Teff < 12000 K
Use ROBGrid otherwise
Science results
Porto, 10-13 November 2014 Gaia-ESO Survey Second Science Meeting 15
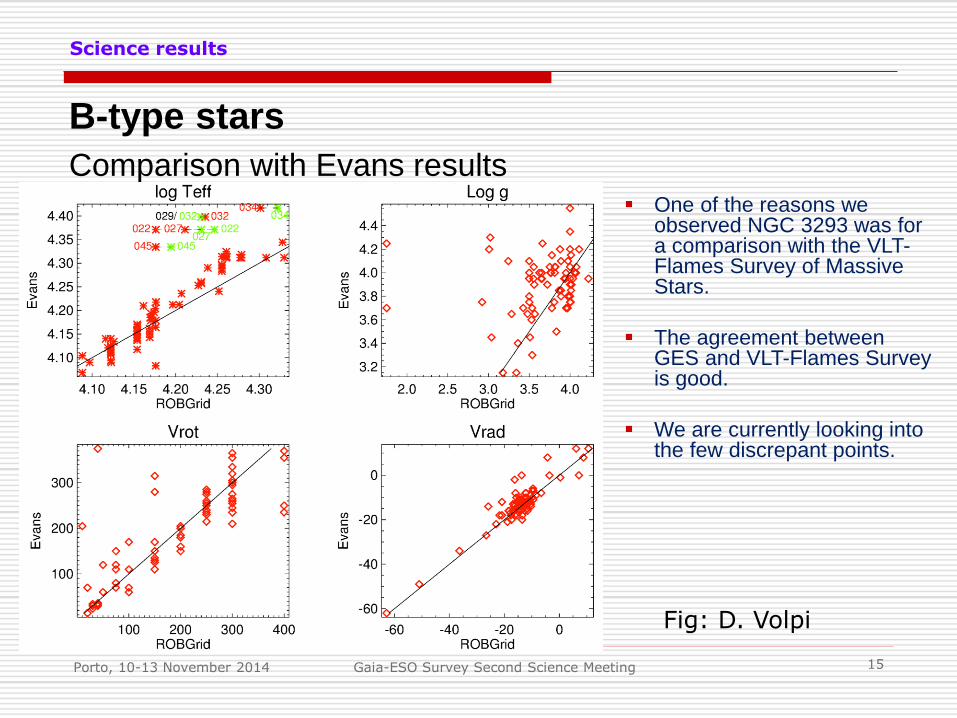
B-type stars
Comparison with Evans results
Fig: D. Volpi
One of the reasons we observed NGC 3293 was for a comparison with the VLT-Flames Survey of Massive Stars.
The agreement between GES and VLT-Flames Survey is good.
We are currently looking into the few discrepant points.
Science results
Porto, 10-13 November 2014 Gaia-ESO Survey Second Science Meeting 16
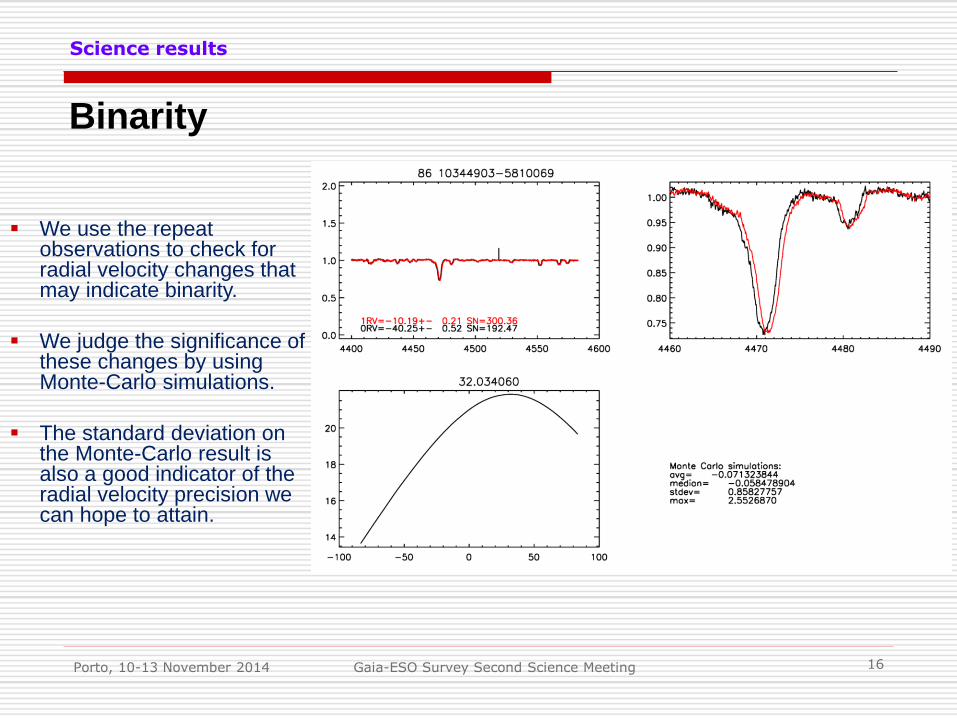
Binarity
We use the repeat observations to check for radial velocity changes that may indicate binarity.
We judge the significance of these changes by using Monte-Carlo simulations.
The standard deviation on the Monte-Carlo result is also a good indicator of the radial velocity precision we can hope to attain.
Science results
Porto, 10-13 November 2014 Gaia-ESO Survey Second Science Meeting 17
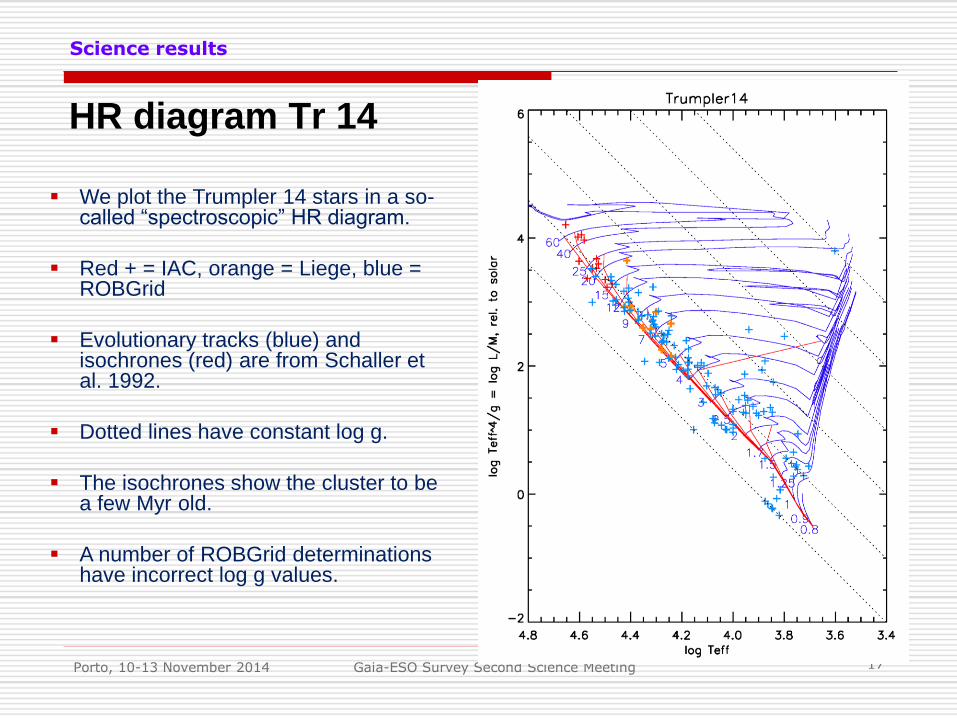
HR diagram Tr 14
We plot the Trumpler 14 stars in a so-called “spectroscopic” HR diagram.
Red + = IAC, orange = Liege, blue = ROBGrid
Evolutionary tracks (blue) and isochrones (red) are from Schaller et al. 1992.
Dotted lines have constant log g.
The isochrones show the cluster to be a few Myr old.
A number of ROBGrid determinations have incorrect log g values.
Plans iDR4
Porto, 10-13 November 2014 Gaia-ESO Survey Second Science Meeting 18
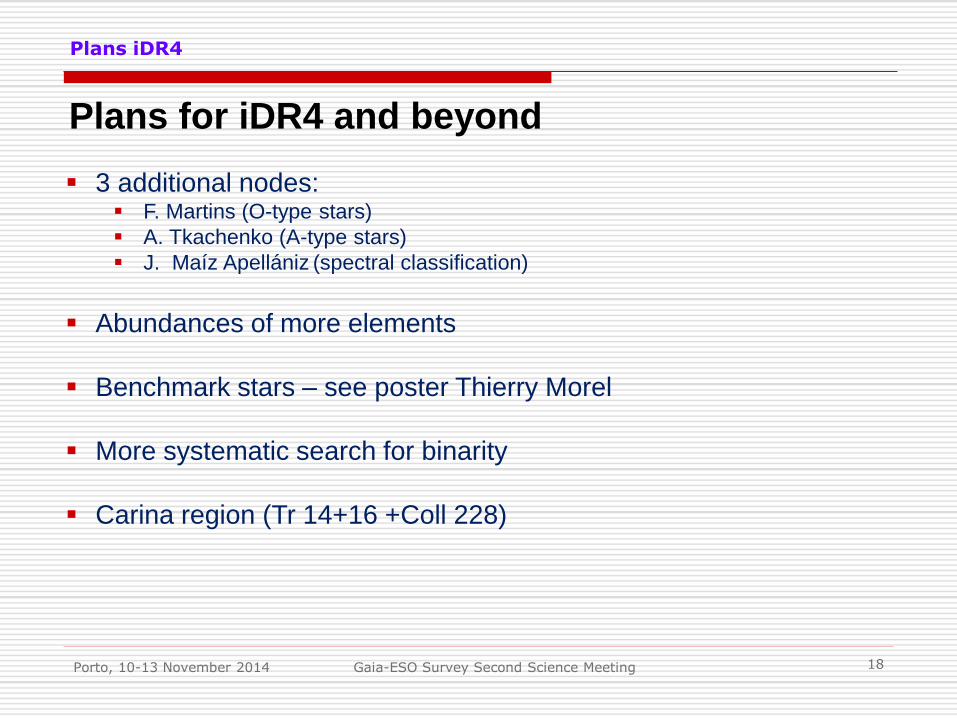
Plans for iDR4 and beyond
3 additional nodes: F. Martins (O-type stars)
A. Tkachenko (A-type stars)
J. Maíz Apellániz (spectral classification)
Abundances of more elements
Benchmark stars – see poster Thierry Morel
More systematic search for binarity
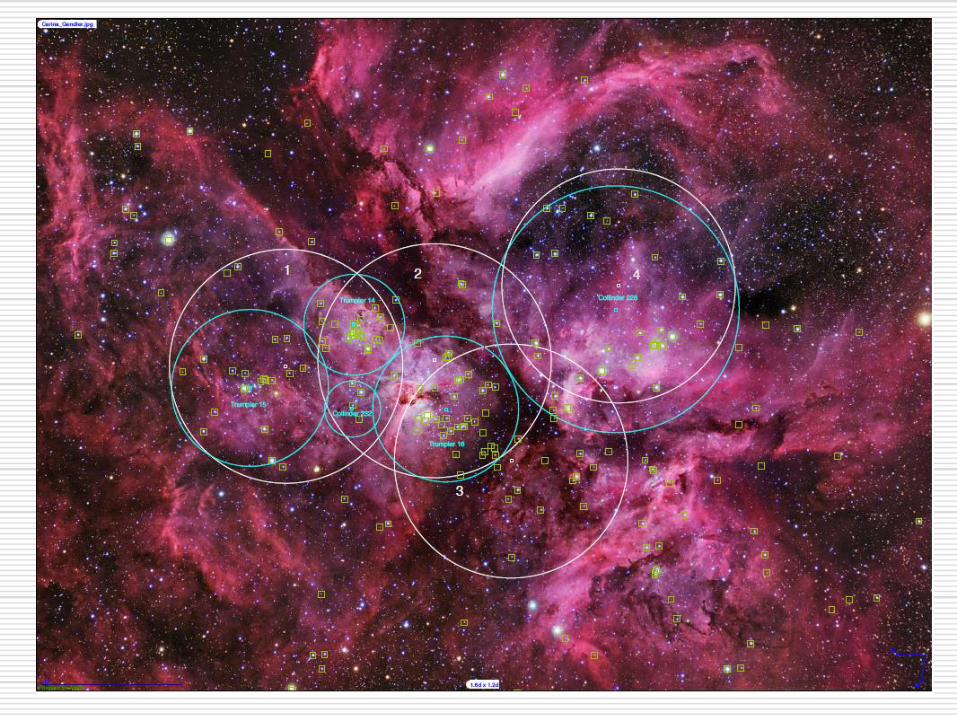
Carina region (Tr 14+16 +Coll 228)
New
Porto, 10-13 November 2014 Young Clusters in the Gaia-ESO Survey 19