Embed Size (px)
Citation preview

December 7th 2019 A publication of Algobot Pte Ltd CRN201604500D. Copyright © 2019
1
Weekly for Saturday December 7th, 2019. Based on Thursday’s Close
CONTENTS
SPECULATIVE TRADE FAILURE pg1 BLACK FRIDAY MARKET CRASH pg6 SHORT TRADE PATTERN DEVELOPMENT pg8
DOW STRENGTH pg11 MORE FOREIGN INFLUENCE pg12
NEWSLETTER OUTLOOK: BREAK A LEG pg14 PORTFOLIO CASE STUDIES: MONEY MANAGEMENT pg15
SPECULATIVE TRADE FAILURE By Daryl Guppy
Some trades simply do not work out as anticipated. We had high hopes and
they were dashed. This was a speculative trade built around a particular product and news stories. ID8* produces software that can ‘bolt onto’ legacy bank systems and produce reports that are compliant with AUSTRAC requirements. On a fundamental
level this seemed a good fit for the Westpac story. The specifics of the news links are not as important as the trading methods that
were illustrated in this example. This type of trade is not indemnified as a result of a technical analysis search. They are first identified as a result of a major news event.
But first, a recap of the trade plans.
December 7th 2019 A publication of Algobot Pte Ltd CRN201604500D. Copyright © 2019
2
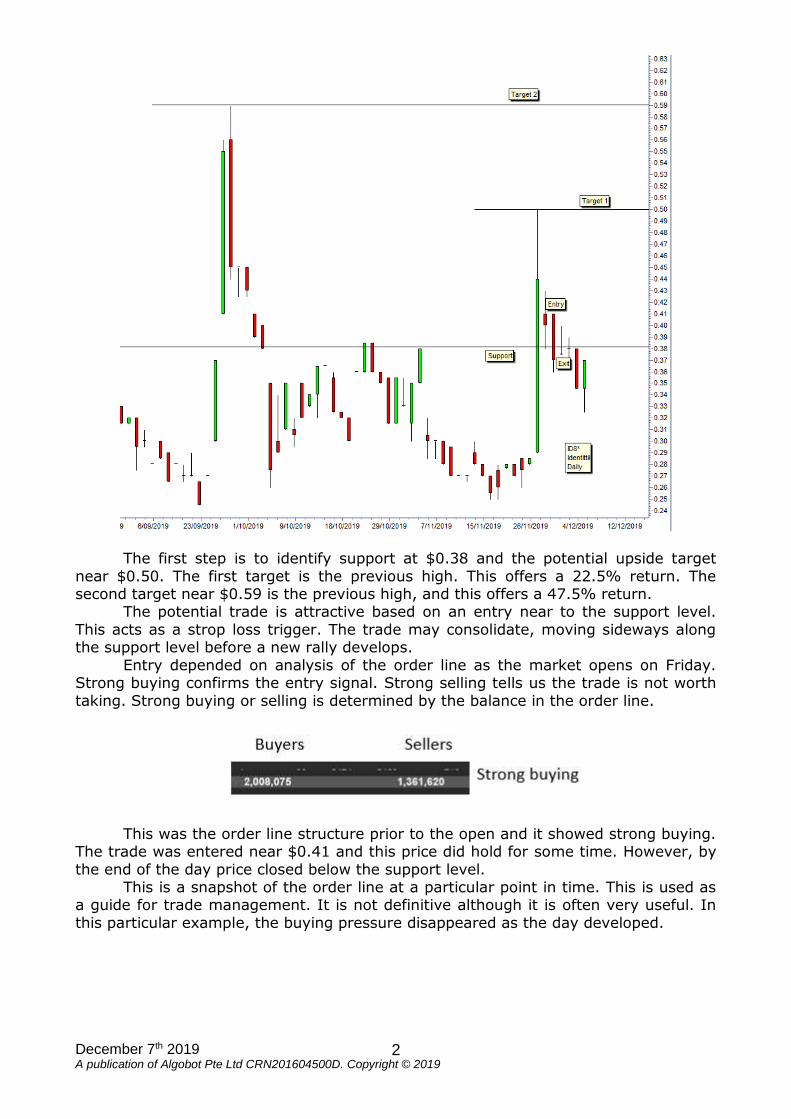
The first step is to identify support at $0.38 and the potential upside target
near $0.50. The first target is the previous high. This offers a 22.5% return. The second target near $0.59 is the previous high, and this offers a 47.5% return.
The potential trade is attractive based on an entry near to the support level.
This acts as a strop loss trigger. The trade may consolidate, moving sideways along the support level before a new rally develops.
Entry depended on analysis of the order line as the market opens on Friday. Strong buying confirms the entry signal. Strong selling tells us the trade is not worth
taking. Strong buying or selling is determined by the balance in the order line.
This was the order line structure prior to the open and it showed strong buying. The trade was entered near $0.41 and this price did hold for some time. However, by
the end of the day price closed below the support level. This is a snapshot of the order line at a particular point in time. This is used as
a guide for trade management. It is not definitive although it is often very useful. In
this particular example, the buying pressure disappeared as the day developed.

December 7th 2019 A publication of Algobot Pte Ltd CRN201604500D. Copyright © 2019
3
This signalled the trade had failed. The exit is signalled for the next day. The objective is to get the best possible exit price. For case study purposes this is taken at
$0.39. This gives a loss of $975.61 or 4.88%. Some readers may have regarded this trade example as a gamble, and in some
ways it was. It was very much a speculative trade example, and although it didn’t
develop as expected, the impact on the overall portfolio is very small. This management of risk is the essential foundation for this type of trade.
You can download the ATR indicator for MT4 at
https://www.mql5.com/en/market/product/29683 Use this to improve your trade risk management.

December 7th 2019 A publication of Algobot Pte Ltd CRN201604500D. Copyright © 2019
4
CASE STUDY EQUITY CURVE
The case study trade with ID8 is closed for a loss of $975.61 or 4.88%. The
case study portfolio return is $50,450 or 50.45% for the period starting July 1, 2019 and ending June 30, 2020.
For the year starting July 1, 2018 – 2019 the case study portfolio return is $91,794 or 91.79%.
For the year starting July 1, 2017-2018, the case study portfolio return is
$115,330 or 115.3%. For the year starting July 1, 2016-2017, the case study portfolio return is $92,464.15 or 92.5%. For the year starting July 1, 2015- 2016, the
case study portfolio return is $156,450 or 156.45%. Equity trade size is generally kept constant at $20,000 in the case study
portfolio so it is easier to compare the case study trades over this and other years.
Unless otherwise noted in the trade management notes, all equity case study trades are managed on an end of day basis, with the exit taken at the best reasonable price
on the day after the stop loss is triggered. Warrant and CFD trades are generally kept constant at $10,000. Warrant and
CFD trades are closed on an intraday basis using a guaranteed stop loss as this is a
primary method of managing derivative risk. FX trades are generally kept constant at $5000. Stops are managed intraday.
This capital allocation reflects the risk in each of these asset classes.

December 7th 2019 A publication of Algobot Pte Ltd CRN201604500D. Copyright © 2019
5
Go to: http://www.guppytraders.com/2019Xmas/

December 7th 2019 A publication of Algobot Pte Ltd CRN201604500D. Copyright © 2019
6
BLACK FRIDAY MARKET CRASH By Karen Wong
You may have missed the Black Market Crash at the end of November this year.
Prices dropped, some over 50% leading up to the crash. It sounds like an event relating to stocks in the share market but it wasn’t.
The reason you might have missed it was because this crash happened in the FIFA 20 trading player market also known as the FUT transfer market. Not to be confused with the FTSE. Completely different.
In the Black Market Crash it wasn’t the price of CSL plummeting. It was the prices of player cards like Wissam Ben Yedder falling by around 90% from its high.
The chart looked like this.
The FUT transfer market aka FIFA Ultimate Team transfer market is a place to
buy and sell digital cards of individual international football players. These cards are used to make your ultimate football team to play the online football simulation game FIFA 20. Each time you win a FIFA 20 game, you get 500 coins. A virtual economy of
FIFA coins exists to buy and sell FUT cards. Want Ronaldo on your team? His FUT card costs about 1.3 million coins.
Comparing the FUT transfer market with the Australian Stock Market is like comparing chalk and cheese. The complexity of the ins and outs of the FUT transfer market are beyond the scope of this article. Despite the differences in the 2 markets
the principles of trading are exactly the same. There are real lessons to be learnt from the participants trading cards in the
FIFA 20 card market. A trading guide I found online on how to trade the FUT market reminded me of the trading principles we see applicable to any market in the world.
The following recent trade on Baby Bunting Group Ltd - BBN will be used to
demonstrate some of the principles found in the FUT trading guide.

December 7th 2019 A publication of Algobot Pte Ltd CRN201604500D. Copyright © 2019
7
Figure 1.1
Buying a Stock
FUT market traders are encouraged to ask themselves what the reasons are for
buying a player. For technical traders the reasons could be one or more indicators giving a buy signal to enter a trade. On the Daily chart of BBN, Figure 1.1, we are
looking at the Guppy Multiple Moving Averages to determine whether we will enter the trade or not. The wide separation of the lines in the Long Term GMMA means there is strong support from investors of the uptrend in place. Leading up to the marked
Entry, the Short Term GMMA is sitting above the Long Term GMMA, compressed slightly but beginning to turn up and fan out again. The Short Term GMMA represents
the activity of traders and it shows traders are quite active in this stock. Price was highly likely to rise in line with the prevailing uptrend.
Buy Low and Sell High
FUT market traders like to buy at a low price then sell at a higher price to maximize profit.
The problems faced by the FUT market traders mirror those experienced by technical traders.
(1) Selling too early and missing out on further profit as the price continues up. The price of BBN rose after initial entry then retraced back towards the Long Term
GMMA closing not below but on the line of the 2*ATR Stop Loss. If the BBN trade was closed the next day we would have missed the rise to the high of $4.03.
(2) Holding on too long and watching price go down along with your profits. The BBN trade remained open and a new Count Back Line Long Stop Loss was used
to ensure the trailing stop loss remained close to the price movements. The Count Back Line Long Stop Loss was triggered a few days after the high. This
was the time to close the trade. This trade was not closed when price was at $4.03, only $0.04 away from our Target Profit. Price was heading south and profits were going down as a result of holding the trade open for longer.

December 7th 2019 A publication of Algobot Pte Ltd CRN201604500D. Copyright © 2019
8
Focus on the Now
According to the guide, some FUT market traders avoid selling too early for fear
of missing out. Instead of appreciating the great profit in front of them the focus and concern is on the imagined profit they could make going into the future. Technical
traders are susceptible to the same kind of thinking. The key to our decisions should always be from the chart.
Selling Early
Selling early has the advantage of locking in a definite profit for the FUT market traders. The advantage is one for technical traders too as it releases your cash to channel into another better trade. Constant profits are possible as a result of
withdrawing from one trade into another trade with the potential for a stronger move.
Stick to Target Goals
FUT market traders are encouraged to always stick to their target goals by
setting a buy price and a sell price. For technical traders this is incorporated into the trading plan by setting an Entry price, Exit price and Target Profit price. In the BBN
trade an Entry was made at $3.55 with a 2*ATR Stop Loss of $3.13 and a Target Profit of $4.07.
Selling on Time
Sell when you have to according to your plan. In the FUT transfer market the perfect time to sell is also the worst time as huge volumes of sellers enter the market
to drive price downwards immediately. From the high of $4.03 on the BBN chart we see the effect of sellers in the market as price eventually fell to $3.19 at the right side of the chart.
Limiting Losses
FUT market traders should acknowledge if a trade fails, they should sell and
move on. A small loss now can become a bigger loss in a few days. If the BBN trade
was sold at $3.38, that is when price closed on the 2*ATR line then a small loss of 4% would have been the result. Not acknowledging the 2*ATR stop loss and holding the
trade open until the right side of the chart results in an open loss at $3.19. A much larger loss of 10%.
Whether it is in the stock, FX or commodities market, even the FUT transfer
market, we can consider these simple trading principles for better trading in the future.
SHORT TRADE PATTERN DEVELOPMENT By Daryl Guppy
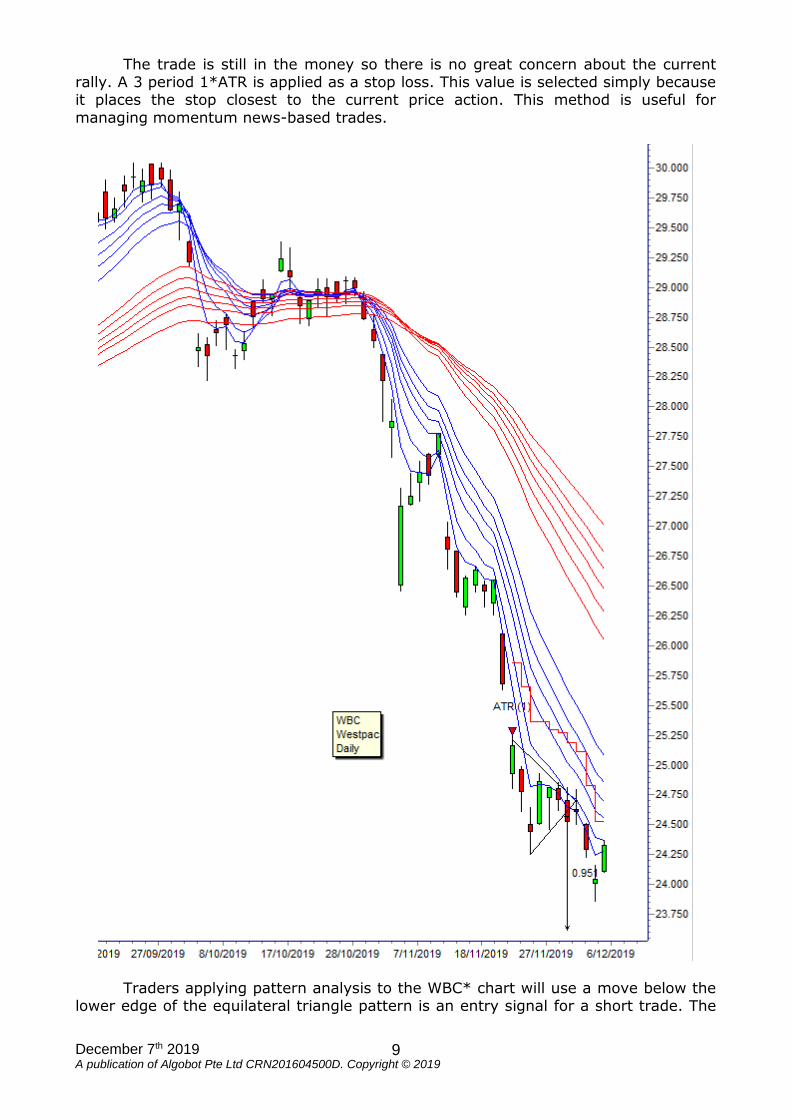
This is a pattern trade. Its built around continuing bad news for the underlying stock – WBC* – but at heart it’s a pattern trade with an equilateral triangle. It’s the news the provides traders with the clue to the direction of the breakout.
The base of the pattern is measured and projected downwards to give a target near $23.63. This projection is measured from the point where the price moves below
the trend line. The trade solution is built around these pattern price projections.
December 7th 2019 A publication of Algobot Pte Ltd CRN201604500D. Copyright © 2019
9
The trade is still in the money so there is no great concern about the current rally. A 3 period 1*ATR is applied as a stop loss. This value is selected simply because it places the stop closest to the current price action. This method is useful for
managing momentum news-based trades.
Traders applying pattern analysis to the WBC* chart will use a move below the lower edge of the equilateral triangle pattern is an entry signal for a short trade. The

December 7th 2019 A publication of Algobot Pte Ltd CRN201604500D. Copyright © 2019
10
base of the triangle pattern is measured and used to project the downside target near $23.63.
For tutorial purposes we have added a CFD trade in WBC* using this pattern. Entry is near $24.74. The upper edge of the triangle pattern is used as the stop loss. The projected downside target is shown. This is an example of news based and
pattern based trading. *The image shows a saxophone player and a woman’s face.

December 7th 2019 A publication of Algobot Pte Ltd CRN201604500D. Copyright © 2019
11
DOW STRENGTH By Daryl Guppy
The pullback in the DOW represents a buying opportunity. The conclusion rests
on two different types of analysis. The first analysis method looks at trend strength. We use the Guppy Multiple Average (GMMA) indicator to assess trend strength.
The GMMA consist of two groups of moving averages. The short-term upper group provides a guide to the way traders are thinking. The long-term lower group does the same for investors. The long-term group is widely separated and moving
steadily upwards. This suggests good support for the trend. When a selloff occurs the downwards
pressure is absorbed by the long-term group – the investors – as they come into the market as buyers. This consistent reaction is seen at points A, B and C. This shows trend resilience.
The note of caution is given by the narrow degree of separation between the long- and short-term groups of averages. This is in contrast to the November 216 to
December 2018 period where the separation between the two groups of moving averages was much wider and this showed a much stronger trend.
The current relationship shows a steady trend that is frequently tested. This
adds a further note of caution because these types of tests with rapid retreats and rebounds usually end up breaking the uptrend. It like a jackhammer gradually
weakening a concrete beam with continuous sharp attacks. There is certainly no signal to short the DOW, but traders will recognise
diminished trend strength.
The second analysis method is built around the trading band because this is used to set potential upside targets. The trading band is a combination of support
and resistance levels. The upper resistance level is near 26,600. The lower support level is near 23,500. This lower level was broken with a major market dip in December 2018, so the trading band is applied with a degree of caution. This means
the target projection is used as a guide rather than as a definite target.

December 7th 2019 A publication of Algobot Pte Ltd CRN201604500D. Copyright © 2019
12
The width of the band is measured and this value projected upwards. It gives
an upside target near 29,700.
MORE FOREIGN INFLUENCE By Daryl Guppy
The Australian index follows the DOW as discussed in the XJO notes. However,
the Australian market is also buffeted by the Shanghai Index. This has added a gloomy background to the DOW collapse.
The Shanghai Index continues to move slowly down towards support near
2830. This is a slow and steady decline with the index clustering along the lower edges of the short-term Guppy Multiple Moving Average. There is no indication of
trend reversal or rally behaviour. However, the decline is slow and steady, and this shows no evidence of panic
selling with a fast fall or large intraday dips. This restrained trend movement
increases the probability of good support developing near 2830 because the down pressure is not very volatile.
The GMMA is used to assess the strength of the trend. The long term GMMA is showing steady separation. The upper edge of the long term GMMA is near to the value of the central support resistance level near 2920.

December 7th 2019 A publication of Algobot Pte Ltd CRN201604500D. Copyright © 2019
13
The short term GMMA indicates the way traders are thinking. This group is also
steadily and consistently separated. There is no evidence of compression, so this suggests steady selling. Traders are waiting for the test of support near 2830 before
they enter the market in anticipation of a trend change. This steady separation suggests any rally will be short-lived.
The separation between the two groups of averages is also consistent. This
consistent separation is the characteristic of a steady and well-established trend. The key future event bis the strength of the support behaviour when the index reaches
2830. A successful consolidation and rebound require three main features to develop
before a new uptrend can be established. The first bullish feature for any rebound from support is a change in the
relationships between the Guppy Multiple Moving averages. The short-term group of
averages must compress, turn upwards and move above the upper edge of the long term GMMA. This confirms a bullish environment.
The second feature is the support and resistance level near 2920. The index must be able to move above this level and use this level as a support level before any new uptrend can develop.
The third resistance feature is the value of the down sloping trend line. The value of this downtrend line will act as a resistance level for any rally above the 2920
level. The current trend line value is near 2975. The combination of the downtrend line and the horizonal support level near
2920 creates a down sloping triangle pattern. A downside target is calculated by
measuring the height of the base of the triangle and projecting this value downwards. The 2800 target level is below the value of the lower edge of the long-term
support level near 2830. This suggests that in any strong market fall that the Shanghai Index may dip to the 2800 level before rebounding and developing a consolidation near 2830.

December 7th 2019 A publication of Algobot Pte Ltd CRN201604500D. Copyright © 2019
14
NEWSLETTER OUTLOOK: BREAK A LEG By Daryl Guppy
We noted over recent weeks that this is a market lacking courage and commitment. The economy simply doesn’t have the strength to go its own
way, so the market is always at the beck and call of foreign influence. After the failure of GMMA support and support near 6650, the downside
target is support near 6480.
This is a market that is too weak to develop its own direction, so it decided to follow the DOW higher and then dramatically lower, smashing
through the support features. The much-lauded new highs were not highs made with any degree of confidence. As we noted, this result was be easily shaken by external events and this exposes a worrying weakness in the
trend so many treated the rally as a short-term trading opportunity. The evidence of suspicion of trend strength comes from the GMMA
relationships and this has been confirmed with the rapid collapse. The long term GMMA is not widely separated. It has been constantly tested and tested and this usually indicates trend weakness. Compare the separation to the
GMMA separation between February and August 2019. The wide separation in this period shows a strong trend. The current narrow separation shows a
weak trend, with frequent tests of the lower edge of the long term GMMA.
December 7th 2019 A publication of Algobot Pte Ltd CRN201604500D. Copyright © 2019
15
These tests are like a jackhammer smashing its way through a block of concrete. Each hammer blow weakens the concrete- each test of GMMA support weakness the trend.
This is a complex structured chart with a continuous interplay between the values of the trading band and the trading channel.
It does not have strong momentum and relies almost exclusively on external leads from the US or China. The upside target is the value of the upper edge of the trade band shown as line D. Beyond this resistance comes from the upper edge of the
trading channel. The XJO is also dominated by trading bands and trading channels and this gives
multiple target calculations. Unlike a trading band, the target for the trading channel breakout continues to move. The target is always the upper edge of the trading channel which forms a resistance point.
Just like a trading band, the activity in a trading channel is often a rally and retreat behaviour within the limits of the parallel bands or trend lines.
The behaviour of the XJO is set with GMMA analysis. The targets for the XJO are set using trading band and trading channel analysis.
PORTFOLIO CASE STUDIES: MONEY MANAGEMENT
Starting cash position $100,000 - no brokerage or slippage 2% of risk = $2,000 NOTE Entered date is the newsletter date which contains the case study discussion.
OVERALL PROFIT TO DATE
The case study trade with ID8 is closed for a loss of $975.61 or 4.88%. The case study portfolio return is $50,450 or 50.45% for the period starting July 1, 2019
and ending June 30, 2020. For the year starting July 1, 2018 – 2019 the case study portfolio return is
$91,794 or 91.79%.
The case study portfolio return is $156,450 or 156.45% for the period starting July 1, 2016-2017. Note that this includes 6 to 21 trade results. The case study
portfolio return is $92,464.15 or 92.5% for the period starting July 1, 2015- 2016. Equity trade size is generally kept constant at $20,000 in the case study portfolio so it is easier to compare the case study trades over this and other years. Unless otherwise
noted in the trade management notes, all equity case study trades are managed on an end of day basis, with the exit taken at the best reasonable price on the day after
the stop loss is triggered.
CUSTOMER CAUTION NOTICE AND COPYRIGHT Algobot Pte Ltd (CRN 201604500D) Pte Ltd is not a licensed investment advisor. This publication, which is generally available to the public, falls under the Singapore Media Advice provisions. The information provided is for educational purposes only and does not constitute financial product advice. These analysis notes are based on our experience of applying technical analysis to the market and are designed to be
used as a tutorial showing how technical analysis can be applied to a chart example based on recent trading data. This newsletter is a tool to assist you in your personal judgment. It is not designed to replace your Licensed Financial Consultant or your Stockbroker. It has been prepared without regard to any particular person's investment objectives, financial situation and particular needs because readers come from diverse backgrounds, with diverse objectives and financial situations. This information is of a general nature only so you should seek independent advice from your broker or other investment advisors as appropriate before taking any action. The publication should not be construed by any reader
as Publisher's (i) solicitation to effect, or attempt to effect transactions in securities, or (ii) provision of any investment related advice or services tailored to any particular individual's financial situation or investment objective(s). Readers do not receive investment advisory, investment supervisory or investment management services, nor the initial or ongoing review or monitoring of the reader's

December 7th 2019 A publication of Algobot Pte Ltd CRN201604500D. Copyright © 2019
16
individual investment portfolio or individual particular needs. Therefore, no reader should assume that the Publisher serves as a substitute for individual personalized advice from a licensed financial professional of the reader's choosing. The decision to trade and the method of trading is for the reader alone to decide. The reader maintains absolute discretion as to whether or not to follow any portion of
our content. Publisher does not offer or provide any implementation services, nor does it offer or provide initial or ongoing individual personalized advice. It remains the reader's exclusive responsibility to review and evaluate the content and to determine whether to accept or reject any strategy and to
correspondingly determine whether any such strategy is appropriate for a reader's individual situation. Publisher expresses no opinion as to whether any of strategy contained on this publication is appropriate for a reader's individual situation. The author and publisher expressly disclaim all and any liability to any person, whether the purchase of this publication or not, in respect of anything and of the consequences of any thing done or omitted to be done by any such person in reliance, whether whole or partial, upon the whole or any part of the contents of this publication. Neither Algobot Pte Limited nor its officers,
employees and agents, will be liable for any loss or damage incurred by any person directly or indirectly as a result of reliance on the information contained in this publication. The information contained in this newsletter is copyright and for the sole use of trial and prepaid readers. It cannot be circulated to other readers without the permission of the publisher. Each issue now incorporates fingerprint protection that enables us to track the original source of pirate copies. If we find that you are redistributing the newsletter then, at our discretion, we will reduce the length of your paid subscription by the value of the multiple copies we believe you are circulating. Share with nine friends, and we cut your subscription
period by 90%. Contributed materials reflect the personal opinion of the authors and are not necessarily those of the publisher. Articles accurately reflect the personal views of the authors. Stocks held by the
authors are marked* and are not to be taken as a trading recommendation. This is not a newsletter of stock tips. Case study trades are notional and analysed in real time on a weekly basis. Any past investment-related performance . referred to may not be indicative of future results, and therefore, no reader should assume that the future performance of any specific investment, investment strategy will be suitable or profitable for a
reader's portfolio, or equal historical or anticipated performance level(s). Algobot Pte Ltd does not receive any benefit or fee from any of the stocks reviewed in the newsletter. Algobot Pte Ltd is an independent international financial education organization and research is supported by subscription fees. Please note that in the interest of timely publication of the newsletter, this document may be incompletely proofed. OFFICES; Algobot Pte Ltd Head Office, 20 Cecil Street,#20-01 Equity Plaza, Singapore
049705, Singapore, 22 Hibernia Crescent, Brinkin, Darwin, Australia, Room B105-A17, No.14, Chaoyangmen Nandajie, Chaoyang District, Beijing, China.