Embed Size (px)
Citation preview
Speech and Language Therapy Services for Bilingual Children in England and Scotland: A Tale of Three
Cities
Ineke Mennen, Jois Stansfield, and Sally JohnstonQueen Margaret University College
1. Introduction
It is generally accepted that the majority of the world’s population speaks more than one language and that the monolingual situation is rather uncommon (e.g. Aitchison, 1994). Winter (1999) suggests that there is no reason to assume that the prevalence of speech and language difficulties in the bilingual population should be any different to that in the monolingual population. It is thus inevitable that managers are faced with having to provide appropriate speech and language therapy services for bilingual and multilingual clients in order to ensure an equitable service to all clients. This is, however, a rather challenging task. In order to assess the need for such a service, to plan what resources are required and the best way to deliver that service, managers will need to be aware of the bilingual population they are serving. Such socio-demographic information is however not available as an easily retrievable statistic and it is difficult for managers to plan a service when faced with a paucity of data on the linguistic communities present within their area of remit.
The Royal College of Speech and Language Therapists (RCSLT, the United Kingdom’s professional body for speech and language therapists) has acknowledged the need to provide culturally and linguistically appropriate services by documenting guidelines for therapists in its handbook of professional standards (RCSLT, 1996). These guidelines advise that speech and language assessment should be carried out in both (all) languages spoken by a bilingual or multilingual client and also highlight the importance of offering speech and language therapy in the client’s chosen language. In practice, however, it may be difficult for the speech and language therapy service to achieve these guidelines. Young and Westernoff (1999) identified several challenges professionals are faced with when working with clients from culturally and linguistically diverse backgrounds, ranging from culture, language, and training, to professional matters. These challenges are often perceived to be barriers to providing an efficacious service to these clients.
This study investigates the current speech and language therapy service to bilingual children within three major centres of population in Britain and specifically addresses whether the speech and language therapists working in these areas believe that their service is currently capable of meeting the RCSLT guidelines. Through a combination of interviews and postal questionnaires, information was gathered about the speech and language therapy paediatric service provision in each of these centres, with particular emphasis to some of the challenges that may affect service provision, such as language, training and policy. Further data was gathered by studying Census data and data gleaned from Local Education Authorities (LEA).
The study is part of a wider study which aims to get a more in depth view of how RCSLT guidelines are being addressed, how accessible the service is, what support services are in place, and how services can be improved. In this paper, however, we will only report on the first phase of this study, as described above.
In our study we use the term bilingual to refer to individuals who use two or more languages in any of its modalities, speaking, writing, reading and writing (Mackey, 1968) and do not distinguish between bilingualism, multilingualism, or biculturalism and multiculturalism, unless specifically stated otherwise.
© 2005 Ineke Mennen, Jois Stansfield, and Sally Johnston. ISB4: Proceedings of the 4th International Symposium on Bilingualism, ed. James Cohen, Kara T. McAlister, Kellie Rolstad, and Jeff MacSwan, 1578-1596. Somerville, MA: Cascadilla Press.
1.1 The need for a service Mumby (1987) suggests that the lack of information about minority languages and cultures is the
factor that “perpetuates the feeling that this field is somehow beyond the scope of the average therapist”. Other factors contributing to this view are the prevailing perception that bilingual clients are rare (e.g. Paradis, 1998), the fact that bilingual or multilingual issues have only recently been added to the curriculum (at least in some speech and language therapy courses in the UK), and the fact that the norms referred to in most speech and language therapy text books and published assessments usually only refer to monolingual norms. Nevertheless, lack of information, small numbers of bilingual clients or small numbers of minority ethnic groups in a community does not in itself justify the scarcity of a satisfactory service. Particularly, since the reality is that – at least in England – the majority of speech and language therapists working with children have at least some bilingual clients on their caseload (Winter, 1999).
In a recent paper, Müller (2003: p. 5) argued for the need for surveys to establish “referral rates of multilingual clients, the duration of therapy intervention, […] the numbers and ratio of speech-language pathologists qualified to work in different languages, and the availability of multilingual therapy assistants and interpreters in various services.” In Britain, only one survey is available which investigates the speech and language therapy provision for bilingual children living in England (Winter, 1999). So far, no surveys are available for other parts of Britain, such as Scotland, Wales or Northern Ireland. Winter’s study was confined to establishing the number of speech and language therapists who work with bilingual children as well as the spread of bilingual children over their caseloads. Her findings indicate that the majority (59%) of therapists working with children in England have some bilingual children on their caseload, although there are few therapists with a specialised bilingual caseload. This information is very useful for both managers and educationalists as it suggests “that the need for training about bilingualism for speech and language therapists should be reassessed on both local and national levels” (Winter, 1999: p. 86). However, in order to plan a service strategically, managers will need to know the actual numbers of bilingual or multilingual individuals living in their area of remit, and whether or not they are proportionately represented on the caseload compared to monolingual individuals. In this way, it can be established whether there is an over- or under-representation of bilinguals on speech and language therapy caseloads.
1.2 False positives and false negatives
Bilingual or multilingual children may sometimes receive speech and language therapy when they
don’t need it. Conversely, bilingual or multilingual children may not receive therapy when they actually do need it. This over- and under-representation is sometimes referred to as the false positive or the false negative situation (e.g. Hall, 1995). False positives may result from the lack of knowledge and expertise of speech and language therapists and the lack of resources available to them, necessary to correctly diagnose a communicative disorder in such children. This may result in an over-referral of bilingual and multilingual children for fear of missing them out (Müller, 2003; Winter, 1999). False negatives may arise when bilingual or multilingual children are not referred (perhaps because their communication problem is wrongly attributed to a difficulty learning English), or fail to access services (Winter, 1999). Both situations are of course undesirable, as one doesn’t want clients falling through the net but at the same time one doesn’t want to drain resources (Müller, 2003; Winter, 1999). Only by comparing caseload data with ethnic minority population statistics can one address whether there is an over- or under-representation of bilingual or multilingual clients, and determine whether more needs to be done to promote equality of service for bilingual individuals.
• 1579 •
2. Method 2.1 Aims
Our study aimed to establish, whether • there is an over- or under-representation of bilingual or multilingual children on the speech
and language therapist’s paediatric caseloads in one English city (E1) and two Scottish cities (S1 and S2)
• speech and language therapists in these three cities believe that their service is currently meeting the RCSLT guidelines
In order to address these questions, we wanted to establish: • the percentage of monolingual and bilingual children in the population • the proportion of bilingual and monolingual children on the speech and language therapy
caseload • the percentage of monolingual and bilingual children in the school population • the languages spoken by pupils • the languages spoken by the bilingual children on the speech and language therapy caseload
The choice of the three urban centres was primarily motivated by the fact that no published data on
bilingual clients in Scotland are available, and we wanted to compare service provision in two Scottish cities to that in an English city which is renown for its multicultural population. 2.2 Data from census 2001 and local education authorities
We intended to establish the total number of monolingual and bilingual children in the population
in each centre of population, with the aim of comparing it to the number of monolingual and bilingual paediatric clients in each area. However, there are no reliable figures available which directly relate to the number of bilinguals in the population in the United Kingdom. Census data on ethnic groups give some indication of the linguistic minorities that are present, but this is by no means an unequivocal measure of bilingualism as there will also be individuals in the minority groups who are monolingual just as there may be bilinguals in the self-categorised white group. In countries like the United States, Australia, New Zealand and Canada – countries that have evolved from significant immigration and have noteworthy multicultural policies – the census includes questions on language use. In the United Kingdom, however, questions on language use have only been included in the last two censuses (1991 and 2001) and have focussed exclusively on the indigenous minority languages of the United Kingdom – Scottish Gaelic, Welsh and Irish Gaelic. This reflects a change of policy to support and finance these languages and also reflects that the countries of their origin now have devolved or decentralised governing bodies. Coleman and Salt (1996) state that there were proposals, at the design stage of the 1991 British Census, to add a question on language use to the ethnic group question but these were not followed up. This was a missed opportunity to collect data that could have been used to build a linguistic profile of the United Kingdom.
Ideally, we wanted to compare the number of bilingual children on the speech and language therapy caseload to the number of children of ethnic minorities in the three centres of population. For S1 and S2 we were able to obtain the Census 2001 data on ethnic minorities for children aged 0 to 17. However, for E1, figures for ethnic minorities categorised by age have not yet been made available. Therefore, we were unable to establish the number of children from ethnic groups in the population of E1, and can only present figures for the ethnicity of all residents. As a means of supplementing the census 2001 data, information regarding the number of bilingual children as well as the most prevalent languages spoken in the school-aged population was obtained from the LEA. Speech and language therapy is not only provided to school-age children, but also to pre-schoolers, therefore the speech and language therapy caseload data are not fully compatible with data from LEA’s which do not include
• 1580 •
pre-schoolers. The combination of figures obtained from census data and education authorities do, however, provide the nearest possible indication of the number of bilinguals in the population (see also Winter, 1999, for a similar discussion on the difficulty to obtain accurate population statistics for bilinguals).
A second problem with obtaining relevant population statistics is the fact that the census data are organised around geographical areas, but that data on speech and language therapy services are organised around NHS Trusts. Trusts are medical service organisations that are responsible for providing health care to residents of a specific area. As Trust boundaries are not co-terminus with census areas, information obtained from census data is not necessarily fully compatible with information from Trusts (cf. Winter, 1999).
2.3 Interviews and questionnaires
Initial contact was made with the managers of the NHS Trust providing paediatric services within each area. Interviews were then held with these managers to identify service coordinators in each of the areas who were responsible for service delivery to paediatric bilingual clients and thus had an overview of the number of bilingual and monolingual clients on therapists’ caseloads. The two large English and Scottish cities (S2 and S3) had service coordinators, and these were each sent a questionnaire.
As the smaller Scottish city (S1) did not have a designated paediatric service coordinator, questionnaires were sent to a sample of individual speech and language therapists working with paediatric clients. First, we obtained a list of all speech and language therapists working with paediatric clients in the S1 Trust, who were assigned to five geographical sectors within the Trust. Therapists marked as absent (due to leave or illness) were excluded from the sample. We then took a stratified random sample, i.e. for each geographical sector a third of the therapists were randomly chosen and a questionnaire was sent to them.
The questionnaire included both open and closed questions and respondents were encouraged to make comments regarding certain questions as well as to add any comments they felt were appropriate. The questionnaire addressed the following issues: Caseload and languages represented; Accessibility of service; Support services; Policy and RCSLT guidelines; and Training/education.
This paper only reports on the first phase of the research which involved only three of the above issues, i.e. caseload and languages represented, policy and RCSLT guidelines, and training/education, as follows:
• Caseload and languages represented: Therapists/coordinators were asked about the total
number of clients and the proportion of bilingual/multilingual clients on their/the Trust’s paediatric caseloads; the languages spoken by their clients; the method used for recording information about the languages spoken by clients and carers; and whether there had been an increase in referrals for any specific language users.
• Policy and RCSLT guidelines: Therapists/coordinators were asked whether their trust had a published operational policy for working with bilingual clients; and finally, they were asked whether their service was able to meet the RSCLT guidelines for working with bilingual or multilingual clients.
• Training/education: Therapists/coordinators were asked whether they had received training on bilingual issues and whether this training was at undergraduate/postgraduate level or as part of their continuing professional education.
2.4 Data analysis
Data from the questions relating to the total number of clients on the paediatric caseload and the proportion of bilingual/multilingual clients were compared to the population data from the census and educational departments. Qualitative data were extracted from the questionnaires and reported separately.
• 1581 •
3. Results
A total of nineteen completed questionnaires were returned. Overall this was a 70% return rate. The return rate for the coordinators was 100%, whereas for the individual speech and language therapists it was 62%. Results will be presented separately for each centre of population.
3.1 City S1 3.1.1 Ethnicity and population
This section presents the results for City S1 from the questionnaire sent to the sample group of
speech and language therapist (one third of all therapists with a paediatric caseload) and the population statistics from the 2001 Census. The total population of children up to and including 17 years of age in S1 at the 2001 Census was 82,529. Of this total, 91 % was categorised as White, 0.5 % as Black (including Black Caribbean and Black African), 0.7 % as Indian, 1.7 % as Pakistani, 0.3 % as Bangladeshi, 0.9 % as Chinese, 0.4 % as Other-Asian, 1.5 % as Mixed, and 0.5 % as Other Ethnic, and 2.6 % as Other White, as shown in Table I.
Table I: Total population of S1 and ethnicity of residents aged 0 to 17. Source: 2001 Census.
Ethnic Group S1 White 90.99 % Black 0.49 % Indian 0.66 % Pakistani 1.72 % Bangladeshi 0.27 % Chinese 0.93 % Other-Asian 0.37 % Mixed 1.50 % Other ethnic 0.47 % Other white 2.60 % Total 100.00 % Total Population 82,529
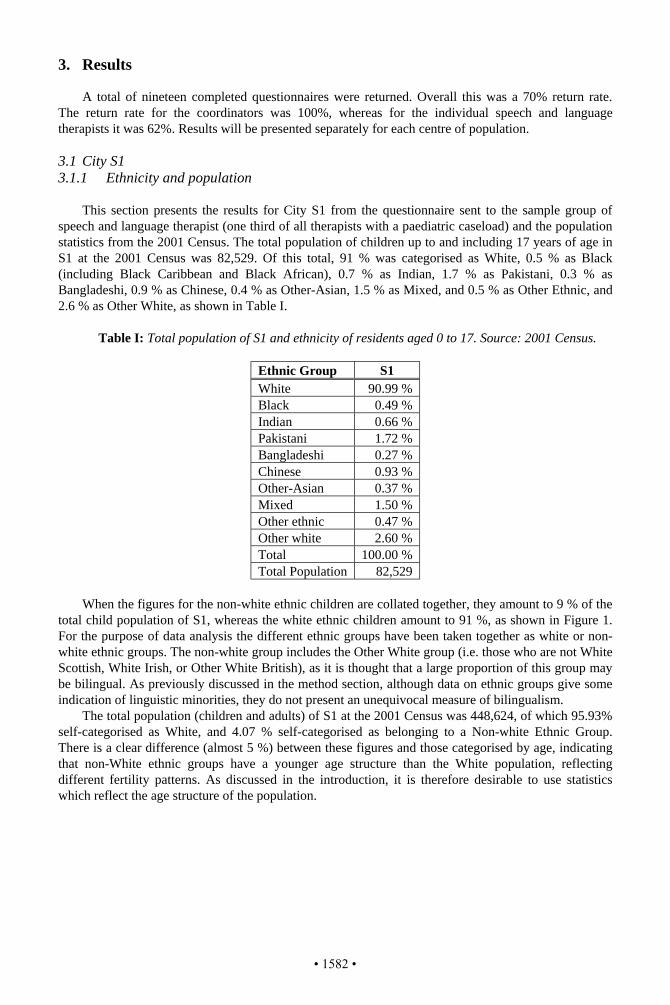
When the figures for the non-white ethnic children are collated together, they amount to 9 % of the
total child population of S1, whereas the white ethnic children amount to 91 %, as shown in Figure 1. For the purpose of data analysis the different ethnic groups have been taken together as white or non-white ethnic groups. The non-white group includes the Other White group (i.e. those who are not White Scottish, White Irish, or Other White British), as it is thought that a large proportion of this group may be bilingual. As previously discussed in the method section, although data on ethnic groups give some indication of linguistic minorities, they do not present an unequivocal measure of bilingualism.
The total population (children and adults) of S1 at the 2001 Census was 448,624, of which 95.93% self-categorised as White, and 4.07 % self-categorised as belonging to a Non-white Ethnic Group. There is a clear difference (almost 5 %) between these figures and those categorised by age, indicating that non-White ethnic groups have a younger age structure than the White population, reflecting different fertility patterns. As discussed in the introduction, it is therefore desirable to use statistics which reflect the age structure of the population.
• 1582 •
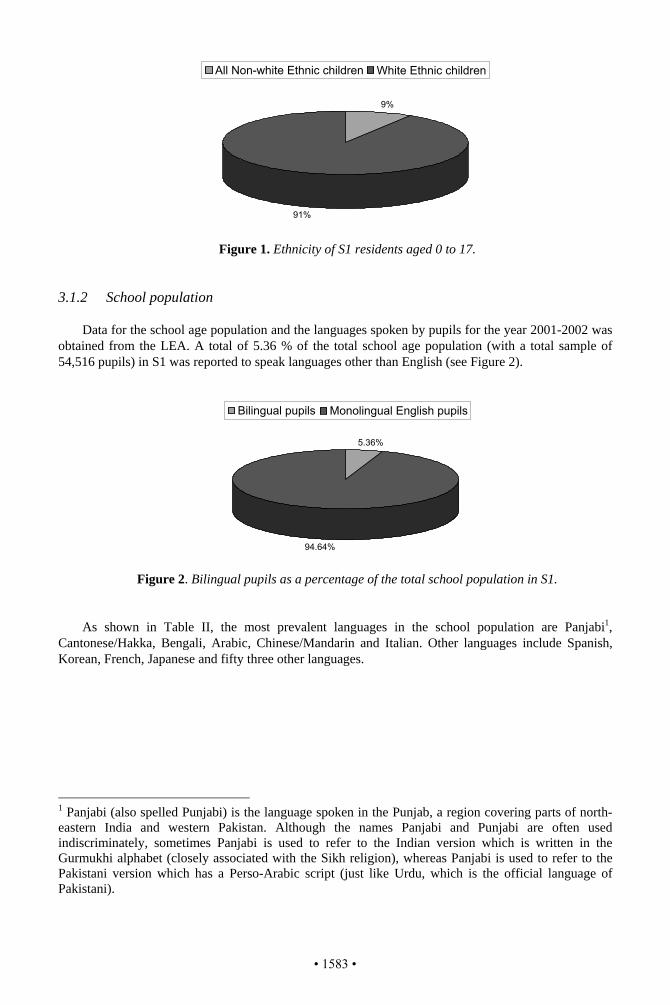
Figure 1. Ethnicity of S1 residents aged 0 to 17.
3.1.2 School population
Data for the school age population and the languages spoken by pupils for the year 2001-2002 was obtained from the LEA. A total of 5.36 % of the total school age population (with a total sample of 54,516 pupils) in S1 was reported to speak languages other than English (see Figure 2).
Figure 2. Bilingual pupils as a percentage of the total school population in S1.
As shown in Table II, the most prevalent languages in the school population are Panjabi1, Cantonese/Hakka, Bengali, Arabic, Chinese/Mandarin and Italian. Other languages include Spanish, Korean, French, Japanese and fifty three other languages.
1 Panjabi (also spelled Punjabi) is the language spoken in the Punjab, a region covering parts of north-eastern India and western Pakistan. Although the names Panjabi and Punjabi are often used indiscriminately, sometimes Panjabi is used to refer to the Indian version which is written in the Gurmukhi alphabet (closely associated with the Sikh religion), whereas Panjabi is used to refer to the Pakistani version which has a Perso-Arabic script (just like Urdu, which is the official language of Pakistani).
9%
91%
5.36%
94.64%
Bilingual pupils Monolingual English pupils
All Non-white Ethnic children White Ethnic children
• 1583 •
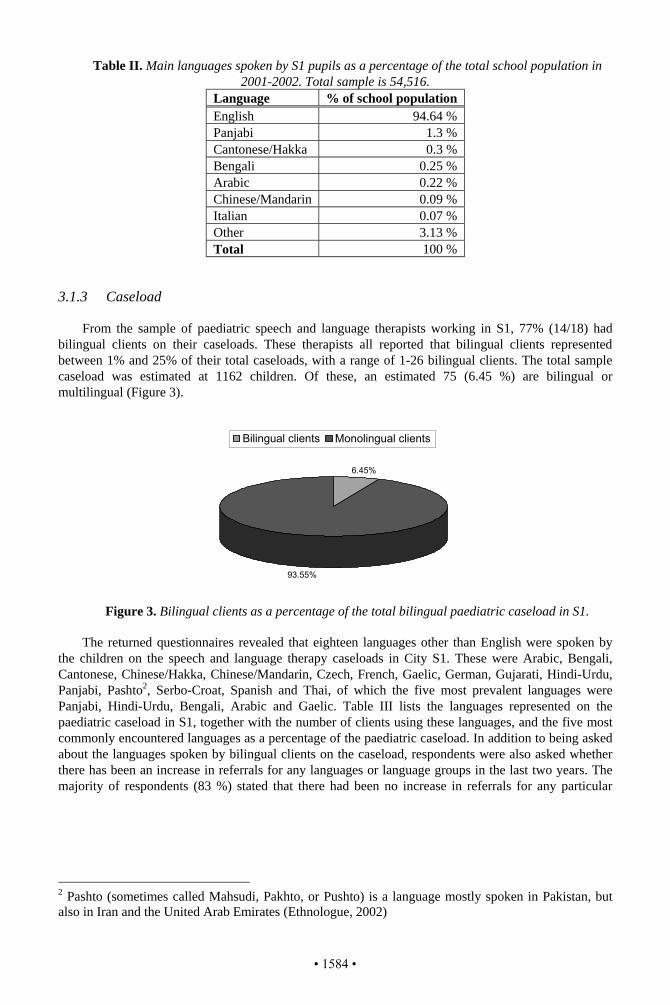
Table II. Main languages spoken by S1 pupils as a percentage of the total school population in 2001-2002. Total sample is 54,516.
Language % of school population English 94.64 % Panjabi 1.3 % Cantonese/Hakka 0.3 % Bengali 0.25 % Arabic 0.22 % Chinese/Mandarin 0.09 % Italian 0.07 % Other 3.13 % Total 100 %
3.1.3 Caseload
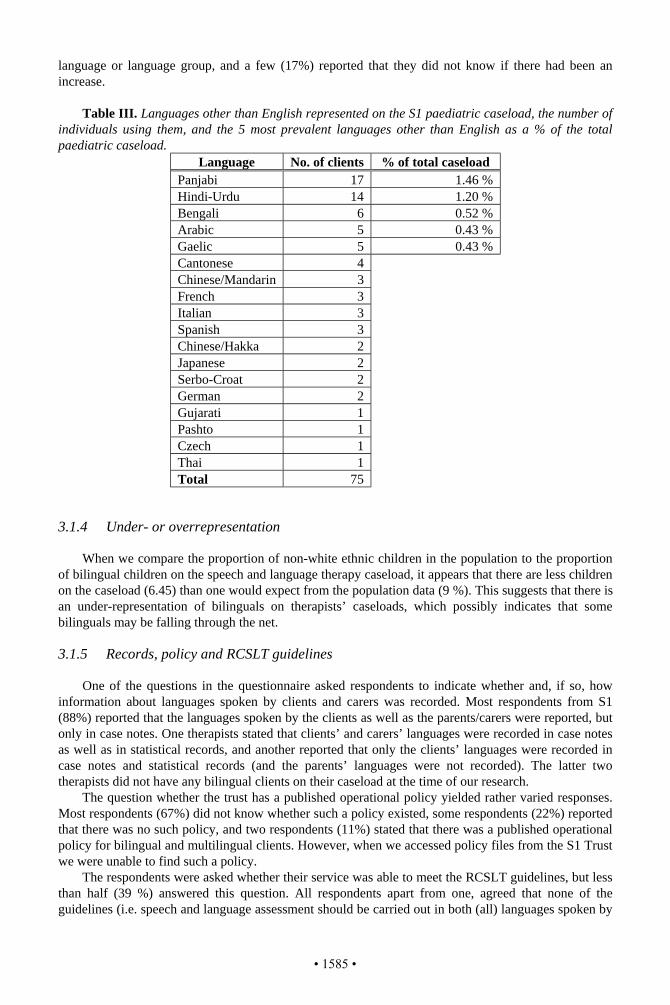
From the sample of paediatric speech and language therapists working in S1, 77% (14/18) had bilingual clients on their caseloads. These therapists all reported that bilingual clients represented between 1% and 25% of their total caseloads, with a range of 1-26 bilingual clients. The total sample caseload was estimated at 1162 children. Of these, an estimated 75 (6.45 %) are bilingual or multilingual (Figure 3).
Figure 3. Bilingual clients as a percentage of the total bilingual paediatric caseload in S1.
The returned questionnaires revealed that eighteen languages other than English were spoken by the children on the speech and language therapy caseloads in City S1. These were Arabic, Bengali, Cantonese, Chinese/Hakka, Chinese/Mandarin, Czech, French, Gaelic, German, Gujarati, Hindi-Urdu, Panjabi, Pashto2, Serbo-Croat, Spanish and Thai, of which the five most prevalent languages were Panjabi, Hindi-Urdu, Bengali, Arabic and Gaelic. Table III lists the languages represented on the paediatric caseload in S1, together with the number of clients using these languages, and the five most commonly encountered languages as a percentage of the paediatric caseload. In addition to being asked about the languages spoken by bilingual clients on the caseload, respondents were also asked whether there has been an increase in referrals for any languages or language groups in the last two years. The majority of respondents (83 %) stated that there had been no increase in referrals for any particular
2 Pashto (sometimes called Mahsudi, Pakhto, or Pushto) is a language mostly spoken in Pakistan, but also in Iran and the United Arab Emirates (Ethnologue, 2002)
6.45%
93.55%
Bilingual clients Monolingual clients
• 1584 •
language or language group, and a few (17%) reported that they did not know if there had been an increase.
Table III. Languages other than English represented on the S1 paediatric caseload, the number of individuals using them, and the 5 most prevalent languages other than English as a % of the total paediatric caseload.
Language No. of clients % of total caseload Panjabi 17 1.46 % Hindi-Urdu 14 1.20 % Bengali 6 0.52 % Arabic 5 0.43 % Gaelic 5 0.43 % Cantonese 4 Chinese/Mandarin 3 French 3 Italian 3 Spanish 3 Chinese/Hakka 2 Japanese 2 Serbo-Croat 2 German 2 Gujarati 1 Pashto 1 Czech 1 Thai 1 Total 75
3.1.4 Under- or overrepresentation
When we compare the proportion of non-white ethnic children in the population to the proportion of bilingual children on the speech and language therapy caseload, it appears that there are less children on the caseload (6.45) than one would expect from the population data (9 %). This suggests that there is an under-representation of bilinguals on therapists’ caseloads, which possibly indicates that some bilinguals may be falling through the net. 3.1.5 Records, policy and RCSLT guidelines
One of the questions in the questionnaire asked respondents to indicate whether and, if so, how information about languages spoken by clients and carers was recorded. Most respondents from S1 (88%) reported that the languages spoken by the clients as well as the parents/carers were reported, but only in case notes. One therapists stated that clients’ and carers’ languages were recorded in case notes as well as in statistical records, and another reported that only the clients’ languages were recorded in case notes and statistical records (and the parents’ languages were not recorded). The latter two therapists did not have any bilingual clients on their caseload at the time of our research.
The question whether the trust has a published operational policy yielded rather varied responses. Most respondents (67%) did not know whether such a policy existed, some respondents (22%) reported that there was no such policy, and two respondents (11%) stated that there was a published operational policy for bilingual and multilingual clients. However, when we accessed policy files from the S1 Trust we were unable to find such a policy.
The respondents were asked whether their service was able to meet the RCSLT guidelines, but less than half (39 %) answered this question. All respondents apart from one, agreed that none of the guidelines (i.e. speech and language assessment should be carried out in both (all) languages spoken by
• 1585 •
bilingual/multilingual clients, and therapy should be offered in the client’s chosen language) are currently being met. The only respondent who felt that all guidelines were being met had relatively high numbers of bilingual clients on his/her caseload. 3.1.6 Training
The majority of respondents (56 %) reported that they had not received any training on bilingual issues in their undergraduate course. From further analysis of the responses, it became clear that the undergraduate training received correlates with the number of years since qualification, with more training being provided more recently. It appeared that none of the therapists who had graduated between 21 and 35 years ago had received any training on bilingual or multilingual issues. However, training had been received by half of the therapists who had graduated between 11 and 20 years ago, and this number increased to 63 % for those therapists graduating between 1 and 10 years ago.
Therapists who join the S1 Trust are not required to attend in-house training on bilingual issues. Nevertheless, they are all expected to provide service to bilingual clients if they happen to be on their caseload. Therapists responsible for a large number of bilingual clients (60% of total bilingual paediatric caseload) had received postgraduate training on bilingual issues. However, therapists who had received no training on bilingual matters were responsible for 24% of the bilingual caseload. 3.2 City S2 (Scotland) 3.2.1 Ethnicity and population
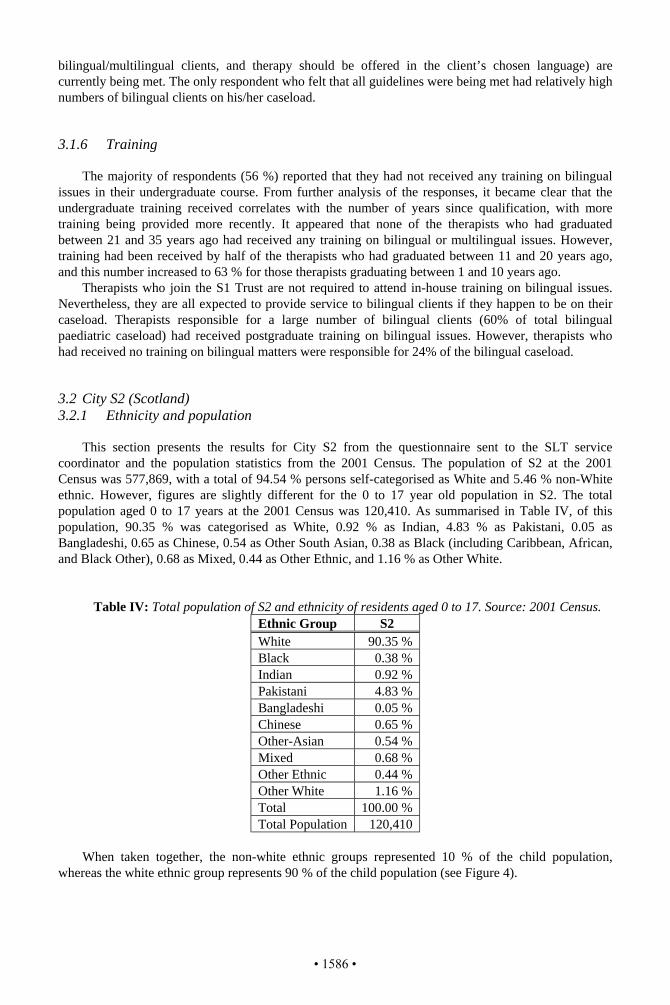
This section presents the results for City S2 from the questionnaire sent to the SLT service coordinator and the population statistics from the 2001 Census. The population of S2 at the 2001 Census was 577,869, with a total of 94.54 % persons self-categorised as White and 5.46 % non-White ethnic. However, figures are slightly different for the 0 to 17 year old population in S2. The total population aged 0 to 17 years at the 2001 Census was 120,410. As summarised in Table IV, of this population, 90.35 % was categorised as White, 0.92 % as Indian, 4.83 % as Pakistani, 0.05 as Bangladeshi, 0.65 as Chinese, 0.54 as Other South Asian, 0.38 as Black (including Caribbean, African, and Black Other), 0.68 as Mixed, 0.44 as Other Ethnic, and 1.16 % as Other White.
Table IV: Total population of S2 and ethnicity of residents aged 0 to 17. Source: 2001 Census. Ethnic Group S2 White 90.35 % Black 0.38 % Indian 0.92 % Pakistani 4.83 % Bangladeshi 0.05 % Chinese 0.65 % Other-Asian 0.54 % Mixed 0.68 % Other Ethnic 0.44 % Other White 1.16 % Total 100.00 % Total Population 120,410
When taken together, the non-white ethnic groups represented 10 % of the child population,
whereas the white ethnic group represents 90 % of the child population (see Figure 4).
• 1586 •
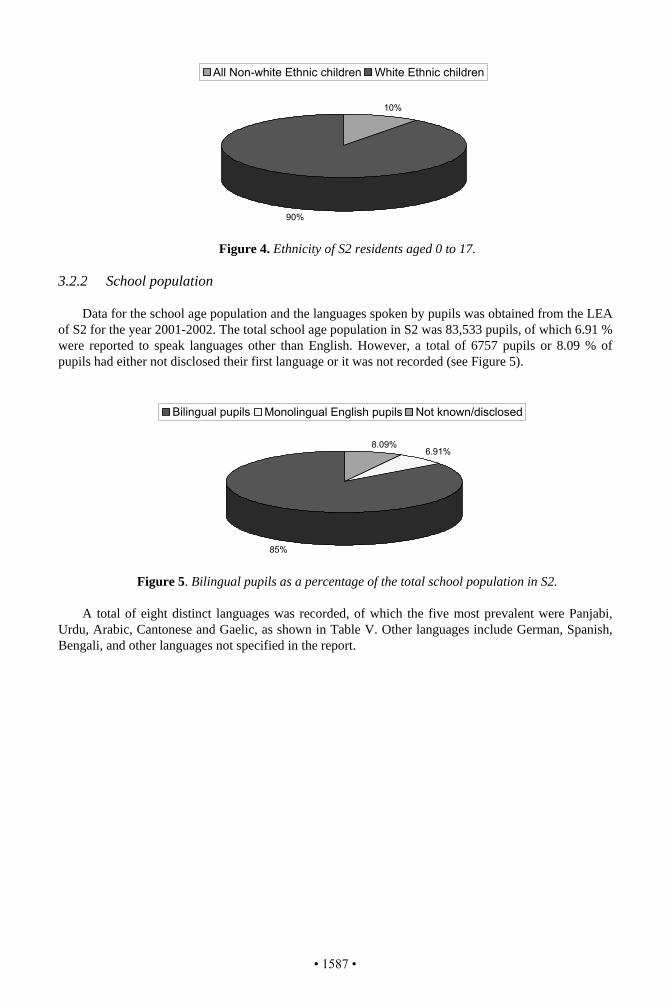
Figure 4. Ethnicity of S2 residents aged 0 to 17.
3.2.2 School population
Data for the school age population and the languages spoken by pupils was obtained from the LEA of S2 for the year 2001-2002. The total school age population in S2 was 83,533 pupils, of which 6.91 % were reported to speak languages other than English. However, a total of 6757 pupils or 8.09 % of pupils had either not disclosed their first language or it was not recorded (see Figure 5).
Figure 5. Bilingual pupils as a percentage of the total school population in S2.
A total of eight distinct languages was recorded, of which the five most prevalent were Panjabi,
Urdu, Arabic, Cantonese and Gaelic, as shown in Table V. Other languages include German, Spanish, Bengali, and other languages not specified in the report.
10%
90%
8.09%6.91%
85%
Bilingual pupils Monolingual English pupils Not known/disclosed
All Non-white Ethnic children White Ethnic children
• 1587 •
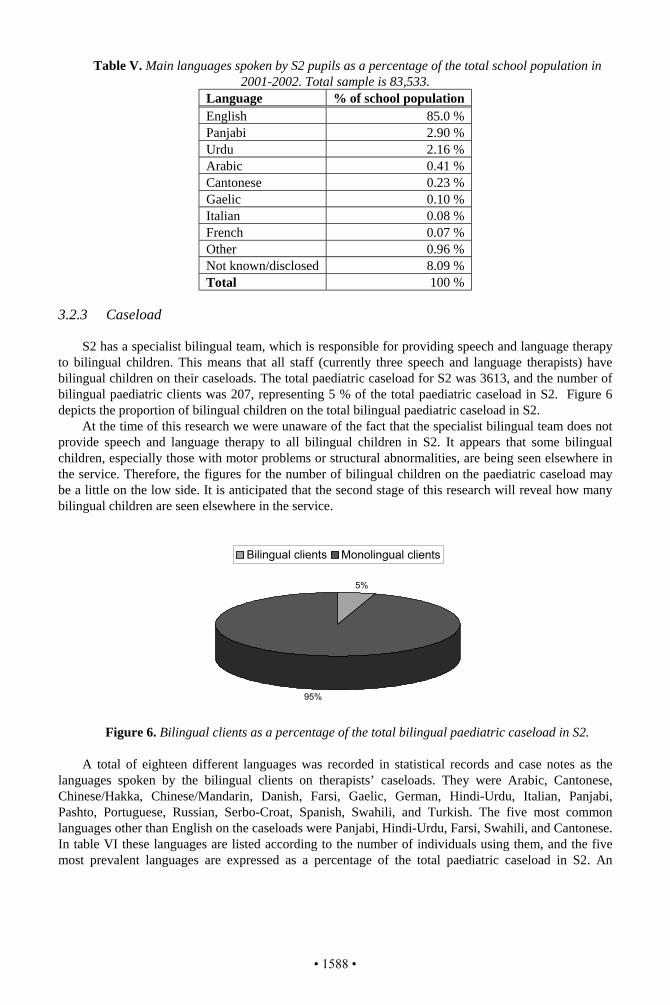
Table V. Main languages spoken by S2 pupils as a percentage of the total school population in 2001-2002. Total sample is 83,533.
Language % of school population English 85.0 % Panjabi 2.90 % Urdu 2.16 % Arabic 0.41 % Cantonese 0.23 % Gaelic 0.10 % Italian 0.08 % French 0.07 % Other 0.96 % Not known/disclosed 8.09 % Total 100 %
3.2.3 Caseload
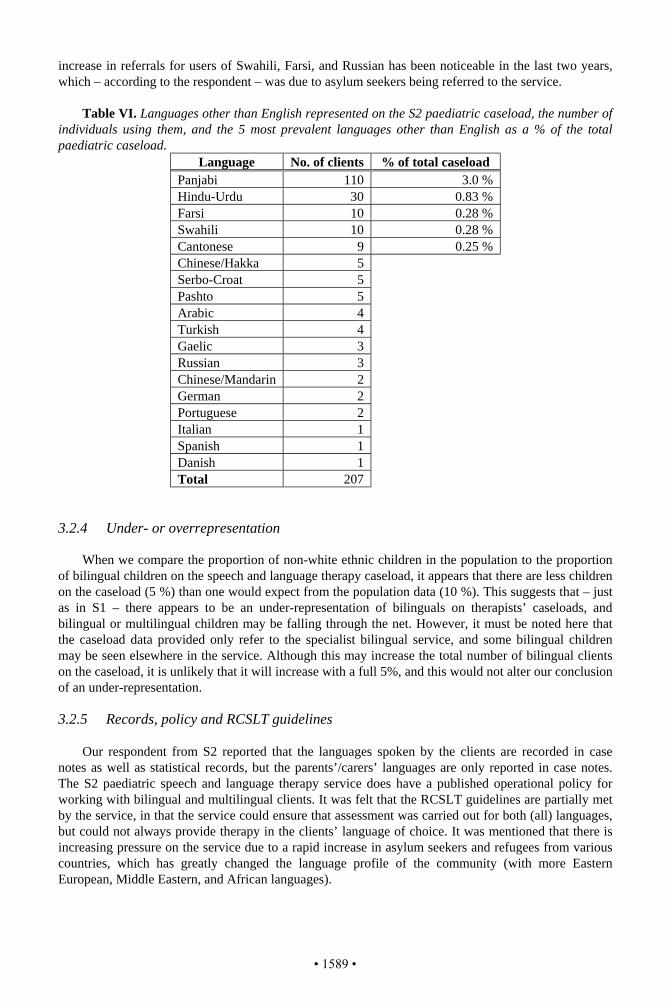
S2 has a specialist bilingual team, which is responsible for providing speech and language therapy to bilingual children. This means that all staff (currently three speech and language therapists) have bilingual children on their caseloads. The total paediatric caseload for S2 was 3613, and the number of bilingual paediatric clients was 207, representing 5 % of the total paediatric caseload in S2. Figure 6 depicts the proportion of bilingual children on the total bilingual paediatric caseload in S2.
At the time of this research we were unaware of the fact that the specialist bilingual team does not provide speech and language therapy to all bilingual children in S2. It appears that some bilingual children, especially those with motor problems or structural abnormalities, are being seen elsewhere in the service. Therefore, the figures for the number of bilingual children on the paediatric caseload may be a little on the low side. It is anticipated that the second stage of this research will reveal how many bilingual children are seen elsewhere in the service.
Figure 6. Bilingual clients as a percentage of the total bilingual paediatric caseload in S2. A total of eighteen different languages was recorded in statistical records and case notes as the
languages spoken by the bilingual clients on therapists’ caseloads. They were Arabic, Cantonese, Chinese/Hakka, Chinese/Mandarin, Danish, Farsi, Gaelic, German, Hindi-Urdu, Italian, Panjabi, Pashto, Portuguese, Russian, Serbo-Croat, Spanish, Swahili, and Turkish. The five most common languages other than English on the caseloads were Panjabi, Hindi-Urdu, Farsi, Swahili, and Cantonese. In table VI these languages are listed according to the number of individuals using them, and the five most prevalent languages are expressed as a percentage of the total paediatric caseload in S2. An
5%
95%
Bilingual clients Monolingual clients
• 1588 •
increase in referrals for users of Swahili, Farsi, and Russian has been noticeable in the last two years, which – according to the respondent – was due to asylum seekers being referred to the service.
Table VI. Languages other than English represented on the S2 paediatric caseload, the number of
individuals using them, and the 5 most prevalent languages other than English as a % of the total paediatric caseload.
Language No. of clients % of total caseload Panjabi 110 3.0 % Hindu-Urdu 30 0.83 % Farsi 10 0.28 % Swahili 10 0.28 % Cantonese 9 0.25 % Chinese/Hakka 5 Serbo-Croat 5 Pashto 5 Arabic 4 Turkish 4 Gaelic 3 Russian 3 Chinese/Mandarin 2 German 2 Portuguese 2 Italian 1 Spanish 1 Danish 1 Total 207
3.2.4 Under- or overrepresentation
When we compare the proportion of non-white ethnic children in the population to the proportion of bilingual children on the speech and language therapy caseload, it appears that there are less children on the caseload (5 %) than one would expect from the population data (10 %). This suggests that – just as in S1 – there appears to be an under-representation of bilinguals on therapists’ caseloads, and bilingual or multilingual children may be falling through the net. However, it must be noted here that the caseload data provided only refer to the specialist bilingual service, and some bilingual children may be seen elsewhere in the service. Although this may increase the total number of bilingual clients on the caseload, it is unlikely that it will increase with a full 5%, and this would not alter our conclusion of an under-representation. 3.2.5 Records, policy and RCSLT guidelines
Our respondent from S2 reported that the languages spoken by the clients are recorded in case
notes as well as statistical records, but the parents’/carers’ languages are only reported in case notes. The S2 paediatric speech and language therapy service does have a published operational policy for working with bilingual and multilingual clients. It was felt that the RCSLT guidelines are partially met by the service, in that the service could ensure that assessment was carried out for both (all) languages, but could not always provide therapy in the clients’ language of choice. It was mentioned that there is increasing pressure on the service due to a rapid increase in asylum seekers and refugees from various countries, which has greatly changed the language profile of the community (with more Eastern European, Middle Eastern, and African languages).
• 1589 •
3.2.6 Training
All therapists that join the bilingual specialist service are expected to undertake formal in-house training courses on bilingual matters and cultural and linguistic diversity. Training is also available to other therapists working in the same trust, speech and language therapists from other trusts, co-workers, speech and language therapy assistants, English as an Additional Language (EAL) staff, teachers, medical staff, other Professions Allied to Medicine (PAM) staff and Educational psychologists. However, as our sample did not include speech and language therapists who are not a member of the bilingual specialist service, we are unaware of the number of therapists who attended training on bilingual matters. 3.3 City E1 (England) 3.3.1 Ethnicity and population
This section presents the results for City E1 from the questionnaire sent to the SLT service coordinator and the population statistics from the 2001 Census. For E1, there were at the time of this research no population data available which were categorised by age. Therefore, we will present the population data for all residents (children and adults) of E1 at the 2001 Census.
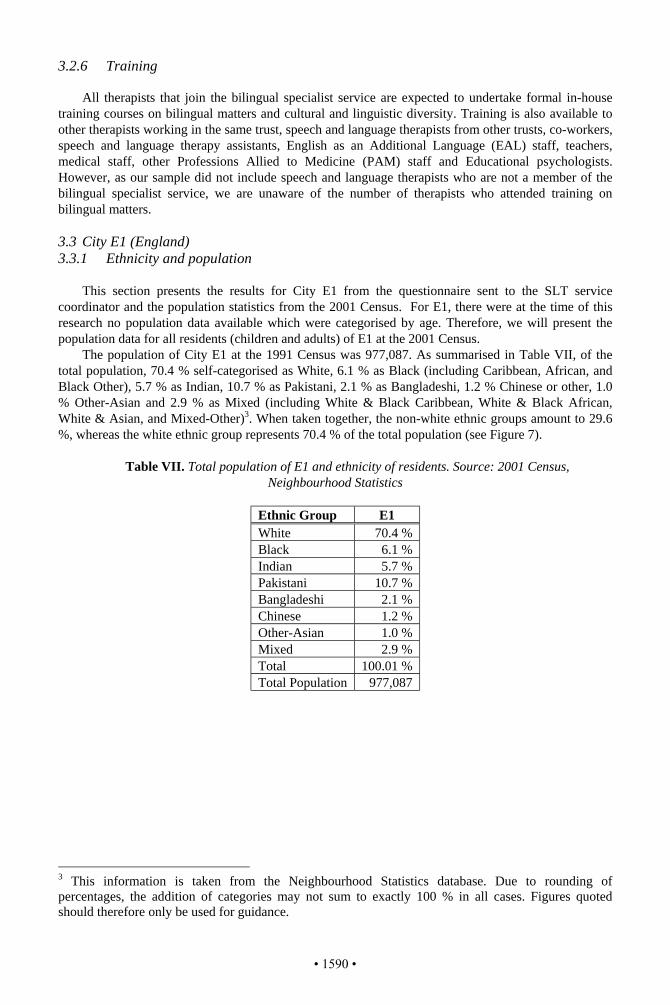
The population of City E1 at the 1991 Census was 977,087. As summarised in Table VII, of the total population, 70.4 % self-categorised as White, 6.1 % as Black (including Caribbean, African, and Black Other), 5.7 % as Indian, 10.7 % as Pakistani, 2.1 % as Bangladeshi, 1.2 % Chinese or other, 1.0 % Other-Asian and 2.9 % as Mixed (including White & Black Caribbean, White & Black African, White & Asian, and Mixed-Other)3. When taken together, the non-white ethnic groups amount to 29.6 %, whereas the white ethnic group represents 70.4 % of the total population (see Figure 7).
Table VII. Total population of E1 and ethnicity of residents. Source: 2001 Census,
Neighbourhood Statistics
Ethnic Group E1 White 70.4 % Black 6.1 % Indian 5.7 % Pakistani 10.7 % Bangladeshi 2.1 % Chinese 1.2 % Other-Asian 1.0 % Mixed 2.9 % Total 100.01 % Total Population 977,087
3 This information is taken from the Neighbourhood Statistics database. Due to rounding of percentages, the addition of categories may not sum to exactly 100 % in all cases. Figures quoted should therefore only be used for guidance.
• 1590 •
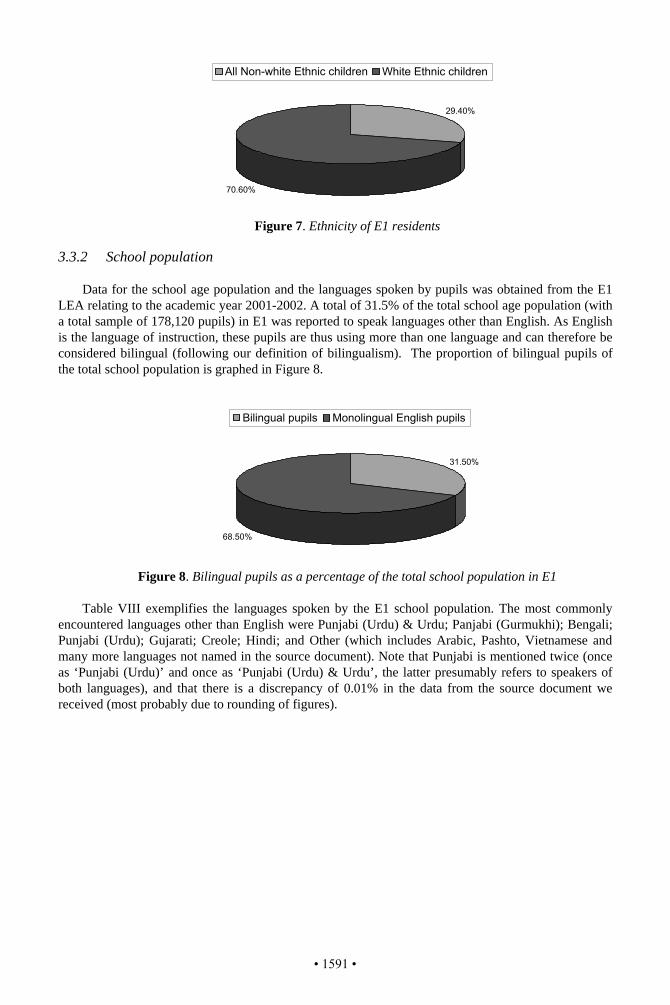
Figure 7. Ethnicity of E1 residents
3.3.2 School population
Data for the school age population and the languages spoken by pupils was obtained from the E1
LEA relating to the academic year 2001-2002. A total of 31.5% of the total school age population (with a total sample of 178,120 pupils) in E1 was reported to speak languages other than English. As English is the language of instruction, these pupils are thus using more than one language and can therefore be considered bilingual (following our definition of bilingualism). The proportion of bilingual pupils of the total school population is graphed in Figure 8.
Figure 8. Bilingual pupils as a percentage of the total school population in E1 Table VIII exemplifies the languages spoken by the E1 school population. The most commonly
encountered languages other than English were Punjabi (Urdu) & Urdu; Panjabi (Gurmukhi); Bengali; Punjabi (Urdu); Gujarati; Creole; Hindi; and Other (which includes Arabic, Pashto, Vietnamese and many more languages not named in the source document). Note that Punjabi is mentioned twice (once as ‘Punjabi (Urdu)’ and once as ‘Punjabi (Urdu) & Urdu’, the latter presumably refers to speakers of both languages), and that there is a discrepancy of 0.01% in the data from the source document we received (most probably due to rounding of figures).
29.40%
70.60%
31.50%
68.50%
Bilingual pupils Monolingual English pupils
All Non-white Ethnic children White Ethnic children
• 1591 •
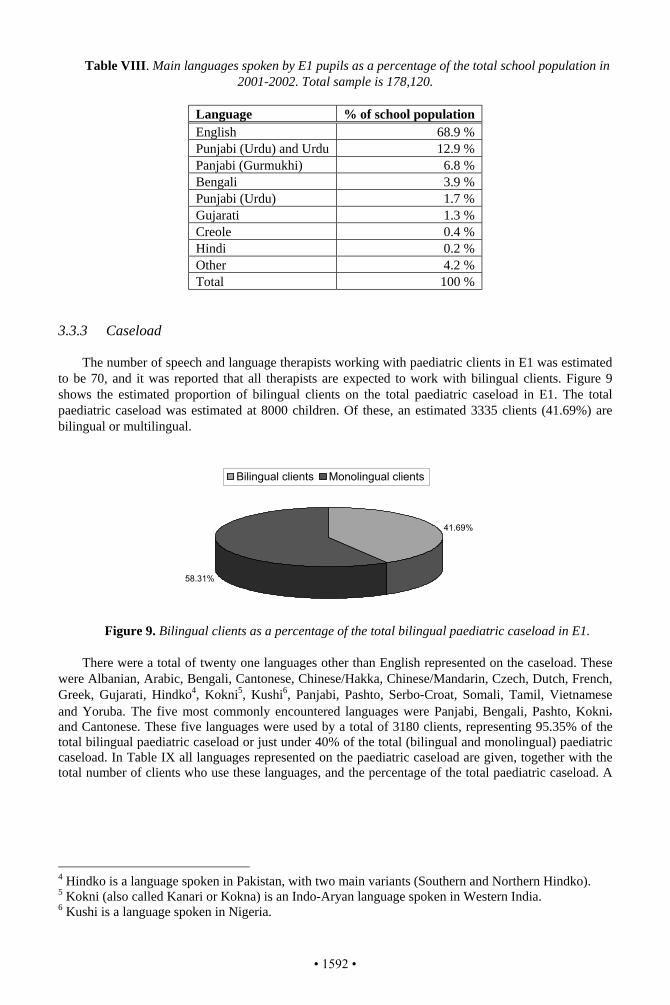
Table VIII. Main languages spoken by E1 pupils as a percentage of the total school population in 2001-2002. Total sample is 178,120.
Language % of school population English 68.9 % Punjabi (Urdu) and Urdu 12.9 % Panjabi (Gurmukhi) 6.8 % Bengali 3.9 % Punjabi (Urdu) 1.7 % Gujarati 1.3 % Creole 0.4 % Hindi 0.2 % Other 4.2 % Total 100 %
3.3.3 Caseload
The number of speech and language therapists working with paediatric clients in E1 was estimated to be 70, and it was reported that all therapists are expected to work with bilingual clients. Figure 9 shows the estimated proportion of bilingual clients on the total paediatric caseload in E1. The total paediatric caseload was estimated at 8000 children. Of these, an estimated 3335 clients (41.69%) are bilingual or multilingual.
Figure 9. Bilingual clients as a percentage of the total bilingual paediatric caseload in E1.
There were a total of twenty one languages other than English represented on the caseload. These
were Albanian, Arabic, Bengali, Cantonese, Chinese/Hakka, Chinese/Mandarin, Czech, Dutch, French, Greek, Gujarati, Hindko4, Kokni5, Kushi6, Panjabi, Pashto, Serbo-Croat, Somali, Tamil, Vietnamese and Yoruba. The five most commonly encountered languages were Panjabi, Bengali, Pashto, Kokni, and Cantonese. These five languages were used by a total of 3180 clients, representing 95.35% of the total bilingual paediatric caseload or just under 40% of the total (bilingual and monolingual) paediatric caseload. In Table IX all languages represented on the paediatric caseload are given, together with the total number of clients who use these languages, and the percentage of the total paediatric caseload. A
4 Hindko is a language spoken in Pakistan, with two main variants (Southern and Northern Hindko). 5 Kokni (also called Kanari or Kokna) is an Indo-Aryan language spoken in Western India. 6 Kushi is a language spoken in Nigeria.
41.69%
58.31%
Bilingual clients Monolingual clients
• 1592 •
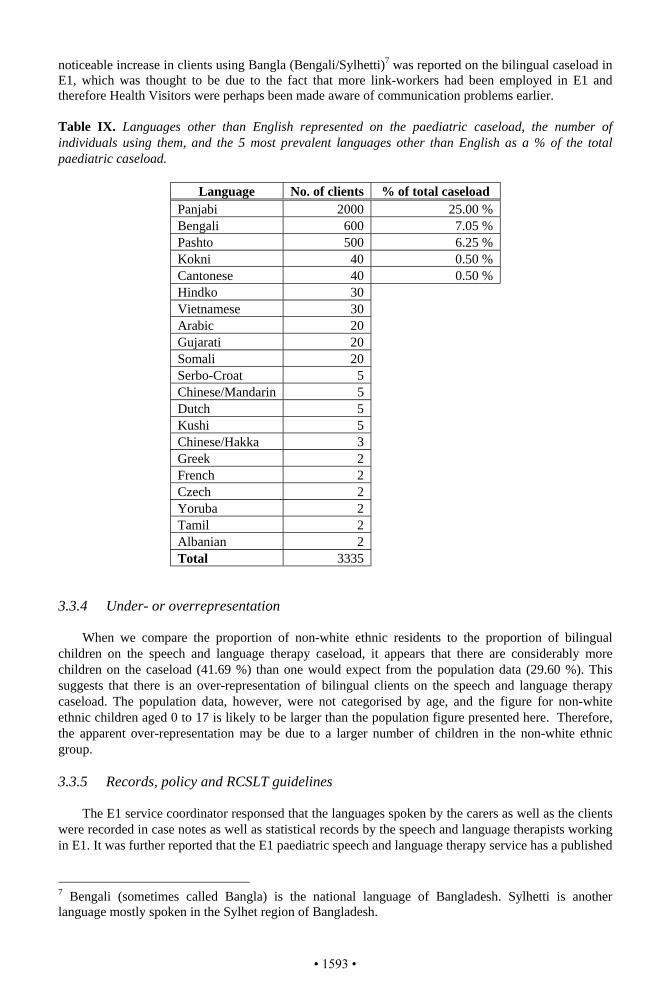
noticeable increase in clients using Bangla (Bengali/Sylhetti)7 was reported on the bilingual caseload in E1, which was thought to be due to the fact that more link-workers had been employed in E1 and therefore Health Visitors were perhaps been made aware of communication problems earlier. Table IX. Languages other than English represented on the paediatric caseload, the number of individuals using them, and the 5 most prevalent languages other than English as a % of the total paediatric caseload.
Language No. of clients % of total caseload Panjabi 2000 25.00 % Bengali 600 7.05 % Pashto 500 6.25 % Kokni 40 0.50 % Cantonese 40 0.50 % Hindko 30 Vietnamese 30 Arabic 20 Gujarati 20 Somali 20 Serbo-Croat 5 Chinese/Mandarin 5 Dutch 5 Kushi 5 Chinese/Hakka 3 Greek 2 French 2 Czech 2 Yoruba 2 Tamil 2 Albanian 2 Total 3335
3.3.4 Under- or overrepresentation
When we compare the proportion of non-white ethnic residents to the proportion of bilingual children on the speech and language therapy caseload, it appears that there are considerably more children on the caseload (41.69 %) than one would expect from the population data (29.60 %). This suggests that there is an over-representation of bilingual clients on the speech and language therapy caseload. The population data, however, were not categorised by age, and the figure for non-white ethnic children aged 0 to 17 is likely to be larger than the population figure presented here. Therefore, the apparent over-representation may be due to a larger number of children in the non-white ethnic group.
3.3.5 Records, policy and RCSLT guidelines
The E1 service coordinator responsed that the languages spoken by the carers as well as the clients were recorded in case notes as well as statistical records by the speech and language therapists working in E1. It was further reported that the E1 paediatric speech and language therapy service has a published
7 Bengali (sometimes called Bangla) is the national language of Bangladesh. Sylhetti is another language mostly spoken in the Sylhet region of Bangladesh.
• 1593 •
operational policy for working with bilingual and multilingual clients. Finally, the E1 service coordinator believed that all RCSLT guidelines were being met by the current service. 3.3.6 Training
It was reported that all speech and language therapists who join the E1 speech and language therapy service are required to attend an in-house course where they receive specific training on bilingual matters. Specific training on bilingual (multilingual) and bicultural (multicultural) matters are also provided to speech and language therapists from other trusts, co-workers and speech and language therapy assistants.
4. Discussion
This research was conducted to identify whether the current speech and language therapy services in one English and two Scottish cities are successful in providing an equal service to both monolingual and bilingual children, and whether speech and language therapists working in these urban centres feel that their current service meets the RCSLT guidelines for working with bilingual and multilingual individuals. Specifically, this study investigated whether bilingual and multilingual individuals are proportionately represented on the paediatric caseload compared to monolingual individuals in each area, or whether they are over- or underrepresented.
Results show that the two Scottish cities currently appear to have an under-representation of bilingual individuals on their caseloads, with less bilingual children on their caseloads than expected from the proportion of non-white ethnic children in the population. While the percentages of bilingual children on the speech and language therapy caseload is rather similar in these two Scottish cities, the size of the total bilingual population differs considerably, with more bilingual children in City S2 than in S1 (120,410 as opposed to 82,529). The problem of under-representation is thus affecting more bilingual children in S2 than in S1.
The results for City E1, suggest that bilingual children are over-represented, with a greater percentage of bilingual children accessing speech and language therapy services than is expected from both the Census 2001 data and the school language data. There are a number of possible reasons for this apparent over-representation. First, the census figures for the non-white ethnic group in City E1 included all age groups rather than only the 0 to 17 age group. Given that minority ethnic groups have a younger age structure than the white population, the figures used for City E1 may have been rather on the low side and this may have resulted in an apparent over-representation of bilingual children on the caseloads when in reality they are receiving an equitable service. Another possibility is that the over-representation of bilingual children is due to a lack of knowledge of referring parties, who may be referring children with a difficulty learning English rather than those with a communication problem. It is interesting to note that there is no EAL service in this city, and it is thus unclear whose role it is to deal with problems of learning English as an additional language.
There appears to be a relation between the number of individuals from non-white ethnic groups in the population and the way in which services for bilingual clients are planned. The two cities with a larger number of non-white ethnic residents (City E1 and S2) have designated service coordinators who are responsible for service delivery to paediatric bilingual clients. The paediatric speech and language therapy service in these two cities also have a published operational policy for working with bilingual clients, therapists who join the service are required to attend an in-house course on bilingual matters, and information about the languages spoken by clients is stored in statistical records and case notes (E1 even stores information about the languages spoken by carers/parents in statistical records). Conversely, the smaller Scottish city (S1) with the smallest number of individuals from non-white ethnic groups does not have a specialist service coordinator, the service does not appear to have a published policy for working with bilingual clients, no in-house course on bilingual matters is provided for therapists who join the service, and information about language use of parents/carers and clients is either not recorded or only recorded in case notes. Such organisational differences are also apparent in the LEA in the cities of investigation, with a more detailed classification (into separate dialects) in the E1 LEA data than in
• 1594 •
any of the other cities. Differences in the way information is stored is a hindrance to service planning as they make it difficult to establish the actual number of bilingual clients on the caseloads and the languages in which this service needs to be provided.
Interestingly, only the respondent from the English city (E1) believed that their service was currently able to meet all RCSLT guidelines. Respondents for the Scottish cities believed that their service was only partially able to meet RCSLT guidelines (S2), or that it was unable to meet any of the guidelines (S1). These views reflect our findings of an under-representation of bilingual clients on the speech and language therapy caseloads in both Scottish cities.
Many different languages other than English were represented on the paediatric speech and language therapy caseloads. Eighteen different languages were recorded for City S1 and S2, and twenty one for City E1. In all three cities the most common language spoken by clients on the paediatric caseload is Panjabi (which in this case refers to both the Pakistani and the Indian variant). Cantonese and Bengali are one of the five most prevalent languages in E1 and S1, but not in S2. Hindi-Urdu is one of the five most common languages in S1 and S2, but not in S2. The languages spoken by pupils also vary enormously, with languages spoken by a relative large number of pupils (such as Panjabi, Bengali, Cantonese and Arabic), and many languages spoken by small numbers of pupils. For example, in City S1 there were a total of fifty seven (!) different languages included in the category ‘Other’. It is clear that a service that meets the RCSLT guidelines needs to have appropriate support services (such as bilingual speech and language therapy assistants, co-workers, and interpreters) in place to be able to assess and offer service in all of these different languages. The second phase of our research will establish whether and which support services are in place for speech and language therapists working with bilingual clients.
Finally, there were differences in the way the data were collected in the three different cities. In E1 and S2, respondents were service coordinators, whereas respondents in S1 were speech and language therapists. It is possible that the coordinators were more informed respondents with a better overview of the service provision to bilingual clients. Therefore, it would be interesting to find out what speech and language therapists in E1 and S2 think about the current service provision. 5. Conclusion
This study provided some timely data on the proportion of bilingual children in the population and on speech and language therapy caseloads in two Scottish and one English city. It was shown that only the larger English city is currently able to meet the RCSLT guidelines and appears to be providing an equitable service to bilingual and monolingual clients. The two Scottish cities appear to have an under-representation of bilingual clients on the paediatric speech and language therapy caseloads, and are unable to fully meet the RCSLT guidelines.
The study highlighted that service planning is hindered by a lack of easily retrievable statistical information about the number of bilingual and monolingual individuals in the population, the number of clients on speech and language therapy caseloads, and the languages spoken by clients. There seems no justification in not recording a client’s means of communication, which in the case of a bilingual client includes the languages he or she uses. If we want to provide an equitable service for bilingual and monolingual individuals, there needs to be a change in how data on linguistic diversity in society is collected and disseminated so that informed decisions can influence the future of quality services to minority groups. It is a recommendation of this study that all speech and language therapy services should collect information about the languages their clients use and store this as an easily retrievable statistic. Such data collection will not only help service planning but it will also be a move towards recognising the importance of social inclusion, community cohesion and good community and race relations.
It would appear that those cities with the highest number of (and the most experience with) residents from non-white ethnic minorities are providing a more equal speech and language therapy service for bilingual and monolingual clients than those with lower numbers. This was reflected in a higher number of bilingual clients on speech and language therapy caseloads, more specialist speech and language therapists, and provision of in-house training on bilingual matters in the more successful services. It would thus appear that equality of service is linked to the perceived need of speech and
• 1595 •
language therapy managers and therapists. This highlights the need for reliable information and training on bilingual matters.
It is hoped that this study will form a first step in providing speech and language therapists and their managers with useful information to help them plan or re-evaluate services. Specifically, it is hoped that this study will encourage therapists and managers to collect and record data on the languages spoken by bilingual clients on their caseloads, and that further surveys will promote equality for bilingual individuals (children as well as adults) in future speech and language therapy services. Acknowledgements
We would like to thank Queen Margaret University College for funding this project through its Small Project Funding Scheme, and all the respondents to the questionnaires for their participation in this study. References
Aitchison, J. (1994). Words in the mind: An introduction to the mental lexicon (2nd ed.). Oxford: Basil Blackwell.
Coleman, D. & Salt, J. (1996). The ethnic group question in the 1991 Census: a new landmark in British social statistics. In D. Coleman & J. Salt (Eds.) Ethnicity in the 1991 Census Volume One: Demographic characteristics of ethnic minority populations. London: HMSO, pp. 1-32.
Ethnologue: Languages of the World (14th Edition, 2002), at www.ethnologue.com. Hall, D. (1995). Assessing the needs of bilingual pupils: Living in two languages. London. David Fulton
Publishers Limited. Mackey, W.F. (1968). The description of bilingualism. In J.A. Fishman (Ed.) Readings in the sociology of
language. The Hague: Mouton, pp. 554-584. Müller, N. (2003). Multilingual communication disorders: exempla et desiderata. Journal of Multilingual
Communication Disorders, 1, 1-12. Mumby, K. (1987). Clients need treatment in their mother tongue. Speech Therapy in Practice, December, 8-
9. Paradis, M. (1998). Aphasia in bilinguals: How atypical is it? In P. Coppens, Y. Lebrun & A. Basso (Eds.)
Aphasia in atypical populations, Mahwah: Lawrence Erlbaum, pp. 35-66. Royal College of Speech and Language Therapists (1996). Communicating Quality2: Professional Standards
for Speech and Language Therapists London: Royal College of Speech and Language Therapists. Winter, K. (1999). Speech and language therapy provision for bilingual children: aspects of the current
service. International Journal of Language and Communication Disorders 34 (1), 85-98. Young, T. & Westernoff, F. (1999). Reflections of Speech and Language Pathologists and Audiologists on
Practices in a Multicultural, Multilingual Society. Journal of Speech- Language Pathology and Audiology, 23 (1), 24-30.
• 1596 •
ISB4: Proceedings of the4th International Symposium on Bilingualism
edited by James Cohen, Kara T. McAlister,Kellie Rolstad, and Jeff MacSwan
Cascadilla Press Somerville, MA 2005
Copyright information
ISB4: Proceedings of the 4th International Symposium on Bilingualism© 2005 Cascadilla Press, Somerville, MA. All rights reserved
ISBN 978-1-57473-210-8 CD-ROMISBN 978-1-57473-107-1 library binding (5-volume set)
A copyright notice for each paper is located at the bottom of the first page of the paper.Reprints for course packs can be authorized by Cascadilla Press.
Ordering information
To order a copy of the proceedings, contact:
Cascadilla PressP.O. Box 440355Somerville, MA 02144, USA
phone: 1-617-776-2370fax: [email protected]
Web access and citation information
This paper is available from www.cascadilla.com/isb4.html and is identicalto the version published by Cascadilla Press on CD-ROM and in library binding.