Embed Size (px)
Citation preview

896 IEEE TRANSACTIONS ON SPEECH AND AUDIO PROCESSING, VOL. 13, NO. 5, SEPTEMBER 2005
Speech Enhancement EmployingLaplacian–Gaussian Mixture
Saeed Gazor, Senior Member, IEEE, and Wei Zhang
Abstract—A new, efficient speech enhancement algorithm (SEA)is developed in this paper. In this low-complexity SEA, a noisyspeech signal is first decorrelated and then the clean speech com-ponents are estimated from the decorrelated noisy speech samples.The distributions of clean speech and noise signals are assumed tobe Laplacian and Gaussian, respectively. The clean speech compo-nents are estimated either by maximum likelihood (ML) or min-imum-mean-square-error (MMSE) estimators. These estimatorsrequire some statistical parameters derived from speech and noise.These parameters are adaptively extracted by the ML approachduring the active speech or silence intervals, respectively. In addi-tion, a voice activity detector (VAD) that uses the same statisticalmodel is employed to detect whether the speech is active or not. Thesimulation results show that our SEA approach performs as wellas a recent high efficiency SEA that employs the Wiener filter. Thecomputational complexity of this algorithm is very low comparedwith existing SEAs with low computational complexity.
Index Terms—Adaptive Karhunen–Loève transform, adaptivesignal detection, adaptive signal processing, colored noise, decor-related domains, decorrelation, decorrelation transformation,discrete cosine transforms, Gaussian distribution, generalized GD,Karhunen–Loève transforms, Laplacian distribution, Laplacian-Gaussian Mixture, Laplacian random variables, linear minimummean squared error estimation, marginal distributions, minimummean squared error estimation, maximum likelihood estimation,multivariate distribution approximation, non-Gaussian distribu-tion, nonlinear speech enhancement, speech activity detection,speech enhancement, speech probability distribution, speech pro-cessing, speech quality evaluation, speech samples distribution,speech signal statistics, time-varying speech components energy.
I. INTRODUCTION
OVER the past four decades, the problem of speech en-hancement (SE) has been discussed by many researchers
[1], [2], [8], [9]. The main objective of SE is to improve theperformance of speech communication systems in a noisy envi-ronment. Depending on the specific application, the objective ofan enhancement system may be to improve the overall quality,increase intelligibility, reduce listener fatigue, or a combinationof these.
Most of SE research has focused on removing the corruptingnoise, which improves the overall quality of the speech signal.Usually it is assumed that speech is degraded by additive noisewhich is independent of clean speech. In early implementa-tions, spectral subtraction approach was widely used. This ap-
Manuscript received July 18, 2002; revised August 6, 2004. The AssociateEditor coordinating the review of this manuscript and approving it for publica-tion was Prof. Li Deng.
The authors are with the Department of Electrical and Computer Engi-neering, Walter Light Hall, Queen’s University, Kingston, ON, K7L 3N6,Canada (e-mail: [email protected]; [email protected]).
Digital Object Identifier 10.1109/TSA.2005.851943
proach estimates the power spectral density (PSD) of a cleansignal by subtracting the PSD of the noise from the PSD of thenoisy signal [2], [3]. The estimate of PSD is performed withinshort time segments, because the short-time spectral amplitudecarries important information about both speech quality andintelligibility.
Almost all of the known speech enhancement algorithms,which operate in the transform domains, assume that the coef-ficients of both the noisy speech and noise are all jointly zeromean Gaussian distributed random variables in the transformdomain. Such a assumption results in a linear estimator for theclean speech signal. However, it has been remarked that as-suming some other distributions can result in better performancethan the Gaussian model [16], [17]. A linear estimator is ob-viously suboptimal where the Gaussian distribution is not thebest candidate for the data. For instance in [8], [9], the enhance-ment of speech in the log-domain (cepstrum) is considered. Dueto a nonlinear blending of noise and clean speech, the distribu-tion of speech and noise is non-Gaussian. Employing a mixturemodel as approximation for the pdfs considerable improvementis achieved in [8], [9].
The Wiener filter has been used for SE [4]. The noisy speechis used to estimate an “optimum” filter adaptively, under theassumption that speech and noise signals are independent andhave zero mean Gaussian distributions. The Wiener filter couldbe applied in either the time domain or the frequency domainto obtain an estimate of the clean speech. The Kalman filter hasalso been used to estimate the clean speech signal [5]. It is “the-oretically” optimal in the minimum-mean-square-error sense ifthe speech and noise have a joint linear Gaussian dynamic.
Recently a signal subspace speech enhancement frameworkhas been developed (see [6], [7], [10], [18], and referencestherein). In this framework, the estimation is performed on aframe-by-frame basis under the assumption that the noise isadditive and uncorrelated with the clean speech signal. Thissignal subspace SE system decomposes the noisy signal intouncorrelated components by applying the Karhunen–LoèveTransform (KLT). So along each eigenvector, the component ofnoisy speech is the sum of the components of clean speech andnoise. An estimation of each clean speech component is made.Then the clean signal is synthesized by applying the inverseKLT (IKLT) to the estimated clean speech vectors.
The recent statistical modeling presented in [11], [12] con-cludes that the clean speech components, in decorrelateddomains (e.g., in the KLT and the Discrete Cosine Transform(DCT) domains [14]) as random variables have Laplacian dis-tributions, and noise components are accurately modeled byGaussian distributions. Therefore, the speech decorrelated com-ponents could be accurately modeled as a multivariate Laplacian
1063-6676/$20.00 © 2005 IEEE
Authorized licensed use limited to: University of Illinois. Downloaded on October 27, 2009 at 02:27 from IEEE Xplore. Restrictions apply.

GAZOR AND ZHANG: SPEECH ENHANCEMENT EMPLOYING LAPLACIAN–GAUSSIAN MIXTURE 897
random vector, while for noise a multivariate Gaussian model isaccurate. Based on these assumptions, we design a Bayesian SEsystem to estimate the clean speech signal components. Sincespeech signals are not stationary, the parameters of this systemare adaptively calibrated. The Adaptive KLT (AKLT) is the firstalternative that attempts to fully decorrelate the signals (see[6], [7], [10], and [18]). The DCT is another computationallyinexpensive alternative that transforms acoustic signals intoreasonably decorrelated components [14].
This paper is organized as follows. In Section II, we reviewthe basic principle of the decorrelation of speech signals. Sec-tion III provides the statistical modeling that will be used in thispaper. The main subject of this paper is a new estimation algo-rithm of clean speech components, proposed in Section IV. InSection V, we give the structure of a SEA system. The perfor-mance evaluation and conclusion are summarized in Section VI.Section VII is the conclusion.
II. DECORRELATION OF SPEECH SIGNALS
In this section, we consider a speech signal in the decorrelateddomain. Let be the clean speech signal. A -dimensionalvector of samples of at time is denoted by
(1)
where denotes the transpose operation. Also, let de-note the corresponding -dimensional vector of noisy speech.Assuming that the noise vector is additive, we have
(2)
In [10], a linear model for the speech signal is described thatapproximates a vector of noisy signal with a linear combinationof some basis vector. Since the correlation between speech sig-nals is commonly rather high, a speech data vector can be repre-sented with a small error by a small number of components. Inthis paper, the speech signals are transformed into uncorrelatedcomponents by using the DCT or the AKLT [7], [14]. It can beeasily seen that , where ,and are transformed components of , and
, respectively.In order to develop our SEA, we assume that the uncorrelated
components, i.e., , are independent. This assumptionis strongly justified by intuition for a set of uncorrelated Lapla-cian random variables. However, for the Gaussian case it can beeasily proven, i.e., Gaussian random variables are independentif they are uncorrelated.
A. Karhunen–Loève Transform (KLT)
Let be the covariance matrixof clean speech , and consider the eigendecomposition of
to be as follows:
(3)
where is a diagonal matrix containing the eigenvaluesof the clean speech covariance matrix . The matrices
and are called the KLT and the Inverse KLT(IKLT) of the clean signal , respectively [7]. In fact, themain property of the KLT is that the covariance matrix of the
transformed signal, , is diagonal, i.e.,. The column span of
corresponding to nonzero eigenvalues is referred to as signalsubspace. The KLT and IKLT are unitary transformations, i.e.,
.In most subspace-based speech-processing algorithms, the
noise subspace components are first assumed to be white, i.e.,, where is the variance of noise
[10]. In this case, the covariance matrix ofshould also equal to because the matrixis unitary. Practical results show that each component of
has a different variance. A better approximationfor the covariance matrix of the noise components in the KLTdomain is as follows [7]:
(4)
where is the variance of noise along the eigenvectorat time . It is reasonable to assume that the noise isuncorrelated with and independent of the speech . In thiscase, the covariance matrix of noisy speech is given by
(5)
This means that the eigenvectors of and are thesame in the presence of speech.
Accurate estimates of eigenvectors and eigenvalues ofare required in the speech processing algorithms based
on subspace approaches. As the speech signals are not sta-tionary processes, adaptive subspace tracking algorithms couldbe applied here, e.g., the algorithm suggested in Table I [7].
B. Discrete Cosine Transform (DCT)
The KLT is optimal for transform coding of Gaussian sources.It is an orthonormal transform that produces uncorrelated coeffi-cients. As the KLT is complex to compute, harmonic transformssuch as DCT and Discrete Fourier Transform (DFT) are usedas suboptimal alternatives. Another motivation for using thesetransforms instead of the AKLT is to avoid the subspace vari-ations and errors of the AKLT. Among the DCT and DFT, theDCT yields a better performance, and is computationally lessexpensive. Thus, it is preferred in practice.
The DCT also reduces the correlation of the signal and com-pacts the energy of a signal block into some of the DCT coef-ficients. The results in [14] illustrate that the efficiency of theDCT in whitening an autoregressive signal (or speech) is asgood as the KLT if the data size is large enough.
III. STATISTICAL MODELLING
The statistical modeling in [11], [12] leads to the conclusionthat the DCT and the KLT components of speech follow Lapla-cian distributions more accurately than Gaussian distributions.Our experimental results show that most noise signals can beprecisely modeled by Gaussian distributions in the transformeddomain. In this section, we review the model of noise compo-nents and clean speech components.
Authorized licensed use limited to: University of Illinois. Downloaded on October 27, 2009 at 02:27 from IEEE Xplore. Restrictions apply.

898 IEEE TRANSACTIONS ON SPEECH AND AUDIO PROCESSING, VOL. 13, NO. 5, SEPTEMBER 2005
TABLE IADAPTIVE KLT TRACKING ALGORITHM FOR SEA [7]
A. Noise Distribution
We assume that the noise components in uncorrelated do-mains, , are Gaussian, i.e.,
(6)
where is the variance of the noise component. If thesuccessive samples of , during the silence interval be-tween and , are independent and the variationsof their variances are very small, then the Maximum Likelihoodestimate of is given by
(7)
We use the following low-complexity substitute for (7):
(8)
In our simulations, is chosen to let the time constant of theabove filter be 0.5 s, assuming that the variation of the noisespectrum is negligible over a time interval of 0.5 s. Because thespeech signal includes some silence intervals, the noise samplescan be always separated from these time intervals and storedusing a VAD.
B. Speech Signal Modeling
In [11], [12], we demonstrated that the clean speech compo-nents in the decorrelated domains, , have zero-meanLaplacian distributions and are uncorrelated, i.e., the pdfs of
are given by
(9)
where is the Laplacian factor for the clean speechcomponent. Similarly, by applying the Maximum Likelihoodestimate of the Laplacian Factor yields
(10)
Similarly, we use the following low-complexity substitute for(10)
(11)
In our simulations, is chosen to let the time constant of theabove adaptive process be 10 ms, because the speech signal canbe assumed to be stationary over such a period.
The estimation of in (11) is equivalent to the expectedvalue of . Note that there is no access to the clean signal,
. If the noise power is small, we may use as anapproximation for in (11). For low SNRs, our experi-mental results show that the substraction of the estimated noisevariance from and using the following es-timator lead to further SNR enhancement:
(12)
IV. ESTIMATION OF CLEAN SPEECH COMPONENTS
In this section, the estimators of clean speech componentsare presented, based on the statistical distributions given in theprevious section.
Assuming that different components are independent, we canprocess different components in parallel. In this section for sim-plicity of notation, we drop the time index and eigenvectorindex . Here, the problem is to estimate the clean speech com-ponent when the noisy speech component is given. As-suming that the speech is detected as present, we have
(13)
where
(14)
It is reasonable to assume that the speech and noise compo-nents are independent; therefore, the joint distribution of and
is given by
(15)
Authorized licensed use limited to: University of Illinois. Downloaded on October 27, 2009 at 02:27 from IEEE Xplore. Restrictions apply.
GAZOR AND ZHANG: SPEECH ENHANCEMENT EMPLOYING LAPLACIAN–GAUSSIAN MIXTURE 899
Fig. 1. Comparison of a linear estimator with two proposed nonlinearestimators (MMSE and ML) of the clean speech signal component s from thenoisy input component v = s + u.
and the conditional distribution of given is
(16)
Subsequently, we derive two estimators for .
A. Minimum Mean Square Error (MMSE) Estimator
This MMSE estimator is the conditional mean of withas the pdf. Using (15), the MMSE estimator of the
clean speech component , is given as a nonlinear function ofthree inputs: 1) noisy speech component , 2) noise variance
, and 3) speech Laplacian factor
(17)
where , and the functionis the complementary error function.
B. Maximum Likelihood (ML) Estimator
The ML estimate of given the observation is the valuefor which the likelihood function is maximum. Max-imizing is obviously equivalent to maximizing (15).Thus, we have
if ,
if ,
if .
(18)
The MMSE and ML estimators in (17) and (18) are depictedin Fig. 1 versus the noisy input signal for a given value of
. We find that these estimators operate very similarly; if the
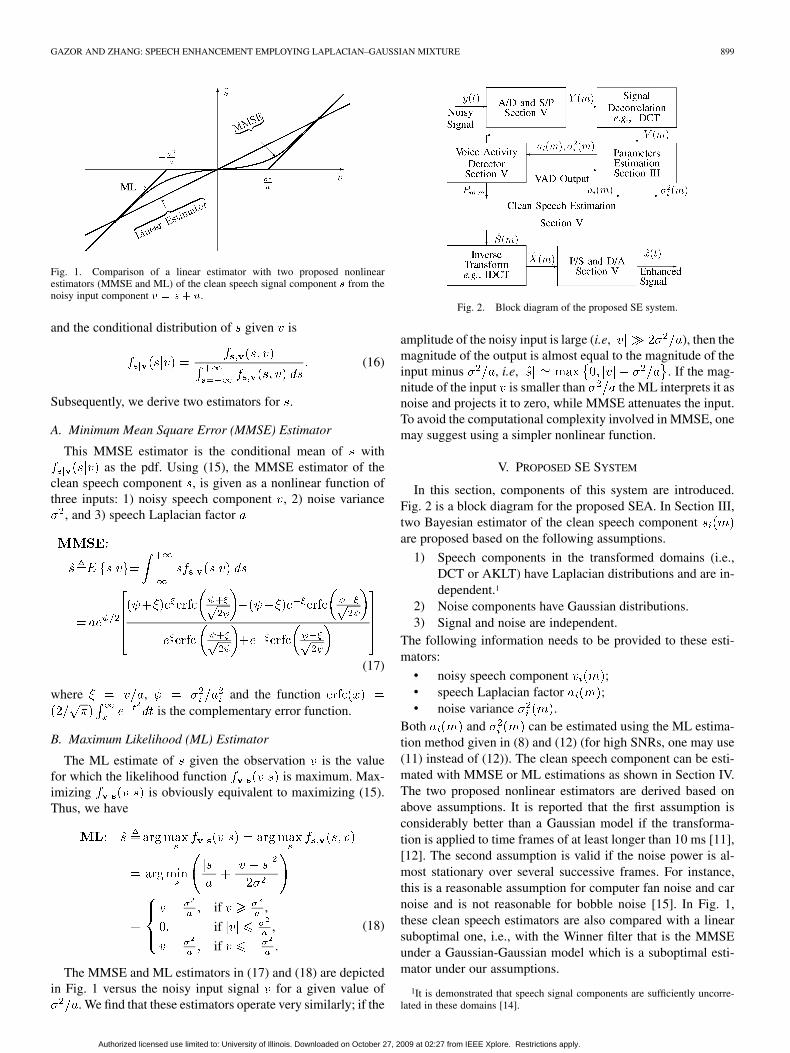
Fig. 2. Block diagram of the proposed SE system.
amplitude of the noisy input is large (i.e, ), then themagnitude of the output is almost equal to the magnitude of theinput minus , i.e, . If the mag-nitude of the input is smaller than the ML interprets it asnoise and projects it to zero, while MMSE attenuates the input.To avoid the computational complexity involved in MMSE, onemay suggest using a simpler nonlinear function.
V. PROPOSED SE SYSTEM
In this section, components of this system are introduced.Fig. 2 is a block diagram for the proposed SEA. In Section III,two Bayesian estimator of the clean speech componentare proposed based on the following assumptions.
1) Speech components in the transformed domains (i.e.,DCT or AKLT) have Laplacian distributions and are in-dependent.1
2) Noise components have Gaussian distributions.3) Signal and noise are independent.
The following information needs to be provided to these esti-mators:
• noisy speech component ;• speech Laplacian factor ;• noise variance .
Both and can be estimated using the ML estima-tion method given in (8) and (12) (for high SNRs, one may use(11) instead of (12)). The clean speech component can be esti-mated with MMSE or ML estimations as shown in Section IV.The two proposed nonlinear estimators are derived based onabove assumptions. It is reported that the first assumption isconsiderably better than a Gaussian model if the transforma-tion is applied to time frames of at least longer than 10 ms [11],[12]. The second assumption is valid if the noise power is al-most stationary over several successive frames. For instance,this is a reasonable assumption for computer fan noise and carnoise and is not reasonable for bobble noise [15]. In Fig. 1,these clean speech estimators are also compared with a linearsuboptimal one, i.e., with the Winner filter that is the MMSEunder a Gaussian-Gaussian model which is a suboptimal esti-mator under our assumptions.
1It is demonstrated that speech signal components are sufficiently uncorre-lated in these domains [14].
Authorized licensed use limited to: University of Illinois. Downloaded on October 27, 2009 at 02:27 from IEEE Xplore. Restrictions apply.
900 IEEE TRANSACTIONS ON SPEECH AND AUDIO PROCESSING, VOL. 13, NO. 5, SEPTEMBER 2005
TABLE IISTRUCTURE OF THE PROPOSED SEA
The SEA is shown in Table II. The first step is to decomposethe noisy speech vectors to uncorrelated components. Providingthe speech and noise statistic parameters, each DCT componentwill be used to estimate the clean speech component along thecorresponding eigenvector using (17) and (18). Then the the en-hanced speech signal is obtained via the inverse transform. Thesynthesis process applies the inverse transform of the decorre-lation process to the cleaned signal vector . The enhancedspeech vector is given by
(19)
where is the vector ofestimated (enhanced) speech components in the decorrelateddomain which could be obtained either from ML estimation orMMSE estimation. The overlap between successive input vec-tors controls a trade off between computational com-plexity and the performance. To create the stream of the output,we only need some samples of ; therefore, to reduce thecomputational complexity, only required samples in (19) areneeded to be calculated.
The estimations of the speech and noise parameters are per-formed on a frame-by-frame basis. The speech Laplacian factors
and the noise variance may be obtained with theML approach given in Section III. Using these parameters, SEis performed with (17) or with (18) in MMSE and ML senses,respectively.
Analog-to-Digital and Serial-to-Parallel: After analog-to-digital (A/D) conversion, the signal is passed through a se-rial-to-parallel (S/P) convertor, by using a tap delay line toobtain the noisy speech signal vector . This vector willbe then transformed by the DCT, KLT, or another decorrelationtransformation.
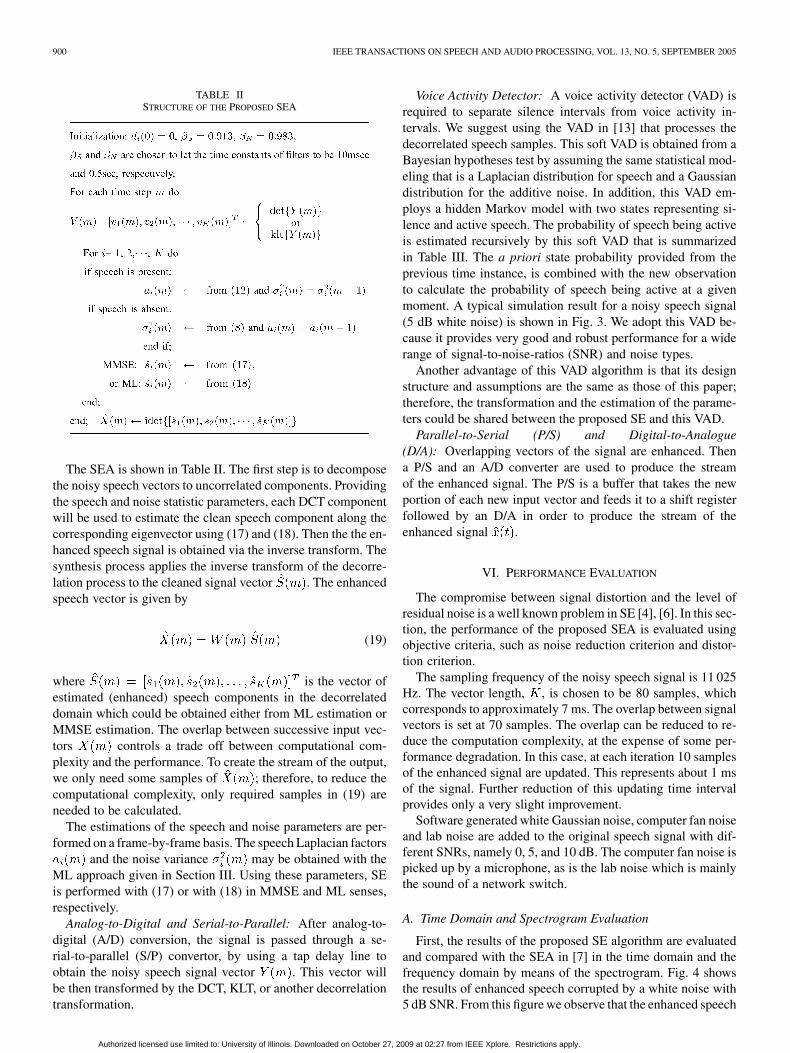
Voice Activity Detector: A voice activity detector (VAD) isrequired to separate silence intervals from voice activity in-tervals. We suggest using the VAD in [13] that processes thedecorrelated speech samples. This soft VAD is obtained from aBayesian hypotheses test by assuming the same statistical mod-eling that is a Laplacian distribution for speech and a Gaussiandistribution for the additive noise. In addition, this VAD em-ploys a hidden Markov model with two states representing si-lence and active speech. The probability of speech being activeis estimated recursively by this soft VAD that is summarizedin Table III. The a priori state probability provided from theprevious time instance, is combined with the new observationto calculate the probability of speech being active at a givenmoment. A typical simulation result for a noisy speech signal(5 dB white noise) is shown in Fig. 3. We adopt this VAD be-cause it provides very good and robust performance for a widerange of signal-to-noise-ratios (SNR) and noise types.
Another advantage of this VAD algorithm is that its designstructure and assumptions are the same as those of this paper;therefore, the transformation and the estimation of the parame-ters could be shared between the proposed SE and this VAD.
Parallel-to-Serial (P/S) and Digital-to-Analogue(D/A): Overlapping vectors of the signal are enhanced. Thena P/S and an A/D converter are used to produce the streamof the enhanced signal. The P/S is a buffer that takes the newportion of each new input vector and feeds it to a shift registerfollowed by an D/A in order to produce the stream of theenhanced signal .
VI. PERFORMANCE EVALUATION
The compromise between signal distortion and the level ofresidual noise is a well known problem in SE [4], [6]. In this sec-tion, the performance of the proposed SEA is evaluated usingobjective criteria, such as noise reduction criterion and distor-tion criterion.
The sampling frequency of the noisy speech signal is 11 025Hz. The vector length, , is chosen to be 80 samples, whichcorresponds to approximately 7 ms. The overlap between signalvectors is set at 70 samples. The overlap can be reduced to re-duce the computation complexity, at the expense of some per-formance degradation. In this case, at each iteration 10 samplesof the enhanced signal are updated. This represents about 1 msof the signal. Further reduction of this updating time intervalprovides only a very slight improvement.
Software generated white Gaussian noise, computer fan noiseand lab noise are added to the original speech signal with dif-ferent SNRs, namely 0, 5, and 10 dB. The computer fan noise ispicked up by a microphone, as is the lab noise which is mainlythe sound of a network switch.
A. Time Domain and Spectrogram Evaluation
First, the results of the proposed SE algorithm are evaluatedand compared with the SEA in [7] in the time domain and thefrequency domain by means of the spectrogram. Fig. 4 showsthe results of enhanced speech corrupted by a white noise with5 dB SNR. From this figure we observe that the enhanced speech
Authorized licensed use limited to: University of Illinois. Downloaded on October 27, 2009 at 02:27 from IEEE Xplore. Restrictions apply.
GAZOR AND ZHANG: SPEECH ENHANCEMENT EMPLOYING LAPLACIAN–GAUSSIAN MIXTURE 901
TABLE IIISUMMARY OF A SOFT VAD ALGORITHM SIMILAR TO THE PROPOSED ONE IN [13]
Fig. 3. Results of the proposed VAD in the presence of white noise with 5dB SNR. (a) Noisy speech and (b) soft detection result, P of the proposedVAD.
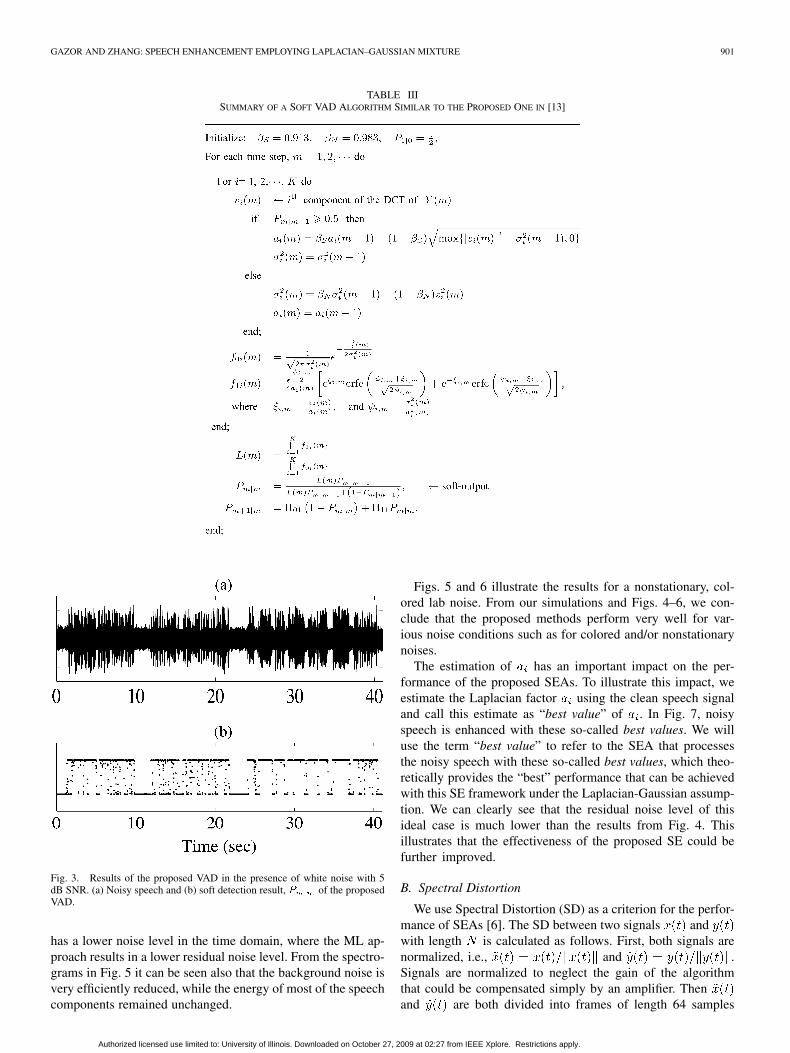
has a lower noise level in the time domain, where the ML ap-proach results in a lower residual noise level. From the spectro-grams in Fig. 5 it can be seen also that the background noise isvery efficiently reduced, while the energy of most of the speechcomponents remained unchanged.
Figs. 5 and 6 illustrate the results for a nonstationary, col-ored lab noise. From our simulations and Figs. 4–6, we con-clude that the proposed methods perform very well for var-ious noise conditions such as for colored and/or nonstationarynoises.
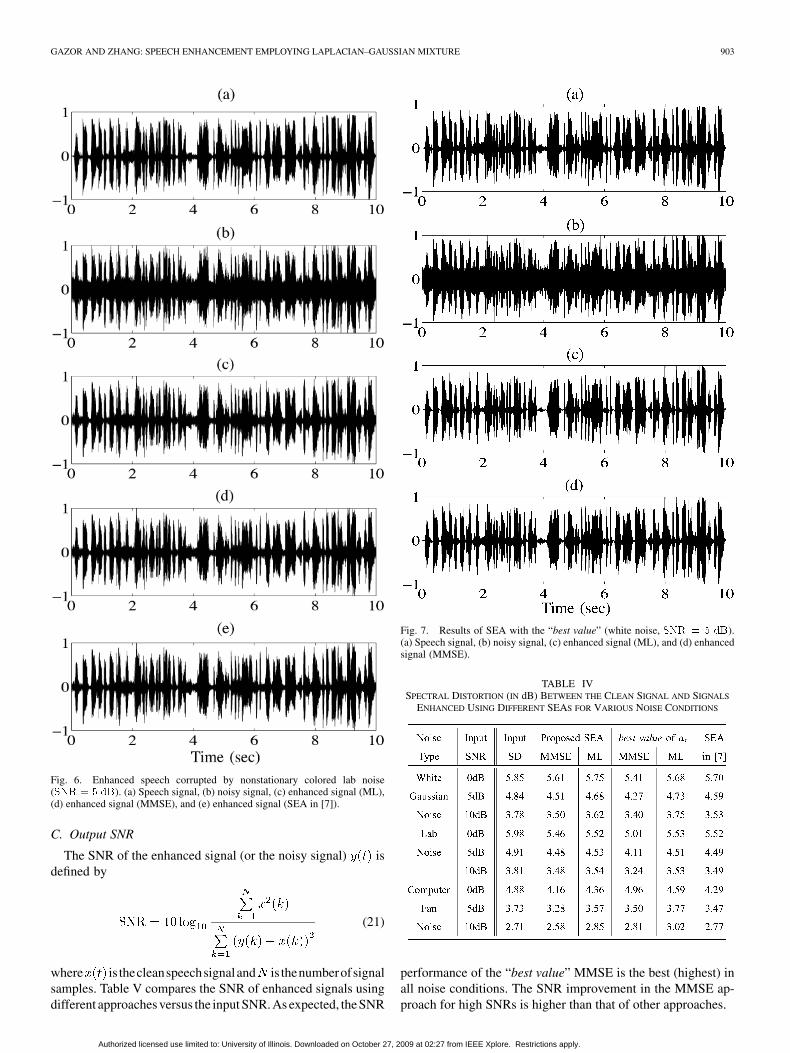
The estimation of has an important impact on the per-formance of the proposed SEAs. To illustrate this impact, weestimate the Laplacian factor using the clean speech signaland call this estimate as “best value” of . In Fig. 7, noisyspeech is enhanced with these so-called best values. We willuse the term “best value” to refer to the SEA that processesthe noisy speech with these so-called best values, which theo-retically provides the “best” performance that can be achievedwith this SE framework under the Laplacian-Gaussian assump-tion. We can clearly see that the residual noise level of thisideal case is much lower than the results from Fig. 4. Thisillustrates that the effectiveness of the proposed SE could befurther improved.
B. Spectral Distortion
We use Spectral Distortion (SD) as a criterion for the perfor-mance of SEAs [6]. The SD between two signals andwith length is calculated as follows. First, both signals arenormalized, i.e., and .Signals are normalized to neglect the gain of the algorithmthat could be compensated simply by an amplifier. Thenand are both divided into frames of length 64 samples
Authorized licensed use limited to: University of Illinois. Downloaded on October 27, 2009 at 02:27 from IEEE Xplore. Restrictions apply.
902 IEEE TRANSACTIONS ON SPEECH AND AUDIO PROCESSING, VOL. 13, NO. 5, SEPTEMBER 2005
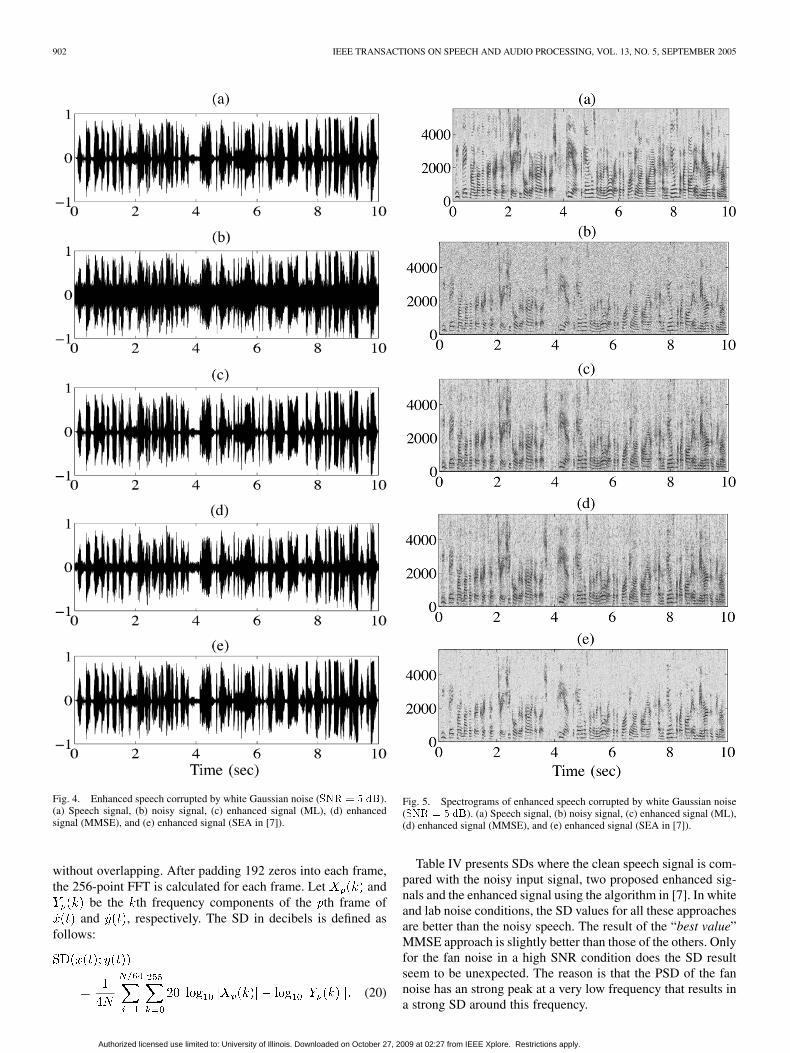
Fig. 4. Enhanced speech corrupted by white Gaussian noise (SNR = 5 dB).(a) Speech signal, (b) noisy signal, (c) enhanced signal (ML), (d) enhancedsignal (MMSE), and (e) enhanced signal (SEA in [7]).
without overlapping. After padding 192 zeros into each frame,the 256-point FFT is calculated for each frame. Let and
be the th frequency components of the th frame ofand , respectively. The SD in decibels is defined as
follows:
(20)
Fig. 5. Spectrograms of enhanced speech corrupted by white Gaussian noise(SNR = 5 dB). (a) Speech signal, (b) noisy signal, (c) enhanced signal (ML),(d) enhanced signal (MMSE), and (e) enhanced signal (SEA in [7]).
Table IV presents SDs where the clean speech signal is com-pared with the noisy input signal, two proposed enhanced sig-nals and the enhanced signal using the algorithm in [7]. In whiteand lab noise conditions, the SD values for all these approachesare better than the noisy speech. The result of the “best value”MMSE approach is slightly better than those of the others. Onlyfor the fan noise in a high SNR condition does the SD resultseem to be unexpected. The reason is that the PSD of the fannoise has an strong peak at a very low frequency that results ina strong SD around this frequency.
Authorized licensed use limited to: University of Illinois. Downloaded on October 27, 2009 at 02:27 from IEEE Xplore. Restrictions apply.
GAZOR AND ZHANG: SPEECH ENHANCEMENT EMPLOYING LAPLACIAN–GAUSSIAN MIXTURE 903
Fig. 6. Enhanced speech corrupted by nonstationary colored lab noise(SNR = 5 dB). (a) Speech signal, (b) noisy signal, (c) enhanced signal (ML),(d) enhanced signal (MMSE), and (e) enhanced signal (SEA in [7]).
C. Output SNR
The SNR of the enhanced signal (or the noisy signal) isdefined by
(21)
where is thecleanspeechsignaland is thenumberofsignalsamples. Table V compares the SNR of enhanced signals usingdifferent approaches versus the input SNR. As expected, the SNR
Fig. 7. Results of SEA with the “best value” (white noise, SNR = 5 dB).(a) Speech signal, (b) noisy signal, (c) enhanced signal (ML), and (d) enhancedsignal (MMSE).
TABLE IVSPECTRAL DISTORTION (IN dB) BETWEEN THE CLEAN SIGNAL AND SIGNALS
ENHANCED USING DIFFERENT SEAS FOR VARIOUS NOISE CONDITIONS
performance of the “best value” MMSE is the best (highest) inall noise conditions. The SNR improvement in the MMSE ap-proach for high SNRs is higher than that of other approaches.
Authorized licensed use limited to: University of Illinois. Downloaded on October 27, 2009 at 02:27 from IEEE Xplore. Restrictions apply.

904 IEEE TRANSACTIONS ON SPEECH AND AUDIO PROCESSING, VOL. 13, NO. 5, SEPTEMBER 2005
TABLE VCOMPARISON OF SNR (IN dB) OF ENHANCED SIGNALS
FOR VARIOUS NOISE CONDITIONS
VII. CONCLUSION
A comprehensive framework for SE is developed based ona Laplacian distribution for speech and a Gaussian distributionfor additive noise signals. The enhancement is performed byestimating the clean speech components from a Laplacian plusGaussian mixture in a decorrelated domain. Each component isestimated from the corresponding noisy speech component byapplying a nonlinear memoryless filter.
The speech signal is decomposed into uncorrelated com-ponents by the DCT or adaptively by the KLT. The estimatesare obtained based on the information of statistical models forspeech and noise components. This assumes that the speech isstationary within 20–40 ms and the noise is stationary over alonger period of about 0.5 s. The proposed SEAs are based onthe MMSE and the ML approaches, respectively. The speechis then synthesized by the IDCT or IKLT. Overall, proposedSEAs effectively reduce the additive noise. At the same time,the proposed SEAs produce a lower level of distortion in theenhanced speech when compared with the method in [7] thatuses a complex Adaptive KLT. The comparison of results withthe method in [7] shows that the proposed SEAs provide abetter (or similar) performance. The performance criteria ofthe proposed SEAs give similar results. The fact that the SEAswith “best value” outperformed all the others, indicates that thenew proposed framework for SE could be further improved.
The computational complexity of the proposed SEAs is verylow compared with the existing algorithms because of the use offast DCT. In fact, most of the computationally complex parts arethe DCT and IDCT (the computational complexity the DCT andIDCT is of the order of , where is the size of thevectors). All our simulations and listening evaluations confirmthat the proposed methods are very useful for SE.
REFERENCES
[1] Y. Ephraim and D. Malah, “Speech enhancement using a minimum mean-squareerrorshort-timespectralamplitudeestimator,”IEEETrans.Acoust.,Speech,Signal Processing, vol. 32, no. 6, pp. 1109–1121,Dec. 1984.
[2] J. S. Lim and A. V. Oppenheim, “Enhancement and bandwidth compres-sion of noisy speech,” Proc. IEEE, vol. 67, pp. 1586–1604, Dec. 1979.
[3] S. M. McOlash, R. J. Niederjohn, and J. A. Heinen, “A spectral subtrac-tion method for the enhancement of speech corrupted by nonwhite, non-stationary noise,” in Proc. 1995 IEEE IECON 21st Int. Conf. IndustrialElectronics, Control, and Instrumentation, vol. 2, 1995, pp. 872–877.
[4] I. Y. Soon and S. N. Koh, “Low distortion speech enhancement,” Proc.Inst. Elect. Eng., vol. 147, no. 3, pp. 247–253, Jun. 2000.
[5] Z. Goh, K.-C. Tan, and B. T. G. Tan, “Kalman-filtering speech enhance-ment method based on a voiced-unvoiced speech model,” IEEE Trans.Speech Audio Processing, vol. 7, pp. 510–524, Sep. 1999.
[6] U. Mittal and N. Phamdo, “Signal/noise KLT based approach for en-hancing speech degraded by colored noise,” IEEE Trans. Speech AudioProcessing, vol. 8, no. 2, pp. 159–167, Mar. 2000.
[7] A. Rezayee and S. Gazor, “An adaptive KLT approach for speech en-hancement,” IEEE Trans. Speech Audio Processing, vol. 9, no. 2, pp.87–95, Feb. 2001.
[8] L. Deng, J. Droppo, and A. Acero, “Estimating cepstrum of speech underthe presence of noise using a joint prior of static and dynamic features,”IEEE Trans. Speech Audio Processing, vol. 12, no. 3, pp. 218–233, May2004.
[9] , “Enhancement of log Mel power spectra of speech using a phase-sensitive model of the acoustic environment and sequential estimationof the corrupting noise,” IEEE Trans. Speech Audio Processing, vol. 12,no. 2, pp. 133–143, Mar. 2004.
[10] Y. Ephraim and H. L. Van Trees, “A signal subspace approach for speechenhancement,” IEEE Trans. Speech Audio Processing, vol. 3, no. 4, pp.251–266, Jul. 1995.
[11] S. Gazor and R. R. Far, “Probability distribution of speech signal enve-lope,” in Proc. IEEE Can. Conf. Electrical and Computer Engineering,(CCECE’04), May 2004.
[12] S. Gazor and W. Zhang, “Speech probability distribution,” IEEE SignalProcessing Lett., vol. 10, no. 7, pp. 204–207, Jul. 2003.
[13] , “A soft voice activity detector based on a Laplacian-Gaussianmodel,” IEEE Trans. Speech Audio Processing, vol. 11, no. 5, pp.498–505, Sep. 2003.
[14] I. Y. Soon, S. N. Koh, and C. K. Yeo, “Noisy speech enhancement usingdiscrete cosine transform,” Speech Commun., vol. 24, no. 3, pp. 249–257,1998.
[15] J.-H. Chang, S. Gazor, N. S. Kim, and S. K. Mitra, “Soft decision speechenhancement using a multiple statistical modeling,” J. Signal Process.,Apr. 2004, submitted for publication.
[16] J.-H. Chang and N. S. Kim, “Speech enhancement using warped discretecosine transform,” in Proc. IEEE Speech Coding Workshop, Tsukuba,Japan, Oct. 2002.
[17] C. Breithaupt and R. Martin, “MMSE estimation of magnitude-squaredDFT coefficients with superGaussian priors,” in Proc. IEEE Int. Conf.Acoustics, Speech, and Signal Processing, ICASSP ’03, vol. 1, Apr. 2003,pp. 896–899.
[18] F. Jabloun and B. Champagne, “Incorporating the human hearing prop-erties in the signal subspace approach for speech enhancement,” IEEETrans. Speech Audio Process., vol. 11, no. 6, pp. 700–708, Nov. 2003.
Saeed Gazor (S’94–M’95–SM’98) received theB.Sc. degree in electronics and the M.Sc. degreein communication systems both from IsfahanUniversity of Technology in 1987 and 1989, re-spectively. He received the Ph.D. degree in signaland image processing from Telecom Paris, Dé-partement Signal (École Nationale Supérieure desTélécommunications/ENST PARIS), France, in1994 (all with highest honors).
From 1995 to 1998, he was with the Department ofElectrical and Computer Engineering, Isfahan Uni-
versity of Technology. From January 1999 to July 1999, he was with the De-partment of Electrical and Computer Engineering, University of Toronto. He iscurrently Associate Professor with the Department of Electrical and ComputerEngineering, Queen’s University, Kingston, ON, Canada. His main research in-terests are array signal processing, statistical and adaptive signal processing,speech processing, analog adaptive circuits, communication systems and infor-mation theory.
Dr. Gazor received the Premier’s Research Excellence Award of the Provinceof Ontario in 2004. He is a Registered Professional Engineer in Ontario, Canada.
Wei Zhang received the B. Eng. degree in information engineering from theHarbin Institute of Technology, Harbin, China, and the M.S. (Eng.) degree inelectrical engineering from Queen’s University, Kingston, ON, Canada, in 1999and 2002, respectively. He is currently pursuing the Ph. D. degree in the Schoolof information technology and engineering, University of Ottawa, Ottawa, ON.His research interests include speech processing, especially for speech modelingand speech enhancement, adaptive signal processing, and general area in digitalsignal processing.
Authorized licensed use limited to: University of Illinois. Downloaded on October 27, 2009 at 02:27 from IEEE Xplore. Restrictions apply.