Embed Size (px)
Citation preview
Speech Quality Classifier Model based on DBN thatConsiders Atmospheric Phenomena
Marielle Jordane da Silva, Dick Carrillo Melgarejo, Renata Lopes Rosa, and Demostenes Zegarra Rodrıguez
Abstract—Current implementations of 5G networks considerhigher frequency range of operation than previous telecommu-nication networks, and it is possible to offer higher data ratesfor different applications. On the other hand, atmospheric phe-nomena could have a more negative impact on the transmissionquality. Thus, the study of the transmitted signal quality athigh frequencies is relevant to guaranty the user´s quality ofexperience. In this research, the recommendations ITU-R P.838-3 and ITU-R P.676-11 are implemented in a network scenario,which are methodologies to estimate the signal degradationsoriginated by rainfall and atmospheric gases, respectively. Thus,speech signals are encoded by the Adaptive Multi-Rate Wideband(AMR-WB) codec, transmitted and the perceptual speech qualityis evaluated using the algorithm described in ITU-T Rec. P.863,mostly known as POLQA. In this work, a novel non-intrusivespeech quality classifier that considers atmospheric phenomenais proposed. This classifier is based on Deep Belief Networks(DBN) that uses Support Vector Machine (SVM) with radialbasis function kernel (RBF-SVM) as classifier, to identify fivepredefined speech quality classes. Experimental results showthat the proposed speech quality classifier reached an accuracybetween 92% and 95% for each quality class overcoming theresults obtained by the sole non-intrusive standard described inITU-T Recommendation P.563. Furthermore, subjective tests arecarried out to validate the proposed classifier performance, andit reached an accuracy of 94.8%.
Index Terms—Wireless communications, speech quality, atmo-spheric phenomena, rain, atmospheric gases.
I. INTRODUCTION
Nowadays, the demand for services with high data ratesis being increasingly demanded, due to the emergence appli-cations such as video streaming, online gaming and virtualreality [1], [2]. In mobile communication systems, four gen-erations (1 to 4G) were implemented. These generations usebandwidth up to 780 MHz. However, these frequency spectraare no longer sufficient to meet the new needs of mobileservice providers. Therefore, wireless communication systemsare advancing in the use of the millimeter wave frequencyspectrum (mmWave) [3].
Manuscript received March 17, 2020; revised March 28, 2020. Date ofcurrent version March 31, 2020. The associate editor prof. Nikola Rozichas been coordinating the review of this manuscript and approved it forpublication.
M. J. da Silva, R. L. Rosa and D. Z. Rodrıguez are with the Department ofComputer Science, Federal University of Lavras, MG, Brazil, e-mail: [email protected], [email protected], [email protected].
D. Carrillo is with the LUT School of Energy Systems, Finland, e-mail:[email protected]
This work was supported by Fundacao de Amparo a Pesquisa do Estadode Sao Paulo (FAPESP) under Grant 2015/24496-0 and Grant 2018/26455-8.
Digital Object Identifier (DOI): 10.24138/jcomss.v16i1.1033
It is expected that the use of mmWave in communication sys-tems will bring a considerable advance in solving congestionproblems, limited bandwidth and restricted channel capacity ofwireless systems. In this context, the fifth-generation systems(5G) are expected to meet these demands, due to the use ofthe (mmWave) frequency spectrum. This frequency wavebandis being considered very important for the new generationof wireless systems, due to wider bandwidth, low latencies,less than 1ms, and data rates higher than 10Gbps. Thus, the5G networks promise to improve Quality of Service (QoS) intelecommunications [1], [2], [4].
Frequency spectrum availability is a fundamental require-ment to allow the testing and deployment of 5G in 2020 [5].Therefore, according to [6], a larger spectrum band, such as the(mmWave) frequency band, will be used by 5G systems, sincethis band has a large available bandwidth. Several countrieshave used similar frequency bands for testing and deploying5G systems. Despite of 5G network advantages, the use of veryhigh carrier frequencies is associated with serious propagationlosses [3], [7]–[9]. This problem occurs mainly because ofthe rain. According to [3], at high frequencies (mmWave),the rain causes random fluctuations in the refractive indexof the air. These fluctuations cause random changes in theintensity of a propagation signal, causing the phenomenoncalled fading, [10], [11]. This phenomenon is directly relatedto the frequency of operation, channel conditions, path length,as well as rainfall rate, among others [12]. Considering pre-vious generations (1 to 4G), rain does not cause significantdegradation in the transmitted signals, since the wavelength ofthe carrier frequency is different from the physical dimensionsof the raindrops.
To quantify the influence of rain on the attenuation of thetransmitted signal, the Radio Communications Sector of theInternational Telecommunication Union (ITU-R) has produceda global standard named ITU-R P.838-3. This recommendationprovides a specific attenuation model for the signal transmitteddue to the influence of rain. In addition to this recommen-dation, ITU-R has another recommendation that quantifiesthe impact that atmospheric gases in the transmitted signal,which is called ITU-R P.676-11. In both recommendations,the operating frequency range varies from 1 to 100 GHz.
Speech quality in a telecommunications system is consid-ered an important parameter for assessing the user satisfaction[13]. It depends on different factors, such as network condi-tions, speech codec, environment noise, among others. Thereare different speech codec characteristics, one of the mostused in current cellular networks is the Adaptive Multi-RateWideband (AMR-WB) codec [14]. Speech quality assessment
JOURNAL OF COMMUNICATIONS SOFTWARE AND SYSTEMS, VOL. 16, NO. 1, MARCH 2020 75
1845-6421/03/1033 © 2020 CCIS

is complex, since it is a subjective concept, as it is determinedby the listener’s perception. The Mean Opinion Score (MOS)test, defined in ITU-T Rec. P.800, is widely accepted as astandard for the subjective classification of speech quality [15].This test is carried out in a controlled laboratory. At the end ofthe tests, the scores of all subjects are collected and the averageis calculated, and named Mean Opinion Score (MOS). Thissubjective test is the most accurate, however, it is consideredtime-consuming and expensive.
Objective methods can be classified into two categories,intrusive or non-intrusive. Intrusive metrics assess speechquality by comparing reference samples (sent) and degraded(received), that is, there is a need for a reference signalto verify the actual degradation of the transmitted signal.Non-intrusive metrics, on the other hand, use the signal inservice to make predictions of speech quality, without the needfor a reference signal. The algorithms described in the ITUrecommendations, P.862 [16], P.863 [17] and P.563 [18] areexamples of objective measures. The two first are intrusivealgorithms; thus, they need both a reference and degradedspeech signals. The third one is a non-intrusive metric, andit only uses a degraded speech signal to estimate a MOSscore. For this reason, the P.862 and P.863 algorithms presentmore accurate results. In addition, it is worth noting thatthe P.863 algorithm also presents additional features relatedto modern communication systems and works from narrow-band to full-band networks. However, the P.563 algorithm ismore recommended for real-time applications, such as VoIPcommunications [19].
Another approach to estimate speech quality is the para-metric models [20]. They use network parameters to estimatespeech quality at the receptor, such as the algorithm describedin ITU-T Rec. G.107 [21], [22], mostly known as E-model.
Nowadays, several algorithms, such as, the Artificial NeuralNetworks (ANN), has been employed for speech analysisand recognition. The Deep Convolutional Neural Network(DCNN) [23], the Restricted Boltzmann Machine (RBM) [24]among others, are used in speech and image applicationsThe RBM is a generative stochastic ANN. It works using asupervised or unsupervised approach. In unsupervised tasks[25], [26] that need a classification step, a supervised learningalgorithm need to be added, classifying the samples based onthe features extracted by the RBM. Support Vector Machine(SVM) with Radial Basis Function (RBF) kernel (RBF-SVM)associated to DBN presents reliable results in several tasks,such as speech signal pattern recognition [27].
In this arena, this research presents additional contributionsregarding [28], which can be summarized as follows:
• A wireless network simulator that considers the imple-mentation of the AMR-WB speech codec using twodifferent operation modes. Thus, more realistic results areobtained. The implementation of atmospheric phenomenain the transmission channel is also considered.
• The P.863 algorithm is used to evaluate the speech signalquality, which gives more realistic results because itconsiders modern network characteristics.
• A proposed speech quality classifier model that considersatmospheric phenomena parameters and speech codeccharacteristics, which is based on Deep Belief Networks(DBN) with RBF-SVM. It is important to note that thisproposed model analyze the speech signal itself, differentthat the solution proposed in [28] that considered anetwork parametric approach.
It is worth noting that the proposed model estimates aperceptual speech quality class, and its main goal is to beuseful in wireless network transmission monitoring tasks. Ex-perimental validation results show that the proposed classifiermodel results are highly correlated to the results obtained bysubjective tests.
The article is divided into the following sections. Section IIsummarizes the recommendations ITU-R P.838-3 and R P.676-11 related to the attenuation caused by rain and atmosphericgases, respectively. Section III presents an overview of deepbelief network and speech signal features. The overviewof AMR-WB speech codec is presents in Section IV. Theimplemented simulation scenario is described in Section V.Section VI presents the proposed speech quality assessmentmodel based on DBN. The results obtained are presented inthe Section VII. Finally, the conclusion is discussed in SectionVIII.
II. IMPACT OF ATMOSPHERIC PHENOMENA ON WIRELESSTRANSMISSION
The use of millimeter wave frequencies has gained promi-nence in recent years, since it was proposed for 5G systems.The millimeter wave bands allow the use of simpler interfacesto achieve high data rates. Also, the large bandwidth availableis an advantage of mmWave. According to [29], mmWave hasthe following advantages:• Large bandwidth capacity.• Highly directive beams.• Relatively small antennas.• Low transmitter power requirement.In recent years, due to the emergence of a new mobile gen-
eration system, several types of research are focused on maintechnologies for 5G, in addition to issues related to networkarchitecture, resource allocation and spectrum management[30].
According to [31] the modeling of radio channels and thepropagation prediction for 5G mobile communication systemsis one of the most important questions to technically assesswhether this new technology will work properly. Also, thepropagation of electromagnetic waves is a fundamental factorto understand the design of the transmitter and receiver,the antenna requirements, the power transmission and, theinterference levels.
Despite the numerous benefits of using mmWave in 5Gsystems, this frequency range has a disadvantage. The useof very high carrier frequencies involves serious propagationlosses, mainly due to rain. This interference in the transmittedsignals is more common in regions of intense rain.
In this context, when radio waves propagate in a rainy area,the absorption and dispersion of electromagnetic waves result
76 JOURNAL OF COMMUNICATIONS SOFTWARE AND SYSTEMS, VOL. 16, NO. 1, MARCH 2020

in significant path-loss. The effect of scattering occurs becausethe physical dimensions of the raindrops are the same orderas the wavelength of the carrier frequency, above 28GHz. Inaddition to the frequency, the attenuation caused by the raindepends on the size distribution of the raindrop, as well as thepolarization of the waves.
[30] states that the attenuation of the transmitted signal dueto rain is considered very small at frequencies below 5 GHz.However, considering frequencies above 5 GHz, rain falls, inthe form of absorption and dispersion, become more evident,contributing to transmission losses. Although the effect of therain are small, at frequencies below 5GHz, the absorptioneffect is evident for frequencies below roughly 1 GHz andthe scattering effect is more considered for frequencies above1 GHz.
High rainfall can cause interruption of mmWave lengthlinks, which could lead to the disconnection of part of themobile network. Thus, it is necessary to apply mathematicalmodels to verify the effects of rain on wireless transmissionsby mmWave, since this atmospheric phenomenon limits theavailability and performance of the system. There are severalmodels in the literature that estimate the attenuation caused byrain. These models are based on the same equation to calculateattenuation due to precipitation, as shown in (1).
A[dB] =
∫ d
0
kRα(l)dl (1)
where k and α are empirical coefficients and depend onfrequency and polarization. R(l) corresponds to the point rainintensity in mm/h, along the path at distance l and d is thepath length of the link.
According to [32], the rainfall rate and the attenuationcaused can vary considerably, along longer paths. Thus, inpractice, the average value on the way is considered.
The most commonly used rain attenuation prediction modelis the ITU-R P.530-15. This model does not use the completedistribution of the rain rate, but only one parameter, called0.01. This parameter represents the rainfall rate, obtainedfor 0.01% of an average year (with an integration time of1 min). ITU-R P.530-15 determines that if these values arenot available from local measurement sources, it is possibleto obtain an estimate according to recommendation ITU-RP.837. After determining the rain rate, specific attenuationis calculated (γR). The relationship between the attenuationsuffered by the signal (γR), in dB/km, and the rate of rainfall(R), in mm/h, can be calculated as presented in (2). Thisattenuation calculation is described in the recommendationITU-R P.838 [33].
γR = kRα (2)
where the coefficients k and α are defined according tovariable related to frequency, rainfall, temperature, refractiveindexes, elevation angles and polarization state (horizontal orvertical) of the system, as shown in (3) and (4).
log10k =4∑j=1
(ajexp
[−(log10f − bj
cj
)2])
+mklog10f+ck
(3)
α =5∑j=1
(ajexp
[−(log10f − bj
cj
)2])
+mαlog10f + cα
(4)The values of the constants aj , bj , cj ,mk, ck, cα, and mα
are given in [33]. The operating frequency of this model variesfrom 1 to 1000 GHz.
Then, to set the attenuation value along the way, justmultiply the attenuation value γR by the effective length ofthe link path.
As mentioned, this model makes predicts rain attenuationbased on only the rainfall rate for 0.01% of an average year.However, there are methods depend upon the full rainfall ratedistribution, such as UK (2003 RAL) and the Brazil models[32]. However, the model presented in Recommendation ITU-R P.530-15 is the most used, and is therefore used in thiswork.
In addition to rain, atmospheric gases are also responsiblefor causing attenuation in the signals transmitted in wirelessnetwork systems. When dealing with this phenomenon, theITU-R produces the recommendation ITU-R P.676-1. Thisrecommendation provides methods to estimate the attenuationby atmospheric gases for electromagnetic waves, in the 1 a1000 GHz frequency range [34].
According to [35], ITU calculations are generated from anumber of equations applied to a dataset of absorption lineswater vapor. This dataset is fixed and includes 34 water vaporabsorption lines, in different frequency bands.
Thus, the attenuation due to dry air and water vapor can beevaluated for any pressure, temperature and humidity valuethrough a sum of the individual oxygen and water vaporresonance lines. This gas attenuation, according to ITU-RRecommendation P.676-11, is given by [34]:
γ = γ0 + γW (5)
γ = 0.1820f(N ′′Oxygen(f) +N ′′WaterV apour(f)) (6)
where γ0 and γW correspond the specific attenuation, indB/km, of dry air and water vapor, respectively. f correspondsto the operating frequency which may range from 2 to 1000GHz. N ′′Oxygen(f) and N ′′WaterV apour(f) consists of the imag-inary parts of the refractive dependent frequencies related toair pressure and water vapor pressure, respectively.
III. DEEP BELIEF NETWORK AND SPEECH SIGNALFEATURES
Several speech signals features are used to determine thespeech signal characteristics used for different applications[36], [37]. Zero-crossing rate (ZCR) parameter represent fastchanges on the speech signal that is composed by vowel andconsonant sequence in the temporal domain. There are a highnumber of parameters based on the frequency domain analysis,
M. J. da SILVA et al.: SPEECH QUALITY CLASSIFIER MODEL BASED ON DBN 77

such as, the Mel-Frequency Cepstrum Coefficients (MFCC)[38] that gives a speech representation using the mel-frequencyscale.
In a speech signal recognition, the hidden Markov models(HMMs) is very used for recognizing the temporal variabilityof the speech and the Gaussian mixture models (GMMs),which is used to model the density of the states in the HMMbecause the speech signal can be observed such as a piecewisestationary signal [39]. The area of speech signal recognitionin the majority involves a reference signal to be manipulated[40], however the adaptability of new characteristics is moredifficult. On the other hand, a reduced-reference methodfor speech recognition permits to measure the accuracy ofclassification.
Speech signal parameters are used for several applica-tions applying different methodologies, for instances, in [41],MFCC, amplitude and ZCR parameters are used with GMMfor speech discrimination. In [42], authors proposed a modelfor music and speech classification based on MFCC, ZCR,Linear Predictive Coding (LPC), the spectral centroid, rolloffand flux parameters.
In addition, speech recognition can be accomplished byunsupervised learning. This technique builds representations ofthe input, which are useful for data classification. There aredifferent techniques that can be used for this purpose, suchas density estimation, clustering and Principal ComponentAnalysis (PCA). In addition to these techniques, there is vectorquantization (VQ). VQ provides discrete inputs, being con-sidered an initial application for audio analysis. Unsupervisedtraining models work with initial models. Thus, small amountsof transcribed data are represented and the model is used todecode large amounts of un-transcribed data. In this way, newmodels are trained using part or all of this automatic labeleddata.
In recent years, due to the high processing power combinedwith the expansion of computer memories, it favored thedevelopment of complex learning algorithms, such as DNN[43]. This algorithm can be composed of a large number oflayers containing non-linear hidden units, as well as manyoutput layers. It should be noted that the DNN can be im-plemented using unsupervised, as well as supervised machinelearning techniques. Another existing technique is RBM. Thistechnique can learn more discriminatory characteristics fora given problem [44]. Thus, the fundamental idea of thistechnique is to feed the network with unlabeled examples andthen rebuild the input data. Thus, this technique can providean improvement computational cost and, consequently, in thetime necessary to complete the training process.
The structure of the RBM is basically composed of visibleand hidden units, and the adjacent layers are connected byweights. Thus, RBMs are similar to classic Boltzmann Ma-chines. However, in RBM connections between neurons inthe same layer are not allowed. Among the existing methodsfor training, there is a Contrastive Divergence (CD) [45].According to [46], this method commonly used in RBMs, dueto its efficiency, as well as its reliable results. The CD aims toadjust the input values into the model, in order to work withthe approach of maximum likelihood learning. Thus, in this
work, it was used as a learning rule.According to [47], RBM can be used to model fragments of
a speech signal. The structure of a DBN is composed by manyRBMs. In this structure, the first RBM is trained and, its outputis used as an input to the second RBM and, successively. Thus,a hierarchical model learns low-level resources, in order toobtain a high-level representation. The output of a DBN is usedas an input for supervised learning methods, such as SVM.In [47], RBM is used for a better representation of speechsound waves. According to these authors, the performance ofphoneme recognition using the proposed RBM model is betterthan solutions based on MFCC.
IV. OVERVIEW OF AMR-WB SPEECH CODEC
AMR-WB speech codec is described in ITU-T Rec. G.722.2[14]. It works with nine bit rates from 6.60 kbps and 23.85kbps, and a low rate background noise encoding mode. TheAMR-WB codec can change its bit-rate every 20 ms speech,and it is based on ACELP algorithm.
The number of bits of header and supplementary infor-mation of the AMR-WB frame structure are the same ofits predecessor the AMR narrow-band (NB) codec. The coreframe length–in bits–is different for each operation mode ascan be observed in Table I.
TABLE IBITS OF AMR-WB CONSIDERING EACH OPERATION MODE.
Frame Number Bit-rateType bits (kbps)
0 132 6.601 177 8.852 181 12.653 213 14.254 245 15.855 293 18.256 325 19.857 389 23.058 405 23.85
The AMR-WB speech codec works with a sample rateof 16 kHz reaching an improved speech signal quality inrelation to the AMR-NB codec. This codec is used in moderncommunication networks because its reasonable performancein adverse network conditions [48], providing high qualityphone calls. The operation modes that use high bit-rates areused for high quality such as music, and its lower bit-ratespresents a better performance considering speech quality thanother NB codecs.
V. IMPLEMENTATION OF THE NETWORK TEST SCENARIO
The influence of atmospheric phenomena was analyzed inseveral audio signals. For this, 20 voice files were extracted,with telephone conversation characteristics. The files wereextracted from Rec. ITU-T P.862, with an average durationof around 8 seconds [49]. All of these files have similarcharacteristics, the total length each audio file is composed by60% of voice segments and 40% of silence segments. Thesesignals were transmitted in a wireless channel that considersatmospheric factors related to rain and gases.
78 JOURNAL OF COMMUNICATIONS SOFTWARE AND SYSTEMS, VOL. 16, NO. 1, MARCH 2020

For the analysis of the degradation of these voice filesa simulator was implemented, developed in the Matlab ®software, version 2017b. This software has a function packagein which it is possible to simulate the rain and atmosphericgases degradation model, by the rainpl and gaspl functions,respectively.
The rainpl function was developed in accordance withRec. ITU-R P. 838-3. According to this recommendation, thevariables that can influence the degradation of the transmittedsignal are the operating frequency carrier of the system, whichhas values between 1 and 1000 GHz; the distance betweenthe transmitter and receiver (m); the rainfall rate (mm/h); theelevation angles and polarization state of the system, bothranging from -90 to 90°.
The evaluation of the degradation caused by atmosphericgases was verified by the gaspl function, which was imple-mented according to Rec. ITU-R P.676-11. According to thisrecommendation, the parameters that influence signal degrada-tion consist of operating frequency; atmospheric pressure (Pa),air temperature (°C); and relative humidity (g/cm3).
In this work, the range of 10 to 100 GHz for the operatingfrequency was stipulated because it largely covers the frequen-cies of 5G networks. Others parameters were fixed to specificvalues to restrict the number of test scenarios. The distancebetween the transmitter and receiver was fixed to 1000 m, toenable attenuation assessment at each 1 Km. The atmosphericpressure was fixed to 101, 300 Pa, because it corresponds tosea-level pressure. The values of the elevation angles andpolarization state used were equivalent to 0°. Preliminarytests were performed with the angle varying from -90 to 90°.However, in all tests, it was found that such parameters didnot represent significant changes in the MOS and BER index.Thus, the value of 0° for the variables of the elevation andpolarization angles were used in all test. The temperaturesof 12, 14, 16, 18, 20 and 25°C were selected. Accordingto [50] the relative humidity of the air equivalent to thesetemperatures are: 10.68, 12.09, 13.65, 15.4, 17.31 and 23.07g/cm3, therefore, these values are adopted. In the transmissionsystem, only the QPSK modulation scheme was implemented.
The speech signals were encoded using the AMR-WBspeech codec that is used in current telecommunication net-works, specifically the mode operations that represent themaximum (Mode 8) and minimum (Mode 0) bit-rates areimplemented to obtain different speech perceptual qualities.
Table II presents an overview of the input parameters usedin the simulator.
TABLE IICONFIGURATION PARAMETERS FOR DIFFERENT TEST SCENARIOS
Parameters Options/valuesSpeech Codec AMR-WB codec - Modes 0 and 8
Modulation scheme BPSK, QPSK, QAM (16, 64, 256)Frequency of Operation 10 a 100 GHz - steps of 10 GHz
Rainfall 0, 5, 25, 50, 75, 100 and 200 mm/hTemperature 12, 14, 16, 16, 18 and 20°C
Relative Humidity of Air 10.68, 12.09, 13.65, 15.4, 17.31 and 23.07 g/cm3
Fig. 1 presents the block diagram used for the developmentof the simulator. As previously stated, the simulator aims
to quantify the level of degradation of the transmitted audiosignals, in the GHz frequency bands. This degradation analysisis done using the MOS index given by the POLQA algorithm.
VI. PROPOSED SPEECH CLASSIFIER BASED ON DBN
The proposed speech quality classifier model that considersthe presence of atmospheric phenomena during signal trans-mission is based on an DBN with RBF-SVM. This proposedmodel uses the signal information of different speech samples.
The network and atmospheric parameters introduced inTable II are used to create different transmission scenarios.Thus, in total six parameters, each one with different valuesor operation modes, are utilized in the simulation tests. Thespeech samples at the end side are analyzed considering theirspeech signal features. In addition, the speech quality of eachsample is evaluate by the P.863 algorithm (POLQA), givenas a result a MOS score. Therefore, a data-set of speechsamples with different impairment types is obtained, and aspeech quality score is determined for each sample. Then, aDBN model can be determined using this data-set as shownin Fig. 2.
As can be observed in Fig. 2, the first step in the trainingprocess is the speech signal feature extraction. These featuresare extracted using Matlab tools and they are utilized tobuild the DBN structure. In order to permit a fast processing,those features are stored in a vector. Additionally, the featureprocessing of each sample is associated with the correspondingPOLQA score that is considered as the learning model output.Because the AMR-WB codec characteristics, a 20 ms speechsegment is considered to evaluate the speech features. Thisperiod of time is valid for every AMR-WB operation mode.
The speech signal features considered in the tests are theinputs of the DBN that gave the estimated values for every ofthe impaired speech segments. In this study, 64 features wereused, which are: ZCR, spectral flux, spectral roll-off, pitch,spectral centroid, 13 MFCC static features and the first andsecond derivatives of the static features, and 20 FFT PowerSpectrum.
As previously stated, the proposed speech quality assess-ment model does not give a MOS value, but gives a speechquality class. In this work, five quality classes or categories areproposed. It is important to note that these classes are basedon the ITU-T Recommendation P.800, specifically in the five-point MOS scale. Also, it is expected that in real applicationto know only the speech class be useful. Table III presents thequality scales used in this research.
TABLE IIISPEECH QUALITY CLASSES AND THEIR MOS VALUES RANGE
Speech Quality Perceived quality MOS indexClass (ACR Scale) values
Class-A Excellent 5.00-4.00Class-B Good 3.99-3.00Class-C Fair 2.99-2.00Class-D Poor 1.99 and 1.30Class-E Very Poor 1.29 and lower
It is important to highlight that two classifiers were testedin initial tests, specifically, the Softmax function and the
M. J. da SILVA et al.: SPEECH QUALITY CLASSIFIER MODEL BASED ON DBN 79
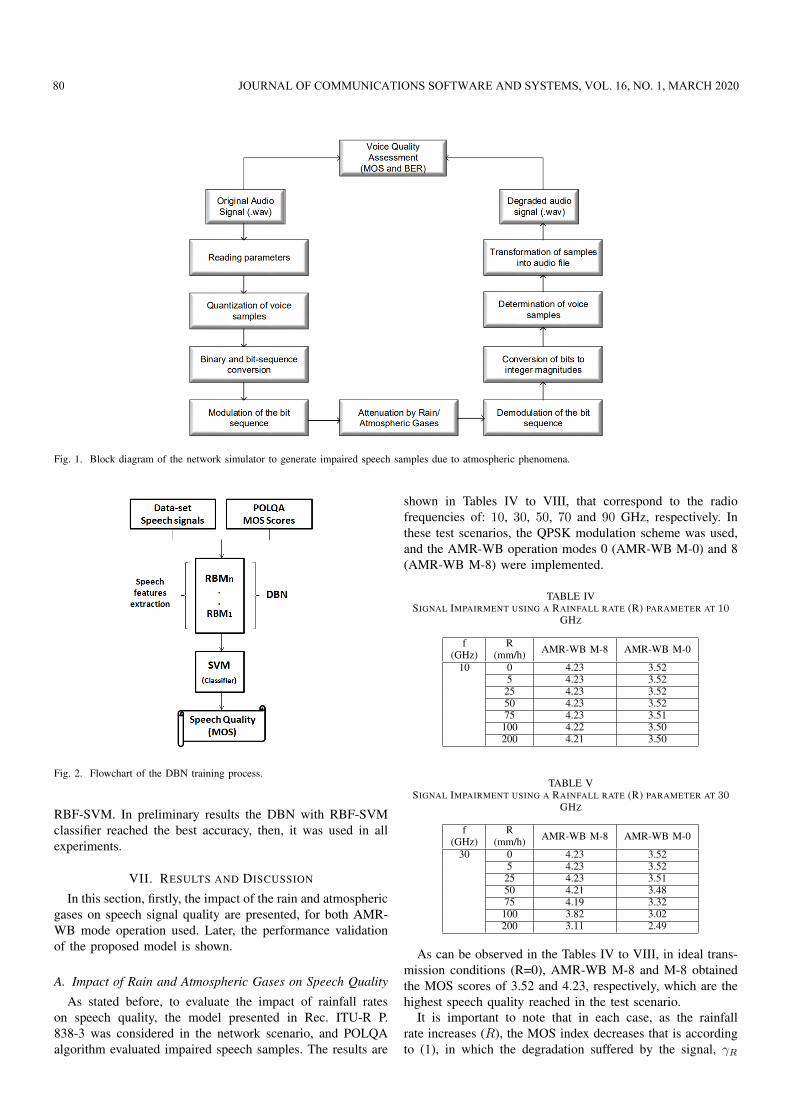
Fig. 1. Block diagram of the network simulator to generate impaired speech samples due to atmospheric phenomena.
Fig. 2. Flowchart of the DBN training process.
RBF-SVM. In preliminary results the DBN with RBF-SVMclassifier reached the best accuracy, then, it was used in allexperiments.
VII. RESULTS AND DISCUSSION
In this section, firstly, the impact of the rain and atmosphericgases on speech signal quality are presented, for both AMR-WB mode operation used. Later, the performance validationof the proposed model is shown.
A. Impact of Rain and Atmospheric Gases on Speech Quality
As stated before, to evaluate the impact of rainfall rateson speech quality, the model presented in Rec. ITU-R P.838-3 was considered in the network scenario, and POLQAalgorithm evaluated impaired speech samples. The results are
shown in Tables IV to VIII, that correspond to the radiofrequencies of: 10, 30, 50, 70 and 90 GHz, respectively. Inthese test scenarios, the QPSK modulation scheme was used,and the AMR-WB operation modes 0 (AMR-WB M-0) and 8(AMR-WB M-8) were implemented.
TABLE IVSIGNAL IMPAIRMENT USING A RAINFALL RATE (R) PARAMETER AT 10
GHZ
f(GHz)
R(mm/h) AMR-WB M-8 AMR-WB M-0
10 0 4.23 3.525 4.23 3.52
25 4.23 3.5250 4.23 3.5275 4.23 3.51100 4.22 3.50200 4.21 3.50
TABLE VSIGNAL IMPAIRMENT USING A RAINFALL RATE (R) PARAMETER AT 30
GHZ
f(GHz)
R(mm/h) AMR-WB M-8 AMR-WB M-0
30 0 4.23 3.525 4.23 3.52
25 4.23 3.5150 4.21 3.4875 4.19 3.32100 3.82 3.02200 3.11 2.49
As can be observed in the Tables IV to VIII, in ideal trans-mission conditions (R=0), AMR-WB M-8 and M-8 obtainedthe MOS scores of 3.52 and 4.23, respectively, which are thehighest speech quality reached in the test scenario.
It is important to note that in each case, as the rainfallrate increases (R), the MOS index decreases that is accordingto (1), in which the degradation suffered by the signal, γR
80 JOURNAL OF COMMUNICATIONS SOFTWARE AND SYSTEMS, VOL. 16, NO. 1, MARCH 2020

TABLE VISIGNAL IMPAIRMENT USING A RAINFALL RATE (R) PARAMETER AT 50
GHZ
f(GHz)
R(mm/h) AMR-WB M-8 AMR-WB M-0
50 0 4.23 3,525 4.23 3.5225 4.23 3.5250 4.19 3.4775 3.33 2.64
100 2.74 2.16200 1.78 1.41
TABLE VIISIGNAL IMPAIRMENT USING A RAINFALL RATE (R) PARAMETER AT 70
GHZ
f(GHz)
R(mm/h) AMR-WB M-8 AMR-WB M-0
70 0 4.23 3.525 4.22 3.5025 4.20 3.1950 3.63 2.9275 3.11 2.43
100 2.05 1.38200 1.57 1.13
TABLE VIIISIGNAL IMPAIRMENT USING A RAINFALL RATE (R) PARAMETER AT 90
GHZ
f(GHz)
R(mm/h) AMR-WB M-8 AMR-WB M-0
90 0 4.23 3.525 4.21 3.5125 4.20 3.5150 3.55 2.8575 2.94 2.34
100 2.22 1.68200 1.51 1.11
increases with the higher the rainfall rate. Additionally, MOSvalues do not present a significant variation for frequencieslower than 30 GHz. This is because, according to [3], rainfallimpact is more evident at frequencies higher than 28 GHz.Thus, in the frequency range from 30 and 100 GHz, the MOSvalue is negatively affected.
In order to evaluate the impact of atmospheric gases, the testscenario was implemented according to the ITU-R recommen-dation P.676-11. Similarly, the frequency range considered inthe test was from 10 to 100 GHz, with steps of 10 GHz.The experimental results are shown in Tables IX to XIII,corresponding to carrier frequencies of 20, 40, 60, 80 and100 GHz, respectively.
TABLE IXSIGNAL IMPAIRMENT USING ATMOSPHERIC GASES PARAMETERS AT 20
GHZ
f(GHz)
Temp.(°C)
Humidity(g/cm3) AMR-WB M-8 AMR-WB M-0
20 12 10.68 4.23 3.5214 12.09 4.23 3.5216 13.65 4.23 3.5218 15.4 4.23 3.5220 17.31 4.23 3.52
TABLE XSIGNAL IMPAIRMENT USING ATMOSPHERIC GASES PARAMETERS AT 40
GHZ
f(GHz)
Temp.(°C)
Humidity(g/cm3) AMR-WB M-8 AMR-WB M-0
40 12 10.68 4.23 3.5214 12.09 4.23 3.5216 13.65 4.23 3.5218 15.4 4.23 3.5220 17.31 4.23 3.52
TABLE XISIGNAL IMPAIRMENT USING ATMOSPHERIC GASES PARAMETERS AT 60
GHZ
f(GHz)
Temp.(°C)
Humidity(g/cm3)
AMR-WB M-8 AMR-WB M-0
60 12 10.68 4.02 3.2414 12.09 3.96 3.2116 13.65 3.94 3.1818 15.4 3.92 3.1620 17.31 3.91 3.12
TABLE XIISIGNAL IMPAIRMENT USING ATMOSPHERIC GASES PARAMETERS AT 80
GHZ
f(GHz)
Temp.(°C)
Humidity(g/cm3) AMR-WB M-8 AMR-WB M-0
80 12 10.68 4.23 3.5214 12.09 4.23 3.5216 13.65 4.23 3.5218 15.4 4.23 3.5220 17.31 4.23 3.52
TABLE XIIISIGNAL IMPAIRMENT USING ATMOSPHERIC GASES PARAMETERS AT 100
GHZ
f(GHz)
Temp.(°C)
]@c@Humidity(g/cm3)
AMR-WB M-8 AMR-WB M-0
100 12 10.68 4.23 3.5214 12.09 4.23 3.5216 13.65 4.23 3.5218 15.4 4.23 3.5220 17.31 4.23 3.52
As can be observed, the MOS values are very stable, alwaysbeing close to the highest quality of AMR-WB -8 and AMR-WB-0.Therefore, with the exception of frequencies around60GHz, the impact of atmospheric gases parameters on speechquality is almost negligible. This is because the water vaporfirst resonant line appears at frequencies above 100 GHz, aswell as the influence of pressure-induced nitrogen attenuation.
In [28], the behavior of signal attenuation (dB/Km) in thefrequency range of 10 to 100 GHz due to atmospheric gasesis presented as can be observed in Fig. 3.
It is worth noting that that there is a greater attenuation at60 GHz, and this is the only scenario in which the speechquality is negatively affected. In [51], authors stated that fre-quency range has not been used in current network generationsbecause the production of RF equipment that support thisfrequency has a high cost.
M. J. da SILVA et al.: SPEECH QUALITY CLASSIFIER MODEL BASED ON DBN 81

Fig. 3. Signal attenuation originated by atmospheric gases [28].
At this frequency band, many oxygen absorption linesmerge together at sea-level pressures to form a single, broadabsorption band. Thus, this fact causes a greater attenuationat 60 GHz, since the attenuation of dry air vapor is higher[34]. This fact is worthy of note, since the 60 GHz bandis considered promising due to its large availability of unli-censed bandwidth around the world [52]–[54]. In addition, thedevelopment of mmWave frequency standards, such as IEEE802.11ad, IEEE 802.15.3c and IEEE 802.11ay demonstratesthat 60 GHz band technology can be used in new networkgenerations, such as 5G technology.
B. Performance Assessment of the Proposed Model
The parameters presented in Table II were used in the testscenarios to obtain impaired speech samples, which are usedto determine the proposed DBN model. In the DBN trainingprocess, the topology of the network used a learning rateof 0.0015, a Dropout Fraction value of 0.1, CD steps to1, and momentum 0.8. Each network of the algorithm wastrained using 500 epochs. The DBN is based on three hiddenlayers, with RBM of 100 neurons each one. This topologyis used because reached the best results in relation to otherconfiguration that were previously tested.
As first step, the unimpaired speech samples from the data-set are randomly divided for training and validation phasesconsidering 80% and 20%, respectively. Then, they are usedin the all network simulation scenarios, and the MOS valuesobtained by POLQA are used as reference values.
Table XIV presents DBN Model performance assessment re-sults for speech quality class estimation in the validation tests,using the confusion matrix format, considering in both casesthe POLQA results as ground truth. For comparison purposes,Table XV present the results obtained by the non-intrusiveP.563 algorithm, in which each MOS value is attributed to aquality class according to Table II.
From Tables XIV and XV can be observed the superiorperformance results obtained by the proposed DBN classifiermodel. The proosed DBN model can be used as a non-intrusivequality metric that considers the atmospheric phenomena.
As the last step, subjective tests of speech quality assess-ment were performed in a controlled environment. The ITU-TP.563 algorithm was used for comparison purposes becauseis the sole standardized non-intrusive algorithm in the currentliterature. In the subjective test, 34 volunteers participated. 4speech files that correspond to scenarios presented in TablesIV to XIII were considering; thus, in total 480 speech fileswere evaluated by subjective tests. The classification accuracyis used to compare proposed DBN model and ITU-T P.563algorithm considering subective test results. These results arepresented in Table XVI.
As can be observed in Table XVI, the proposed speechquality classifier model presented a better correlation withsubjective test results than the P.563 algorithm. Thus, theproposed model can be useful in modern communicationnetworks that operate in high frequency bands, such as thoseused in 5G networks. It is important to note that P.563 isa non-intrusive algorithm which results are not reliable inlossy channel transmissions [55], but there is not anotherstandardized non-intrusive algorithm.
VIII. CONCLUSIONS
In this work, a network transmission scenario is imple-mented that considers different intensities of rainfall andatmospheric gases according to ITU-R recommendation P.530-15 and ITU-R recommendation P.676-1, respectively. Ourpreliminary experimental results show the impact of theseatmospheric phenomena on signal quality transmission can besignificant at high frequency range, such as 10 to 100 GHz. Itis important to note that current 5G network implementationsconsider this frequency band. Experimental results show thatrainfall has a considerable negative impact on the signaltransmission for frequencies higher than 30 GHz. In the case ofthe atmospheric gases model, the impact on the signal qualityis almost negligible, except for the 60 GHz frequency thatcauses a high signal attenuation. The low signal degradationshown in these frequency ranges is due to the influence ofoxygen. That is because the water vapor first resonant line isabove 100 GHz.
In the test scenario, actual speech samples are used, whichare encoded by the AMR-WB speech codec that is used incurrent cellular networks. Additionally, to evaluate the speechquality is used the POLQA algorithm that is the latest ITU-T standard regarding the intrusive speech quality algorithms,and also it incorporates modern telecommunication networkcharacteristics. The resulting impaired speech samples areassessed by the POLQA algorithm and classified in one ofthe five quality classes previously determined.
The proposed speech quality classifier is based on theRBM that extracts features from speech sample signals, andthe RBF-SVM classifier. The results obtained show the highperformance of the proposed DNC classifier, reaching 92.46%to 95.76% classification accuracy in the validation test over-coming the results obtained by the algorithm described inthe ITU-T recommendation P.563. It is important to stressthat te proposed model can be used as non-intrusive method.Additionally, subjective test were performed to evaluate 480
82 JOURNAL OF COMMUNICATIONS SOFTWARE AND SYSTEMS, VOL. 16, NO. 1, MARCH 2020

TABLE XIVCONFUSION MATRIX FOR DBN MODEL CLASSIFICATION RESULTS (IN PERCENTAGE)
Speech DBN / P.563 DBN / P.563 DBN / P.563 DBN / P.563 DBN / P.563Qual. Class Class-A Class-B Class-C Class-D Class-E
Class-A 95.76 4.24 0.0 0.0 0.0Class-B 3.85 94.58 1.57 0.0 0.0Class-C 0.0 3.59 93.27 3,14 0.0Class-D 0.0 0.0 2,26 92.46 5.28Class-E 0.0 0.0 1.08 6.11 92,81
TABLE XVCONFUSION MATRIX FOR P.563 RESULTS CONSIDERING SPEECH QUALITY CLASSES (IN PERCENTAGE)
Speech DBN / P.563 DBN / P.563 DBN / P.563 DBN / P.563 DBN / P.563Qual. Class Class-A Class-B Class-C Class-D Class-E
Class-A 46.15 23.85 28.44 1.56 0.0Class-B 1.19 59.21 31.28 7.11 1.21Class-C 0.43 4.26 82.65 10.44 2.22Class-D 0.0 0.27 4.53 89.88 5.32Class-E 0.0 0.02 2.15 6.58 91.25
TABLE XVIPERFORMANCE ASSESSMENT VALIDATION OF THE PROPOSED MODEL IN
RELATION TO SUBJECTIVE TEST RESULTS
AccuracyDBN Model vs Subjective tests 0.948ITU-T P.563 vs Subjective tests 0.693
additional impairment samples, in which the proposed DBNmodel reached 94.8% of accuracy.
REFERENCES
[1] G. W. et al., “5gnow: non-orthogonal, asynchronous waveforms forfuture mobile applications,” IEEE Communications Magazine, vol. 52,no. 2, pp. 97–105, February 2014.
[2] D. Soldani and A. Manzalini, “Horizon 2020 and beyond: On the 5goperating system for a true digital society,” IEEE Vehicular TechnologyMagazine, vol. 10, no. 1, pp. 32–42, March 2015.
[3] H. Y. Lam, L. Luini, J. Din, M. J. Alhilali, S. L. Jong, and F. Cuervo,“Impact of rain attenuation on 5g millimeter wave communicationsystems in equatorial malaysia investigated through disdrometer data,”in 11th European Conference on Antennas and Propagation (EUCAP),March 2017, pp. 1793–1797.
[4] D. Z. Rodrıguez and S. Moller, “Speech quality parametric model thatconsiders wireless network characteristics,” in 2019 Eleventh Interna-tional Conference on Quality of Multimedia Experience (QoMEX), June2019, pp. 1–6.
[5] 5G Spectrum Bands, https://gsacom.com/5g-spectrum-bands/, 2017.[6] A. Tamayo–Dominguez, X. Sun, and J. Fernandez–Gonzalez, “New
manufacturing technologies for 5g millimeter wave antennas,” in 201811th Global Symposium on Millimeter Waves (GSMM), May 2018, pp.1–4.
[7] O. Adetan and T. Afullo, “The influence of disdrometer channels onspecific attenuation due to rain over microwave links in southern africa,”SAIEE Africa Research Journal, vol. 105, no. 1, pp. 31–40, March 2014.
[8] C. Capsoni, L. Luini, A. Paraboni, C. Riva, and A. Martellucci, “Anew prediction model of rain attenuation that separately accounts forstratiform and convective rain,” IEEE Transactions on Antennas andPropagation, vol. 57, no. 1, pp. 196–204, Jan 2009.
[9] E. Matricciani, “Physical-mathematical model of the dynamics of rainattenuation based on rain rate time series and a two-layer verticalstructure of precipitation,” Radio Science, vol. 31, no. 02, pp. 281–295,March 1996.
[10] H. Y. Lam, L. Luini, J. Din, C. Capsoni, and A. D. Panagopoulos,“Investigation of rain attenuation in equatorial Kuala Lumpur,” IEEEAntennas and Wireless Propag. Letters, vol. 11, pp. 102–105, 2012.
[11] E. T. Affonso, D. Z. Rodrıguez, R. L. Rosa, T. Andrade, and G. Bressan,“Voice quality assessment in mobile devices considering different fadingmodels,” in Proc. IEEE Int. Symposium on Consumer Electronics, SaoPaulo, Brazil, Sep. 2016, pp. 21–22.
[12] A. I. Sulyman, A. T. Nassar, M. K. Samimi, G. R. Maccartney, T. S.Rappaport, and A. Alsanie, “Radio propagation path loss models for5g cellular networks in the 28 ghz and 38 ghz millimeter-wave bands,”IEEE Communications Magazine, vol. 52, no. 9, pp. 78–86, Sep. 2014.
[13] C. A. B. Mello and R. Q. Albuquerque, “Reference-free speech qualityassessment for mobile phones based on audio perception,” in 2015 IEEEInternational Conference on Systems, Man, and Cybernetics, Oct 2015,pp. 2413–2417.
[14] ITU-T Rec. G.722.2, “Wideband coding of speech at around 16 kbit/susing Adaptive Multi-Rate Wideband (AMR-WB) ,” Jul 2013. [Online].Available: https://www.itu.int/rec/T-REC-G.722.2-200307-I/en
[15] ITU-T Rec. P.800, “Methods for subjective determination oftransmission quality,” Jun. 1996. [Online]. Available: www.itu.int/rec/T-REC-P.800/en
[16] ITU-T Rec. P.862, “An objective method for end-to-end speech qualityassessment of narrowband telephone networks and speech codecs,” Set.2001. [Online]. Available: www.itu.int/rec/R-REC-P.862/en
[17] ITU-T Rec. P.863, “Perceptual objective listening quality prediction,”Mar. 2018. [Online]. Available: http://www.itu.int/rec/T-REC-P.863-201803-I/en
[18] ITU-T Rec. P.563, “Single-ended method for objective speechquality assessment in narrow-band telephony applications,” May. 2004.[Online]. Available: www.itu.int/rec/T-REC-P.563/en
[19] R. Dantas Nunes, C. H. Pereira, R. L. Rosa, and D. Z. Rodrıguez, “Real-time evaluation of speech quality in mobile communication services,”in IEEE International Conference on Consumer Electronics (ICCE), Jan2016, pp. 389–390.
[20] D. Z. Rodrıguez, G. F. Pıvaro, R. L. Rosa, G. Mittag, and S. Moller,“Improving a parametric model for speech quality assessment in wirelesscommunication systems,” in 26th Intern. Conf. on Software, Telecom-munications and Computer Networks (SoftCOM), Sep. 2018, pp. 1–5.
[21] ITU-T Rec. G.107, “The e-model: a computational model foruse in transmission planning,” Jun. 2014. [Online]. Available:www.itu.int/rec/T-REC-G.107.
[22] D. Z. Rodrıguez, R. L. Rosa, F. L. Almeida, G. Mittag, and S. Moller,“Speech quality assessment in wireless communications with mimosystems using a parametric model,” IEEE Access, vol. 7, pp. 35 719–35 730, 2019.
[23] Y. Qian, M. Bi, T. Tan, and K. Yu, “Very deep convolutional neuralnetworks for noise robust speech recognition,” IEEE/ACM Trans. onAudio, Speech, and Language Processing, vol. 24, no. 12, pp. 2263–2276, Dec. 2016.
[24] Y. Wang, S. Zhao, J. Li, and J. Kuang, “Speech bandwidth extensionusing recurrent temporal restricted boltzmann machines,” IEEE SignalProcessing Letters, vol. 23, no. 12, pp. 1877–1881, Dec. 2016.
[25] C. L. P. Chen, C. Y. Zhang, L. Chen, and M. Gan, “Fuzzy restricted
M. J. da SILVA et al.: SPEECH QUALITY CLASSIFIER MODEL BASED ON DBN 83

boltzmann machine for the enhancement of deep learning,” IEEE Trans.on Fuzzy Systems, vol. 23, no. 6, pp. 2163–2173, Dec. 2015.
[26] Y. Qian and P. C. Woodland, “Very deep convolutional neural networksfor robust speech recognition,” IEEE/ACM Trans. on Audio, Speech, andLanguage Processing, vol. 24, no. 12, pp. 481–488, Dec. 2016.
[27] G. Wen, H. Li, J. Huang, D. Li, and E. Xun, “Random deep beliefnetworks for recognizing emotions from speech signals,” ComputationalIntelligence and Neuroscience, vol. 2017, no. 2, pp. 1–9, Mar. 2017.
[28] M. J. da Silva, D. C. Begazo, and D. Z. Rodrıguez, “Evaluation ofspeech quality degradation due to atmospheric phenomena,” in 2019 In-ternational Conference on Software, Telecommunications and ComputerNetworks (SoftCOM), Sep. 2019, pp. 1–6.
[29] K. Ulaganathen, I. M. Rafiqul, K. Abdullah, and T. A. Rahman, “Specificrain attenuation analysis and modeling for 5g communication,” in2018 7th International Conference on Computer and CommunicationEngineering (ICCCE), Sep. 2018, pp. 1–4.
[30] K. Ulaganathen, A. R. Tharek, R. M. Islam, and K. Abdullah, “Rainattenuation for 5g network in tropical region (malaysia) for terrestriallink,” in 2017 IEEE 13th Malaysia International Conference on Com-munications (MICC), Nov 2017, pp. 35–38.
[31] C. Kourogiorgas, S. Sagkriotis, and A. D. Panagopoulos, “Coverageand outage capacity evaluation in 5g millimeter wave cellular systems:impact of rain attenuation,” in 2015 9th European Conference onAntennas and Propagation (EuCAP), April 2015, pp. 1–5.
[32] P. Kantor, J. Bito, and Drozdy, “Characteristics of 5g wireless mil-limeter wave propagation: Transformation of rain attenuation applyingdifferent prediction models,” in 2016 10th European Conference onAntennas and Propagation (EuCAP), April 2016, pp. 1–5.
[33] ITU Rec. P.838.3, “Specific attenuation model for rain foruse in prediction methods,” Mar. 2005. [Online]. Available:https://www.itu.int/rec/R-REC-P.838-3-200503-I
[34] ITU-T Rec. P.676, “Attenuation by atmospheric gases,” Set. 2006.[Online]. Available: https://www.itu.int/rec/R-REC-P.676/en
[35] J. F. O’Hara and D. R. Grischkowsky, “Comment on the veracityof the itu-r recommendation for atmospheric attenuation at terahertzfrequencies,” IEEE Transactions on Terahertz Science and Technology,vol. 8, no. 3, pp. 372–375, May 2018.
[36] Y. J. Hu and Z. H. Ling, “DBN-based spectral feature representation forstatistical parametric speech synthesis,” IEEE Signal Processing Letters,vol. 23, no. 3, pp. 321–325, Mar. 2016.
[37] J. Fredes, J. Novoa, S. King, R. M. Stern, and N. B. Yoma, “Locallynormalized filter banks applied to deep neural-network-based robustspeech recognition,” IEEE Signal Processing Letters, vol. 24, no. 4,pp. 377–381, Apr. 2017.
[38] D. Chazan, R. Hoory, G. Cohen, and M. Zibulski, “Speech reconstruc-tion from mel frequency cepstral coefficients and pitch frequency,” inProc. Int. Conf. on Acoustics, Speech, and Signal Processing, Istanbul,Turkey, Aug. 2000, pp. 1299–1302.
[39] Y.-S. Yun and Y.-H. Oh, “A segmental-feature HMM for speech patternmodeling,” IEEE Signal Processing Letters, vol. 7, no. 6, pp. 135–137,Jun. 2000.
[40] A. Graves, Supervised Sequence Labelling with Recurrent Neural Net-works, ser. Studies in Computational Intelligence. Springer, 2012, vol.385.
[41] M. Carey, E. Parris, and H. Lloyd-Thomas, “A comparison of features forspeech, music discrimination,” in Proc. of IEEE Int. Conf. on Acoustics,Speech, Signal Processing, Arizona, USA, Mar. 1999, pp. 191–199.
[42] C. Liu, L. Xie, and H. Meng, “Classification of music and speech inmandarin news broadcasts,” in National Conf. on Man-Machine SpeechCommunication, Anhui, China, Oct. 2007, pp. 17–20.
[43] G. Hinton, L. Deng, D. Yu, G. E. Dahl, A. r. Mohamed, N. Jaitly,A. Senior, V. Vanhoucke, P. Nguyen, T. N. Sainath, and B. Kingsbury,“Deep neural networks for acoustic modeling in speech recognition:The shared views of four research groups,” IEEE Signal ProcessingMagazine, vol. 29, no. 6, pp. 82–97, Nov. 2012.
[44] G. Pan, J. Qiao, W. Chai, and N. Dimopoulos, “An improved RBMbased on bayesian regularization,” in Proc. Int. Joint Conf. on NeuralNetworks, Beijing, China, Jul. 2014, pp. 2935–2939.
[45] E. T. Affonso, R. D. Nunes, R. L. Rosa, G. F. Pivaro, and D. Z.Rodrıguez, “Speech quality assessment in wireless voip communicationusing deep belief network,” IEEE Access, vol. 6, pp. 77 022–77 032,2018.
[46] G. E. Hinton, S. Osindero, and Y.-W. Teh, “A fast learning algorithmfor deep belief nets,” Neural Computing, vol. 18, no. 7, pp. 1527–1554,2006.
[47] N. Jaitly and G. E. Hinton, “Learning a better representation of speechsoundwaves using restricted boltzmann machines.” in Proc. IEEE Int.
Conf. on Acoustics, Speech and Signal, Prague, Czech Republic, May2011, pp. 5884–5887.
[48] D. Z. Rodrıguez, M. Arjona Ramırez, L. F. Bernardes, G. Mittag, andS. Moller, “Impact of fec codes on speech communication quality usingwb e-model algorithm,” in 2019 Wireless Days (WD), 2019, pp. 1–4.
[49] D. Z. Rodrıguez, G. F. Pıvaro, R. L. Rosa, G. Mittag, and S. Moller,“Quantifying the quality improvement of MIMO transmission systemsin voip communication,” in International Conference on Software,Telecomm. and Comp. Networks (SoftCOM), Sep. 2018, pp. 1–5.
[50] Relative humidity, http://www.etec.com.br/muda3.html, 2019.[51] R. Gomes, L. Sismeiro, C. Ribeiro, T. R. Fernandes, M. G. Sanchez,
A. Hammoudeh, and R. F. S. Caldeirinha, “Will COTS RF Front-EndsReally Cope With 5G Requirements at mmWave?” IEEE Access, vol. 6,pp. 38 745–38 769, 2018.
[52] T. S. Rappaport, J. N. Murdock, and F. Gutierrez, “State of the art in60-ghz integrated circuits and systems for wireless communications,”Proceedings of the IEEE, vol. 99, no. 8, pp. 1390–1436, Aug 2011.
[53] R. C. Daniels and R. W. Heath, “60 ghz wireless communications:Emerging requirements and design recommendations,” IEEE VehicularTechnology Magazine, vol. 2, no. 3, pp. 41–50, Sep. 2007.
[54] J. Kim, J.-J. Lee, and W. Lee, “Strategic control of 60 ghz millimeter-wave high-speed wireless links for distributed virtual reality platforms,”Mobile Information Systems, vol. 2017, pp. 1–10, 03 2017.
[55] E. T. Affonso, R. L. Rosa, and D. Z. Rodrıguez, “Speech quality as-sessment over lossy transmission channels using deep belief networks,”IEEE Signal Processing Letters, vol. 25, no. 1, pp. 70–74, 2018.
M. J. da Silva received her Master’s degree inSystems Engineering and Automation from the Fed-eral University of Lavras, 2019. She received hergraduation in Electrical Engineering from the Fed-eral Institute of Education, Science and Technologyof Minas Gerais, 2016. She is computer technicianfrom the Federal Center for Technological Educationof Minas Gerais, 2011. She is currently a substituteprofessor in the Mechatronic Engineering Depart-ment at CEFET-MG, Divinopolis campus.
D. C. Melgarejo (M’08) received the B.Eng. de-gree (Hons.) in electronics and electrical engineer-ing from San Marcos National University, Lima,Peru, and the M.Sc. degree in electrical engineer-ing from Pontifical Catholic University of Rio deJaneiro, Rio de Janeiro, Brazil, in 2004 and 2008,respectively. Between 2008 and 2010, he contributedto WIMAX (IEEE 802.16m) standardization. From2010 to 2018, he worked with the design and imple-mentation of cognitive radio networks and projectsbased on 3GPP technologies. Since 2018 he is a
researcher at LUT University, where he is also pursuing the Ph.D degree inelectrical engineering. His research interests are mobile technologies beyond5G, energy harvesting, intelligent meta-surfaces, and Cell-free mMIMO.
R. L. Rosa received her M.S. degree from the Uni-versity of Sao Paulo in 2009 and her Ph.D. degreefrom the Polytechnic School of the University of SaoPaulo, in 2015 (EPUSP). She is currently an AdjunctProfessor with Department of Computer Science,Federal University of Lavras, Brazil. Her current re-search interests include computer networks, artificialintelligence algorithms, recommendation systems,telecommunication systems, wireless networks, andquality of service and quality of experience in mul-timedia services.
D. Z. Rodrıguez (M’12-SM’15) received the B.S.degree in electronic engineering from the PontificalCatholic University of Peru, the M.S. degree andPh.D. degree from the University of Sao Paulo in2009 and 2013. He is currently an Adjunct Professorwith the Department of Computer Science, FederalUniversity of Lavras, Brazil. He has a solid knowl-edge in Telecommunication Systems and ComputerScience based on 15 years of Professional experiencein major companies. His research interest includesQoS and QoE in Multimedia services, artificial in-
telligence algorithms, and architect solutions in Telecommunication Systems.
84 JOURNAL OF COMMUNICATIONS SOFTWARE AND SYSTEMS, VOL. 16, NO. 1, MARCH 2020