Embed Size (px)
Citation preview

Speed Management on Maltese Roads
Policy and Technical Guidance Manual
Consultation Document

2

Speed Management on Maltese Roads
Policy and Technical Guidance Manual
Consultation Document
Version 1.06c
05/04/2012
Front cover photograph courtesy of P.P. Barbara

ii
iii
Executive Summary
The “need for speed”
The current road network links all the towns and villages and covers more than 2,300km (with nearly
800km of major roads) and our desire for increase mobility has changed both lifestyle and travel
behaviour in Malta. As a nation, Malta has radically transformed from having one of the lowest per
capita car ownership level in Europe in the 1970s to having one of the highest levels by 2008. Malta
also has one of the highest car dependency rates in Europe.
There are many factors which contribute to excessive or inappropriate use of speed, ranging from
pressure on commercial drivers by fleet managers and employers to be more productive, lack of
awareness of speed limits and in some cases since speed is a source of adrenalin rush for some
drivers. Many drivers overestimate their driving skills and believe that it is possible to travel above the
speed limit without placing themselves or others at risk.
With an average of one road traffic accident every 30 minutes, albeit with minor damage to vehicle or
roadside infrastructure, an average of three people are hospitalised every day. Excessive or
inappropriate use of speed is identified as a key risk factor in road traffic injuries and this policy
attempts to scientifically analyse and explain possible measures to improve road safety though better
speed management.
Road functions
The functions of roads and their structures differ considerably in built-up and rural areas. The
classification of each road by its particular function reflects use in most cases and provides a basis for
the consistent application of a speed management policy. Classification of roads for flow, distributory
and access functions will dictate their design construction and use and therefore impact the ultimate
intended user speed.
While national speed limits can be indicated as a factor that influences road design and their ultimate
marked speed limits, local scale issues dictate the need for localised speed limits to be used in certain
cases. As a start however, this policy seeks to clearly define the different road functions including
new road functions of “linking” and “TEN-T” roads while reclassifying roads where their function has
clearly changed over time.
National Speed Limit regimes
National speed limits are widely used to define acceptable speeds and to indicate the maximum
speed for vehicles to travel so as to be compliant with the law. Set correctly, speed limits can help
reinforce road users’ assessments of a safe speed and can act as an indicator for drivers as to the
nature and risk level associated with the road.
Across Europe, national speed limits are set for roads with particular functions and environments, but
also for particular vehicle types. Introduced 16 years ago, the national speed limit regime in Malta
contains many of the essential elements which are considered to be European best practice.
Most major roads in Malta were built at a time where the national speed limit, and hence their design
speed was lower than the current national speed limit of 80km/h. Spatial competition between road
network and building construction often limits the ability of roads to be designed to provide optimum
conditions.
The policy seeks to determine the need to update these limits to take changes in traffic mix, road
construction and vehicle technology into consideration. In this respect, the policy seeks to
recommend a rationalisation of the speed limits applicable to vehicle types as well as to redefine
some grey areas in function and environment factors to be taken into consideration when defining

iv
national limits. Further rationalisation of road use such as the prohibition of certain slow moving
vehicles on certain roads and lane discipline are also contemplated by the policy.
Local Speed Limit regimes
No two roads are alike and there will always be situations where discrepancies between national
speed limits for the road type, drivers’ perceptions of the safe travelling speed and the appropriate
speed for that road, as established by theoretical analysis occur.
At minimum, speed limits should reflect an appropriate balance between safety and mobility. On a
road without marked speed limits, a driver will rely on his judgement of risk and perception of hazard
in order to determine his safe operating speed. Some hazards may be obvious while others less
obvious. Changes to the road environment will inevitably occur after the construction of the road
often resulting in a wide discrepancy between the speed at which a road was originally designed and
the speed at which vehicles on the road are observed to operate.
Operating speed of vehicles on a section of road is an important factor in establishing safe speed
limits for that road and a variety of theoretical best-of-breed measures are used to determine local
speed limits that are then indicated by signs. Transition zones between different speed limit zones
encourage gradual adjustment of speed in a safe manner.
The policy proposes that a rationalisation process of speed limits be implemented to streamline local
speed limits, including setting up of a structured methodology to determine local speed limits. Also
ongoing monitoring of the road network is proposed, to ensure that the local speed limits are
appropriate for the conditions of the respective road.
Proposed speed limits for the arterial and distributory road network are annexed to the policy.
Communicating these limits to the road user
Generally speaking, drivers are well educated about their the national speed limits during the training
and testing associated with obtaining the driving licence, and this is reinforced by information
concerning national speed limits at ports and airports as well as by the of Posted Speed Limit signs on
the road network.
Road sign construction, location and clarity are all important factors if the road user is to heed the
limits that they seek to convey. Furthermore road markings, illuminated or variable signage and other
physical measures contribute to the understanding of the speed that a road user will apply.
The policy recommends the replacement of all “national speed limit” signs to actual speed signs since
they appear to be least understood by road users. It also recommends the introduction of new
vehicle activated signs that indicate vehicle speed so as to increase awareness of actual speed that
vehicles travel at. Further improvements to the quality of road markings and traffic management by
introducing better accountability by entities supplying these measures will be complimented by road
infrastructure safety audits.
Educating the wider public
The success of the speed management policy depends overwhelmingly on the acceptability of the
community and community decision makers. Although there is clear evidence that speed and
speeding are problematic, it is vital that speed management policies, which by their nature necessarily
restrict driving behaviour and driving choices, are well managed and so as not to be ignored.
Education, training and information are key to the success of a comprehensive speed management
policy as well as being a pre-requisite for effective implementation of other measures such as
infrastructure, signage, road makings, enforcement and vehicle technology. Starting at school with
v
road safety awareness for children, effective use of the road network by various users is reinforced by
driver training, testing and follow-up enforcement.
The policy proposes that Road Safety could be established as part of the national learning curriculum.
Further education on road safety and the driving test could be developed for pre-driver licence post-
secondary level students as well as further investment in road safety educational materials and tools.
The introduction of continued ability test for existing Driving instructors would ensure that driver
training remains at its peak. Introducing a safe driving course model for Government employees
would serve as a pilot with potential to be transferred to the private sector. The policy also indicates
that continued media attention to speed policies by introducing a long-term media programme
relating to speed management and other road safety issues would reinforce lifelong training and
education to all road users.
Enforcement for better road safety
In a perfect world, speed limits on roads would be credible, self explanatory and motorists would
adhere to safe driving speeds at all times and in all conditions. However, in the real world motorists
regularly exceed the posted speed limits either inadvertently or deliberately. Enforcement can be
both an effective educational tool and also be a powerful measure contributing directly to the
reduction of speeding and associated traffic accidents, injuries and fatalities.
Based on the psychological premise that most people will try and avoid penalties for not complying
with the rules, the driver’s assessment of risk of apprehension is based on the likelihood of being
caught and prosecuted. In itself, this is an effective deterrent and ensures that most drivers comply
with the rules. The subjective risk of apprehension can be increased by the use of publicity campaigns
and increase media awareness.
Until the time when compliance with the speed limits is enforced via on-board instruments, speed
enforcement using roadside equipment or by mobile enforcement personnel will continue to be main
process. Roads with a poor safety record or a perceived risk of danger from motorists are targeted for
speed enforcement and the policy looks at the where, when and how the most effective enforcement
tools can be deployed with the aim of tangible safety improvements. This includes accreditation of
current enforcement tools, studies for the possible implementation of new tools such as dummy
cameras and average speed cameras, as well as clearer definition of the enforcement tolerance limits
along with a third tier of speed fines to further discourage abuse.
Implementation and Monitoring
No policy would be complete without regular review of the policy implementation and the monitoring
of the effectiveness of the policy. This policy therefore considers the continual review process at the
various stages of speed management implementation including at local, regional and national level as
well as at regional and international policy level.

vi

vii
Contents
Executive Summary........................................................................................................................... iii Section 1 Debate on Speed – The Facts ............................................................................................1
Road Crashes and Injuries involving Speed ..........................................................................................1 Vehicle stopping distances at different speeds ................................................................................1 Vehicle Protection Devices ...............................................................................................................2 Speed and the Drivers visual field ....................................................................................................2 Traffic Conditions and Accidents ......................................................................................................3
Speed and its Environmental Impact....................................................................................................3 Speed and its impact on journey times ................................................................................................4 Speed and congestion ..........................................................................................................................5 Speed limits and public perception ......................................................................................................5
Section 2 Establishing a Speed Management Policy for Malta..........................................................7 Introduction..........................................................................................................................................7 Components of a Speed Management Policy Package ........................................................................7
Section 3 Determining the function of the road ...............................................................................9 Current Practice in Malta..................................................................................................................9
Section 4 Determining the National Speed Limit Regimes .............................................................. 13 Maximum National Speed limits ........................................................................................................13
Type of Road or Environment.........................................................................................................13 Type of Vehicle ...............................................................................................................................14 Types of Tyre ..................................................................................................................................14 Types of Driver................................................................................................................................14 Prevailing Weather conditions .......................................................................................................14
Minimum Speed Limits .......................................................................................................................15 Current Practice in Malta....................................................................................................................15
Maximum National Speed Limits....................................................................................................15 Minimum Speed Limits ...................................................................................................................16
Section 5 Setting Local speed Limits ............................................................................................... 19 Design Speed of a Road ..................................................................................................................19 Operating speeds............................................................................................................................19 Posted Speed Limits........................................................................................................................19 Transition Zones .............................................................................................................................20 Speed zones....................................................................................................................................21
Current Practice in Malta....................................................................................................................21 Design speed of roads ....................................................................................................................21 Posted Speed limits in Malta ..........................................................................................................23
Section 6 Making sure people actually know the speed limit in force............................................. 30 Speed Limit Signage........................................................................................................................30 Vehicle Activated Signs...................................................................................................................32 Road Markings................................................................................................................................32 Physical measures to influence vehicle speed................................................................................33
Current Practice in Malta....................................................................................................................33 Speed limit Signage.........................................................................................................................34 Vehicle Activated Signage...............................................................................................................34 Road Markings................................................................................................................................34 Physical measures to influence vehicle speed................................................................................34
Section 7 Informing and educating the drivers about speed and speed management.................... 38 Education of children......................................................................................................................38 Driver Training ................................................................................................................................38 Licensed drivers ..............................................................................................................................39
Current Practice in Malta....................................................................................................................39 Education of children......................................................................................................................39 Driver Training ................................................................................................................................40 Licensed Drivers..............................................................................................................................41

viii
Section 8 Enforcing to control the intentional speeder................................................................... 44 Speed Enforcement Systems and Equipment.................................................................................44 Conventional manual speed enforcement .....................................................................................44 Automatic speed enforcement.......................................................................................................45 Fixed Speed Cameras......................................................................................................................45 Mobile Speed Cameras...................................................................................................................45 Average Speed Cameras .................................................................................................................46 Tolerances for speed limit enforcement ........................................................................................46 Where and how to use speed Enforcement? .................................................................................47 Fines and Penalties .........................................................................................................................48 Administration of speed cameras...................................................................................................49 Evaluation of the impact of Speed Enforcement measures ...........................................................50
Current Practice in Malta....................................................................................................................50 Speed Enforcement Systems and Equipment.................................................................................51 Where and how to use speed Enforcement? .................................................................................51 Tolerances for speed limit enforcement ........................................................................................51 Fines and Penalties .........................................................................................................................52 Administration of speed cameras...................................................................................................53 Evaluation of the impact of Speed Enforcement measures ...........................................................54
References ....................................................................................................................................... 58 ANNEX 1 Technical Guidance to Setting Local Speed Limits............................................................. 59 ANNEX 2 Technical Guidance to making sure people actually know the speed limit in force .......... 85 ANNEX 3 Technical Guidance to enforcing to control the intentional speeder .............................. 103

ix
List of Figures
Figure 1: Vehicle stopping distances at different speeds .........................................................................2 Figure 2: Impact of speed on the field of vision .......................................................................................3 Figure 3: Relative injury accident rate on urban roads going faster and slower than average speed. ....3 Figure 4: Gaseous emissions as a function of speed ................................................................................4 Figure 5: Traffic flow as a function of travel speed ..................................................................................5 Figure 6: A simple road hierarchy for urban areas ...................................................................................9 Figure 7: Road hierarchy map for Malta and Gozo.................................................................................10 Figure 8: Minimum Speed limit signs .....................................................................................................15 Figure 9: Warning sign indicating reduction in speed necessary for a change of road layout ahead ....20 Figure 10: Speed Limit Signage...............................................................................................................21 Figure 11: Malta TEN-T (road) Node EA15 (Kappara) to NA11 (Pembroke) required alignment changes
for 80km/h design speed........................................................................................................................22 Figure 12: Proposed Posted Speed Limits on Arterial and Distributor roads in Malta...........................26 Figure 13: Proposed Posted Speed Limits on Arterial and Distributor roads in Gozo ............................27 Figure 14: Examples of best practice in the layout Speed Limit Signage................................................31 Figure 15: Examples of Vehicle Activated Signage .................................................................................32 Figure 16: Speed Limit Roundels ............................................................................................................33 Figure 17: Road narrowing with road hump...........................................................................................33 Figure 18: Photographs showing traffic calming measures applied correctly and incorrectly...............35 Figure 19: Overall, the road safety education carried out at various schools........................................40 Figure 20: Camouflaged Speed camera in Loipersdorf, Austria .............................................................48 Figure 21: Process to review existing speed camera sites......................................................................54
List of Tables
Table 1: Road Hierarchy in Malta ...........................................................................................................10 Table 2: Recent informal changes to Malta’s road hierarchy.................................................................11 Table 3: Typical speed limits in European Union....................................................................................13 Table 4: UK National speed limits according to type of road and Vehicle Types ...................................14 Table 5: Malta national speed limits ......................................................................................................16 Table 6: Recommended distances between first / last Posted Speed Limit signs and repeater signs ...31 Table 7: Layout of road markings ...........................................................................................................32 Table 8: Fixed speed camera tolerance limits in Europe for roads with speed limits of 80km/h or less47 Table 9: Speed fines and Penalty Points by European Country..............................................................49 Table 10: Malta Fixed speed camera tolerance limits for Roads with Speed limits of 80km/h or less ..52 Table 11: Malta Probationary Licence Penalty Point System .................................................................53 Table 12: Assessment of existing speed cameras in Malta ....................................................................55

x

1
Section 1
Debate on Speed – The Facts
Over the past forty years, our society has benefited greatly from improved mobility. Today’s traveller
has a much wider choice of modes of transport available for his personal mobility such as private car,
motor cycle, bus, coach and minibus in addition to walking and cycling. The current road network links
all the towns and villages and covers more than 2,300km (with nearly 800km of major roads).
Inevitably our desire for increase mobility has changed both our lifestyles and our travel behaviour.
Malta as a nation, has radically transformed from having one of the lowest per capita car ownership
level in Europe in the 1970s to having the seventh highest in level in 20081 and, with over 74% of all
trips by Maltese citizens being made by car2, Malta also has one of the highest car dependency rates
in Europe too.
Motorisation world-wide has often been perceived as an indicator of efficiency, a facilitator to
employment, goods, services and amenities and as a tool for progress. As a result, the technological
advances introduced in the automobile industry have constantly been designed to meet our demands
for greater mobility and shorter journey times. Today however, unlike 30 years ago, the majority of
passenger cars being manufactured are capable of travelling in excess of 150 km/h.
There are many factors which contribute to excessive or inappropriate use of speed. These may range
from individuals trying to reach destinations on time, to pressure on commercial drivers by fleet
managers and employers to be more productive, or lack of awareness of speed limits. Speed may also
be a source of pleasure for some drivers who relish the adrenalin and excitement of travelling at high
velocities. Many drivers consider themselves above average in terms of skill and very often they
believe they can travel above the speed limit and without placing themselves or others at risk.
While, on the one hand, increased speed and perceived reduction in our travel times is seen by many
to positively contribute to our increasingly busy lifestyles; on the other, travelling on roads at higher
speeds has known adverse effects, principally in terms of road accidents and consequent death or
injury and material damage, but also in terms of stress levels resulting in road rage contributing at the
same time to environmental issues such as noise and pollution from exhaust emissions.
Road Crashes and Injuries involving Speed
In Malta, there is an average of one road traffic accident every 30 minutes. Although the vast majority
of these traffic accidents only involve minor damage to the vehicles or to roadside infrastructure,
each day an average of three people are brought into our hospitals and poly-clinics to receive medical
attention, as a result of road traffic accidents.
Excessive or inappropriate use of speed has long been identified as a key risk factor in road traffic
injuries, influencing both the risk of road traffic crashes and the severity of injuries. As speed
increases so does the distance travelled during the driver’s reaction time and the distance needed to
stop.
Vehicle stopping distances at different speeds
Pedestrians are a vulnerable road user. A pedestrian hit by a vehicle travelling at the national speed
limit of 50km/h within towns and villages incurs an 80% risk of being killed. In Malta and Gozo, four
pedestrians were killed in road traffic accidents in 2009 alone, while 52 were grievously injured3.
1 European Environment Agency Term 22 Passenger Car Ownership (2008)
2 Transport Malta National Household Travel Survey (2010)
3 National Statistics Office Transport Statistics (2010)

2
Take for example a motorist travelling in dry conditions at the national speed limit of 80km/h (outside
towns and villages); a typical, well maintained vehicle would take around 22 metres (1 second driver
reaction time) and a total distance of 57 metres for the vehicle to reach a complete standstill when
seeing a potential hazard ahead. If a child runs onto the road 36 metres ahead the driver, due to the
short distance, would most likely run over and probably kill that child at a decelerating speed of
62km/h. Driver reaction times and braking distances are invariably increased when the road surface is
wet, making this even more likely.
Figure 1: Vehicle stopping distances at different speeds Source: Impact Speed (Road Safety Education Resource) Australian Road Safety Bureau (no date)
Vehicle Protection Devices
In recent years, vehicle manufacturers have spent more energy developing vehicle design
technologies aimed at improving safety for vehicle occupants and other road users. Through the
European New Car Assessment Programme (EuroNCAP) each new model of vehicle now undergoes an
independent speed crash test analysis and consumers are made aware of the safety rating of the
vehicle. Tests include frontal impact at 64 km/h and side impact at 50 km/h, including the protection
afforded to children, pedestrians and whiplash prevention.
Whereas car occupants are not generally considered to be vulnerable road users even modern, well-
equipped cars with a high EuroNCAP rating can in reality only provide protection up to certain speeds;
for example car occupants wearing seatbelts are generally protected to a maximum of 70km/h for
frontal impacts and a maximum of 50km/h for side impacts.
Speed and the Drivers visual field
The speed at which a driver travels affects the field of vision of the driver. As shown in Figure 2 the
field of vision is reduced when speed increases. A driver travelling at 40km/h has a field of vision of
100° which, in most cases, allows for obstacles on the roadside and other potential hazards to be
clearly seen. At an increased speed of 70km/h the field of vision is reduced to 75° which in turn
reduces the ability of drivers to clearly see potential hazards ahead and reduces the capability of the
driver to assess potential danger at the kerbside or beyond (for example at intersections).

3
Figure 2: Impact of speed on the field of vision Source: French Ministry for Transport (no date)
Traffic Conditions and Accidents
Studies conducted by the Australian Transport Council provide direct evidence that speeds just 5km/h
above average in 60km/h urban areas and 10 km/h in rural areas are sufficient to double the risk of
casualties in road traffic accidents.
Figure 3: Relative injury accident rate on urban roads going faster and slower than average speed. Source: Speed Management in Sweden Andersson and Nilsson (1997)
The European Transport Safety Council (ETSC) estimates that each 1km/h reduction in average speed
leads to a 2%-3% reduction in injury accidents.
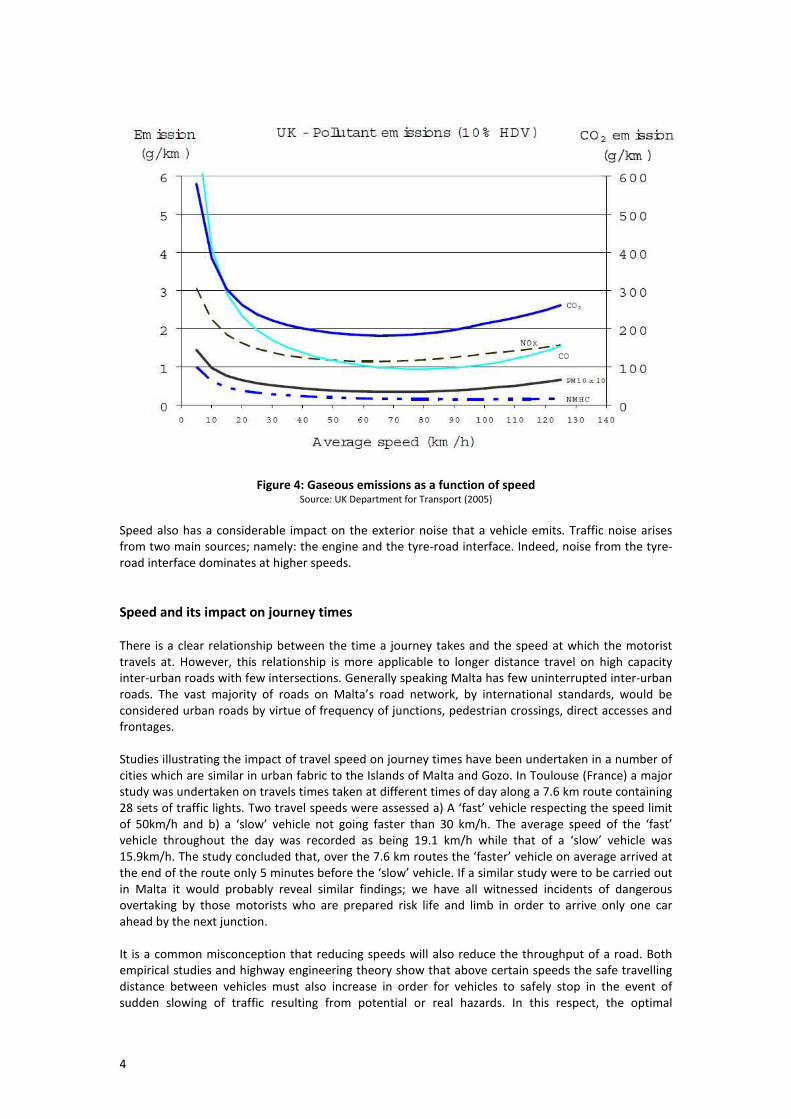
Speed and its Environmental Impact
Emissions from road vehicles contain a variety of pollutants which are produced in different quantities
at different vehicle speeds. The main gaseous pollutants emitted from vehicle exhaust include: carbon
monoxide (CO), hydrocarbons (HC), nitrogen oxides (NOx) and particulate matter (PM). The
production of pollutants varies both within vehicles and, depending on engine technologies, from one
vehicle to the next. Modern vehicles, using the latest technologies, have much lower levels of local
pollutants from older vehicles and emissions from these vehicles is generally more sensitive to rapid
and sudden acceleration and heavy braking than to constant average speed.
The optimum speed at which emissions are minimised varies according to the type of emission.
However, typically, pollutant emissions on average are probably optimised at around 60 km/h.
4
Figure 4: Gaseous emissions as a function of speed Source: UK Department for Transport (2005)
Speed also has a considerable impact on the exterior noise that a vehicle emits. Traffic noise arises
from two main sources; namely: the engine and the tyre-road interface. Indeed, noise from the tyre-
road interface dominates at higher speeds.
Speed and its impact on journey times
There is a clear relationship between the time a journey takes and the speed at which the motorist
travels at. However, this relationship is more applicable to longer distance travel on high capacity
inter-urban roads with few intersections. Generally speaking Malta has few uninterrupted inter-urban
roads. The vast majority of roads on Malta’s road network, by international standards, would be
considered urban roads by virtue of frequency of junctions, pedestrian crossings, direct accesses and
frontages.
Studies illustrating the impact of travel speed on journey times have been undertaken in a number of
cities which are similar in urban fabric to the Islands of Malta and Gozo. In Toulouse (France) a major
study was undertaken on travels times taken at different times of day along a 7.6 km route containing
28 sets of traffic lights. Two travel speeds were assessed a) A ‘fast’ vehicle respecting the speed limit
of 50km/h and b) a ‘slow’ vehicle not going faster than 30 km/h. The average speed of the ‘fast’
vehicle throughout the day was recorded as being 19.1 km/h while that of a ‘slow’ vehicle was
15.9km/h. The study concluded that, over the 7.6 km routes the ‘faster’ vehicle on average arrived at
the end of the route only 5 minutes before the ‘slow’ vehicle. If a similar study were to be carried out
in Malta it would probably reveal similar findings; we have all witnessed incidents of dangerous
overtaking by those motorists who are prepared risk life and limb in order to arrive only one car
ahead by the next junction.
It is a common misconception that reducing speeds will also reduce the throughput of a road. Both
empirical studies and highway engineering theory show that above certain speeds the safe travelling
distance between vehicles must also increase in order for vehicles to safely stop in the event of
sudden slowing of traffic resulting from potential or real hazards. In this respect, the optimal

5
throughput vehicles using on a standard inter-urban dual 2 lane carriageway, has been determined to
be between 60 km/h and 70 km/h.
Figure 5: Traffic flow as a function of travel speed Source: Speed Management OECD and ECMT (2006)
Speed and congestion
Over the last 10 years, the number of vehicles licensed to use Maltese roads has increased from
246,000 to 301,000. This has resulted in a typical increase in traffic levels of 2% per annum. Increased
congestion, particularly during peak hours results in decreased average speeds on many roads.
Although no specific studies have been carried out to measure the relationship between congestion
and accident risk, it would appear from the latest NSO statistics that most traffic accidents that
involve casualties take place when there is less traffic on the roads at times when traffic is generally
more free-flowing. Specific studies will need to be carried out to establish the precise relationship
between traffic levels and injury accidents, including the impact of driver frustration and risk taking
during peak hours which could cause increased severity and number of accidents.
Speed limits and public perception
Studies carried out both in Malta and abroad indicate that drivers do not usually comply strictly with
speed limits. The extent of speeding varies depending on the reasonableness of speed limits, the
perceived likelihood of enforcement (and severity of penalties for non-compliance), fuel
consumption, the driving context and the driver’s own characteristics. Speed surveys recently carried
out on Malta’s main arterial and distributor network clearly indicate the diversity of speeds by
different drivers travelling on the same stretch of road at the same time of day.
The degree of compliance with speed limits results from driver’s appraisal of both the utility and
disutility of non-compliance. A significant percentage of drivers who drive in excess of speed limits
often perceive there to be a contradiction between the design speed of the road and the posted
speed limit signs for example adhering to a 60km/h posted speed limit on an urban dual carriageway.
Although in such instances, the adopted posted speed limits may have been established at a lower

6
level than the road design speed due other factors such to the presence of vulnerable road users such
as pedestrians.
A Eurobarometer survey on Road Safety4 carried out across the 27 Member States of the European
Union highlights the growing concern in Malta regarding the seriousness of drivers exceeding speed
limits. 89% of Maltese respondents to this survey opined that drivers exceeding speed limits pose a
major safety problem in Malta - the fifth highest response rate of this nature behind Cyprus, Bulgaria,
Estonia and Italy.
Nevertheless, both traditional media and on-line forums in Malta are rife with comments to the
contrary, particularly following the increased level of speed enforcement on Maltese roads that has
been put in place since 2005. Public forum comments following each major traffic accident report in
the local media now follow fairly predictable patterns usually starting with road design & condition,
followed by driver age, training & behaviour. Inevitably this is followed by a debate on speed limits,
eventually leading to opinion writers’ presenting views for or against speed cameras.
These debates have invariably also been held in most other countries Many EU member states have
seen changes in public attitude towards speeding with a growing awareness of road safety issues and
the need to manage speed. Following the introduction of their ‘vision zero’ policy on road traffic
accidents, policy makers in Sweden, perhaps the most avant-garde country when it comes to road
safety, faced great pressure from car, truck, coach and commercial drivers to increase speed limits on
motorways from 110km/h to 130 km/h, while there was equal pressure being exerted from
pedestrians and cyclist lobby groups to decrease speed limits from 50 km/h to 30 km/h in urban
areas.
Debates on speed policies are not uncommon in small islands. Following the success and acceptance
of the introduction of a lower blanket speed limit of 40mph (64 km/h) in the State of Jersey, road
safety campaigners in the UK Isle of White have recently been lobbying for a similar blanket speed
limit of 64 km/h to be introduced on the island. The Isle of White (which has an area of 384 square
kilometres and which has a resident population of 140,000) now has quite serious road safety
problems resulting in an average of 13 persons being killed each year through road traffic accidents.
The stage is set for a lively debate.
4 European Commission (DG Mobility and Transport) Flash Eurobarometer 301 Road Safety Analytical Report (July 2010)
7
Section 2
Establishing a Speed Management Policy for Malta
Introduction
Speed Management is an active approach that requires (or persuades) drivers to adopt speeds that
offer mobility without compromising safety. The common approach in a speed management policy is
to achieve a road transport system that anticipates and allows for human error, while minimising the
risk of death or serious injury.
The Speed Management Policy for Malta does not suggest that higher speeds cannot be beneficial, as
shorter journey times can provide economic benefits and increased mobility. However, public
authorities have to take fully into account their responsibility for protecting human life and reducing
avoidable serious injuries on the roads. This fundamental responsibility is distinctly different from
other objectives of government interest such as improved economic circumstances for its citizens.
Setting and gaining public acceptance for a speed management policy is not an easy task because
individual and collective benefits have to be reconciled with individual and societal responsibilities.
In this respect, the main goal of this Speed Management Policy is to achieve the desired road safety
benefits evidenced through reductions in the number of road traffic accidents, injuries and fatalities
where speeding is a contributing factor. To this end, the following strategic objectives have been
identified:
• ensure that the correct speed limits are applied to the road network;
• ensure that drivers know the speed limit of the road through which they are travelling;
• encourage drivers to adhere with the established speed limits;
• Effectively enforce driver compliance with speed limits;
• educate drivers to understand circumstances where speeds lower than the speed limit of the
road are required;
• co-ordinate, monitor and evaluate the implementation of this policy.
Components of a Speed Management Policy Package
A speed management policy usually consists of a number of different but inter-related components.
Implementation of fragmented or isolated measures may have some impact, but this will not be as
effective as an integrated, holistic approach to speed management. For example there is a strong and
complimentary link between road infrastructure, clear signage and marking, legislation and
enforcement.
Many countries, including Malta, are introducing speed management policies on transport networks
where the roads have already been constructed. In an ideal world, it would be desirable to start from
scratch when planning the road network system however, in reality, this is never possible. Therefore,
the planning and development of a speed management packages must be progressive, and build on
the outcome of clearly defined steps. The following steps (which are considered to be a best
international practice), have been used in the development of this Speed Management Policy for
Malta. Each step will be elaborated in separate Sections of this Speed Management Policy. Each
Section shall outline best practices from other countries, an explanation of current practice in Malta
and shall conclude with considerations for policy change in Malta.

8
Section 3 of this Speed Management Policy examines the various factors used in determining the
function of the road, Section 4 looks at national speed limit regimes, while Section 5 discusses the
setting local speed limits, Section 6 looks at ways of making sure people actually know the speed limit
in force and section 7 explains how drivers can be informed and educated about speed and speed
management and section 8 assesses how enforcement of can be used to control the intentional
speeder.

9
Section 3
Determining the function of the road
Functions of roads and their hierarchies differ considerably in built-up and rural areas. Empirical data
shows that the nature of crash and injury severity risk also varies within these two broad groupings.
The classification of each road by its particular function will reflect current use in most cases.
However, a road’s function within a said hierarchy provides a basis for the consistent application of a
speed management policy.
Most countries take population and road user density into consideration when classifying their road
network and approach this classification in three components; namely: flow, distribution and access.
Figure 6: A simple road hierarchy for urban areas Source: Speed management on Roads - Manual for Decision Makers and Practitioners (2008), WHO, World Bank and EIA
Foundation
Roads with a flow function allow for an efficient throughput of traffic between urban areas over
longer distances. It is desirable for other vulnerable traffic modes such as bicycles, karozzini and
pedestrians to be separated from vehicular traffic. The number of access and exit points along these
roads should be limited and a significant minimum distance between intersections needs to be
maintained. Roads with a flow function should, as a general rule, be designed to have the highest
carrying capacity and should have the highest speed limits
Roads with a distribution function allow for interface with all kinds of urban and rural areas at
intervals along the road. Intersections are far more frequent that roads with a flow function and
junctions and pedestrian facilities are often at the same level (at-Grade) with the main road. Roads
with a distribution function should, as a general rule, have lower speeds than roads with a flow
function.
Roads with an access function which allow direct access to properties along the road or street.
Provision is made at intersections and links for traffic exchange. At such locations, road engineering
measures may be required to support the low speed requirement.
Current Practice in Malta
The first basic policy framework for speed management in Malta was introduced through the
Structure Plan5 published in the early 1990’s. As part of the preparatory process for the Structure Plan
extensive travel and traffic data were collected and analysed. The Structure Plan established the
5 Structure Plan for the Maltese Islands Draft final Written Statement and Key Diagram, Ministry for Development of
Infrastructure Malta (1990)
10
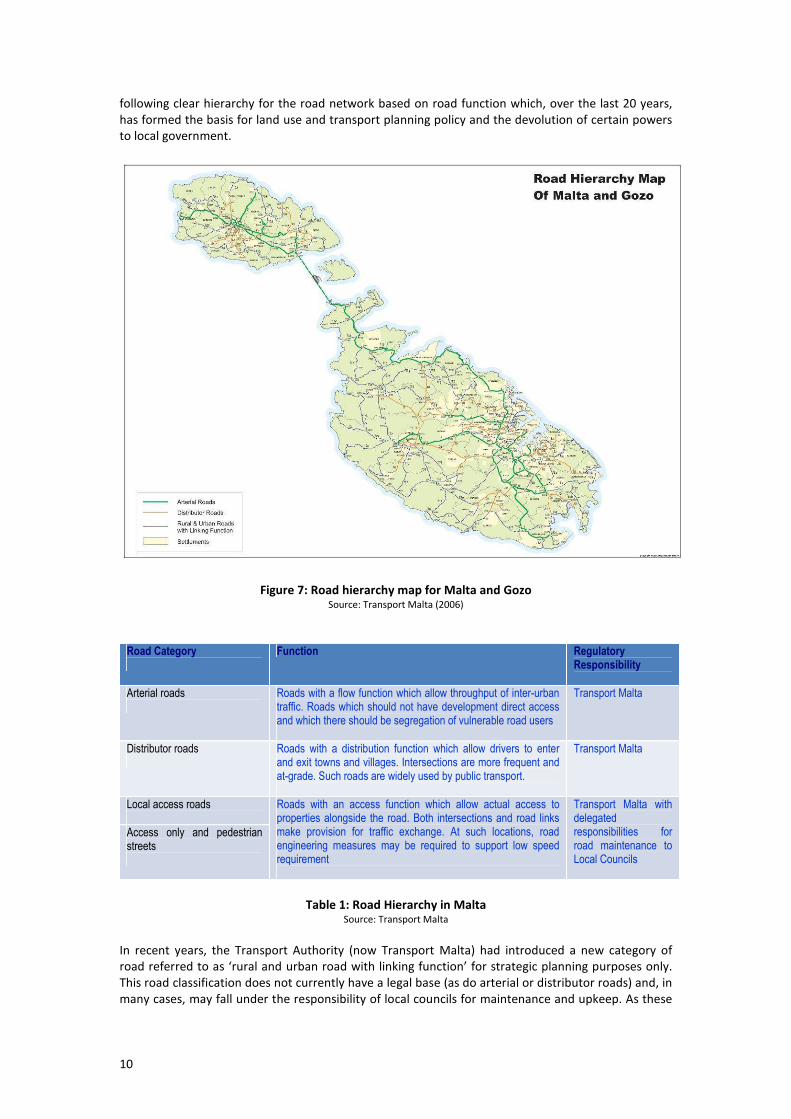
following clear hierarchy for the road network based on road function which, over the last 20 years,
has formed the basis for land use and transport planning policy and the devolution of certain powers
to local government.
Figure 7: Road hierarchy map for Malta and Gozo Source: Transport Malta (2006)
Road Category
Function Regulatory Responsibility
Arterial roads
Roads with a flow function which allow throughput of inter-urban traffic. Roads which should not have development direct access and which there should be segregation of vulnerable road users
Transport Malta
Distributor roads
Roads with a distribution function which allow drivers to enter and exit towns and villages. Intersections are more frequent and at-grade. Such roads are widely used by public transport.
Transport Malta
Local access roads
Access only and pedestrian streets
Roads with an access function which allow actual access to properties alongside the road. Both intersections and road links make provision for traffic exchange. At such locations, road engineering measures may be required to support low speed requirement
Transport Malta with delegated responsibilities for road maintenance to Local Councils
Table 1: Road Hierarchy in Malta Source: Transport Malta
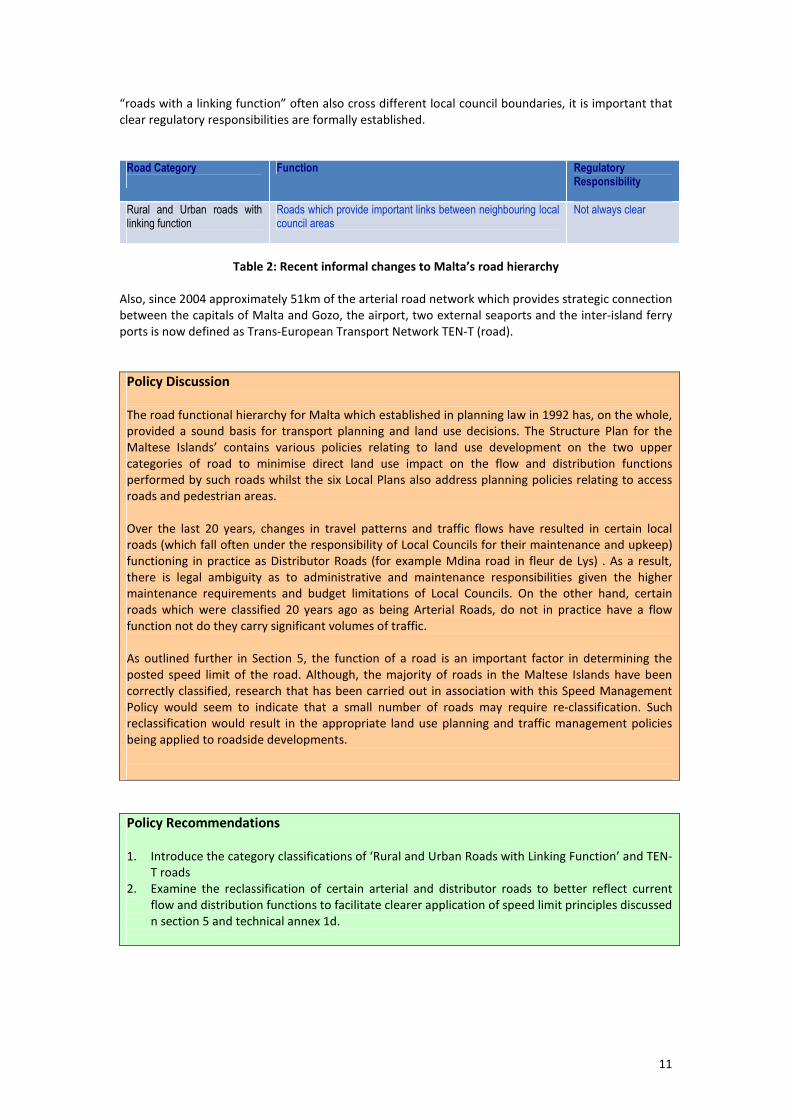
In recent years, the Transport Authority (now Transport Malta) had introduced a new category of
road referred to as ‘rural and urban road with linking function’ for strategic planning purposes only.
This road classification does not currently have a legal base (as do arterial or distributor roads) and, in
many cases, may fall under the responsibility of local councils for maintenance and upkeep. As these
11
“roads with a linking function” often also cross different local council boundaries, it is important that
clear regulatory responsibilities are formally established.
Road Category
Function Regulatory Responsibility
Rural and Urban roads with linking function
Roads which provide important links between neighbouring local council areas
Not always clear
Table 2: Recent informal changes to Malta’s road hierarchy
Also, since 2004 approximately 51km of the arterial road network which provides strategic connection
between the capitals of Malta and Gozo, the airport, two external seaports and the inter-island ferry
ports is now defined as Trans-European Transport Network TEN-T (road).
Policy Discussion
The road functional hierarchy for Malta which established in planning law in 1992 has, on the whole,
provided a sound basis for transport planning and land use decisions. The Structure Plan for the
Maltese Islands’ contains various policies relating to land use development on the two upper
categories of road to minimise direct land use impact on the flow and distribution functions
performed by such roads whilst the six Local Plans also address planning policies relating to access
roads and pedestrian areas.
Over the last 20 years, changes in travel patterns and traffic flows have resulted in certain local
roads (which fall often under the responsibility of Local Councils for their maintenance and upkeep)
functioning in practice as Distributor Roads (for example Mdina road in fleur de Lys) . As a result,
there is legal ambiguity as to administrative and maintenance responsibilities given the higher
maintenance requirements and budget limitations of Local Councils. On the other hand, certain
roads which were classified 20 years ago as being Arterial Roads, do not in practice have a flow
function not do they carry significant volumes of traffic.
As outlined further in Section 5, the function of a road is an important factor in determining the
posted speed limit of the road. Although, the majority of roads in the Maltese Islands have been
correctly classified, research that has been carried out in association with this Speed Management
Policy would seem to indicate that a small number of roads may require re-classification. Such
reclassification would result in the appropriate land use planning and traffic management policies
being applied to roadside developments.
Policy Recommendations
1. Introduce the category classifications of ‘Rural and Urban Roads with Linking Function’ and TEN-
T roads
2. Examine the reclassification of certain arterial and distributor roads to better reflect current
flow and distribution functions to facilitate clearer application of speed limit principles discussed
n section 5 and technical annex 1d.


13
Section 4
Determining the National Speed Limit Regimes
Speed limits are widely used to define acceptable speeds and to indicate the maximum speed for
vehicles to travel so as to be compliant with the law. Set correctly, speed limits can help reinforce
road users’ assessments of a safe speed and can act as an indicator for drivers as to the nature and
risk level associated with the road.
In most countries speed limits specify the maximum safe speed of travel permitted for light vehicles
on a road under ideal conditions. Many countries adopt a two-tier system of national speed limits,
comprising general national speed limits (established by national government) and a variety of local
speed limits. Local speed limits are required where the general speed limits do not correspond to the
appropriate speed on the relevant road or at times where the constantly roadway is in a changeable
environment. These shall be discussed further in Section 5.
Maximum National Speed limits
General speed limits in European countries are normally defined according to one or more of the
following criteria:
• Type of road or environment (e.g. urban road, built up area etc.)
• Type of vehicle (e.g. public transport vehicles, dangerous goods vehicles
• Type of tyres (e.g. special speed limits for studded or solid tyres)
• Type drivers (e.g. probationary drivers)
• Prevailing weather conditions (e.g. rain, snow, fog etc)
Type of Road or Environment
Most countries use differentiated national speed limits according to the road function and the
surrounding environment. As outlined in Section 3 roads forming the national road network are
classified according to function (flow, distribution and access). For the establishment of general
national speed limits the roads are then further categorised according to the type of road (single
carriageway, dual carriageway and motorway) their environment (urban or rural).
In Europe general speed limits for cars inside urban areas are effectively harmonised. However they
vary widely outside urban areas and to some extent on motorways as shown by the table below
Type of Road / Environment
Speed Limit (km/h)
Home zones (often applied as local speed zones) Inside urban areas Outside urban Areas
to
Motorways
to
Table 3: Typical speed limits in European Union Source: adapted from the speed fact sheet 7/10 (2010) European Transport Safety Council

14
Type of Vehicle
The use of differential speed limits for different types of vehicles is an effective tool to improve road
safety and to encourage heavier vehicles to use higher category roads. A typical classification of speed
limits for different types of vehicles normally applies lower speed limits for heavy goods vehicles,
larger public transport vehicles and coupled vehicles. The rationale behind this is that such vehicles,
when fully laden, take a longer distance to stop on the roads. The classification of speed limits by
vehicle type, which has been used in the UK for many years, as summarised below is a good example.
Speed Limits (converted to km)
Outside Built-up Areas
Vehicle type Inside Built
up Area Single Carriageways
Dual Carriageway
Motorways
Cars and motorcycles
48 96 112 112
Cars towing caravans or trailers
48 80 96 96
Buses and coaches
48 80 96 112
Goods vehicles < 7.5 tonnes
48 80 96 112
Goods Vehicles > 7.5 tonnes 48 64 80 96
Table 4: UK National speed limits according to type of road and Vehicle Types Source: UK Department for Transport (2010)
The other criteria for establishing general speed limits at a national level (types of tyre, types of driver
and weather conditions) are less commonly used in European countries.
Types of Tyre
50 years or so ago the use of solid tyres on vehicles was more common. Improvements in tyre
technology has meant that most vehicles use pneumatic tyres today and, in this respect, most
countries prohibit the use of non-pneumatic tyres on public roads for safety reasons.
Types of Driver
Certain countries have introduced lower national speed limits for novice drivers. France, for example,
has introduced a speed limit regime whereby all the mandatory speed limits on single carriageways,
dual carriageways and motorways outside built-up areas are legally reduced by 10 km/h for all drivers
with less than 2 years driving experience. Most countries, however, do not apply differentiated speed
limits based on the type of driver as it is complex and often difficult to enforce. Alternatively, many
countries, apply higher penalty on driving licences to novice drivers for traffic violations compared
with experienced drivers to in order to provide a clear deterrence against speeding by new holders of
driving licences.
Prevailing Weather conditions
Some countries apply differentiated speed limits according to prevailing weather conditions. For
example in France when there is persistent rain mandatory speed limits on single carriageways, dual
carriageways and motorways outside built-up areas speed limits are reduced by 10 km/h for all
drivers. Similarly when there is limited visibility of less than 50 metres, the national speed limit on all
categories of roads in France is reduced to 50 km/h. Again, this is not a common way of differentiating
speeds limits, as the perception of prevailing weather conditions is subjective and hence difficult to
enforce. Most countries nowadays apply Intelligent Transport Systems and deploy variable LED speed
limit signs on main roads which are used to vary speed limits below the national speed limits on
15
stretches of road according to prevailing conditions of travel on that road e.g. rain, snow, fog and
traffic accident ahead etc.
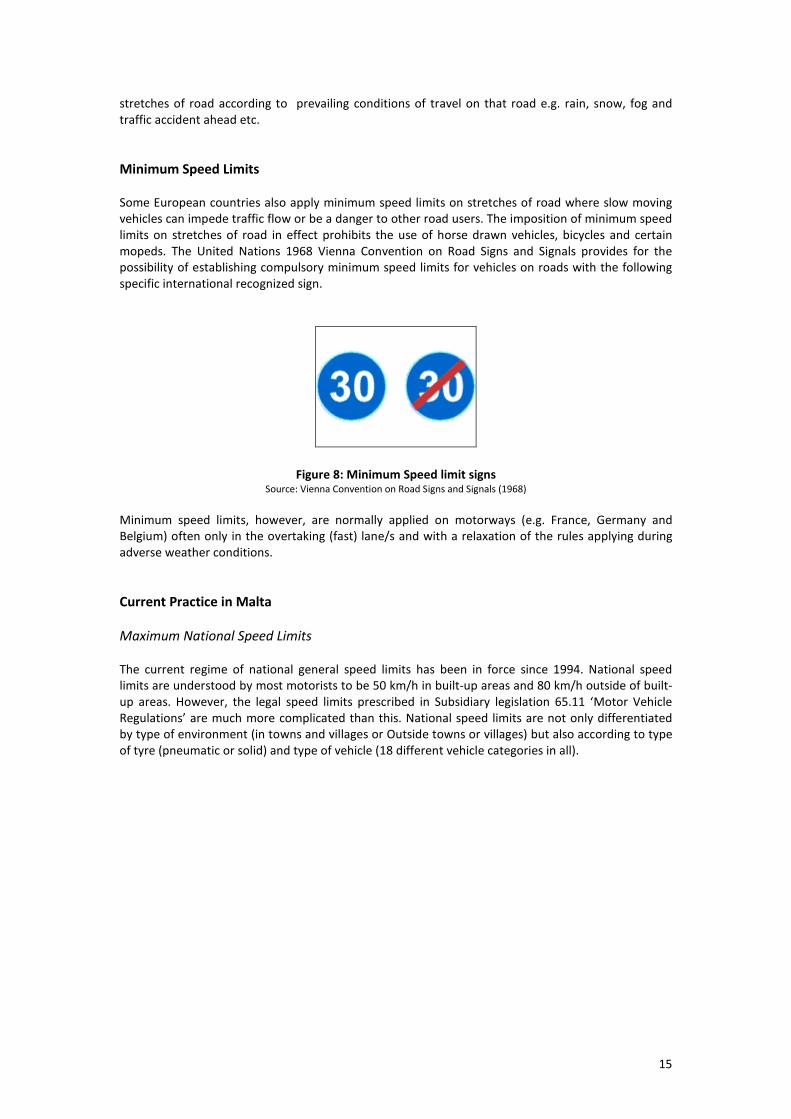
Minimum Speed Limits
Some European countries also apply minimum speed limits on stretches of road where slow moving
vehicles can impede traffic flow or be a danger to other road users. The imposition of minimum speed
limits on stretches of road in effect prohibits the use of horse drawn vehicles, bicycles and certain
mopeds. The United Nations 1968 Vienna Convention on Road Signs and Signals provides for the
possibility of establishing compulsory minimum speed limits for vehicles on roads with the following
specific international recognized sign.
Figure 8: Minimum Speed limit signs Source: Vienna Convention on Road Signs and Signals (1968)
Minimum speed limits, however, are normally applied on motorways (e.g. France, Germany and
Belgium) often only in the overtaking (fast) lane/s and with a relaxation of the rules applying during
adverse weather conditions.
Current Practice in Malta
Maximum National Speed Limits
The current regime of national general speed limits has been in force since 1994. National speed
limits are understood by most motorists to be 50 km/h in built-up areas and 80 km/h outside of built-
up areas. However, the legal speed limits prescribed in Subsidiary legislation 65.11 ‘Motor Vehicle
Regulations’ are much more complicated than this. National speed limits are not only differentiated
by type of environment (in towns and villages or Outside towns or villages) but also according to type
of tyre (pneumatic or solid) and type of vehicle (18 different vehicle categories in all).
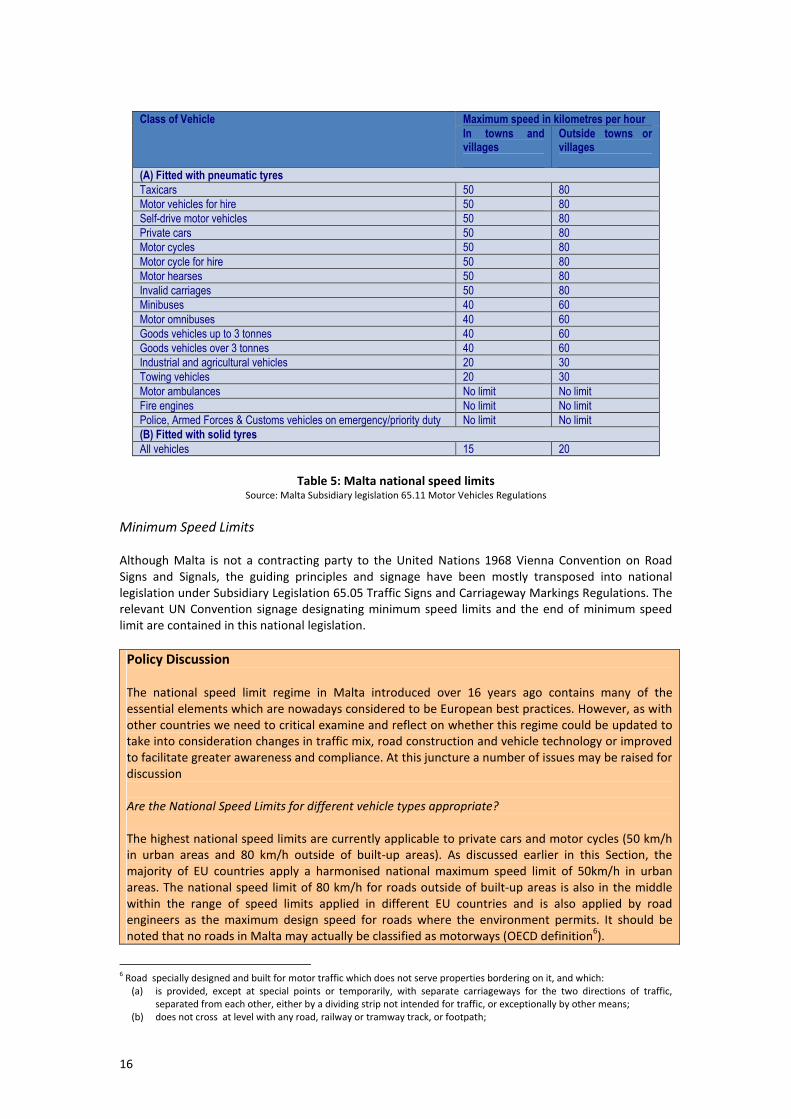
16
Maximum speed in kilometres per hour Class of Vehicle
In towns and villages
Outside towns or villages
(A) Fitted with pneumatic tyres
Taxicars 50 80
Motor vehicles for hire 50 80
Self-drive motor vehicles 50 80
Private cars 50 80
Motor cycles 50 80
Motor cycle for hire 50 80
Motor hearses 50 80
Invalid carriages 50 80
Minibuses 40 60
Motor omnibuses 40 60
Goods vehicles up to 3 tonnes 40 60
Goods vehicles over 3 tonnes 40 60
Industrial and agricultural vehicles 20 30
Towing vehicles 20 30
Motor ambulances No limit No limit
Fire engines No limit No limit
Police, Armed Forces & Customs vehicles on emergency/priority duty No limit No limit
(B) Fitted with solid tyres
All vehicles 15 20
Table 5: Malta national speed limits Source: Malta Subsidiary legislation 65.11 Motor Vehicles Regulations
Minimum Speed Limits
Although Malta is not a contracting party to the United Nations 1968 Vienna Convention on Road
Signs and Signals, the guiding principles and signage have been mostly transposed into national
legislation under Subsidiary Legislation 65.05 Traffic Signs and Carriageway Markings Regulations. The
relevant UN Convention signage designating minimum speed limits and the end of minimum speed
limit are contained in this national legislation.
Policy Discussion
The national speed limit regime in Malta introduced over 16 years ago contains many of the
essential elements which are nowadays considered to be European best practices. However, as with
other countries we need to critical examine and reflect on whether this regime could be updated to
take into consideration changes in traffic mix, road construction and vehicle technology or improved
to facilitate greater awareness and compliance. At this juncture a number of issues may be raised for
discussion
Are the National Speed Limits for different vehicle types appropriate?
The highest national speed limits are currently applicable to private cars and motor cycles (50 km/h
in urban areas and 80 km/h outside of built-up areas). As discussed earlier in this Section, the
majority of EU countries apply a harmonised national maximum speed limit of 50km/h in urban
areas. The national speed limit of 80 km/h for roads outside of built-up areas is also in the middle
within the range of speed limits applied in different EU countries and is also applied by road
engineers as the maximum design speed for roads where the environment permits. It should be
noted that no roads in Malta may actually be classified as motorways (OECD definition6).
6 Road specially designed and built for motor traffic which does not serve properties bordering on it, and which:
(a) is provided, except at special points or temporarily, with separate carriageways for the two directions of traffic,
separated from each other, either by a dividing strip not intended for traffic, or exceptionally by other means;
(b) does not cross at level with any road, railway or tramway track, or footpath;

17
The national speed limits for light goods vans more than 3.0 tonnes g.v.w was specifically changed in
the Maltese law in 2002 from 30 km/h to 40 km/h in urban areas and from 40km/h to 60 km/h
outside of urban areas. The use of 3.0 tonnes g.v.w. to define ‘Light goods vans’ is somewhat
unconventional as the EU vehicle classification system uses 3.5 tonnes to define light commercial
vans (N1 category). Light commercial vans under 3.5 tonnes g.v.w typically carry a payload of less
than 1,000kg; these include the Ford Transit and Peugeot partner and generally meet the same
safety criteria as passenger cars.
Speed radar surveys carried out on a number of different roads in Malta where no speed
enforcement takes place reveals that the average speed of light commercial vans is identical to
average speed of passenger cars. National accident analysis reveals that the number of road traffic
accidents involving light commercial vans is not disproportionate to those involving passenger cars.
With respect to buses, coaches minibuses and heavy goods vehicles the maximum speed limit of
40km/h in urban areas and 60 km/h for outside of built-up areas is deemed to be appropriate given
the relative weights of the vehicles and the extra stopping distances required.
The maximum legal speed limits for Towing Vehicles are 20 km/h for in towns and villages and 30
km/h. Although it is presumed that the legal term ‘towing vehicles’ is intended to mainly cover the
towing of caravans and boat trailers, the inadequacy of the current legislative framework also means
that this definition could be extended to articulated lorries. In this respect, it is fair to comment that
few if any ‘towing vehicles’ in practice actually adhere to a speed limit of 30km/h in free flowing
conditions on roads outside of built up areas.
How do we define ’in and outside towns and villages’?
The current legislative framework does not define the terms ‘in towns and villages’ or ‘outside towns
or villages’. The Vienna Convention on Road Signs and Signals defines "Built-up area" to mean an
area with entries and exits especially sign-posted as such. Some countries use street lighting to
demarcate the urban area boundary. In Malta the application of this definition to apply legal
differentiated speed limits between built-up areas and outside built up areas would, however, give
rise to confusion as a) Local council boundary signposting also incorporates rural roads, b) Nearly all
roads have street lighting c) Urban sprawl and ribbon development over the years has resulted in
most rural roads now having roadside development d) Some upper level arterial and distributor
roads pass through built-up areas but frontages and pedestrian activity are physically separated by
means of footbridges, service roads etc.
In this respect, the only practical solution to clearly distinguish the national speed limits being
applied in urban areas from speed limits applied outside of urban areas would be to use speed limit
signs on all entry points to urban areas.
Should a minimum speed limit be adopted on certain roads?
Many people consider slow drivers to be as much of a road safety hazard as motorists using
excessive or inappropriate speeds. In practice, slow drivers create tailbacks and frustration for other
road users often forcing dangerous overtaking by others. As pointed out earlier in this Section, very
(c) is specially sign-posted as a motorway and is reserved for specific categories of road motor vehicles

18
few countries apply minimum speed limits and those that do in Europe apply such limits only on
inter-urban motorways. The application of minimum speed limits in practice in Malta would be very
difficult to enforce due varying levels of congestion, driver behaviour and high frequency of
intersections. Alternatively, what can be practically applied on the higher level roads would be a
prohibition of certain vehicles and other road users which cannot travel above certain speeds.
Policy Recommendations
1. National speed limit legislation is simplified and revised as follows:
Maximum speed in km / h Class of Vehicle
In Built-up areas Outside Built-up areas
Vehicles under 3.5 tonnes Motor Cycles, Cars (M1 Category), Light Commercial Vans (N1 category)
50 80
Vehicles over 3.5 tonnes Passenger Carrying Vehicles (M2 and M3 categories) Heavy Goods Vehicles (N2 and N3 categories)
40 60
Cars Towing Caravans and Trailers 40 60
Industrial and Agricultural Vehicles 20 30
Emergency Vehicles and Vehicles on Priority Duty No Limit No Limit
2. The boundary defining a “built-up area” shall be determined on a case-by-case basis taking into
consideration the number of dwellings with direct access to the road, type and function of road
and other safety considerations.
3. Each ‘built-up area’ is appropriately signposted on all the entry points;
4. The following categories of vehicles are prohibited from using roads on Arterial roads: horse
drawn vehicles, heavy vehicles which have manufactured design speeds of less than 30 km/h.
5. Prohibit use of certain industrial, plant or agricultural vehicles such as Fork lift trucks and JCBs
on Arterial and Distributor roads
6. Better enforcement of the use of the overtaking lane on certain dual carriageway roads
7. Better promotion and education of the different national speed limits applied to different
vehicle types within and outside built-up areas.

19
Section 5
Setting Local speed Limits
If it were possible to design all roads homogenously in terms of gradients, widths, visibility,
vegetation, bends, junctions and kerbside activity, drivers would immediately chose the appropriate
speed for travelling inside and outside built-up areas. However, no two roads are alike and for the
foreseeable future there will always be situations where there is a discrepancy between different
drivers’ perceptions of the safe travelling speed on a road and the appropriate speed for that road, as
established by theoretical analysis.
A key factor when setting a speed limit is what the road looks like to the road users in terms of its
geometry and adjacent land use. Drivers are likely to expect and respect lower limits, and be
influenced when deciding on what is an appropriate speed, where they can see there are potential
hazards, for example outside schools, in residential areas or villages and in shopping streets.
Strong relationships between design speed, operating speed, and posted speed limit would be
desirable, as these relationships could be used to design and build roads with a certain degree of
consistency. In practice, while the relationship between operating speed and posted speed limit can
be defined, the relationship of design speed with either operating speed or posted speed cannot be
defined with the same level of confidence.
Design Speed of a Road
The process of designing a roadway begins with selecting a speed called the design speed. The road,
street furniture and roadside features are designed according to this selected design speed in
conjunction with a series of tables and figures (See Annex 1).
Operating speeds
At minimum speed limits should reflect an appropriate balance between safety and mobility. On a
road without Posted Speed Limits, a driver will have to rely on his judgement of risk and perception of
hazard in order to determine his safe operating speed. Some hazards may be obvious e.g. vulnerable
road users near schools, tight bends while others less obvious concealed entrances, crest curves, poor
skid resistance. Roads are dynamic structures and changes to the road environment will inevitably
occur after the design and construction of the road. In this respect, there is often a wide discrepancy
between the speed at which a road was originally designed for and the speed at which vehicles on the
road are observed to operate.
The operating speed of vehicles on a section of road is an important factor in establishing safe speed
limits for that road. Most European countries use actual measured speeds, typically the 85th
percentile measured speed (the speed below which 85% of drivers travel in free flow conditions) as
the first step in determining the maximum reasonable and safe Posted Speed Limit. Certain countries,
however, are now moving towards the application the mean speed instead of the 85th percentile
speed as their benchmark.
Posted Speed Limits
The Posted Speed Limit is the actual regulatory sign installed on the road which designates the speed
limit for that road. In practice different countries adopt different technical policies to determine the
Posted Speed Limits on roads within their jurisdiction. A principal aim in determining appropriate
speed limits should be to provide a consistent message between the road geometry and environment
and for changes in speed limit to be reflective of changes in the road layout and characteristics, since
20
these could have changed after the design and construction of the road. In addition to the assessment
of measured speeds on stretches of road, the following important, objective, local factors are also
normally taken into consideration by Traffic Engineers in determining the actual Posted Speed Limit:
• Road function (strategic, through traffic, local access etc.),
• Road geometry (width, sightlines, bends, junctions and accesses etc.),
• Road environment (rural, residential, shop frontages, schools etc.),
• Level of adjacent development,
• Traffic composition (including existing and potential levels of pedestrian and cycle usage),
and
• Road accident rate
In Australia, posted speed limits are normally within 10 km/h of the 85th
percentile operating speeds.
The highway authorities have developed specific software ‘X-limits’ which, after inputting this
localised data, will calculate the appropriate speed limit for the particular stretch of road.
Different countries have different ways of defining posted speed limits on their road networks.
Whatever method is deployed, it is preferable to use a rounded number of the speed limit such as 40,
50, 60, 70 km/h to correspond with the major units on a vehicle’s speedometer.
As a general rule, the minimum coverage length for a particular Posted Speed Limit (e.g. 60km/h)
must be more than 600 metres. Adequate, consistent speed limit signage is critically important to
maintain awareness of the limit and the public support for its application and enforcement.
Transition Zones
Transition zones are required to help drivers adjust their speeds in a gradual manner between points
where the road environment changes for example where a road such as Triq il-Mistra passes through
hilly terrain and local speed reduction is required at the sharp hairpin bends. Road intersections such
as roundabouts and gateways not only perform the function of a road junction but can also physically
slow down traffic to an appropriate speed on the entry points to towns and villages. It is common
practice in many countries to decrease or increase posted speed limits by 20 km/h increments for
example for a speed change from 80km/h to 60km/h.
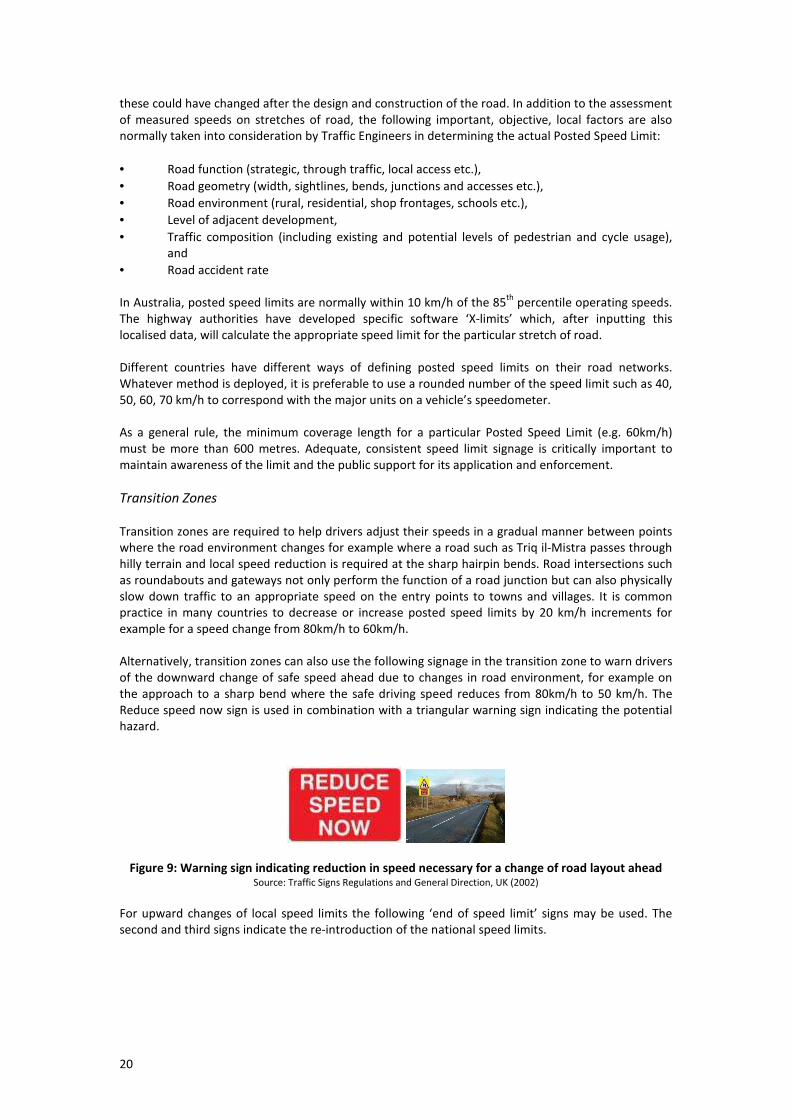
Alternatively, transition zones can also use the following signage in the transition zone to warn drivers
of the downward change of safe speed ahead due to changes in road environment, for example on
the approach to a sharp bend where the safe driving speed reduces from 80km/h to 50 km/h. The
Reduce speed now sign is used in combination with a triangular warning sign indicating the potential
hazard.
Figure 9: Warning sign indicating reduction in speed necessary for a change of road layout ahead Source: Traffic Signs Regulations and General Direction, UK (2002)
For upward changes of local speed limits the following ‘end of speed limit’ signs may be used. The
second and third signs indicate the re-introduction of the national speed limits.

21
Figure 10: Speed Limit Signage Source: Vienna Convention on Road Signs and Signals (1968)
Speed zones
30 km/h zones (often known as ‘home zones’) are used in several European countries, to name a few:
Austria, Ireland Belgium, Denmark, Germany, Ireland, Sweden, United Kingdom (20 mph). Such zones
can be used in single zones where traffic calming is needed or generalised to all zones that display a
common characteristic such as school surroundings. 30km/h zones are normally installed in
residential areas, in roads passing schools and in shopping streets where there is a high conflict level
between motorists and pedestrians or other vulnerable road users. The idea is to slow motor vehicle
speeds to a maximum level of 30 km/h.
Current Practice in Malta
Design speed of roads
Most of the arterial and distributor road network in Malta and Gozo was defined and constructed
prior to the 1970s, at a time when the national legal speed limit for cars travelling outside towns and
villages was set at 40mph (64km/h) and 25 mph (40km/h) within towns and villages. The design of the
main road network was largely determined by the topography of the land and the alignment of the
road was planned in a manner that largely respected existing physical obstructions such as buildings
and fortifications. As a result, there are actually very few long and straight sections of arterial and
distributor road in the Maltese Islands.
Over the years, the rapid growth in urbanization levels has resulted in further building outside urban
areas and linear development along many of the main roads which, when combined with the
environmental and conservation laws, practically preclude the either new provision or re-alignment of
many existing roads in order to conform to the required geometric design parameters for an 80km/h
road (Annex 1) which are taken from the UK Design Manual for Roads and Bridges and which became
mandatory as design standards under Maltese law in 2003.
If we look at Malta’s highest functional level of road the ‘Arterial TEN-T road network’, and
retroactively apply the mandatory standards contained in Annex 1 for the ‘85A design speed
(80km/h)’ it is clear to see that most section of the TEN-T road network falls short of the minimum
design standards for an 80km/h road in terms of on or more of the geometrical design factors.
For example, in order to apply an 80km/h design standard for one of the busiest section of TEN-T
(Regional Road between Kappara and Pembroke), many residential properties adjoining this road
would need to be demolished in order to provide the necessary minimum standards required for
horizontal curvature and super-elevation as illustrated schematically below.. In addition, a design
speed for 80 km/h would necessitate significant realignment of slip roads into environmentally
protected valleys in order to provide the visibility ‘y’ distance of 160m (Annex 1).

22
Figure 11: Malta TEN-T (road) Node EA15 (Kappara) to NA11 (Pembroke) required alignment
changes for 80km/h design speed Source: Transport Malta (2010)

23
Whereas, in the north of Malta where the terrain is hilly and roads follow the steep contours of the
land, the only way in which an 80km/h road design speed can be applied is through the provision of
tunnels and bridges to level out the steep gradients and bends. However, when such measures have
been proposed as part of the upgrade of the TEN-T (for example bypassing Xemxija using a tunnel
through Manikata, or constructing a tunnel and bridge behind Għadira Bay, the transport authorities
at the time had received a strong negative reaction from a wide range of stakeholders and interested
parties.
Posted Speed limits in Malta
In addition to the current national speed limits described in Section 4 the Maltese law7
since 1994 has
empowered the competent highway authority to prescribe a lower speed limit than the national
speed limits in any particular road or area.
Posted Speed Limits started to be introduced on roads from the mid-1990s in what could best be
described as a rather piecemeal and ad hoc manner. Speed limits were usually adjusted downward
from the national speed limits and were posted at specific locations where there was a general
perception of a speeding problem, which could not be resolved in the short term by engineering
measures. Historical road accident statistics for these locations would often indicate frequent serious
injury or fatal road traffic accidents, as for example, the Regional Road Bridge at Msida and the bend
in the Coast Road near Għallis Tower.
The late 1990s saw the promulgation of 35 km/h Home Zones (based on the UK 20 mph ‘Home Zone’
concept) by the then Traffic Control Board which has been successfully introduced in a number of
village cores and traffic sensitive areas.
The introduction of legal design standards in 2003 and the introduction of speed cameras in 2004
resulted in improved analysis of operating speeds and local factors such as road geometry, road
environment, 85th percentile speed measurements, frontage and pedestrian activity prior to the
implementation of Posted Speed Limits
The current Posted Speed Limits for Malta and Gozo are contained in Annex 1)
Policy Discussion
Do we have a comprehensive and effective system of Posted Speed Limits?
Although the national posted speed limit regime system effectively addresses safety concerns and
speeding problems along certain stretches of road, there are other parts of the road network which
fall far short of the standards required. These sections may have one or more of the following
deficiencies.
Some Posted Speed limits indicating reduced local speed limits at bends or other dangerous sections
of road are not cancelled by an ‘end of speed limit’ sign. Without an ‘end of speed limit the local
speed limit restriction would, according to the law, apply until the next posted speed limit. For
example, the stretch of TEN-T network between the outskirts of Mellieħa and Mtarfa has local
speed limits of 30km/h north of junction NA5 in each direction for the dangerous ‘hairpin’ bends but
no further Posted speed limit signage until Xemxija or northbound, thus unrealistically restricting
speed limits to 30km/h for several kilometres in either direction .
Certain stretches of road have frequent changes of posted speed limits whereas international best
practice dictates that Posted speed Limits are not changes within distances of 600metres. The 3km
section of TEN-T road (Regional road) between High Ridge and Msida Valley has no fewer than seven
changes of posted speed limit.
7 Subsidiary Legislation 65.11 Motor Vehicles Regulations

24
Certain roads make unconventional use of non-rounded numbers such as 35km/h and 45 km/h. As
highlighted earlier in this Section, it is undesirable to use non-rounded numbers, as this both
complicates the speed restriction message and, as most vehicle speedometers are graduated at
10km/h intervals and not 5 km/h intervals, making it more difficult for motorists to verify their
operating speeds against the speed limit;
Certain roads do not have local Posted Speed Limits which should according to international best
practice have local speed limits restrictions imposed. For example the road leading to down to Għar
Lapsi has no posted speed limits therefore, as this is considered to be outside of a town or village the
national speed limit of 80km/h would apply. The road is characterized by very tight bends, narrow
carriageway, narrow bridge, inadequate barriers and poor skid resistance. Regular users of this road
normally travel at suitably low safe speeds however, for non-regular users such as tourists without
appropriate local speed limits there is the serious risk of speed misjudgement.
Use of inappropriate Posted Speed Limits on some roads which are well below natural free-flow
operating speeds with no justification. Where certain speed restrictions have been imposed in the
past and not enforced, it is clear that these signs are being blatantly ignored by the majority of
drivers. The use of inappropriately low posted speed limits for no evidently justifiable reason can
create a credibility problem for the competent authority in this important area of road safety.
Who is responsible for establishing or changing speed limits?
In most European countries the role of establishing speed limits is divided between the national
government (which is normally responsible for upper level motorways and arterial roads) and local
authorities (which are responsible for the lower level local roads within their administrative a
boundaries). The national government normally provides the regulatory framework and clear
guidelines for local authorities to following in setting local speed limits. Chapter 499 Article 7(J) of
the Laws of Malta designates Transport Malta as the legal entity responsible for authorizing all road
traffic signs. Local Councils may request a review of certain speed limits within their boundary as
part of a traffic management application.
What system should be adopted to determine local speed restrictions?
There is no harmonised approach in Europe for determining local speed restrictions and each
country has developed is own unique system. Whilst some countries rely exclusively on subjective
opinion based on driving, other countries have developed quite sophisticated scientific ways of
calculating speed limits. These often combine measurements of operating speeds (e.g. mean or 85th
percentile speeds), local factors such as accident levels, road geometry with engineering judgement
and practical observations through driving.
Where is the speed limit announced or published?
For either legal reasons or for the purpose of improving public awareness, most European countries
publish changes to specific speed limits for different sections of road. Notification of these changes
may be through speed limit orders, council notification, gazettes, and newspapers or in simply
documented in the registry of the competent highway authority.
Who is responsible for maintaining database of speed limits and certifying speed limit decision has
been correctly signposted?
Normally it is the competent highway authority
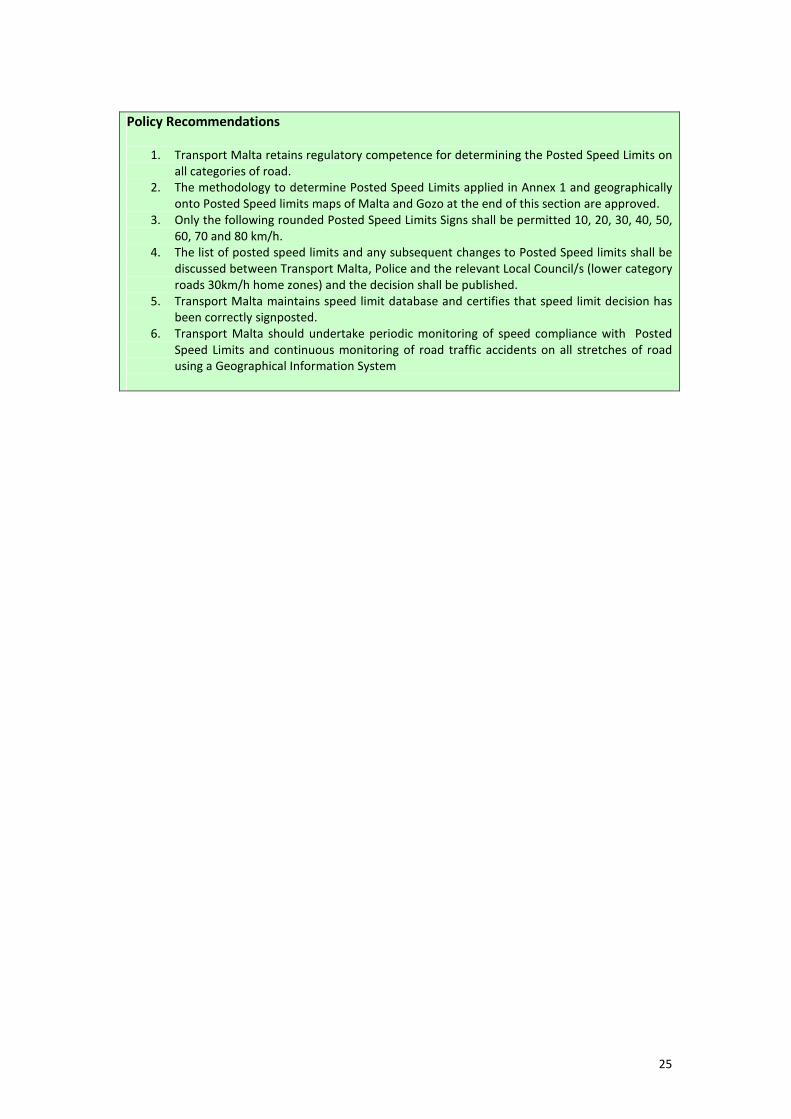
25
Policy Recommendations
1. Transport Malta retains regulatory competence for determining the Posted Speed Limits on
all categories of road.
2. The methodology to determine Posted Speed Limits applied in Annex 1 and geographically
onto Posted Speed limits maps of Malta and Gozo at the end of this section are approved.
3. Only the following rounded Posted Speed Limits Signs shall be permitted 10, 20, 30, 40, 50,
60, 70 and 80 km/h.
4. The list of posted speed limits and any subsequent changes to Posted Speed limits shall be
discussed between Transport Malta, Police and the relevant Local Council/s (lower category
roads 30km/h home zones) and the decision shall be published.
5. Transport Malta maintains speed limit database and certifies that speed limit decision has
been correctly signposted.
6. Transport Malta should undertake periodic monitoring of speed compliance with Posted
Speed Limits and continuous monitoring of road traffic accidents on all stretches of road
using a Geographical Information System
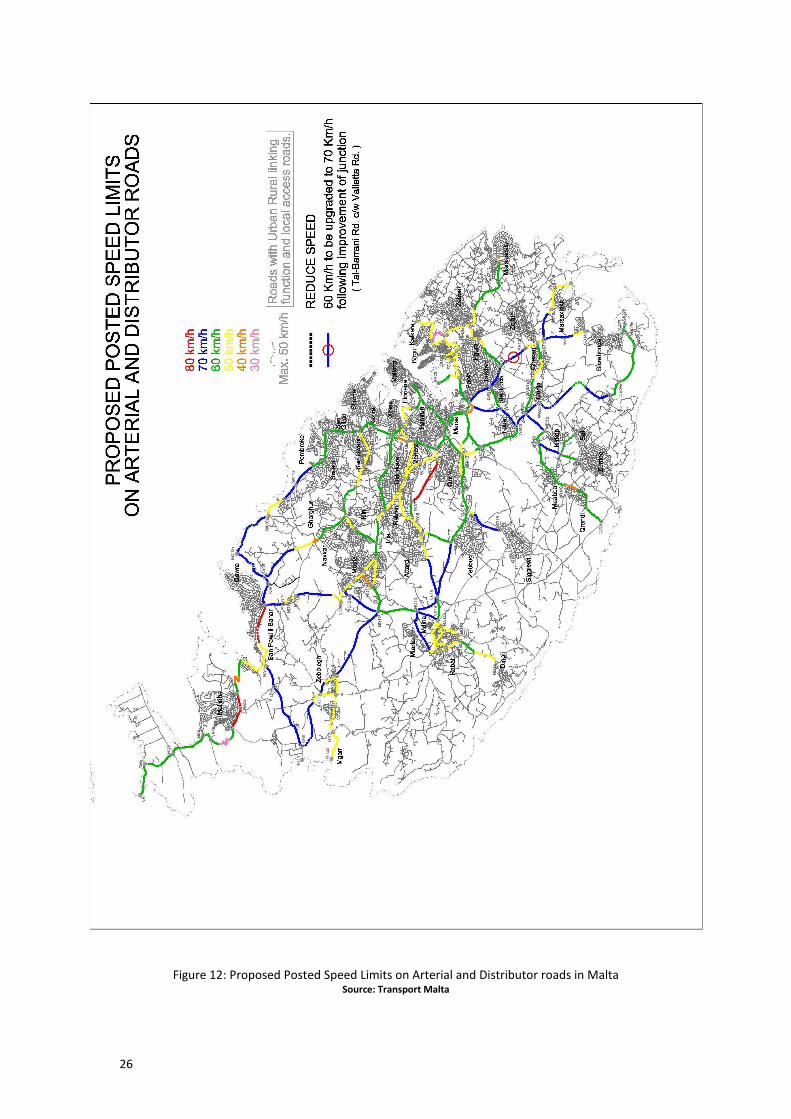
26
Figure 12: Proposed Posted Speed Limits on Arterial and Distributor roads in Malta Source: Transport Malta

27
Figure 13: Proposed Posted Speed Limits on Arterial and Distributor roads in Gozo Source: Transport Malta

28

29
30
Section 6
Making sure people actually know the speed limit in force
Generally speaking, drivers are educated about their county’s national speed limits during the training
and testing associated with obtaining a Driving Licence. This education is reinforced by information
concerning national speed limits at ports, airports and border crossings and the use of Posted Speed
Limit signs on the road network (which in most countries has been harmonised in accordance with the
provisions of the 1968 Vienna Convention on Road Signs and Signals). As discussed in Section 4,
national maximum speed limits may also be differentiated by other specific rules such as: according to
type of vehicle, type of tyre, type of driver, prevailing driving conditions; which makes communication
and provision of information for different road users more difficult. In cases where there are legal
changes to national speed limits it is important to communicate such changes to both existing and
prospective drivers. In this respect usual practice is that formal consultation is carried out with
stakeholder groups and associations representing different categories of drivers, education campaigns
are carried out using media channels and teaching aids for trainee drivers such as the Highway Code
are updated accordingly.
Speed Limit Signage
The use and location of Posted Speed Limits on the road network needs careful consideration so as to
provide a clear and consistent message to drivers, without cluttering the environment with
superfluous driver information. To achieve this aim, the following basic best practices are applied. For
fixed speed limit signage, these should:
• Be clearly visible at day time and night time (in other words should also be retro-reflective);
• Should have minimum diameter of 600mm at start and end of the speed limit restriction,
with the diameter optionally reduced to 300m for repeater signs;
Be installed in such a manner that compliments other important road signage e.g. upcoming
bend or slippery road surface;
• Apply to a length of road not less than 600m before another change in the Posted Speed
Limit;
• Be spaced at the intervals indicated in Table 6 between consecutive signs;
• Have terminal signs located at or as near as practicable to the point where the speed limit
begins or ends:
o For single carriageway roads, on each side of the road in each direction
o For roads with more than one carriageway, on each side of each carriageway where
the relevant speed limit applies.
• Be consistent with speed limits being indicated on variable message signs with clear
indication which signage should take precedence.
At speed transition zones, most European countries decide on the most appropriate procedure for
their national policy frameworks:
• at transitional sections of road with small variations in speed limits e.g. posted speed limit on
a road changing from 50km/h to 60km/h - either display sign indicating ‘end of speed limit’
or a sign indicating the new Posted Speed Limit (see Section 5)
• at transitional sections of road with large variations of speed e.g. from a rural road 80km/h
passing through a village centre 50km/h countries either use graduated increments of 10
km/h to reduce speeds (in this case the distance can be 100m-200m) or use the warning
signage ‘Reduce Speed Now’ (see Section 5).

31
Type of Road Max. distance between consecutive signs on the
same side of the carriageway
Max. distance between consecutive signs on alternate sides of the
carriageway
Max. distance between start/end of length of road to be signed &
first/last repeater
Road over 250 metres in length with 50km/h limit
400m 250m 200m
Road over 350 metres in length with 60km/h limit
500m 350m 250m
Road over 350 metres in length with 70km/h limit
600m 350m 300m
Road over 450 metres in length with 80km/h limit
700m 450m 350m
Table 6: Recommended distances between first / last Posted Speed Limit signs and repeater signs Source: adapted from the Suffolk Constabulary Policies and Procedures, 2006
←100m max→
Major Road (70km/h speed limit)
←100m max→
↑ 20m Max
↓
Minor Road
(50km/h speed limit)
Major Road (50km/h speed limit)
↑ 20m max ↓
Minor Road (60km/h
speed limit)
Figure 14: Examples of best practice in the layout Speed Limit Signage Source: Speed Limits Association of British Drivers (2010)

32
Vehicle Activated Signs
Vehicle Activated Signs (VAS) have been developed to address the problem of widespread
inappropriate speed where conventional signing has not been effective. The signs which have in-built
radars are generally used for two purposes: speed limit compliance and warning of a hazard ahead.
VAS do not target all drivers but are selectively activated by vehicles exceeding the posted speed
limits or a safe speed for a particular hazard. VAS can either be permanently fixed or mobile for use in
different sites where they communicate with drivers in real time when they are travelling at excessive
speeds. VAS are considered to be an effective measure both from an educational; point of view and
from a practical point of view as most motorists heed the warning and lower their speeds.
Figure 15: Examples of Vehicle Activated Signage Source: Internet (not specific)
Road Markings
Road markings also perform an important function in influence the driver’s choice of speed. They
serve to guide motorists for example through lane delineation, they inform drivers about traffic
regulations e.g. parking, overtaking etc, they can give advance warning of changes in road alignment
ahead and they can be used to change speed perception by giving the impression of narrowing the
road carriageway.
In addition to signage displayed alongside a road to indicate speed limits, certain carriageway
markings must be varied according to the speed limit of the road. Three types of marking depend if
the speed limit exceeds 60km/h as follows:
• centreline markings to divide traffic proceeding in opposite directions where there are no
specific hazards
• centreline markings to divide traffic proceeding in opposite directions where it is dangerous
to cross the centre of the carriageway
• markings dividing traffic into lanes on multi-lane roads where traffic in two or more lanes is
travelling in the same direction.
The type of line markings required are as follows:
Type of Road Markings Speed more than 60km/h Speed less than 60km/h
Normal centreline 3m mark and 6m gap 2m mark and 4m gap
Hazard centreline 6m mark an 3m gap 4m mark and 2m gap
Divide traffic lanes 2m mark and 7m gap 1m mark and 5m gap
Table 7: Layout of road markings Source: UK Department for Transport (2006)
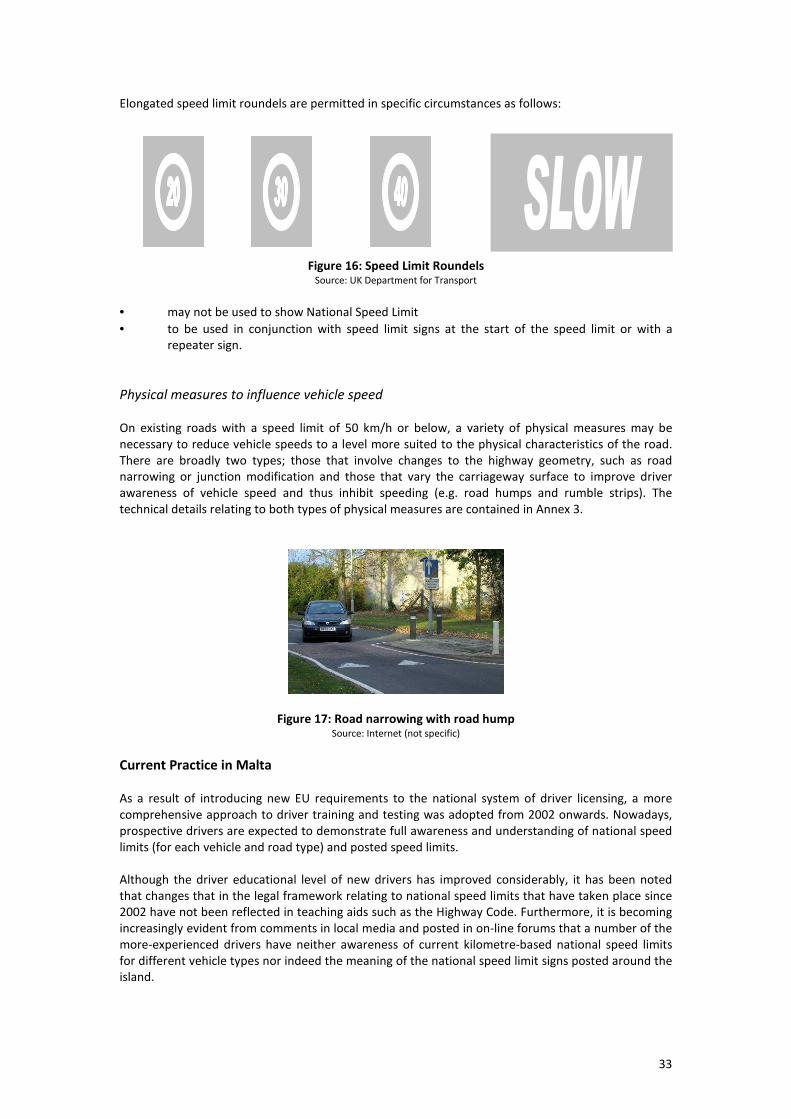
33
Elongated speed limit roundels are permitted in specific circumstances as follows:
Figure 16: Speed Limit Roundels Source: UK Department for Transport
• may not be used to show National Speed Limit
• to be used in conjunction with speed limit signs at the start of the speed limit or with a
repeater sign.
Physical measures to influence vehicle speed
On existing roads with a speed limit of 50 km/h or below, a variety of physical measures may be
necessary to reduce vehicle speeds to a level more suited to the physical characteristics of the road.
There are broadly two types; those that involve changes to the highway geometry, such as road
narrowing or junction modification and those that vary the carriageway surface to improve driver
awareness of vehicle speed and thus inhibit speeding (e.g. road humps and rumble strips). The
technical details relating to both types of physical measures are contained in Annex 3.
Figure 17: Road narrowing with road hump Source: Internet (not specific)
Current Practice in Malta
As a result of introducing new EU requirements to the national system of driver licensing, a more
comprehensive approach to driver training and testing was adopted from 2002 onwards. Nowadays,
prospective drivers are expected to demonstrate full awareness and understanding of national speed
limits (for each vehicle and road type) and posted speed limits.
Although the driver educational level of new drivers has improved considerably, it has been noted
that changes that in the legal framework relating to national speed limits that have taken place since
2002 have not been reflected in teaching aids such as the Highway Code. Furthermore, it is becoming
increasingly evident from comments in local media and posted in on-line forums that a number of the
more-experienced drivers have neither awareness of current kilometre-based national speed limits
for different vehicle types nor indeed the meaning of the national speed limit signs posted around the
island.
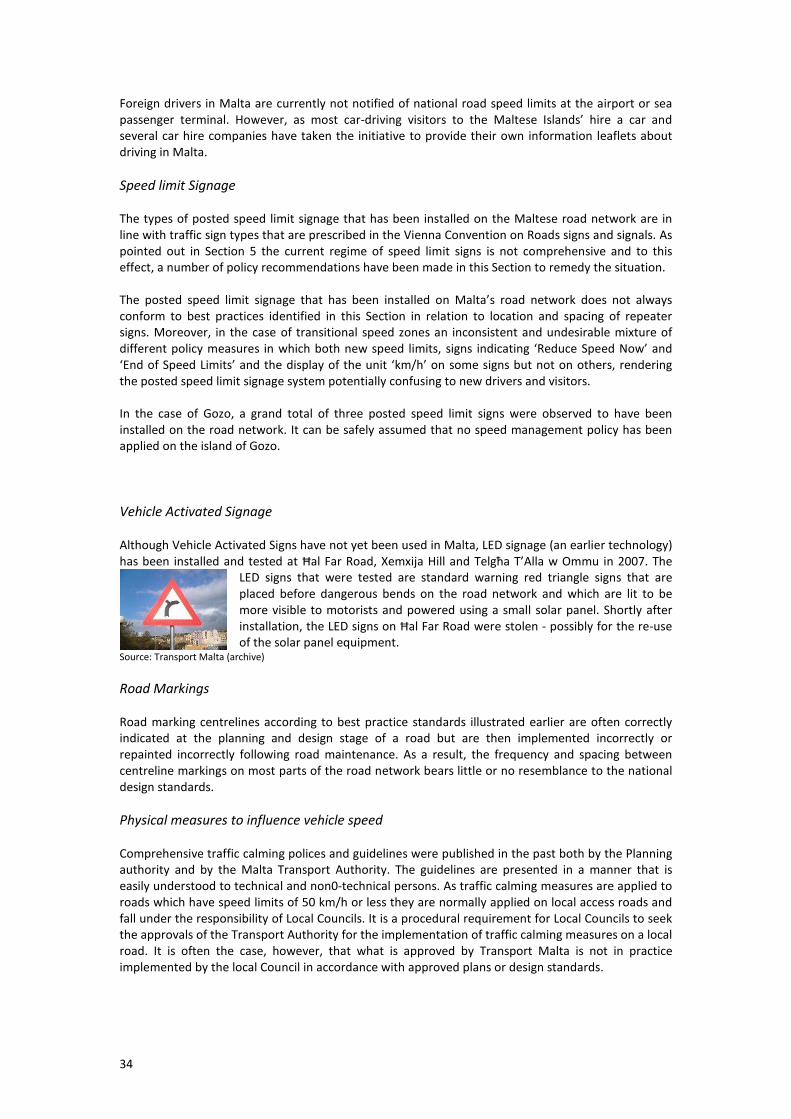
34
Foreign drivers in Malta are currently not notified of national road speed limits at the airport or sea
passenger terminal. However, as most car-driving visitors to the Maltese Islands’ hire a car and
several car hire companies have taken the initiative to provide their own information leaflets about
driving in Malta.
Speed limit Signage
The types of posted speed limit signage that has been installed on the Maltese road network are in
line with traffic sign types that are prescribed in the Vienna Convention on Roads signs and signals. As
pointed out in Section 5 the current regime of speed limit signs is not comprehensive and to this
effect, a number of policy recommendations have been made in this Section to remedy the situation.
The posted speed limit signage that has been installed on Malta’s road network does not always
conform to best practices identified in this Section in relation to location and spacing of repeater
signs. Moreover, in the case of transitional speed zones an inconsistent and undesirable mixture of
different policy measures in which both new speed limits, signs indicating ‘Reduce Speed Now’ and
‘End of Speed Limits’ and the display of the unit ‘km/h’ on some signs but not on others, rendering
the posted speed limit signage system potentially confusing to new drivers and visitors.
In the case of Gozo, a grand total of three posted speed limit signs were observed to have been
installed on the road network. It can be safely assumed that no speed management policy has been
applied on the island of Gozo.
Vehicle Activated Signage
Although Vehicle Activated Signs have not yet been used in Malta, LED signage (an earlier technology)
has been installed and tested at Ħal Far Road, Xemxija Hill and Telgħa T’Alla w Ommu in 2007. The
LED signs that were tested are standard warning red triangle signs that are
placed before dangerous bends on the road network and which are lit to be
more visible to motorists and powered using a small solar panel. Shortly after
installation, the LED signs on Ħal Far Road were stolen - possibly for the re-use
of the solar panel equipment. Source: Transport Malta (archive)
Road Markings
Road marking centrelines according to best practice standards illustrated earlier are often correctly
indicated at the planning and design stage of a road but are then implemented incorrectly or
repainted incorrectly following road maintenance. As a result, the frequency and spacing between
centreline markings on most parts of the road network bears little or no resemblance to the national
design standards.
Physical measures to influence vehicle speed
Comprehensive traffic calming polices and guidelines were published in the past both by the Planning
authority and by the Malta Transport Authority. The guidelines are presented in a manner that is
easily understood to technical and non0-technical persons. As traffic calming measures are applied to
roads which have speed limits of 50 km/h or less they are normally applied on local access roads and
fall under the responsibility of Local Councils. It is a procedural requirement for Local Councils to seek
the approvals of the Transport Authority for the implementation of traffic calming measures on a local
road. It is often the case, however, that what is approved by Transport Malta is not in practice
implemented by the local Council in accordance with approved plans or design standards.

35
Figure 18: Photographs showing traffic calming measures applied correctly and incorrectly
Source: Transport Malta (archive)
Policy Discussion
Should we continue to use this sign to indicate the national speed limits?
Although this sign is contained in the Vienna Convention for Road Signs and Signals it is only used in
a limited number of European countries; namely: UK and Ireland to signify end of a local speed limit
and re-introduction of the national speed limit on a stretch of road.. Other countries, especially
countries with road border crossings, choose to display the actual national speed limit in figures.
Which road signage policy is best suited for Malta’s road network in speed transition zones?
The most effective speed signage is that which presents a clear and consistent message to drivers
without cluttering the road environment. The road network in Malta and Gozo is characterized by
frequent intersections and changes in the road environment.
• Downward change in speed limit - it may be impractical to deploy the policy option for the
downward change in using posted speed signage displaying incremental speed reductions
up to the start of the section of road where the actual lower speed restriction should apply.
The use of the ‘Reduce Speed Now’ sign placed at intervals on the approach to the lower
speed section would provide a simpler and clearer solution given the short distances
between changes of speed limits.
• The other policy option choice in speed transition zones relates to the use of ‘end of speed
limit’ signs or simply display the new speed limit sign .
Can Vehicle Activated Signs be effective in Malta?
Vehicle Activated Signs are proven to be very effective devices to increase the awareness of drivers
in relation to their use of excessive speed at a particular. VAS needs to be selectively sited at
locations where there is use of inappropriate speed, where there are hazards such as tight bends,
adverse camber etc. or where there is an actual or perceived risk of traffic accidents. In Malta there
are several locations where installation of speed camera devices, using objective assessment criteria
(see section 8), may not be justified and the installation of VAS may effectively address road safety
problems. However, it is important that appropriate precautionary measures are taken to prevent
VAS from being vandalised or stolen and that public awareness of their safety benefits is promoted
prior to their installation.
� � �
36
Policy Recommendations
1. Replace all national speed limit signs with posted speed limits displaying the actual maximum
speed as a number
2. In speed transition zones use only ‘Reduce Speed Now’ signs in combination with triangular
warning signs and the actual posted speed limit at location where the speed limit actually
applies.
3. Explore the technical feasibility of Malta becoming a contracting party to the UN 1968 Vienna
Convention on Road Signs and Signals
4. Introduce Vehicle Actuated Signs (fixed and mobile) at key locations for example before or after
existing fixed speed cameras as an information / educational measure and as a counter measure
to the kangaroo effect’ (see section 8), on approaches where local speed reduction is required
before sharp bends, pedestrian crossings etc. Installation should be accompanied by
appropriate public awareness campaigns on the purpose and road safety benefits of VAS.
5. Transport Malta to audit road markings and traffic management and calming measures to verify
compliance with government standards
6. Transport Malta to introduce greater accountability amongst other entities responsible for
undertaking road markings and constructing traffic control measures. All works should be signed
off by a warranted Architect and Civil Engineer in the form of a completion certificate.

37

38
Section 7
Informing and educating the drivers about speed and speed
management
The success of a speed management policy will depend overwhelmingly on the acceptability of the
community and community decision makers. Speed is a highly controversial issue. Although there may
be clear evidence that speed and speeding are problematic, it is vital that speed management
policies, which by their nature necessarily restrict driving behaviour and driving choices, are well
managed and so as not to be ignored.
Education, training and information are all essential to the success of a comprehensive speed and
speed management policy. They are also a pre-requisite for other measures to be effective such as
infrastructure, signage, road makings, enforcement and vehicle technology.
Speed management is an area of road safety for which there is often joint regulatory responsibility:
the politician for legislating and approval of actions, the roads authority level (central and local) for
the physical implementation of speed management measures, the driver licensing authority for the
training and testing of drivers and the traffic police level for enforcement of speed limits and driving
behaviour. Responsibility for speed management does not, however, stop with the public authorities
and there are several other important stakeholders including media, insurance companies, schools,
researchers, motoring and other associations, all of which can help promote speed management
policies and greater awareness of road safety.
Education of children
Unlike other areas of road safety education taught at schools, school children are not in position to
directly influence the speed of motorists. On the other hand, children are directly affected by the risks
from motor vehicles being driven at speed, particularly near there home, where they play or on route
to school. At a young age, their behaviour can be unpredictable in the road environment. Speed
management programmes are therefore particularly important in sensitive areas such as near
schools, playgrounds and in residential zones.
The educational technique used at schools is largely dependent on age group and is usually structured
accordingly. Basic road safety can be taught using visual aids, toys and road safety games for very
young children. Education about crossing the roads, safer routes to school, using bicycles and motor
scooters at is often delivered at secondary school level. Finally the use of speed (as a driver) is taught
as part of road safety education for prospective motorists in the final year of secondary as well as at
post-secondary schooling.
Driver Training
There are a number of European Union directives that aim to standardise and harmonise the testing
and licensing of prospective drivers of different vehicle categories. The EU driving test assesses a
driver candidate’s level of theoretical knowledge on speed and speed limits and the control of the
vehicle under different road environments at different speeds in the practical test (see Section 5).
However, currently EU member states are allowed full discretion regarding legal requirements for
training before (and after) the test for a driving licence is mandatory. Some EU countries such as the
UK apply the traditional mandatory test-only approach. Many EU countries apply the mandatory test
plus pre-test driving school model in which a minimum amount of formal driving instruction is
required before becoming eligible to sit for a driving test. Young car drivers (18 to 25 year olds)
account for 27% of the total number of car drivers killed across the EU. A number of non-EU countries
(e.g. Australia, Canada, USA and New Zealand) have introduced probationary periods in which novice
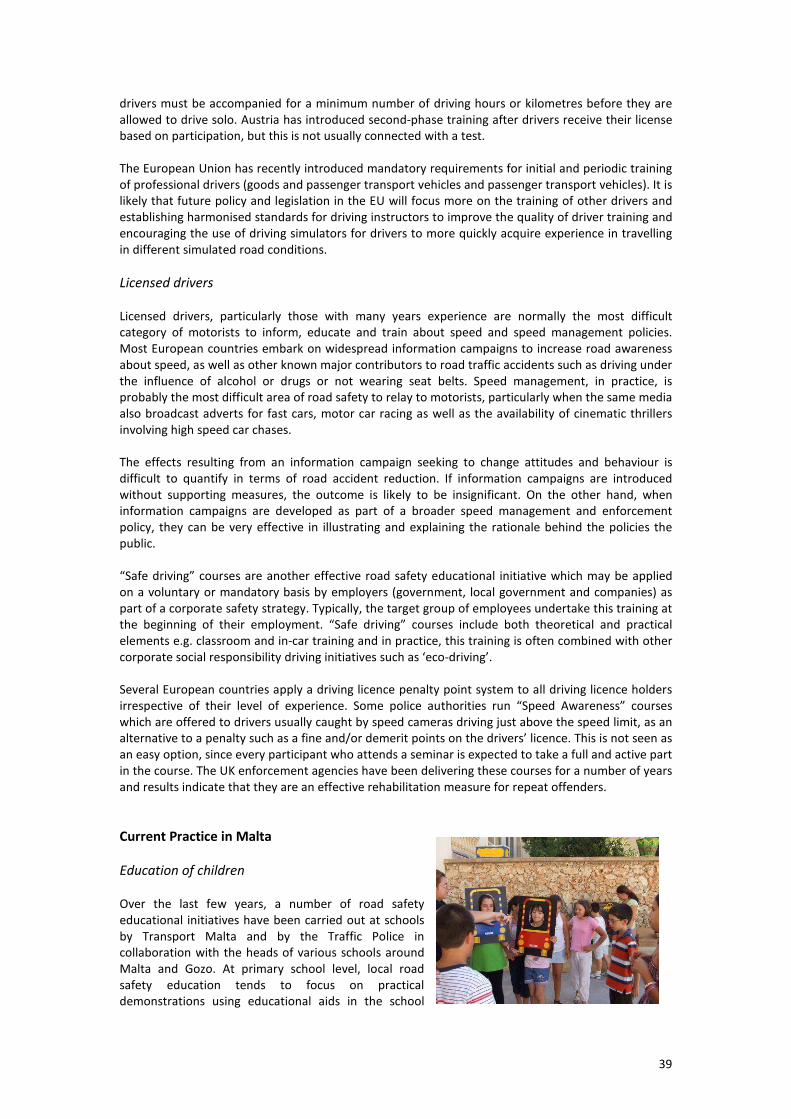
39
drivers must be accompanied for a minimum number of driving hours or kilometres before they are
allowed to drive solo. Austria has introduced second-phase training after drivers receive their license
based on participation, but this is not usually connected with a test.
The European Union has recently introduced mandatory requirements for initial and periodic training
of professional drivers (goods and passenger transport vehicles and passenger transport vehicles). It is
likely that future policy and legislation in the EU will focus more on the training of other drivers and
establishing harmonised standards for driving instructors to improve the quality of driver training and
encouraging the use of driving simulators for drivers to more quickly acquire experience in travelling
in different simulated road conditions.
Licensed drivers
Licensed drivers, particularly those with many years experience are normally the most difficult
category of motorists to inform, educate and train about speed and speed management policies.
Most European countries embark on widespread information campaigns to increase road awareness
about speed, as well as other known major contributors to road traffic accidents such as driving under
the influence of alcohol or drugs or not wearing seat belts. Speed management, in practice, is
probably the most difficult area of road safety to relay to motorists, particularly when the same media
also broadcast adverts for fast cars, motor car racing as well as the availability of cinematic thrillers
involving high speed car chases.
The effects resulting from an information campaign seeking to change attitudes and behaviour is
difficult to quantify in terms of road accident reduction. If information campaigns are introduced
without supporting measures, the outcome is likely to be insignificant. On the other hand, when
information campaigns are developed as part of a broader speed management and enforcement
policy, they can be very effective in illustrating and explaining the rationale behind the policies the
public.
“Safe driving” courses are another effective road safety educational initiative which may be applied
on a voluntary or mandatory basis by employers (government, local government and companies) as
part of a corporate safety strategy. Typically, the target group of employees undertake this training at
the beginning of their employment. “Safe driving” courses include both theoretical and practical
elements e.g. classroom and in-car training and in practice, this training is often combined with other
corporate social responsibility driving initiatives such as ‘eco-driving’.
Several European countries apply a driving licence penalty point system to all driving licence holders
irrespective of their level of experience. Some police authorities run “Speed Awareness” courses
which are offered to drivers usually caught by speed cameras driving just above the speed limit, as an
alternative to a penalty such as a fine and/or demerit points on the drivers’ licence. This is not seen as
an easy option, since every participant who attends a seminar is expected to take a full and active part
in the course. The UK enforcement agencies have been delivering these courses for a number of years
and results indicate that they are an effective rehabilitation measure for repeat offenders.
Current Practice in Malta
Education of children
Over the last few years, a number of road safety
educational initiatives have been carried out at schools
by Transport Malta and by the Traffic Police in
collaboration with the heads of various schools around
Malta and Gozo. At primary school level, local road
safety education tends to focus on practical
demonstrations using educational aids in the school

40
playgrounds which practically illustrate the potentials of playing near roads.
At secondary schools, road safety classroom lessons are often accompanied by practical exercises for
children, for example cycling or the use of puzzles and quizzes, as tools designed to increase
awareness and interest of children in various aspects of road safety.
Figure 19: Overall, the road safety education carried out at various schools Source: Transport Malta (archive)
Driver Training
Following the introduction of new EU requirements to the national system of driver licensing, a more
comprehensive approach has been adopted for the testing of prospective drivers. A harmonised
syllabus was introduced which sets out all the various subjects that could be tested in the practical
test of skills and behaviour as well as in the driver theory test.
Driver training continues to be vitally important in order to relay the necessary road environment
awareness and car handling skills. National legislation was amended in 2007 requiring all professional
Driving Instructors to pass a theory examination; a driving ability and fitness test and to demonstrate
ability to instruct candidates (on average 20-30 a year) prior to being licensed by Transport Malta as
instructors. It is intended that a continuing ability test for the 180 incumbent driving instructors be
deployed, since it is evident that the standard of instruction by currently licensed instructors is
variable. However this test has not yet been organised.
Literature is also available for novice drivers to read and learn about signage, road markings and
general rules of the road in Malta, however very little is yet available in the Maltese language.
Malta has also recently introduced the EU mandatory requirements for all drivers of goods and public
transport vehicles (driver licence categories C and D) to be certified as being professionally competent
to work in this vocational area. All drivers who passed a category D driving test after 10th September
2008 or a category C test after 10th September 2009 are then required to be certified with an initial
qualification following successful completion of further theoretical and practical tests. As part of the
same EU initiative all professional drivers (including those incumbent drivers who were not required
to sit for the initial qualification) are required to undergo 35 hours of periodic training at least every
five years.
The mandatory initial qualification and periodic training requirements for professional competence
certification provides further opportunity for education of all heavy goods and passenger transport
vehicle drivers on important areas such as national speed limits, appropriate speeds for different road
conditions and speed management.
41
Licensed Drivers
The mandatory periodic training for professional drivers will help to keep professional drivers updated
and informed about road safety issues. The vast majority of drivers, however, are private drivers using
personal and smaller vehicles such as cars and motorcycles and do not fall within the scope of this EU
training initiative. In this respect, increasing public awareness of the speed management aspect of
road safety through education campaigns and other initiatives at a national level will remain
important.
In the last five years, very little positive public education has taken place in relation to driver speed as
a problem and enforcement of speed as a potential solution. As a result, the public and media have
largely been left to debate the issues often subjectively based on personal experiences and pseudo-
scientific assumptions, in the main part, rather devoid of objective content or facts. This Speed
Management Policy introduces the issues relating to speed management in a structured way, and sets
out the policies and practices that are required to be adopted to create a comprehensive framework
for this vital aspect of road safety. The issues being raised in each section of this policy document, will
therefore, need to be relayed to the public through an effective media strategy so as to increase the
public understanding of the complexity of the road safety landscape and thus increase public
acceptability of policy decisions and measures that may be taken as a result of the adoption by
government of the Speed Management Policy.
Policy Discussion
Should road safety education become part of the school curriculum?
All school children will eventually become road users from being pedestrians and cyclists to
becoming drivers. Road safety education during a child’s formative years will help increase his / her
awareness of potential dangers on the road throughout his adolescence and hopefully into
adulthood. The carrying out various experimental road safety educational initiatives in different
schools in Malta has so far been positively received and it would seem that what has been piloted in
a limited number of schools could be formally transferred to a national level with different
educational courses being set up for different age groups.
Can we make driver learning more interesting even before getting into a car?
In today’s world there are many interesting learning aids that can be used persons approaching the
eligible age to start driver training. These include inter-active web-sites where you can learn and test
yourself on aspects of the highway code, driving simulators, thematic quizzes and driving videos that
could be shown to classes at the Junior colleges, MCAST and the University which can certainly make
driver training and education more interesting to the candidate.
Should newly qualified drivers require to accompaniment for a limited period
Although this is not an EU mandatory requirement, several countries require new drivers to be
accompanied by a more experienced driver for the first few weeks and are required to use a special
‘L’ plate for designation as novice drivers for a fixed period before being allowed to drive solo drive.
It is envisaged, however, that in practice this initiative is probably difficult to ensure compliance with
and violations are only detected when stopped by the police in connection with other violations. In
saying this, a newly qualified driver will very often find himself in a driving situation or scenario that
he has not experienced during his driver training e.g. traffic light power outage and would benefit
from being given instruction by a more experienced driver until he gains confidence.
How can the Media help in Road Safety Education?

42
Media can play a vital role in increasing awareness on issues in road safety, if the correct messages
are being brought across in the public domain in an interesting and thought provoking manner.
Alternatively, the media can effectively undermine road safety policy objectives and measures if
media producers, journalists and opinion makers do not understand the rationale behind policy
objectives or do not agree with the policy measures. It is, therefore, critical for the authorities
responsible for road safety to be in a position to back up all policy decisions measures, with
objective facts and statistics and for these to be clearly communicated before policy measures are
implemented.
The problem of speeding - What makes a successful education and information campaign?
The most successful education and information programmes encompass the logical basis of the
speed limit system and the reasons for speed management measures, highlighting the positive
safety outcomes of these measures, as well as other benefits e.g. reductions in noise, air pollution.
Countries generally rely on information campaigns, e.g. by billboards alongside the road or messages
on television. Information campaigns are indispensable when used to support other measures but
will have little effect if they are applied as a stand-alone measure. The production and dissemination
of information should be a continuous activity and should, in particular, precede and accompany
speed enforcement initiatives. There is much debate over the effectiveness of ‘fear-inducing’
messages versus the softer approach. Although, there is no definitive study to conclude which
approach is more effective, there would seem to be common agreement that there is a strong
relationship between the arousal of fear and the convincing power of message especially that which
has a strongly stated solution.
Policy Recommendations
1. Discuss with education authorities the feasibility of establishing Road Safety as part of the
national learning curriculum.
2. Competent authority to prepare educational video for sixth-formers regarding road safety and
the driving test.
3. Competent authority to invest further in road safety educational material and tools
4. Introduce continued ability test for existing Driving instructors
5. Establish and pilot a safe driving course model for Government employees with transferability
potential to private sector.
6. Carry out pilot study into new driver accompaniment.
7. Hold information session for the media in order to discuss and explain speed policies initiatives
and measures (i.e. national speed limits, the setting of local speed limits, use of variable
message signs, traffic calming and other engineering measures, speed enforcement through
fixed and mobile cameras).
8. Appoint media experts to plan a long-term programme of media campaigns relating to speed
management and other road safety issues.

43
44
Section 8
Enforcing to control the intentional speeder
In a perfect world, speed limits on roads would be credible and self explanatory and motorists, in full
cognisance of the consequences of using excessive or inappropriate speeds, would readily adhere to
safe driving speeds at all times and in all conditions. However, in the real world it is a fact that a high
percentage of motorists regularly exceed the posted speed limits either inadvertently or knowingly
and deliberately. It is an unfortunate fact, however, that it is only drivers who subsequently to
travelling at excessive or inappropriate speeds and who have killed or injured other people change
both their driving behaviour and their views about speed management.
Enforcement can be both an effective educational tool and, if approached appropriately, can also be a
powerful measure contributing directly to the reduction of speeding and associated traffic accidents,
injuries and fatalities.
Enforcement is based on the psychological premise that most people will try and avoid the legal
penalty of not complying with the rules. This premise is reinforced by the actual amount of
enforcement carried out and the level of penalties and fines applied to offenders. The objective risk of
apprehension based on the likelihood of being caught and prosecuted is in itself a deterrent which
effectively ensures compliance with the rules by most drivers. The subjective risk of apprehension can
be increased by the use of publicity campaigns and increase media awareness.
Until the time when compliance with the speed limits is enforced via on-board instruments, speed
enforcement using roadside equipment or by mobile enforcement personnel will continue to be main
process. Targeting roads which have a poor safety record or where there is a perceived risk of danger
from motorists and speed enforcement is important; however this enforcement should take place on
all categories of road.
Speed Enforcement Systems and Equipment
In all cases, the burden of proving the actual speed and linking the speed to the offending driver rests
with the enforcement body Evidence will include:
• the identity of the driver;
• evidence of the speed limit;
• verifiable evidence of the speed alleged, including visual observations;
• the type of equipment used;
• the fact that the equipment was certified as accurate (by a secondary speed measurement
device verified periodically);
• any explanation offered by the driver (not essential);
• environmental conditions e.g. traffic, weather and road conditions (relevant although not
essential).
Conventional manual speed enforcement
With the increase in the burden of proof on the enforcement bodies outlined above, traditional speed
enforcement tools (which in the past include stopwatches, pneumatic tubes and radar guns) have
over the past 15 years gradually been taken over by a new generation of intelligent speed detection
equipment which provides real-time photographic proof of the infringement.
Mobile police squads were the first to be equipped with video camera-based laser or radar detection.
Police cars (often unmarked) equipped with this speed enforcement equipment, drive around an
enforcement area e.g. between two intersections on a motorway or within an urban area on the

45
lookout for major infringements such not stopping at red lights or driving at high speed. The vehicle is
followed and stopped, and the video footage which displays the travelling speed of the vehicle in
question is then used as evidence for the prosecution. Nowadays the only advantage that manual
speed enforcement has over automatic speed enforcement is that it can enforce speeds of different
vehicle types which, in certain jurisdictions, may have legally differentiated national speed limits.
In addition, it is not uncommon for footage from Urban Traffic Control CCTV systems to be used to
assist enforcement bodies in the prosecution of motorists alleged to be dangerously driving or using
inappropriate or excessive speed.
Automatic speed enforcement
As the phrase implies automatic speed enforcement is generally carried out without with little
manpower required to operate the equipment. Most speed camera systems today automatically
detect the speed offence during day or night (using infra-red technology or loops), register the traffic
offence, register the number plate of the vehicle on site and then transfer the data electronically to a
centre for automated information processing in which Automatic Number Plate Recognition (ANPR)
software is used to match the registration number plate on the photograph with the vehicle
registration database and then to issue an automated infringement notification.
Automatic speed enforcement is by far the most cost-effective means of enforcing speed limits on
roads. The EU-financed research project ‘VERA’ (Video enforcement for Road Authorities) in 2000
estimated the typical cost of issuing a speed fine to be €80 per fine using the manual enforcement
system compared with €12 per fine using an automated fixed camera system.
The main disadvantages of automated speed enforcement are vandalism and the lack of personal
communication associated with manual enforcement which can have an educational benefit towards
the offending motorist. In countries that legislate different national speed limits for different types of
vehicles automated speed enforcement systems also have the disadvantage that they generally do
not easily differentiate between speeds of different vehicles and are generally set at the maximum
national or posted speed limit speed for passenger cars. However, it is understood that new models
of fixed speed camera can now distinguish between a large vehicle and a car or light goods vehicle.
There are three main types of automated speed cameras in operation across Europe.
a) Fixed speed cameras
b) Mobile speed cameras
c) Average speed cameras
Fixed Speed Cameras
Fixed speed cameras are used to deter drivers from speeding in places where there has been a history
of collisions involving death or injury, where speeding is perceived to be a potential risk in
combination with red light violation detection. Fixed Speed Cameras only measure vehicle speed at a
specific location and work independently of each other. Spot speed cameras can cover a number of
traffic lanes and may be installed to measure vehicle speeds for both directions of vehicle flow.
Mobile Speed Cameras
Mobile speed cameras work on the same principle as fixed speed cameras but are usually place on
tripods or housed in the back of an enforcement van. Mobile cameras have the advantage that can be
moved relatively easily around the road network decreasing the predictability of enforcement
associated with fixed camera sites.
As pointed out earlier in this Section, the combination of fixed and mobile cameras is considered to be
the most effective solution in terms of improving compliance with speed limits and reducing the level
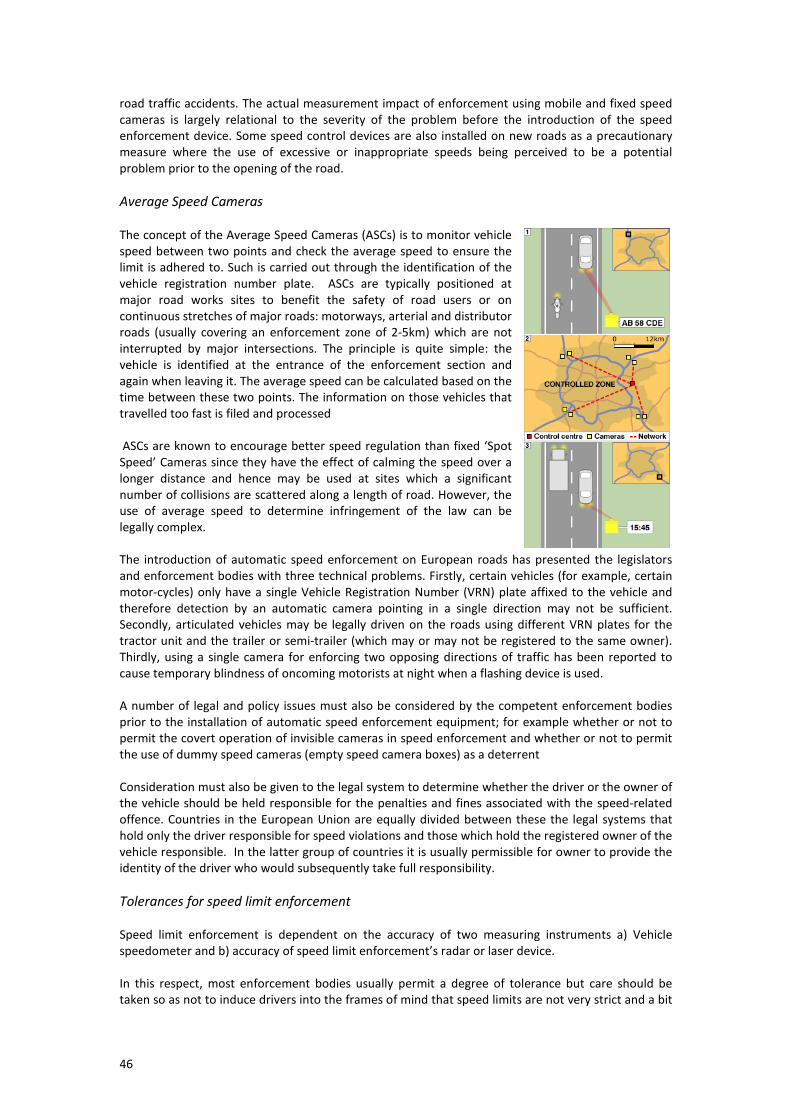
46
road traffic accidents. The actual measurement impact of enforcement using mobile and fixed speed
cameras is largely relational to the severity of the problem before the introduction of the speed
enforcement device. Some speed control devices are also installed on new roads as a precautionary
measure where the use of excessive or inappropriate speeds being perceived to be a potential
problem prior to the opening of the road.
Average Speed Cameras
The concept of the Average Speed Cameras (ASCs) is to monitor vehicle
speed between two points and check the average speed to ensure the
limit is adhered to. Such is carried out through the identification of the
vehicle registration number plate. ASCs are typically positioned at
major road works sites to benefit the safety of road users or on
continuous stretches of major roads: motorways, arterial and distributor
roads (usually covering an enforcement zone of 2-5km) which are not
interrupted by major intersections. The principle is quite simple: the
vehicle is identified at the entrance of the enforcement section and
again when leaving it. The average speed can be calculated based on the
time between these two points. The information on those vehicles that
travelled too fast is filed and processed
ASCs are known to encourage better speed regulation than fixed ‘Spot
Speed’ Cameras since they have the effect of calming the speed over a
longer distance and hence may be used at sites which a significant
number of collisions are scattered along a length of road. However, the
use of average speed to determine infringement of the law can be
legally complex.
The introduction of automatic speed enforcement on European roads has presented the legislators
and enforcement bodies with three technical problems. Firstly, certain vehicles (for example, certain
motor-cycles) only have a single Vehicle Registration Number (VRN) plate affixed to the vehicle and
therefore detection by an automatic camera pointing in a single direction may not be sufficient.
Secondly, articulated vehicles may be legally driven on the roads using different VRN plates for the
tractor unit and the trailer or semi-trailer (which may or may not be registered to the same owner).
Thirdly, using a single camera for enforcing two opposing directions of traffic has been reported to
cause temporary blindness of oncoming motorists at night when a flashing device is used.
A number of legal and policy issues must also be considered by the competent enforcement bodies
prior to the installation of automatic speed enforcement equipment; for example whether or not to
permit the covert operation of invisible cameras in speed enforcement and whether or not to permit
the use of dummy speed cameras (empty speed camera boxes) as a deterrent
Consideration must also be given to the legal system to determine whether the driver or the owner of
the vehicle should be held responsible for the penalties and fines associated with the speed-related
offence. Countries in the European Union are equally divided between these the legal systems that
hold only the driver responsible for speed violations and those which hold the registered owner of the
vehicle responsible. In the latter group of countries it is usually permissible for owner to provide the
identity of the driver who would subsequently take full responsibility.
Tolerances for speed limit enforcement
Speed limit enforcement is dependent on the accuracy of two measuring instruments a) Vehicle
speedometer and b) accuracy of speed limit enforcement’s radar or laser device.
In this respect, most enforcement bodies usually permit a degree of tolerance but care should be
taken so as not to induce drivers into the frames of mind that speed limits are not very strict and a bit

47
of speeding is acceptable. As indicated in the table below most European countries have either
introduced a practical tolerance limit which is kilometre–based or a technical tolerance based on
percentage tolerance above the posted speed limit. Best practice guidelines would seem to strongly
advocate the adoption of technical tolerance approach.
Road Speed Limit
Speed at which penalty is imposed (km/h)
Country Tolerance Rule
50 60 70 80
Austria 5km/h 56 66 76 86
7km/h 58 68 78 88
Germany 3km/h 54 64 74 84
France 5km/h 56 66 76 86
Ireland 5% 53 64 75 86
7% 54 65 76 87
Switzerland 5% 53 64 75 86
Netherlands 7km 58 68 78 88
Greece 10% 56 67 78 89
Sweden 10% 56 67 78 89
UK8 10%+2mph 58.3 69.3 80.3 91.3
Czech Republic 3km/h 54 64 74 84
Average tolerance 56 66 77 87
Table 8: Fixed speed camera tolerance limits in Europe for roads with speed limits of 80km/h or less Source: Transport Malta and European Transport Safety Council (2009)
Speed enforcement using radar and laser technology requires periodic testing and recalibration.
Although not covered by current EU metrological legislation (Directive 2004/22/EC on measuring
instruments), many EU countries have adopted a best practice of periodically checking the integrity of
the device. This is normally carried out at a European Union accredited laboratory which will normally
certify the correct calibration of the instrument every 12 months.
Where and how to use speed Enforcement?
Most traditional speed enforcement methods are known to be limited in both space and time. The
installation of a fixed speed camera for example generally results in what is known as a “kangaroo
effect”. This means that traffic generally slows down to a speed well below the posted speed limit
(representing a lack of faith in the accuracy of speed camera calibration) and then once out of the
range of the speed camera, increase speed with certain vehicles exceeding the posted speed limits of
the area. This phenomenon is a regular occurrence and clearly indicate that fixed speed cameras have
a distinct zone of influence or ‘halo’ (usually not more than a kilometre either side) over which the
enforcement measure is spatially effective.
The traditional method of policing speed using handheld radar equipment is also limited in the sense
that irregular surveillance (say every 3 weeks on the same day at the same time) by highly visible
police officers on the road network usually result in a high level of speed limit compliance at the time
of enforcement but for the rest of the time (when the subjective risk of apprehension is low) speeding
problems will persist. For speed enforcement to be effective it must be carried out at regular intervals
and at high intensities.
During a typical trip on any European road of 100 km, it is most unlikely that a motorist will come
across a mobile police unit visibly operating a speed control of traffic. Highly visible control of speed
8 Converted from miles per hour
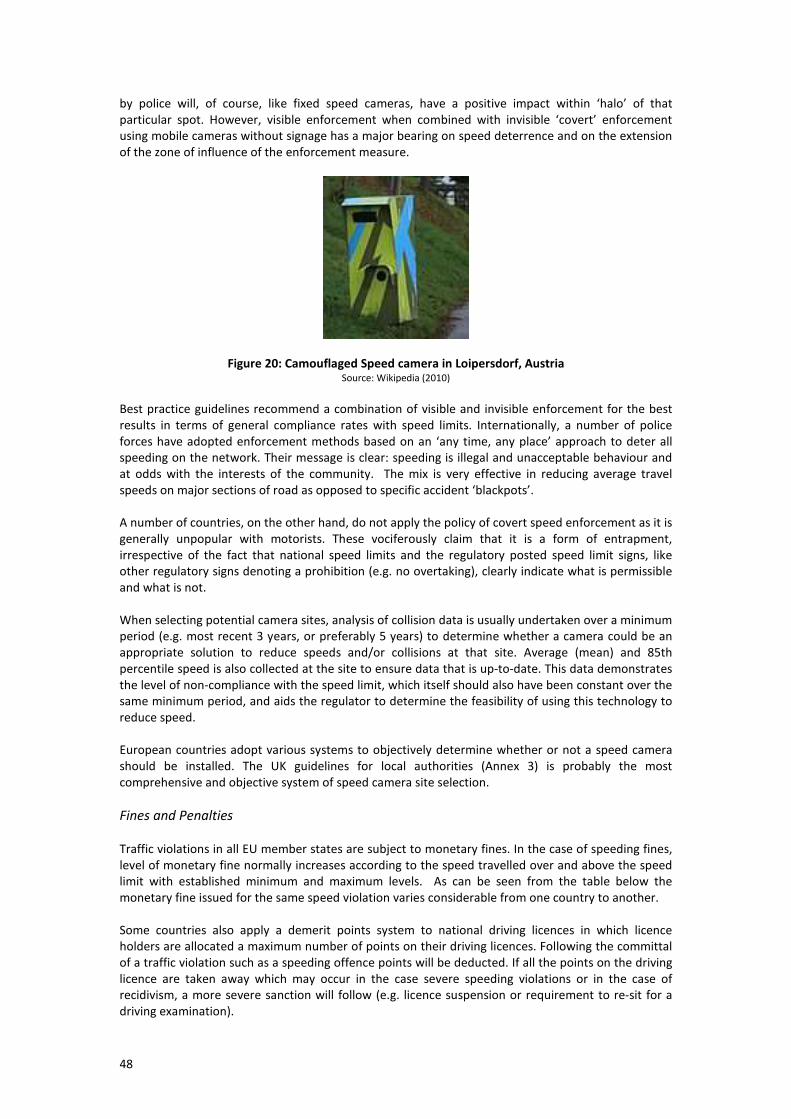
48
by police will, of course, like fixed speed cameras, have a positive impact within ‘halo’ of that
particular spot. However, visible enforcement when combined with invisible ‘covert’ enforcement
using mobile cameras without signage has a major bearing on speed deterrence and on the extension
of the zone of influence of the enforcement measure.
Figure 20: Camouflaged Speed camera in Loipersdorf, Austria Source: Wikipedia (2010)
Best practice guidelines recommend a combination of visible and invisible enforcement for the best
results in terms of general compliance rates with speed limits. Internationally, a number of police
forces have adopted enforcement methods based on an ‘any time, any place’ approach to deter all
speeding on the network. Their message is clear: speeding is illegal and unacceptable behaviour and
at odds with the interests of the community. The mix is very effective in reducing average travel
speeds on major sections of road as opposed to specific accident ‘blackpots’.
A number of countries, on the other hand, do not apply the policy of covert speed enforcement as it is
generally unpopular with motorists. These vociferously claim that it is a form of entrapment,
irrespective of the fact that national speed limits and the regulatory posted speed limit signs, like
other regulatory signs denoting a prohibition (e.g. no overtaking), clearly indicate what is permissible
and what is not.
When selecting potential camera sites, analysis of collision data is usually undertaken over a minimum
period (e.g. most recent 3 years, or preferably 5 years) to determine whether a camera could be an
appropriate solution to reduce speeds and/or collisions at that site. Average (mean) and 85th
percentile speed is also collected at the site to ensure data that is up-to-date. This data demonstrates
the level of non-compliance with the speed limit, which itself should also have been constant over the
same minimum period, and aids the regulator to determine the feasibility of using this technology to
reduce speed.
European countries adopt various systems to objectively determine whether or not a speed camera
should be installed. The UK guidelines for local authorities (Annex 3) is probably the most
comprehensive and objective system of speed camera site selection.
Fines and Penalties
Traffic violations in all EU member states are subject to monetary fines. In the case of speeding fines,
level of monetary fine normally increases according to the speed travelled over and above the speed
limit with established minimum and maximum levels. As can be seen from the table below the
monetary fine issued for the same speed violation varies considerable from one country to another.
Some countries also apply a demerit points system to national driving licences in which licence
holders are allocated a maximum number of points on their driving licences. Following the committal
of a traffic violation such as a speeding offence points will be deducted. If all the points on the driving
licence are taken away which may occur in the case severe speeding violations or in the case of
recidivism, a more severe sanction will follow (e.g. licence suspension or requirement to re-sit for a
driving examination).

49
Country Fine for a speed
violation of 9 km/h (€)
Fine for a speed violation of 19 km/h
(€) Penalty Points or licence withdrawals
Belgium 50 150 Court remission for driving in excess of 31km/h over speed limit
Czech Republic 10-30 10-30 -
Denmark Based on net income of driver -
Finland Based on net income of driver -
France 68 to 135 68 to 135 Yes
Germany 15 to 20 30 to 35 Yes
Greece 30 30 -
Ireland 80 80 Yes
Italy 143 573 Yes
Malta 34.94 €69.88 Probationary drivers only
Netherlands 30 55 to 70 Court remission for driving in excess of 71km/h over speed limit
Poland 14.75 14.75 to 29.53 -
Portugal 60 to 300 60 to 300 Driver disqualification for driving in excess of 61km/h over speed limit
Spain 140 200 Licence suspension for driving in excess of 31km/h over speed limit
Sweden 161.11 257.82 -
UK 89 89 Yes
Table 9: Speed fines and Penalty Points by European Country Source: Complete guide to speed limits and speeding fines for Europe Logitravel (2010)
Administration of speed cameras
The coordination and administration of the operation of speed enforcement systems in most
countries normally falls under the auspices of the Police who usually work in partnership with the
highway authorities and researchers to identify the locations where speed enforcement is necessary
and monitor the effectiveness of speed control measures. Public perception appears to falsely
consider that the main aims of these enforcement activities are revenue generation. This perception
decreases public and political support for these mechanisms as a speed enforcement tool and can, in
the long term, lower the effectiveness of speed checks.
Possible methods to reduce this misperception include:
a) Clear rules stating that speed checks may only be performed at locations with above average
numbers of crashes and where speed can be assumed to be a contributory factor to the
crashes
b) A transparent accounting of cost and fines generated by enforcement programmes
Speed enforcement programmes can, for example, be funded on a 'cost recovery' basis in which the
police, local road authorities, research and publicity institutes who are involved in the programme are
allowed to recover the costs of speed enforcement from the fine revenue. Investment of the revenues
exceeding the costs of the enforcement should visibly be in favour of programmes road safety or
mobility measures.
If the installation and operation of speed cameras is outsourced by the authorities to third parties, it is
normal practice to pay a fixed contractual fee to the contractor rather than a fee per fine issued.

50
Evaluation of the impact of Speed Enforcement measures
The best estimate is that automatic camera enforcement results in a crash reduction of 15 to 20% (EU
SafetyNet Project 2009). Individual evaluation studies differ widely in the reported effects. The actual
effectiveness depends on many factors, such as the actual enforcement effort, the initial speed and
safety level and the type and amount of supporting publicity. The following measures are generally
deployed to determine effectiveness of the measure.
Speed management systems are monitored by surveying and recorded speeds registered on site, prior
to and after the installation of speed management systems. This data is usually obtained immediately
prior to installation, and then following a specific regime over time (e.g. 1 month, 3 months 6 months
and 12 months after the scheme is introduced) to determine effectiveness.
Reported collisions involving injury data for a full 5-year period should be obtained before speed
management systems are installed and the average number of collisions per year calculated. Collision
data should then be obtained for a minimum of 1 year after installation and then compared with the
‘before’ data (using the average number of collisions per year when comparing before and after data)
Changes in the layout of the carriageway subsequent to installing such systems should also be
recorded as these also directly impact average speed of the traffic and should not be included in the
evaluation of the said measure. For example, a speed table, mini roundabout, new road markings etc
may all contribute in lowering the traffic speed independently of the enforcement system and these
must be taken into account.
Current Practice in Malta
Until 2004, speed enforcement was carried out by random checks by mobile police located at the
roadside at select locations and by using a hand held radar device. The coordination of activities from
the setting up of the site to the eventual prosecution proved to be a time-consuming and labour
intensive exercise.
In 2004, following Government policy direction subsidiary legislation 65.11 ‘Motor Vehicles
Regulations’ was amended in order to legally provide:
• for the use of speed monitoring devices that use Photographs, film, video-recordings,
electronic images as evidence for prosecution;
• Ministerial authorisation process for particular speed monitoring device
• to extend legal responsibility for certification of evidence to local wardens; and
• to assign legal responsibility for an offence to the owner of the motor vehicle (unless is
immediately stopped and identified by the police following the offence);
In August 2005, the make and model of prescribed speed monitoring device under Regulation 127 of
Motor Vehicles Regulations was published in the Government Gazette. An agreement was entered
into between the then ADT (which was legally responsible for administering and operating roads, now
Transport Malta) and Local Council’s Association (representing Local councils that had delegated legal
responsibilities for enforcing offences). The agreement defined the relative responsibilities of each
entity in relation to the authorisation process permanent and mobile speed cameras, the operation of
speed cameras, information, and the apportionment and utilisation of revenue derived from speed
camera fines.
In 2007, main legislation Chapter 65 ‘Traffic Regulation Ordinance’ was amended to introduce a
system of graduated fixed monitory fines according to kilometres travelled over the speed limit.

51
Speed Enforcement Systems and Equipment
The type of speed camera equipment put forwarded by the Local Councils’ Association and
subsequently approved and prescribed by the Minister responsible for Transport in August 2005 was
a speed recording device that uses radar technology which could be used either as a fixed speed
camera or as a mobile speed camera.
The fixed speed camera identifies number plates and is fully automated from on-site speed detection
stage to transmission to off-site back office to the postal infringement notification. The model of fixed
speed camera does not, however, distinguish between different vehicle types and the different
national speed limits that apply to these vehicle types.
Although this speed camera model has the capability of being used as a mobile camera, authorisation
was not granted by the Minister responsible for Transport on the grounds of lack of government
policy framework and standards relating to the setting out of mobile speed control sites and to the
lack of necessary accreditation of enforcing officers.
Where and how to use speed Enforcement?
A policy decision was taken that the speed cameras were to be permanently fixed, visible and the
approaches were to be clearly signed with information signs to advise that cameras are being used for
enforcement and the posted maximum speed limit.
The agreement between the then ADT and the Local Councils’ Association stipulates that Local
Councils wishing to install a speed camera would be required to submit an application form to the
Transport Authority clearly indicating the proposed location of the speed camera.
For each application made by a Local Council for a fixed speed camera, the Transport Malta had
carried out traffic studies which included classified link traffic counts, vehicle 85th percentile speed
readings in free flowing conditions, assessment of road traffic accidents over the previous 3 years and
inspection of the suitability of the site. The following benchmark criteria (adapted from the UK
Department for Transport’s handbook for rules and guidance - November 2004) were applied to all
applications.
• At least four persons killed or injured on the road within a kilometre of proposed site (past 3
years)
• Speed surveys indicate that 85th
percentile free flow speed is greater than speed limit
• At least 20% of drivers exceed speed limit
• No other engineering solutions can be implemented in short term.
Out of approximately 44 applications for speed cameras that were submitted by Local Councils
between August 2005 and 2009 11 locations complied with the aforementioned criteria for fixed
camera ‘core’ sites and were subsequently approved, installed and are being operated
These guidelines also provide for the installation of speed cameras in exceptional circumstances
which do not necessarily meet all of the criteria listed above, but where there is evidence to suggest
that a speeding exists and that there is a perceived risk of serious accident taking place. This
exceptional rule was applied in the case of the speed camera Ħal Far Road a few weeks after
completion of reconstruction in the aftermath of the tragic multiple fatality accident on upgraded
Mdina road on the outskirts of Zebbuġ.
Tolerances for speed limit enforcement
While all speed enforcement cameras are required to be calibrated every 12 months by an EU
accredited laboratory and evidence of this is retained at the Local Tribunal for evidence purposes, the
system is designed with certain tolerances. The current tolerances being advised by the Ministry for

52
Infrastructure, Transport and Communications for speed enforcement in Malta are contained in the
table below. These are in line with the recommended practice to used technical tolerances rather
than practical tolerances. It is understood, however, that not all Joint committees and Local Tribunals
have applied this advice in practice.
Posted Speed Limit Tolerance (10%)
Enforced Speed
50 km/h 55 km/h 56 km/h and above
60 km/h 66 km/h 67 km/h and above
70 km/h 77 km/h 78 km/h and above
80 km/h 88 km/h 89 km/h and above
Table 10: Malta Fixed speed camera tolerance limits for Roads with Speed limits of 80km/h or less Source: Transport Malta
Fines and Penalties
The principal legislation, Traffic Regulation Ordinance (Chapter 65), was amended in 2007 in order to
introduce the following graduated system of traffic fines for driving at an excessive speed:
• €34.94 for travelling up to 15 kilometres per hour over the limit
• €69.88 for travelling over 15 kilometres per hour over the limit
When compared with the fines issued by other EU countries (Table 9) the level of fines for lower
speed offences is considered to be average. However, Malta’s two tier graduated fine structure is
limited insofar as other countries introduce incrementally stricter penalties on drivers who exceed the
speed limits by more than 20, 30 and 40 km/h. Therefore, for a car driver travelling 90km/h in a built-
up area (where the 50km/h national speed limit applies) the same fine of €69.88 would be applied.
Furthermore, in practice the current fine system does not distinguish between drivers of vehicles for
which different national speed limits apply. For example, if a driver of a coach was detected by a
speed camera, travelling at 60km/h in a built up area (where there is posted speed limit 50 km/h) the
driver would receive a fine of €34.94. However, according to the law, the national maximum speed
limit for a coach travelling through a built-up is 40km/h and, in the respect, the violation is in fact
20km/h over the speed limit and the respective fine should be €69.88.
All new drivers who pass their driving test are issued with a ‘Probationary’ driving licence. This driving
is valid for three years and is subject to a penalty point system (on a paper counterpart licence)
applicable for all licence categories. A probationary driving licence is revoked if, at any time, during
the probationary three year period its owner accumulates an aggregate of 12 penalty points or over.
The driving offence of ‘exceeding speed limits signs or regulations for classification of road and type of
vehicle’ carries with a penalty of 3-6 points. For each contravention, penalty points are imposed by
the court of magistrates or by the commissioner’s for justice. In 2010, 422 probationary driving
licences 2.9% of all probationary licences) were endorsed with penalty points relating to code PH-1
(Exceeding speed limits signs or regulations for classification of road and type of vehicle). 32 drivers
with probationary licences had committed repeated violations relating to exceeding the speed limits
in 2010.
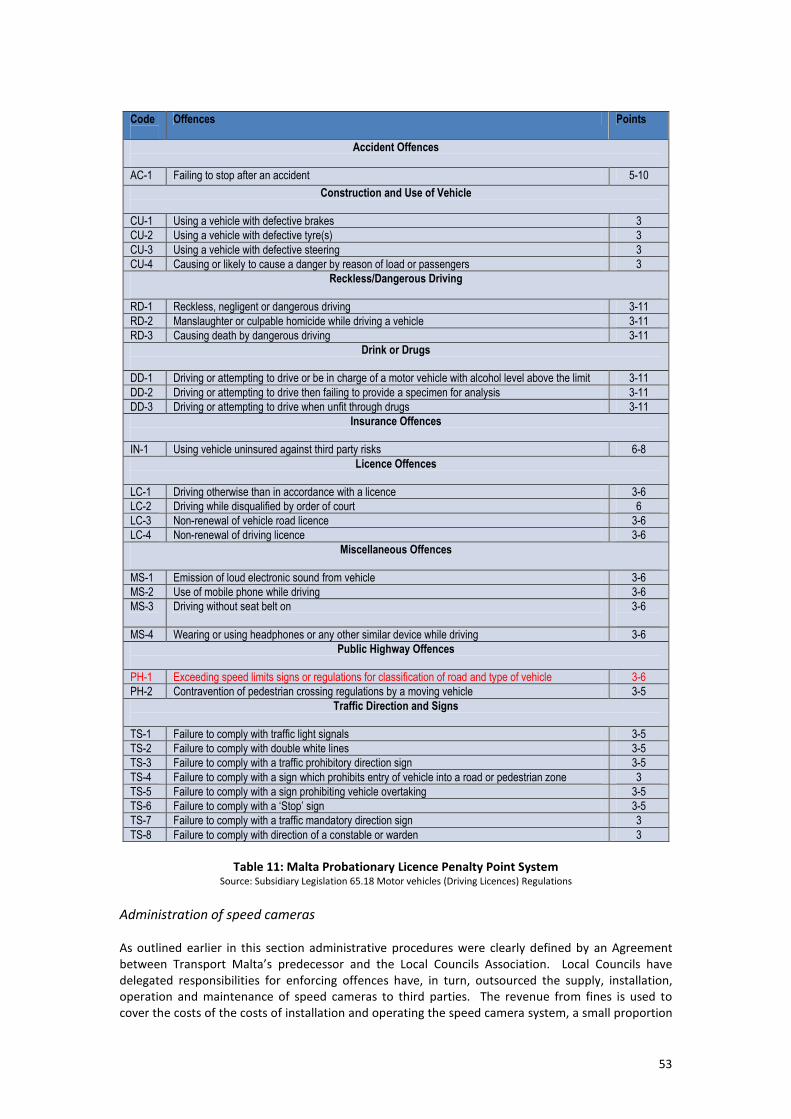
53
Code
Offences Points
Accident Offences
AC-1 Failing to stop after an accident 5-10
Construction and Use of Vehicle
CU-1 Using a vehicle with defective brakes 3
CU-2 Using a vehicle with defective tyre(s) 3
CU-3 Using a vehicle with defective steering 3
CU-4 Causing or likely to cause a danger by reason of load or passengers 3
Reckless/Dangerous Driving
RD-1 Reckless, negligent or dangerous driving 3-11
RD-2 Manslaughter or culpable homicide while driving a vehicle 3-11
RD-3 Causing death by dangerous driving 3-11
Drink or Drugs
DD-1 Driving or attempting to drive or be in charge of a motor vehicle with alcohol level above the limit 3-11
DD-2 Driving or attempting to drive then failing to provide a specimen for analysis 3-11
DD-3 Driving or attempting to drive when unfit through drugs 3-11
Insurance Offences
IN-1 Using vehicle uninsured against third party risks 6-8
Licence Offences
LC-1 Driving otherwise than in accordance with a licence 3-6
LC-2 Driving while disqualified by order of court 6
LC-3 Non-renewal of vehicle road licence 3-6
LC-4 Non-renewal of driving licence 3-6
Miscellaneous Offences
MS-1 Emission of loud electronic sound from vehicle 3-6
MS-2 Use of mobile phone while driving 3-6
MS-3 Driving without seat belt on 3-6
MS-4 Wearing or using headphones or any other similar device while driving 3-6
Public Highway Offences
PH-1 Exceeding speed limits signs or regulations for classification of road and type of vehicle 3-6
PH-2 Contravention of pedestrian crossing regulations by a moving vehicle 3-5
Traffic Direction and Signs
TS-1 Failure to comply with traffic light signals 3-5
TS-2 Failure to comply with double white lines 3-5
TS-3 Failure to comply with a traffic prohibitory direction sign 3-5
TS-4 Failure to comply with a sign which prohibits entry of vehicle into a road or pedestrian zone 3
TS-5 Failure to comply with a sign prohibiting vehicle overtaking 3-5
TS-6 Failure to comply with a ‘Stop’ sign 3-5
TS-7 Failure to comply with a traffic mandatory direction sign 3
TS-8 Failure to comply with direction of a constable or warden 3
Table 11: Malta Probationary Licence Penalty Point System Source: Subsidiary Legislation 65.18 Motor vehicles (Driving Licences) Regulations
Administration of speed cameras
As outlined earlier in this section administrative procedures were clearly defined by an Agreement
between Transport Malta’s predecessor and the Local Councils Association. Local Councils have
delegated responsibilities for enforcing offences have, in turn, outsourced the supply, installation,
operation and maintenance of speed cameras to third parties. The revenue from fines is used to
cover the costs of the costs of installation and operating the speed camera system, a small proportion

54
of revenue from each fine is passed over to Transport Malta for use in road safety campaigns, and
surplus revenue being used by to fund local council road maintenance and improvement in their
respective localities.
Evaluation of the impact of Speed Enforcement measures
Transport Malta has adopted the following best practice procedures for monitoring and evaluating
the impact of speed enforcement measures. In order to carry out an objective assessment of the
impact of a fixed speed camera. It is important to compare the traffic and accident situation before
and after the installation the speed enforcement device. Speed camera sites must be in operation for
at least three years in order to be confidently changes in travel behaviour an accident rates. The
following diagram outlines the evaluation process that has been adopted.
Transport Malta has been receiving records of road traffic injury accidents as provided by the Police.
However these records are not yet of sufficient detail and technical accuracy to be used to assess the
effectiveness of speed cameras and other accident remedial measures introduced at particular
accident ‘blackspots’. With an average of 800-900 road traffic injury accidents typically occurring each
year, accident analysis using this information is therefore limited. Accurate location of the accident is
particularly problematic on longer roads with few landmarks e.g. Coast Road, Hal Far Road etc due to
the manual nature of compilation of this data.
Figure 21: Process to review existing speed camera sites Source: Handbook of rules and guidance for national safety camera partnership in England and Wales (2004) UK DfT
The highest recorded speed offences at speed cameras are of great concern and are, in most cases,
more than double the legal speed limit. It is pertinent to note that the majority of these highest
speeds took place late at night and in the early morning. It is of most concerning that the recorded
speed of a vehicle travelling 123 km/h through the residential area of Notary Zarb Street in Attard
took place at a time when there are a lot of vulnerable road users using the road e.g. school children
crossing.

55
Existing Speed Cameras
Site and Fixed Speed Camera Details 2010 Before and After9
Locality Street Installed Speed limit
Ave. Tickets /
Day
AADT10
85th Percentile
Speed (Before)
85th Percentile
Speed (After)
Highest recorded
speed offence on camera
St. Julians Regional Rd Dec 2004 60 5.3 58,984 73km/h 66km/h 138 km/h
Qormi Mriehel Bypass Dec 2005 80 1.1 26,202 87km/h 72km/h 169 km/h
Zebbug Mdina Rd Jan 2006 70 4.8 19,213 89km/h 76km/h 163 km/h
Attard Not Zarb Str Jun 2006 50 13.5 26,703 64km/h 54km/h 123 km/h
St. Paul’s Bay Burmarrad Rd Jun 2006 70 2.5 20,682 88km/h 62km/h 172 km/h
Pembroke St. Andrew’s Rd11
Jan 2007 70 5.5* 26,134 N/A 66km/h 144 km/h
Birzebbugia Hal Far Rd Feb 2008 60 22.0 14,298 82km/h 63km/h 194 km/h
Birkirkara B’kara Bypass Mar 2009 60 20.8 21,430 70km/h 58km/h 188 km/h
Santa Venera Tunnels Mar 2009 60 10.8 18,763 74km/h 67km/h 159 km/h
Zejtun Tal-Barrani Rd Mar 2009 60 9.3 32,486 80km/h 48km/h 175 km/h
Qormi Imdina Rd Apr 2009 60 11.3 22,427 66km/h 63km/h 123 km/h
Table 12: Assessment of existing speed cameras in Malta Source: Transport Malta
Policy Discussion
Should we make more use of mobile speed cameras?
The combination of fixed site speed cameras with the random use of mobile speed cameras is
considered to be a best practice for speed compliance throughout the road network. As pointed out
in this section, the primary reasons why the use of mobile cameras operated by local wardens has
not been approved in the past relate to regulation of the setting out of the site (advance warning
signage layout, conspicuousness of speed camera and safe location of tripod or vehicle) and ensuring
that the proper speed tolerance is set before operating each site., It is, however, technically possible
for a National Accreditation Body to accredit the personnel responsible for setting up the site thus
ensuring the necessary quality control and assurance.
Should invisible / covert enforcement be allowed?
The use of invisible or covert speed enforcement equipment is a subject of much controversy
worldwide. In many countries, the police are legally empowered to carry out covert speed
enforcement but often this is considered as a measure to deal with exceptional situations.
Exceptional situations may include for example extreme car drivers or motorbike riders are prepared
to reconnoitre roads for any cameras, including mobile cameras, before using them illegally for high-
speed racing. The practice of carrying out covert speed enforcement is usually left to the discretion
of the Police.
Should ‘dummy’ speed cameras be permitted?
‘Dummy’ speed cameras usually comprise an empty box containing no speed camera or radar
equipment. These are generally considered to be a cost-effective measure for ensuring compliance
with posted speed limits, but in small communities it is recommended that speed cameras are
9 85th percentile speed indicates the faster direction of the two directions (measurement taken 400m downstream
of camera) 10 AADT – Annual Average Daily Traffic (both directions) 11 operated only in the month of December 2010
56
randomly installed in the empty boxes and rotated between the sites.
Should the tolerances on speed cameras be changed?
From research carried out, the 10% tolerances set on the speed cameras (above which vehicles will
be detected and issued with a fine) is in line with the average across the EU and takes into full
account as margins of errors of speed measuring devices. However, this 10% tolerance is not being
applied at all of the speed cameras being operated by the Joint Committees which raises concern.
How often should speed cameras be checked for correct calibration?
Currently, speed cameras are covered by a calibration certificate issued every 12 months. A few
weeks before the certificate expiry date the camera is sent to an EU accredited laboratory. To date,
all speed cameras (some of which have been in operation for over five years) have checked and
returned ‘as found, as left’ with no required calibration adjustment. In this respect, it is confirmed
through best practice for this type of measuring instrument, manufacturers’ recommendations and
through practical application that a calibration certificate which is valid for 12 months is fully
acceptable.
Site identification
The UK Department of Transport set of guidelines for local authorities (DfT 01/2007 – Annex 3)
provides a comprehensive and objective assessment framework for speed monitoring devices and
would be fully transferable to the Maltese environment.
Under the current agreement with the Local Councils’ Association, it is the Local Councils that are
responsible for nominating suitable sites for speed camera operation. In this respect, the sites
eventually selected for speed cameras are dependent on the ability of Local councils to identify a
speed problem and the risks that associated and for the council to be prepared to submit an
application to Transport Malta. Inevitably, there are certain localities in which speed enforcement
should (according to objective criteria) be carried out, but no application for a speed camera has
been submitted.
In most European countries, the site of speed cameras is determined in agreement between the
highway authority and the Police. Competent authorities that have regulatory responsibilities and
expertise in road design, traffic control, enforcement and road safety.
Should new posted speed limits be installed at the same time as speed enforcement devices?
The currently network of posted speed limits is neither comprehensive nor complete (see Section 5).
If a stretch of road requires a posted speed limit that is lower than the applicable national speed
limit it is important for the posted speed limit signs to be in place for at least six months for
monitoring of the site before deciding to use speed enforcement devices.
Is the current system of speed fines and penalties effective?
The two tier system of fines (for vehicles travelling up to or in excess of 15 km/h over the posted
speed limit in the main part works effectively. However, for someone who is intent on using his
private car as racing car, something that clearly takes place in Malta in the early hours, a fixed fine
just under €70 is not considered to be an effective deterrent.
Several countries in the European Union have successfully introduced a system of penalty points on
driving licences, other countries have decided not to introduce such a system because of the amount
of administration involved or the high number of foreign plated vehicles using their roads. The
introduction of a harmonised penalty point system is being discussed with the European, but a
solution in the short term is unlikely. In Malta, the administrative procedures are already in place
and the system of penalty new drivers under a probationary licence has been in operation for a

57
number of years. Extending the existing penalty point system to cover all drivers would require legal
changes but, from an administrative point of view, would be relatively straight forward.
Monitoring
The monitoring of the effectiveness of speed management measures is still largely a manual process,
particularly the collection and collation of data from road traffic accidents. Modern road accident
investigation in other countries has removed much of the administrative burden form the Police and
traffic authorities by automation of data collection using GPS technology to accurately locate the
accident and the use of GIS as a presentation and as an analytical tool for road accident
investigation.
Policy Recommendations
1. Set up the administrative and accreditation framework for mobile cameras.
2. Carry out further studies on the potential for using Average Speed Cameras on long stretches of
road with few intersections (2-5km) such as Coast Road and Burmarrad Road.
3. Transport Malta to formally permit the deployment of ‘dummy’ speed cameras in approved
locations.
4. Transport Malta to formally adopt the speed camera site selection criteria and assessment
framework contained in Annex 1.
5. Formally adopt the 10% tolerance for speed enforcement using cameras nationwide
6. Amendment to the agreement with the Local Councils’ Association to stipulate that Transport
Malta (in agreement with the Police) shall determine the site for the installation, operation
and/or removal of fixed and mobile speed cameras, based on objective reasoning.
7. Assess technical feasibility through the VERA system for the correct fine to be applied to Heavy
vehicles.
8. A third tier of speed fines should be introduced into the law for drivers travelling 30km/h over
the posted speed limit with a pecuniary fine of not less than €500.
9. Examine the technical feasibility of extending the driving licence penalty point system that is
currently applicable to new drivers with probationary driving licences, to cover drivers with
standard licences.
10. Discuss new contracting procedures with Local Council Association for camera service provision
to be based on fixed annual fee rather than fee per fine payment received.
11. Improve data collection of road traffic accidents through the use of handheld data capture
devices with the facility for logging coordinates of the road traffic accident using GPS and
continued development of Transport Malta’s road accident GIS database.
12. Transport Malta to discuss with the Police and respective Local Councils the monitored
performance of the listed fixed speed cameras after three years of operation.
References
American Association of State Highway and Transportation Officials Expert System for
Recommending Speed Limits in Speed Zones, USA (2006)
Association of British Drivers Signing Requirement for Speed Limits, UK (2009)
BCEOM French Engineering Consultants Feasibility and Environmental Impact Studies for Transport
Infrastructure Projects in Malta, EuropeAid 114473/D/SV/MT, Brussels (2004)
Department for Transport Graduated Fixed Penalties for Speeding Offences – Discussion Note, UK
(2010)
Department for Transport Setting Local Speed Limits DfT Circular 01/2006, UK (2006)
Department for Transport Traffic Signs Manual, UK (2006)
Department for Transport Interaction between Speed Choice and Road Environment – Road Safety
Research Report No. 100, UK (2008)
Department for Transport Handbook of Rules and Guidance for the National Safety Camera
Programme for England and Wales for 2005/06, UK (2004)
European Commission, Directorate-General Transport and Energy SafetyNet Speed Enforcement,
Brussels (2009)
European Commission, Directorate-General Transport and Energy Speed Alert D2.1 Common
Definition of Speed Limits and Classifications, Brussels (2004)
European Commission, Directorate-General Transport and Energy Saving 20,000 lives on our roads –
a shared responsibility, Brussels (2003)
European Commission, Directorate General Transport and Energy Supreme- summary and
publication of best practices in road safety in the member states – thematic report: Enforcement,
Brussels (2007)
European Commission, Directorate-General Mobility and Transport Flash Eurobarometer 301 – Road
Safety Analytical Report, Brussels (2010)
European Federation for Transport and Environment CARS21 Road transport speed and climate
change, Brussels (2005)
European Transport Safety Council (ETSC) ShLOW! – Reducing Excessive and Inappropriate Speed
Now: a Toolkit, Brussels (2008)
European Transport Safety Council (ETSC) – Speed Fact Sheet 2/08 Combating speed through penalty
point systems, Brussels (2008)
Eurostat Energy, Transport and Environment indicators, Brussels (2008)
Global Road Safety Partnership (WHO, FIA Foundation and World Bank) Speed Management: a road
safety manual for decision makers and practitioners, Geneva (2008)
Highways Agency Design Manual for Roads and Bridges volume 6 section 1 part 1 TD 93/3 highway
link design, UK (2002)
Highways Agency Design Manual for Roads and Bridges volume 6 section 1 part 1 TD 42/9 Geometric
Design of Major/ Minor Priority Junctions, UK (1995)
Leichhardt Road Safety Committee Speed Management Strategy for the Leichhardt LGA, 2000-2005,
NSW Australia (1999)
National Cooperative Highway Research Programme NCHRP Design Speed, Operating Speed and
Posted Speed Practices, Washington D.C (2003)
National Statistics Office Transport Statistics 2010, Malta (2010)
OECD and ECMT Speed Management, Paris (2006)
Parliamentary Office of Science and Technology Post Note Speed Cameras, UK (2004)
Suffolk Constabulary Policies and Procedures Speed Enforcement – General, UK (2006)
Surrey County Council Speed Management Policy UK (2006)
The Institute of Highways and Transportation Transport in the Urban Environment, UK (2006)
The Royal Society for the Prevention of Accidents (RoSPA) Working together for Road Safety, UK
(2009)
Transport Research Laboratory Barlow T.J. and Boulter P.G Emission Factors – a review of average
speed approach for estimating hot exhaust emissions, UK (2009)
UN-ECE Convention on Road Signs and Signals, of 1968 (Vienna Convention) Vienna (1968)

ANNEX 1
Technical Guidance to Setting Local Speed Limits
(Section 5)

a. Current Posted speed Limits for Malta
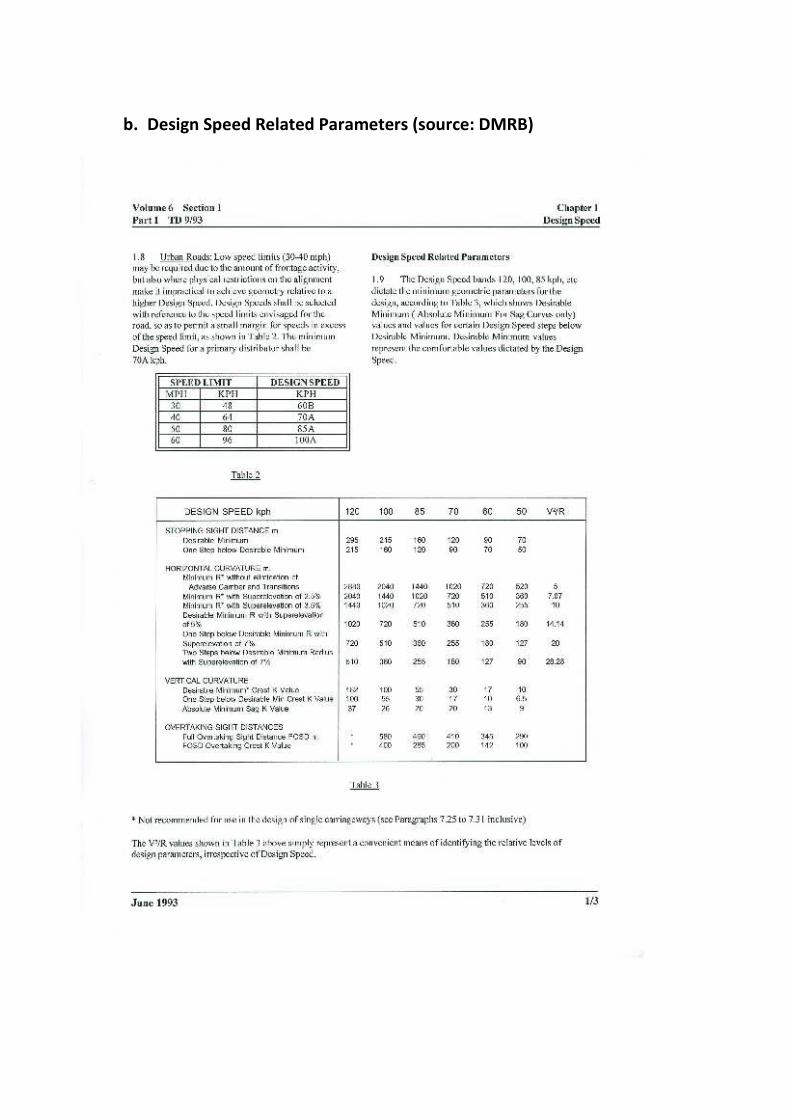
b. Design Speed Related Parameters (source: DMRB)
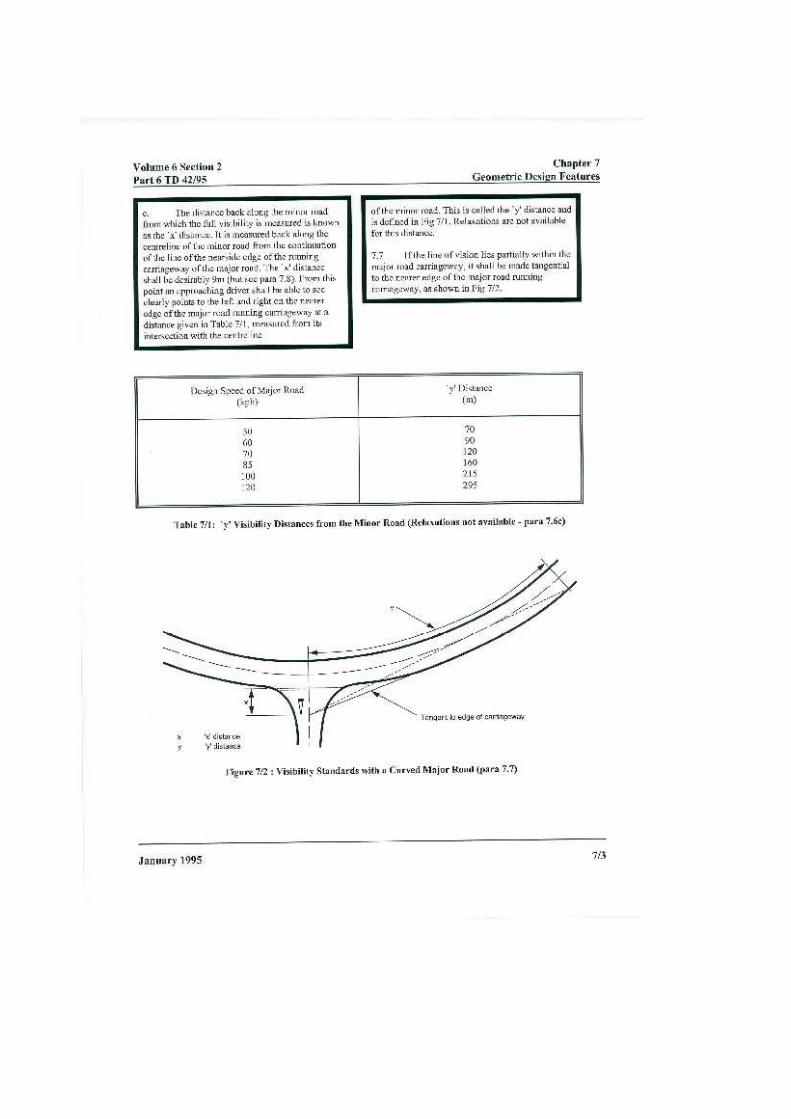
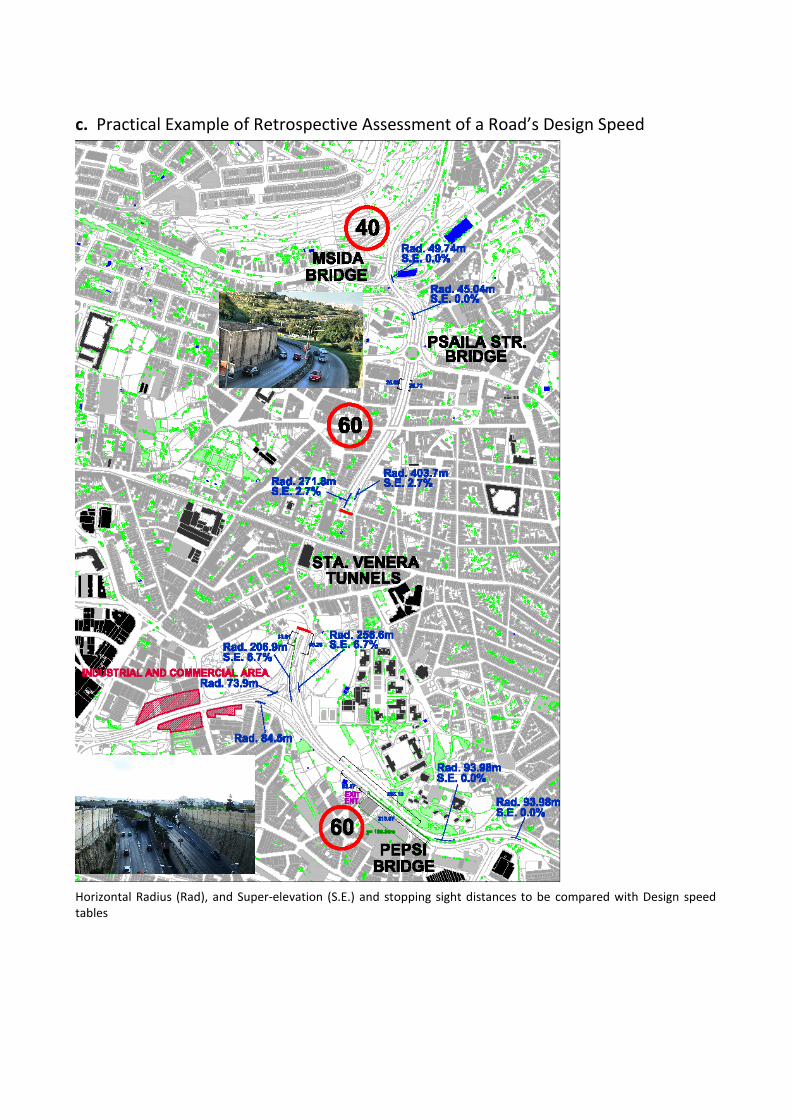
c. Practical Example of Retrospective Assessment of a Road’s Design Speed
Horizontal Radius (Rad), and Super-elevation (S.E.) and stopping sight distances to be compared with Design speed
tables
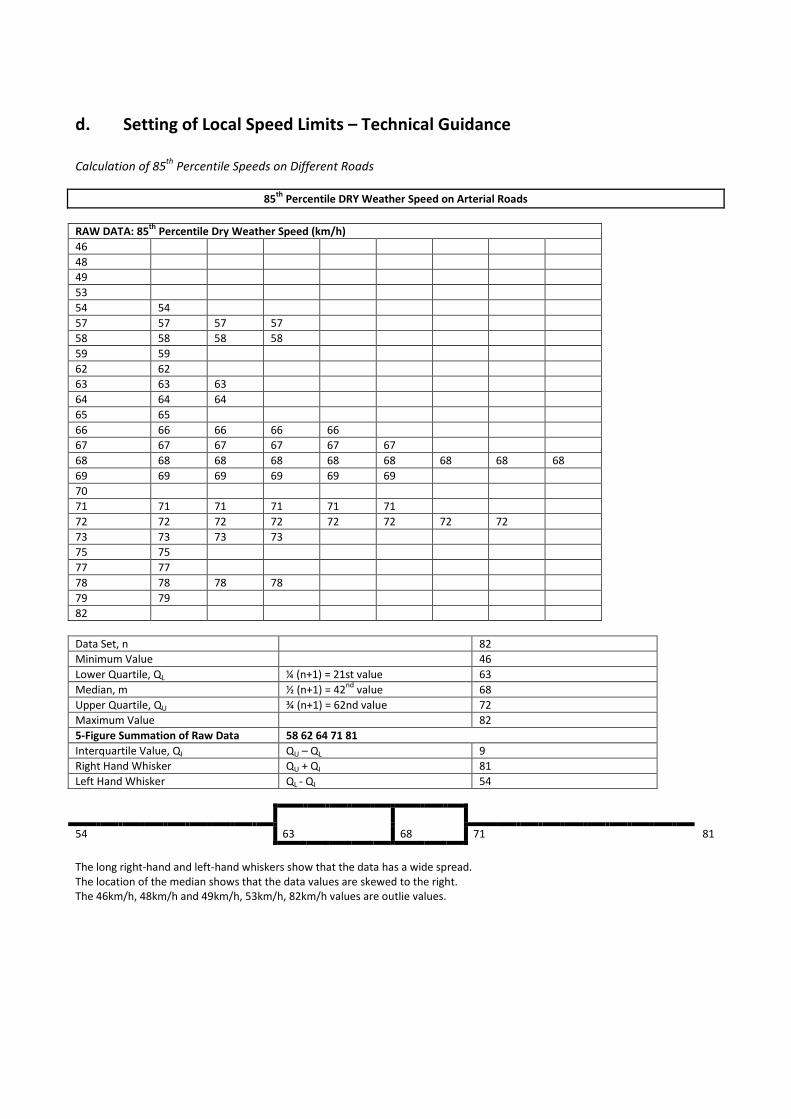
d. Setting of Local Speed Limits – Technical Guidance
Calculation of 85
th Percentile Speeds on Different Roads
85th
Percentile DRY Weather Speed on Arterial Roads
RAW DATA: 85th
Percentile Dry Weather Speed (km/h)
46
48
49
53
54 54
57 57 57 57
58 58 58 58
59 59
62 62
63 63 63
64 64 64
65 65
66 66 66 66 66
67 67 67 67 67 67
68 68 68 68 68 68 68 68 68
69 69 69 69 69 69
70
71 71 71 71 71 71
72 72 72 72 72 72 72 72
73 73 73 73
75 75
77 77
78 78 78 78
79 79
82
Data Set, n 82
Minimum Value 46
Lower Quartile, QL ¼ (n+1) = 21st value 63
Median, m ½ (n+1) = 42nd
value 68
Upper Quartile, QU ¾ (n+1) = 62nd value 72
Maximum Value 82
5-Figure Summation of Raw Data 58 62 64 71 81
Interquartile Value, QI QU – QL 9
Right Hand Whisker QU + QI 81
Left Hand Whisker QL - QI 54
54 63 68 71 81
The long right-hand and left-hand whiskers show that the data has a wide spread.
The location of the median shows that the data values are skewed to the right.
The 46km/h, 48km/h and 49km/h, 53km/h, 82km/h values are outlie values.
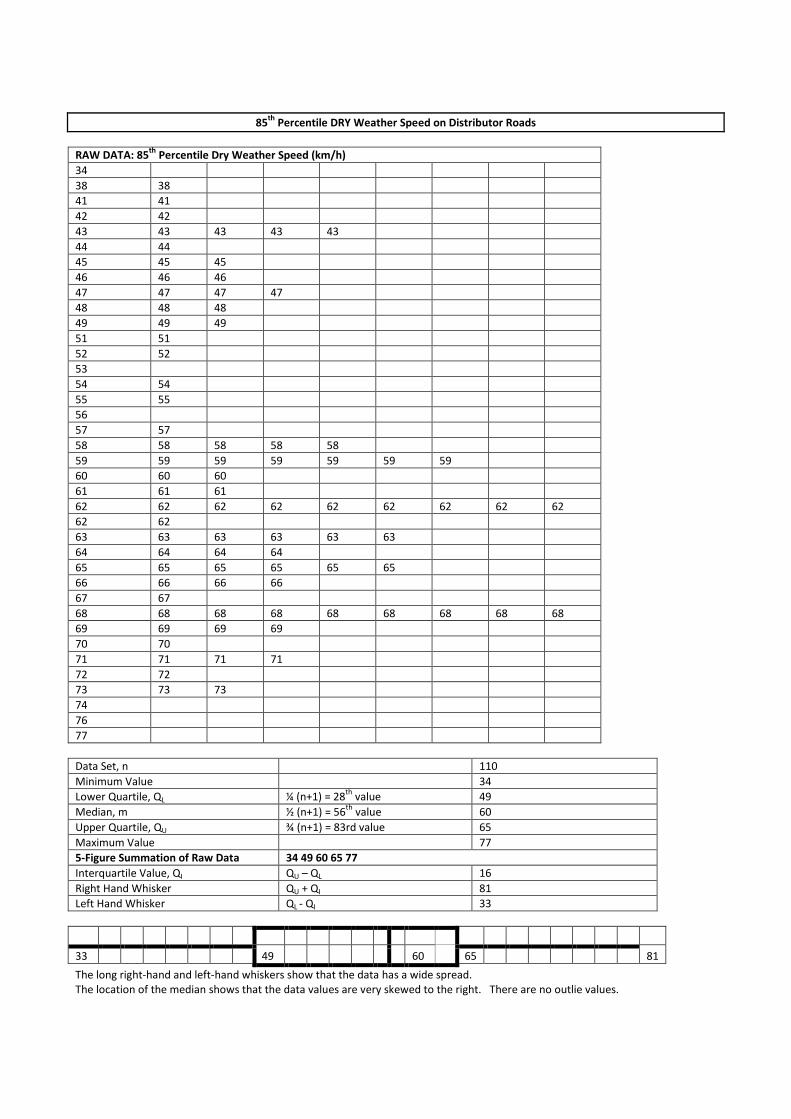
85th
Percentile DRY Weather Speed on Distributor Roads
RAW DATA: 85th
Percentile Dry Weather Speed (km/h)
34
38 38
41 41
42 42
43 43 43 43 43
44 44
45 45 45
46 46 46
47 47 47 47
48 48 48
49 49 49
51 51
52 52
53
54 54
55 55
56
57 57
58 58 58 58 58
59 59 59 59 59 59 59
60 60 60
61 61 61
62 62 62 62 62 62 62 62 62
62 62
63 63 63 63 63 63
64 64 64 64
65 65 65 65 65 65
66 66 66 66
67 67
68 68 68 68 68 68 68 68 68
69 69 69 69
70 70
71 71 71 71
72 72
73 73 73
74
76
77
Data Set, n 110
Minimum Value 34
Lower Quartile, QL ¼ (n+1) = 28th
value 49
Median, m ½ (n+1) = 56th
value 60
Upper Quartile, QU ¾ (n+1) = 83rd value 65
Maximum Value 77
5-Figure Summation of Raw Data 34 49 60 65 77
Interquartile Value, QI QU – QL 16
Right Hand Whisker QU + QI 81
Left Hand Whisker QL - QI 33
33 49 60 65 81
The long right-hand and left-hand whiskers show that the data has a wide spread.
The location of the median shows that the data values are very skewed to the right. There are no outlie values.
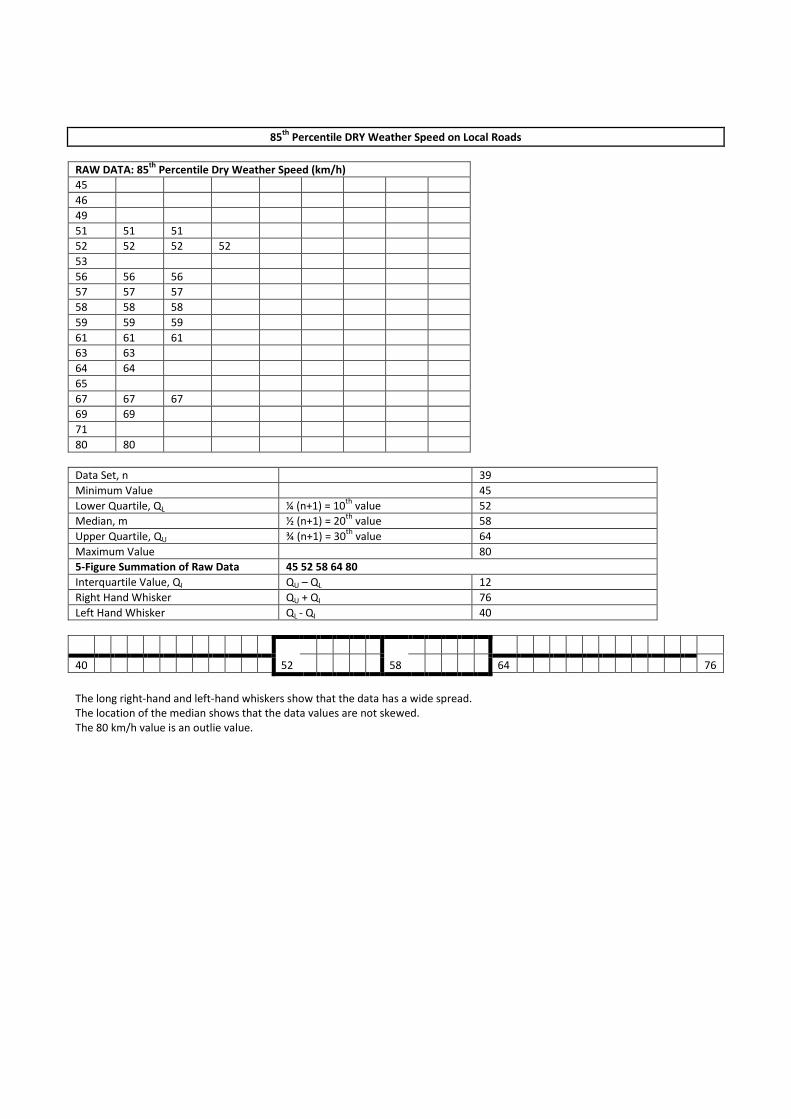
85th
Percentile DRY Weather Speed on Local Roads
RAW DATA: 85th
Percentile Dry Weather Speed (km/h)
45
46
49
51 51 51
52 52 52 52
53
56 56 56
57 57 57
58 58 58
59 59 59
61 61 61
63 63
64 64
65
67 67 67
69 69
71
80 80
Data Set, n 39
Minimum Value 45
Lower Quartile, QL ¼ (n+1) = 10th
value 52
Median, m ½ (n+1) = 20th
value 58
Upper Quartile, QU ¾ (n+1) = 30th
value 64
Maximum Value 80
5-Figure Summation of Raw Data 45 52 58 64 80
Interquartile Value, QI QU – QL 12
Right Hand Whisker QU + QI 76
Left Hand Whisker QL - QI 40
40 52 58 64 76
The long right-hand and left-hand whiskers show that the data has a wide spread.
The location of the median shows that the data values are not skewed.
The 80 km/h value is an outlie value.

1.13.1 Analysis of Speed Survey Data
From the above statistical analysis of the 85thPercentile Dry Weather Speed for Arterial, Distributor and Local Council roads, the
following can be concluded based on the diagrammatic summary:
Arterial Roads
54 63 68 71 81
• The maximum 85th
Percentile Dry Weather Speed exceeds the national speed limit as can be seen on the right-hand
whisker of the box-plots. This shows that there is indeed an over speeding problem on such roads which needs to be
addressed.
• The range of speed values between the lower quartile and upper quartile speeds, hence between 63km/h and 71km/h
are considered to be the identified speed range of vehicle drivers for arterial roads.
Distributor Roads
33 49 60 65 81
• The maximum 85th
Percentile Dry Weather Speed exceeds the national speed limit as can be seen on the right-hand
whisker of the box-plots. This shows that there is indeed an over speeding problem on such roads which needs to be
addressed.
• The lower quartile speed, the median speed, and the upper quartile speed for arterial roads exceed those for distributor
roads as is expected since distributor roads are designed for less speeds.
• The range of speed values between the lower quartile and upper quartile speeds, hence between 49km/h to 65km/h, are
considered to be the identified speed range of vehicle drivers for distributor roads.
• The minimum speed for distributor roads is less than that for arterial roads as expected and as shown in the left-hand
whisker of the box plots.
Local Roads
40 52 58 64 76
• The maximum 85th
Percentile Dry Weather Speed exceeds the maximum speed limit outlined by law for such roads as can
be seen on the right-hand whisker of the box-plots. This shows that there is indeed an over speeding problem on such
roads which needs to be addressed.
• The range of speed values between the lower quartile and upper quartile speeds, hence between 52km/h to 64 km/h, are
considered to be the identified speed range of vehicle drivers for local roads. Such values are higher than the speeds
stipulated by law for local roads.
• The minimum speed and lower quartile speed for local roads is greater than that for distributor roads but less than that
for arterial roads It is expected that such value is less than that for both arterial and distributor roads however it is not
the case as shown in the left-hand whisker and lower quartile representation of the box plots.

Three Year Assessment of Road Traffic Accidents – Ranking of Roads with highest Accident Rates
Injury Accidents 2007-2009 Rank Locality Road Road
Type Slight Injuries
Serious Injuries
Fatalities Weighting
1 Naxxar Coast Road Arterial (Rural)
67 24 6 217
2 Gzira / St. Julian’s Msida
Regional Road / Triq M.A. Vassalli
Arterial (Rural / Urban)
59 15 0 134
3 Tarxien / Zejtun / St.Lucija
Tal-Barrani Road Arterial (Rural) 52 16 0 132
4 B’kara Triq Dun Karm (B’kara bypass)
Arterial (Rural / Urban)
56 11 1 116
5 Gzira / Msida
Rue D’Argens Access (Urban)
40 14 0 110
6 Hamrun St. Joseph High Road Access (Urban)
29 13 3 109
7 St. Paul’s Bay Burmarrad Road Distributor (Rural)
44 10 0 94
8 Zebbug Mdina Road Distributor (Rural)
27 13 0 92
9 Floriana / Hamrun
National Road Arterial (Rural)
28 11 0 83
10 Ghajnsielem / Xewkija / Rabat
Mgarr Road Arterial (Rural / Urban)
31 4 3 66

Step by Step Approach for Setting Local Speed Limits
STAGE 1: Determine the road length to be considered
1. A minimum length of 600m is to be considered over which a speed limit change is to be effected
2. Start and end point of the speed limit are to be well examined as existing road configurations may provide
automatic thresholds.
3. Speed limits of 30km/h are to be implemented over an area-wide zone and not on an individual road unless it
is at least 500m long.
STAGE 2: Measure the Operating Mean Speed and Collision Rate
Operating Mean Speed: A mean speed for a 200 reading dataset is to be established
Collision rate per 100 million vehicle kilometres
= Number of collisions x 100,000,000_______
Number of days in period x AADT x Length of route
STAGE 3: Establish the Road Tier
Upper tier roads – less than 35 injury accidents per 100 million vehicle kilometres (calculation in Stage 2)
Lower tier roads – less than 60 injury accidents per 100 million vehicle kilometres (calculation in Stage 2)
STAGE 4: Calculate the Posted Speed Limit
The value for the mean speed of the road and the value for the Collision rate per 100 million vehicle kilometres are
used to establish the speed limit as per graphs at Fig.1 and Fig.2 (Surrey County Council, 2006).
Posted Speed Limits are to be established in factors of ten, hence 10km/h, 20km/h, 30km/h, 40km/h, 50km/h,
60km/h, 70km/h and National Speed Limit (80km/h).


STAGE 5: Confirm the Speed Limit
The Posted Speed Limit is confirmed further to verification in relation to the following:
• Lane widths
• Road type and condition
• Topography (vertical and horizontal curves)
• Parking conditions
• Land uses along the road
• Type and widths of access points and intersection roads
• Mean Speeds
• Test runs
• Traffic volumes
• Pedestrian Volumes and Behavioural Settings
• Accidents involving pedestrians.
STAGE 6: Compare Posted Speed Limit with Maximum Recommended Speed Limits
Speed Limits for Arterial, Distributor and Rural Roads with linking function
1. The table below gives the maximum speed limits in rural or urban areas for roads with flow and distribution
functions. There may be cases where the type of road does not fit perfectly into one of the descriptions and
hence this would need to be discussed in more detail with the police.
2. The default highest national speed limit in rural areas is 80km/h although lower speeds apply to certain types
of vehicles. However, this maximum speed may be reduced where there is a strong road safety case.
3. The default highest national speed limit in urban areas is 50km/h. However, higher speed limits may be
applied if there is a low level of direct frontage / access and formal pedestrian crossings have been provided.
Category Definition of Types of Arterial and distributor Roads in Rural and
Urban Areas
Maximum
Posted Speed
Limit
RURAL 1 Arterial and distributor single or dual carriageway roads with adequate street
lighting and few bends, junctions and accesses in rural areas 80km/h
RURAL 2 Arterial and Distributor single or dual carriageway roads with adequate
street lighting and a relatively high number of bends, junctions and accesses
or concealed accesses but with little roadside development usually in rural
areas
70km/h
RURAL 3
URBAN 1
a) Arterial and Distributor single or dual carriageway roads with
inadequate street lighting levels and/or high number of bends,
junctions and accesses in rural areas
b) Arterial and distributor single or dual carriageway roads with
roadside development but with few direct accesses and with formal
crossing places for pedestrians (Pelican crossings) in urban areas
60km/h
RURAL 4
URBAN 2
a) Low Quality Rural roads
b) Arterial and distributor roads single or dual carriageway roads with
roadside development, with many direct accesses and informal
pedestrian crossings (zebra crossings and refuges) in urban areas
50 km/h

Speed Limits for Access, Access only and Urban Roads with linking function in Urban Areas
1. The table below is a guide outlining the maximum speed limits in urban areas.
2. Although the default speed limit in urban areas is 50km/h there may be strong safety reasons where this
speed limit is lowered.
3. In specific areas 30km/h zones (Home Zones) may be considered to enable a safe shared area by vehicles,
pedestrians and cyclists.
4.
Category Definition of Type of Access and Access-only Roads in Urban Areas Maximum
Posted Speed
Limit
URBAN 3 a) Spine roads in villages where the through traffic is essential but
adequate facilities for vulnerable road users and cyclists are
provided such as pedestrian crossings, footways and cycle lanes.
b) Roads with linking function where the movement of traffic has
priority but adequate facilities for vulnerable road users and
cyclists are provided such as pedestrian crossings, footways and
cycle lanes.
50km/h
URBAN 4 Shopping Areas and town centres with access to public transport, schools
and commercial outlets. Where pedestrians and cyclists have priority over
traffic.
40km/h
URBAN 5
Home Zones are specially identified residential streets where the road space
is shared between vehicles, vulnerable road users and cyclists. Low speed is
attained through road design and road space designation rather than by the
installation of speed limit signs only.
30km/h
(Leichhardt Road Safety Committee)
STAGE 7: Comparing the Posted Speed Limit with Mean and 85th
percentile Operating Speeds.
1. After determining the posted speed limit of a road an assessment in relation to the mean operating speeds is
necessary. Speed measurements will determine if there is a speed-related concern.
2. In cases where the posted speed limit is less than the operating limit it is to be assessed if the difference is
such that speed reduction measures are required to support the posted speed limit.
3. If the mean operating speeds are considerably higher than the posted speed limit, implement other speed
management measures to lower speeds closer to the posted limit.
4. When the posted speed limit is higher than the operating speed limit, this is to be addressed with caution
since raising the speed limit might pose road safety risks.
5. Carry out test runs
STAGE 8: Monitoring
1. Following the implementation of new speed management measures, adequate monitoring is important to
ensure that the new measures are effective.
2. In the case that the new speed management measures have not achieved the desired speed reduction,
additional measures should be considered.
3. Monitoring is to include the carrying out and the assessment of speed surveys and accident data.
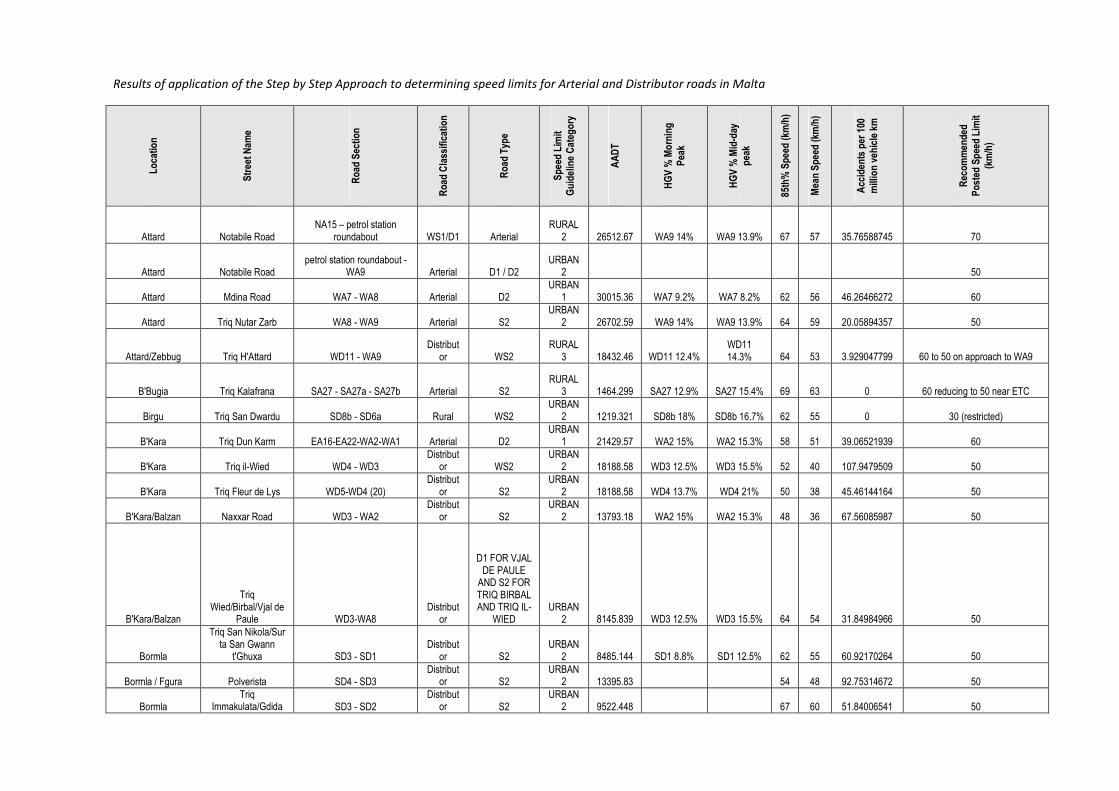
Results of application of the Step by Step Approach to determining speed limits for Arterial and Distributor roads in Malta
Lo
cati
on
Str
eet
Nam
e
Ro
ad S
ecti
on
Ro
ad C
lass
ific
atio
n
Ro
ad T
ype
Sp
eed
Lim
it
Gu
idel
ine
Cat
ego
ry
AA
DT
HG
V %
Mo
rnin
g
Pea
k
HG
V %
Mid
-day
pea
k
85th
% S
pee
d (
km/h
)
Mea
n S
pee
d (
km/h
)
Acc
iden
ts p
er 1
00
mill
ion
veh
icle
km
Rec
om
men
ded
P
ost
ed S
pee
d L
imit
(km
/h)
Attard Notabile Road NA15 – petrol station
roundabout WS1/D1 Arterial RURAL
2 26512.67 WA9 14% WA9 13.9% 67 57 35.76588745 70
Attard Notabile Road petrol station roundabout -
WA9 Arterial D1 / D2 URBAN
2 50
Attard Mdina Road WA7 - WA8 Arterial D2 URBAN
1 30015.36 WA7 9.2% WA7 8.2% 62 56 46.26466272 60
Attard Triq Nutar Zarb WA8 - WA9 Arterial S2 URBAN
2 26702.59 WA9 14% WA9 13.9% 64 59 20.05894357 50
Attard/Zebbug Triq H'Attard WD11 - WA9 Distribut
or WS2 RURAL
3 18432.46 WD11 12.4% WD11 14.3% 64 53 3.929047799 60 to 50 on approach to WA9
B'Bugia Triq Kalafrana SA27 - SA27a - SA27b Arterial S2 RURAL
3 1464.299 SA27 12.9% SA27 15.4% 69 63 0 60 reducing to 50 near ETC
Birgu Triq San Dwardu SD8b - SD6a Rural WS2 URBAN
2 1219.321 SD8b 18% SD8b 16.7% 62 55 0 30 (restricted)
B'Kara Triq Dun Karm EA16-EA22-WA2-WA1 Arterial D2 URBAN
1 21429.57 WA2 15% WA2 15.3% 58 51 39.06521939 60
B'Kara Triq il-Wied WD4 - WD3 Distribut
or WS2 URBAN
2 18188.58 WD3 12.5% WD3 15.5% 52 40 107.9479509 50
B'Kara Triq Fleur de Lys WD5-WD4 (20) Distribut
or S2 URBAN
2 18188.58 WD4 13.7% WD4 21% 50 38 45.46144164 50
B'Kara/Balzan Naxxar Road WD3 - WA2 Distribut
or S2 URBAN
2 13793.18 WA2 15% WA2 15.3% 48 36 67.56085987 50
B'Kara/Balzan
Triq Wied/Birbal/Vjal de
Paule WD3-WA8 Distribut
or
D1 FOR VJAL DE PAULE
AND S2 FOR TRIQ BIRBAL AND TRIQ IL-
WIED URBAN
2 8145.839 WD3 12.5% WD3 15.5% 64 54 31.84984966 50
Bormla
Triq San Nikola/Sur ta San Gwann
t'Ghuxa SD3 - SD1 Distribut
or S2 URBAN
2 8485.144 SD1 8.8% SD1 12.5% 62 55 60.92170264 50
Bormla / Fgura Polverista SD4 - SD3 Distribut
or S2 URBAN
2 13395.83 54 48 92.75314672 50
Bormla Triq
Immakulata/Gdida SD3 - SD2 Distribut
or S2 URBAN
2 9522.448 67 60 51.84006541 50
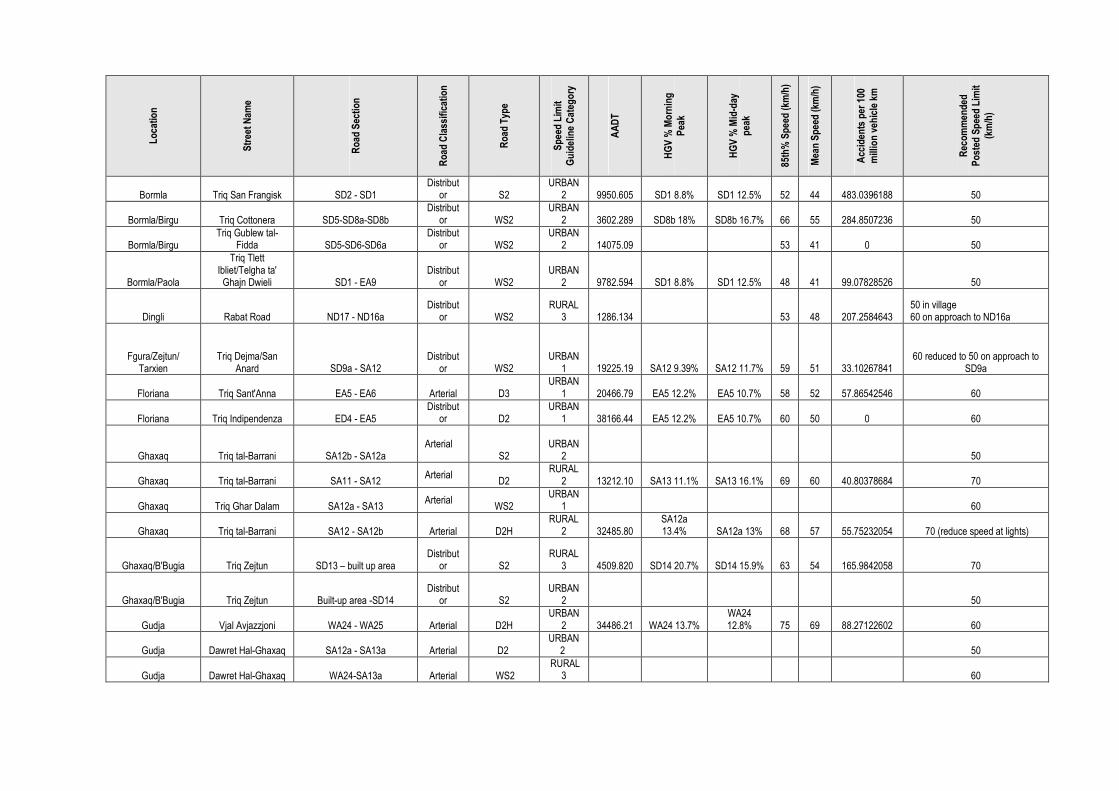
Lo
cati
on
Str
eet
Nam
e
Ro
ad S
ecti
on
Ro
ad C
lass
ific
atio
n
Ro
ad T
ype
Sp
eed
Lim
it
Gu
idel
ine
Cat
ego
ry
AA
DT
HG
V %
Mo
rnin
g
Pea
k
HG
V %
Mid
-day
pea
k
85th
% S
pee
d (
km/h
)
Mea
n S
pee
d (
km/h
)
Acc
iden
ts p
er 1
00
mill
ion
veh
icle
km
Rec
om
men
ded
P
ost
ed S
pee
d L
imit
(km
/h)
Bormla Triq San Frangisk SD2 - SD1 Distribut
or S2 URBAN
2 9950.605 SD1 8.8% SD1 12.5% 52 44 483.0396188 50
Bormla/Birgu Triq Cottonera SD5-SD8a-SD8b Distribut
or WS2 URBAN
2 3602.289 SD8b 18% SD8b 16.7% 66 55 284.8507236 50
Bormla/Birgu Triq Gublew tal-
Fidda SD5-SD6-SD6a Distribut
or WS2 URBAN
2 14075.09 53 41 0 50
Bormla/Paola
Triq Tlett Ibliet/Telgha ta'
Ghajn Dwieli SD1 - EA9 Distribut
or WS2 URBAN
2 9782.594 SD1 8.8% SD1 12.5% 48 41 99.07828526 50
Dingli Rabat Road ND17 - ND16a Distribut
or WS2 RURAL
3 1286.134 53 48 207.2584643 50 in village 60 on approach to ND16a
Fgura/Zejtun/ Tarxien
Triq Dejma/San Anard SD9a - SA12
Distributor WS2
URBAN 1 19225.19 SA12 9.39% SA12 11.7% 59 51 33.10267841
60 reduced to 50 on approach to SD9a
Floriana Triq Sant'Anna EA5 - EA6 Arterial D3 URBAN
1 20466.79 EA5 12.2% EA5 10.7% 58 52 57.86542546 60
Floriana Triq Indipendenza ED4 - EA5 Distribut
or D2 URBAN
1 38166.44 EA5 12.2% EA5 10.7% 60 50 0 60
Ghaxaq Triq tal-Barrani SA12b - SA12a Arterial
S2 URBAN
2 50
Ghaxaq Triq tal-Barrani SA11 - SA12 Arterial
D2 RURAL
2 13212.10 SA13 11.1% SA13 16.1% 69 60 40.80378684 70
Ghaxaq Triq Ghar Dalam SA12a - SA13 Arterial
WS2 URBAN
1
60
Ghaxaq Triq tal-Barrani SA12 - SA12b Arterial D2H RURAL
2 32485.80 SA12a 13.4% SA12a 13% 68 57 55.75232054 70 (reduce speed at lights)
Ghaxaq/B'Bugia Triq Zejtun SD13 – built up area Distribut
or S2 RURAL
3 4509.820 SD14 20.7% SD14 15.9% 63 54 165.9842058 70
Ghaxaq/B'Bugia Triq Zejtun Built-up area -SD14 Distribut
or S2 URBAN
2 50
Gudja Vjal Avjazzjoni WA24 - WA25 Arterial D2H URBAN
2 34486.21 WA24 13.7% WA24 12.8% 75 69 88.27122602 60
Gudja Dawret Hal-Ghaxaq SA12a - SA13a Arterial D2 URBAN
2 50
Gudja Dawret Hal-Ghaxaq WA24-SA13a Arterial WS2 RURAL
3 60

Lo
cati
on
Str
eet
Nam
e
Ro
ad S
ecti
on
Ro
ad C
lass
ific
atio
n
Ro
ad T
ype
Sp
eed
Lim
it
Gu
idel
ine
Cat
ego
ry
AA
DT
HG
V %
Mo
rnin
g
Pea
k
HG
V %
Mid
-day
pea
k
85th
% S
pee
d (
km/h
)
Mea
n S
pee
d (
km/h
)
Acc
iden
ts p
er 1
00
mill
ion
veh
icle
km
Rec
om
men
ded
P
ost
ed S
pee
d L
imit
(km
/h)
Gudja Dawret Hal-Ghaxaq SA13a-SA13 Arterial WS2
URBAN 1
URBAN 2 3230.153 SA13a 8.5%
SA13a 16.1% 63 59 88.54892304
60
50 in central part
Gudja/Safi/Zurrieq Hal Far Road SA27-WA26-WA26a-
WA26b-WA26c Arterial WS2 RURAL
3 60 (reduce speed at barracks)
Gudja/Safi/Zurrieq Hal Far Road WA26-WA24-WA25 Arterial WS2 RURAL
2 14297.80 SA27 12.9% SA27 15.4% 63 56 21.35621983 70 (reduce speed at bends)
Hamrun/Floriana National Road EA7 - EA5 Arterial D3 URBAN
1 42940.44 EA7 10.2% EA7 8.9% 64 60 145.9544172 60
Hamrun/Santa Venera
Santa Venera Tunnels WA18 - WA17 Arterial D2
RURAL 3 18763.07 WA17 11.2%
WA17 9.76% 67 62 56.89643154 60
Kalkara
Triq Santa Liberata/San
Rokku/Missjoni Taljana SD6a - SD7
Distributor WS2
RURAL 4 1920.849 SD6a 9.7% SD6a 11% 60 53 144.6561356 50
Kirkop Triq Industrija WD19 - WD18 Distribut
or D2 URBAN
2 12371.38 WD19 9.1% WD19 8.9% 65 57 61.31137739 50
Kirkop/Luqa Kirkop Tunnels WD18 - WA24 Distribut
or D2 RURAL
2 20522.46 WD18
11.79% WD18 14.6% 74 67 35.457863 70
Lija/Iklin/Naxxar Mosta Road WA2- Lija cemetery Arterial WS2 URBAN
2 50
Lija/Iklin/Naxxar Mosta Road Lija Cemetery - NA21 Arterial WS2 URBAN
1 23548.68 WA2 15% WA2 15.3% 67 61 27.80001577 60
Luqa Triq Kunsill ta l-
Ewropa WA22 - WA23 Arterial D2 RURAL
2 16990.82 WA22 15.1% WA22 14.9% 69 63 127.7097234 70
Luqa Dawret il-Gudja WA23 - WA24 Arterial D2 RURAL
2 15549.17 WA23
14.45% WA23 14.8% 73 67 36.14307652 70
Luqa Qormi Road WA23 - WA27 Arterial WS2 RURAL
3 15088.5 WA27 15.1% WA27 17.6% 72 66 59.3124871 60
Qormi Luqa Road WA27 - WA13 Arterial WS2
URBAN 2
WA13
12.29% WA13 11.6%
50
Marsa Triq is-Sebh WA6 - WA18 Arterial D2 URBAN
2 50
Marsa Triq is-Sebh WA18 - WA19 - WA19a Arterial D2 RURAL
3 60
Marsa Triq is-Sebh WA19a - EA20 Arterial D2H RURAL
3 83658.79 WA19 6.8% WA19 6.7% 21.31736983 60
Marsa Triq Labour EA20a-EA21 Arterial D4 RURAL
3 60+ reduced speed

Lo
cati
on
Str
eet
Nam
e
Ro
ad S
ecti
on
Ro
ad C
lass
ific
atio
n
Ro
ad T
ype
Sp
eed
Lim
it
Gu
idel
ine
Cat
ego
ry
AA
DT
HG
V %
Mo
rnin
g
Pea
k
HG
V %
Mid
-day
pea
k
85th
% S
pee
d (
km/h
)
Mea
n S
pee
d (
km/h
)
Acc
iden
ts p
er 1
00
mill
ion
veh
icle
km
Rec
om
men
ded
P
ost
ed S
pee
d L
imit
(km
/h)
Marsa Triq Aldo Moro EA20 - EA20a Arterial D4 RURAL
3 93522.68 EA20 8.2% EA20 11.6% 78 68 38.49970312 60
Marsa Triq Dicembru 13 EA7a - EA7 Arterial D2H RURAL
3 50081.28 EA7 10.2% EA7 8.9% 72 68 43.19476755 60
Marsa/Luqa Triq Garibaldi WA22 - EA20a Arterial D2H RURAL
2 16600.60 EA21 10.3% EA21 10.8% 77 67 16.86209429 70 to 40 at Industrial Estate
Marsascala Triq Sant' Antnin
tal-Plier SD8-Triq Latmija Distribut
or WS2 URBAN
2 50
Marsascala Triq Sant' Antnin
tal-Plier Triq Latmija -SD15a Distribut
or D1 RURAL
3 10500.64 SD15 11.6% SD15 8.5% 62 54 6.650784448 60
Marsascala Triq Sant' Antnin
tal-Plier SD15 - SD15a Distribut
or D1H URBAN
2
50
Marsaxlokk Tas-Silg to Power
Station SD17 - SD16 Distribut
or D1H RURAL
4 2767.137 51 45 0 50
Marsaxlokk Triq Bir
Rikka/Melqart SD16 - SD16a Distribut
or 1-WAY 1-
LANE URBAN
2 3029.623 59 52 0 50
Marsaxlokk/Zejtun Triq
Zejtun/Marsaxlokk SD16a - SA13 Distribut
or WS2 RURAL
3 4743.663 SA13 11.1% SA13 16.1% 13.96071796 70 (reduce speed at traffic lights)
Mdina/Rabat Srina to Saqqajja NA14 - NA15 Distribut
or WS2 RURAL
3 12304.57 NA14 7.7% NA14 8.3% 69 62 71.0614388 60
Mellieha Cirkewwa Road NA1 - NA2 Arterial WS2 RURAL
3 4552.564 NA1 34.3% NA1 32.2% 70 64 121.5754261
60 (reduced speed) To be reviewed when
reconstructed
Mellieha Marfa Road NA2 - NA3 Arterial WS2 RURAL
3 6633.737 72 67 134.865244
60 To be reviewed when
reconstructed
Mellieha Mellieha Bay NA3 - NA4a Arterial D2 RURAL
2 6454.886 54 49 0 60
Mellieha Mellieha By Pass NA4a-NA5 Arterial WS4 RURAL
3 60
30 on hairpin bend
Mellieha Mellieha By Pass NA5-NA5a-NA6 Arterial
WS2H FROM NA6 TO NA5
AND D1 FROM NA5
TO NA4 RURAL
1 6313.973 NA6 17.3% NA6 18.5% 15.43082137 80
Mellieha Mistra Road NA6 – Mistra Village rbt Arterial WS2 RURAL
3 3289.77 NA7 11.28% NA7 13.2% 68 62 9.384738375 60
40 at hairpin bend

Lo
cati
on
Str
eet
Nam
e
Ro
ad S
ecti
on
Ro
ad C
lass
ific
atio
n
Ro
ad T
ype
Sp
eed
Lim
it
Gu
idel
ine
Cat
ego
ry
AA
DT
HG
V %
Mo
rnin
g
Pea
k
HG
V %
Mid
-day
pea
k
85th
% S
pee
d (
km/h
)
Mea
n S
pee
d (
km/h
)
Acc
iden
ts p
er 1
00
mill
ion
veh
icle
km
Rec
om
men
ded
P
ost
ed S
pee
d L
imit
(km
/h)
Xemxija Xemxija Hill Mistra Village Rbt- NA7 Arterial S2 URBAN
2 50
Mgarr Triq Ghajn Tuffieha NA7 - NR9-NR8 Rural S2 RURAL
2 70
Mgarr Gnejna Road ND20a - NR22-NR21 Rural S2
RURAL 4
URBAN 2 50
Mgarr Triq Banjijiet
Rumani NR11 - ND20 Rural S2 URBAN
2 50
Mgarr Triq Sir Temi
Zammit NR11 - ND19 Rural S2
RURAL 2
URBAN 4
70
50 in built up area
Mgarr Triq Ghajn Tuffieha NR9 – Built-up area Rural S2 RURAL
3 70 (reduced Speed at bend)
Mgarr Triq Ghajn Tuffieha Built-up area-NR11 Rural S2 URBAN
2 50
Mgarr Triq Zebbiegh ND19 - ND20 Distribut
or WS2 URBAN
2 1948.688 ND20 16.1% ND20 15.8% 68 61 464.0045041 50
Mgarr Triq Fisher ND20 - ND20a Distribut
or S2 URBAN
2 1909.714 ND20 16.1% ND20 15.8% 42 38 0 50
Mosta Valletta Road NA21 - NA22 Arterial D2 URBAN
1 29098.47 NA21 9.4% NA21 13.4% 67 60 81.44774175 60
Mosta Qlejja to Targa Gap (Missjunarji Maltin) ND12-ND12a-ND3
Distributor S2
RURAL 2 70
Mosta Qlejja to Targa Gap (Missjunarji Maltin) ND12 - ND13
Distributor WS2
RURAL 3 14741.63 ND12 19.8%
ND12 21.4% 60.37995235 60
Mosta Triq Millbrae ND3 - ND3a Distribut
or WS2 RURAL
4 ND3 14.5% ND3 12.8% 50
Mosta Triq Difiza Civili ND3a - ND2 Distribut
or WS2 RURAL
3 6790.909 ND3 14.5% ND3 12.8% 56 47 0 70
reducing speed to 50 at bend
Mosta Vjal Indipendenza NA22 - ND11 Distribut
or WS2 URBAN
2 16643.96 NA22 11.6% NA22 12.6% 57 50 53.79340593 50
Mosta Triq Kbira ND11 - ND12 Distribut
or WS2 RURAL
3 2232.924 ND12 19.8% ND12 21.4% 43 39 377.6446687 60
Mosta Triq Kungress
Ewkaristiku NA22 - ND5 Distribut
or 1-WAY 1-
LANE URBAN
2 4628.440 ND5 19.6% ND5 18.4% 52 40 232.8152655 50
Triq Kostituzzjoni ND3-ND4-ND5 Distribut
or S2 URBAN
2 7495.472 ND3 14.5% ND3 12.8% 53 41 181.8494735 50
Mosta Triq il-Kbira ND11 to Constitution Street Rural S1 URBAN 43 39 40

Lo
cati
on
Str
eet
Nam
e
Ro
ad S
ecti
on
Ro
ad C
lass
ific
atio
n
Ro
ad T
ype
Sp
eed
Lim
it
Gu
idel
ine
Cat
ego
ry
AA
DT
HG
V %
Mo
rnin
g
Pea
k
HG
V %
Mid
-day
pea
k
85th
% S
pee
d (
km/h
)
Mea
n S
pee
d (
km/h
)
Acc
iden
ts p
er 1
00
mill
ion
veh
icle
km
Rec
om
men
ded
P
ost
ed S
pee
d L
imit
(km
/h)
2
Mosta/St Paul Bay Triq Burmarrad ND1-ND1a-ND2 Distribut
or URBAN
2 50
Mosta/St Paul Bay Triq Burmarrad ND3 - ND1 Distribut
or WS2H RURAL
1 20681.65 ND2a 7.69% ND2a 3.3% 62 47 66.42437409 ND1 - ND1a 50km/h
Mosta/Mgarr Triq Xifer il-Kief/il-Mosta (Imselliet) ND12 - ND19
Distributor WS2
RURAL 2 4471.269 ND12 19.8%
ND12 21.4% 68 61 0 70 (reduce speed near school)
Mqabba Triq Qrendi/Konvoj
ta' Santa Marija WD20 - WR4 Distribut
or WS2
URBAN 1
URBAN 2
60
50
Mqabba Triq Qrendi/Konvoj
ta' Santa Marija WD20 - WD19 Distribut
or WS2H URBAN
4 4742.255 WD19 9.1% WD19 8.9% 67 55 18.30565352 60
Msida Triq Psaila WD4-WA17 Distribut
or S2 URBAN
2 50
Msida Triq Wied ED3 – EA16a Arterial WS2 URBAN
2 15049.43 EA16a 12.4%
EA16a 13.6% 50 39 178.9173288 50
Birkirkara Regional Road EA16 - WA17 Arterial D2 RURAL
3 58984.00 WA17 11.2% WA17 9.76% 66 53 68.62216671
60 on approach to EA16 40 approach to Msida bridge
Msida Triq MA Vassalli ED3a-EA16-EA15-EA-14-
EA12-EA16a Arterial D2 URBAN
1
60
Mtarfa Triq Ghajn Qajjiet ND13 - ND21 Arterial D1 RURAL
2 6436.238 ND13 13.1% ND13 13.1% 68 55 0 70 reduce speed to 50 at ND21
Mtarfa Mtarfa By Pass NA15 - ND13 Arterial D2 RURAL
2 2639.080 NA15 10.5% NA15 9.96% 66 61 0 70
Naxxar Triq il-Kosta NA8-NA9-NA9a-NA10a-
NA10b Arterial S2 RURAL
2 70
Naxxar Triq il-Kosta NA10a - NA10 Arterial S2 URBAN
2 30800.26 NA9 7.56% NA9 7.2% 72 67 40.43518303 50
Naxxar Triq Parrocca ND9 - ND8 Distribut
or S2 URBAN
2 14765.48 ND9 11.9% ND9 11.3% 51 40 32.55251095 50
Naxxar Telgha t'Alla w
Ommu NA9a- built-up area Rural S2 RURAL
2 18000.30 60 47 0 70
(reduce speed near NA9a)
Naxxar Telgha t'Alla w
Ommu Built-up area Rural S2 URBAN
2
50
Naxxar Telgha t'Alla w
Ommu Maghtab Access
Roundabout Rural D1 RURAL
4 50

Lo
cati
on
Str
eet
Nam
e
Ro
ad S
ecti
on
Ro
ad C
lass
ific
atio
n
Ro
ad T
ype
Sp
eed
Lim
it
Gu
idel
ine
Cat
ego
ry
AA
DT
HG
V %
Mo
rnin
g
Pea
k
HG
V %
Mid
-day
pea
k
85th
% S
pee
d (
km/h
)
Mea
n S
pee
d (
km/h
)
Acc
iden
ts p
er 1
00
mill
ion
veh
icle
km
Rec
om
men
ded
P
ost
ed S
pee
d L
imit
(km
/h)
Naxxar Birguma Bypass Roundabout-ND9 Rural S2 URBAN
1 60
Naxxar Triq Labour ND8 - NA21 Distribut
or WS2 URBAN
2 19481.31 NA21 9.4% NA21 13.4% 65 53 18.97888607 60
Paola Triq Buhagiar AE9-Roundabout Arterial WS2 URBAN
2 50
Paola Triq Buhagiar Roundabout -EA23 Arterial “S2 RURAL
3 60
Paola Triq Kordin EA8 - EA9 Arterial D2 URBAN
1 13717.31 EA8 7.7% EA8 9.4% 54 50 69.95713701 60
Paola Sir Paul Boffa
Avenue EA8 - EA21 Arterial D2 URBAN
1 44756.04 EA21 10.3% EA21 10.8% 68 63 48.142197 60
Paola Vjal St Lucija EA21 - SA11 Arterial D2 RURAL
2 25261.31 SA11 10.8% SA11 13.8% 69 64 108.5232275 70
Paola/St Lucija Luqa Road SA11 - WA22 Arterial S2 URBAN
1 12367.80 WA22 15.1% WA22 14.9% 77 71 68.43400323 60 (reduce speed near school)
Pembroke/Naxxar St Andrews Road NA10-NA11a-NA11 Arterial WS2 RURAL
2 26133.89 NA11 10.9% NA11 12.9% 66 61 23.37440863 70
Pembroke/Naxxar St Andrews Road NA11-NA11a-EA12 Arterial WS2 URBAN
1 60
Pieta Triq Marina ED4 - ED3 Distribut
or D2 URBAN
2 42860.00 ED3 9.4% ED3 10% 65 58 42.75192494 50 (dangerous bend)
Qormi Mriehel bypass WA6 - WA7 Arterial D2H RURAL
1 26201.50 WA7 9.2% WA7 8.2% 69 62 17.6836971 80
Qormi Triq Manuel Dimech WA13 - WA12 Arterial S4 URBAN
1 14243.02 WA12 10.5% WA12 13% 53 48 120.6282354 60
Qormi Triq Qormi WA12 - WA19 Arterial D2
RURAL
3 WA19 6.8% WA19 6.7% 60
Qormi Triq Imdina WA13 - WD14 Distribut
or D2H
URBAN 1
RURAL 2 22426.80
WA13 12.29%
WA13 11.6% 63 50 112.0206231
50 eastbound
60 westbound
Rabat Triq Hal Tartani ND16 - ND16a Arterial WS2 URBAN
2 4086.677 ND16 12.1% ND16 13.4% 58 53 176.6546318 50
Rabat Triq Dingli/Vjal
Haddiem to Dingli ND16a - ND21b Distribut
or WS2 URBAN
2 3763.751 53 54 78.52472769 50
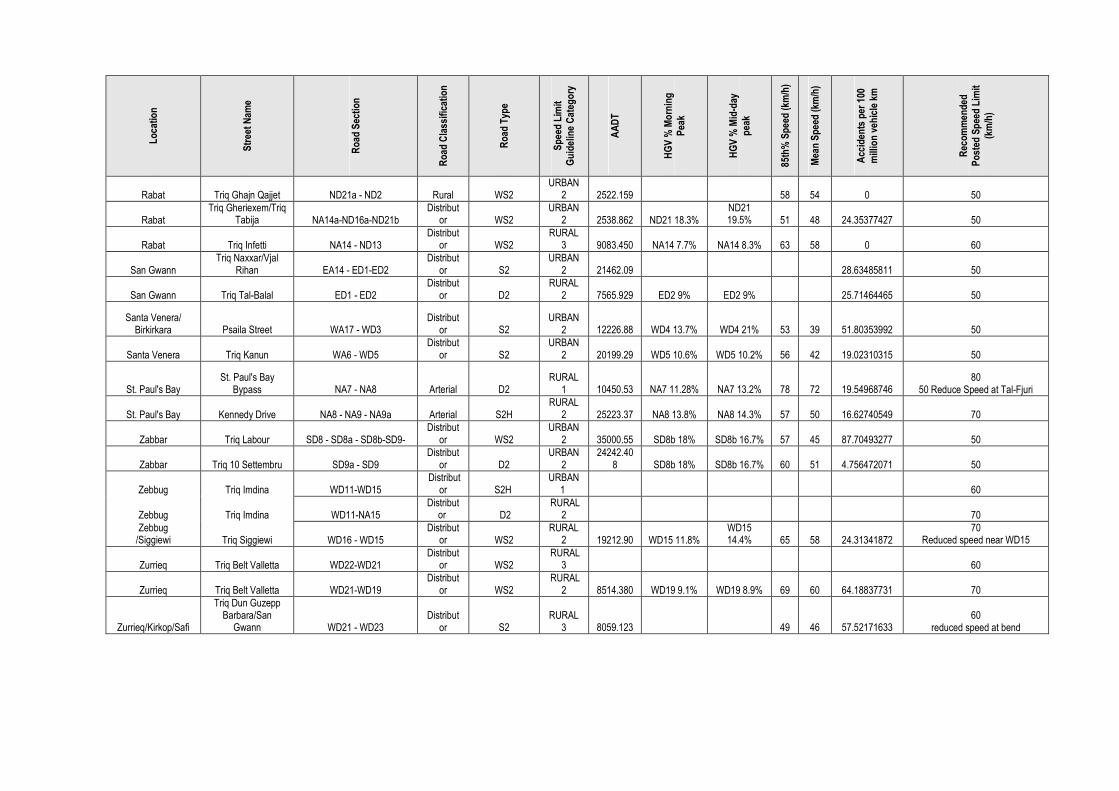
Lo
cati
on
Str
eet
Nam
e
Ro
ad S
ecti
on
Ro
ad C
lass
ific
atio
n
Ro
ad T
ype
Sp
eed
Lim
it
Gu
idel
ine
Cat
ego
ry
AA
DT
HG
V %
Mo
rnin
g
Pea
k
HG
V %
Mid
-day
pea
k
85th
% S
pee
d (
km/h
)
Mea
n S
pee
d (
km/h
)
Acc
iden
ts p
er 1
00
mill
ion
veh
icle
km
Rec
om
men
ded
P
ost
ed S
pee
d L
imit
(km
/h)
Rabat Triq Ghajn Qajjet ND21a - ND2 Rural WS2 URBAN
2 2522.159 58 54 0 50
Rabat Triq Gheriexem/Triq
Tabija NA14a-ND16a-ND21b Distribut
or WS2 URBAN
2 2538.862 ND21 18.3% ND21 19.5% 51 48 24.35377427 50
Rabat Triq Infetti NA14 - ND13 Distribut
or WS2 RURAL
3 9083.450 NA14 7.7% NA14 8.3% 63 58 0 60
San Gwann Triq Naxxar/Vjal
Rihan EA14 - ED1-ED2 Distribut
or S2 URBAN
2 21462.09 28.63485811 50
San Gwann Triq Tal-Balal ED1 - ED2 Distribut
or D2 RURAL
2 7565.929 ED2 9% ED2 9% 25.71464465 50
Santa Venera/ Birkirkara Psaila Street WA17 - WD3
Distributor S2
URBAN 2 12226.88 WD4 13.7% WD4 21% 53 39 51.80353992 50
Santa Venera Triq Kanun WA6 - WD5 Distribut
or S2 URBAN
2 20199.29 WD5 10.6% WD5 10.2% 56 42 19.02310315 50
St. Paul's Bay St. Paul's Bay
Bypass NA7 - NA8 Arterial D2 RURAL
1 10450.53 NA7 11.28% NA7 13.2% 78 72 19.54968746 80
50 Reduce Speed at Tal-Fjuri
St. Paul's Bay Kennedy Drive NA8 - NA9 - NA9a Arterial S2H RURAL
2 25223.37 NA8 13.8% NA8 14.3% 57 50 16.62740549 70
Zabbar Triq Labour SD8 - SD8a - SD8b-SD9- Distribut
or WS2 URBAN
2 35000.55 SD8b 18% SD8b 16.7% 57 45 87.70493277 50
Zabbar Triq 10 Settembru SD9a - SD9 Distribut
or D2 URBAN
2 24242.40
8 SD8b 18% SD8b 16.7% 60 51 4.756472071 50
Zebbug Triq Imdina WD11-WD15 Distribut
or S2H URBAN
1 60
Zebbug Triq Imdina WD11-NA15 Distribut
or D2 RURAL
2 70
Zebbug /Siggiewi Triq Siggiewi WD16 - WD15
Distributor WS2
RURAL 2 19212.90 WD15 11.8%
WD15 14.4% 65 58 24.31341872
70 Reduced speed near WD15
Zurrieq Triq Belt Valletta WD22-WD21 Distribut
or WS2 RURAL
3 60
Zurrieq Triq Belt Valletta WD21-WD19 Distribut
or WS2 RURAL
2 8514.380 WD19 9.1% WD19 8.9% 69 60 64.18837731 70
Zurrieq/Kirkop/Safi
Triq Dun Guzepp Barbara/San
Gwann WD21 - WD23 Distribut
or S2 RURAL
3 8059.123 49 46 57.52171633 60
reduced speed at bend
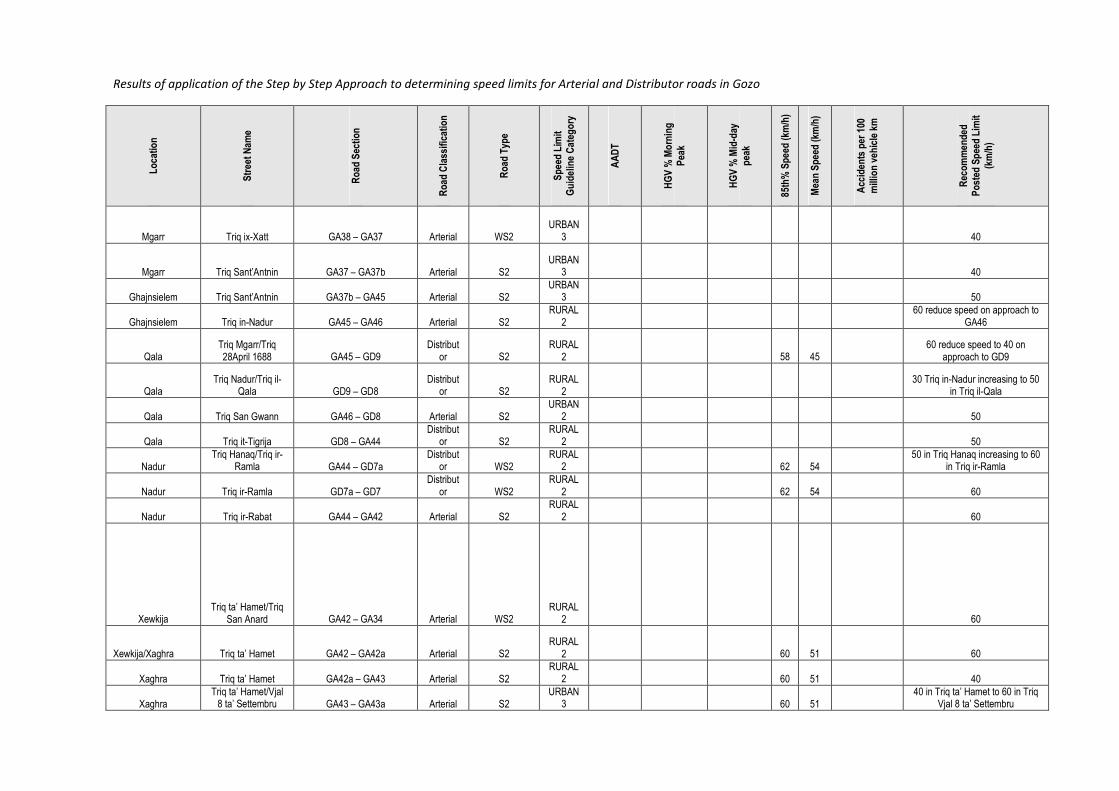
Results of application of the Step by Step Approach to determining speed limits for Arterial and Distributor roads in Gozo
Lo
cati
on
Str
eet
Nam
e
Ro
ad S
ecti
on
Ro
ad C
lass
ific
atio
n
Ro
ad T
ype
Sp
eed
Lim
it
Gu
idel
ine
Cat
ego
ry
AA
DT
HG
V %
Mo
rnin
g
Pea
k
HG
V %
Mid
-day
pea
k
85th
% S
pee
d (
km/h
)
Mea
n S
pee
d (
km/h
)
Acc
iden
ts p
er 1
00
mill
ion
veh
icle
km
Rec
om
men
ded
P
ost
ed S
pee
d L
imit
(km
/h)
Mgarr Triq ix-Xatt GA38 – GA37 Arterial WS2 URBAN
3 40
Mgarr Triq Sant’Antnin GA37 – GA37b Arterial S2 URBAN
3 40
Ghajnsielem Triq Sant’Antnin GA37b – GA45 Arterial S2 URBAN
3 50
Ghajnsielem Triq in-Nadur GA45 – GA46 Arterial S2 RURAL
2 60 reduce speed on approach to
GA46
Qala Triq Mgarr/Triq 28April 1688 GA45 – GD9
Distributor S2
RURAL 2 58 45
60 reduce speed to 40 on approach to GD9
Qala Triq Nadur/Triq il-
Qala GD9 – GD8 Distribut
or S2 RURAL
2 30 Triq in-Nadur increasing to 50
in Triq il-Qala
Qala Triq San Gwann GA46 – GD8 Arterial S2 URBAN
2 50
Qala Triq it-Tigrija GD8 – GA44 Distribut
or S2 RURAL
2 50
Nadur Triq Hanaq/Triq ir-
Ramla GA44 – GD7a Distribut
or WS2 RURAL
2 62 54 50 in Triq Hanaq increasing to 60
in Triq ir-Ramla
Nadur Triq ir-Ramla GD7a – GD7 Distribut
or WS2 RURAL
2 62 54 60
Nadur Triq ir-Rabat GA44 – GA42 Arterial S2 RURAL
2 60
Xewkija Triq ta’ Hamet/Triq
San Anard GA42 – GA34 Arterial WS2 RURAL
2 60
Xewkija/Xaghra Triq ta’ Hamet GA42 – GA42a Arterial S2 RURAL
2 60 51 60
Xaghra Triq ta’ Hamet GA42a – GA43 Arterial S2 RURAL
2 60 51 40
Xaghra Triq ta’ Hamet/Vjal
8 ta’ Settembru GA43 – GA43a Arterial S2 URBAN
3 60 51 40 in Triq ta’ Hamet to 60 in Triq
Vjal 8 ta’ Settembru

Lo
cati
on
Str
eet
Nam
e
Ro
ad S
ecti
on
Ro
ad C
lass
ific
atio
n
Ro
ad T
ype
Sp
eed
Lim
it
Gu
idel
ine
Cat
ego
ry
AA
DT
HG
V %
Mo
rnin
g
Pea
k
HG
V %
Mid
-day
pea
k
85th
% S
pee
d (
km/h
)
Mea
n S
pee
d (
km/h
)
Acc
iden
ts p
er 1
00
mill
ion
veh
icle
km
Rec
om
men
ded
P
ost
ed S
pee
d L
imit
(km
/h)
Xewkija Triq il-Madonna tar-
Rummiena GA42 – GA35 Distribut
or S2 RURAL
2 60
Ghajnsielem Triq Mgarr GA37 – GA37a Arterial S4 RURAL
1 7193.44 60
Ghajnsielem Triq Mgarr GA37a – GA36 Arterial WS2 RURAL
1 50
Ghajnsielem/ Xewkija Triq Mgarr GA36 – GA35a Arterial WS2
URBAN 2 59 51 50 in Ghajsielem to 60 in Xewkija
Xewkija Triq Mgarr GA35a – GA35 Arterial WS2 URBAN
2 59 51 60
Xewkija Triq Mgarr GA35 – GA34 Arterial WS2 RURAL
2 64 53 60
Xewkija Triq il-Mithna/Triq
Hamrija GA35 – GD13 Distribut
or S2 URBAN
2 30 in Triq il-Mithna to 50 in Triq
Hamrija
Xewkija Triq ta’ Sannat/TRiq
Xewkija GD13 – GD11 Distribut
or S2 RURAL
3 59 50 60 with REDUCE SPEED at bend
Sannat Triq ta’Sannat GD11 – GD11a
Distributor S2
RURAL 2 70 60 60
Sannat Triq ta’Cenc GD11a – GD12 Distribut
or S2 RURAL
3 50
Xewkija/Rabat Triq Ta’ Sannat/Triq
Tabib Tabone GD11 – GD10
Distributor
S2
RURAL 2/
URBAN 3
70 60
60 in Triq ta’ Sannat to 40 in Triq
Tabib Tabone
Sannat Triq Marsiena GD11 – GD15 Distribut
or S2 RURAL
2 59 60 60
Sannat/Rabat Triq San Duminka GD15 – GD14 Distribut
or S2
RURAL 2/
URBAN 3 50 in Sannat to 40 in Rabat
Xlendi/Rabat Triq Xlendi GD17 – GD16 Distribut
or S2 RURAL
2 48 41 60 in Xlendi to 40 in Rabat
Rabat Triq l-IsptarSan
Giljan GD16 – GD14 Distribut
or S2 URBAN
3 40
Rabat Triq Ghajn Qatet GD13 – GD21 Distribut
or S2 URBAN
3 40
Rabat Triq Archisqof Pietru Pace GD21 – GD34
Distributor S2
URBAN 3 40

Lo
cati
on
Str
eet
Nam
e
Ro
ad S
ecti
on
Ro
ad C
lass
ific
atio
n
Ro
ad T
ype
Sp
eed
Lim
it
Gu
idel
ine
Cat
ego
ry
AA
DT
HG
V %
Mo
rnin
g
Pea
k
HG
V %
Mid
-day
pea
k
85th
% S
pee
d (
km/h
)
Mea
n S
pee
d (
km/h
)
Acc
iden
ts p
er 1
00
mill
ion
veh
icle
km
Rec
om
men
ded
P
ost
ed S
pee
d L
imit
(km
/h)
Rabat Triq Fortunato Mizzi GA34 – GA33 Arterial WS2 URBAN
4 18795.59 40
Rabat Triq Fortunato Mizzi GA33 – GA32 Distribut
or WS2 URBAN
4 40
Rabat Triq ta’ Viani/Triq
Ewropa GA33 – GA40 Arterial S2 URBAN
3 40
Rabat Triq Kapuccini GA40 – GA32 Arterial S1 URBAN
3 40
Rabat Triq Vassallo/Triq
ta’ Wara s-Sur GA40 – GA39 Arterial S2 URBAN
3 60
Rabat Triq l-Imghallem GA31 – GA39 Arterial S2 URBAN
4 50
Rabat/Xaghra/ Marsalforn
Triq Kapuccini/ Triq Marsalforn GA40 – GA41 Arterial S2
RURAL 2 50 43 60
Rabat/Zebbug Triq l-Imghallem GA39 – GD4 Distribut
or S2 RURAL
2 50 43 60 REDUCE SPEED on
approach to GD4
Zebbug Triq il-Knisja GD4 – GD5 Distribut
or S2
RURAL 2/URBA
N 3 61 53 60
Zebbug Triq iz-Zebbug GD4 – GD3 Distribut
or S2 RURAL
3 51 44 60
Ghasri Triq Dun K.Caruana GD3 – GA29 Distribut
or S2 RURAL
2 51 44 60
Rabat Triq Repubblika GA32 – GA31 Arterial S2 URBAN
4 29488.69
7 40
Rabat Triq Sant’Orsla GA31 – GA30 Arterial S2 URBAN
4 40
Rabat That Putirjal GA32 – GD21 Arterial S2
URBAN 4
40
Rabat Triq Enrico Mizzi GD21 – GD10 Distribut
or S1 URBAN
4 40
Rabat Triq Enrico Mizzi GD10 – GD14 Distribut
or S1 URBAN
4 40
Rabat Triq tal-Ghajn GD16 – GD19 Distribut
or S1 URBAN
4 40
Rabat Triq il-Wied/Triq
Kercem GD19 – GD18 Distribut
or S2 URBAN
3 40
Rabat Triq Gedrin GD19 – GA30 Distribut
or S1 URBAN
3 40

Lo
cati
on
Str
eet
Nam
e
Ro
ad S
ecti
on
Ro
ad C
lass
ific
atio
n
Ro
ad T
ype
Sp
eed
Lim
it
Gu
idel
ine
Cat
ego
ry
AA
DT
HG
V %
Mo
rnin
g
Pea
k
HG
V %
Mid
-day
pea
k
85th
% S
pee
d (
km/h
)
Mea
n S
pee
d (
km/h
)
Acc
iden
ts p
er 1
00
mill
ion
veh
icle
km
Rec
om
men
ded
P
ost
ed S
pee
d L
imit
(km
/h)
Rabat Triq Papa Gwanni II GA30 – GA29 Arterial WS2 RURAL
2 55 47 40 increasing to 60 towards
GA29
Ghasri/Gharb Triq Gharb GA29 – GA28 Arterial S2 RURAL
2 40 increasing to 50 towards
GA28
Gharb Triq Gharb/Triq Frangisk Portelli GA28 – GD1 Arterial S2
RURAL 2 50
Sa Lawrenz Triq Duluri/Triq
Gebla tal-General GD1 – GD2 Arterial S2 RURAL
2 50 with REDUCE SPEED at
bends

ANNEX 2
Technical Guidance to making sure people actually know the
speed limit in force
(Section 6)

a. Traffic Calming guidelines
MEASURE PHYSICAL PROPERTIES USAGE
Bar Markings • Yellow transverse bar markings. • To draw attention to an approaching junction;
• On high speed roads;
• Used prior to a change in speed-limit.
Pinch Points • An extension of the footway at the side of the road;
• May include landscaping.
• Narrowing of carriageway;
• Re-organisation of on-street parking;
• A reduction in speed;
• May include a raised pedestrian crossing and a central refuge.
Chicanes • May include one or more build outs on alternate sides of the road;
• May include a deflection in road alignment;
• May include landscaping.
• Narrowing of the carriageway;
• A reduction in speed;
• May include a raised pedestrian crossing and a central refuge;
• May have speed cushions;
• Spacing distance of 10m-15m.
Entry Treatment • Change in surface or raised area or a combination of both.
• A reduction in speed;
• May include a raised pedestrian crossing.
Islands and Pedestrians Refuges
• Usually a longitudinal island built in the carriageway.
• To improve lane discipline;
• Restrict overtaking;
• A reduction in speeds;
• May be used as a pedestrian refuge.
Mini Roundabouts • A small roundabout
(diameter[4meters)either painted or constructed as a raised round area;
• Mountable;
• External diameter [ 28m;
• Speeds [ 48km/h;
• Conventional roundabout is used where the external diameter exceeds 39meters.
• On straight roads to break up the road into sections;
• At tee-junctions, crossroads or Y-junctions;
• Regulate conflicting movements;
• A reduction in speeds.
Road Hump • Transverse raised section of the road. • A reduction in speed.
Home Zones • Scope is to strike a balance between vehicular traffic and vulnerable road users
• Promote speed reduction through physical alterations of streets.
• Reduced speed to 20km/h
• In residential areas
• Areas which generate high pedestrian and cycling traffic
• Main commercial and recreational areas.

SPEED LIMITS
Aims of Measure:
To improve road safety by establishing the speed limits.
Implementation of Measure:
• identification the extent of the area of influence
• determination of the revised speed limit
- not exceeding 80km/h for arterial/distributor roads
- not exceeding 60km/h on roads with linking function
- not exceeding 40km/h for local access roads
- not exceeding 30km/h for village core and road widths less than 3.0m
• implementation of SPEED LIMIT sign and the corresponding END OF SPEED LIMIT sign (as per Traffic Signs and
Carriageway Markings Regulations, Subsidiary Legislation Section 65)
• implementation of speed roundels (advisory)
• implementation of REDUCE SPEED NOW signs (advisory)
• SLOW road markings (advisory)
SIGNAGE
ROAD MARKINGS
Constraints:
• location of school access
• traffic volumes on adjoining roads
• 85th
percentile speed limit of adjoining roads
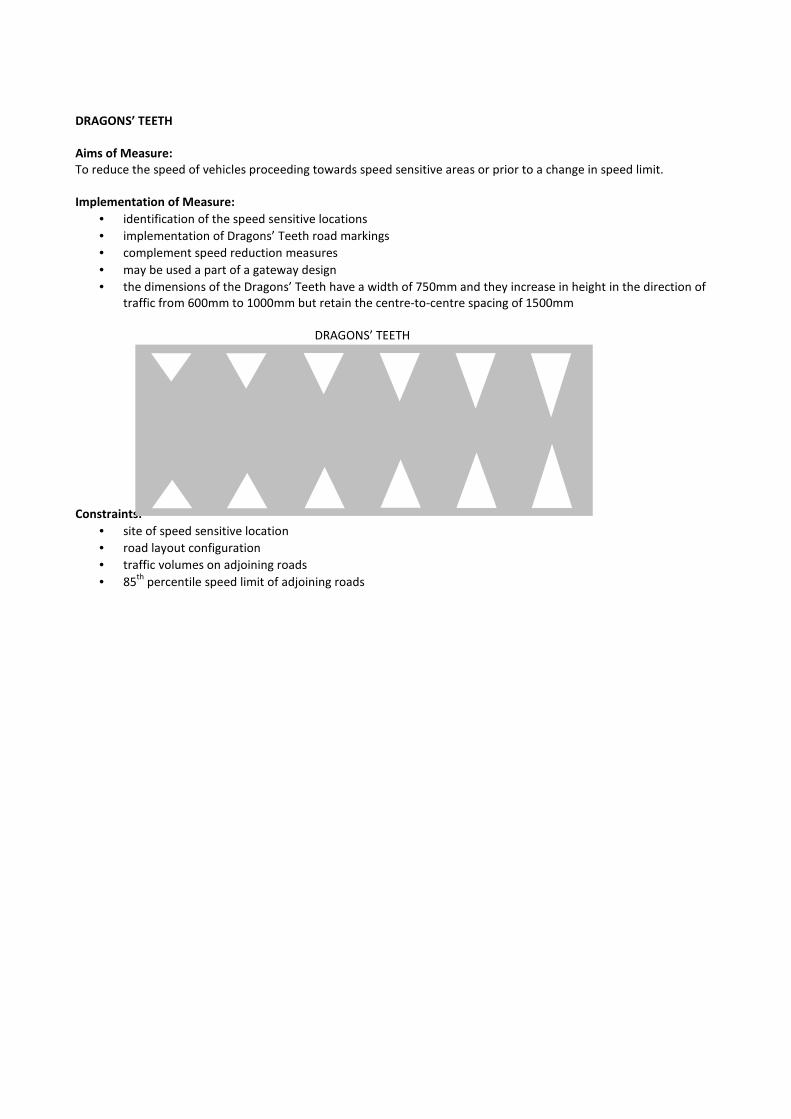
DRAGONS’ TEETH
Aims of Measure:
To reduce the speed of vehicles proceeding towards speed sensitive areas or prior to a change in speed limit.
Implementation of Measure:
• identification of the speed sensitive locations
• implementation of Dragons’ Teeth road markings
• complement speed reduction measures
• may be used a part of a gateway design
• the dimensions of the Dragons’ Teeth have a width of 750mm and they increase in height in the direction of
traffic from 600mm to 1000mm but retain the centre-to-centre spacing of 1500mm
DRAGONS’ TEETH
Constraints:
• site of speed sensitive location
• road layout configuration
• traffic volumes on adjoining roads
• 85th
percentile speed limit of adjoining roads
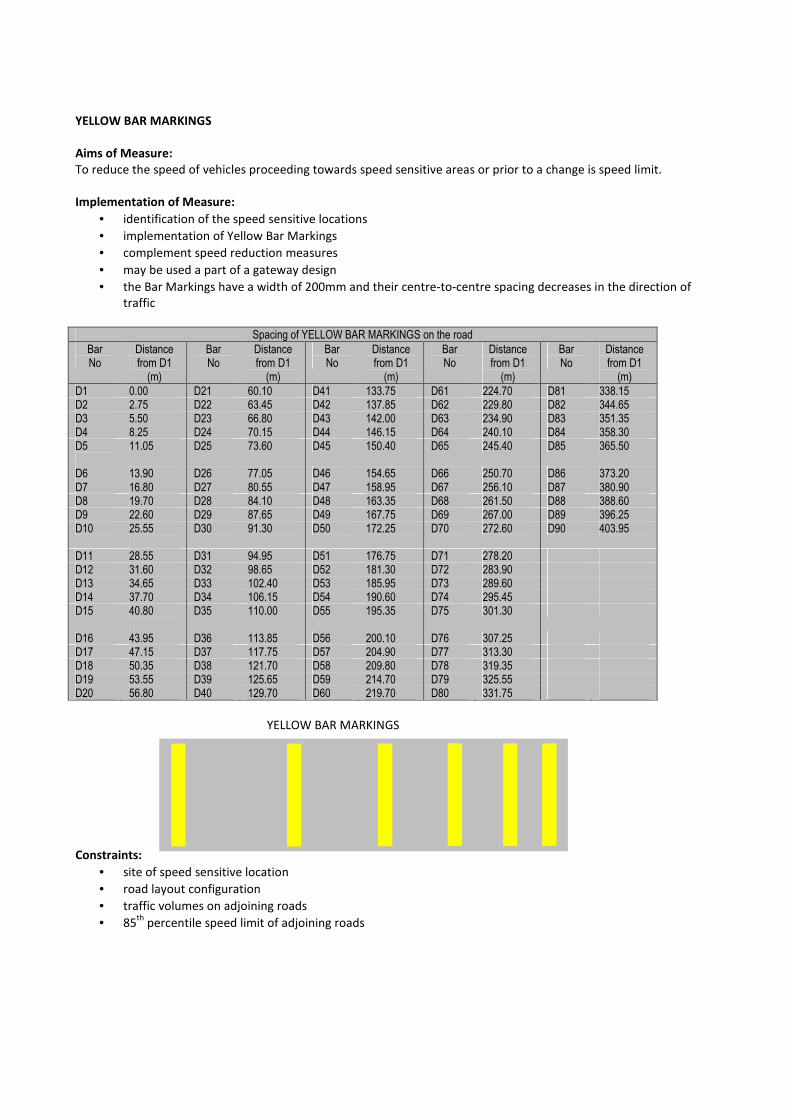
YELLOW BAR MARKINGS
Aims of Measure:
To reduce the speed of vehicles proceeding towards speed sensitive areas or prior to a change is speed limit.
Implementation of Measure:
• identification of the speed sensitive locations
• implementation of Yellow Bar Markings
• complement speed reduction measures
• may be used a part of a gateway design
• the Bar Markings have a width of 200mm and their centre-to-centre spacing decreases in the direction of
traffic
Spacing of YELLOW BAR MARKINGS on the road
Bar No
Distance from D1
(m)
Bar No
Distance from D1
(m)
Bar No
Distance from D1
(m)
Bar No
Distance from D1
(m)
Bar No
Distance from D1
(m)
D1 0.00 D21 60.10 D41 133.75 D61 224.70 D81 338.15 D2 2.75 D22 63.45 D42 137.85 D62 229.80 D82 344.65 D3 5.50 D23 66.80 D43 142.00 D63 234.90 D83 351.35 D4 8.25 D24 70.15 D44 146.15 D64 240.10 D84 358.30 D5
11.05 D25 73.60 D45 150.40 D65 245.40 D85 365.50
D6 13.90 D26 77.05 D46 154.65 D66 250.70 D86 373.20 D7 16.80 D27 80.55 D47 158.95 D67 256.10 D87 380.90 D8 19.70 D28 84.10 D48 163.35 D68 261.50 D88 388.60 D9 22.60 D29 87.65 D49 167.75 D69 267.00 D89 396.25 D10 25.55
D30 91.30 D50 172.25 D70 272.60 D90 403.95
D11 28.55 D31 94.95 D51 176.75 D71 278.20 D12 31.60 D32 98.65 D52 181.30 D72 283.90 D13 34.65 D33 102.40 D53 185.95 D73 289.60 D14 37.70 D34 106.15 D54 190.60 D74 295.45 D15 40.80
D35 110.00 D55 195.35 D75 301.30
D16 43.95 D36 113.85 D56 200.10 D76 307.25 D17 47.15 D37 117.75 D57 204.90 D77 313.30 D18 50.35 D38 121.70 D58 209.80 D78 319.35 D19 53.55 D39 125.65 D59 214.70 D79 325.55 D20 56.80 D40 129.70 D60 219.70 D80 331.75
YELLOW BAR MARKINGS
Constraints:
• site of speed sensitive location
• road layout configuration
• traffic volumes on adjoining roads
• 85th
percentile speed limit of adjoining roads

ROUND TOPPED ROAD HUMPS
Aims of Measure:
To reduce the speed of vehicles proceeding towards speed sensitive areas.
Implementation of Measure:
• identification of the speed sensitive locations
• implementation of Round Topped Road Hump
• complement speed reduction measures
• for two-way roads, the road hump should not be implemented within the 15m distance from the corner
• for one-way roads, the road hump should not be implemented within the 5m distance from the corner
• if the street is a bus route, the crest of the hump is not to exceed 50mm
• if the street is not a bus route, the crest of the hump is not to exceed 100mm
• the hump width is to be 3.7m
• the hump is not to impede or obstruct access to garages
• adequate width is to be allowed between the edge of the carriageway and the edge of the hump to permit
unimpeded flow of rainwater drainage
SPECIFICATIONS FOR HUMP LINE MARKINGS AND SIGNAGE FOR HUMP
Constraints:
• site of speed sensitive location
• road layout configuration
• traffic volumes on adjoining roads
• 85th
percentile speed limit of adjoining roads
• underground structures and/or services
• structural condition of adjoining buildings
ROAD THUMPS
Aims of Measure:
To reduce the speed of vehicles proceeding towards speed sensitive areas.
Implementation of Measure:
• identification of the speed sensitive locations
• implementation of Road Thump
• complement speed reduction measures
• for two-way roads, the road thump should not be implemented within the 15m distance from the corner
• for one-way roads, the road thump should not be implemented within the 5m distance from the corner
• if the street is a bus route, thumps are not to be implemented
• the thump is not to impede or obstruct access to garages
• adequate width is to be allowed between the edge of the thump and the edge of the thump to permit
unimpeded flow of rainwater drainage
• thumps are to have a circular profile
• the height of the thumps is to be from 37mm to 50mm.
• the width of the thumps is to be from 900mm to 1500mm.
• thumps are ineffective in roads where the speed exceeds 50km/h
• spacing between thumps is not to be less than 50 meters
• for thumps higher than 37mm, a channel gap of 750mm to 1000mm is to be left so as to enable cyclists to
avoid the thumps
• thumps are considered only in roads where the total width does not exceed 3.0 meters or in
parking/vehicle circulation areas.
Constraints:
• site of speed sensitive location
• road layout configuration
• traffic volumes of the road
• 85th
percentile speed limit of the road
• underground structures and/or services
• structural condition of adjoining buildings
• road width

BUILD-OUTS/PINCH POINTS
Aims of Measure:
To reduce vehicular speeds on the approach to speed sensitive areas.
Implementation of Measure:
• narrowing of the road
• re-organisation of on-street parking
• may include a pedestrian crossing
• identification of the speed sensitive locations
• implementation of the pinch point/build-outs
• complement speed reduction measures
• effective road width to be determined depending on the road classification
• the pinch point/build-out is not to impede or obstruct access to garages
• the pinch point/build-out is to permit unimpeded flow of rainwater drainage
• may include soft landscaping not exceeding 50mm in height
• may include a raised pedestrian crossing depending on the location of the measure and the vehicle flow
direction of the road
Constraints:
• road layout configuration
• traffic volumes of the road
• 85th
percentile speed limit of the road
• existing road width
• existing storm water provisions.
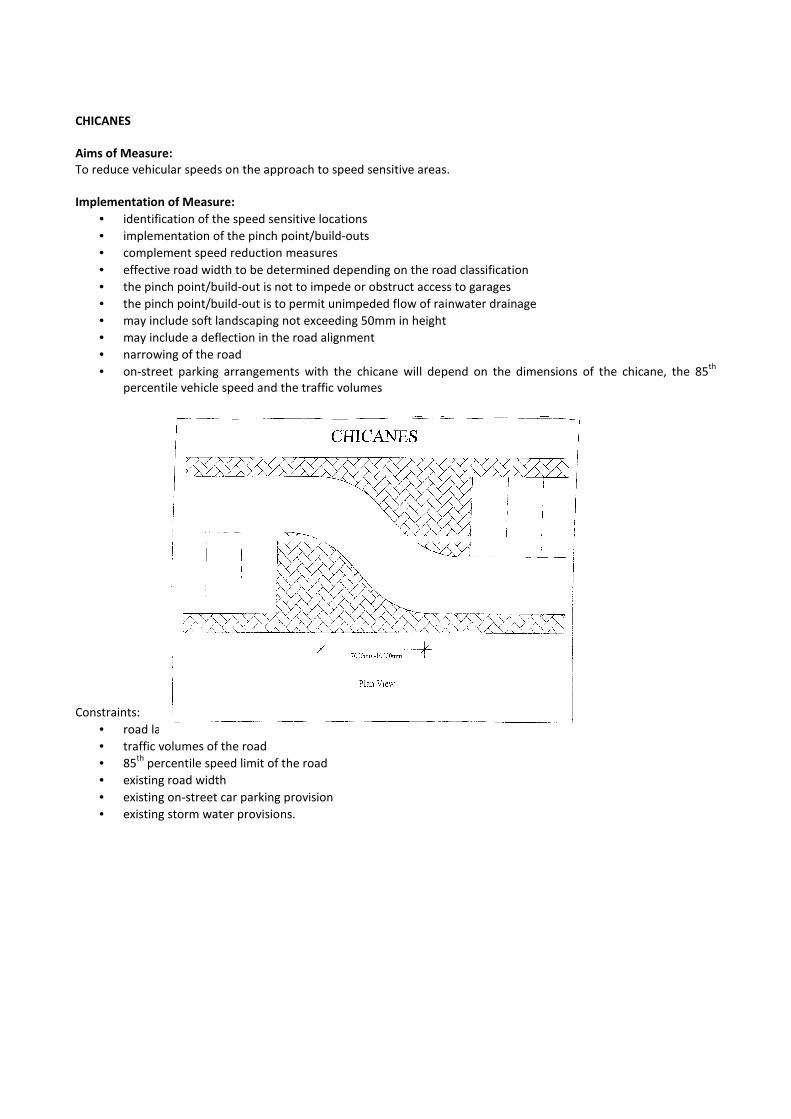
CHICANES
Aims of Measure:
To reduce vehicular speeds on the approach to speed sensitive areas.
Implementation of Measure:
• identification of the speed sensitive locations
• implementation of the pinch point/build-outs
• complement speed reduction measures
• effective road width to be determined depending on the road classification
• the pinch point/build-out is not to impede or obstruct access to garages
• the pinch point/build-out is to permit unimpeded flow of rainwater drainage
• may include soft landscaping not exceeding 50mm in height
• may include a deflection in the road alignment
• narrowing of the road
• on-street parking arrangements with the chicane will depend on the dimensions of the chicane, the 85th
percentile vehicle speed and the traffic volumes
Constraints:
• road layout configuration
• traffic volumes of the road
• 85th
percentile speed limit of the road
• existing road width
• existing on-street car parking provision
• existing storm water provisions.
MINI ROUNDABOUTS AND TRAFFIC ISLANDS
Aims of Measure:
To reduce vehicular speeds on the approach to speed sensitive areas and junctions and to regularise and manage
vehicle movements.
Implementation of Measures according to standard specifications:
• measure can be implemented on straight roads to break up the road into sections
• measure can be implemented at T-junctions, Y-junctions and at crossroads
• the mini roundabout, with a diameter not exceeding a maximum of 4.0meters, may be either painted or
constructed as a mountable round area with a crest height not exceeding a maximum of 100mm
• the mini roundabout is recommended for locations where the external diameter does not exceed 28meters
Constraints:
• road layout configuration
• traffic volumes of the road
• 85th
percentile speed limit of the road
• existing road width
• swept path of vehicles permitted through the area
• road gradient
• mini roundabout is not recommended where the gradient of the road exceeds 4%
• measures recommended for locations where the speed does not exceed 50km/h
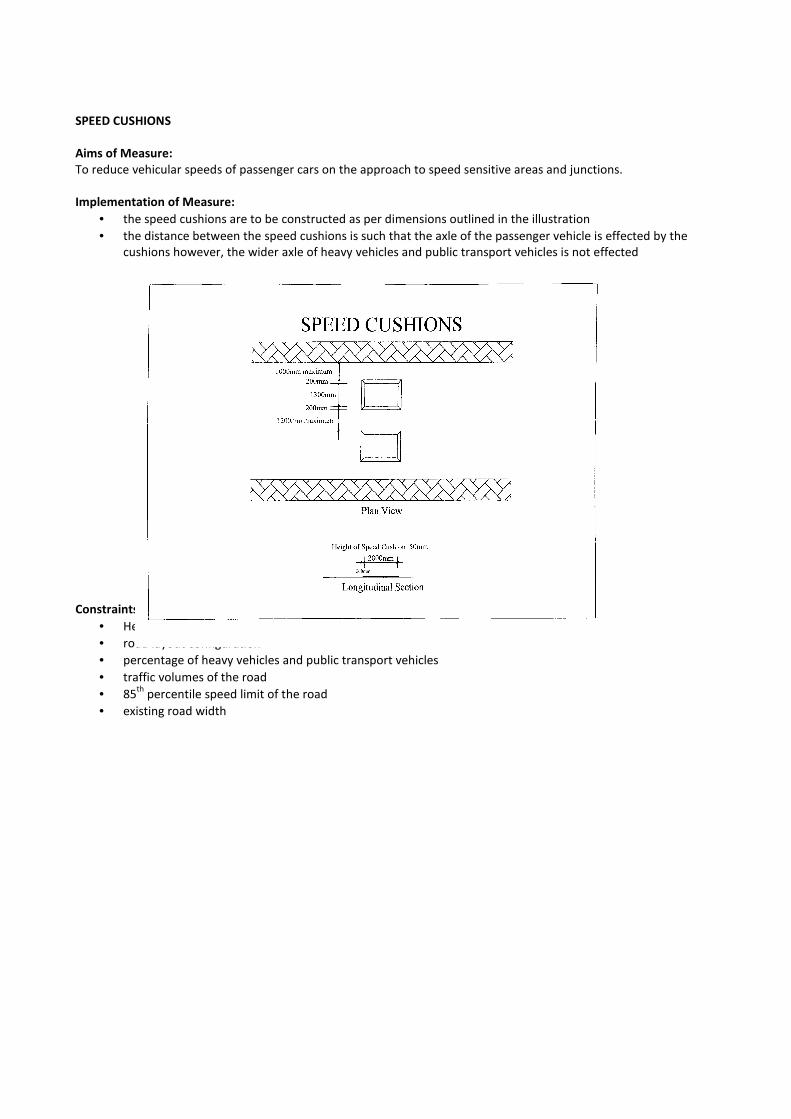
SPEED CUSHIONS
Aims of Measure:
To reduce vehicular speeds of passenger cars on the approach to speed sensitive areas and junctions.
Implementation of Measure:
• the speed cushions are to be constructed as per dimensions outlined in the illustration
• the distance between the speed cushions is such that the axle of the passenger vehicle is effected by the
cushions however, the wider axle of heavy vehicles and public transport vehicles is not effected
Constraints:
• Heavy vehicles and public transport vehicles are not effected by this measure
• road layout configuration
• percentage of heavy vehicles and public transport vehicles
• traffic volumes of the road
• 85th
percentile speed limit of the road
• existing road width
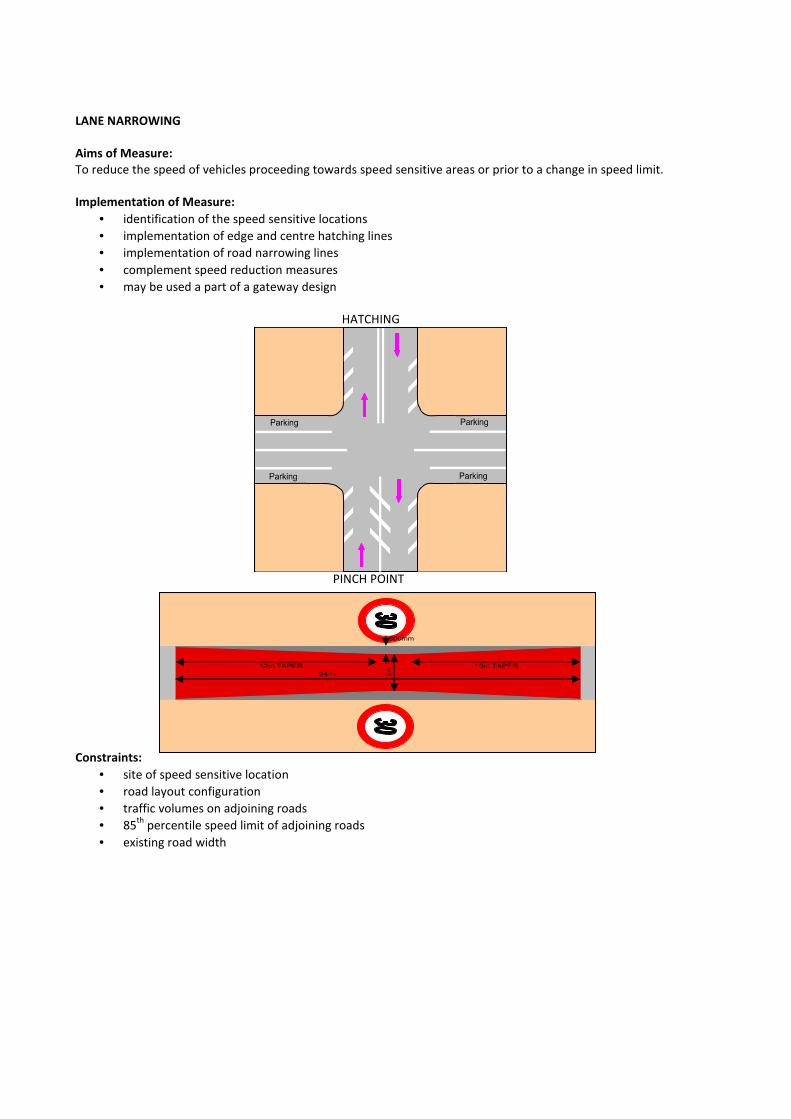
LANE NARROWING
Aims of Measure:
To reduce the speed of vehicles proceeding towards speed sensitive areas or prior to a change in speed limit.
Implementation of Measure:
• identification of the speed sensitive locations
• implementation of edge and centre hatching lines
• implementation of road narrowing lines
• complement speed reduction measures
• may be used a part of a gateway design
HATCHING
PINCH POINT
Constraints:
• site of speed sensitive location
• road layout configuration
• traffic volumes on adjoining roads
• 85th
percentile speed limit of adjoining roads
• existing road width

GATEWAYS
Aims of Measure:
To reduce the speed of vehicles proceeding towards speed sensitive areas or prior to a change in speed limit.
Implementation of Measure:
• identification of the 85th
percentile speed of the road
• identification of location for gateway
• recommended for implementation on arterial and distributor roads, roads with linking functions and roads
within the village which have high traffic volumes
• gateways are a combination of road safety measures complementing each other for maximum effectiveness
EXAMPLE OF GATEWAY INCLUDING
HATCHING, ANTI-SKID MATERIAL, SPEED LIMIT AND CENTRAL ISLAND
EXAMPLE OF GATEWAY INCLUDING
HATCHING, DRAGONS’TEETH, SPEED LIMIT, RUMBLE STRIPS AND CENTRAL ISLAND
EXAMPLE OF GATEWAY INCLUDING
ROAD NARROWING, ANTI-SKID MATERIAL AND SPEED LIMIT
Constraints:
• road layout configuration
• traffic volumes on adjoining roads
• 85th
percentile speed limit of adjoining roads
• existing road width

RUMBLE STRIPS
Aims of Measure:
To alert the driver that he is approaching a traffic sensitive area
Implementation of Measure:
• survey of existing traffic patterns and traffic volumes in the area
• identification of locations where rumble strips can be effective
• Rumble strips are to be located at 200m on the approach to the traffic sensitive area;
• the length of the rumble strips depends on the width of the road;
• for the safety of cyclists, a clear gap of 75mm-1000mm is to be left between the rumble strips and the
footway;
• for rumble strips sited 200m away from a residential area, they are not to exceed 10mm in height and no
vertical face is to exceed 6mm in height;
• for rumble strips sited within a residential area, they are not to exceed 5mm in height and no vertical face is
to exceed 4mm in height;
RUMBLE STRIPS
Constraints:
• location of school in relation to the approach roads
• location of residential areas
• widths of approach roads
• traffic volumes
b. Vehicle Activated Signs

The most widespread educational speed management measure using digital systems are the Vehicle Activated Signs
(VAS). VAS are roadside digital signs that display a message when they are approached by a driver exceeding the
speed limit. VAS are normally used to reduce a driver’s speed by displaying a message. They are not used for
enforcement purposes but only for educational purposes.
Types of VAS Sites can be permanent, semi-permanent, temporary, mobile or displayed from the back of a vehicle.
Power supplies for VAS vary including mains supply, solar powered charging internal batteries or battery powered.
Site Selection
The general site selection criteria include:
• Investigation of the nature of the road safety/collision problem including current vehicle speeds
• The proportion of vehicles exceeding the speed limit in free-flowing conditions
• The proportion of different collision types.
Speed cameras are not to be operated on roads where the maximum speed limit is less than 50km/h.
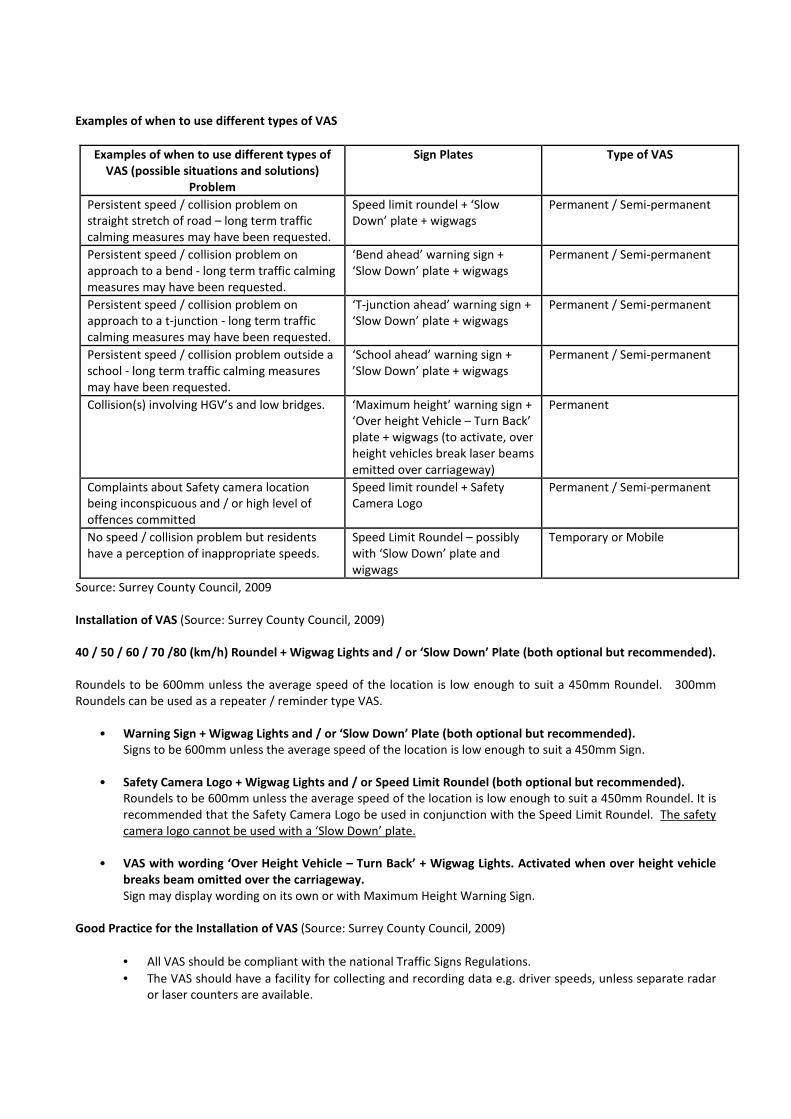
Examples of when to use different types of VAS
Examples of when to use different types of
VAS (possible situations and solutions)
Problem
Sign Plates Type of VAS
Persistent speed / collision problem on
straight stretch of road – long term traffic
calming measures may have been requested.
Speed limit roundel + ‘Slow
Down’ plate + wigwags
Permanent / Semi-permanent
Persistent speed / collision problem on
approach to a bend - long term traffic calming
measures may have been requested.
‘Bend ahead’ warning sign +
‘Slow Down’ plate + wigwags
Permanent / Semi-permanent
Persistent speed / collision problem on
approach to a t-junction - long term traffic
calming measures may have been requested.
‘T-junction ahead’ warning sign +
‘Slow Down’ plate + wigwags
Permanent / Semi-permanent
Persistent speed / collision problem outside a
school - long term traffic calming measures
may have been requested.
‘School ahead’ warning sign +
’Slow Down’ plate + wigwags
Permanent / Semi-permanent
Collision(s) involving HGV’s and low bridges. ‘Maximum height’ warning sign +
‘Over height Vehicle – Turn Back’
plate + wigwags (to activate, over
height vehicles break laser beams
emitted over carriageway)
Permanent
Complaints about Safety camera location
being inconspicuous and / or high level of
offences committed
Speed limit roundel + Safety
Camera Logo
Permanent / Semi-permanent
No speed / collision problem but residents
have a perception of inappropriate speeds.
Speed Limit Roundel – possibly
with ‘Slow Down’ plate and
wigwags
Temporary or Mobile
Source: Surrey County Council, 2009
Installation of VAS (Source: Surrey County Council, 2009)
40 / 50 / 60 / 70 /80 (km/h) Roundel + Wigwag Lights and / or ‘Slow Down’ Plate (both optional but recommended).
Roundels to be 600mm unless the average speed of the location is low enough to suit a 450mm Roundel. 300mm
Roundels can be used as a repeater / reminder type VAS.
• Warning Sign + Wigwag Lights and / or ‘Slow Down’ Plate (both optional but recommended).
Signs to be 600mm unless the average speed of the location is low enough to suit a 450mm Sign.
• Safety Camera Logo + Wigwag Lights and / or Speed Limit Roundel (both optional but recommended).
Roundels to be 600mm unless the average speed of the location is low enough to suit a 450mm Roundel. It is
recommended that the Safety Camera Logo be used in conjunction with the Speed Limit Roundel. The safety
camera logo cannot be used with a ‘Slow Down’ plate.
• VAS with wording ‘Over Height Vehicle – Turn Back’ + Wigwag Lights. Activated when over height vehicle
breaks beam omitted over the carriageway.
Sign may display wording on its own or with Maximum Height Warning Sign.
Good Practice for the Installation of VAS (Source: Surrey County Council, 2009)
• All VAS should be compliant with the national Traffic Signs Regulations.
• The VAS should have a facility for collecting and recording data e.g. driver speeds, unless separate radar
or laser counters are available.

• VAS should display the speed limit, not the speed of the driver. Displaying the driver’s speed does not
educate them as to whether they are exceeding the speed limit or driving too fast for the conditions.
• The speed at which the signs are triggered should be based on those used nationally.
• Semi-permanent / temporary VAS to be at a location for a minimum of 1 month to ensure maximum
benefit. There is no minimum site duration for Mobile VAS.
• VAS should be clearly visible to drivers (a minimum 3 second view) and should not be obstructed by trees
or other road signs.
• Consideration should be given to nearby homes and businesses when finding a suitable location for VAS
as the light emitted from the signs can sometimes intrude.
• VAS should not be used as a substitute for a standard sign plate or speed limit repeater sign. Where
standard signs will warn all drivers of a speed limit or hazard, VAS will only display the warning to drivers
exceeding the speed limit or driving inappropriately for the conditions.
• VAS should be used to reduce speeds where there is a poor safety record or where a survey has
identified inappropriate speeds. VAS can also be considered when residents have raised concerns about
speeds in their area. There may not be records of poor safety or inappropriate speeds, but the VAS will
help to reassure concerned residents. In these cases, mobile or temporary VAS may be sufficient.


ANNEX 3
Technical Guidance to enforcing to control the
intentional speeder
(Section 8)

a. Existing speed Camera Legal Framework
The Motor Vehicle Regulations, Subsidiary Legislation Section 65 states the following in respect of speed
monitoring devices and enforcement:
‘… (3) Photographs, film, video-recordings, electronic images or any other record produced by a
prescribed speed monitoring device, including any record of a measurement made by the device, shall be
admissible in evidence and shall constitute proof of their contents if they are accompanied by a
certificate signed by a police officer or local warden (in the same or in another document) as to the
circumstances of date, time and place in which the photograph, film, video-recording, electronic image
or other record was produced.
(4) Any device referred to in sub regulation (1) shall be a device prescribed by order of the Minister
responsible for Transport who may in any such order lay down any conditions as to the purposes for
which, and the manner and other circumstances in which, the device is to be used.
(5) A document purporting to be a document, record or signed certificate of the kind mentioned in sub-
regulation (1) shall be deemed to be such a document, record or certificate signed as aforesaid unless the
contrary is proved.
(6) The owner of the vehicle which is identified in any document, record or signed certificate referred to
in sub-regulation (1) shall be responsible for any offence proved by the same document, record or signed
certificate unless the driver of the vehicle when the offence was committed is shown to have been
stopped and identified by the police immediately after the commission of the offence.
(7) Any image recorded by any means referred to in sub regulation (3) may be converted from one
format to another, transmitted, stored or reproduced by electronic or any other means that allows the
recorded image to be reproduced in intelligible form including, without limitation, electronically.
(8) Where a recorded image has been stored in electronic format as provided in sub-regulation (7), the
recorded image may be reproduced in paper format which shall have the same effect for all purposes as
if it were an original document if the reproduction is certified to be such in the certificate mentioned in
sub-regulation (3).
(9) Any device prescribed under sub-regulation (3) shall be deemed to have been functioning accurately
and correctly in all respects at the time that any document or record referred to in the said paragraph
was produced by it unless the contrary is proved.
(10) The person against whom a certificate under sub-regulation (3) is produced may require the
attendance of the police officer or local warden who purportedly signed the certificate for the purpose of
cross-examination.
(11) For the purposes of sub-regulations (3) to (6), ''speed monitoring device'' means a device prescribed
under sub-regulation (3) that is capable of photographing or capturing the image of a motor vehicle
while simultaneously measuring and recording its speed…

b. Existing Speed Camera Consideration Framework
The basic principles applicable to the Speed Camera Management are:
• The power of administering and operating roads, as well as deriving any benefit resulting from
such, is invested in Transport Malta by law.
• Local Councils have been delegated, by Central Government, the function of enforcing offences
listed in the Schedule of the Commissioners for Justice Act.
The Speed Camera Consideration Framework is managed as follows:
• Whenever a Local Council wishes to install a speed camera on a road within its locality, it shall
submit an application, which application must include a site plan clearly indicating the
proposed location of the speed camera.
• Whenever Transport Malta receives a written application for the installation of a speed camera
all the necessary transport related assessments are carried out. Subsequently, Transport Malta
may grant to the applicant Local Council the authorization to install the speed camera as
requested subject to any conditions that the authority may deem fit at its discretion. The
Authority shall not withhold such authorization unreasonably and shall act on and decide the
request within four calendar weeks from the receipt of the application. The Authority shall also
provide the Local Council with a copy of the assessments carried out at no cost.
• The applicable speed limit shall be determined by Transport Malta. Unless a particular speed
limit is set, the general speed limits specified in the Motor Vehicle Regulations shall apply.
• The Local Council which will have applied for and obtained the authorization of Transport Malta
for the installation and operation of a speed camera on a road, hereafter the Authorised Local
Council, shall be solely responsible for the supply, installation and maintenance of such speed
camera.
• The Authorised Local Council shall, on the fifteenth day of every month, forward to the
authority, at no cost, a copy of all the reports and statistics generated by the speed camera/s
during the previous month. Such report shall include report of all the charges issued.
• The Authorised Local Council shall, on the fifteenth day of every month, forward to the
authority, at no cost, a detailed account of all the fines collected by it in relation to over
speeding offences detected by the speed camera/s. Together with the said account, the
Authorised Local Council shall pay eleven Euros and sixty-five cents (11.65 Euros) for every fine
collected in connection with the said offences. Increases in the relative penalties provided for
by law for over speeding offences shall bring about proportional increases to the amount due
to the authority in terms of the above for each fine collected.
• The authority shall utilize the money, passed on to it in virtue of the above, in order to fund
media campaigns promoting road traffic safety.
• The Authorised Local Council shall utilize its share of the collected fines in order to fund the
installation and operation of the speed camera/s. The Authorised Local Council shall dedicate
any surplus funds entirely to road maintenance and improvement within its locality.
• The Authority and the Local Councils shall not divulge any information acquired through the
provisions of the above without each other’s consent, except when they are expected to do so
by law.
• The over speeding penalty is issued by the Local Wardens to the offender within forty-eight
hours of the offense being committed. The penalty is paid at any Local Council offices. The
offender may forward a petition to the Board of Petitions, PO Box 41, Valletta prior to the Local
Tribunal hearing. If the petiti8on is not upheld by the Board of Petitions, the citation may be
contested at the Local Tribunal. If the ruling of the tribunal is not to the satisfaction of the
offender, the case may be taken to court.

c. Proposed Assessment Framework for Speed Cameras

d. Signage for Fixed Speed Camera Sites (as adapted from the DfT Circular 01/2007)
• A co-located speed limit and speed camera sign must be placed not more than 1km from the
speed camera location
• The recommended distances between consecutive co-located speed camera and speed limit
repeater signs and between the first/last co-located speed camera and speed limit repeater
signs and the start/end of a co-located speed camera and speed limit are as follows:
Type of Road Max. distance
between
consecutive signs on
the same side of the
carriageway
Max. distance
between
consecutive signs on
alternate sides of
the carriageway
Max. distance
between start/end
of length of road to
be signed &
first/last repeater
Road over
250 metres in
length with 50km/h limit
400m 250m 200m
Road over
350 metres in
length with 60km/h limit
500m 350m 250m
Road over
350 metres in
length with 70km/h limit
600m 350m 300m
Road over
450 metres in
length with 80km/h limit
700m 450m 350m
(as adapted from the Suffolk Constabulary Policies and Procedures, 2006)
• The speed camera and the approach signs must be positioned to be visible.
• Where permissible, carriageway roundel markings may be used
• Where possible, on dual carriageway roads an additional speed camera approach warning sign
should be placed on the central reserve.
• Where possible, the speed limit signs and the speed camera signs should be co-located
• For mobile speed camera sites, advance speed camera warning signs must be placed in advance
of the point of entry of the site or route in the direction of traffic flow which is being enforced.
Co-locating signs (as adapted from DfT 2006/07)
When co-locating camera signs with a speed limit sign
• The two signs may be located individually on the same post, with the speed limit sign above the
camera sign
• They may be co-located on a rectangular yellow or grey backing board with the speed limit sign
above the camera sign - the backing board must not have a border
• They may be located near each other on different posts, so long as they are on the same side of
the carriageway and both can be seen in the same view as the fixed camera by the driver.
For fixed cameras
• there should be a co-located speed limit and camera sign not more than 1 km from the camera;
and
• there should be a co-located speed limit and camera sign within the same view as the camera.
For mobile cameras

• there should be a co-located speed limit and camera sign in advance of the point of entry to the
site or route
• there should be camera signs at regular intervals of around 1 km throughout the site or route;
and
• these camera signs should be co-located with the regularly spaced speed limit repeater signs
throughout the site.
Co-Located Signs
Used only on roads where there is a system of carriageway
lighting and the speed limit is 50 km/h
Speed limit repeater sign with safety camera warning sign
co-located
Mounted on a yellow or grey rectangular backing board.
The backing board must not have a boarder.
Speed limit above the camera sign
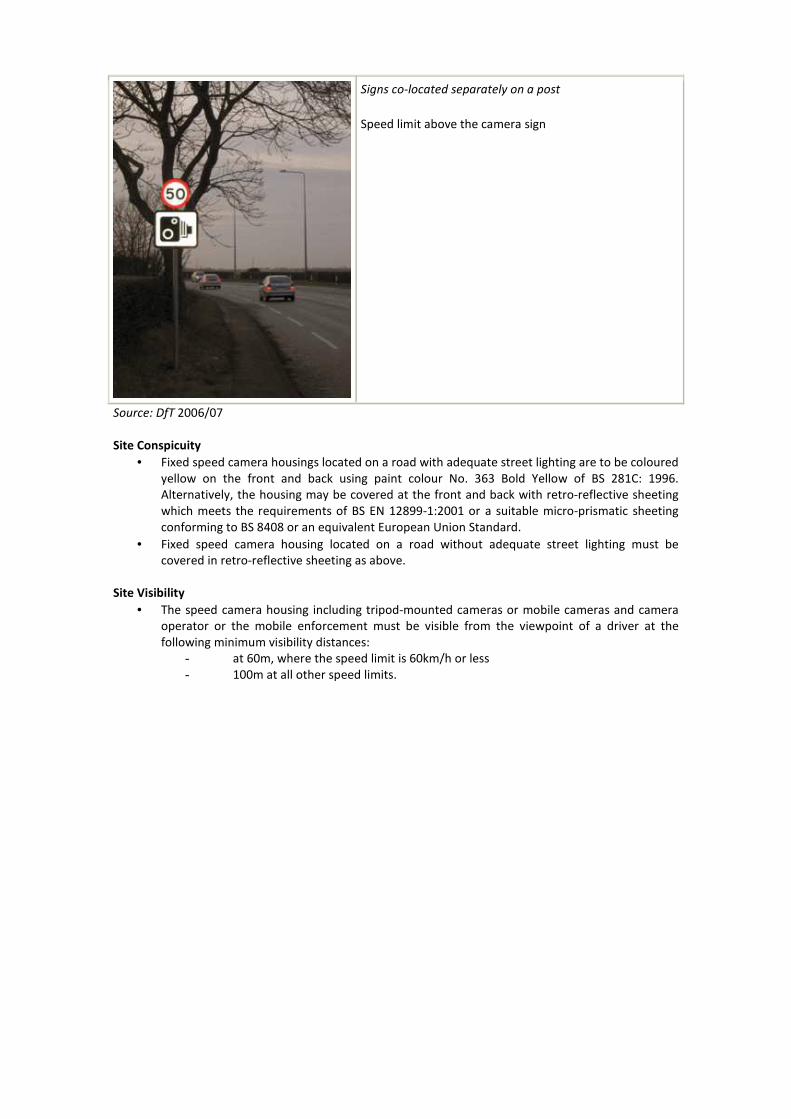
Signs co-located separately on a post
Speed limit above the camera sign
Source: DfT 2006/07
Site Conspicuity
• Fixed speed camera housings located on a road with adequate street lighting are to be coloured
yellow on the front and back using paint colour No. 363 Bold Yellow of BS 281C: 1996.
Alternatively, the housing may be covered at the front and back with retro-reflective sheeting
which meets the requirements of BS EN 12899-1:2001 or a suitable micro-prismatic sheeting
conforming to BS 8408 or an equivalent European Union Standard.
• Fixed speed camera housing located on a road without adequate street lighting must be
covered in retro-reflective sheeting as above.
Site Visibility
• The speed camera housing including tripod-mounted cameras or mobile cameras and camera
operator or the mobile enforcement must be visible from the viewpoint of a driver at the
following minimum visibility distances:
- at 60m, where the speed limit is 60km/h or less
- 100m at all other speed limits.