Embed Size (px)
Citation preview
Copyright (C) 2021 Seven & i Holdings Co., Ltd. All Rights Reserved.
Speedway Acquisition by 7-Eleven, Inc.
July 1, 2021Ryuichi Isaka
President and Representative DirectorSeven & i Holdings Co., Ltd.
Copyright (C) 2021 Seven & i Holdings Co., Ltd. All Rights Reserved.
AGENDATODA Y ’ S
1
2
3
Growth history and future opportunity
Financial Forecast
2
Transaction Overview & Synergies
Copyright (C) 2021 Seven & i Holdings Co., Ltd. All Rights Reserved.
AGENDATODA Y ’ S
1
2
3
3
Growth history and future opportunity
Financial Forecast
Transaction Overview & Synergies
Copyright (C) 2020 Seven & i Holdings Co., Ltd. All Rights Reserved.
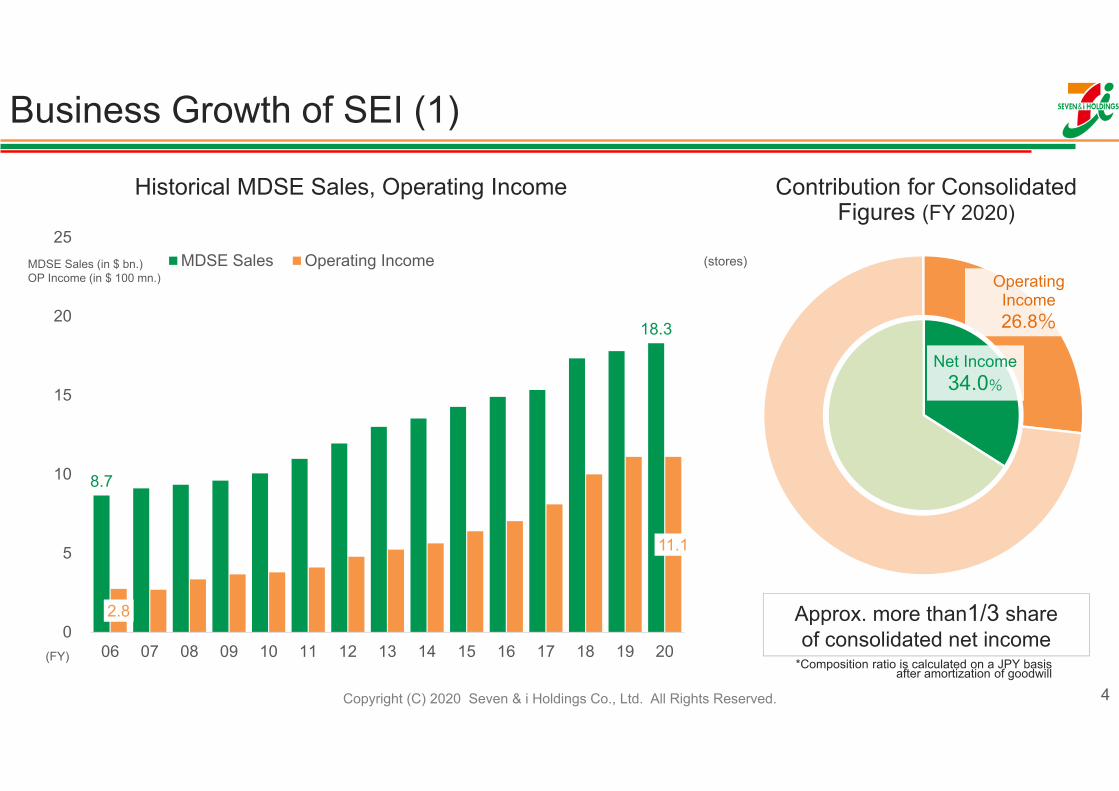
8.7
18.3
2.8
11.1
0
5
10
15
20
25
06 07 08 09 10 11 12 13 14 15 16 17 18 19 20
MDSE Sales Operating Income
Business Growth of SEI (1)
4
MDSE Sales (in $ bn.)OP Income (in $ 100 mn.)
(stores)
(FY)
Contribution for Consolidated Figures (FY 2020)
*Composition ratio is calculated on a JPY basisafter amortization of goodwill
Approx. more than1/3 share of consolidated net income
Historical MDSE Sales, Operating Income
Operating Income26.8%
Net Income34.0%
Copyright (C) 2021 Seven & i Holdings Co., Ltd. All Rights Reserved. 5
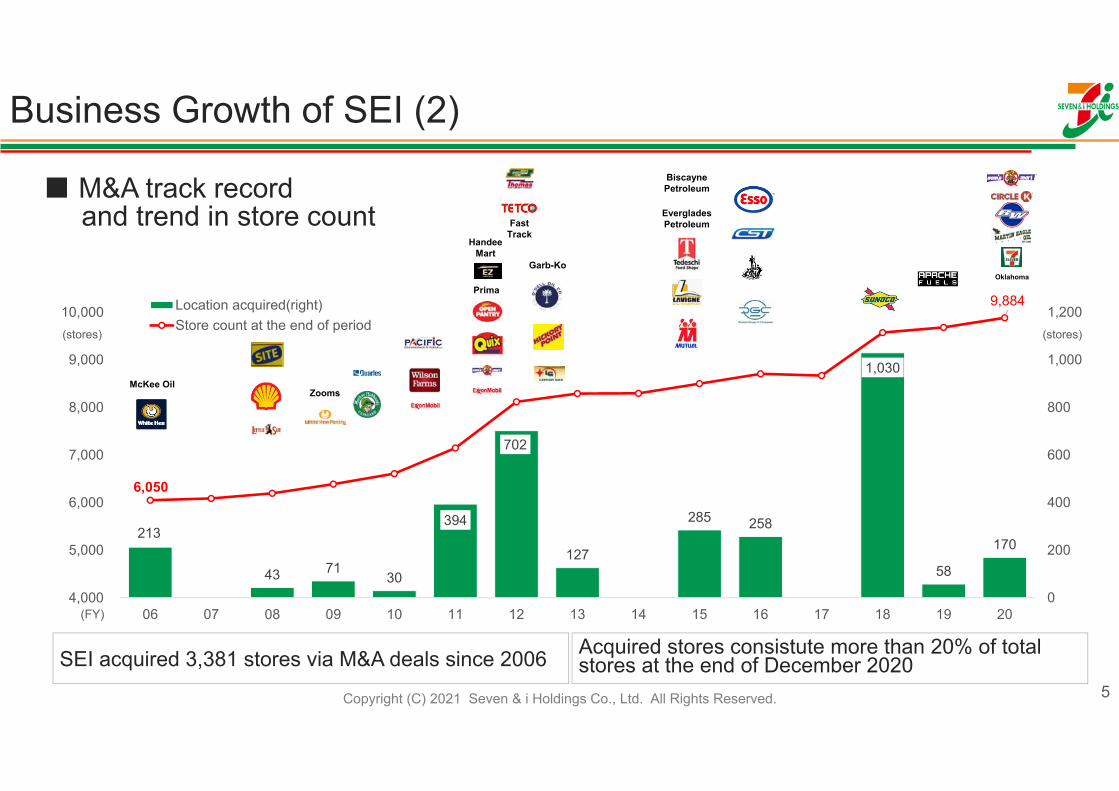
213
43 71 30
394
702
127
285 258
1,030
58
170
6,050
9,884
0
200
400
600
800
1,000
1,200
4,000
5,000
6,000
7,000
8,000
9,000
10,000
06 07 08 09 10 11 12 13 14 15 16 17 18 19 20
Location acquired(right)Store count at the end of period
(stores)
(FY)
■ M&A track recordand trend in store count
McKee OilZooms
Prima
Handee Mart
Garb-Ko
Fast Track
BiscaynePetroleum
EvergladesPetroleum
(stores)
SEI acquired 3,381 stores via M&A deals since 2006 Acquired stores consistute more than 20% of total stores at the end of December 2020
Business Growth of SEI (2)
Oklahoma
Copyright (C) 2020 Seven & i Holdings Co., Ltd. All Rights Reserved.
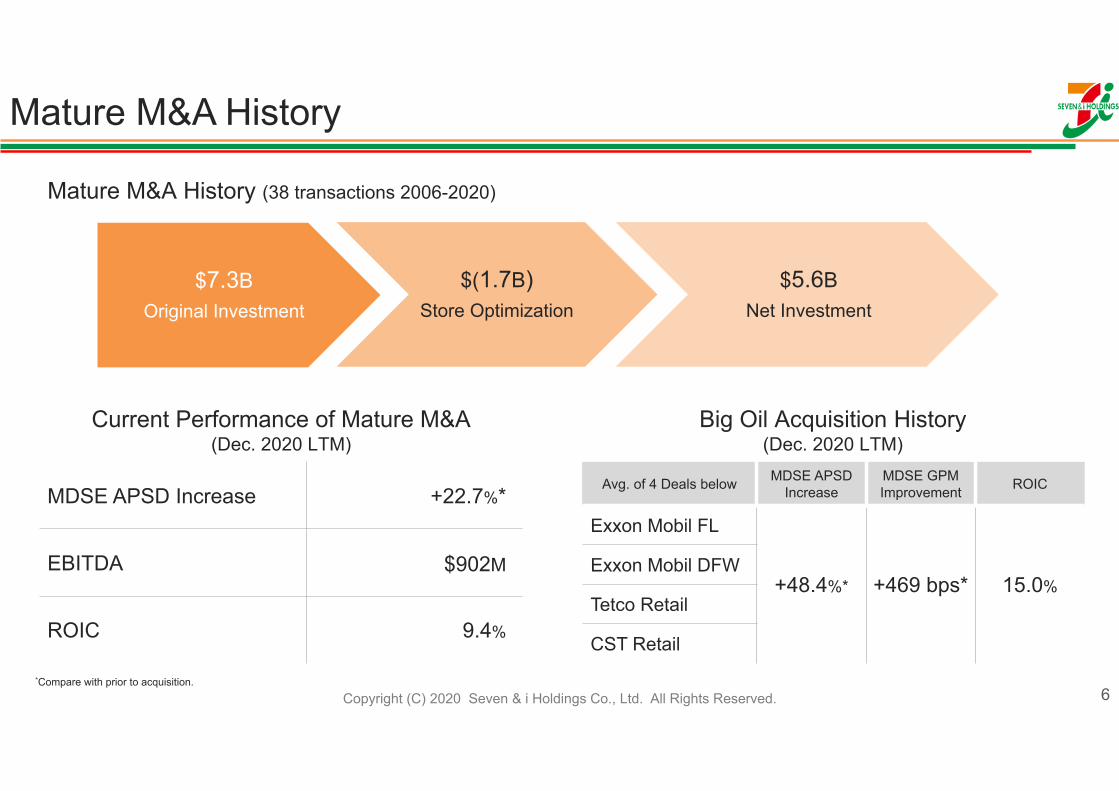
Mature M&A History
6*Compare with prior to acquisition.
MDSE APSD Increase +22.7%*
EBITDA $902M
ROIC 9.4%
Current Performance of Mature M&A (Dec. 2020 LTM)
$7.3BOriginal Investment
$(1.7B) Store Optimization
$5.6BNet Investment
Mature M&A History (38 transactions 2006-2020)
Big Oil Acquisition History (Dec. 2020 LTM)
Avg. of 4 Deals below MDSE APSD Increase
MDSE GPMImprovement ROIC
Exxon Mobil FL
+48.4%* +469 bps* 15.0%Exxon Mobil DFW
Tetco Retail
CST Retail
Copyright (C) 2021 Seven & i Holdings Co., Ltd. All Rights Reserved. 7
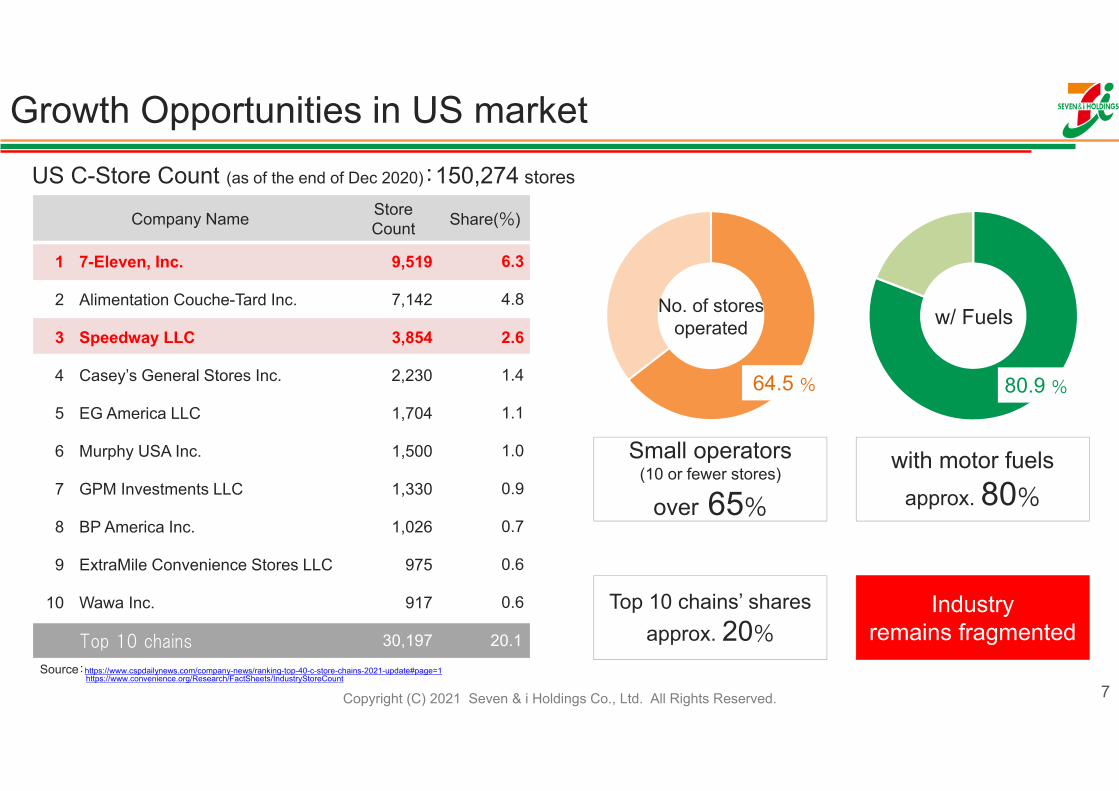
US C-Store Count (as of the end of Dec 2020):150,274 stores
Source:https://www.cspdailynews.com/company-news/ranking-top-40-c-store-chains-2021-update#page=1https://www.convenience.org/Research/FactSheets/IndustryStoreCount
Company Name Store Count Share(%)
1 7-Eleven, Inc. 9,519 6.3
2 Alimentation Couche-Tard Inc. 7,142 4.8
3 Speedway LLC 3,854 2.6
4 Casey’s General Stores Inc. 2,230 1.4
5 EG America LLC 1,704 1.1
6 Murphy USA Inc. 1,500 1.0
7 GPM Investments LLC 1,330 0.9
8 BP America Inc. 1,026 0.7
9 ExtraMile Convenience Stores LLC 975 0.6
10 Wawa Inc. 917 0.6
Top 10 chains 30,197 20.1
64.5 %
No. of storesoperated
Small operators(10 or fewer stores)
over 65%
with motor fuelsapprox. 80%
Top 10 chains’ sharesapprox. 20%
Industryremains fragmented
80.9 %
w/ Fuels
Growth Opportunities in US market
Copyright (C) 2021 Seven & i Holdings Co., Ltd. All Rights Reserved.
AGENDATODA Y ’ S
1
2
3
8
Financial Forecast
Transaction Overview & Synergies
Growth history and future opportunity
Copyright (C) 2021 Seven & i Holdings Co., Ltd. All Rights Reserved. 9
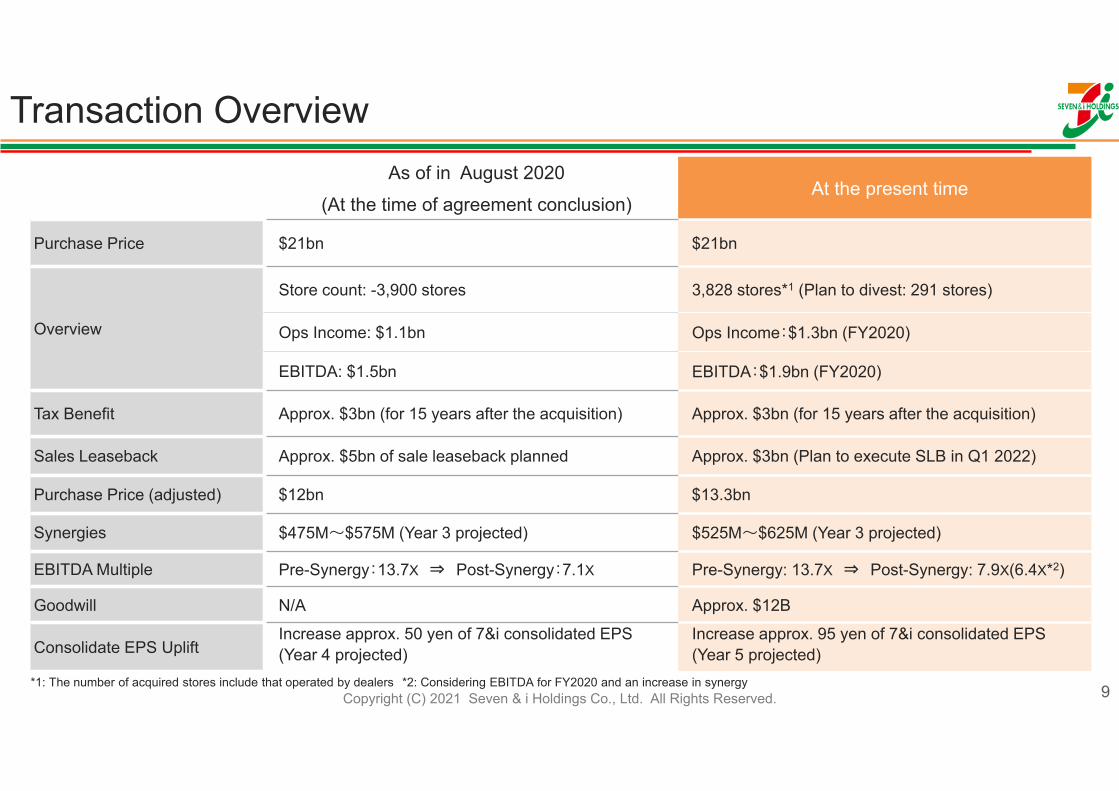
As of in August 2020(At the time of agreement conclusion)
At the present time
Purchase Price $21bn $21bn
Overview
Store count: -3,900 stores 3,828 stores*1 (Plan to divest: 291 stores)
Ops Income: $1.1bn Ops Income:$1.3bn (FY2020)
EBITDA: $1.5bn EBITDA:$1.9bn (FY2020)
Tax Benefit Approx. $3bn (for 15 years after the acquisition) Approx. $3bn (for 15 years after the acquisition)
Sales Leaseback Approx. $5bn of sale leaseback planned Approx. $3bn (Plan to execute SLB in Q1 2022)
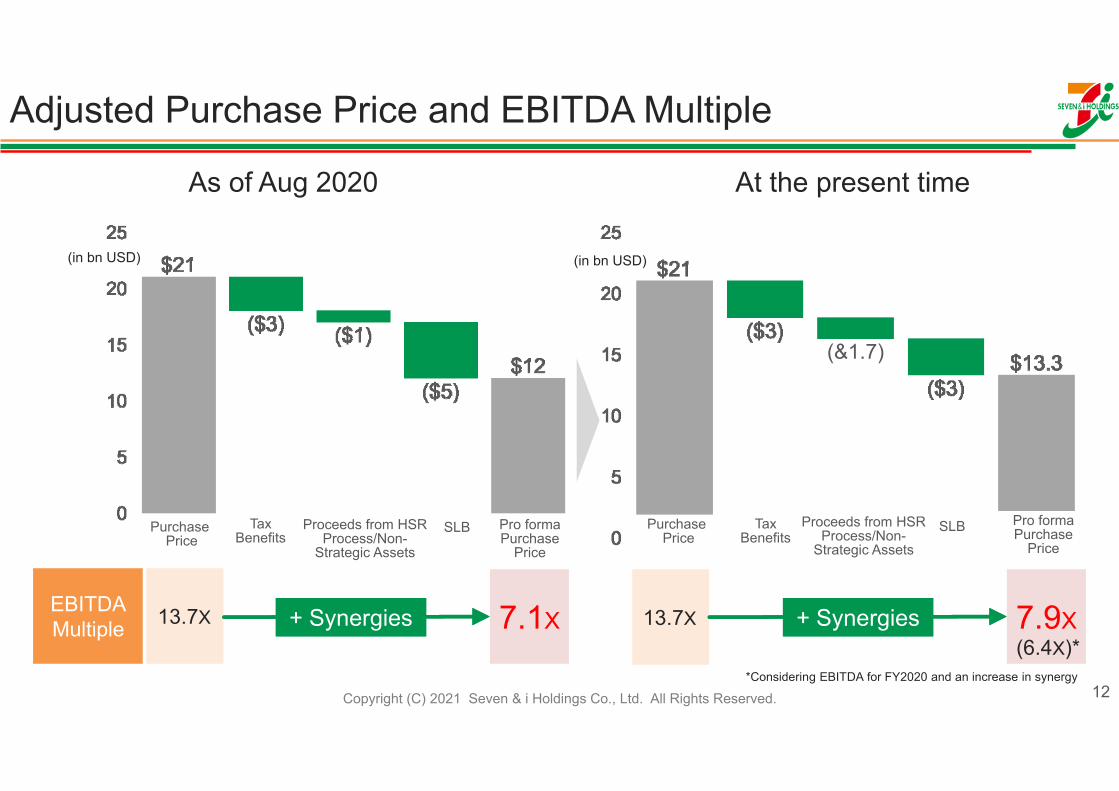
Purchase Price (adjusted) $12bn $13.3bn
Synergies $475M~$575M (Year 3 projected) $525M~$625M (Year 3 projected)
EBITDA Multiple Pre-Synergy:13.7X ⇒ Post-Synergy:7.1X Pre-Synergy: 13.7X ⇒ Post-Synergy: 7.9X(6.4X*2)
Goodwill N/A Approx. $12B
Consolidate EPS UpliftIncrease approx. 50 yen of 7&i consolidated EPS(Year 4 projected)
Increase approx. 95 yen of 7&i consolidated EPS(Year 5 projected)
Transaction Overview
*1: The number of acquired stores include that operated by dealers *2: Considering EBITDA for FY2020 and an increase in synergy
Copyright (C) 2021 Seven & i Holdings Co., Ltd. All Rights Reserved. 10
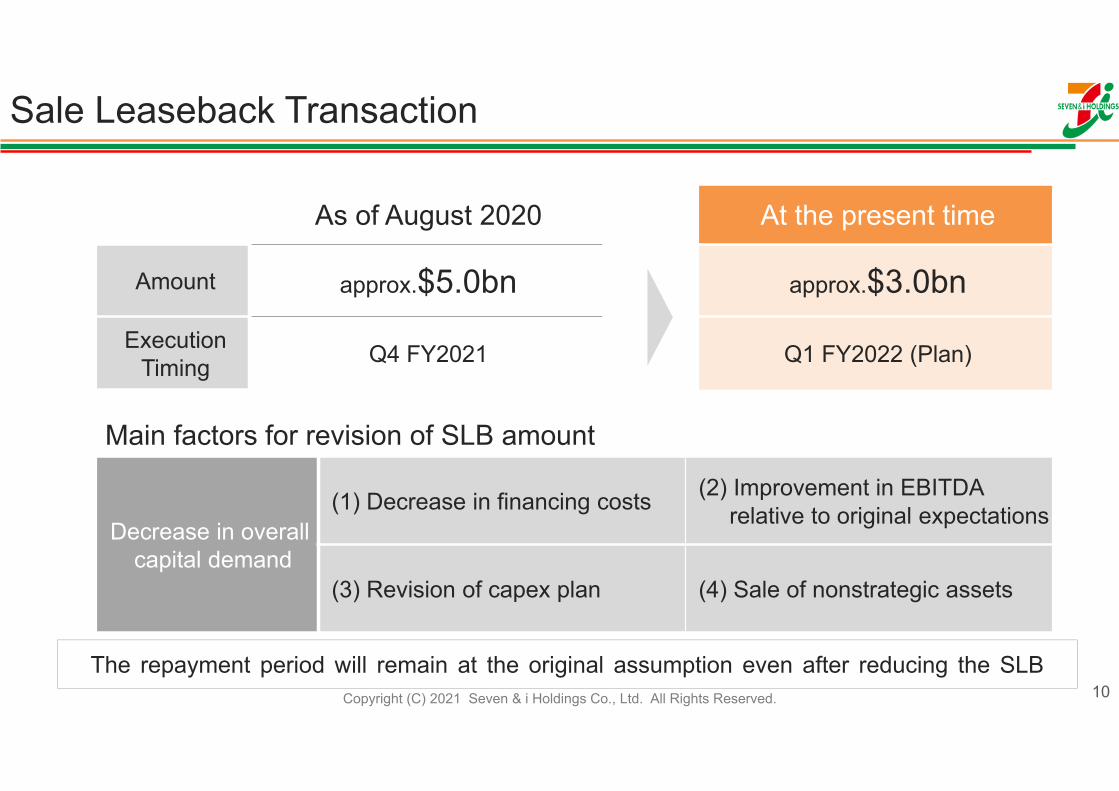
As of August 2020 At the present time
Amount approx.$5.0bn approx.$3.0bnExecution
Timing Q4 FY2021 Q1 FY2022 (Plan)
Main factors for revision of SLB amount
Decrease in overallcapital demand
(1) Decrease in financing costs (2) Improvement in EBITDA relative to original expectations
(3) Revision of capex plan (4) Sale of nonstrategic assets
Sale Leaseback Transaction
The repayment period will remain at the original assumption even after reducing the SLB
Copyright (C) 2021 Seven & i Holdings Co., Ltd. All Rights Reserved. 11
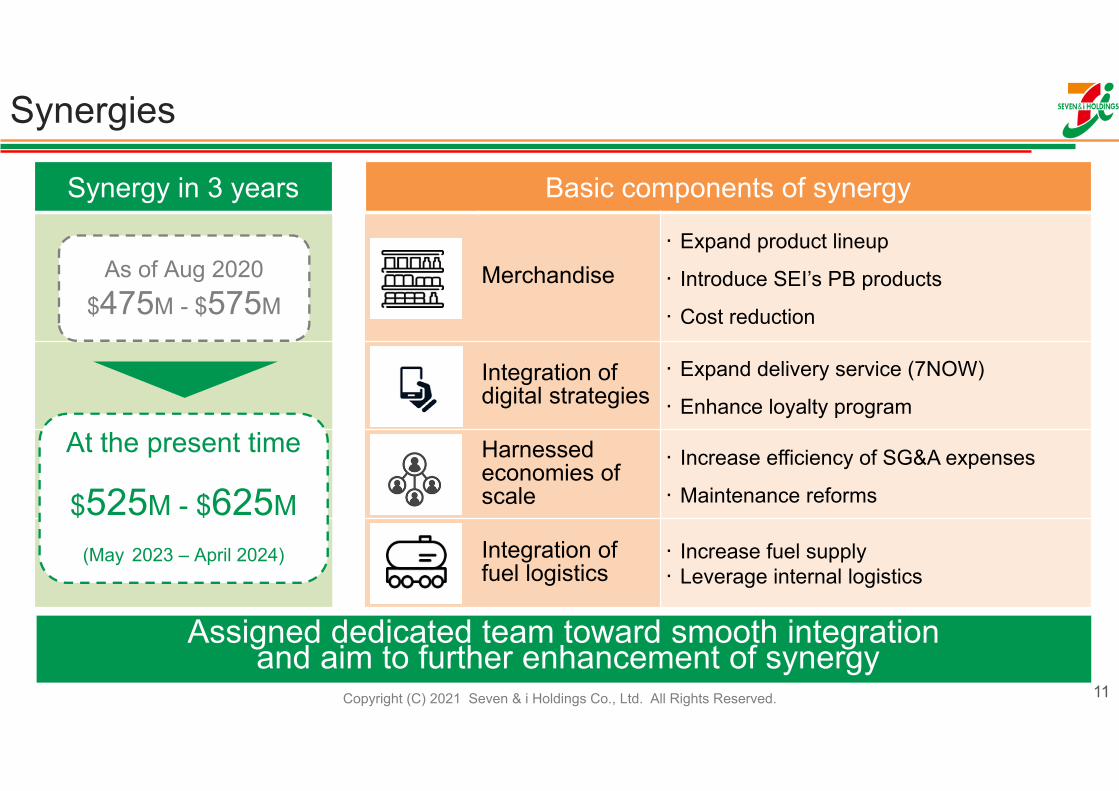
Synergies
Assigned dedicated team toward smooth integrationand aim to further enhancement of synergy
Synergy in 3 years Basic components of synergy
Merchandise・ Expand product lineup
・ Introduce SEI’s PB products
・ Cost reduction
Integration ofdigital strategies
・ Expand delivery service (7NOW)
・ Enhance loyalty program
Harnessed economies of scale
・ Increase efficiency of SG&A expenses
・ Maintenance reforms
Integration of fuel logistics
・ Increase fuel supply・ Leverage internal logistics
As of Aug 2020$475M - $575M
At the present time
$525M - $625M(May 2023 – April 2024)
Copyright (C) 2021 Seven & i Holdings Co., Ltd. All Rights Reserved. 12
EBITDAMultiple 13.7X + Synergies+ Synergies 7.1X 13.7X 7.9X
As of Aug 2020 At the present time
PurchasePrice
TaxBenefits
Proceeds from HSR Process/Non-
Strategic Assets
SLB Pro formaPurchase
Price
Adjusted Purchase Price and EBITDA Multiple
(in bn USD) (in bn USD)
PurchasePrice
TaxBenefits
Proceeds from HSR Process/Non-
Strategic AssetsSLB Pro forma
PurchasePrice
+ Synergies+ Synergies
(&1.7)
(6.4X)**Considering EBITDA for FY2020 and an increase in synergy
Copyright (C) 2021 Seven & i Holdings Co., Ltd. All Rights Reserved.
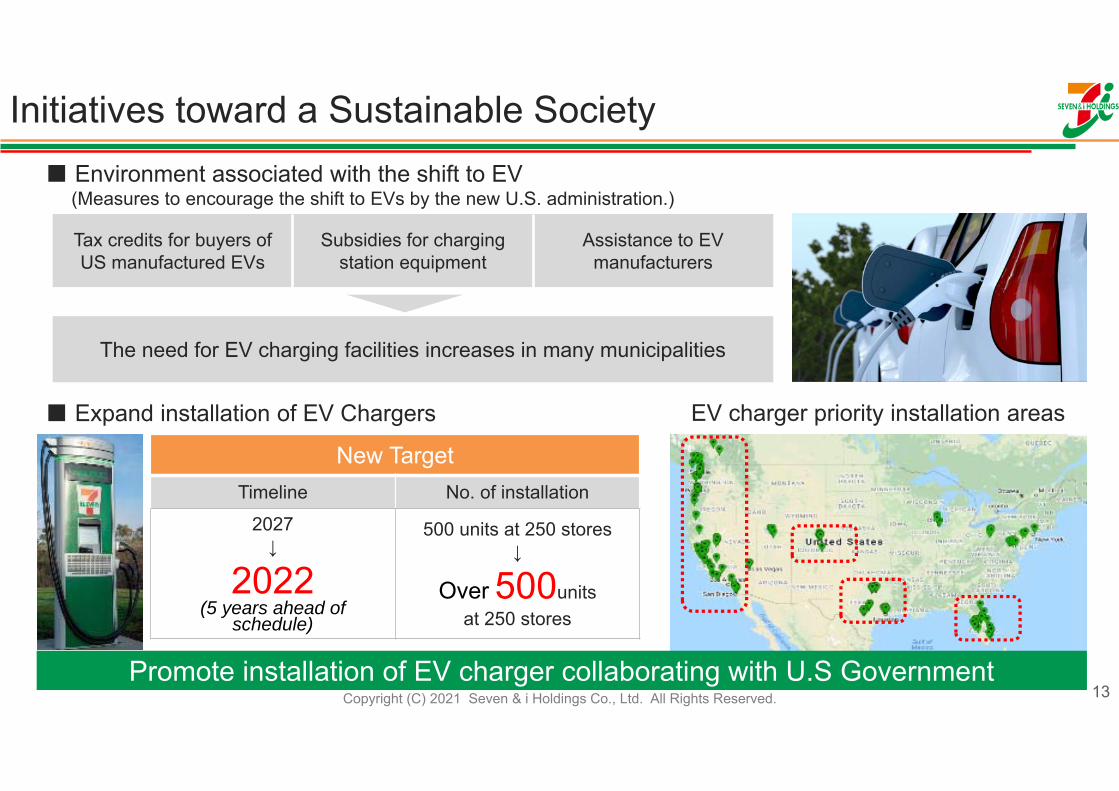
Tax credits for buyers of US manufactured EVs
Subsidies for charging station equipment
Assistance to EV manufacturers
The need for EV charging facilities increases in many municipalities
13
■ Expand installation of EV Chargers
New TargetTimeline No. of installation
2027↓
2022(5 years ahead of
schedule)
500 units at 250 stores↓
Over 500unitsat 250 stores
EV charger priority installation areas
■ Environment associated with the shift to EV(Measures to encourage the shift to EVs by the new U.S. administration.)
Initiatives toward a Sustainable Society
Promote installation of EV charger collaborating with U.S Government
Copyright (C) 2021 Seven & i Holdings Co., Ltd. All Rights Reserved.
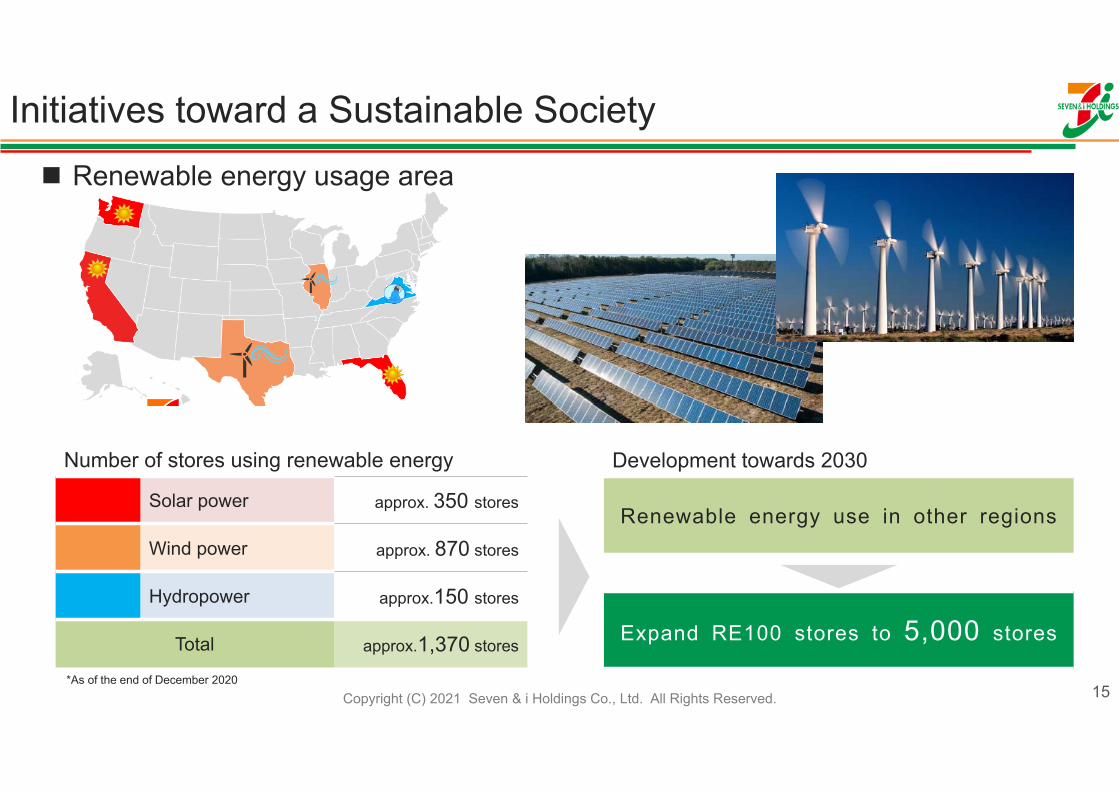
Initiatives toward a Sustainable Society
*As of the end of December 202015
Number of stores using renewable energy
Solar power approx. 350 stores
Wind power approx. 870 stores
Hydropower approx.150 stores
Total approx.1,370 stores
Renewable energy usage area
Development towards 2030
Renewable energy use in other regions
Expand RE100 stores to 5,000 stores
Copyright (C) 2021 Seven & i Holdings Co., Ltd. All Rights Reserved.
AGENDATODA Y ’ S
1
2
3
15
Financial Forecast
Transaction Overview & Synergies
Growth history and future opportunity
Copyright (C) 2021 Seven & i Holdings Co., Ltd. All Rights Reserved. 16
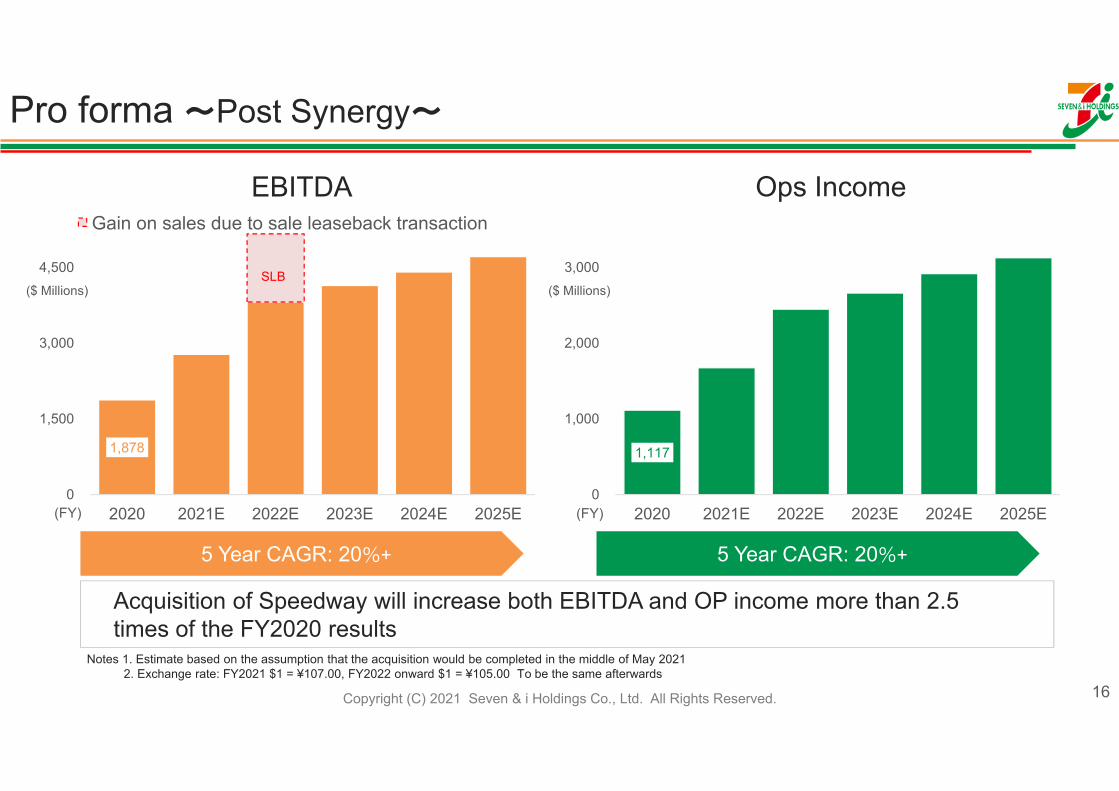
Pro forma ~Post Synergy~
EBITDA Ops Income
5 Year CAGR: 20%+
Acquisition of Speedway will increase both EBITDA and OP income more than 2.5 times of the FY2020 results
5 Year CAGR: 20%+
1,117
0
1,000
2,000
3,000
2020 2021E 2022E 2023E 2024E 2025E
1,878
0
1,500
3,000
4,500
2020 2021E 2022E 2023E 2024E 2025E
Gain on sales due to sale leaseback transaction
SLB
(FY) (FY)
Notes 1. Estimate based on the assumption that the acquisition would be completed in the middle of May 20212. Exchange rate: FY2021 $1 = ¥107.00, FY2022 onward $1 = ¥105.00 To be the same afterwards
($ Millions) ($ Millions)
Copyright (C) 2021 Seven & i Holdings Co., Ltd. All Rights Reserved.
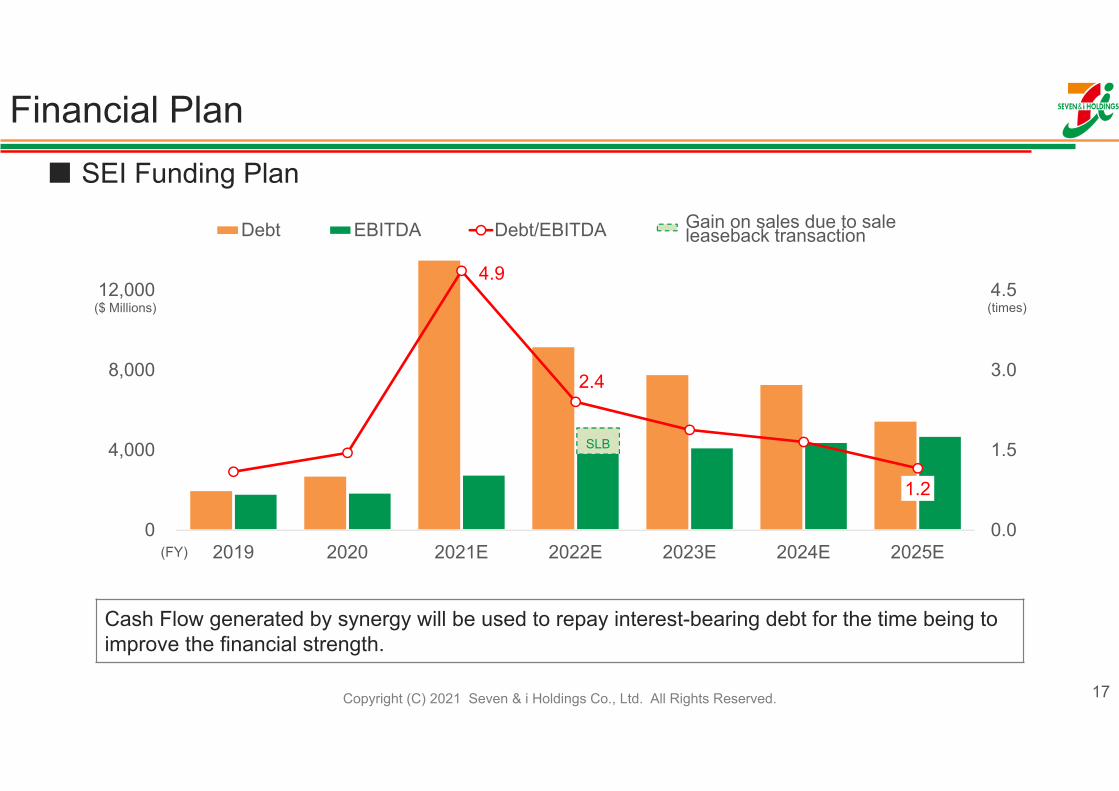
4.9
2.4
1.2
0.0
1.5
3.0
4.5
0
4,000
8,000
12,000
2019 2020 2021E 2022E 2023E 2024E 2025E
Debt EBITDA Debt/EBITDA
17
Cash Flow generated by synergy will be used to repay interest-bearing debt for the time being to improve the financial strength.
■ SEI Funding Plan
Financial Plan
(times)
Gain on sales due to sale leaseback transaction
(FY)
SLB
($ Millions)
Copyright (C) 2021 Seven & i Holdings Co., Ltd. All Rights Reserved. 18
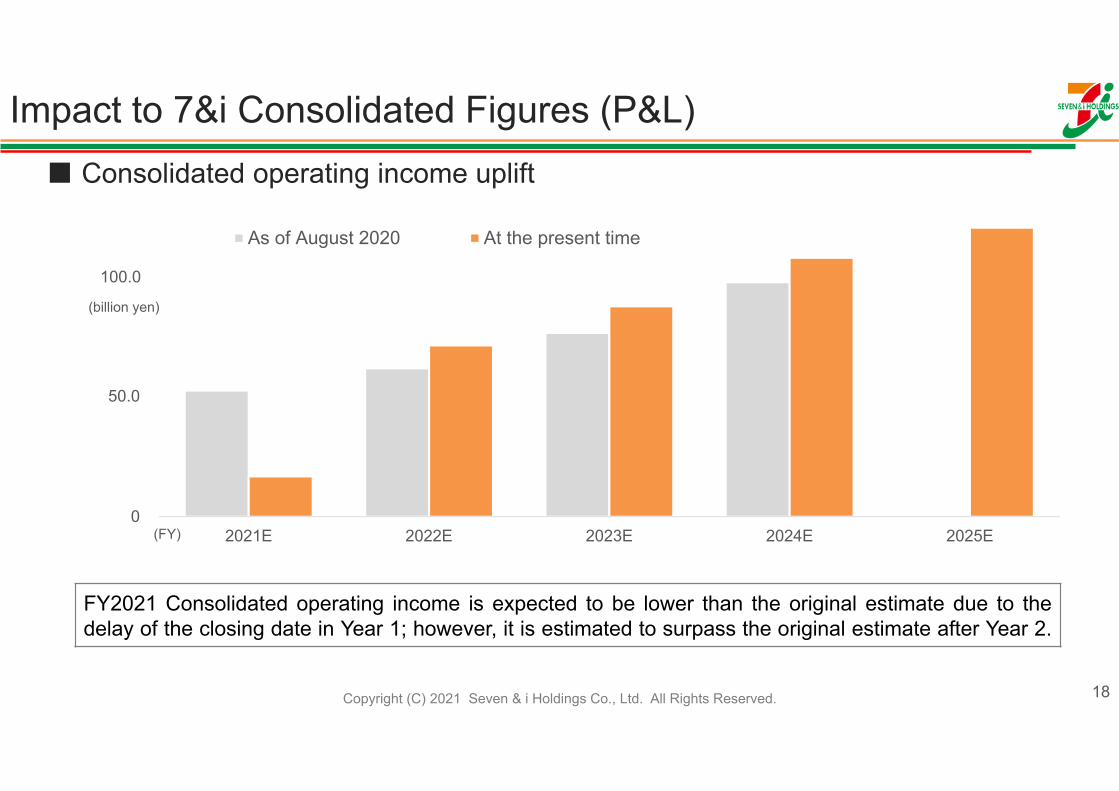
Impact to 7&i Consolidated Figures (P&L)
0
500
1,000
2021E 2022E 2023E 2024E 2025E
As of August 2020 At the present time
(billion yen)
■ Consolidated operating income uplift
100.0
50.0
(FY)
FY2021 Consolidated operating income is expected to be lower than the original estimate due to thedelay of the closing date in Year 1; however, it is estimated to surpass the original estimate after Year 2.
Copyright (C) 2021 Seven & i Holdings Co., Ltd. All Rights Reserved. 19
▲1.0
0.0
1.0
2.0
3.0
2021E 2022E 2023E 2024E 2025E
As of August 2020At the present time
▲30
0
30
60
90
2021E 2022E 2023E 2024E 2025E
As of August 2020At the present time
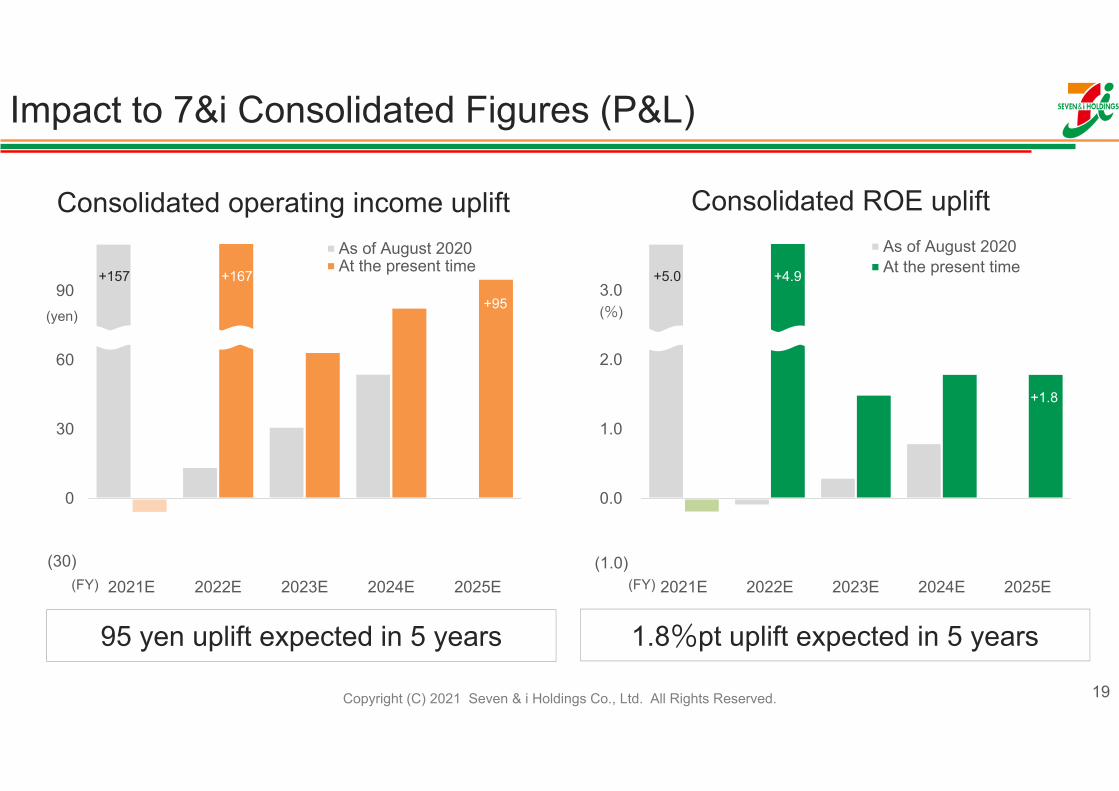
Consolidated operating income uplift
(yen) (%)
1.8%pt uplift expected in 5 years
+167 +4.9+5.0+157
+95
+1.8
95 yen uplift expected in 5 years
Impact to 7&i Consolidated Figures (P&L)
Consolidated ROE uplift
(30) (1.0)(FY) (FY)
Copyright (C) 2020 Seven & i Holdings Co., Ltd. All Rights Reserved.
With Livings ― Seven & i Group
The information disclosed by the Company may contain forward-looking statements. Thesestatements are based on management’s judgment in accordance with materials available to theCompany at the time of disclosure, with future projections based on certain assumptions. Theforward-looking statements therefore incorporate various risks, estimates, and uncertainties, and assuch, actual results and performance may differ from the future outlook included in disclosedinformation due to various factors, such as changes in business operations and the financialsituation going forward.