Embed Size (px)
Citation preview

Spending Profiles of National Forest Visitors, NVUM Four Year Report
Daniel J. Stynes and Eric M. White
Professor, Department of Park, Recreation and Tourism Resources and Graduate Research Assistant, Department of Forestry, respectively.
Michigan State University, East Lansing, Michigan May 2005
This report is based on an analysis of National Forest Visitor Use Monitoring (NVUM) Survey Data for the first four years covering calendar year 2000, and fiscal years 2001, 2002, and 2003.
JOINT VENTURE AGREEMENT
BETWEEN THE USDA FOREST SERVICE
INVENTORY AND MONITORING INSTITUTE and
MICHIGAN STATE UNIVERSITY Joint Venture Agreement # 01-JV-11130149-203
Direct correspondence to Daniel Stynes, [email protected].

NVUM Four Year Report
2
ABSTRACT: This report presents national forest visitor spending profiles developed from the USDA Forest Service National Visitor Use Monitoring (NVUM) project surveys collected between January, 2000 and September, 2003. The report is an update of an earlier report covering the first three years of NVUM survey data. The FY 2003 NVUM surveys add an additional 6,314 cases with spending data from an additional 31 national forests. Changes from the three year national spending averages are generally minor. National average spending profiles are developed for seven trip type segments: day trips and overnight trips involving stays on and off the forest for local and non-local visitors, and visitors whose primary trip purpose was not recreation on the forest. Distinct spending profiles are also estimated for high and low spending areas and for selected recreation activity subgroups.

NVUM Four Year Report
3
INTRODUCTION This report updates a previous report (Stynes and White 2004) that estimated spending profiles for national forest visitors based on data from the first three years of the National Visitor Use Monitoring study. In FY 2003, visitors at an additional 31 forests were sampled, adding 6,314 cases to the spending dataset. The three year spending profiles are updated here using data from the first four years of the NVUM survey. National average spending profiles have remained fairly consistent over the four years, with some variations likely due to the mix of forests sampled each year. There were some changes in the survey instrument in 2003. The effects of these changes are covered more fully in a separate report (Stynes and White 2005) that refines the segments for overnight visitors using information about lodging types gathered in FY 2003. In this four-year combined report, we replicate the procedures used during the first three years and price adjust all spending figures to 2003. The presentation and tables closely follow the three year report (Stynes and White 2004). BACKGROUND ON NVUM SURVEYS The objective of the USDA Forest Service National Visitor Use Monitoring study (NVUM) is to estimate the number of recreation visits to national forests (English et al. 2002). To achieve this objective a selection of individual forests in each region are sampled yearly with each administrative forest in the National Forest System being sampled once every five years. In addition to data necessary to estimate visitation, the NVUM survey gathered other visitor and trip characteristics. A separate economics survey administered to roughly a fourth of those sampled gathered spending information that provides the basis for development of the spending profiles reported here. The analysis here is based on data gathered during the first cycle of the NVUM project, covering 119 administrative national forests, grasslands, and recreation areas sampled under NVUM. The addition of FY 2003 data yields modest increases in the reliability of the spending averages and now provides estimates for all national forests. METHODS National forest visitors were sampled at both designated recreation sites and in the general forest area (GFA) of individual forests. A stratified sampling scheme was employed for sites and days based upon the expected visitation (high, medium, or low visitation) at a given location on a given day (termed a “site day”).

NVUM Four Year Report
4
During the first cycle of the NVUM study, a total of 81,277 visitors were sampled. Roughly one fourth (21,406) of these visitors completed a supplemental set of spending questions (Table 1)1. The economics portion of the NVUM questionnaire measured spending within fifty miles of the forest on the current recreation trip. During the first three years, the NVUM questionnaire measured spending of a randomly selected adult in the travel party. Based on our analysis of the data gathered during the first two years (CY 2000 and FY 2001) and comparisons with other studies, we concluded that most respondents were reporting spending for the entire travel party (Stynes, White and Leefers 2003). Spending reported in FY 2002 was also assumed to represent the travel party. In FY 2003 the questionnaire was changed to request the spending of the entire travel party (all people in the vehicle). The lack of significant changes in the spending averages in FY 2003 supports our decision to treat spending reports as representing the travel party.
Table 1. Breakdown of the NVUM sample by Year 2000 2001 2002 2003 4 Year Total
Total Sample 19,351 22,014 20,589 19,323 81,277Cases with economic data 4,347 4,957 5,788 6,314 21,406
Outliers in economic data Days away from home >= 30 115 107 146 127 495People in vehicle >= 8 76 82 79 116 353Total spending >= 1000 129 176 210 308 823Missing Zip codea 181 192 158 91 622Total omitted cases 501 557 593 642 2,293Final Cases for economic analysis 3,846 4,400 5,195 5,672 19,113a In total, 767 cases had missing Zip codes (excluding foreign travelers). Of these, 67 are removed as outliers. Of the remaining 700 cases, 78 cases are included within the non-primary purpose trip segment. The remaining 622 are excluded in analyses by trip segment.
National forest visitors reported spending in ten categories. The individual expenditure categories were modified slightly in FY 2003. Table 2 shows the changes in spending categories and how FY 2003 categories were matched with earlier years. The two lodging categories in each version of the instrument are combined to create a general “lodging” category that can be compared across the two versions of the instrument2. The new “sporting goods” category in FY 2003 can be combined with the “souvenirs/clothing and other misc” category to be consistent with the combination of “souvenirs/clothing” and “any other expenses” during the first three years3. 1 Roughly one in four visitors received the economics survey during the first three years. The percentage was increased to a third in FY 2003. 2 In the first three years “privately-owned lodging” accounted for 89% of total lodging expenditures. In year 4 “motel, lodge, cabin, B&B” represented 78% of the total lodging expenditures. 3 See Stynes and White (2005) for a more complete treatment of the effects of changes in spending categories in FY 2003.
NVUM Four Year Report
5
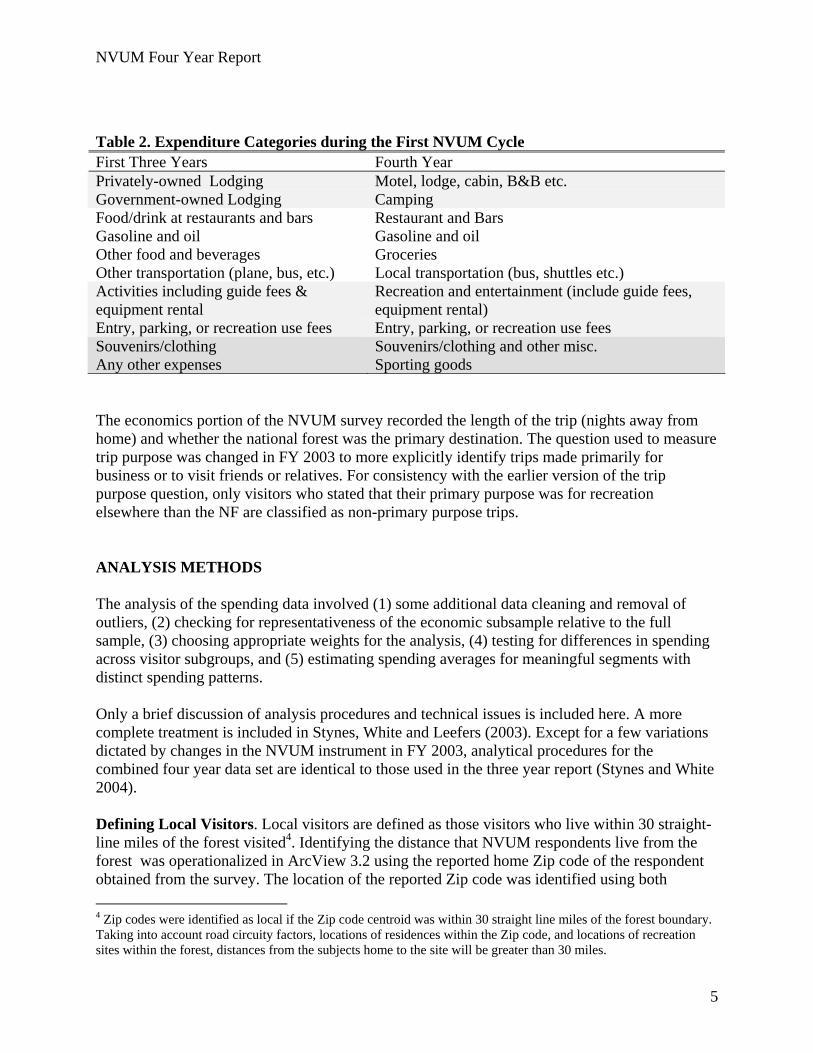
Table 2. Expenditure Categories during the First NVUM Cycle First Three Years Fourth Year Privately-owned Lodging Motel, lodge, cabin, B&B etc. Government-owned Lodging Camping Food/drink at restaurants and bars Restaurant and Bars Gasoline and oil Gasoline and oil Other food and beverages Groceries Other transportation (plane, bus, etc.) Local transportation (bus, shuttles etc.) Activities including guide fees & equipment rental
Recreation and entertainment (include guide fees, equipment rental)
Entry, parking, or recreation use fees Entry, parking, or recreation use fees Souvenirs/clothing Souvenirs/clothing and other misc. Any other expenses Sporting goods The economics portion of the NVUM survey recorded the length of the trip (nights away from home) and whether the national forest was the primary destination. The question used to measure trip purpose was changed in FY 2003 to more explicitly identify trips made primarily for business or to visit friends or relatives. For consistency with the earlier version of the trip purpose question, only visitors who stated that their primary purpose was for recreation elsewhere than the NF are classified as non-primary purpose trips. ANALYSIS METHODS The analysis of the spending data involved (1) some additional data cleaning and removal of outliers, (2) checking for representativeness of the economic subsample relative to the full sample, (3) choosing appropriate weights for the analysis, (4) testing for differences in spending across visitor subgroups, and (5) estimating spending averages for meaningful segments with distinct spending patterns. Only a brief discussion of analysis procedures and technical issues is included here. A more complete treatment is included in Stynes, White and Leefers (2003). Except for a few variations dictated by changes in the NVUM instrument in FY 2003, analytical procedures for the combined four year data set are identical to those used in the three year report (Stynes and White 2004). Defining Local Visitors. Local visitors are defined as those visitors who live within 30 straight-line miles of the forest visited4. Identifying the distance that NVUM respondents live from the forest was operationalized in ArcView 3.2 using the reported home Zip code of the respondent obtained from the survey. The location of the reported Zip code was identified using both 4 Zip codes were identified as local if the Zip code centroid was within 30 straight line miles of the forest boundary. Taking into account road circuity factors, locations of residences within the Zip code, and locations of recreation sites within the forest, distances from the subjects home to the site will be greater than 30 miles.

NVUM Four Year Report
6
Delorme Street Atlas 2004 and a Zip code database distributed by ESRI. The straight-line distance from Zip code centroid to the boundary of the forest was calculated for each respondent. Those respondents living within 30 straight-line miles were classified as “local” visitors while those living greater than 30 miles were classified as “non-local” visitors. All foreign visitors were classified as “non-local” visitors. Visitors not providing a Zip code or providing a Zip code that was not found either in Delorme Street Atlas 2004 or in the ESRI database were classified as “missing” and excluded from most economic analyses. Outliers/Contaminants: Long trips (days away from home >=30), large parties (people in the vehicle >=8), and cases with very high total spending (>=$1,000) were omitted from the spending analysis. Spending data for very long stays or covering large parties were deemed unreliable. Spending reports of $1,000 or more were omitted as these cases appeared to include airfares, other expenses outside the local area, or expenditures not clearly related to the NF visit. Dropping these cases yields more conservative spending averages, but likely better represents what a typical NF visitor spends. Since the NVUM sampling design resulted in very high weights for some cases, the omission of outliers helps to reduce the sensitivity of subgroup parameter estimates to a small number of atypical cases. Cases with missing Zip codes were dropped in estimating spending patterns of local versus non-local visitors. After omitting contaminants, outliers and cases with missing data, 19,116 cases were available from which to develop spending profiles within a set of trip type segments (Table 1). Representativeness: Comparisons of selected variables between cases completing the economics portion of the questionnaire versus the overall sample did not reveal any significant differences. The economics sub-sample is therefore assumed to be representative of the entire sample. Representativeness of the overall NVUM sample rests on the stratified sampling design and case weighting to adjust for disproportionate sampling of site days across strata5. As the NVUM study was designed primarily to develop reliable use estimates at the national level, the sample may not be completely representative of visitors at the individual forest level. Forest level statistics should therefore be used with caution. Weights: Two distinct weights are applied to adjust the sample for disproportionate sampling across strata and different levels of exposure of individual visitors to sampling. The exposure weight for each case is the inverse of the number of sites visited. A visitor stopping at two distinct sites on the forest during their visit has twice the chance of being selected as a visitor stopping at only one site and hence is weighted ½ when estimating characteristics of NF visits. Visitors on overnight trips, particularly those staying overnight on the forest were more likely to visit multiple sites. Strata weights adjust the sample to reflect the number of site days sampled within each stratum6. Case weights are the product of the exposure and strata weights. The case weights are used in
5 See English et. al. 2002 for sampling details. 6 Strata were defined as high, medium and low use site days within four types of sites (OUDS, DUDS, WILD and GFA). Weights for sites with proxy measures of site use were based on actual proxy use counts. See English et. al. 2002 for details.

NVUM Four Year Report
7
estimating segment shares, lengths of stay, party sizes and most other visit and visitor characteristics. Only the exposure weights are used in estimating spending averages. Spending measures do not vary systematically with the NVUM strata and therefore the case weights do not generally influence the overall spending averages. However, due to small sample sizes within strata at the individual forest level (or for other narrowly defined subgroups of visitors) and wide variations in sampling ratios across strata7, spending estimates for individual forests that employ strata weights can be sensitive to a small number of cases with very high weights. To avoid this problem, all spending averages are computed using only the exposure weights. Subgroup Analysis: The rationale for and definition of visitor trip segments is discussed further below. The key subgroups for explaining visitor spending were identified in the analysis of the first two years of NVUM data. Analysis of variance indicated that trip type segments were the best predictors of spending. Variations in spending across forests and recreation activities were much smaller and frequently explained by differences in the trip segment mix for a given forest or activity. Procedures for the spending analysis therefore begin by dividing visitors into trip type segments. Spending averages are then estimated for each segment. Spending estimates presented for other subgroups (e.g., by forest or recreation activity groups) take into account variations resulting from the mix of trip types.
NATIONAL FOREST VISITOR SEGMENTS
A primary objective of the economic analysis is to estimate spending profiles for a set of meaningful visitor segments. To be useful, the segments must a) be identifiable from the NVUM survey variables, b) help to explain differences in spending across different applications, c) be large enough to obtain adequate sample sizes in the survey, and d) be meaningful to anticipated national forest management and policy applications. Seven trip type segments were identified in the analysis of the first two years of NVUM data.
National Forest Visitor Trip Type Segments 1. Non-local day trips: Non-local residents on day trips 2. Non-local OVN-NF: Non-local residents staying overnight on the NF 3. Non-local OVN: Non-local residents staying overnight off the NF
4. Local day trips: Local residents on day trips 5. Local OVN-NF: Local residents staying overnight on the NF 6. Local-OVN: Local residents staying overnight off the NF
7. Non-Primary: Visits where recreating on the NF is not the primary trip purpose.
7 Strata weights vary from as low as 1 to as high as 100,000. Hence a single case with very high spending could significantly influence the spending averages if the strata weights were used, while hundreds of cases with low weights would have almost no influence at all.

NVUM Four Year Report
8
Local visitors are defined as living within 50 miles of the recreation site8. Overnight visitors (OVN) are those that reported being away from home more than 24 hours on their trip9. The OVN-NF segments are composed of those visitors who stated that they spent the previous night on the national forest10. The “non-primary” segment covers visitors who reported recreating at other areas on the trip and did not identify the NF as their primary destination11. Spending differences are largest between day trips and overnight trips. There are also differences among overnight visitors between those staying on or off the forest12. The trip type segmentation distinguishes local visitors from non-local visitors and splits out non-primary purpose trips as a distinct segment. Identifying locals as a set of distinct segments facilitates distinguishing “new” money (exports) brought in by non-locals from spending by local residents when completing a regional economic analysis13. Likewise, the spending by visitors in the non-primary segment can be included or not depending on the purpose of a given analysis14. Spending profiles are developed first for the seven trip type segments, as these explain much more variation in individual visitor spending than recreation activities. Variations in spending across forests and activities are frequently explained by the mix of trip segments. For example, forests or sites that attract more local visitors and day trips have lower visitor spending averages than those serving larger percentages of overnight visitors. Local residents on day trips account for a greater share of some activities such as hiking, biking and picnicking, which in part explains why these activities have below average spending.
8 Formally, locals were defined using the Zip code variable to determine the straight-line distance from the center of the Zip code to the forest boundary. Distances of 30 miles or less were defined as locals. Taking into account the additional distance from the forest boundary to the recreation site, distances from the residence to Zip code centroid and road circuity, locals should be interpreted as living within roughly a 50 mile driving distance of the site. 9 As the survey in the first three years did not measure nights spent in the local area, the overnight segments will include some visitors on extended trips that do not spend any nights locally. Spending reports were restricted to spending within 50 miles of the site. 10 This may mis-classify some visitors sampled on the first day of their visit. Since only last-exiting vehicles were interviewed this will not be a problem for visitors contacted at camping sites; however, some NF campers may have been sampled at day use sites prior to setting up camp. 11 This question was asked differently in FY 2003. See Stynes and White (2005) for details. 12 The analysis of lodging types in the FY 2003 data suggests that not all visitors claiming to spend the night “on the national forest” were actually on NF lands/facilities. 13 For use in an economic impact analysis, the definition of the “local region” depends on the region for which impacts are desired. The region should include places where visitors might stay and spend money during a trip to the area. In most cases regions are defined as collections of counties around the forest. 14 The “non-primary” segment can also be divided between local and non-local residents, but is grouped in the analyses reported here, because most visitors (79%) whose primary purpose was not to visit the NF are non-local.

NVUM Four Year Report
9
SEGMENT SHARES
The percentage of national forest visits within the seven trip type segments was estimated from the four years of NVUM data. Local residents on day trips are the largest segment, accounting for 46% of all visits (Figure 1). Another 13% of visits are local residents on overnight trips staying either on- or off- the forest. Non-local visitors are more likely to be on overnight trips. Nineteen percent of visits are non-local visitors staying overnight off of the forest, 7% are non-local visitors staying overnight on the forest and 8% are non-local day trips. Another 7% of visits are trips where recreating on the national forest was not the primary trip purpose (Figure 1). The majority of non-primary purpose trips are visitors from outside the local region, often involving other activities in the area or a stop en route to other destinations. Non-primary purpose trips are identified as a distinct segment as much of the spending on these trips cannot be directly attributed to the national forest visit. Segment shares vary widely across recreation activities, seasons of the year, individual forests, and specific sites on a given forest. Variations in these trip type segment shares across forests (Table A-2) and primary recreation activity (Table A-5) are shown in Appendix A. The national estimates of segment shares are somewhat sensitive to the choice of weights in the NVUM sample and also the exclusions of outliers (Table 3). Outliers primarily come from the non-primary purpose and non-local overnight off-forest segments. The trips that these outliers represent frequently involve extended trips with multiple purposes and some spending not directly related to the NF visit. Exposure weighting reduces the share of overnight trips relative to day trips as overnight visitors are more likely to visit multiple sites on the forest. Case weights and the full information estimates increase the percentage of local day trips and non-local OVN trips relative to overnight on-forest segment shares.
Figure 1. National Forest Visitor Trip Type Segments
NL OVN-NF7%
NL-OVN19%
Local Day46%
Local OVN-NF6%
Local OVN7%
Non-primary7%
NL Day8%

NVUM Four Year Report
10
Table 3. National Forest Visitor Segment Distribution, First NVUM Cycle Number of cases a Percent
Case All Cases
Omitting Outliers All Cases
Drop Outliers
Exposure Wt Wt Full Infoc
Non-Local Day 1,632 1,600 8% 8% 9% 9% 8%Non-Local OVN-NF 3,125 2,845 15% 15% 12% 8% 7%Non-Local -OVN 3,442 2,840 17% 15% 14% 15% 19%Local Day 7,373 7,241 36% 38% 43% 48% 46%Local OVN-NF 1,828 1,753 9% 9% 8% 7% 6%Local OVN 1,236 1,153 6% 6% 6% 6% 7%Non-Primaryb 2,100 1,681 10% 9% 8% 6% 7%Total 20,736 19,113 100% 100% 100% 100% 100%a Cases with missing Zip codes are omitted in estimating segment shares except for the non-primary segment.. b 21% of “non-primary” visitors are local residents. c The full information segment shares are computed using case weights and information from both the economics and general sections of the survey. The “full information” estimates in the right hand column of Table 2 are the best estimates of the national segment shares as these use the case weights to adjust for disproportionate sampling and make use of additional information from the larger sample completing the general survey. A partial segmentation was developed from questions in the general survey using all cases. Variables from the smaller economic sub-sample were then used to distribute these segments into the final seven trip type segments15. The segment mix has changed somewhat from year to year over the first cycle of NVUM surveys (Table 4). Non-local overnight trips (NL-OVN) have ranged from 16% to 25% of all visits, while local day trips have varied from 42% to 51%. The percentage of visits classified as non-primary purpose trips varies from a low of 5% in 2002 to 8% during the first two years. Table 4. Comparison of Full Information Segment Shares by Year Non-Local Segments Local Segments
Year Day OVN-
NF OVN DayOVN-
NF OVNNon-
Primary Total 2000 6% 5% 16% 51% 5% 9% 8% 100% 2001 8% 7% 20% 44% 4% 9% 8% 100% 2002 9% 7% 25% 42% 6% 6% 5% 100% 2003 10% 9% 14% 50% 7% 3% 7% 100% 2000 & 2001 7% 6% 18% 47% 5% 9% 8% 100% 2000, 2001, 2002 8% 7% 20% 45% 5% 8% 7% 100% Four Years 8% 7% 19% 46% 6% 7% 7% 100% 15 The general survey obtained the Zip codes of respondents (to identify local visitors) and whether or not the visitor spent the night on the NF while the number of days away from home on the trip and the primary trip purpose were measured for the economics sub-sample.

NVUM Four Year Report
11
Other segments generally represent 5-10% of all visits, fluctuating somewhat within this range. Year to year differences seem to reflect the mix of forests sampled each year, although they may also be due to sites sampled on each forest, or changes over time. SPENDING PROFILES Spending profiles give the average amount spent within a set of spending categories for a particular subgroup of visitors. The unit of analysis for spending is the party trip, covering all expenses by the travel party within 50 miles of the interview site during their stay in the area. All spending figures are reported in 2003 dollars. Spending reported each year was price adjusted to 2003 using distinct BLS price indices for each spending category. 1. National averages by trip type segments Table 5 presents the national spending averages across all national forest visits based on the spending reports of 19,113 visitors sampled on 119 national forests between January, 2000 and September, 2003. Profiles are estimated for the seven trip type segments defined above. Spending is itemized within eight spending categories16 and reported on a party trip basis. Sample sizes and sampling errors of the totals are given at the bottom of the table. For comparability, this same format is used in all subsequent spending tables. Table 5. National Forest Visitor Spending Profiles by Trip Type Segment and Spending
Category, $ per party per tripa Non-Local Segments Local Segments
Spending category Day OVN-NF OVN Day OVN-NF OVNNon-
Primary All Visitsb
Lodging $ 0.00 $ 25.30 $ 64.85 $ 0.00 $ 16.24 $ 17.62 $ 48.78 $ 19.71Restaurant 13.60 25.26 58.91 6.12 13.61 21.49 44.80 22.32Groceries 7.61 36.55 31.28 5.41 41.15 23.46 21.04 17.18Gas & oil 15.99 37.28 35.79 11.67 27.70 25.93 28.52 21.53Other transp. 0.98 3.00 7.54 0.21 0.21 1.09 5.10 2.26Activities 3.87 8.04 15.49 1.82 3.80 6.76 9.67 6.03Admissions/fees 5.24 10.23 9.02 3.42 10.54 8.37 6.97 6.13Souvenirs/other 4.31 15.59 22.37 4.20 11.24 11.42 18.64 10.40Total 51.60 161.25 245.25 32.85 124.49 116.14 183.52 105.57N (unwtd) 1,600 2,845 2,840 7,241 1,753 1,153 1,681 19,113Std Dev. of Total 85 201 249 65 147 162 229 180SE Mean of Total 2.15 3.79 4.82 0.76 3.53 4.76 5.11 1.30Pct Error (95% level) 8% 5% 4% 5% 6% 8% 6% 2%a Outliers are excluded and exposure weights are applied in estimating spending averages. All figures expressed in 2003 dollars. b The all visit averages are computed as a weighted average of the columns using the national trip segment shares as weights
16 The two lodging categories in each version of the survey instrument are combined and sporting goods measured in FY 2003 is combined into the souvenirs and other category.

NVUM Four Year Report
12
Spending varies from $33 per party per trip for local day trips, to $52 for non-local day trips, to as high as $245 per trip for non-local visitors on overnight trips staying off the forest. Sampling error (of the totals) at the 95 percent confidence level is two percent overall and between four and eight percent for individual segments (Table 5). The national spending averages have changed slightly from year to year, although for most segments the differences are not statistically significant (Table 6). Spending averages for visitors staying overnight on the NF were above average in 2001, mainly due to greater spending on groceries and gas. Spending of local visitors on day trips was higher in the first year than the following two years. Changes in spending categories in 2003 likely account for the higher spending for the NL-OVN, L-OVN-NF, and L-OVN segments that year. Changes in the lodging categories increased reported lodging expenses17. Year to year changes also reflect differences in the forests surveyed each year. The “All Visits” spending average for each year is estimated as a weighted average of segment spending averages using the full information segment shares in Table 4 as weights. If segment shares are fixed at their four year values, the all visits spending average is above average in 2003 and below average in 2002. If segment shares are allowed to vary from year to year, the all visits spending average is highest in 2002 and lowest in 2000. The differences in the two columns illustrate the importance of segment shares in determining the overall average spending. The above average percentage of NL-OVN visitors in 2002 raises the spending average that year. The below average percentages of OVN visitors in 2003 compensates for the higher spending of those segments. Table 6. Comparison of Spending Averages by Year, $ per party per trip Non-Local Segments Local Segments All Visitsd
Year Day OVN-
NF OVN DayOVN-
NF OVNNon-
Primary 4 year
SegAnnual
Seg2000 $49a $143a $225a $38a $114abc $113ab $197a $103 ab $97 a 2001 63a 200b 220a 29b 122abc 111ab 168a 101 ab 104 b
2002 49a 148a 252ab 29b 115bc 86b 172a 100 a 111 c
2003 48a 158a 285b 35ab 139c 194c 192a 121 c 105 b
Two year 58a 178ab 222a 34ab 119abc 112ab 184a 103 ab 101 ab
Three year 54a 163a 232a 32b 117ab 104ab 180a 101 a 103 b
Four Year 52a 161a 245a 33ab 124abc 116a 184a 106 b 106 b
NOTE: All spending averages computed with exposure weights and with outliers removed. All figures expressed in 2003 dollars. Two and three year averages cover the first two and three years, respectively. abc Denotes significantly different subsets within segments. Segments with the same superscript in any column are not significantly different (95% level), while those with different superscript are. The two, three and four year averages are treated as independent samples in this test d. The all visits average is computed as a weighted average using full information segment shares as weights. The “4 year Seg” column fixes the segment shares at the 4 year average, while the “Annual Seg” column uses segment shares for each year from Table 4.
17 See Stynes and White (2005) for further details about the effects of questionnaire changes in 2003. .

NVUM Four Year Report
13
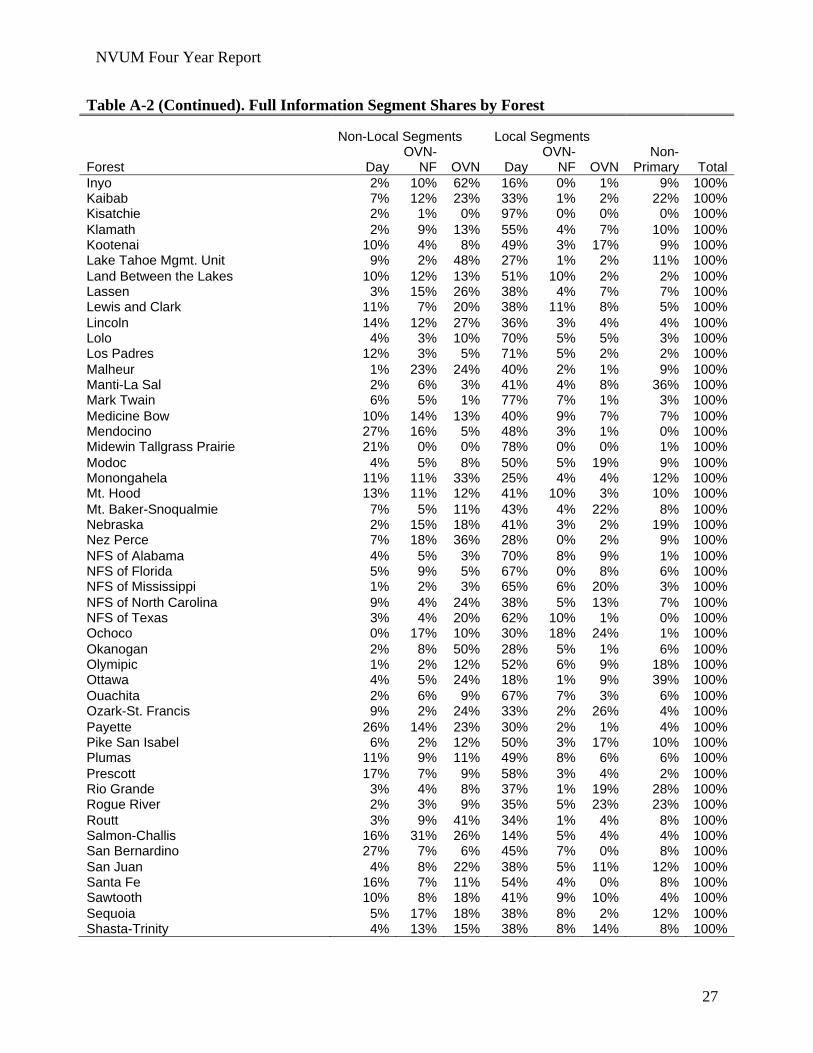
2. High and Low Spending Areas NVUM sample sizes are too small at the individual forest level to reliably capture differences in spending for individual forests. The overall average visitor spending for a given forest can be estimated as a weighted average of the national spending profiles using trip segment shares for the individual forest as weights (Table A-2). This procedure assumes the national spending profiles for each segment in Table 5 can be generalized to individual forests. Differences in spending between forests are then attributed primarily to the mix of visitors attracted. Spending will vary somewhat from one area to another based upon local prices and spending opportunities. To account for spending variations that are independent of the mix of trip segments, “high” (Table 7) and “low” (Table 8) NF visitor spending profiles were estimated by grouping cases from forests with above or below average spending. Forests with above or below average spending were identified by comparing spending averages for each forest with the national averages. Day and overnight visitor spending averages (excluding non-primary visitors) were estimated based on the sample of visitors on each forest. To control for differences in the visitor mix across forests, a standardized overall average was computed for each forest, assuming a fixed mix of 60% day trips and 40% overnight trips. The standardized average for each forest was compared to the national standardized average18. Of the 119 forests sampled in the NVUM study, 48 have visitor spending averages not significantly different from the national average, after controlling for the segment mix. Forty-four forests have below average spending and 28 forests have above average spending. The classification of individual forests into high, low and average spending categories is reported in Table A-1. Table 7. High Spending Profiles by Segment and Spending Category, $ per party per tripa Non-Local Segments Local Segments
Spending category Day OVN-NF OVN DayOVN-NF OVNNon-
Primary All Visitsb
Lodging 0.00 35.56 80.95 0.00 24.62 28.11 64.62 25.84Restaurant 16.96 35.41 73.07 6.43 14.28 32.07 64.30 28.28Groceries 9.08 47.36 38.30 7.50 42.40 28.15 23.51 20.93Gas & oil 21.62 47.16 37.92 10.58 28.79 29.76 35.18 23.37Other transp. 1.36 4.61 10.38 0.33 0.00 4.32 6.06 3.28Activities 4.97 13.51 23.54 1.96 3.47 6.89 23.39 9.05Admissions/fees 7.60 14.01 10.51 2.69 9.21 8.56 9.79 6.66Souvenirs/other 6.47 19.74 29.30 7.63 12.32 18.18 26.87 14.87Total 68.06 217.36 303.97 37.13 135.08 156.04 253.73 132.28N(unwtd) 320 830 1,072 1,325 220 206 444 4,417Std Dev. of Total 110 228 262 85 146 194 253 226SE Mean of Total 6.13 7.91 7.99 2.33 9.83 13.54 12.02 3.40Pct Error (95% level) 18% 7% 5% 13% 15% 17% 9% 5%a Outliers are excluded and exposure weights are applied in estimating spending averages. All figures expressed in 2003 dollars. b All visits averages are computed as a weighted average of the columns using the national trip segment shares as weights
18 See Stynes, White and Leefers (2003) for a more detailed description of this procedure.
NVUM Four Year Report
14
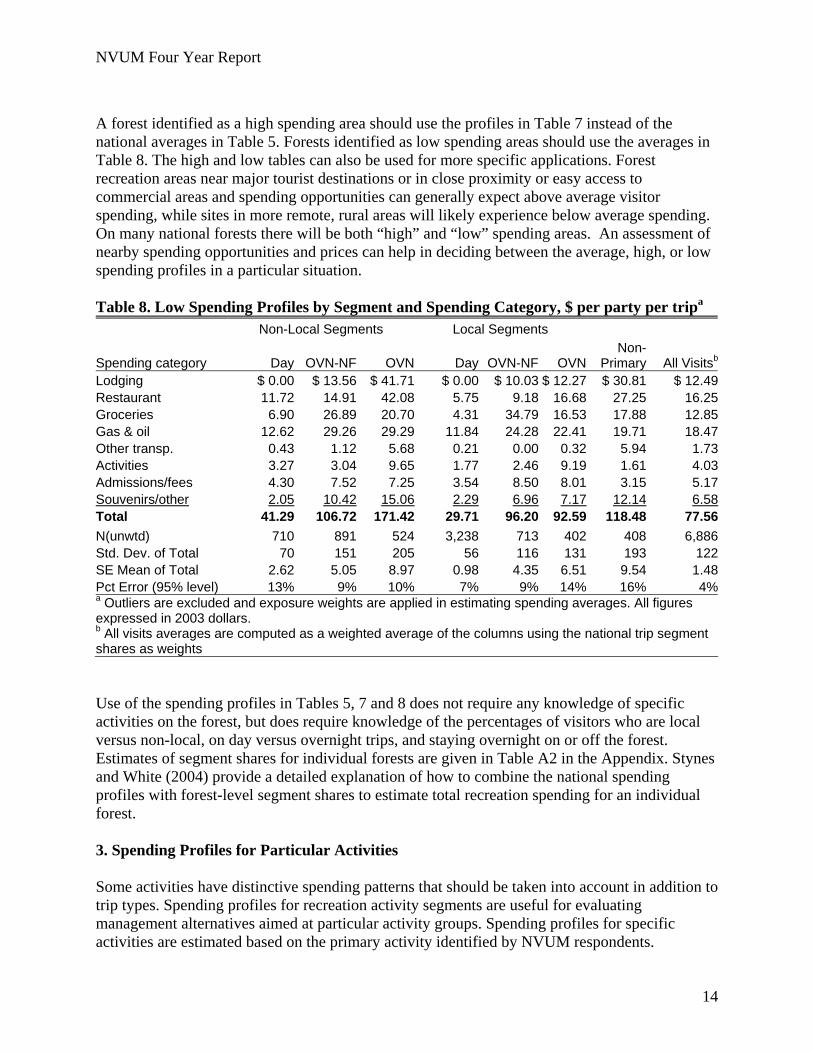
A forest identified as a high spending area should use the profiles in Table 7 instead of the national averages in Table 5. Forests identified as low spending areas should use the averages in Table 8. The high and low tables can also be used for more specific applications. Forest recreation areas near major tourist destinations or in close proximity or easy access to commercial areas and spending opportunities can generally expect above average visitor spending, while sites in more remote, rural areas will likely experience below average spending. On many national forests there will be both “high” and “low” spending areas. An assessment of nearby spending opportunities and prices can help in deciding between the average, high, or low spending profiles in a particular situation. Table 8. Low Spending Profiles by Segment and Spending Category, $ per party per tripa Non-Local Segments Local Segments
Spending category Day OVN-NF OVN Day OVN-NF OVNNon-
Primary All Visitsb
Lodging $ 0.00 $ 13.56 $ 41.71 $ 0.00 $ 10.03 $ 12.27 $ 30.81 $ 12.49Restaurant 11.72 14.91 42.08 5.75 9.18 16.68 27.25 16.25Groceries 6.90 26.89 20.70 4.31 34.79 16.53 17.88 12.85Gas & oil 12.62 29.26 29.29 11.84 24.28 22.41 19.71 18.47Other transp. 0.43 1.12 5.68 0.21 0.00 0.32 5.94 1.73Activities 3.27 3.04 9.65 1.77 2.46 9.19 1.61 4.03Admissions/fees 4.30 7.52 7.25 3.54 8.50 8.01 3.15 5.17Souvenirs/other 2.05 10.42 15.06 2.29 6.96 7.17 12.14 6.58Total 41.29 106.72 171.42 29.71 96.20 92.59 118.48 77.56N(unwtd) 710 891 524 3,238 713 402 408 6,886Std. Dev. of Total 70 151 205 56 116 131 193 122SE Mean of Total 2.62 5.05 8.97 0.98 4.35 6.51 9.54 1.48Pct Error (95% level) 13% 9% 10% 7% 9% 14% 16% 4%a Outliers are excluded and exposure weights are applied in estimating spending averages. All figures expressed in 2003 dollars. b All visits averages are computed as a weighted average of the columns using the national trip segment shares as weights Use of the spending profiles in Tables 5, 7 and 8 does not require any knowledge of specific activities on the forest, but does require knowledge of the percentages of visitors who are local versus non-local, on day versus overnight trips, and staying overnight on or off the forest. Estimates of segment shares for individual forests are given in Table A2 in the Appendix. Stynes and White (2004) provide a detailed explanation of how to combine the national spending profiles with forest-level segment shares to estimate total recreation spending for an individual forest. 3. Spending Profiles for Particular Activities Some activities have distinctive spending patterns that should be taken into account in addition to trip types. Spending profiles for recreation activity segments are useful for evaluating management alternatives aimed at particular activity groups. Spending profiles for specific activities are estimated based on the primary activity identified by NVUM respondents.

NVUM Four Year Report
15
Differences in spending by particular activity subgroups are generally due to unique expenses associated with the activity, such as additional gas for motorized recreation activities, special fees for skiing, golf, and camping, and in some cases equipment rental/purchases on the trip for particular activities. For many activities, however, special activity-related expenses are small compared to the more general expenditures that vary with trip types, transportation modes, length of stay and party sizes. Hence, for many activities the spending averages do not differ significantly from the general averages or the differences are explained by the mix of trip types. The trip type mixes are reported in Table A-5. Tests were carried out on the NVUM data to identify activities with above or below average spending. Spending averages for all activity-trip type combinations with at least 50 cases in the four year spending data set are reported in Table 9. Spending significantly different from the overall segment spending mean at the bottom of the column are indicated with an asterisk (95% confidence level).
Table 9. Spending Averages by Primary Activity and Segment, $ per party trip Non-Local Segments Local Segments
Primary Activity Day OVN-
NF OVN DayOVN-
NF OVN Non-
Primary All
Visits
Biking 343* 20* $ 78*Boatinga 158 288 52* 100 108 Cross-country skiing 346* 34 105Developed Camping 140 146* 128 127 117* 131*Downhill skiing 80* 331* 53* 129 136*Driving 40 166* 24* 129* 71*Fishing 42 205* 238 42* 135 99 225 108General/Relaxing 46 158 245 33 125 148 146 118*Hiking 37* 147 276 20* 79* 83* 217 77*Hunting 44 201 250 51* 174* 130 122*Multiple activities 173* 36 152 98Nature-relateda 52 213 225 27* 134 190 121*No primary activity 138 252 42 100 190 119OHV usea 62 147 182* 38 114 89*Othera 135 222 31 161 88Other non-motorized 43 163 262 31 70*Picnic 59 38 73*Prim. camp/Backpacking 105* 104* 93* 99 99Resort 222*Snowmobile 108* 343* 68* 157*National Average 52 161 245 33 124 116 184 106NOTE: Means are reported for segment/activity combinations with at least 50 cases. Averages are computed using exposure weights and omitting outliers. All figures expressed in 2003 dollars. a “Nature-related” activities include viewing wildlife, viewing natural features, nature study, visiting a nature center, or viewing forest. “OHV use” includes other motorized activity. “Boating” combines motorized and non-motorized boating. The “other” category includes gathering, visiting historic sites, and horseback riding * Indicates the mean is significantly different from the overall total at the bottom of the column (95% confidence level)

NVUM Four Year Report
16
Complete spending profiles for activity-trip type combinations with significantly different spending averages (95% confidence level) are reported in Tables 10-14. Sampling errors for spending averages of individual activity-trip type segments are generally between 10 and 20% at a 95% confidence level. A few segments that are not significantly different are shown in these tables for comparison. It should be noted that spending averages for individual activities may vary across forests or individual sites. Activity-specific spending profiles are grouped into tables covering (1) motorized activities, (2) skiing, (3) hunting and fishing, (4) camping, and (5) general day trip activities. A more complete analysis of wildlife-related activities is included in Appendix B. Motorized Activities Visitors whose primary activity is a motorized activity spend more money on gas and oil (Table 10). For example, snowmobilers on day trips from more than 50 miles away (non-local) spend $108 per trip including $52 for gas and oil. This compares to the national day trip spending average of $52 with $16 for gas and oil. The national spending average for local day trips is $33 of which $12 is for gas. Local snowmobilers spend $68 per day and $32 for gas. Local day visitors whose primary activity is boating (motorized) spend about $28 more per trip than the overall local day trip average. Almost half of this difference is due to the higher gas and oil expenses. Spending by local OHV users on day trips is not significantly different than the overall average, although the difference in the sample of about $5 is largely additional fuel purchases.
Table 10. Spending Profiles for Visitors in Motorized Activities; Selected Day Trip Segments, $ per party per day
Snowmobile
Motorized Boating OHV Use
Spending category Non-Local
Day Local Day Local Day Local Day
Lodging 0.00 0.00 0.00 0.00Restaurant 22.92 11.28 7.00 6.43Groceries 11.50 7.02 10.38 7.21Gas & oil 52.48 31.64 23.81 15.89Other transp. 0.75 0.26 1.28 0.00Activities 10.72 2.14 1.35 2.58Admissions/fees 8.32 6.64 5.34 2.36Souvenirs/other 1.42 9.47 11.83 3.40Total 108.11 68.45 60.98 37.88a
N 56 162 101 211Std Dev. of Total 155 82 96 59SE Mean of Total 21 6 10 4
Pct Err (95% level) 38% 19% 31% 21%Note: All figures expressed in 2003 dollars. a Not significantly different from the overall segment spending average at 95% confidence level.

NVUM Four Year Report
17
Skiing Higher spending of skiers results primarily from greater expenditures for activities and admissions and fees, reflecting the additional costs of lift tickets, equipment rental and use fees (Table 11). Half of the spending by skiers on day trips is for activities or admissions/fees. This percentage is more than double what other day visitors spend in these two categories. Non-local OVN downhill skiers spend $76 per party on activities and admissions/fees, accounting for most of the difference in spending compared to the overall average for the NL-OVN segment. Comparatively lower spending on activities and fees of local skiers may reflect the omission of season passes in the spending reports. Higher lodging expenses for skiers on overnight trips reflects the greater percentage staying in resorts and lodges, compared to summer visitors, although an unknown number of skiers on overnight trips may be staying in owned seasonal homes or with friends and relatives19. Spending by the NL-OVN cross country ski segment is statistically similar to the corresponding downhill ski segment and statistically different from the national average NL-OVN spending. Local cross country skiers on day trips spend similar amounts per visit as other local visitors on day trips.
Table 11. Skier Spending Profiles for Selected Trip Segments, $ per party per trip
Downhill Ski Cross Country Skiing
Spending category Non-Local
DayLocal
DayNon-Local-
OVNLocal OVN
Non-Local OVN Local Day
Lodging 0.00 0.00 88.09 18.32 117.94 0.00Restaurant 13.60 9.79 66.24 31.81 90.22 7.74Groceries 5.47 2.75 25.85 7.92 32.96 7.31Gas & oil 13.21 11.19 29.93 17.06 35.78 7.70Other transp. 0.00 0.01 19.07 1.13 10.28 0.00Activities 18.06 11.95 43.77 14.35 23.87 3.35Admissions/fees 24.65 12.62 32.52 20.94 10.36 5.04Souvenirs/other 4.56 5.03 25.41 17.39 24.39 2.90Total 79.54 53.34 330.89 128.91 345.81 34.04a
N 138 397 170 57 59 227Std Dev. of Total 94 84 290 177 267 82SE Mean of Total 8 4 22 24 35 5Pct Err (95% level) 20% 16% 13% 36% 20% 32%Note: All figures expressed in 2003 dollars. a Not significantly different from the overall segment spending average at 95% confidence level.
19 Specific lodging types were not measured in the first three years of NVUM surveys. Greater detail on lodging types is reported in Stynes and White (2005).

NVUM Four Year Report
18
Hunting and Fishing Distinct spending profiles are identified for hunters and anglers within selected trip type segments (Table 12). Non-local anglers who stayed the night on the national forest and local anglers on day trips spent significantly more than the average for all visitors in those segments. Local hunters, whether on a day trip or spending the night on the national forest, also spent significantly more than the average for those trip type segments. The spending of non-local OVN-NF hunters and local OVN-NF anglers was also above average, although this difference was not statistically significant. The greater spending by hunters and anglers can mostly be attributed to higher expenditures in the lodging, groceries, gas and oil, and souvenirs/other expenditure categories.
Table 12. Spending Profiles for Hunting and Fishing, $ per party per trip Fishing Hunting
Spending category Non-Local
OVN-NF Local DayLocal
OVN-NFNon-Local
OVN-NF Local Day Local
OVN-NF
Lodging 39.06 0.00 17.58 19.87 0.00 12.64Restaurant 29.91 7.28 14.87 24.79 4.86 15.98Groceries 46.78 8.19 43.89 51.16 8.72 57.04Gas & oil 46.43 14.90 31.09 66.52 16.89 47.70Other transp. 3.70 0.04 0.00 0.00 0.00 1.14Activities 10.11 1.83 3.36 6.29 2.00 3.30Admissions/fees 9.31 3.77 9.19 6.14 1.60 3.58Souvenirs/other 19.64 5.64 15.41 26.16 16.67 32.77Total 204.94 41.65 135.39a 200.92a 50.74 174.14N 306 646 154 177 395 111Std Dev. of Total 216 79 156 221 90 178SE Mean of Total 12 3 13 17 5 17Pct Err (95% level) 12% 15% 19% 17% 18% 19%Note: All figures expressed in 2003 dollars. a Not significantly different from the overall segment spending average at 95% confidence level.
Some USDA FS programmatic analyses require separate estimates for wildlife-related recreation including hunting, fishing and wildlife viewing. Appendix B presents a more detailed analysis of wildlife-related visitors including a comparison of wildlife-related and non-wildlife-related visitors. Grouping of the three wildlife-related activities yields larger samples for subgroup analyses, although this aggregation loses differences among the three activities. From Table 12 we see that anglers spend slightly more than hunters if staying overnight on the forest, but spend slightly less on day trips or when staying overnight off the forest.

NVUM Four Year Report
19
Camping Among visitors staying overnight on the national forest, two distinct groups of campers with divergent spending patterns may be identified (Table 13). Those staying in primitive campgrounds or the backcountry spend $105 per trip if non-local and $94 if local. Campers staying in developed campgrounds spend approximately 35% more than primitive campers. Lodging expenditures account for some of the difference20, but those camping in developed areas also spend more on groceries and gas and oil. Campers from the local area spend less than those from outside the local region.
Table 13. Trip Spending Profiles for Campers, $ per party per trip*
Primitive Camping Developed Camping
Spending category Non-Local
VisitorsLocal
VisitorsNon-Local
VisitorsLocal
Visitors
Lodging 8.76 8.51 14.65 11.18 Restaurant 17.54 11.08 20.83 12.48 Groceries 20.85 33.22 37.79 46.28 Gas & oil 25.17 20.64 34.87 27.39 Other transp. 6.24 0.10 1.48 0.32 Activities 5.29 1.61 7.01 3.81 Admissions/fees 6.76 7.80 13.37 18.10 Souvenirs/other 14.07 11.10 11.28 8.30 Total 104.68 94.07 141.29 127.87 N (unwtd) 409 228 656 588 Std Dev. of Total 163 116 173 139 SE Mean of Total 8 8 7 6 Pct Error (95% level) 15% 16% 10% 9% Note: All figures expressed in 2003 dollars.
20 Camping fees may have been reported as lodging or as admissions/fees and in some cases possibly as activity expenses.

NVUM Four Year Report
20
General Day Trip Activities Spending averages for biking, hiking and driving for pleasure on day trips were about a third less than the general day trip spending averages. As the spending profiles for these activities are similar, they are grouped together in Table 14.
Table 14. Day Trip Spending Profiles for Biking, Hiking and Driving for Pleasure, $ per party per day
Bike, Hike, Drive
Spending category Non-Local Local Day Lodging 0.00 0.00 Restaurant 12.48 4.49 Groceries 5.23 3.08 Gas & oil 10.93 8.02 Other transp. 2.32 0.12 Activities 0.82 0.57 Admissions/fees 2.60 2.20 Souvenirs/other 2.68 2.07 Total 37.05 20.56 N 431 2529 Std Dev. of Total 77 48 SE Mean of Total 4 1 Pct Err (95% level) 20% 9% Note: All figures expressed in 2003 dollars.
The activity-based spending profiles in Tables 10-14 may be used to evaluate alternatives involving specific activities or when the number of visitors in distinct activity groups is known. For example, the skier profiles may be applied to changes in skier visits, snowmobile profile to changes in visits from modifications of snowmobile trails, and the developed camping profiles to an increase or decrease in campground use.
Summary and Conclusion This report has updated previous NVUM spending profiles using data gathered at an additional 31 national forests in FY 2003. Overall, the four-year spending average for all national forest visitors has remained around $100 per party per trip or $43 per person. Spending patterns have remained reasonably consistent across the four years in the first cycle of NVUM surveys. Year to year differences in the national averages are likely explained by the mix of forests surveyed each year and some changes in the survey instrument in FY 2003. Results based on the combined sample provide reliable estimates of the national averages.

NVUM Four Year Report
21
Modifications to the survey instrument in FY2003 will permit some refinements to the visitor segments in future years. Spending profiles on both a per day and a per trip basis can be estimated from the FY2003 data with overnight visitors divided into lodging types that better explain differences in spending of overnight visitors. Spending profiles for lodging type segments are presented in the FY2003 report (Stynes and White 2005). We recommend developing spending profiles with the revised segments in the second NVUM cycle. Appendices to this report provide estimates for individual forests. Appendix B presents results for wildlife-related activities. Results for individual forests will be less reliable than the national averages and therefore should be used with caution. The number of usable cases for the economic analysis range from 33 cases on the Rio Grande National Forest to 528 on the Tonto National Forest (Table A-4). Sample sizes for specific trip types and activities at the forest level are much smaller and results can be quite sensitive to the NVUM case weights.
REFERENCES
English, D.B.K., S.M. Kocis, S.J. Zarnoch, and J.R. Arnold. 2002. Forest Service national
visitor use monitoring process: research method documentation. USDA Forest Service General Technical Report SRS-57 14 p.
Stynes, D.J., Propst, D.B., Chang, W.H., and Sun, Y. 2000. Estimating regional economic impacts of park visitor spending: Money Generation Model Version 2 (MGM2). East Lansing, MI: Department of Park, Recreation and Tourism Resources, Michigan State University.
Stynes, D.J.,White E.M. and Leefers, L.A. 2003. Spending profiles of National Forest Visitors: Years 2000 and 2001. Report to USDA Forest Service. East Lansing, MI: Department of Park, Recreation and Tourism Resources. Michigan State University.
Stynes, D.J. and White E. 2004. Spending profiles of National Forest Visitors; 2002 Update. Report to USDA Forest Service. East Lansing, MI: Department of Park, Recreation and Tourism Resources. Michigan State University.
Stynes, D.J. and White E. 2005. Effects of Changes in the FY2003 NVUM Instrument and Development of National Forest Visitor Spending Profiles for Lodging-based Segments. Report to USDA Forest Service. East Lansing, MI: Department of Park, Recreation and Tourism Resources. Michigan State University.

NVUM Four Year Report
22
Appendix A.
Supplemental Tables
Table A-1. Spending Averages by Forest and Day Versus Overnight Trip Segments, $ per party per trip .……………………..………………………....…………24 Table A-2. Full Information Segment Shares by Forest ...................................................27 Table A-3. People per Vehicle by Segment by Forest …………………………………..30 Table A-4. Sample Size by Forest and Segment …………………………………….…..33 Table A-5. Trip Segment Distribution by Primary Activity .............................................36 Table A-6. Number and Percentage of Respondents by Primary and Participation Activity ……………………………………………………………….37

NVUM Four Year Report
23
Table A-1. Spending Averages by Forest and Day Versus Overnight Trip Segments,
$ per party per tripa
Day Trips Overnight Trips Overall Spending
Average
NVUM Year Forest Spending N Spending N
Forest Sample
Standardized
Above-average Spending 2 Apache-Sitgreaves $55 23 $253 176 $231 $134 2 Ashley $52 48 $198 99 $143 $111 4 Black Hills $77 50 $295 63 $132 $164 3 Chequamegon-Nicolet $72 65 $189 103 $127 $119 2 Chippewa $32 40 $237 73 $116 $114 1 Coconino $58 65 $210 92 $125 $119 1 Flathead $77 48 $271 38 $158 $155 4 Gallatin $30 187 $252 89 $105 $119
4 Grand Mesa, Uncompahgre and Gunnison $36 146 $262 105 $117 $127
3 Inyo $39 37 $242 283 $201 $120 2 Lake Tahoe Mgmt. Unit $33 102 $287 163 $185 $135 4 Lincoln $66 61 $271 61 $164 $148 4 Ottawa $44 28 $257 79 $180 $129 2 Routt $37 33 $244 67 $161 $120 1 Sawtooth $40 37 $226 76 $127 $114 4 Sequoia $51 65 $249 174 $152 $130 3 Shasta-Trinity $38 70 $245 112 $150 $121 Tongass (All Years) $10 192 $302 67 $112 $127
4 Wallowa-Whitman $54 60 $257 86 $123 $135 2 Wenatchee $70 104 $165 104 $122 $108 1 White Mountain $100 30 $229 92 $189 $152 3 White River $32 196 $269 197 $188 $127
Average Spending 2 Allegheny $38 42 $141 80 $83 $79 1 Beaverhead-Deerlodge $46 61 $150 61 $100 $88 3 Bridger-Teton $20 167 $181 121 $75 $84 1 Caribbean $43 18 $112 51 $105 $71 1 Caribou-Targhee $64 55 $157 109 $98 $101 4 Carson $36 46 $238 65 $177 $117 4 Chattahoochee-Oconee $31 82 $173 47 $86 $88 3 Cherokee $21 83 $167 85 $60 $80 2 Chugach $57 35 $191 36 $76 $111 2 Cleveland $47 115 $166 57 $68 $95 1 Columbia Gorge NSR $18 169 $183 58 $36 $84 2 Coronado $30 166 $152 80 $63 $79 3 Dakota Prairie $31 14 $123 15 $70 $68 3 Deschutes $36 62 $166 76 $97 $88 4 Dixie $50 42 $215 70 $144 $116 3 Fishlake $22 27 $168 53 $104 $80 2 Fremont $43 28 $148 43 $99 $85 2 Gifford-Pinchot $26 67 $155 63 $79 $78 2 Gila $84 10 $110 42 $102 $94 1 Green Mountain $28 65 $174 47 $76 $86 1 Hiawatha $31 24 $155 48 $98 $81 1 Humboldt-Toiyabe $26 32 $182 31 $93 $89

NVUM Four Year Report
24
Table A-1 (Continued). Spending Averages by Forest and Day Versus Overnight Trip Segments, $ per party per tripa
Day Trips Overnight Trips Overall Spending
Average NVUM Year Forest Spending N Spending N
Forest Sample
Standardized
Average Spending (continued) 2 Huron-Manistee $43 26 $163 84 $111 $91 4 Idaho Panhandle $55 126 $198 117 $94 $112 1 Kaibab $37 27 $143 38 $89 $80 3 Land Between the Lakes $25 22 $154 19 $74 $77 1 Lassen $33 17 $231 61 $144 $112 4 Malheur $33 27 $181 57 $114 $92 2 Manti-La Sal $43 37 $149 36 $78 $86 4 Midewin Tallgrass Prairie $25 23 $0 0 $25 $15 4 Monongahela $47 75 $200 170 $137 $108 4 Mt. Hood $40 131 $194 136 $102 $101 3 Nebraska $33 18 $190 31 $107 $95 1 Nez Perce $72 15 $116 19 $99 $89 4 NFS of Alabama $36 41 $167 56 $69 $88 1 NFS of Florida $67 50 $131 23 $82 $93 3 NFS of Mississippi $52 30 $128 57 $76 $83 2 NFS of North Carolina $33 53 $210 93 $120 $104 4 NFS of Texas $32 31 $235 26 $103 $113 1 Okanogan $45 19 $192 69 $145 $104 1 Olymipic $51 69 $167 89 $92 $97 1 Ouachita $39 81 $149 77 $69 $83 2 Ozark-St. Francis $36 54 $190 59 $122 $98 3 Payette $47 37 $158 49 $94 $91 2 Pike San Isabel $35 130 $150 91 $79 $81 1 Plumas $42 75 $134 111 $75 $79 1 Rio Grande $29 9 $280 20 $139 $130 3 Rogue River $62 12 $211 15 $139 $121 4 San Bernardino $36 171 $212 77 $75 $107 1 San Juan $22 57 $219 45 $124 $100 4 Shoshone $35 54 $214 58 $126 $107 3 Sierra $62 57 $153 119 $117 $98 3 Siskiyou $24 34 $185 38 $93 $88 3 Siuslaw $32 32 $208 54 $108 $103 4 Six Rivers $29 42 $173 51 $107 $87 4 Stanislaus $70 78 $179 218 $127 $114 1 Superior $35 17 $176 43 $101 $92 2 Tahoe $34 163 $162 172 $89 $85 2 Umpqua $36 33 $190 68 $119 $98 2 Winema $25 20 $167 15 $99 $82

NVUM Four Year Report
25
Table A-1 (Continued). Spending Averages by Forest and Day Versus Overnight Trip Segments, $ per party per tripa
Day Trips Overnight Trips Overall Spending
Average NVUM Year Forest Spending N Spending N
Forest Sample
Standardized
Below-average Spending 1 Angeles $47 206 $54 24 $48 $50 1 Arapaho-Roosevelt $28 153 $122 79 $60 $66 2 Bighorn $43 52 $107 81 $76 $69 3 Bitteroot $26 140 $107 58 $46 $59 1 Boise $43 36 $104 44 $60 $67 1 Cibola $29 128 $111 41 $53 $62 2 Clearwater $43 36 $106 56 $81 $69 4 Colville $33 50 $103 45 $56 $61 3 Custer $21 36 $90 36 $44 $49 3 Daniel Boone $40 81 $105 100 $58 $66 4 Eldorado $30 158 $125 171 $62 $68 3 Francis Marion and Sumter $30 99 $134 32 $52 $72 1 G. Washington & Jefferson $55 97 $102 75 $66 $74 4 Helena $39 91 $148 33 $56 $83 4 Hoosier $38 72 $105 44 $55 $64 2 Kisatchie $21 22 $81 9 $22 $45 2 Klamath $30 39 $106 33 $58 $60 3 Kootenai $34 101 $127 74 $67 $71 2 Lewis and Clark $41 44 $116 45 $77 $71 2 Lolo $19 96 $107 23 $40 $54 2 Los Padres $18 126 $123 46 $34 $60 3 Mark Twain $26 73 $103 59 $37 $57 3 Medicine Bow $29 73 $101 115 $62 $58 3 Mendocino $15 126 $91 112 $34 $46 1 Modoc $28 13 $55 31 $39 $39 1 Mt. Baker-Snoqualmie $26 129 $62 71 $43 $40 1 Ochoco $21 9 $135 25 $101 $67 3 Prescott $26 163 $120 79 $48 $64 4 Salmon-Challis $26 30 $138 131 $103 $71 4 Santa Fe $25 229 $148 132 $55 $74 2 Shawnee $27 64 $118 72 $62 $64 3 Tonto $36 358 $115 187 $60 $68 2 Uinta $29 265 $129 89 $49 $69 4 Umatilla $47 125 $120 51 $80 $76 4 Wasatch-Cache $18 284 $167 105 $48 $78 4 Wayne $41 83 $134 40 $63 $78 3 Willamette $50 159 $112 172 $71 $75
Three-Year Avg.b $35 6,424 $169 6,352 $89 $89 FY2003 Avg.b $37 2,712 $194 2,566 $100 $100a A standardized average is computed using a fixed mix of day trips (60%) and overnight trips (40%) for each forest. The standardized averages should not be used to represent visitors to a particular forest, as they are based on a fixed mix of day and overnight visitors. The forest sample average is computed based upon the forest’s mix of day and overnight visitors as shown in Table A-2 (excluding non-primary visitors). As the spending averages reported at the forest-level are generally based upon very limited sample sizes these figures may not be reliable. b Forests sampled in the first three years are compared to the three year standardized average and forests in year 4 are compared to the FY 2003 standardized average.

NVUM Four Year Report
26
Table A-2. Full Information Segment Shares by Forest Non-Local Segments Local Segments
Forest DayOVN-
NF OVN DayOVN-
NF OVN Non-
Primary TotalNational Average 8% 7% 19% 46% 6% 7% 7% 100%Allegheny 4% 6% 29% 50% 2% 6% 3% 100%Angeles 9% 0% 1% 81% 5% 4% 0% 100%Apache-Sitgreaves 3% 42% 35% 8% 4% 6% 2% 100%Arapaho-Roosevelt 5% 2% 10% 54% 8% 11% 10% 100%Ashley 16% 20% 24% 18% 5% 6% 11% 100%Beaverhead-Deerlodge 2% 11% 6% 39% 6% 22% 14% 100%Bighorn 9% 8% 15% 32% 8% 11% 17% 100%Bitteroot 10% 2% 5% 63% 9% 8% 3% 100%Black Hills 0% 5% 11% 65% 6% 0% 13% 100%Boise 7% 1% 1% 64% 13% 13% 1% 100%Bridger-Teton 9% 6% 16% 52% 3% 7% 7% 100%Caribbean 5% 0% 44% 2% 0% 20% 29% 100%Caribou-Targhee 0% 4% 11% 57% 12% 7% 9% 100%Carson 6% 9% 51% 22% 3% 1% 8% 100%Chattahoochee-Oconee 10% 9% 14% 50% 14% 1% 2% 100%Chequamegon-Nicolet 17% 5% 35% 34% 2% 3% 4% 100%Cherokee 11% 3% 3% 56% 16% 3% 8% 100%Chippewa 5% 16% 17% 53% 3% 5% 1% 100%Chugach 12% 0% 4% 47% 5% 1% 31% 100%Cibola 5% 0% 18% 60% 2% 7% 8% 100%Clearwater 12% 21% 3% 22% 20% 9% 13% 100%Cleveland 0% 1% 7% 79% 6% 3% 4% 100%Coconino 16% 7% 24% 31% 2% 4% 16% 100%Columbia Gorge NSR 5% 1% 6% 72% 1% 2% 13% 100%Colville 11% 15% 7% 51% 9% 0% 7% 100%Coronado 7% 5% 9% 62% 4% 7% 6% 100%Custer 31% 11% 17% 31% 2% 0% 8% 100%Dakota Prairie 4% 6% 14% 49% 1% 18% 8% 100%Daniel Boone 8% 9% 7% 65% 8% 3% 0% 100%Deschutes 5% 11% 19% 43% 4% 8% 10% 100%Dixie 1% 9% 26% 35% 4% 9% 16% 100%Eldorado 21% 13% 12% 40% 6% 1% 7% 100%Fishlake 10% 19% 16% 31% 5% 12% 7% 100%Flathead 0% 2% 15% 55% 3% 20% 5% 100%Francis Marion and Sumter 7% 4% 5% 70% 4% 8% 2% 100%Fremont 17% 14% 20% 30% 12% 6% 1% 100%Gallatin 2% 4% 18% 59% 7% 2% 8% 100%Gifford-Pinchot 13% 7% 17% 40% 6% 7% 10% 100%Gila 1% 11% 22% 24% 5% 16% 21% 100%Grand Mesa, Uncompahgre and Gunnison 5% 10% 13% 56% 6% 6% 4% 100%Green Mountain 16% 4% 19% 49% 3% 6% 3% 100%George Washington & Jefferson 2% 5% 6% 70% 4% 6% 7% 100%Helena 14% 4% 4% 66% 5% 2% 5% 100%Hiawatha 1% 4% 31% 35% 2% 6% 21% 100%Hoosier 13% 12% 2% 60% 9% 1% 3% 100%Humboldt-Toiyabe 1% 4% 29% 52% 5% 2% 7% 100%Huron-Manistee 19% 5% 44% 24% 2% 5% 1% 100%Idaho Panhandle 5% 4% 3% 65% 11% 8% 4% 100%
NVUM Four Year Report
27
Table A-2 (Continued). Full Information Segment Shares by Forest
Non-Local Segments Local Segments
Forest DayOVN-
NF OVN DayOVN-
NF OVN Non-
Primary TotalInyo 2% 10% 62% 16% 0% 1% 9% 100%Kaibab 7% 12% 23% 33% 1% 2% 22% 100%Kisatchie 2% 1% 0% 97% 0% 0% 0% 100%Klamath 2% 9% 13% 55% 4% 7% 10% 100%Kootenai 10% 4% 8% 49% 3% 17% 9% 100%Lake Tahoe Mgmt. Unit 9% 2% 48% 27% 1% 2% 11% 100%Land Between the Lakes 10% 12% 13% 51% 10% 2% 2% 100%Lassen 3% 15% 26% 38% 4% 7% 7% 100%Lewis and Clark 11% 7% 20% 38% 11% 8% 5% 100%Lincoln 14% 12% 27% 36% 3% 4% 4% 100%Lolo 4% 3% 10% 70% 5% 5% 3% 100%Los Padres 12% 3% 5% 71% 5% 2% 2% 100%Malheur 1% 23% 24% 40% 2% 1% 9% 100%Manti-La Sal 2% 6% 3% 41% 4% 8% 36% 100%Mark Twain 6% 5% 1% 77% 7% 1% 3% 100%Medicine Bow 10% 14% 13% 40% 9% 7% 7% 100%Mendocino 27% 16% 5% 48% 3% 1% 0% 100%Midewin Tallgrass Prairie 21% 0% 0% 78% 0% 0% 1% 100%Modoc 4% 5% 8% 50% 5% 19% 9% 100%Monongahela 11% 11% 33% 25% 4% 4% 12% 100%Mt. Hood 13% 11% 12% 41% 10% 3% 10% 100%Mt. Baker-Snoqualmie 7% 5% 11% 43% 4% 22% 8% 100%Nebraska 2% 15% 18% 41% 3% 2% 19% 100%Nez Perce 7% 18% 36% 28% 0% 2% 9% 100%NFS of Alabama 4% 5% 3% 70% 8% 9% 1% 100%NFS of Florida 5% 9% 5% 67% 0% 8% 6% 100%NFS of Mississippi 1% 2% 3% 65% 6% 20% 3% 100%NFS of North Carolina 9% 4% 24% 38% 5% 13% 7% 100%NFS of Texas 3% 4% 20% 62% 10% 1% 0% 100%Ochoco 0% 17% 10% 30% 18% 24% 1% 100%Okanogan 2% 8% 50% 28% 5% 1% 6% 100%Olymipic 1% 2% 12% 52% 6% 9% 18% 100%Ottawa 4% 5% 24% 18% 1% 9% 39% 100%Ouachita 2% 6% 9% 67% 7% 3% 6% 100%Ozark-St. Francis 9% 2% 24% 33% 2% 26% 4% 100%Payette 26% 14% 23% 30% 2% 1% 4% 100%Pike San Isabel 6% 2% 12% 50% 3% 17% 10% 100%Plumas 11% 9% 11% 49% 8% 6% 6% 100%Prescott 17% 7% 9% 58% 3% 4% 2% 100%Rio Grande 3% 4% 8% 37% 1% 19% 28% 100%Rogue River 2% 3% 9% 35% 5% 23% 23% 100%Routt 3% 9% 41% 34% 1% 4% 8% 100%Salmon-Challis 16% 31% 26% 14% 5% 4% 4% 100%San Bernardino 27% 7% 6% 45% 7% 0% 8% 100%San Juan 4% 8% 22% 38% 5% 11% 12% 100%Santa Fe 16% 7% 11% 54% 4% 0% 8% 100%Sawtooth 10% 8% 18% 41% 9% 10% 4% 100%Sequoia 5% 17% 18% 38% 8% 2% 12% 100%Shasta-Trinity 4% 13% 15% 38% 8% 14% 8% 100%

NVUM Four Year Report
28
Table A-2 (Continued). Full Information Segment Shares by Forest Non-Local Segments Local Segments
Forest DayOVN-
NF OVN DayOVN-
NF OVN Non-
Primary TotalShawnee 12% 5% 15% 46% 4% 12% 6% 100%Shoshone 3% 11% 13% 35% 12% 4% 22% 100%Sierra 8% 18% 14% 31% 9% 18% 2% 100%Siskiyou 1% 3% 14% 48% 10% 10% 14% 100%Siuslaw 11% 19% 14% 39% 3% 1% 13% 100%Six Rivers 3% 9% 15% 35% 10% 11% 17% 100%Stanislaus 21% 26% 18% 24% 4% 0% 7% 100%Superior 2% 13% 24% 49% 5% 3% 4% 100%Tahoe 9% 4% 28% 43% 3% 5% 8% 100%Tongass (All Years) 1% 1% 24% 62% 2% 6% 6% 100%Tonto 9% 4% 1% 60% 22% 3% 1% 100%Uinta 9% 2% 2% 67% 10% 5% 5% 100%Umatilla 13% 11% 17% 40% 11% 5% 3% 100%Umpqua 2% 13% 8% 37% 13% 11% 16% 100%Wallowa-Whitman 18% 13% 10% 43% 6% 2% 8% 100%Wasatch-Cache 2% 2% 7% 76% 9% 1% 3% 100%Wayne 17% 8% 7% 57% 2% 7% 2% 100%Wenatchee 17% 5% 21% 27% 3% 25% 2% 100%White Mountain 10% 15% 48% 20% 1% 3% 3% 100%White River 13% 2% 57% 20% 1% 4% 3% 100%Willamette 15% 9% 9% 46% 7% 6% 8% 100%Winema 4% 5% 24% 44% 11% 11% 1% 100%NOTE: The full information segment shares are computed using NVUM case weights and some information from the general portion of the NVUM survey. Questions for distinguishing day and overnight trips and to identify non-primary purpose trips were only asked on the economics portion of the survey.

NVUM Four Year Report
29
Table A-3. People per Vehicle by Segment by Foresta Non-Local Segments Local Segments
Forest Day OVN-
NF OVN DayOVN-NF OVN
Non- Primary Total
Allegheny 2.3 2.5 1.8 2.1Angeles 2.9 2.4 2.5Apache-Sitgreaves 2.9 2.8 2.2 2.7Arapaho-Roosevelt 2.5 4.4 1.9 2.4 2.9 2.6 2.3Ashley 2.8 2.9 2.2 2.0 2.3 2.5Beaverhead-Deerlodge 2.9 2.3 3.2 2.8Bighorn 1.8 2.5 2.4 2.5 2.4Bitteroot 3.8 2.0 2.2 2.2Black Hills 3.2 2.1 1.9 2.2Boise 2.1 2.4 2.5Bridger-Teton 1.9 2.6 2.3 2.3 2.4 2.9 2.4Caribbean 2.4 2.6Caribou-Targhee 2.1 2.0 2.3 2.6 2.9 2.1Carson 2.8 2.8 1.8 2.4Chattahoochee-Oconee 1.6 1.8 2.8 2.1Chequamegon-Nicolet 1.7 2.6 2.6 2.0 2.5 2.3Cherokee 1.9 2.1 2.3 2.2Chippewa 2.1 2.7 1.9 2.1Chugach 2.5 3.5 2.7Cibola 3.2 2.3 3.6 2.6Clearwater 3.0 2.6 2.5Cleveland 2.3 2.5 2.1Coconino 2.5 2.7 2.6 1.4 2.2 2.1Columbia Gorge NSR 2.5 2.6 2.4 2.5 2.4Colville 2.6 1.8 2.0Coronado 2.2 2.5 2.0 2.4 2.1Custer 2.7 3.0 2.7Dakota Prairie 2.5Daniel Boone 2.7 2.4 1.7 2.4 2.0Deschutes 2.2 2.6 1.9 2.9 2.2Dixie 2.8 2.5 2.7 2.6 2.6Eldorado 3.0 2.2 2.9 2.1 1.9 2.6 2.4Fishlake 2.9 2.5 2.0 2.3Flathead 1.9 2.3Francis Marion and Sumter 2.5 1.9 2.0Fremont 2.1 2.3Gallatin 2.7 1.9 1.9 2.5 2.1Gifford-Pinchot 2.4 2.9 2.6 2.1 2.8 2.5Gila 2.4 2.1Grand Mesa, Uncompahgre and Gunnison 1.6 2.1 2.2 2.2 2.0 2.1 2.2Green Mountain 2.2 2.3 2.1George Washington & Jefferson 1.5 1.6 2.9 1.8Helena 2.4 2.7Hiawatha 2.3 1.5 2.4 2.2Hoosier 2.9 2.4 1.7 2.4Humboldt-Toiyabe 2.3 2.6

NVUM Four Year Report
30
Table A-3 (Continued). People per Vehicle by Segment by Foresta Non-Local Segments Local Segments
Forest Day OVN-
NF OVN DayOVN-NF OVN
Non- Primary Total
Huron-Manistee 2.4 1.8 2.1 2.2Idaho Panhandle 1.6 2.3 2.1 3.1 2.1 2.6 2.3Inyo 2.3 2.5 1.2 2.3 2.3Kaibab 3.5 2.3 2.8 2.8Kisatchie 2.4 2.4Klamath 1.6 1.7Kootenai 2.3 4.0 2.3 1.8 2.6 2.5Lake Tahoe Mgmt. Unit 1.8 2.4 2.5 1.7 2.8 2.1Land Between the Lakes 2.3 2.3Lassen 2.7 2.5 2.6Lewis and Clark 2.2 2.5Lincoln 2.9 2.0 2.7 2.7 2.5Lolo 1.9 1.9Los Padres 2.2 1.7 1.8Malheur 2.0 2.9 2.8Manti-La Sal 2.2 2.6Mark Twain 2.2 2.2 2.3Medicine Bow 1.9 2.6 3.0 1.9 2.8 1.5 2.2Mendocino 1.8 2.6 2.7 1.9 2.0Midewin Tallgrass Prairie 1.6 1.5Modoc 2.7Monongahela 2.1 3.0 2.4 2.1 2.2 2.6 2.4Mt. Hood 2.5 2.4 2.5 2.5 2.2 2.5Mt. Baker-Snoqualmie 2.0 2.6 2.2 2.1 2.4 2.8Nebraska 2.4 2.3 2.7Nez Perce 2.4NFS of Alabama 1.7 3.0 1.8NFS of Florida 2.4 2.5NFS of Mississippi 2.0 1.6 3.2 1.9 1.7NFS of North Carolina 2.6 2.3 1.6 2.7 2.7 2.1NFS of Texas 2.3 2.3Ochoco 1.9Okanogan 2.6 2.4 2.2Olymipic 2.5 1.8 2.7 2.6 2.5 2.1Ottawa 1.6 2.4 2.2 2.1 2.2Ouachita 2.5 1.4 2.3 2.3Ozark-St. Francis 4.0 2.5 1.8 2.5Payette 2.1 2.0 3.6 2.4 2.4Pike San Isabel 3.1 1.6 2.6 2.0 2.0Plumas 2.5 2.2 2.2 2.4 2.2 2.3Prescott 2.1 2.9 2.3 1.7 2.0Rio Grande 2.5Rogue River 2.7 2.7Routt 1.7 2.2 3.1 2.6Salmon-Challis 2.8 3.0 1.6 2.2 2.7San Bernardino 2.8 2.8 3.8 2.8 4.1 2.5 2.9San Juan 3.0 2.5 1.9 2.7 2.2Santa Fe 2.9 3.1 2.7 2.0 3.3 2.3 2.4Sawtooth 3.1 2.3 1.8 2.9 2.4Sequoia 3.2 3.4 2.4 2.3 2.8 2.7

NVUM Four Year Report
31
Table A-3 (Continued). People per Vehicle by Segment by Foresta Non-Local Segments Local Segments
Forest Day OVN-
NF OVN DayOVN-NF OVN
Non- Primary Total
Shasta-Trinity 2.2 2.4 2.6 3.2 2.8 2.6Shawnee 2.8 3.1 2.8 2.4 3.1 2.6Shoshone 3.0 3.3 1.9 2.3 2.4Sierra 2.6 3.9 2.6 2.1 2.4 2.7Siskiyou 2.6 2.6Siuslaw 3.1 2.1 2.7 3.4 2.6Six Rivers 2.7 2.0 2.6 2.3Stanislaus 2.6 2.6 3.3 3.2 2.0 2.7Superior 2.9 2.1Tahoe 1.5 2.5 2.1 1.7 2.4 2.8 1.8 1.9Tongass (All Years) 2.2 1.9 2.0Tonto 2.3 2.1 3.0 2.3 3.1 3.2 2.4Uinta 2.7 2.4 3.7 2.4 2.5 2.6Umatilla 2.4 2.7 2.2 2.4Umpqua 2.8 2.3 2.5 2.2 2.4Wallowa-Whitman 2.5 3.0 1.8 2.4 2.1Wasatch-Cache 3.7 2.3 3.0 2.5Wayne 2.0 2.4 2.3 2.3Wenatchee 2.8 2.1 3.4 2.2 3.6 2.9White Mountain 2.0 3.3 2.3 2.6White River 2.2 1.9 2.7 1.7 2.0 2.1 2.3 2.2Willamette 2.5 2.4 2.5 2.3 2.4 2.4 2.4 2.4Winema 2.3 2.7National Average 2.3 2.5 2.7 2.1 2.5 2.5 2.6 2.3a If a forest has less than 15 cases in a segment the value is left blank. In these instances the national average at the bottom of the column may be used.

NVUM Four Year Report
32
Table A-4. Economic Sub-Sample Size by Forest and Segmenta Non-local Segments Local Segments
Forest DayOVN-
NF OVN DayOVN-
NF OVN Non- Primary Total
Allegheny 6 17 47 35 4 10 6 125Angeles 20 0 2 177 7 13 1 220Apache-Sitgreaves 8 96 61 15 5 9 5 199Arapaho-Roosevelt 15 7 16 135 18 38 32 261Ashley 27 37 36 18 7 13 20 158Beaverhead-Deerlodge 4 15 13 54 17 13 9 125Bighorn 13 36 24 37 8 11 39 168Bitteroot 21 9 8 114 29 11 12 204Black Hills 3 28 20 46 11 1 11 120Boise 3 4 3 31 25 12 1 79Bridger-Teton 25 41 43 137 12 20 51 329Caribbean 2 0 19 6 0 3 10 40Caribou-Targhee 4 6 33 50 24 41 23 181Carson 7 21 32 36 6 3 13 118Chattahoochee-Oconee 22 11 13 58 18 4 10 136Chequamegon-Nicolet 15 28 53 48 12 8 16 180Cherokee 14 15 9 66 53 3 7 167Chippewa 6 32 23 33 3 5 3 105Chugach 7 1 5 22 8 3 21 67Cibola 10 0 25 116 3 12 18 184Clearwater 14 16 13 21 8 12 9 93Cleveland 4 4 11 105 29 8 7 168Coconino 19 18 55 45 8 6 22 173Columbia Gorge NSR 22 13 28 141 6 9 43 262Colville 10 21 7 39 14 1 12 104Coronado 20 13 17 144 33 13 10 250Custer 21 22 9 12 4 0 9 77Dakota Prairie 2 2 4 11 4 4 2 29Daniel Boone 15 53 14 64 23 6 3 178Deschutes 6 29 32 54 7 5 17 150Dixie 3 25 29 37 10 5 23 132Eldorado 42 102 18 116 47 4 18 347Fishlake 7 22 15 19 8 8 6 85Flathead 1 5 12 42 8 11 14 93Francis Marion and Sumter 18 8 10 77 8 4 8 133Fremont 2 14 11 26 9 6 4 72Gallatin 11 14 46 173 16 12 31 303Gifford-Pinchot 20 6 29 42 15 11 20 143Gila 4 6 20 5 3 6 9 53Grand Mesa, Uncompahgre and Gunnison 15 32 41 129 23 9 26 275Green Mountain 10 8 27 53 3 9 6 116George Washington & Jefferson 4 11 15 87 13 23 5 158Helena 8 6 10 83 12 5 9 133Hiawatha 1 9 28 20 3 6 23 90Hoosier 12 21 7 58 15 1 10 124Humboldt-Toiyabe 1 2 12 31 8 5 6 65Huron-Manistee 10 12 46 15 8 15 3 109Idaho Panhandle 15 20 13 106 61 20 15 250

NVUM Four Year Report
33
Table A-4 (Continued). Economic Sub-Sample Size by Forest and Segmenta Non-local Segments Local Segments
Forest Day OVN-
NF OVN DayOVN-
NF OVNNon-
Primary TotalInyo 10 126 134 27 5 6 61 369Kaibab 8 7 24 19 2 4 37 101Kisatchie 2 2 1 18 3 2 1 29Klamath 1 8 10 35 7 7 6 74Kootenai 12 15 15 89 7 36 15 189Lake Tahoe Mgmt. Unit 28 22 121 73 6 13 38 301Land Between the Lakes 3 9 3 17 1 4 4 41Lassen 3 16 24 13 12 5 7 80Lewis and Clark 12 6 14 29 11 12 9 93Lincoln 17 26 26 44 5 3 7 128Lolo 8 7 5 86 5 6 5 122Los Padres 15 8 8 102 13 9 5 160Malheur 6 41 7 20 7 1 8 90Manti-La Sal 6 9 10 30 8 9 14 86Mark Twain 11 31 9 60 13 5 6 135Medicine Bow 17 43 30 53 21 14 16 194Mendocino 53 84 15 70 8 1 2 233Midewin Tallgrass Prairie 7 0 0 16 0 0 2 25Modoc 2 14 6 11 6 4 7 50Monongahela 23 69 76 51 17 7 38 281Mt. Hood 21 37 25 110 62 9 13 277Mt. Baker-Snoqualmie 17 4 12 106 20 33 19 211Nebraska 2 16 12 16 1 1 9 57Nez Perce 3 5 13 12 0 1 4 38NFS of Alabama 9 14 4 31 32 6 7 103NFS of Florida 8 1 10 40 0 10 4 73NFS of Mississippi 4 18 5 23 17 16 2 85NFS of North Carolina 12 15 41 39 12 24 19 162NFS of Texas 2 9 2 28 14 1 1 57Ochoco 0 6 7 6 3 8 2 32Okanogan 5 24 36 13 6 3 13 100Olymipic 4 11 23 59 22 31 43 193Ottawa 7 29 36 20 8 5 48 153Ouachita 14 39 23 66 11 4 5 162Ozark-St. Francis 6 6 31 47 5 15 6 116Payette 15 25 16 20 5 1 6 88Pike San Isabel 13 7 25 109 13 37 26 230Plumas 14 26 27 60 32 24 12 195Prescott 39 37 18 118 14 6 5 237Rio Grande 1 8 5 5 3 2 9 33Rogue River 3 4 1 9 5 5 18 45Routt 4 20 33 27 3 10 12 109Salmon-Challis 13 66 37 17 17 10 10 170San Bernardino 43 26 19 118 26 4 19 255San Juan 5 15 17 51 2 11 19 120Santa Fe 81 67 33 145 27 3 24 380Sawtooth 7 25 24 28 8 16 8 116Sequoia 11 102 46 52 19 6 31 267Shasta-Trinity 11 51 27 55 19 11 17 191Shawnee 17 17 30 47 6 17 5 139

NVUM Four Year Report
34
Table A-4 (Continued). Economic Sub-Sample Size by Forest and Segmenta Non-local Segments Local Segments
Forest Day OVN-
NF OVN DayOVN-
NF OVNNon-
Primary TotalShoshone 10 21 18 44 14 5 20 132Sierra 11 48 23 44 29 18 6 179Siskiyou 1 8 7 31 14 9 11 81Siuslaw 7 20 21 25 10 1 28 112Six Rivers 7 11 11 35 20 9 20 113Stanislaus 45 143 48 31 18 2 13 300Superior 2 14 22 13 4 3 5 63Tahoe 32 60 65 129 25 22 20 353Tongass (All Years) 8 3 44 182 8 11 13 269Tonto 36 34 18 300 104 25 11 528Uinta 31 8 9 227 48 21 20 364Umatilla 43 20 12 79 14 1 2 171Umpqua 2 27 8 29 20 7 17 110Wallowa-Whitman 7 34 32 53 10 8 26 170Wasatch-Cache 3 8 15 281 71 10 12 400Wayne 16 19 5 66 12 2 2 122Wenatchee 43 28 42 56 14 19 3 205White Mountain 9 40 39 18 1 6 8 121White River 53 34 121 141 21 18 24 412Willamette 48 71 34 110 49 17 36 365Winema 2 3 6 18 2 4 2 37Total 1,600 2,845 2,840 7,241 1,753 1,153 1,681 19,113a Excludes outliers and cases with missing Zip codes.

NVUM Four Year Report
35
Table A-5. Trip Segment Distribution by Primary Activitya Non-Local Segments Local Segments
Primary Activity Day OVN-
NF OVN DayOVN-
NF OVNNon-
Primary TotalNational Averageb 8% 7% 19% 46% 6% 7% 7% 100%Bikingc 5% 1% 22% 59% 3% 4% 6% 100%Boatingc 11% 11% 15% 43% 9% 7% 5% 100%Cross-country skiing 10% 3% 29% 53% 2% 3% 1% 100%Developed Camping 1% 32% 12% 2% 35% 12% 7% 100%Downhill skiing 15% 1% 31% 43% 1% 6% 2% 100%Driving 6% 1% 8% 71% 0% 3% 11% 100%Fishing 11% 12% 13% 50% 7% 5% 4% 100%General/Relaxing 8% 18% 12% 36% 14% 7% 5% 100%Hiking 8% 3% 12% 64% 2% 4% 6% 100%Hunting 5% 13% 7% 50% 10% 12% 3% 100%Multiple activities 11% 14% 11% 32% 7% 14% 11% 100%Nature-relatedc 10% 3% 22% 43% 2% 5% 16% 100%No primary activity 4% 18% 17% 44% 8% 5% 5% 100%OHV usec 11% 11% 11% 49% 8% 5% 5% 100%Otherc 8% 3% 7% 60% 6% 9% 7% 100%Other non-motorized 10% 3% 6% 74% 2% 2% 2% 100%Picnic 6% 2% 10% 60% 2% 5% 16% 100%Prim. camp/Backpacking 0% 33% 14% 4% 33% 13% 2% 100%Resort 3% 16% 12% 9% 26% 15% 19% 100%Snowmobile 7% 2% 11% 56% 6% 7% 10% 100%a Excludes cases with missing Zip codes, activity segment distributions are case weighted using the economic subsample. b National average segment shares are computed using case weights and information from both the economics and general sections of the survey. c “Nature-related” activities include viewing wildlife, viewing natural features, nature study, visiting a nature center, or viewing forest. “OHV use” also includes other motorized activity. “Boating” combines motorized and non-motorized boating. The “other” category includes gathering, visiting historic sites, and horseback riding

NVUM Four Year Report
36
Table A-6. Participation in Recreation Activities and Reported Primary Activity on the Trip
Recreation Activity Percent
Participatinga
Percent Primary Activitya
Numer of Cases (Full Sample)
Number of Cases (Economic Sample)
Biking 5% 3% 1,766 448Boatingb 6% 2% 2,014 579Cross-country skiing 4% 3% 1,651 425Developed Camping 11% 4% 5,409 1,583Downhill skiing 15% 14% 3,875 971Driving 23% 4% 2,688 703Fishing 15% 8% 7,011 1,843General/Relaxing 40% 7% 8,100 2,223Hiking 39% 14% 14,827 4,067Hunting 10% 8% 4,189 1,079Nature-relatedb 60% 10% 9,175 2,300OHV useb 7% 3% 2,119 599Other Activityb 13% 3% 2,358 646Other non-motorized 9% 3% 2,830 760Picnic 13% 2% 2,363 572Prim. camp/Backpacking 9% 2% 2,759 791Resort 4% 1% 689 168Snowmobile 3% 2% 1,702 434Multiple primary activities --- 4% 3,382 750No primary activity --- 3% 2,370 465Total --- 100% 81,277 21,406a Estimated using case weights on full sample. b “Nature-related” activities include viewing wildlife, viewing natural features, nature study, visiting a nature center, or viewing forest. “OHV use” also includes other motorized activity. “Boating” combines motorized and non-motorized boating. The “other” category includes gathering, visiting historic sites, and horseback riding.
NVUM Four Year Report
37
Appendix B.
Spending Profiles of Wildlife-Related National Forest Visitors
This Appendix presents two sets of spending profiles for national forest visitors. One set is for visitors whose primary activity on the forest was wildlife-related. The other set is for visitors whose primary activity was one of 23 other general recreation activities (non-wildlife-related). The wildlife-related activity spending profiles can be used to evaluate the economic contribution of wildlife-related recreation activity on National Forests. Estimates are based on the National Forest Visitor Use Monitoring Project (NVUM) data for the first four years of the NVUM cycle (calendar year 2000 through fiscal year 2003)21. Wildlife-related visitors were identified by their response to two questions on the NVUM Survey: “What activities have you participated in while on this visit?” and “Of these, which was your primary recreation activity?”. Respondents who selected viewing wildlife, hunting, or fishing were considered wildlife-related visitors. Forty-four percent of national forest visitors participated in a wildlife-related activity during their visit (Table B-1). Twenty-eight percent engaged in wildlife viewing, 15 percent fished, and 10 percent hunted. Nineteen percent of visitors stated that their primary activity during their visit was wildlife-related. Only one percent of visitors cited viewing wildlife as their primary activity, while eight percent cited fishing and nine percent stated hunting was their primary activity. Only respondents to the economic portion of the survey who stated that their primary recreation activity was wildlife-related are used in the subsequent analysis22. “Viewing wildlife” was not included in the list of activities in the first year of NVUM sampling so the four year sample underestimates the percentage of wildlife viewers. Based on the data from years 2001, 2002, and 2003, 20 percent of national forest visitors came primarily for a wildlife-related activity, two percent of these were wildlife viewing, nine percent were fishing and nine percent were hunting.
21 Wildlife viewing was not included in the activity list during the first year of the NVUM survey. The percentage of visitors engaged in wildlife-related activities (Table B-1) is therefore also estimated based on the last three years of data. Spending averages are based on data from all four years. 22 The patterns of wildlife-related recreation participation in the economic sub-sample are similar to that of the general sample.

NVUM Four Year Report
38
Table B-1. Participation in Wildlife-Related Recreation by NVUM Respondents All
RespondentsAny Wildlife-
RelatedViewing Wildlife Fishing Hunting
NVUM General Survey Participated, N 81,277 42,972 31,893 15,551 5,180 Raw Percent 100% 53% 39% 19% 6% Weighted a 44% 28% 15% 10% Last 3 years, weighted a,b 54% 40% 16% 10%
Primary Activity, Na,b 75,525 12,298 1098 7,011 4,189 Raw Percent 100% 16% 1% 9% 6% Weighted a 19% 1% 8% 9% Last 3 years, weighted a,b 20% 2% 9% 9%
Economic Subsample
Primary Activity, Na,b 20,191 3,225 303 1,843 1,079
Raw Percent 100% 16% 2% 9% 5% Weighted a 18% 1% 8% 9% Last 3 years, weighted a,b 19% 2% 8% 9%Note: Respondents identifying multiple primary activities or failing to provide a primary activity are excluded from primary activity figures. a Weighted figures adjust the sample for sampling exposure and disproportionate sampling across NVUM strata using NVUM case weights. b The four year data underestimates viewing wildlife as this activity was not included during the first year of NVUM sampling. We therefore recommend using estimates based on the last three years.
Spending Profiles by Trip Segments The average spending of wildlife-related visitors was not significantly different than non-wildlife related visitors, although there were significant differences within particular visitor segments (Table B-2). Wildlife-related visitors in the OVN-NF trip segments and the local day trip segment spent more per trip than non-wildlife visitors. Non-local visitors on day trips whose primary activity was wildlife-related spent less than their non-wildlife-related counterparts The higher spending for the OVN-NF segments is mostly explained by longer stays of wildlife-related visitors. On a per night basis wildlife-related visitors in both OVN-NF segments spent less than non-wildlife related visitors. Local visitors on day trips spent significantly more if their primary activity was wildlife-related, while non-local visitors on day trips spend less than average if their primary activity was wildlife-related. The difference in the day trip segments stems largely from a higher percentage of visitors “viewing wildlife” in the non-local day trip segment compared to the local day trip segment. Visitors on day trips whose primary activity was “viewing wildlife” spent between $10 and $25 less than day trip visitors whose primary activity was “hunting” or “fishing”.

NVUM Four Year Report
39
Table B-2. Comparison of Wildlife-Related and Not Wildlife-Related Visitor
Spendinga
Non-Local Segments Local Segments
Spending category Day OVN-NF OVN DayOVN-
NF OVNNon-
Primary Totalb
Spending per party per trip
Wildlife-related $41* $204* 250 $44* $152* $116 $195 $104 Non-wildlife-related $54* $151* 244 $31* $120* $116 $182 $105 Full Information Segment Sharesc Wildlife-related 6.9% 10.7% 10.4% 50.5% 8.9% 8.8% 3.9% 100% Non-wildlife-related 8.4% 6.5% 20.4% 45.9% 5.1% 6.4% 7.4% 100%
Spending per night on the NF Wildlife-related $57 $46 Non-wildlife-related $63 $57 a All dollar figures expressed in 2003 dollars. * Averages that are statistically different (95% confidence level) are designated by an asterisk b Spending averages are computed as a weighted average of the columns using the full information segment shares. c The full information segment shares are computed using NVUM case weights and some information from cases that did not complete the economics portion of the survey. Tables B-3 and B-4 provide the detailed spending patterns for wildlife-related and non-wildlife-related visitors, respectively. The spending profiles for non-wildlife-related visitors are similar to the overall national averages, since the majority of visitors fall into this group. The higher spending by wildlife-related visitors in some trip segments is due primarily to higher spending on gas and oil, and groceries.

NVUM Four Year Report
40
Table B-3. Wildlife-related Visitor Spending by Trip Type Segment and Spending Category, $ per party per tripa Non-Local Segments Local Segments
Spending category Day OVN-NF OVN Day OVN-NF OVNNon-
Primary All Visitsb
Lodging 0.00 31.62 63.70 0.00 15.02 14.87 47.56 14.50Restaurant 8.39 28.44 57.76 6.19 15.15 18.44 37.70 17.18Groceries 7.00 48.53 33.62 8.11 49.42 24.67 25.08 20.80Gas & oil 16.00 54.31 47.04 15.51 38.40 34.89 34.17 27.44Other transp. 0.00 2.10 1.74 0.02 0.52 0.16 1.62 0.54Activities 2.97 8.47 18.81 1.81 3.28 4.58 20.06 5.46Admissions/fees 2.44 8.03 6.50 2.81 6.47 3.46 5.36 4.21Souvenirs/other 3.91 22.28 20.78 9.58 23.66 15.42 23.40 14.02Total 40.71 203.78 249.95 44.03 151.92 116.49 194.95 104.15N(unwtd) 262 501 406 1117 270 206 134 2,896Std. Dev. of Total 65 220 231 82 165 184 239 183SE Mean of Total 4.0 9.9 11.8 2.5 10.1 12.9 17.6 3.4Pct Error (95% level) 20% 10% 9% 11% 13% 22% 18% 7%a Outliers are excluded and exposure weights are applied in estimating spending averages. All figures expressed in 2003 dollars. b All visits averages are computed as a weighted average across columns using full information segment shares for wildlife related visitors (Table B-2). The inclusion of cases without spending data in estimating segment shares explains why both the wildlife and nonwildlife “all visits” averages are less than the overall average of 105.57 in Table 2.
Table B-4. Not Wildlife Related Visitor Spending by Trip Type Segment and Spending Category, $ per party per tripa Non-Local Segments Local Segments
Spending category Day OVN-NF OVN Day OVN-NF OVNNon-
Primary All Visitsb
Lodging 0.00 23.82 65.05 0.00 16.44 18.24 48.90 20.42Restaurant 14.64 24.52 59.11 6.11 13.33 22.19 45.48 23.12Groceries 7.73 33.76 30.88 4.92 39.65 23.18 20.66 16.41Gas & oil 15.99 33.31 33.84 10.96 25.76 23.85 27.99 20.33Other transp. 1.17 3.21 8.55 0.24 0.15 1.30 5.43 2.65Activities 4.05 7.94 14.91 1.82 3.89 7.27 8.69 6.03Admissions/fees 5.79 10.74 9.46 3.53 11.28 9.51 7.12 6.44Souvenirs/others 4.39 14.03 22.66 3.21 8.99 10.49 18.19 9.84Total 53.76 151.33 244.46 30.79 119.49 116.03 182.46 105.24N(unwtd) 1,338 2,344 2,434 6,124 1,483 947 1,547 16,217Std. Dev. of Total 88 196 252 61 143 157 228 180SE Mean of Total 2.4 4.0 5.1 0.8 3.7 5.1 5.8 1.4Pct Error (95% level) 9% 5% 4% 5% 6% 9% 6% 3%a Outliers are excluded and exposure weights are applied in estimating spending averages. All figures expressed in 2003 dollars. b All visits averages are computed as a weighted average across columns using full information segment shares for non-wildlife related visitors only (Table B-2).

NVUM Four Year Report
41
Wildlife-related Visitor Trip and Party Characteristics Visitors whose primary activity was wildlife-related had smaller party sizes and were less likely to include children in the party than visitors whose primary activity was not wildlife-related (Table B-5). Wildlife-related visitors staying overnight on the national forest had longer stays, averaging at least an extra night compared to OVN-NF visitors in general. The percentage of visitor parties whose primary activity was wildlife-related varies across forests (Table B-6). For some forests, the percentages are sensitive to the choice of weights. For example, for Land Between the Lakes the raw percentage of wildlife-related visitor parties in the NVUM sample is 59%, but drops to 44% when case weights are applied. Conversely, 13% of the NVUM sample on the Cherokee National Forest were wildlife-related visitors, but after case weighting, the share of wildlife-related visitors increases to 30%. Figures in Table B-6 should be used cautiously if the weighted and unweighted estimates are very different. The percentage of the NVUM sample classified as wildlife-related on each forest depends somewhat on the relative proportion of site days assigned to distinct locations and seasons, as these may differentially attract wildlife-related visitors. The percentage of visitors identified as wildlife-related depends on the proportion of wildlife viewers, hunters and anglers on each forest who identified the activity as their primary activity. While most trips involving hunting identified hunting as the primary activity, only about half of the trips in which someone in the party fished identified angling as the primary activity, and less than 5% of trips involving wildlife viewing identified it as the primary activity (Table B-1). The percentage of visitors identified as wildlife-related is therefore sensitive to the proportions of wildlife viewers and anglers on each forest who identify the activity as their primary one. Table B-5. Wildlife-Related and Not Wildlife-Related Visitor Characteristics Non-Local Segments Local Segments
Characteristic Wildlife-related Day
OVN-NF OVN DAY
OVN-NF OVN
Non- Primary Total
Segment Sharea Yes 6.9% 10.7% 10.4% 50.5% 8.9% 8.8% 3.9% 100% No 8.4% 6.5% 20.4% 45.9% 5.1% 6.4% 7.4% 100%People per Vehicleb Yes 2.0 2.1 2.2 1.9 2.0 2.2 2.1 2.0 No 2.4 2.6 2.7 2.1 2.6 2.5 2.7 2.4Children Under 16b Yes 0.3 0.2 0.4 0.3 0.3 0.4 0.4 0.3 No 0.3 0.6 0.5 0.4 0.7 0.6 0.5 0.5Nights on the National Forestb Yes 0.0 3.6 0.5 0.0 3.3 0.1 2.6 2.5 No 0.0 2.4 0.2 0.0 2.1 0.1 1.0 1.6a Based on full-information segment shares computed using NVUM case weights and some information from cases that did not complete the economics portion of the survey. b Outliers and cases with missing Zip codes excluded, case weighted

NVUM Four Year Report
42
Table B-6. Percentage of Wildlife-Related Visits by Forest Forest Un-weighted Exposure Weights Case WeightsNational Average 16% 17% 19%Allegheny 24% 27% 44%Angeles 8% 8% 9%Apache-Sitgreaves 18% 19% 21%Arapaho-Roosevelt 11% 12% 9%Ashley 33% 33% 41%Beaverhead-Deerlodge 42% 42% 39%Bighorn 18% 17% 28%Bitteroot 10% 10% 19%Black Hills 16% 19% 31%Boise 15% 17% 18%Bridger-Teton 13% 12% 13%Caribbean 0% 0% 0%Caribou-Targhee 8% 7% 29%Carson 9% 10% 9%Chattahoochee-Oconee 30% 29% 21%Chequamegon-Nicolet 32% 33% 39%Cherokee 13% 14% 30%Chippewa 54% 53% 58%Chugach 39% 36% 32%Cibola 7% 6% 8%Clearwater 18% 19% 20%Cleveland 8% 8% 12%Coconino 7% 7% 9%Columbia Gorge NSR 2% 2% 2%Colville 20% 21% 22%Coronado 9% 7% 10%Custer 21% 19% 33%Dakota Prairie 41% 44% 42%Daniel Boone 18% 20% 33%Deschutes 28% 28% 21%Dixie 23% 24% 21%Eldorado 16% 18% 13%Fishlake 51% 51% 57%Flathead 20% 21% 19%Francis Marion and Sumter 35% 36% 41%Fremont 44% 45% 50%Gallatin 11% 10% 19%Gifford-Pinchot 11% 13% 17%Gila 18% 21% 33%Grand Mesa, Uncompahgre and Gunnison 12% 11% 18%Green Mountain 12% 12% 9%George Washington & Jefferson 23% 23% 37%Helena 39% 40% 49%Hiawatha 9% 9% 23%Hoosier 20% 21% 39%Humboldt-Toiyabe 10% 7% 15%Huron-Manistee 29% 31% 30%Idaho Panhandle 21% 22% 28%Inyo 23% 22% 13%Kaibab 11% 10% 18%Kisatchie 14% 18% 20%

NVUM Four Year Report
43
Table B-6 (Continued). Percentage of Wildlife-Related Visits by Forest Forest Un-weighted Exposure Weights Case WeightsKlamath 21% 19% 12%Kootenai 22% 22% 39%Lake Tahoe Mgmt. Unit 2% 2% 4%Land Between the Lakes 59% 61% 44%Lassen 31% 28% 25%Lewis and Clark 25% 25% 31%Lincoln 4% 3% 2%Lolo 13% 12% 21%Los Padres 7% 6% 13%Malheur 35% 34% 32%Manti-La Sal 21% 23% 17%Mark Twain 11% 11% 21%Medicine Bow 21% 23% 24%Mendocino 13% 13% 18%Midewin Tallgrass Prairie 47% 47% 85%Modoc 36% 34% 25%Monongahela 23% 25% 29%Mt. Hood 7% 7% 3%Mt. Baker-Snoqualmie 5% 6% 3%Nebraska 31% 35% 29%Nez Perce 20% 21% 29%NFS of Alabama 14% 14% 36%NFS of Florida 7% 6% 35%NFS of Mississippi 34% 34% 74%NFS of North Carolina 11% 13% 15%NFS of Texas 29% 32% 55%Ochoco 18% 18% 24%Okanogan 5% 5% 7%Olymipic 9% 10% 15%Ottawa 20% 21% 27%Ouachita 19% 23% 52%Ozark-St. Francis 21% 22% 32%Payette 28% 29% 27%Pike San Isabel 10% 11% 15%Plumas 25% 25% 21%Prescott 13% 14% 15%Rio Grande 20% 18% 20%Rogue River 16% 16% 19%Routt 16% 17% 11%Salmon-Challis 37% 41% 41%San Bernardino 6% 5% 2%San Juan 14% 15% 16%Santa Fe 12% 11% 8%Sawtooth 5% 5% 6%Sequoia 14% 17% 25%Shasta-Trinity 18% 19% 34%Shawnee 11% 14% 17%Shoshone 21% 21% 24%Sierra 12% 11% 10%Siskiyou 8% 9% 8%Siuslaw 16% 19% 11%Six Rivers 23% 24% 31%Stanislaus 15% 15% 16%

NVUM Four Year Report
44
Table B-6 (Continued). Percentage of Wildlife-Related Visits by Forest Forest Un-weighted Exposure Weights Case WeightsSuperior 35% 37% 27%Tahoe 13% 13% 8%Tongass (All Years) 9% 9% 7%Tonto 17% 17% 23%Uinta 21% 19% 21%Umatilla 21% 19% 36%Umpqua 21% 23% 26%Wallowa-Whitman 13% 15% 37%Wasatch-Cache 9% 8% 9%Wayne 16% 16% 23%Wenatchee 9% 9% 12%White Mountain 2% 2% 1%White River 9% 9% 2%Willamette 17% 18% 19%Winema 18% 19% 38%Note: WR percentages are estimated using the full sample. Respondents reporting multiple primary activities or failing to provide a primary activity are excluded.