Embed Size (px)
Citation preview

SPICe Briefing
Class Sizes 31 January 2011
11/09
Camilla Kidner
This briefing sets out developments in policy and regulations on class sizes and summarises progress towards the policy of reducing class size in lower primary. It also gives a brief overview of the research evidence on the effect of class size reductions on pupil attainment. This briefing updates Berry, K. SB 08/18.

2
CONTENTS
EXECUTIVE SUMMARY .............................................................................................................................................. 3
SETTING CLASS SIZE MAXIMA ................................................................................................................................ 4
GOVERNMENT POLICY .............................................................................................................................................. 5
SCOTTISH EXECUTIVE POLICY ............................................................................................................................ 5 SCOTTISH GOVERNMENT POLICY FROM 2007 ................................................................................................. 5
2007 Concordat .................................................................................................................................................... 5 Revised Education Framework 2009/10 .............................................................................................................. 7 Changes from Autumn 2010 ................................................................................................................................ 7 Class sizes in S1 and S2 ..................................................................................................................................... 8
PROGRESS TOWARDS SMALLER PRIMARY CLASS SIZES ................................................................................. 9
Comparing upper and lower primary class sizes ................................................................................................. 9 Lower Primary .................................................................................................................................................... 11 Pupil teacher ratio .............................................................................................................................................. 11
LOCAL AUTHORITY POLICY AND PROGRESS ON CLASS SIZE ........................................................................ 12
EFFECT OF CLASS SIZE ON EDUCATIONAL ATTAINMENT ............................................................................... 13
STAR Project - USA ........................................................................................................................................... 14 CSPAR in England ............................................................................................................................................. 14 Processes involved ............................................................................................................................................ 14 No ‘optimal’ size ................................................................................................................................................. 14 Pupil Teacher Ratio and class size .................................................................................................................... 15 Value for money and alternative strategies ....................................................................................................... 15
SOURCES .................................................................................................................................................................. 16
RELATED BRIEFINGS .............................................................................................................................................. 20

3
EXECUTIVE SUMMARY
Primary school classes have been getting steadily smaller from an average of 25 pupils in 1997 to 23 pupils in 2010. The proportion of pupils composite1 classes has increased from 22% to 27% over the same period (Scottish Government, online).
The largest reductions have been in lower primary. In 1997, 7% of P1-3 pupils were in classes of 18 or less. By 2010 this had increased to 18% (Scottish Government, online). (21.7% of pupils if classes of up to 36 taught by two teachers are included). (Scottish Government 2010a).
In 2007, the Concordat between the Scottish Government and COSLA included an agreement to work towards class sizes of 18 or less in P1-3. As it became evident that class sizes were not falling as fast as had been hoped, the Government and COSLA drew up a Framework Agreement in late 2009 which included a target to achieving the policy for 20% of pupils by August 2010. This was accompanied by flexibility on how the expansion of pre-school hours and free school meals is achieved. (Scottish Government, online).
In 2009, eight councils had met this target. In 2010, this increased to 20 councils. When team teaching is included (i.e classes taught by more than one teacher), the figures are 13 councils in 2009 compared with 24 councils in 2010 (Scottish Government, 2010b table 6.8)
In November 2010, the Scottish Government and COSLA agreed to maintaining the pupil teacher ratio for P1 to P3 (Swinney, 2010). The exact figure to be used is currently under discussion (Scottish Government, personal communication January 2011). The pupil:teacher ratio for primary as a whole was 15.8 in both 2009 and 2010.
The legislative maximum class size for P1 has recently been reduced from 30 to 25 pupils. In 2007, 96% of P1 pupils were in classes under 25, taught by a single teacher. This declined slightly to 91% in 2009 (Scottish Government, 2009a) but increased in 2010 to 94% (Scottish Government, 2010b table 2.12).
The evidence on class size reductions is contentious, but there is a consensus that it has an effect on pupil learning, particularly in early primary and particularly for disadvantaged pupils. There is less agreement on the magnitude of the effect, the exact ways in which it works and whether investing in smaller class sizes is value for money.
1 Class made up of more than one year group. Eg P1 and P2 in one class.

4
SETTING CLASS SIZE MAXIMA
The current framework for setting class size maxima is a mix of legislation, teachers‘ conditions, Government guidance and policy and is set out in the table below:
Table 1: Framework for setting class sizes
Regulation SNCT2 November 2010 agreement
Framework Agreement, 2009
Circular 1/2007
P1 25 25 Maintain pupil teacher ratio
20% of pupils in classes of 18 by August 2010
25
P2 - 3 30 30 n/a
P4-7 n/a
33 n/a
n/a
S1-2 33 20 in English and Maths
S3 30 n/a
S4-6
Practical classes
20
Composite classes
25
Sources: Education (Lower Primary Class Sizes) (Scotland) Regulations 1999 as amended, SNCT, online.
Swinney, J. 2010. Scottish Government and COSLA, 2007. Scottish Government, 2007a.
The Education (Lower Primary Class Sizes (Scotland) regulations 1999 (as amended in November 2010) provide for a maximum of 25 pupils in P1 (from August 2011) and 30 in P2 and 3. If a parent makes a successful placing request appeal, their child will not be counted towards the class size maximum for the first year. There is also provision not to count pupils with ASN who are only taught part of the time in a class. This means that in some circumstances, P1 classes can be larger than 25. The regulations also allow classes that are larger than the statutory maximum if there is more than one teacher in the class.
In late 2009, a working group was established to consider the variety of class size control mechanisms. Their report, published in August 2010, emphasised that class size is only one amongst many mechanisms for improving learning and that: ―it is difficult to make a strong case for there being a specific class size on the basis of educational research‖ (Cameron, D, 2010). The report also argued for consistency: ―if there are benefits from reduced class size limits, children should benefit from these regardless of where they are educated.‖ The group also commented that the idea of a ‗class‘ is more complicated than it appears. It has become far more common for children to be placed in groupings of different sizes for different activities. However, the working group considered that there is still a need to prescribe upper limits on class sizes. The recommendations were:
1. Legislation should be used to set an upper limit for class sizes.
2. This should be supported by clear references to teacher/pupil ratios that enable schools and local authorities to establish classes smaller than the maximum limit.
3. The legislation should recognise the range of learning activities in which pupils are likely to engage and set an upper limit for practical activities.
4. It should also make clear that pupils could be engaged in larger groupings for appropriate activities – assemblies, lectures etc.
2 Scottish Negotiating Committee for Teachers.

5
5. There should be a commitment to the ongoing review of the organisation of learning as the nature of learning develops.
GOVERNMENT POLICY
SCOTTISH EXECUTIVE POLICY
The previous Scottish Executive set a target of maximum class sizes of 25 in P1 and 20 in S1 English and Mathematics classes, to be reached by 2007. Guidance was provided to local authorities as Circular 1/2007 (Scottish Government, 2007a). The Partnership Agreement had also committed to increase teacher numbers to 53,000 by 2007 and to increase support staff, mainly in secondary schools (Scottish Labour Party and Scottish Liberal Democrats, 2003). Between 2006 and 2007 the proportion of P1 pupils in classes of 25 or less increased from 66% to 95% (Scottish Government 2008a, table 2.14).
In early 2007, the Executive indicated that class sizes of up to 29 in S1 and S2 would be allowed if, in each school, S1 Maths, S2 Maths, S1 English and S2 English each average no more than 20 pupils. This change followed representations from local authorities seeking greater flexibility in organising classes.
Secondary school class size data is not routinely collected by the government. A special collection of S1 to S2 Maths and English class size data was made as part of the 2007 School Census. The overall target was met in 85% of secondary schools. The average Maths class was 18.5 pupils in S1 and 18.7 pupils in S2. The average English class size was 18.4 in S1 and 18.6 in S2 (Scottish Government 2007b).
A Class Sizes, Staffing and Resources Working Group was established by the previous Scottish Executive in 2005. The interim and final reports included estimates of the training and salary costs for a number of scenarios including, reducing P1-3 to 25, reducing P1-7 to 20, providing additional CPD and employing more classroom assistants (Scottish Government, 2006, 2007b). Their final report, published after the 2007 election recommended a longitudinal study into the impact of class sizes should be commissioned and that the effects of the reduction in P1-P3 classes to a maximum of 18 should be evaluated as the reductions are rolled out. These recommendations have not been implemented.
SCOTTISH GOVERNMENT POLICY FROM 2007
The Scottish Government has consistently argued for smaller class sizes in P1-3, although the detail of the policy was revised in late 2009 and again in late 2010.
2007 Concordat
In relation to class sizes the Concordat3 stated in 2007 that local government and the Scottish Government will move towards:
― as quickly as is possible, reducing class sizes in P1 to P3 to a maximum of 18… The provision of additional capital allocation and specific arrangements for local authorities to
3 The Concordat was agreed between the Scottish Government and COSLA in November 2007 and included a
number of policy commitments which would be delivered by local government, supported by the local government
funding settlement.
6
maintain teacher numbers in the face of falling school rolls will allow significant progress on this policy over the Spending Review period. Taking into account retirals, the capacity of the universities to train new teachers, changing demographic trends, and the different circumstances across authorities including accommodation pressures, it is recognised that the pace of implementation of class size reduction will vary across authorities depending on local circumstances and needs. Local government will be expected to show year on year progress toward delivery of the class size reduction policy.‖ (Scottish Government 2007)
One of the key issues debated at the time was the cost of implementing the policy in full. As the then Cabinet Secretary confirmed during her Ministerial Statement in 2007:
―.. none of the specified manifesto commitments comes with an individual price tag precisely because the package as a whole is being presented to local government for agreement. That includes the reductions in ring fencing, the additional £1.3 billion over the spending period to help finance policies such as class size reductions, and the efficiency savings.‖ (Scottish Parliament 2007a)
She stated that there were sufficient resources in the local government settlement to maintain teacher numbers despite falling school rolls.
―Page 4 of the concordat identifies that there are sufficient resources in the local government settlement to maintain teacher numbers at 53,000.‖ (ELLC Committee, 2008, col 1807).
In addition, the Government provided an extra £9m to local government to fund 300 extra teachers. This was provided in 2007 and added to the local authority baseline funding for subsequent years:
―These extra teachers provide a kick start to delivering two important manifesto commitments - protecting the role of teachers in pre-school and cutting class sizes in primary. (Scottish Government, 2007c)
There were also funds provided for school buildings improvements, which the Government advised could be used towards the capital cost of creating smaller classes (Scottish Government, 2007d) and plans to increase the intake of student teachers. It was estimated in 2008 that achieving the class size policy would require an extra 3,300 teachers which it was considered would not be achieved within the lifetime of the parliament (Scottish Government, 2008b).
While there was no national estimate published on the cost of implementing the policy there were reports of individual councils‘ own estimates of the cost implications. For example, it was reported that Glasgow City Council would require 186 more classrooms and 397 more teachers at a cost of £57m (Scotland on Sunday 2007), that the cost for Glasgow and Edinburgh together would be nearly £90m (Herald 2007) that an additional £27m would be required for West Lothian (Scottish Parliament 2007b), and an additional £4m would be required in the Scottish Borders (BBC 2007).
From 2008 onwards, it became clear that, overall, local authorities were not recruiting teachers on the scale necessary to deliver the class size policy. Between 2007 and 2010, the number of teachers in Scottish schools fell from 52,446 to 49,923. (For more detail see Kidner, C. Teacher Numbers). In addition to this, as indications of the scale of future local authority budget cuts began to emerge, it became even less likely that resources would be found for extensive class size reductions.

7
Revised Education Framework 2009/10
In December 2009, following a change in Cabinet Secretary from Fiona Hyslop to Michael Russell, the Government proposed a Framework Agreement on class sizes, free school meals and pre-school nursery hours (Scottish Government online). While the long term aim of lower class sizes remained, this agreement set out a target for progress by August 2010. This was that 20% of pupils in P1-3 would be in classes of 18 by August 2010. In return, local authorities were given ‗flexibility‘ in relation to other Concordat commitments. The increase in pre-school hours from 475 to 570 a year would not be set in legislation, although councils were encouraged to work towards it. The original concordat commitment for free school meals for all P1-3 pupils by August 2010 was altered to a free school meal (either breakfast or lunch) in P1-3 in the 20% most deprived communities. However, the agreement re-iterated the long term aspiration:
―This agreement does not the dilute the aspirations set out in the Concordat and reflects a pragmatic response to changed financial circumstances.‖
And noted the importance of monitoring progress:
―To ensure that they remain on track, both partners agree on the importance of establishing appropriate and robust mechanisms and milestones.‖
In relation to the 20% target for class sizes, the Cabinet Secretary said:
―Am I disappointed that we are not at 100 per cent? Of course. This has turned out to be more difficult than anybody anticipated. There have been political as well as practical difficulties. When I came into office, I thought it important to try to get some new momentum on the issue‖ (Scottish Parliament ELLC Committee, 2010a)
However, he considered that: ―Twenty per cent was achievable and realistic‖ (Scottish Parliament ELLC Committee, 2010a). This target was achieved with 21.7% of P1-3 pupils being in classes of 18 or less, as measured by the pupil census, in September 2010. This included classes of up to 36 taught by two teachers (Scottish Government, 2010a).
Changes from Autumn 2010
In addition to the policy to reduce class sizes in P1 to P3, in November 2010, the legislative maximum for P1 classes was reduced from 30 to 25 pupils. Asked by opposition members why this was set at 25 for P1 rather reflecting the policy of 18 for P1-3, the Cabinet Secretary said:
―When you were in government, you set the target at 25 but you did not achieve it. It is the next step to take it down, and that is what we are going to do. It is the right place to be on it. We do not yet have 100 per cent of classes in primary 1 at 18 or below, and to have imposed a limit of 18 at this stage would have conferred a considerable burden. I am a natural negotiator, Mr Macintosh, and I try to move things forward by agreement and consensus. In the circumstances, I believe that the work that I have done in moving the policy forward this year—which I hope will bear fruit when the figures are published—is the next step. We are taking it a step at a time, and this is a useful next step.‖ (Scottish Parliament ELLC Committee 2010b).
A motion lodged by Elizabeth Smith MSP to annual the regulations was not successful. Her reasoning had been that the lower cap on P1 class size would reduce parental choice by further limiting access to popular primary schools (Scottish Parliament ELLC Committee 2010b col 4087).
8
Also in November 2010 the Scottish Government and COSLA agreed to maintain the pupil teacher ratio in P1-3 at the 2010 level (Swinney, 2010). In evidence to the ELLC Committee the Cabinet Secretary said:
―I am not saying that we are moving to a focus on the PTR, I am saying that this figure on which we have agreed is the best figure at this stage for maintaining the progress that we have made. Both the unions and I were convinced of that, so we have agreed the figure with COSLA‖ (Scottish Parliament ELLC Committee 2010c, col 4425)
As part of this agreement, an extra £15m was provided in the local government settlement 2011/12 for employing teachers. This was, however, in the context of an average cut to local authority revenue allocations of 2.6% (or 6.6% if they did not sign up to the COSLA/Scottish Government budget agreement).
Class sizes in S1 and S2
As mentioned, the previous Scottish Executive had a policy of achieving class sizes of 20 in S1 and 2 English and Maths and issued circular 1/2007 to provide guidance on this. Asked whether this was SNP policy, the Cabinet Secretary stated in 2010 that ―The circular continues in existence and therefore there continues to be advice on that matter‖. He stated that he had no intention to legislate on class sizes in secondary schools (Scottish Parliament ELLC Committee, 2010b col 4086-7). The TESS reported in January 2011 that 13 out of 22 councils asked had dropped the target and a further 3 councils were considering dropping it. The main reason given was budget pressures (TESS, 2011).

9
PROGRESS TOWARDS SMALLER PRIMARY CLASS SIZES
Comparing upper and lower primary class sizes
Table 2 below shows that over the last thirteen years the proportion of lower primary pupils in small classes (18 or fewer) increased from 7% to 13% between 1997 and 2009 and then to 18% in 20104. The proportion in classes of more than 25 dropped from 53% to 23% by 2009 but last year increased to 27%. It appears therefore, that in 2010, pupils moved from medium sized classes (19-25) into both smaller and larger classes. There has been less change in upper primary. The proportion of upper primary pupils in classes of less than 25 increased from 45% in 1997 to 52% in 2010.
Table 2: Proportion of pupils in classes of different sizes, 1997 – 2010
P1 to P3 pupils P4 to P7 pupils
% in
composite
Average
class
size
18 or
fewer
19 to
25
more than
25
25 or
fewer
26 to
30
more than
30
1997 7 40 53 45 35 20 22 25
1998 8 42 50 45 35 20 22 25
1999 9 45 46 46 35 19 22 25
2000 10 47 44 46 35 19 22 24
2001 10 49 41 46 35 19 22 24
2002 9 49 41 47 35 18 23 24
2003 10 49 41 48 35 17 24 24
2004 10 49 41 48 36 17 24 24
2005 11 50 39 49 35 16 24 24
2006 11 51 38 50 35 15 25 24
2007 12 60 28 50 34 16 26 23
2008 13 63 23 51 33 17 27 23
2009 13 64 23 52 32 16 27 23
2010 18 55 27 52 32 16 27 23
Source: Scottish Government online.
Chart 1 below illustrates the trend towards smaller class sizes over the last ten years by showing the falling proportion of pupils in P1-3 and P4-7 in classes of more than 25. This demonstrates greater progress in lower than upper primary, reflecting the policy focus on lower primary.
4 Classes taught by a single teacher. This measure has been used to enable comparison over years.

10
Chart 1: Proportion of pupils in classes of more than 25 – lower and upper primary compared. 1997-2010.
Source: Scottish Government online
Another way of looking at this is to consider average class size. Classes have become smaller in P1, falling from an average of 25 to 21 pupils but there is little change in upper primary which fell by less than one percentage point over 13 years. Chart 2 below compares the average class size for P1-7 for 1997 and 2010.
Chart 2: average class size by stage 1997 and 2010
Sources: Pupils in Scotland 2003 and 2009, 2010b
11
Lower Primary
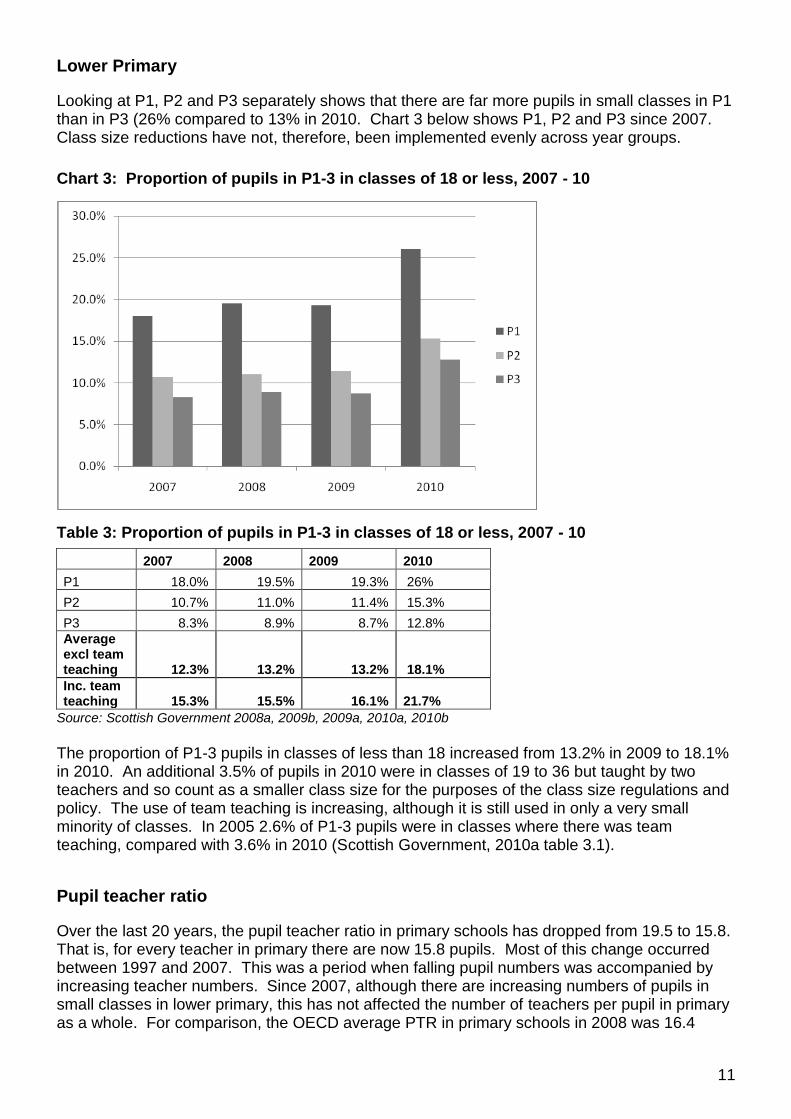
Looking at P1, P2 and P3 separately shows that there are far more pupils in small classes in P1 than in P3 (26% compared to 13% in 2010. Chart 3 below shows P1, P2 and P3 since 2007. Class size reductions have not, therefore, been implemented evenly across year groups.
Chart 3: Proportion of pupils in P1-3 in classes of 18 or less, 2007 - 10
Table 3: Proportion of pupils in P1-3 in classes of 18 or less, 2007 - 10
2007 2008 2009 2010
P1 18.0% 19.5% 19.3% 26%
P2 10.7% 11.0% 11.4% 15.3%
P3 8.3% 8.9% 8.7% 12.8%
Average excl team teaching 12.3% 13.2% 13.2% 18.1%
Inc. team teaching 15.3% 15.5% 16.1% 21.7%
Source: Scottish Government 2008a, 2009b, 2009a, 2010a, 2010b
The proportion of P1-3 pupils in classes of less than 18 increased from 13.2% in 2009 to 18.1% in 2010. An additional 3.5% of pupils in 2010 were in classes of 19 to 36 but taught by two teachers and so count as a smaller class size for the purposes of the class size regulations and policy. The use of team teaching is increasing, although it is still used in only a very small minority of classes. In 2005 2.6% of P1-3 pupils were in classes where there was team teaching, compared with 3.6% in 2010 (Scottish Government, 2010a table 3.1).
Pupil teacher ratio
Over the last 20 years, the pupil teacher ratio in primary schools has dropped from 19.5 to 15.8. That is, for every teacher in primary there are now 15.8 pupils. Most of this change occurred between 1997 and 2007. This was a period when falling pupil numbers was accompanied by increasing teacher numbers. Since 2007, although there are increasing numbers of pupils in small classes in lower primary, this has not affected the number of teachers per pupil in primary as a whole. For comparison, the OECD average PTR in primary schools in 2008 was 16.4

12
(14.6 for the EU19). It was 20.2 for the UK as a whole and 14.4 in Finland (OECD, 2010). The pupil teacher ratio trend in primary schools over the last 20 years is given in chart 4 below.
Chart 4: pupil teacher ratio 1990 to 2010.
Scottish Government 2007d, 2009c,
LOCAL AUTHORITY POLICY AND PROGRESS ON CLASS SIZE
The implementation of the class size policy is a matter for local authorities and some have prioritised this more than others. In addition to debates about available resources, there are also some local authorities which believe there are more effective ways of using available funds. Glasgow Council decided to focus on nurture groups5, English as an additional language and support for dyslexia. Maureen McKenna (Executive Director of Education at Glasgow) explained this targeted approach:
―We are not going to aim for 18; instead, we are going to target need by providing head teachers with the staff they need to meet the varying needs of the children in their school. That is not just about P1 to P3; we have some children who still experience levels of vulnerability when they are in P4 and P5.‖ (Scottish Parliament ELLC Committee, 2010d).
The Cabinet Secretary acknowledged Glasgow‘s approach:
―I do not in the slightest criticise Glasgow City Council's priorities. It has worked well with the Scottish Government on the 570 hours commitment6; indeed, all local authorities have moved forward on that. The concordat contained a clear set of agreements, and councils have moved forward on all of them. The policy fits well within an overall strategy of improvement in education and I am happy to give credit where it is due, to Glasgow City Council. I am sure that you will want to give credit to the Government, too, for the progress that we have made.‖ (Scottish Parliament ELLC Committee, 2010a).
5 Grounded in attachment theory, these are informal settings enabling small groups of (usually) primary pupils to
develop socially and emotionally in order that they can make progress with formal learning. See:
http://www.nurturegroups.org/pages/what-are-nurture-groups.html 6 The Scottish Government had a target to increase pre-school hours to 570 hours by August 2010. This was
affected by the ‗revised education framework‘ discussed on p. 7.

13
In March 2010, the Education, Lifelong Learning and Culture Committee took evidence from local authorities about class sizes. One of the witnesses raised the point that small class sizes is only one amongst a number of methods to improve learning.
―The most expensive resource is teachers and it is clear that, to achieve a reduction in class size, it is necessary to employ additional teachers. At a time of increasing financial constraint, the question that I am asking is: could you get the same results in respect of maintaining and improving attainment by adopting methods other than the class size method?‖ (Terry Lanagan, Executive Director of educational services at West Dunbartonshire Council at Scottish Parliament ELLC 2010d)
Chart 5 below shows the variation in progress in class size reductions since 2007 in different local authorities. The situation has improved in 28 local authorities. In four local authorities, there was a lower proportion of pupils in small classes in 2010 compared with 2007 – these were Aberdeenshire, North Lanarkshire, Glasgow and Shetland. However Shetland, with 43% of P1 to P3 pupils in classes of 18 or less in 2010, still met the 20% target. Although Edinburgh, Aberdeen, East Lothian, Falkirk and Midlothian did not meet the 20% target by August 2010, they had still made some progress towards smaller classes over the period.
Chart 5: Percentage point change 2007 to 2010 in % P1-3 pupils in classes of 18 or less by local authority.
Source: Scottish Government 2010a.
EFFECT OF CLASS SIZE ON EDUCATIONAL ATTAINMENT
Class size is a well studied, but still contentious area of educational research. Findings from projects such as STAR in the United States have led to class size reduction (CSR) programmes across the world. The two most robust studies are STAR in the United States and Class size and the Pupil Adult Ratio – CSPAR- project in England. Blatchford notes that literature reviews and commentaries vary in their conclusions and there is vigorous debate about the methods used in various studies.

14
STAR Project - USA
There has been a very large number of studies on class size, but the best known is the STAR project. This involved the random allocation of 7,000 pupils aged 5 to 8 years to classes of 13 – 17 and to classes of 22-25 with and without a teacher aide. The project found significantly better attainment in maths and reading in the smaller classes (i.e classes under 18 compared with classes under 25). The greatest benefits were for those pupils who were in small classes over a number of years and progress was greater for schools in low-income areas (Finn and Suriani, 2010). Blatchford notes that criticisms of this study include the level of attrition (pupils ‗dropping out‘ of the study) and the lack of baseline data. Finn describes the magnitude of the effect as ‗benefits of ½ to 5 ½ months of schooling‖.7
CSPAR in England
CSPAR was a longitudinal study of 10,000 pupils in England over their time in primary school. Instead of setting up classes of particular sizes, it measured the effects of the natural variation in class size and controlled for factors such as prior attainment. This showed a clear class size effect on pupil attainment in literacy and mathematics in the first year, although effects in later years were less evident. Interestingly, it also found a ‗disruption‘ effect of moving into a different size of class. The effect was particularly marked for pupils with lower prior attainment. Blatchford found that: ―small classes, below 25 worked best in literacy for children who were most in need academically.‖ He notes that: ―key potentially confounding variables were controlled for and one can be fairly confident that results reveal an independent effect of class size over and above other variables.‖
Processes involved
While there appears to be a positive effect of small class sizes in early primary, the exact processes involved are less well understood. Blatchford notes that ―there is most support for the conclusion that class size reduction allows more individual attention, more active, sustained interaction with teachers and more student classroom engagement.‖ Finn notes that ―student behaviour changes, sometimes dramatically‖, with more ‗on-task‘ behaviour, fewer ‗splinter groups‘ and pupils being more supportive of each other. Galton challenges the intuitive argument that smaller classes are beneficial because pupils get more individual attention. He cites studies (Hattie, 2005) showing that the extra attention gained is likely to be minimal and emphasises instead the importance of teaching strategies.
―any policy directed to reducing class size is not likely to be cost effective unless it is coupled with a major effort in teachers‘ professional development designed to change current practice.‖ […] ―the principles of effective teaching are the same in classes of all sizes. The advantage of a smaller class is that it should be easier to put these principles into practice and to monitor their effect on pupils.‖ (Galton).
Tymms notes that ―there is a suggestion that teachers do not alter their teaching as much as might be expected as classes get smaller.‖
No ‘optimal’ size
Government policies have focused on reducing classes to a specific size (18, 20 or 25). However, Blatchford argues that: ―There are no social psychological reasons that have been advanced for thinking that there is a threshold below or above which class size effects change
7 The effect size was between 0.20 to 0.30 standard deviations.

15
in intensity or character. It is also likely that effects will vary between different countries, educational systems and teaching approaches. In general it is probably over simplistic to talk in an exact way about optimal class size.‖
Pupil Teacher Ratio and class size
Finn points out that the studies which show an effect on attainment look at the class rather than just the number of education professionals who contribute to children‘s learning.
―PTR and class size do not translate easily into one another because PTRs are usually computed for schools, districts and other larger units, obscuring variation from classroom to classroom, and because PTRs include personnel who are not responsible for classes of students on a regular or full-time basis.‖ (Finn)
PTR reductions will not necessarily result in class size reductions if they include teachers who do not have full time classes allocated to them. Any effects on attainment may therefore be for reasons other than small class size. For example, a policy to put more resources into additional support teaching staff may reduce overall PTR and improve attainment, but it is not a class size reduction policy.
Value for money and alternative strategies
One of the key criticisms of class size reduction policies is the cost. A literature review by the Scottish Council for Research in Education (SCRE) in 2006 identified a consensus within existing research that policies of class size reductions were expensive. A number of researchers questioned the value for money of such policies and identified alternative options for expenditure that may improve the educational attainment of pupils:
“Further possibilities would be to enhance the quality of teaching through more professional development of the existing workforce or the deployment of other professional staff such as home visitors, social workers in schools or more educational psychologists. Additional support staff either in classrooms or deployed elsewhere in schools would also be options‖ (Scottish Executive 2006)
Tymms points out that other approaches, such as peer tutoring, have been found to have the same effect size as class size reductions. However, Blatchford cautions against comparing class size reduction policies with other initiatives:
―A number of authors conclude that class size reductions are less effective than other and less costly alternative reforms (Hattie, 2005, Slavin, 2009). However, one needs to be careful with this kind of comparison – it is not a fair test in the sense that initiatives such as one-to-one tutoring, peer tutoring and computer-assisted learning represent a distinctive method of teaching while CSR merely set limits on the numbers of participants involved. We would then need to consider what teaching and instruction would be appropriate in classes of different sizes.‖
Finn argues (from Krueger, 2003 and Levin, 2007) that it is important to consider the potential lifetime savings from improved educational attainment including improved earning potential (and therefore tax contributions). Including estimates for this may offset some of the costs of the initial policy.
16
SOURCES
BBC. (2007) Council Makes Class Size Warning [Online]. News Release 23 November 2007. Available at: http://news.bbc.co.uk/1/hi/scotland/south_of_scotland/7108927.stm [Accessed 23 November 2007]
Berry, K. (2008) Class Sizes. SPICe Briefing 08/18. Edinburgh: Scottish Parliament. Available at: http://www.scottish.parliament.uk/business/research/briefings-08/SB08-18.pdf
Blatchford, P. (2010) Submission to Education, Lifelong learning and Culture Committee on class sizes dated 23 February 2010 Edinburgh: Scottish Parliament. Available at: http://www.scottish.parliament.uk/s3/committees/ellc/inquiries/documents/BlatchfordProfessorP.pdf
Cameron, D. (2010) Class size working group report. Edinburgh: Scottish Government. Available at: http://www.scotland.gov.uk/Publications/2010/09/02141620/0
Finn and Suriani. (2010) Small Class Sizes: One Policy – Many Outcomes in Reynolds et al (eds) (in press) Cost effective programs in children’s first decade: A human capital integration. New York: Cambridge University Press. Available at: http://www.scottish.parliament.uk/s3/committees/ellc/inquiries/documents/FinnProfessorJ.pdf
Galton, M. (2010) Submission to Education, Lifelong Learning and Culture Committee on class sizes dated 11 February 2010. Edinburgh: Scottish Parliament. Available at: http://www.scottish.parliament.uk/s3/committees/ellc/inquiries/documents/GaltonProfessorM.pdf
The Herald. (2007) The Cost of Smaller Class Sizes. 16 October 2007. Available at: http://www.theherald.co.uk/news/news/display.var.1761931.0.the_cost_of_smaller_class_sizes.php
OECD. (2010) Education at a Glance. Paris: OECD. Available at: http://www.oecd.org/document/52/0,3343,en_2649_39263238_45897844_1_1_1_1,00.html
Scotland on Sunday. (2007) Crammed Classrooms Make a Mockery of SNP Targets. 23 September 2007 p5. Edinburgh: Scotsman Publications.
Scottish Executive. (2004) Pupils in Scotland 2003. Available at: http://www.scotland.gov.uk/Publications/2004/06/19559/39480 Edinburgh: Scottish Executive.
Scottish Executive. (2006) Class sizes resources and staffing working group. Edinburgh: Scottish Executive. Available at: http://www.scotland.gov.uk/Publications/2006/06/26102419/10
Scottish Executive. (2007a) Circular 1/2007. Edinburgh: Scottish Government.
Scottish Government. (online) Class Sizes Trend. Available at: http://www.scotland.gov.uk/Topics/Statistics/Browse/School-Education/TrendClassSizes [Accessed 20 December 2010]
Scottish Government. (online) COSLA Agreement Available at: http://www.scotland.gov.uk/Topics/Education/Schools/Latest/cosla [Accessed 20 December 2010]
Scottish Government. (2006) Class sizes, staffing and resources working group. Interim report. Edinburgh: Scottish Executive. Available at: http://www.scotland.gov.uk/Publications/2006/06/26102419/5

17
Scottish Government. (2007a) Maths and English Class Sizes in S1 and S2. Edinburgh: Scottish Government. Available at: http://www.scotland.gov.uk/Publications/2007/11/19125551/0
Scottish Government. (2007b) Class Sizes, Staffing and Resources Working Group: Final Report. Edinburgh: Scottish Government. Available at: http://www.scotland.gov.uk/Publications/2007/11/16094326/0
Scottish Government. (2007c) More teachers for class size pledge. News release 29 June 2007. Edinburgh: Scottish Government. Available at: http://www.scotland.gov.uk/News/Releases/2007/06/20093631
Scottish Government. (2007d) Cash to improve school buildings. News release 17 July 2007. Edinburgh: Scottish Government. Available at: http://www.scotland.gov.uk/News/Releases/2007/07/17083532
Scottish Government. (2007d) Teachers in Scotland 2006. Edinburgh: Scottish Government. Available at: http://www.scotland.gov.uk/Publications/2007/03/27085753/4
Scottish Government. (2008a) Pupils in Scotland 2007. Edinburgh: Scottish Government. Available at: http://www.scotland.gov.uk/Publications/2008/02/25145216/40
Scottish Government. (2008b) Note of Meeting between Schools Directorate Officials and Deans of Faculties of Education, Monday 2 July 2007. Edinburgh: Scottish Government. Available at: http://www.scotland.gov.uk/About/FOI/Disclosures/2008/02/Minutes
Scottish Government. (2009a) Pupils in Scotland 2009. Edinburgh: Scottish Government. Available at: http://www.scotland.gov.uk/Publications/2009/11/05112711/0
Scottish Government. (2009) Pupils in Scotland, 2008. Available at: http://www.scotland.gov.uk/Publications/2009/04/01090908/0 Edinburgh: Scottish Government.
Scottish Government. (2009) Teachers in Scotland, 2009. Edinburgh: Scottish Government. Available at: http://www.scotland.gov.uk/Publications/2010/02/09090009/0
Scottish Government. (2010a) Summary school statistics no. 1. Edinburgh: Scottish Government. Available at: http://www.scotland.gov.uk/Publications/2010/12/01091355/0
Scottish Government. (2010b) Pupil census supplementary data. Edinburgh: Scottish Government. Available at: http://www.scotland.gov.uk/Topics/Statistics/Browse/School-Education/pupilsupdata
Scottish Government and COSLA. (2007) Concordat. Edinburgh: Scottish Government. Available at: http://www.cosla.gov.uk/attachments/aboutcosla/concordatnov07.pdf
Scottish Labour Party and Scottish Liberal Democrats. (2003) A Partnership for a Better Scotland: Partnership Agreement. Edinburgh: Scottish Labour Party and Scottish Liberal Democrats. Available at: http://www.scotland.gov.uk/Publications/2003/05/17150/21952
Scottish Negotiating Committee for Teachers. SNCT Handbook appendix 2.9. Available at: http://www.snct.org.uk/wiki/index.php?title=Appendix_2.9 [Accessed 20 December 2010].
Scottish Parliament. (2007a) Official Report 5 December 2007. Col 4067. Edinburgh: Scottish Parliament. Available at: http://www.scottish.parliament.uk/business/officialReports/meetingsParliament/or-07/sor1205-02.htm#Col4067

18
Scottish Parliament. (2007b) Written Answers Monday 22 October 2007 to Friday 26 October 2007. S3W-5065. Edinburgh: Scottish Parliament. Available at: http://www.scottish.parliament.uk/business/pqa/wa-07/war1026.htm
Scottish Parliament Education, Lifelong Learning and Culture Committee. (2008) Official Report of 31st meeting 2008, Session 3, 17 December 2008. Edinburgh: Scottish Parliament. Available at: http://www.scottish.parliament.uk/s3/committees/ellc/or-08/ed08-3101.htm
Scottish Parliament Education, Lifelong Learning and Culture Committee. (2010a) Official Report of 7th meeting 2010, Session 3, 10 March 2010. Edinburgh: Scottish Parliament. Available at: http://www.scottish.parliament.uk/s3/committees/ellc/or-10/ed10-0701.htm
Scottish Parliament Education, Lifelong Learning and Culture Committee. (2010b) Official Report of 26th meeting 2010, Session 3, 27 October 2010. Edinburgh: Scottish Parliament. Available at: http://www.scottish.parliament.uk/s3/committees/ellc/or-10/ed10-2601.htm
Scottish Parliament Education, Lifelong Learning and Culture Committee. (2010c) Official Report of 32nd meeting 2010, Session 3, 1 December 2010. Edinburgh: Scottish Parliament. Available at: http://www.scottish.parliament.uk/s3/committees/ellc/or-10/ed10-3201.htm
Scottish Parliament Education, Lifelong Learning and Culture Committee. (2010d) Official Report of 6th meeting 2010, Session 3, 3 March 2010. Edinburgh: Scottish Parliament. Available at: http://www.scottish.parliament.uk/s3/committees/ellc/or-10/ed10-0601.htm
Swinney, J. (2010) Letter from John Swinney, Cabinet Secretary for Finance and Sustainable Growth and Councillor Pat Watters, President, COSLA to leaders of all Scottish local authorities. Letter dated 17 November 2010. [Available in SPICe bib number: 52115]
The Education (Lower Primary Class Sizes) (Scotland) Amendment Regulations. SSI 2010/326. Available at: http://www.legislation.gov.uk/ssi/2010/326/contents/made [Accessed 20 December 2010].
Times Educational Supplement. (2011) Class size target scrapped. 7 January 2011. Available at: http://www.tes.co.uk/article.aspx?storycode=6067066 [Accessed 7 January 2011].
Tymms, P. (2010) Submission to Education, Lifelong Learning and Culture Committee on class sizes dated 19 February 2010. Edinburgh: Scottish Parliament. Available at: http://www.scottish.parliament.uk/s3/committees/ellc/inquiries/documents/TymmsProfessorP.pdf

19
This page is intentionally blank

20
RELATED BRIEFINGS
SB 11-08 Teacher numbers (775KB pdf)
SB 08-18 Class Sizes (147KB pdf)
Scottish Parliament Information Centre (SPICe) Briefings are compiled for the benefit of the Members of the Parliament and their personal staff. Authors are available to discuss the contents of these papers with MSPs and their staff who should contact Camilla Kidner on extension 85376 or email [email protected]. Members of the public or external organisations may comment on this briefing by emailing us at [email protected]. However, researchers are unable to enter into personal discussion in relation to SPICe Briefing Papers. If you have any general questions about the work of the Parliament you can email the Parliament‘s Public Information Service at [email protected].
Every effort is made to ensure that the information contained in SPICe briefings is correct at the time of publication. Readers should be aware however that briefings are not necessarily updated or otherwise amended to reflect subsequent changes.
www.scottish.parliament.uk