Embed Size (px)
Citation preview

The Socio-Economic Rights Monitoring Tool
The Right to Food in South AfricaAn analysis of the content, policy effort, resource allocation and enjoyment of the constitutional right to foodJuly 2015
Daniel McLaren, Busiso Moyo, Jared Jeffery
Wo
rkin
g P
aper
11


The Right to Food in South Africa:
An analysis of the content, policy effort, resource allocation and enjoyment of the
constitutional right to food
By Daniel McLaren, Busiso Moyo and Jared Jeffery
With contributions from Zukiswa Kota and Muhammad Zakaria Suleman
July 2015
The Socio-Economic Rights Monitoring ToolRecommended citation: McLaren, D, Moyo, B and Jeffery, J ‘The right to food in South Africa: An analysis of the content, policy effort, resource allocation and enjoyment of the constitutional right to food’ (2015) Studies in Poverty and Inequality Institute, Working Paper 11.
Project made possible with funding from the
Additional support provided by Oxfam SA
ISNB number 978-0-620-66847-7

Authors:Daniel McLaren: Researcher and Project Leader, Studies in Poverty and Inequality Institute.
For enquiries about this research and for more information on the Socio-Economic Rights Monitoring Tool, contact: [email protected]
Busiso Moyo: Advocacy & Campaigns Officer, Studies in Poverty and Inequality Institute.
For right to food advocacy related enquires, contact: [email protected]
Jarred Jeffery: Freelance researcher and writer on food security and supermarkets in Africa.
For enquiries related to his research contact: [email protected]
Contributors:Zukiswa Kota: Researcher, Public Service Accountability Monitor (PSAM), Rhodes University. [email protected]
Muhammad Zakaria Suleman: former Junior Researcher on the right to food at Section27.
Other publications by the Socio-Economic Rights Monitoring Tool (available at www.spii.org.za):
Hannah Dawson & Daniel McLaren ‘A Framework for Monitoring and Evaluating the Progressive Realisation of Socio-Economic Rights in South Africa’ (2015) Studies in Poverty and Inequality Institute.
Daniel McLaren & Busiso Moyo ‘Monitoring and Evaluating Progressive Realisation of the Right to Sufficient Food and Basic Nutrition in South Africa’ (2014) Studies in Poverty and Inequality Institute, Policy Brief 8.
Hannah Dawson ‘Public participation and citizen-based monitoring in realising socio-economic rights’ (2014) Studies in Poverty and Inequality Institute, Policy Brief 7.
Hannah Dawson & Daniel McLaren ‘Monitoring the right of access to adequate housing in South Africa’ (2014) Studies in Poverty and Inequality Institute, Working Paper 8.
Khetho Lomahoza ‘Monitoring the right to health care in South Africa’ (2013) Studies in Poverty and Inequality Institute, Policy Brief 2.
Hannah Dawson ‘Monitoring the right to social security in South Africa’ (2013) Studies in Poverty and Inequality Institute, Policy Brief 1.
Hannah Dawson, Khetho Lomahoza & Tshego Monnana ‘The right to social security and primary health care in Zandspruit informal settlement South Africa’ (2013) Studies in Poverty and Inequality Institute.
Stephanie Brockerhoff ‘A Review of the Development of Social Security Policy in South Africa’ (2013) Studies in Poverty and Inequality Institute, Working Paper 6.

ContentsList of tables ........................................................................................................................... vii
List of figures .......................................................................................................................... viii
Acronyms and abbreviations .................................................................................................... ix
Preface and acknowledgements .............................................................................................. xi
Foreword ................................................................................................................................ xii
1 Introduction ............................................................................................... 11.1. Socio-economic rights and transformation ...................................................................................................... 1
1.2. Introducing the Socio-Economic Rights Monitoring Tool .................................................................................. 1
1.3. 3-step methodology ........................................................................................................................................ 2
1.4. Objectives of the Tool and end users ................................................................................................................ 2
1.5. Bridging the gap: Citizen-Based Monitoring (CBM) ......................................................................................... 3
1.6. Overview of the paper ..................................................................................................................................... 3
2 Establishing the content of the right to food and the obligations on the state ................................................................................................ 42.1. The right to food, food security, and food sovereignty ..................................................................................... 4
2.1.1. The right to food and food security ................................................................................................................ 5
2.1.2. The right to food and food sovereignty ........................................................................................................... 6
2.2. The right to food in international and regional human rights law .................................................................... 9
2.2.1. The right to adequate food in international human rights law ....................................................................... 112.2.1.1. International Covenant on Economic, Social and Cultural Rights (ICESCR) .................. 11
2.2.1.2. Optional Protocol to the ICESCR (OP-ICESCR) .................................................................................. 14
2.2.1.3. Voluntary Guidelines to support the progressive realization of the right to adequate food in the context of national food security, FAO, 2004. .................................. 14
2.2.1.4. UN Special Rapporteur on the Right to Food .................................................................................. 15
2.2.1.5. Convention on the Elimination of All Forms of Discrimination Against Women (CEDAW) ............................................................................................................................................. 15
2.2.1.6. Millennium Development Goals (MDGs) and Sustainable Development Goals (SDGs) ......................................................................................................................... 15
2.2.1.7. Convention on the Rights of the Child (CRC) .................................................................................. 16
2.2.2. The right to food in African regional human rights law .................................................................................. 162.2.2.1. African Charter on Human and Peoples’ Rights (ACHPR) .......................................................... 16

2.2.2.2. Protocol to the African Charter on Human and Peoples’ Rights on the Rights of Women in Africa ........................................................................................................................................... 17
2.2.2.3. African Charter on the Rights and Welfare of the Child ............................................................. 17
2.3. The right to food in the South African Constitution .......................................................................................... 18
2.3.1. ‘Everyone has the right to have access to sufficient food’ ................................................................................ 192.3.1.1. ‘Progressive realisation’ and the obligation to take ‘reasonable legislative
and other measures’ ......................................................................................................................................... 20
2.3.1.2. ‘Within available resources’ .......................................................................................................................... 22
2.3.2. ‘Every child has the right to basic nutrition’ .................................................................................................... 23
2.3.3. South African jurisprudence on the right to food ............................................................................................ 25
2.4. Summary of the state’s obligations to realise the right to sufficient food and basic nutrition .......................... 27
2.4.1. Policy obligations: reasonableness and progressive realisation ...................................................................... 272.4.1.1. Overarching constitutional and human rights obligations ..................................................... 27
2.4.1.2. Obligations to ensure everyone’s right to have access to sufficient food ...................... 28
2.4.1.3. Obligations to ensure children’s right to basic nutrition ........................................................... 30
2.4.2. Budgetary obligations: within available resources ......................................................................................... 312.4.2.1. Overarching constitutional and human rights obligations ..................................................... 31
2.4.2.2. Obligations to ensure everyone’s right to have access to sufficient food ...................... 31
2.4.2.3. Obligations to ensure children’s right to basic nutrition ........................................................... 31
3 Policy analysis: Assessing the reasonableness of policies and programmes to ensure the right to food ....................................................... 323.1. Chronological summary of right to food related policy development .............................................................. 33
3.2. Right to Food Programmes and Institutional Responsibilities .......................................................................... 36
3.2.1. Department of Agriculture, Forestry and Fisheries (DAFF) .............................................................................. 373.2.1.1. Integrated Food Security Strategy (IFSS), 2002 ............................................................................... 38
3.2.1.2. The National Policy on Food and Nutrition Security (National Policy), 2014 ................ 40
3.2.1.3. Comprehensive Agricultural Support Programme (CASP), 2003 ......................................... 43
3.2.1.4. National Agricultural Marketing Council (NAMC) – Food Price Monitoring ................. 44
3.2.2. Department of Basic Education (DBE) ............................................................................................................ 453.2.2.1. National School Nutrition Programme (NSNP) ................................................................................ 45
3.2.3. National Treasury ........................................................................................................................................... 473.2.3.1. Zero VAT Rating of basic foodstuffs ....................................................................................................... 47
3.2.4. Department of Social Development (DSD) ..................................................................................................... 483.2.4.1. Social Relief of Distress (Food parcels) – South Africa Social Security Agency ............ 48
3.2.5. Department of Health (DoH) .......................................................................................................................... 493.2.5.1. Integrated Nutrition Programme (INP) ................................................................................................. 49
3.3. Assessing the reasonableness of the policy effort ............................................................................................ 51
3.4. Evolution of Policy Logic on the Right to Food ................................................................................................. 54
3.5. Conclusion (key findings, recommendations) .................................................................................................. 56
4 Budget analysis: assessing the resource allocations and expenditures of government programmes to address the right to food ............................... 574.1. Case study 1: National School Nutrition Programme – Feeding Hungry Minds, by Zukiswa Kota ..................... 59

4.1.1. Introduction ................................................................................................................................................... 60
4.1.2. Objectives of the case study ........................................................................................................................... 64
4.1.3. A brief history of the School Nutrition Programme ......................................................................................... 654.1.3.1. Programme inception and structure ..................................................................................................... 65
4.1.3.2. Objectives of the NSNP and legislative framework ...................................................................... 66
4.1.4. Budget analysis and strategic plan evaluation of the NSNP ............................................................................ 674.1.4.1. Adequacy of overall NSNP budget ......................................................................................................... 67
4.1.4.2. Efficiency of allocations and use of maximum available resources: under-spending trends .................................................................................................................................. 68
4.1.4.3. Effectiveness of the NSNP in budgeting terms .............................................................................. 75
4.1.5. Conclusion and recommendations ................................................................................................................. 75
4.2. Case Study 2: Vitamin A Supplementary Programme, by Muhammad Zakaria Suleman .................................. 77
4.2.1. Vitamin A Deficiency and the Need for Supplementation ............................................................................... 77
4.2.2. Vitamin A Supplementation in South Africa ................................................................................................... 77
4.2.3. VAS Programme Management and Budgeting ............................................................................................... 784.2.3.1. Planning and budgeting for VAS in the National Department of Health ....................... 78
4.2.3.2. Planning and budgeting for VAS in the Provincial Departments of Health .................. 78
4.2.4. Budget analysis of programme ...................................................................................................................... 81
4.2.5. Key findings ................................................................................................................................................... 83
4.2.6. Recommendations ......................................................................................................................................... 84
4.3. Case study 3: Comprehensive Agricultural Support Programme, by Jared Jeffery ............................................ 85
4.3.1. CASP institutional structure and beneficiaries ................................................................................................ 85
4.3.2. CASP Budget Analysis ..................................................................................................................................... 874.3.2.1. Equity of CASP allocations ............................................................................................................................ 91
4.3.2.2. Effectiveness of the programme .............................................................................................................. 95
4.3.3. Conclusion and recommendations ................................................................................................................. 100
4.4. Case Study 4: Fetsa Tlala, by Jared Jeffery ........................................................................................................ 101
4.4.1. Introduction ................................................................................................................................................... 101
4.4.2. Background: the Zero Hunger Campaign ........................................................................................................ 101
4.4.3. Fetsa Tlala: objectives ..................................................................................................................................... 102
4.4.4. Fetsa Tlala: budget analysis ............................................................................................................................ 103
4.4.5. Conclusion and recommendations ................................................................................................................. 105
4.5. Case Study 5: Recapitalisation and Development Programme (RECAP), by Jared Jeffery ................................. 106
4.5.1. How RECAP works. ......................................................................................................................................... 108
4.5.2. Beneficiaries ................................................................................................................................................... 109
4.5.3. Employment .................................................................................................................................................. 111
4.5.4. RECAP: budget analysis .................................................................................................................................. 114
4.5.5. Conclusion and recommendations ................................................................................................................. 118
4.5.6. RECAP turn-around strategy and new policy .................................................................................................. 119
4.6. Case Study 6: Food for All Programme, by Jared Jeffery ................................................................................... 120
4.6.1. Introduction ................................................................................................................................................... 120
4.6.2. Objectives ...................................................................................................................................................... 120
4.6.3. Food For All Programme: budget analysis ...................................................................................................... 122
4.6.4. Conclusion and recommendations ................................................................................................................. 124

5 The Status of the Right to Food in South Africa: what indicators tell us ........... 1255.1. The process of developing indicators ............................................................................................................... 126
5.1.1. Unpack the content of the right ..................................................................................................................... 126
5.1.2. Identify frameworks and indicators that exist ................................................................................................ 127
5.1.3. Verify data sources ......................................................................................................................................... 127
5.2. Right to Food Indicators ................................................................................................................................... 129
5.2.1. Dimensions of SERs: Access, Adequacy, Quality .............................................................................................. 129
5.2.2. Indicator ‘wish list’ .......................................................................................................................................... 130
5.3. Presentation and analysis of the indicators ...................................................................................................... 131
5.3.1. ACCESS INDICATORS ........................................................................................................................................ 1325.3.1.1. Availability .............................................................................................................................................................. 132
5.3.1.2. Stability ..................................................................................................................................................................... 133
5.3.1.3. Economic Access: affordability and vulnerability .......................................................................... 135
5.3.1.4. Physical access: access to land for food production .................................................................... 137
5.3.1.5. Physical access: coverage of state nutrition programmes ....................................................... 138
5.3.2. ADEQUACY INDICATORS .................................................................................................................................. 1405.3.2.1. Utilisation: food safety ..................................................................................................................................... 140
5.3.2.2. Utilisation: prevalence of food insecurity ........................................................................................... 141
5.3.2.3. Utilisation: nutritional adequacy .............................................................................................................. 142
5.3.3. QUALITY INDICATORS ...................................................................................................................................... 1425.3.3.1. Utilisation: health and nutrition outcomes (adults) ..................................................................... 142
5.3.3.2. Utilisation: health and nutrition outcomes (women) .................................................................. 143
5.3.3.3. Utilisation: health and nutrition outcomes (children) ................................................................. 144
6 Ensuring the progressive realisation of the right to food in South Africa: report recommendations based on findings .................................................. 1466.1. STEP 1: Policy recommendations ..................................................................................................................... 146
Recommendations pertaining to children ....................................................................................................................... 147
6.2. STEP 2: Programme and budget recommendations ......................................................................................... 147
6.2.1. Budget recommendations .............................................................................................................................. 147
6.2.2. National School Nutrition Programme ........................................................................................................... 147
6.2.3. The Vitamin A Supplementation Programme: ................................................................................................ 148
6.2.4. Comprehensive Agricultural Support Programme: ......................................................................................... 148
6.2.5. Fetsa Tlala: ..................................................................................................................................................... 148
6.2.6. RECAP ............................................................................................................................................................ 149
6.2.7. Food for All Campaign .................................................................................................................................... 149
6.2.8. National Treasury and VAT Zero Rating ........................................................................................................... 149
6.2.9. NAMC and Food Price Monitoring ................................................................................................................... 149
6.3. STEP 3: Indicators – recommendations to improve the monitoring of the progressive realisation of the right to food ...................................................................................................... 150
6.3.1. The process of developing indicators: key learnings ....................................................................................... 150
6.3.2. Monitoring and evaluating the progressive realisation of the right to food .................................................... 150
6.3.3. Enable improvements to current national survey instruments ....................................................................... 151
vii
6.3.4. Indicators for the right to food ....................................................................................................................... 151
6.3.5. Investment in Qualitative In-depth Studies .................................................................................................... 152
6.4. Uniting and organising to end hunger ............................................................................................................. 152
6.4.1. Using Indicators for Advocacy ......................................................................................................................... 153
BIBLIOGRAPHY ...................................................................................................................... 154
APPENDIX .............................................................................................................................. 162
Table 1: The four dimensions of food security ........................................................................................................................................ 6
Table 2: Evolution of policy and legislation around the right to food ...................................................................................................... 33
Table 3: Government departments and responsibilities regarding food security .................................................................................... 37
Table 4: Food security policy pillars compared ....................................................................................................................................... 42
Table 5: Programmes and Policies .......................................................................................................................................................... 53
Table 6: Food security by locality - SANHANES-I ..................................................................................................................................... 55
Table 7: Provincial & National NSNP Expenditure & Allocations: 2010/11-2016/17 ................................................................................ 67
Table 8: Number of learners benefitting from NSNP in Limpopo 2010/11-2016/17 ............................................................................... 69
Table 9: Nutrition budget allocation and expenditure per province ........................................................................................................ 79
Table 10: VAS Programme coverage of children 6 - 11 months (%) .......................................................................................................... 80
Table 11: VAS Programme of coverage children 12-59 months (%) .......................................................................................................... 80
Table 12: Provincial approaches to nutrition and VAS programme ........................................................................................................... 81
Table 13: Total Support Estimates 1995 – 1997 and 2008 – 2010 (as % of GDP) ..................................................................................... 88
Table 14: CASP budget allocation and expenditure, 2004/05 – 2012/13 ................................................................................................. 90
Table 15: % of Allocation Spent by Province, 2008/09 - 2012/13 ............................................................................................................. 91
Table 16: Employment generated through CASP (2009/10 - 2012/13) .................................................................................................... 96
Table 17: CASP expenditure per job created ............................................................................................................................................. 96
Table 18: Breakdown of employment generation by gender (2011/12 & 2012/13) ................................................................................. 98
Table 19: Fetsa Tlala budget estimates based on CASP allocations, 2014/15 –2017/18 ........................................................................... 103
Table 20: Hectares under production, 2013/14 ........................................................................................................................................ 104
Table 21: Roll out schedule for the programme, 2013/14 - 2018/19 ........................................................................................................ 104
Table 22: Summary of Fetsa Tlala target for 2014/15 financial year ......................................................................................................... 105
Table 23 : Effect of RECAP on beneficiaries’ diets ....................................................................................................................................... 106
Table 24: RECAP projects by land reform type and province as of June 2012 ............................................................................................ 110
Table 25: PLAS and RECAP farms, 2009 – 2012 ........................................................................................................................................ 110
Table 26: Jobs created through RECAP 2010 - 2014 .................................................................................................................................. 112
Table 27: Employment on RECAP farms (DPME survey, n = 98, 6 provinces) ............................................................................................ 113
Table 28: The cost of job creation, CASP and RECAP compared ................................................................................................................. 114
Table 29: RECAP expenditure as % of DRDLR total expenditure ................................................................................................................ 115
Table 30: No. of RECAP projects funded by province & funding category, 2009-2013 (ex cluding amounts for land acquisition) .............. 117
List of Tables
viii
Table 31: Estimate of expenditure per funding category (2009/10 – 2012/13) ........................................................................................ 117
Table 32: No. of people accessing food through feeding programmes per year ........................................................................................ 121
Table 33: Rollout of food distribution centres ........................................................................................................................................... 122
Table 34: Budget allocation for the MTSF ................................................................................................................................................. 122
Table 35: Social Policy and Integrated Service Delivery expenditure trends ............................................................................................. 123
Table 36: Food security data at individual and household level ................................................................................................................ 128
Table 37: Indicators for the Right of Access to Sufficient Food and Basic Nutrition ................................................................................... 131
Table 38: Real Estimates and Expenditure for the National School Nutrition Programme Conditional Grant ........................................... 162
Figure 1: The SER Monitoring Tool: 3-step methodology ......................................................................................................................... 2
Figure 2: Global timeline of right to food commitments .......................................................................................................................... 10
Figure 3: IFSS Institutional arrangements ................................................................................................................................................ 39
Figure 4: Urbanisation by province, 2011 ................................................................................................................................................. 41
Figure 5: Percentage of Children Living in Households that Reported Hunger ......................................................................................... 62
Figure 6: NSNP nominal Change between 2014/15 and 2016/17 and real change between 2013/14 and 2014/15 (%) ......................... 70
Figure 7: Percentage of Learners Benefitting from the NSNP 2009 - 2013 .............................................................................................. 72
Figure 8: Malnutrition amongst select children’s age groups in South Africa, 2005 and 2012 .................................................................. 73
Figure 9 : CASP beneficiaries and programmes ......................................................................................................................................... 86
Figure 10: Real government and DAFF expenditure, 2004/05 – 2014/15 .................................................................................................. 89
Figure 11: Real growth rates for gov’t and DAFF expenditures (in 2012 Rands) ......................................................................................... 89
Figure 12: CASP expenditure as % of total DAFF expenditure, 2004/05 – 2012/13 .................................................................................... 90
Figure 13: Allocation by province 2008/09-2012/13 .................................................................................................................................. 92
Figure 14: Food Security by province, 2012 ................................................................................................................................................ 92
Figure 15: Provincial CASP allocation per capita (2012/13) ....................................................................................................................... 93
Figure 16: Subsistence farmers by province (avg for 2013) ........................................................................................................................ 93
Figure 17: Expenditure per project and per beneficiary ............................................................................................................................. 94
Figure 18: Agricultural employment (2003-2013) ..................................................................................................................................... 95
Figure 19: CASP employment 2010/11 ...................................................................................................................................................... 97
Figure 20: CASP employment 2011/12 ...................................................................................................................................................... 97
Figure 21: CASP employment 2012/13 ...................................................................................................................................................... 97
Figure 22: No. of people involved in subsistence agriculture by province, 2013 ......................................................................................... 99
Figure 23: CASP assistance by type of agriculture, 2012/13 ....................................................................................................................... 99
Figure 24: Fetsa Tlala budget estimate, 2014/15 - 2017/18 ....................................................................................................................... 103
Figure 25: Real RECAP allocation 2010/11 – 2014/15 (2010 Rands – 000s) .............................................................................................. 115
Figure 26: RECAP expenditure by province excluding land acquisitions (000s) .......................................................................................... 116
Figure 27: Proportion of RECAP expenditure by province (2009/10 – 2012/13) ........................................................................................ 116
Figure 28: Estimate of expenditure per funding category (000s) ............................................................................................................... 118
Figure 29: The process of developing indicators ......................................................................................................................................... 126
List of figures

ix
Acronyms and abbreviationsAPAP Agricultural Policy Action Plan
APP Annual Performance Plan
BFAP Bureau for Food and Agricultural Policy
BMR Bureau for Market Research
CAADP Comprehensive Africa Agriculture Development Programme
CASP Comprehensive Agricultural Support Programme
CESCR Committee on Economic Social and Cultural Rights
CPI Consumer Price Index
DAFF Department of Agriculture, Forestry and Fisheries
DBE Department of Basic Education
DoA Department of Agriculture
DoE Department of Education (currently DBE)
DoH Department of Health
DoRA Division of Revenue Act
DPME Department of Monitoring and Evaluation’s
DRDLR Department of Rural Development and Land Reform
DSD Department of Social Development
ECD Early Childhood Development
ECDoE Eastern Cape Department of Education
FAO
FFAP
Food and Agriculture Organisation
Food For All Programme
FEDSAS Federation of School Governing Bodies of South Africa
GDP Gross Domestic Production
GHS General Household Survey
HDDS Household Dietary Diversity Score
HFIAS Households Food Insecurity Access Scale
ICESCR International Covenant on Economic, Social and Cultural Rights
IES Income and Expenditure Survey
IFSS Integrated Food Security Strategy
INP Integrated Nutrition Programme
LDoE Limpopo Department of Education
MDGs Millennium Development Goals
MTEF Medium Term Expenditure Framework
NAMC National Agricultural Marketing Council

x The Right to Food in South Africa
NDP National Development Plan
NEPAD New Partnership for Africa’s Development
NFCS National Food Consumption Surveys
NIDS National Income Dynamic Survey
NRCS National Regulation Council of South Africa
NSNP National School Nutrition Programme
NSSF Norms and Standards For School Funding
PFMA Public Finance Management Act
PLAS Proactive Land Acquisition Strategy
PSC Public Service Commission
RECAP Recapitalisation and Development Programme
SABS South African Bureau of Standards
SAHRC South African Human Rights Commission
SANHANES-I South African National Health and Nutrition Examination Survey
SASA South African Schools Act
SAVAC South African Vulnerability Assessment Committee
SDGs Sustainable Development Goals
SER Socio-Economic Rights
SPII Studies in Poverty and Inequality Institute
StatsSA Statistics South Africa
UN United Nations
UNCCDUnited Nations Convention to Combat Desertification in Countries Experienc-ing Serious Drought and/or Desertification
UNESCO United Nations Educational and Scientific and Cultural Organisation
UNICEF United Nations Children’s Education Fund
VAS Vitamin A Supplementation
VAT Value Added Tax
WCDoE Western Cape Department of Education
WHO World Health Organisation
WWF World Wide Fund for Nature’s

xi
Preface and acknowledgementsStudies in Poverty and Inequality Institute (SPII) is an independent research think-tank that focuses on generating new knowledge, information and analysis in the field of poverty and inequality studies.
This working paper has been undertaken as part of the Socio-Economic Rights Monitoring Tool project conducted by SPII with the support of Ford Foundation and in partnership with the South African Human Rights Commission (SAHRC). The objective of this project, through the combination of policy and budget analysis and statistical indicators, is to provide a comprehensive framework and set of tools to monitor and guide the progressive realisation of socio-economic rights. This includes investigating the manner in which policy making to expand access to socio-economic rights in fact aligns with Constitutional obligations and jurisprudential guidance handed down by the Constitutional Court. This analysis of policy is complemented by an assessment of the resources directed towards the fulfilment of rights and the evaluation of indicators designed to assess realisation of rights over time. The project aims to provide useful tools for policy makers, those that exercise oversight over the executive, including Parliament, the DPME and Chapter Nine institutions (notably the SAHRC), public interest litigants, and broader civil society.
This working paper is written by Daniel McLaren, Busiso Moyo and Jared Jeffery. Case study contributions were also provided by Zukiswa Kota and Muhammad Zakaria Suleman. The paper also benefitted from the valuable assistance and inputs of Hannah Dawson, Caitlin Blaser and Chidimma Maureen Mbanefo.
The process of developing right to food indicators was made less cumbrous by the useful advice and comments we received. Thanks are particularly due to Sakiko Fukuda-Parr whose work on the development of an Economic and Social Rights Fulfilment Index (ESRF-I) assisted a great deal in framing the thinking on right to food indicators; Scott Drimie, director of the Southern African Food Lab whose insight and commentary was valuable; Prof. Luc D’Haese from the University of Stellenbosch/University of Antwerp, who advised us on comparing the available different food security datasets; as well as the numerous participants in brainstorming meetings and presentations that took place around the country.
This work is funded by the Ford Foundation whose funding contribution to this research is gratefully acknowledged. Additional support was also gratefully received from Oxfam in SA.
The objective of this project, through
the combination of policy and budget
analysis and statistical indicators, is to provide
a comprehensive framework and set of tools to monitor and guide the progressive
realisation of socio-economic rights.

xii The Right to Food in South Africa
ForewordFood insecurity is a form of deprivation and an outcome of vulnerability. This means that as with other forms of deprivation, individuals are more or less vulnerable to food insecurity due to increasing food prices, the changing structure of the food system, the resources that are available to them, and shocks that may undermine their incomes and assets. However, food insecurity should also be viewed as a dynamic and social construct rather than simply as a static and natural state. As such, food insecurity can be produced or perpetuated through deliberate actions, the way in which decisions over resource allocations are made, or simply through neglect.
This means that bringing about a reduction in food insecurity will imply conflict over scarce resources and competing needs. A human rights perspective can be used to shape the negotiations that must inevitably arise by providing some sense of the minimum norms that should be applied when making decisions. A human rights approach obliges governments to use their available resources to achieve rights objectives, even if this means introducing measures that imply the reallocation of government resources or broader forms of redistribution such as land reform, free basic education or universal cash grants.
This perspective is particularly important in the context of South Africa in which the enduring legacy of apartheid interacts with new forms of disadvantage and exclusion. As a consequence of this interaction, despite the significant changes that have taken place in the two decades since the first democratic elections - roughly one in five (or over 11 million people) South Africans experience food shortages and 8.4 million experience severe shortages on a regular basis. The experience of food insecurity ranges from starvation to chronic hunger and various forms of malnutrition. Studies undertaken in the former townships, new urban informal areas and former homelands reveal that there are pockets of extreme food insecurity related to high levels of unemployment, inadequate services, and constrained opportunities. Children are most at risk, and the impact of severe food insecurity in the first 1000 days of a child’s life can have a life-long negative impact that permanently affect both health and economic well-being.
The development of a Socio-Economic Rights Monitoring Tool and publication of this working paper is an important contribution toward addressing this deprivation. It provides a new resource for activists, researchers and policy-makers concerned with the reduction of food insecurity in South Africa.
- Julian May1, Director of the Centre of Excellence for Food Security,
University of the Western Cape
1 Professor Julian May is a trustee of the Studies in Poverty and Inequality Institute (SPII). His expertise lies in Applied Poverty Reduction. He obtained his doctoral degree in Development Studies from the University of the KwaZulu-Natal. He is a Research Associate at the Brooks World Poverty Institute, the International Food Policy Research Institute, the Department of Social Policy, Oxford University and the South African Labour and Development Research Unit, University of Cape Town.
This perspective is particularly important
in the context of South Africa in which the enduring legacy of apartheid interacts
with new forms of disadvantage and exclusion

xiii
Address by Nelson Rolihlahla Mandela on the occasion of the ANC’s Bill of Rights Conference, 1991.2
“A simple vote, without food, shelter and health care is to use first generation rights as a smokescreen to obscure the deep
underlying forces which dehumanise people. It is to create an appearance of equality and justice, which by implication socio-
economic inequality is entrenched. We do not want freedom without bread, nor do we want bread without freedom. We must provide for all the fundamental rights and freedoms
associated with a democratic society.”
CONSTITUTION OF THE REPUBLIC OF SOUTH AFRICA, 1996
CHAPTER 2
BILL OF RIGHTS
Section 27, Health care, food, water and social security
(1) Everyone has the right to have access to-
(b) sufficient food and water.
(2) The state must take reasonable legislative and other measures, within its available resources, to achieve the progressive realisation of each of these rights.
Section 28, Children
(1) Every child has the right-
(c) to basic nutrition, shelter, basic health care services and social services.
2 N.R Mandela ‘Address: On the occasion of the ANC’s Bill of Rights conference’ in A Bill of Rights for a Democratic South Africa: Papers and Report of a Conference Convened by the ANC Constitutional Committee, May 1991 (1991) 9 – 14 at 12.
We do not want freedom without
bread, nor do we want bread
without freedom.


1 Introduction
Introduction
1.1. Socio-economic rights and transformationThe inclusion of socio-economic rights in South Africa’s first democratic Constitution envisioned the reconstruction and transformation of a divided and unequal society: to heal the divisions of the past and establish a society based on democratic values, social justice, and fundamental human rights.3 However, unacceptable and unsustainable levels of poverty and inequality, compounded by widespread unemployment and a lack of access to basic services for many poor communities, continue to violate people’s rights and undermine our fledgling democracy. There have undoubtedly been many achievements in the twenty years since South Africa’s political transition; what is unclear, however, is the extent to which the social and economic transformation envisioned by the Constitution has been realised, or even if we are on the right track. Moreover, there remains little consensus within government or civil society on what such transformation would actually look like, how it should be measured, by whom, against what benchmarks, and over what period of time.
The justiciable socio-economic rights (SERs) guaranteed to everyone in South Africa include the rights to health, social security, housing, food, water, education and the environment. With the notable exception of the right to basic education, however, government’s obligation to fulfil these rights, as set down in the Constitution, is to take:
…reasonable legislative and other measures, within its available resources, to achieve the progressive realisation of each of these rights.4
While the Constitution provides an overarching framework and the ‘supreme law’5 governing the rights and duties of citizens, private enterprises and the state, it does not set out the content of these rights: what measures the state should take, how it should finance access to SERs, and the timeframes within which they must be realised. The challenge for policy-makers and oversight bodies alike is how best we are able to evaluate government programmes and budget allocations against these binding and competing Constitutional obligations if there is no methodology for monitoring and addressing critical issues relating to the progressive realisation of these rights.
1.2. Introducing the Socio-Economic Rights Monitoring Tool
It is for this reason that Studies in Poverty and Inequality Institute (SPII), in partnership with the South African Human Rights Commission, has developed a Socio-Economic Rights Monitoring Tool. The Tool uses a methodology for monitoring and evaluating the performance of government and the realisation of SERs that is based on a combination of policy (step 1) and budget (step 2) analysis, and the development of quantitative indicators for each of the rights (step 3). This involves unpacking the content of these rights and the obligations they impose on government, evaluating the extent to which government policies and budget allocations adequately address these obligations, and measuring the enjoyment of rights by people on the ground.
This Working Paper introduces our analysis of the content, policy effort, resource allocation and enjoyment of the constitutional right to food.
The application of our SER Monitoring Tool to the right to food has benefited from collaboration with a range of stakeholders, and provides a unique picture of the level of enjoyment of the right to food, and of the outcomes of government efforts to realise this right, twenty-one years into South Africa’s democracy. We identify areas of progress and regression, gaps and priority areas for action with the aim of guiding government in its obligations to fulfil the right to
3 Constitution of the Republic of South Africa, 1996, preamble. See: www.thepresidency.gov.za/docs/reports/annual/2008/preamble.pdf 4 Ibid, sec 27(b).5 Ibid, sec1(c).
CHAPTER
1
…reasonable legislative and other measures, within its available resources,
to achieve the progressive realisation of each of these rights.

2 The Right to Food in South Africa
food, while providing uniquely accessible information for progressive civil society to engage with. Our Policy Brief: Indicators for the Right to Food provides a snapshot of chapter 5 and is available at www.spii.org.za.
1.3. 3-step methodologySPII’s Socio-Economic Rights Monitoring Tool draws upon international best practice in human rights monitoring to create a unique methodology for SER monitoring relevant to the South African context. The 3-step model combines analyses of the socio-economic policy effort (step 1), the allocation and expenditure of resources for SERs (step 2), with the first two-steps laying the foundation upon which monitoring and evaluating of the actual enjoyment of rights on the ground through right-specific outcome indicators (step 3), can be assessed. This requires the development of performance and impact indicators relevant to the right in question that can be tracked and monitored over time.
Figure 1: The SER Monitoring Tool: 3-step methodology
Step 1: Policy Analysis
"The State must take reasonable
legislative and other measures"
• Assess the Policy E�ort• Constitutional obligations: reasonableness test• Content of SER policies & legislation and the constitutionality
of the policy - making process• Implementation challenges & accountability mechanisms
Step 2: Budget Analysis
"within available resources"
• Assess Resource Allocation & Expenditure• Generation of government revenue• Allocation & expenditure of resources on SERs• Budget cycle process
Step 3: Indicators" to achieve the
progressive realisation of
this right "
• Monitor and Evaluate Attainment of the Right• Access indicators (physical and economic) • Adequacy indicators• Quality indicators
1.4. Objectives of the Tool and end usersThe purpose of the SER Monitoring Tool goes beyond building a framework for the assessment of constitutional and human rights compliance, and aims to achieve specific objectives. These include, first, to clarify and unpack the content of SERs and the concomitant obligations they place on the state, and in so doing, to move the country towards greater consensus on what progressive realisation of socio-economic rights means and requires in South Africa. Second, to develop an efficient and useful method for monitoring and evaluating progress made in realising SERs to date and in the future, to create an evidence-base for socio-economic policy-making, advocacy initiatives and legal interventions. Third, to determine the extent to which organs of the state have respected, protected, promoted and fulfilled their obligations to rights-holders. This involves identifying achievements, deprivations, disparities, and regression to illuminate both causation and accountability in terms of policies, resources spent, implementation and institutional capacity. Lastly, the Tool seeks to make recommendations to broaden and accelerate the progressive – and ultimately universal – enjoyment of all SERs.
As the importance placed on stakeholder engagement in the process of developing indicators testifies, the Tool aims to support and be of practical use to a variety of actors, including: civil society, government and policy-makers, advisory and oversight bodies such as the DPME
The purpose of the SER Monitoring
Tool goes beyond building a framework
for the assessment of constitutional
and human rights compliance, and aims to achieve
specific objectives.

3 Introduction
and Chapter 9 institutions, especially the SAHRC, the judiciary and public interest lawyers, and academia.
For a detailed outline of the objectives of SPII’s 3-step methodology and anticipated use and users of the tool, please refer to SPII’s publication: ‘A Framework for Monitoring and Evaluating the Progressive Realisation of Socio-Economic Rights in South Africa’6 available at www.spii.org.za.
1.5. Bridging the gap: Citizen-Based Monitoring (CBM)The SER Monitoring Tool places emphasis on the importance of respecting and promoting human rights principles at all stages of the country’s development process. However, moving all actors towards thinking about how to develop roadmaps and timeframes for and by when to achieve universal access for all citizens can only go so far without inputs from the most vulnerable and marginalised within society. Thus far, the SER Monitoring Tool has emphasised quantitative measures that are well suited to mapping trends and patterns over time and SPII seeks to include citizen-based monitoring (CBM7) and other mechanisms for public participation as a way of verifying the actual enjoyment of the socio-economic rights in practice.8
SPII is currently considering how to incorporate and operationalize a CBM dimension to the SER Monitoring Tool. This is because, in addition to the reasons above, a bottom-up approach to monitoring the progressive realisation of SERs would provide a very effective mechanism for determining the relationship between individuals and groups with valid claims (right-holders) and the state and non-state actors with correlative obligations (duty-bearers). One of the main causes preventing the realisation of human rights is the failure of duty-bearers to fulfil their obligations combined with a lack of capacity among rights-holders to claim and exercise their rights effectively. Developing these capacities and improving the relationship between these two groups is a cross-cutting and crucial element of the human-rights-based approach to development chosen by post-apartheid South Africa.
1.6. Overview of the paperThe first task of human rights policy-making and monitoring is to define the content of the right in question. International norms and constitutional jurisprudence, among other sources, are used in Chapter 2 to guide an analysis of the content of the right to sufficient food in South Africa, while paying special attention to the right of children to basic nutrition. Notably, for children the principle of equal treatment and non-discrimination has been afforded special importance under section 28 of the Constitution in that children’s rights to basic nutrition are not subject to progressive realisation, unlike the right to sufficient food as set out in section 27. Two major competing paradigms for understanding the right to food are also addressed, namely Food Security and Food Sovereignty. The chapter then concludes with a summary of the state’s obligations with regard to the right to food.
Having established the content and obligations of the right to food, as well as the context in which efforts to realise the right to food are formulated and implemented in South Africa, the 3-step Monitoring Tool is then applied to evaluate government policies (chapter 3), programmes and budgets (chapter 4) and indicators, which track and measure enjoyment of the right to food over time (chapter 5).
Chapter 6 of the paper summarises and brings together the key findings of the policy, budget and indicator analysis and makes recommendations for how access to sufficient and nutritious food can be broadened and accelerated. The paper concludes with a call for people, the private sector, organised labour, civil society and government to organise and unite around these findings and recommendations in order to advance food security and food justice and move the country towards fulfilment of the right to food for all.
6 Dawson, Hannah & McLaren, Daniel. 2015. ‘A Framework for Monitoring and Evaluating the Progressive Realisation of Socio-Economic Rights in South Africa’. Studies in Poverty and Inequality Institute. Available at: http://spii.org.za/wp-content/uploads/2015/03/SPII-A-Framework-for-Monitoring-the-Progressive-Realisation-of-SERs-....pdf.
7 The SER Monitoring Tool is committed to ensuring that the tool meaningfully reflects the concerns, priorities and needs of people on the ground and is able to support and accommodate monitoring information from citizens and communities themselves. It is for this reason that the Tool has surveyed the existing organisations and their methodologies for community participation and monitoring, which the project aims to engage with going forward.
8 Dawson, Hannah. 2014. ‘Public participation and citizen-based monitoring in realising socio-economic rights’. Studies in Poverty and Inequality Institute, Policy Brief 7. Available at: http://spii.org.za/wp-content/uploads/2014/10/Policy-brief-7-Community-Monitoring-Report.pdf.
SPII is currently considering how
to incorporate and operationalize a CBM dimension to the SER
Monitoring Tool.

4 The Right to Food in South Africa
Establishing the content of the right to food and the obligations on the state
The idea of universal human rights, duties or needs can be traced through a wide range of religious, social and political thought, tradition and law that span several continents and date back over thousands of years. In modern times, human rights, particularly those recognised by the Universal Declaration of Human Rights, have come to be accepted by the majority of nations and cultures, if not always in deed, then at least in word. As important as declarations are in mainstreaming the promotion and protection of human rights, however, these rights must be given content if they are to have more than simply moral force. Yet the idea of a human right precludes purely formalistic, legal interpretations of content. This is because, even if no legislation or institutional arrangements exist to protect or promote a right, the right itself still remains valid and real. The content of human rights must therefore be drawn from a combination of ‘hard’ legal instruments (such as constitutions, laws and treaties) as well as from the guidance and standards set down by ‘softer’ authorities such as international interpretive bodies, legal and other scholars, and, wherever possible, the claims of rights-holders themselves.
After enduring centuries of colonialism and then apartheid – systems of government that were fundamentally opposed to the notion of universal human rights – South Africa has established a rights-based, constitutional democracy that has at times been at the forefront of global socio-economic rights jurisprudence and development. The content of rights and the obligations they impose on the state can be established from a range of sources. In relation to the right to food, these include:
� The provisions of the South African Constitution, and relevant jurisprudence;
� Policies and legislation designed to give effect to the right;
� The provisions of international and regional treaties ratified by South Africa;
� Recognised norms and standards set by, among others, the Committee on Economic, Social and Cultural Rights (CESCR); the Food and Agriculture Organisation (FAO) of the United Nations and the Special Rapporteur for the Right to Food; and the African Commission on Human and Peoples’ Rights.
A key argument of this paper is that more emphasis should be placed on providing substantive, enforceable content to SERs, particularly the right to food. This ‘operationalisation’ of SERs is necessary to establish what positive and negative freedoms and entitlements rights-holders have. This in turn establishes the parameters for government action and ensures that rights-holders have access to justice and meaningful remedies for infringements, violations, or lack of effective action in realising those rights.
In this chapter, the concepts of the right to food, food security, and food sovereignty will be introduced to give a broad understanding of the subject and context in which the content of the right to food must be framed. As the legislation, policy and jurisprudence for the right to food in South Africa remains weak, the chapter will then unpack the normative content of the right by drawing upon international and regional treaties, norms and standards relevant to the right to food. From here, the right to food provisions in the South African constitution will be set out, followed by an analysis of children’s immediate right to basic nutrition. A summary of the limited jurisprudence on the right to food in South Africa’s courts will then be provided. Building on all of these inputs, the chapter will conclude with a summary discussion on the content of the right to food in South Africa, and the obligations that this right places on the state.
2.1. The right to food, food security, and food sovereignty
Efforts at achieving the right to food have been guided by the concept of food security when addressing the issue of global hunger and poverty since the 1970s. However, over the past two
CHAPTER
2

5 Establishing the content of the right to food and the obligations on the state
decades, a movement has emerged that is calling for an alternative vision when dealing with world hunger and poverty – food sovereignty. This chapter begins with an analysis of these different concepts and what they mean for the progressive realisation of the right to food in the country.
2.1.1. The right to food and food securityThe dominant approach to the right to food both in South Africa and internationally is based on the multi-dimensional concept of food security. A key feature of this concept, now widely accepted, is that food security is not dependent solely on the availability of food. Food availability is a necessary but not a sufficient condition for ensuring a society/individual is food secure. Since Sen’s9 enlightening analysis of famine and its causes, we have known that food security in a country with available resources (modern agricultural production and/or means to import food), like South Africa, is primarily a function of entitlements and capabilities: the ability of an individual to access enough nutritious food and the physical capability (e.g. good health) to benefit from such access. This paradigm shift to entitlements and capabilities has in turn strengthened the cause of the rights-based approach to food security. This approach holds that a prerequisite for assuring access to food is to entrench the right in law and make it justiciable. The difficulty arises from the broad nature of food security, which cuts across the battle lines of inequality, unemployment, climate change, globalisation and commodity speculation, ownership of productive resources, and urbanisation, among others. The intersectional nature of food security also presents problems in defining precisely the content of the right to food and who is responsible for the provision of access to food. Providing content to the right remains essential however, as without content, rights-holders have no basis on which to make a claim against it.
Defining food security
The South African government in its National Food and Nutrition Security Policy follows the Food and Agriculture Organisation of the United Nations’ (FAO) lead in defining food security as:
‘Physical, social, and economic access to sufficient, safe, and nutritious food by all South Africans at all times to meet their dietary and food
preferences for an active and healthy life.’
9 Sen, A. 1981. ‘Poverty and Famines: An Essay on Entitlement and Deprivation’. OUP.
The dominant approach to the
right to food both in South Africa and
internationally is based on the multi-
dimensional concept of food security.
6 The Right to Food in South Africa
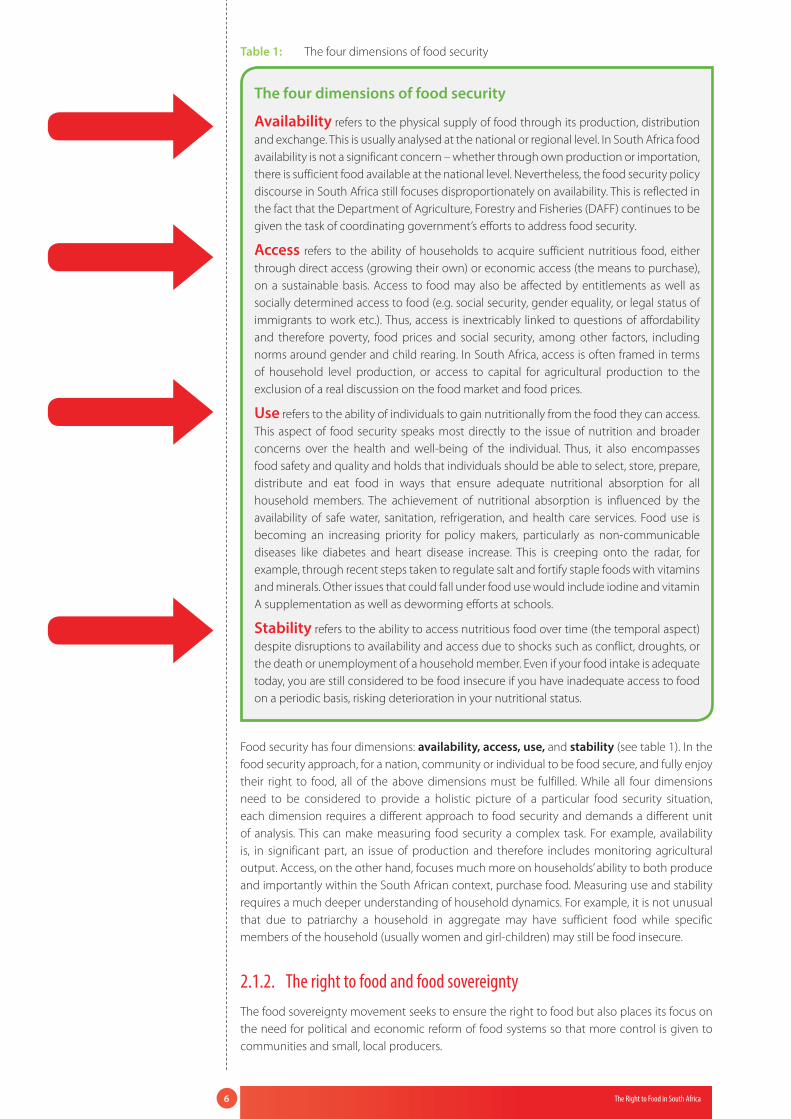
Table 1: The four dimensions of food security
The four dimensions of food security
Availability refers to the physical supply of food through its production, distribution and exchange. This is usually analysed at the national or regional level. In South Africa food availability is not a significant concern – whether through own production or importation, there is sufficient food available at the national level. Nevertheless, the food security policy discourse in South Africa still focuses disproportionately on availability. This is reflected in the fact that the Department of Agriculture, Forestry and Fisheries (DAFF) continues to be given the task of coordinating government’s efforts to address food security.
Access refers to the ability of households to acquire sufficient nutritious food, either through direct access (growing their own) or economic access (the means to purchase), on a sustainable basis. Access to food may also be affected by entitlements as well as socially determined access to food (e.g. social security, gender equality, or legal status of immigrants to work etc.). Thus, access is inextricably linked to questions of affordability and therefore poverty, food prices and social security, among other factors, including norms around gender and child rearing. In South Africa, access is often framed in terms of household level production, or access to capital for agricultural production to the exclusion of a real discussion on the food market and food prices.
Use refers to the ability of individuals to gain nutritionally from the food they can access. This aspect of food security speaks most directly to the issue of nutrition and broader concerns over the health and well-being of the individual. Thus, it also encompasses food safety and quality and holds that individuals should be able to select, store, prepare, distribute and eat food in ways that ensure adequate nutritional absorption for all household members. The achievement of nutritional absorption is influenced by the availability of safe water, sanitation, refrigeration, and health care services. Food use is becoming an increasing priority for policy makers, particularly as non-communicable diseases like diabetes and heart disease increase. This is creeping onto the radar, for example, through recent steps taken to regulate salt and fortify staple foods with vitamins and minerals. Other issues that could fall under food use would include iodine and vitamin A supplementation as well as deworming efforts at schools.
Stability refers to the ability to access nutritious food over time (the temporal aspect) despite disruptions to availability and access due to shocks such as conflict, droughts, or the death or unemployment of a household member. Even if your food intake is adequate today, you are still considered to be food insecure if you have inadequate access to food on a periodic basis, risking deterioration in your nutritional status.
Food security has four dimensions: availability, access, use, and stability (see table 1). In the food security approach, for a nation, community or individual to be food secure, and fully enjoy their right to food, all of the above dimensions must be fulfilled. While all four dimensions need to be considered to provide a holistic picture of a particular food security situation, each dimension requires a different approach to food security and demands a different unit of analysis. This can make measuring food security a complex task. For example, availability is, in significant part, an issue of production and therefore includes monitoring agricultural output. Access, on the other hand, focuses much more on households’ ability to both produce and importantly within the South African context, purchase food. Measuring use and stability requires a much deeper understanding of household dynamics. For example, it is not unusual that due to patriarchy a household in aggregate may have sufficient food while specific members of the household (usually women and girl-children) may still be food insecure.
2.1.2. The right to food and food sovereigntyThe food sovereignty movement seeks to ensure the right to food but also places its focus on the need for political and economic reform of food systems so that more control is given to communities and small, local producers.

7 Establishing the content of the right to food and the obligations on the state
The international food sovereignty movement, through its most established organisation - La Via Campesina10, focuses on the politics of food production, consumption, and distribution.11 The right to food, on this analysis, can only be sustainably guaranteed when the community has control over the food system that serves it, and on which they rely upon.
La Via Campesina (translation: “the Peasants’ Way”) defines food sovereignty as:
‘The right of peoples to healthy and culturally appropriate food produced through sustainable methods and their right to define their own food and agriculture systems. It develops a model of small-scale sustainable production benefiting communities and their environment. It puts the aspirations, needs and livelihoods of those who produce, distribute and consume food at the heart of food systems and policies rather than the demands of markets and corporations’.12
Food sovereignty can be viewed as a global movement to counter the neoliberal (free market) drive that has seen large corporations – using mono-culture production, genetically-modified organisms and patented seeds – become dominant in the global food industry in recent decades. In opposition to this trend, food sovereignty promotes food that is produced locally by small-holder farmers in harmony with the environment over food produced by environmentally and socially destructive large international corporations far removed from the communities that consume their products. La Via Campesina states that it is imperative that ‘the rights to use and manage lands, territories, water, seeds, livestock and biodiversity are in the hands of those who produce food and not of the corporate sector. Therefore the implementation of genuine agrarian reform is one of the top priorities of the farmer’s movement’.13 The idea of food sovereignty is thus founded upon the recognition that all rights are interrelated and interdependent, with lack of access to one (e.g. land) affecting access to others (e.g. food).
Food sovereignty as part of the ‘solidarity economy’The South African food sovereignty movement, spearheaded by the Cooperative and Policy Alternative Centre (COPAC) and the African Centre for Biosafety (ACB), places an additional emphasis on the need for a broader set of changes to the economy if the majority of South African’s are to be food secure. These changes form the basis for what COPAC calls the ‘solidarity economy alternative’. According to COPAC, ‘A crucial aspect to the solidarity economy is building institutions that help to create new patterns of production, consumption and living, that place human need at the centre. It therefore provides important institutions that help to build food sovereignty and social control over food, such as worker and producer cooperatives, cooperative grocers and community marketplaces, and so on.’14 While retaining some distinctive features, the solidarity economy approach is therefore broadly in line with the international movement’s focus on promoting community-level initiative and control over the food system.
The primary cause of inadequate access to sufficient and nutritious food, according to COPAC, is the structural crisis in the agri-food system (what it labels as the ‘agrarian-crisis’).15 Unlike most food security analyses, however, this crisis is seen as stemming from skewed control and ownership of the food system itself. This the movement sees as much more than simply a ‘market failure’: it is also a fundamental injustice. In a recent document released after a food sovereignty conference organised in Johannesburg in March 2015 by the Food Sovereignty Campaign (FSC), the movement indicated its rejection of a new National Food and Nutrition Security Policy recently released by the South African government by stating that:
We are not simply calling for technical solutions for households to access food as encapsulated in the governments’ recently proposed Food Security and
10 La Via Campesina comprises about 164 local and national organizations in 73 countries from Africa, Asia, Europe and the Americas. Altogether, it represents about 200 million farmers. It is an autonomous, pluralist and multicultural movement, independent from any political, economic or other type of affiliation. A group of farmers’ representatives – women and men- from the four continents founded La Via Campesina in 1993 in Mons, Belgium.
11 Patel, RC. 2012. Food Sovereignty: Power, Gender, and the Right to Food. PLoS Med 9(6): e1001223. doi:10.1371/journal.pmed.1001223.12 La Via Campesina. ‘The international peasant’s voice’. Available at: http://viacampesina.org/en/index.php/organisation-mainmenu-44.13 Ibid.14 COPAC. 2014. Discussion Paper: ‘The Right to Food and Food Sovereignty in South Africa: Challenges and Prospects’, 1-2. Available at: www.
copac.org.za/files/Final%20Discussion%20Paper.pdf.15 Ibid, p11.
The right of peoples to healthy and
culturally appropriate food produced
through sustainable methods and their
right to define their own food and agriculture systems.

8 The Right to Food in South Africa
Nutrition Policy and Implementation Plan. We reject the latter and instead are calling for the deep transformation of our food system by breaking the control of food corporations, repositioning the state to realise the Constitutional right to food as part of creating the conditions and space for the emergence of food sovereignty alternatives from below.16
Few would disagree that the right to food policies implemented in the post-apartheid era have failed to alter the structural imbalances in South Africa’s food system, or to eliminate hunger and malnutrition. This is not surprising to Food Sovereignty campaigners, who maintain that if no attempt is made to achieve the former, the latter will remain out of reach. Fresh thinking on how to achieve the right to food, such as that offered by the Food Sovereignty Campaign, should therefore be encouraged and welcomed. However, what has yet to be demonstrated in any detail at this stage is exactly how access to sufficient and nutritious food would increase as a result of shifts in the control of production, land, and agricultural methods. It therefore remains unclear why we should privilege the role of food producers in ensuring the right to food, nor is it clear that greater community control over the food system will lead to greater access to food for the poorest. While democratising the control and ownership of productive resources remains a fundamental issue in post-apartheid South Africa that must be addressed, the right to food in the South African context also requires that we do not lose focus on the equally important need for improved access to and use of food. Notably, the realisation of the right to food as framed in the South African Constitution involves two important components, namely sufficiency and accessibility. Both these elements are important in ensuring proper nutritional hygiene and dietary quality. In so far as sufficiency goes it has been opined that certain notions must be taken into account. In this regard, food must be culturally acceptable, sufficient for nutritional needs in both quantity and quality and more importantly food must be safe.
Food security and food sovereignty – not mutually exclusive approachesThe history of agricultural, rural and food systems reform in South Africa suggests that thinkers and practitioners of these two approaches (food security and food sovereignty) have much to learn from one another. In many ways, these approaches can be complementary and reinforcing. Moreover, collaboration between diverse groups and approaches is absolutely necessary if holistic and effective solutions to South Africa’s challenges in fulfilling the right to food are to be found. While the idea of ‘food security’ is likely to remain influential in policy-making circles, its analytical focus can be as broad or narrow as one wishes. Meanwhile, the South African Food Sovereignty Campaign is a nascent but growing movement that is undoubtedly gaining support from a range of constituencies, particularly community-based organisations and workers formations. While it may need to develop more capacity to undertake deeper analyses of the food situation in South Africa, in which questions of access to food might feature more prominently, at the time of writing, no other social movement is making the key issues around the right to food better known and more widely debated.
16 Food Sovereignty Campaign ‘Declaration of the South African Food Sovereignty Campaign & Alliance’ (2015) 2.

9 Establishing the content of the right to food and the obligations on the state
Summary: the right to food, food security and food sovereignty
� Putting the right to food into context requires an understanding of the unequal social and economic order that prevails in South Africa (and the world), and of the two dominant paradigms or approaches to problematizing, measuring and overcoming hunger and malnutrition, namely Food Security and Food Sovereignty.
� These overlapping approaches both seek to identify the root causes of hunger and malnutrition and the means to overcome them.
� The concept of food security has four dimensions: availability, access, use, and stability.
� The concept of food sovereignty arguably goes further than this by holding that the right to food can only be sustainably guaranteed when communities have control over the food systems that serve them, and which they rely upon.
� While a ‘food security’ approach to achieving the right to food does not preclude a focus on the impact of profit maximising activities and private ownership of food resources (such as seeds and productive land) on the right to food, the food sovereignty movement arose partly as a consequence of the failure of the food security approach to 1) meaningfully interrogate or challenge private power in world food systems, and 2) despite decades of rhetoric, to eliminate or significantly reduce hunger and malnutrition as a result.
2.2. The right to food in international and regional human rights law
As the right to food has yet to be legislated by government or substantively tested or developed in the South African courts, as will be shown below, international and regional treaties, norms and standards related to the right to food, especially those to which South Africa has committed itself, provide vital sources of law and guidance for unpacking the content of the right, as well as for interpreting and assessing the state’s fulfilment of its right to food obligations. Moreover, the South African constitution explicitly requires that courts and other adjudicative fora ‘must consider international law’ and ‘may consider foreign law’ when interpreting rights in the Bill of Rights.17 This section will look at the content and obligations of the right to food as they have been developed internationally and regionally through the following laws and authorities:
� International Covenant on Economic, Social and Cultural Rights (ICESCR)
� Optional Protocol to the ICESCR (OP-ICESCR)
� Voluntary Guidelines to support the progressive realization of the right to adequate food in the context of national food security, FAO
� UN Special Rapporteur on the Right to Food
� Convention on the Elimination of All Forms of Discrimination Against Women (CEDAW)
� Millennium Development Goals (MDGs) and Sustainable Development Goals (SDGs)
� Convention on the Rights of the Child (CRC)
� African Charter on Human and Peoples’ Rights (ACHPR)
� Protocol to the African Charter on Human and Peoples’ Rights on the Rights of Women in Africa
� African Charter on the Rights and Welfare of the Child
The human right to food received its first international enunciation in article 25.1 of the Universal Declaration of Human Rights (UDHR), which was passed by the United Nations
17 Constitution of the Republic of South Africa, sec 39(1)(b) and 39(1)(c).
... the South African constitution explicitly requires that courts
and other adjudicative fora ‘must consider
international law’ and ‘may consider foreign law’ when interpreting
rights in the Bill of Rights.

10 The Right to Food in South Africa
General Assembly in 1948. Since then it has been reaffirmed in various declarations and treaties at the international level, as the following timeline shows:
Figure 2: Global timeline of right to food commitments
1948 – Universal Declaration of Human Rights (UDHR) recognises the right to food as part of the right to an adequate standard of living.
Article 25: Everyone has the right to a standard of living adequate for the health and well-being of himself and of his family, including food, clothing, housing, medical care and necessary social services, and the right to security in the event of unemployment, sickness, disability, widowhood, old age or other lack of livelihood in circumstances beyond his control.
1974 – UN World Food Conference, The Universal Declaration on the Eradication of Hunger and Malnutrition:
Every man, woman and child has the inalienable right to be free from hunger and malnutrition in order to develop fully and maintain their physical and mental faculties.
1976 – International Covenant on Economic, Social and Cultural Rights (ICESCR) enters into force and builds upon the right to an adequate standard of living established in the UDHR, it recognises both the right to food and the right to be free from hunger:
Article 11.1: the right of everyone to an adequate standard of living for himself and his family, including adequate food.
Article 11.2: the fundamental right of everyone to be free from hunger.
1981 – African Charter on Human and Peoples’ Rights (ACHPR) adopted by the Organisation for African Unity, committing African states to ensuring the rights to life, health and the right to economic, social and cultural development.
1989 – Convention on the Rights of the Child (CRC) enters into force, obliges states:
… to care for children and to combat disease and malnutrition through, among others, the provision of adequate nutritious foods and nutritional support programmes.
1996 – The World Food Summit Plan of Action specifies actions that states must take to limit hunger and malnutrition, including the requirement that steps must be taken to clarify the content of the right to food and the right to be free from hunger.
1999 – UN Committee on Economic, Social and Cultural Rights (CESCR), General Comment 12 on ‘The Right to Adequate Food’, defines and describes in more detail the various state obligations to fulfil the right to food derived from the ICESCR.
2000 – Millennium Development Goals (MDGs) adopted by the UN General Assembly. Goal 1 is to eradicate extreme poverty and hunger by 2015.
2004 – The Right to Food Guidelines adopted by the Food and Agriculture Organisation of the United Nations, offer guidance to states on how to implement their obligations for the right to food. The drafting of the guidelines was initiated as a result of a 2002 World Food Summit.
2009 – Optional Protocol to the ICESCR adopted by the UN General Assembly, making the
right to food justiciable at the international level.
1940
1950
1960
1970
1980
1990
2000
2010

11 Establishing the content of the right to food and the obligations on the state
2.2.1. The right to adequate food in international human rights law
2.2.1.1. International Covenant on Economic, Social and Cultural Rights (ICESCR)
Each of the declarations, guidelines and treaties represented in this timeline signify important steps by the international community on the road to giving greater content and effect to the right to food.
The ICESCR entered into force in 1976 and is the preeminent international treaty for the protection and promotion of economic and social rights. South Africa ratified the Covenant in January 2015, joining 163 other nations committed to realising economic, social and cultural rights in terms of the Covenant across the globe. South Africa’s ratification was warmly welcomed by a cross-section of human rights defenders in and outside of government.18 The ICESCR is a particularly important treaty as its ratification by South Africa means that the government must comply with the obligations, goals and standards of the ICESCR and must not take any actions which infringe upon the spirit of the Covenant.19 By April 2017, the state must enact legislation which aligns government polices to the obligations it has undertaken in the Covenant, and domesticate its provisions into South African law.
Ratification of the Covenant makes the state subject to reporting procedures carried out by the UN Committee on Economic, Social and Cultural Rights (CESCR). The first state report on South Africa’s implementation of the treaty is also due by April 2017 and should detail how the state has domesticated and implemented the rights guaranteed by the Covenant. Thereafter, the state will need to submit reports to the committee on progress in realising those rights, including the right to food, every five years.20 These reporting requirements are a key accountability and transparency mechanism for ensuring compliance with the Covenant.
The right to adequate food and the right to be free from hungerTwo provisions in the ICESCR speak directly to the right to food. The first provides a right to adequate food, which must be realised progressively utilising the maximum available resources. The second provides a fundamental right to be free from hunger.
As a result of the special dual provision made for the right to food in the ICESCR, the right to food holds a unique, privileged status under international human rights law. This is because, freedom from hunger is the only right to have been qualified as fundamental in the Covenant. Therefore, while the right to adequate food enshrined in article 11.1 of the Covenant is, like the other rights in the treaty, subject to the overarching state obligation found in article 2.2, article 11.2 sets out further state obligations to ensure that everyone is free from hunger. The relevant provisions are as follows (bold emphasis added):
International Covenant on Economic, Social and Cultural Rights,Article 2:
1. Each State Party to the present Covenant undertakes to take steps, individually and through international assistance and cooperation, especially economic and technical, to the maximum of its available resources, with a view to achieving progressively the full realization of the rights recognized in the present Covenant by all appropriate means, including particularly the adoption of legislative measures.
Article 11:
1. The States Parties to the present Covenant recognize the right of everyone to an adequate standard of living for himself and his family, including adequate food, clothing and housing, and to the continuous improvement of living conditions. The States Parties will take appropriate steps to ensure
18 See, for example, McLaren, Daniel ‘Ratification of Human Rights Treaty Reaffirms SA’s Commitment to Socio-Economic Rights and Internationalism’ SACSIS 30 January 2015; and Dugard, Jackie and Benjamin, Mbekezeli. 2015. ‘Human rights “made whole”’, The New Age.
19 Petherbridge, D. 2012. ‘South Africa’s Pending Ratification of the International Covenant on Economic, Social and Cultural Rights: What are the implications?’, Paragraph 2. Available at: http://blogs.sun.ac.za/seraj/files/2012/11/South-Africas-pending-ratification-of-the-ICESCR.pdf.
20 Ibid.
Each of the declarations,
guidelines and treaties represented
in this timeline signify important steps by
the international community on the
road to giving greater content and effect to
the right to food.

12 The Right to Food in South Africa
the realization of this right, recognizing to this effect the essential importance of international cooperation based on free consent.
2. The States Parties to the present Covenant, recognizing the fundamental right of everyone to be free from hunger, shall take, individually and through international co-operation, the measures, including specific programmes, which are needed:
(a) To improve methods of production, conservation and distribution of food by making full use of technical and scientific knowledge, by disseminating knowledge of the principles of nutrition and by developing or reforming agrarian systems in such a way as to achieve the most efficient development and utilization of natural resources;
(b) Taking into account the problems of both food-importing and food-exporting countries, to ensure an equitable distribution of world food supplies in relation to need.
Freedom from hunger is therefore considered an absolute, unbreachable standard - a minimum level that must be secured for all people, regardless of the level of economic or other development within a given state. The CESCR produces ‘general comment’s’ on the provisions of the ICESCR from time to time in order to guide states in their obligations arising out of the Covenant. General Comment No. 12 on the Right to Adequate Food was produced by the CESCR in 1999.21 It reaffirms the importance of the dual provisions for both a right to adequate food and a right to be free from hunger, and develops in more detail the obligations imposed by the Covenant:
CESCR, General Comment No. 12: The Right to Adequate Food,
14. Every State is obliged to ensure for everyone under its jurisdiction access to the minimum essential food which is sufficient, nutritionally adequate and safe, to ensure their freedom from hunger.
15. The right to adequate food, like any other human right, imposes three types or levels of obligations on States parties: the obligations to respect, to protect and to fulfil. In turn, the obligation to fulfil incorporates both an obligation to facilitate and an obligation to provide. The obligation to respect existing access to adequate food requires States parties not to take any measures that result in preventing such access. The obligation to protect requires measures by the State to ensure that enterprises or individuals do not deprive individuals of their access to adequate food. The obligation to fulfil (facilitate) means the State must proactively engage in activities intended to strengthen people’s access to and utilization of resources and means to ensure their livelihood, including food security. Finally, whenever an individual or group is unable, for reasons beyond their control, to enjoy the right to adequate food by the means at their disposal, States have the obligation to fulfil (provide) that right directly. This obligation also applies for persons who are victims of natural or other disasters.
17. Violations of the Covenant occur when a State fails to ensure the satisfaction of, at the very least, the minimum essential level required to be free from hunger. In determining which actions or omissions amount to a violation of the right to food, it is important to distinguish the inability from the unwillingness of a State party to comply. Should a State party argue that resource constraints make it impossible to provide access to food for those who are unable by themselves to secure such access, the State has to demonstrate that every
21 Available at: www.refworld.org/docid/4538838c11.html.

13 Establishing the content of the right to food and the obligations on the state
effort has been made to use all the resources at its disposal in an effort to satisfy, as a matter of priority, those minimum obligations. This follows from article 2.1 of the Covenant, which obliges a State party to take the necessary steps to the maximum of its available resources, as previously pointed out by the Committee in its general comment No. 3, paragraph 10. A State claiming that it is unable to carry out its obligation for reasons beyond its control therefore has the burden of proving that this is the case and that it has unsuccessfully sought to obtain international support to ensure the availability and accessibility of the necessary food.
The obligation to ‘take steps … particularly the adoption of legislative measures’While allowing for discretion in approaches to tackling hunger and progressively realising the right to food, according to the particular context of each country, the CESCR recommends that a National Strategy (supported by framework legislation) to ensure food and nutrition security be adopted to fulfil the obligations set down by the Covenant. In General Comment 12, the Committee provides some minimum standards and recommendations for such a strategy. These include:
� The creation of appropriate institutional mechanisms to secure a representative process towards the formulation of a strategy, based on the human rights principles of transparency and public participation;
� A systematic identification of policy measures and activities relevant to the situation and context;
� The objectives of the strategy should be clearly defined, and appropriate, corresponding benchmarks and timelines, linked to measurable indicators, established for the achievement of those objectives;
� Develop an effective mechanism to measure the impact of legislative initiatives or policies on the right to food;
� Identify the resources available to meet the objectives and the most cost-effective way of utilising them;
� Define the obligations and roles of actors whose activities impact on the realisation of the right to food, including governmental, non-governmental and private actors;
� Based on these obligations and roles, ensure coordination both within and between the different branches of government and non-governmental actors;
� Any person or group who is a victim of a violation of the right to adequate food should have access to independent judicial or other appropriate remedies at both national and international levels;
� To ensure accountability for effective implementation, states should consider the adoption of a framework law as an effective instrument in the implementation of the national strategy.22
The obligation to use the ‘maximum of its available resources’The phrase in Article 2 of the ICESCR, ‘maximum available resources’, is very similar to the phrase which follows the right to food in the South African Constitution: ‘within available resources’. Both of these phrases are discussed in detail in the introduction to Chapter 4, in which a budget analysis of government’s right to food related programmes is undertaken. For now it is sufficient to note that the obligation to use ‘maximum available resources’ means that government must maximise the pool of resources available for it to dedicate to fulfilling the right to food, and use those resources in such a way that they will have maximum impact on the enjoyment of the right to food. Interestingly, there is no certainty as to what the impact of the above-mentioned obligations is on member states’ socio-economic policy frameworks.
22 Ibid, at paras 21-32.
While allowing for discretion in approaches to
tackling hunger and progressively
realising the right to food, according to
the particular context of each country, the CESCR recommends
that a National Strategy (supported by framework legislation)
to ensure food and nutrition security be adopted to fulfil the
obligations set down by the Covenant.

14 The Right to Food in South Africa
The obligation to ‘achieve progressively’The obligation to ‘achieve progressively’ the full realisation of the right to food is also found in both the ICESCR and the South African Constitution. The phrase has been interpreted to have two main components. The first requires that states ensure that enjoyment of the right to adequate food is consistently expanded over time, towards an end goal of universal, full enjoyment of the right. The second follows from the first, and requires that states do not take any retrogressive measures or backward steps which limit or decrease enjoyment of the right to food.
2.2.1.2. Optional Protocol to the ICESCR (OP-ICESCR)
In 2008, the CESCR adopted the Optional Protocol to the ICESCR (OP-ICESCR). The OP-ICESCR entered into force in 2013 and has been ratified by twenty states, including Cape Verde, Niger and Gabon from the African continent. The OP-ICESCR provides additional remedies for violations of rights enshrined in the ICESCR above and beyond the standard reporting mechanism for the Covenant. These include the option for the CESCR to investigate grave or systemic violations of SERs in member states as well as the option for citizens of member states to petition the CESCR for violations of their rights, if after exhausting domestic channels, they have not found recourse to a suitable remedy. This ‘complaints mechanism’ of the OP-ICESCR is similar (and in fact, largely based on) the ‘reasonableness standard’ of review for SERs adopted by South Africa’s Constitutional Court in Grootboom (on which, more below). Despite this synergy, and the recent ratification of the ICESCR by South Africa, government chose to delay its ratification of the Optional Protocol. Should South Africa choose to further empower its citizens through ratification of the OP-ICESCR, this would provide further avenues for citizens to claim and enforce their right to food.
2.2.1.3. Voluntary Guidelines to support the progressive realization of the right to adequate food in the context of national food security, FAO, 2004.
In drafting such legislation, in order to fulfil its international obligations, the South African government would benefit further from the guidance handed down by the Food and Agriculture Organisation of the United Nations (FAO). The Voluntary Guidelines to support the progressive realization of the right to adequate food in the context of national food security23 (Right to Adequate Food Guidelines), were inspired by the discussions and recommendations of the 2002 World Food Summit (in which South Africa participated) and adopted at the 127th Session of the FAO Council in 2004.
Paragraph 17 of the Guidelines summarizes the obligations of international human rights law in relation to the right to food:
Right to Adequate Food Guidelines, FAO,
17. States have obligations under international instruments relevant to the progressive realization of the right to adequate food. Notably, States Parties to the International Covenant on Economic, Social and Cultural Rights (ICESCR) have the obligation to respect, promote and protect and to take appropriate steps to achieve progressively the full realization of the right to adequate food. States Parties should respect existing access to adequate food by not taking any measures that result in preventing such access, and should protect the right of everyone to adequate food by taking steps so that enterprises and individuals do not deprive individuals of their access to adequate food. States Parties should promote policies intended to contribute to the progressive realization of people’s right to adequate food by proactively engaging in activities intended to strengthen people’s access to and utilization of resources and means to ensure their livelihood, including food security. States Parties should, to the extent that resources permit, establish and maintain safety nets or other assistance to protect those who are unable to provide for themselves.
23 Adopted by the 127th Session of the FAO Council, November 2004. Available at: www.fao.org/3/a-y7937e.pdf.
States have obligations under international
instruments relevant to the progressive
realization of the right to adequate food.
15 Establishing the content of the right to food and the obligations on the state
Thereafter, the FAO’s 19 Guidelines give further weight and content to the right to food provisions of the ICESCR across a range of food related issues, from food governance (Guideline 1), food markets (Guideline 4), food related resources such as land, water and genetic resources (Guideline 8), food safety (Guideline 9) and the budgetary components of fulfilling the right to food (Guideline 12).
2.2.1.4. UN Special Rapporteur on the Right to Food
The UN Special Rapporteur on the Right to Food, who is appointed by the UN Secretary General to promote and monitor states fulfilment of the right to food, has placed emphasis on the need for intergenerational justice in relation to food by incorporating a sustainability element that, though recognised by the CESCR, had been absent from previous definitions of the right. In this definition, ‘the right to food is the right of every individual, alone or in community with others, to have physical and economic access at all times to sufficient, adequate and culturally acceptable food that is produced and consumed sustainably, preserving access to food for future generations’.24 This sustainability aspect has not yet been addressed in much depth in South African literature on the right to food.
In his final report as UN Special Rapporteur on the Right to Food, ‘The Transformative Potential of the Right to Food’, Olivier De Schutter summarised three core avenues through which individuals access to food could be secured, and emphasised the importance of the nutrition (adequacy) component of the right in the ICESCR:
Individuals can secure access to food (a) by earning incomes from employment or self-employment; (b) through social transfers; or (c) by producing their own food, for those who have access to land and other productive resources. Through these channels, which often operate concurrently, each person should have access to a diet that “as a whole contains a mix of nutrients for physical and mental growth, development and maintenance, and physical activity that are in compliance with human physiological needs at all stages throughout the life cycle and according to gender and occupation”.25
2.2.1.5. Convention on the Elimination of All Forms of Discrimination Against Women (CEDAW)
South Africa has also ratified the Convention on the Elimination of All Discrimination against Women (CEDAW), which came into force in 1981. CEDAW was established out of a recognition among UN Member States that substantive equality between men and women remained elusive and that one of the dire effects of gender imbalances was that ‘in situations of poverty women have the least access to food, health, education, training and opportunities for employment and other needs’.26 CEDAW establishes further food-related obligations on states particularly in relation to pregnancy:
Convention on the Elimination of All Forms of Discrimination Against Women,Article 12(2)
States Parties shall ensure to women appropriate services in connection with pregnancy, confinement and the post-natal period, granting free services where necessary, as well as adequate nutrition during pregnancy and lactation.
2.2.1.6. Millennium Development Goals (MDGs) and Sustainable Development Goals (SDGs)
By September 2015, the UN’s Sustainable Development Goals (SDGs)27 should be finalised. These will replace the Millennium Development Goals (MDGs)28 that had sought to eradicate
24 Report of the Special Rapporteur on the right to food, Olivier De Schutter, 2014, ‘Final Report: The transformative potential of the right to food’ at para 2, drawing on paras 6-7 of CESCR, General Comment No. 12. Available at: www.srfood.org/images/stories/pdf/officialreports/20140310_finalreport_en.pdf.
25 Ibid at para at 11.26 CEDAW, Preamble. Available at: www.ohchr.org/Documents/ProfessionalInterest/cedaw.pdf.27 Available at: https://sustainabledevelopment.un.org/topics/sustainabledevelopmentgoals.28 Available at: www.un.org/millenniumgoals.
States Parties shall ensure to women
appropriate services in connection
with pregnancy, confinement and the
post-natal period, granting free services
where necessary, as well as adequate
nutrition during pregnancy and
lactation.

16 The Right to Food in South Africa
extreme poverty and hunger by 2015. The anticipated approach in the SDGs (whose target year for completion is 2030) is slightly different as food security has been separated from the goal to counter poverty. In the new formulation, Proposed SDG1 is to ‘End poverty in all its forms everywhere’, while Proposed SDG2 is to ‘end hunger, achieve food security and improved nutrition, and promote sustainable agriculture’.29 The logic behind this shift may be to pay more attention to food and nutrition goals as well as to ensure that targets are inclusive of developed countries, which also face rising levels of obesity and malnutrition.
2.2.1.7. Convention on the Rights of the Child (CRC)
The UN Convention on the Rights of the Child (CRC)30 is another important treaty which guarantees the right to food for children, and was ratified by South Africa in June 1995. In the CRC, children’s right to food is closely linked to the right to health:
Convention on the Rights of the Child,Article 24(2)
State parties shall ensure full implementation of this right [to health] and, in particular, shall take appropriate measures:
(c) To combat disease and malnutrition, including within the framework of primary 24(2)(c) health care, through, inter alia, the application of readily available technology and through the provision of adequate nutritious foods and clean drinking-water, taking into consideration the dangers and risks of environmental pollution;
(e) To ensure that all segments of society, in particular parents and children, are informed, have access to education and are supported in the use of basic knowledge of child health and nutrition.
The CRC also commits states to assist parents and caregivers in ensuring children’s good health and access to nutritious food:
Article 27(3)
States Parties, in accordance with national conditions and within their means, shall take appropriate measures to assist parents and others responsible for the child to implement this right and shall in case of need provide material assistance and support programmes, particularly with regard to nutrition, clothing and housing.
2.2.2. The right to food in African regional human rights law
2.2.2.1. African Charter on Human and Peoples’ Rights (ACHPR)
Several African instruments also exist to protect and promote the right to food. Foremost among these is the African Charter on Human and Peoples’ Rights (ACHPR),31 adopted by the Organisation for African Unity (now the African Union) in 1981, and ratified by South Africa in 1996.
The ACHPR does not refer explicitly to food or nutrition. However, the Principles and Guidelines on the Implementation of Economic, Social and Cultural Rights in the African Charter on Human and People’s Rights32 adopted by the African Commission on Human and Peoples’ Rights in 2011 (which overseas compliance with the Charter) states that ‘the right to food is inherent in the Charter’s protection of the rights to life, health and the right to economic, social and cultural
29 Full Report of the Open Working Group of the General Assembly on Sustainable Development Goals, UN Doc A/68/970. Available at: http://undocs.org/A/68/970.
30 Adopted and opened for signature, ratification and accession by G.A. Res 44/25 of 20 November 1989 (entry into force 2 September 1990). Available at: www.ohchr.org/EN/ProfessionalInterest/Pages/CRC.aspx.
31 Available at: www.achpr.org/files/instruments/achpr/banjul_charter.pdf.32 Available at: www.achpr.org/files/instruments/economic-social-cultural/achpr_instr_guide_draft_esc_rights_eng.pdf.
To ensure that all segments of society, in particular parents
and children, are informed, have access to education and are supported in the use of basic knowledge
of child health and nutrition.

17 Establishing the content of the right to food and the obligations on the state
development.’33 The Principles and Guidelines also establish ‘Minimum Core Obligations’ which states must abide by in discharging their right to food obligations under the African Charter:
Principles and Guidelines on the Implementation of Economic, Social and Cultural Rights in the African Charter on Human and People’s Rights,
Para 86The State has the following, among other, obligations to:
(a) Take the necessary action to guarantee the right of everyone to be free from hunger and to mitigate and alleviate hunger even in times of natural or other disasters;
(b) Refrain from and protect against destruction and/or contamination of food sources;
(c) Refrain from using access to food as a political tool to reward supporters, punish opponents or recruit militias;
(d) Develop national plans and policies to ensure food security, which includes constantly accessible and quality food that meets the requirements of nutrition and cultural acceptability.
2.2.2.2. Protocol to the African Charter on Human and Peoples’ Rights on the Rights of Women in Africa
In 2003 the African Commission adopted the Protocol to the African Charter on Human and Peoples’ Rights on the Rights of Women in Africa.34 Article 15 of the Protocol (which was ratified by South Africa in 2005) affirms women’s ‘right to food security’, stating:
Protocol on the Rights of Women in Africa,Article 15
States Parties shall ensure that women have the right to nutritious and adequate food. In this regard, they shall take appropriate measures to:
(a) provide women with access to clean drinking water, sources of domestic fuel, land, and the means of producing nutritious food;
(b) establish adequate systems of supply and storage to ensure food security.
2.2.2.3. African Charter on the Rights and Welfare of the Child
The African Charter on the Rights and Welfare of the Child,35 adopted in 1990 and ratified by South Africa in 2000, has similar provisions to the Convention on the Rights of the Child. Article 14(c) obligates States Parties ‘to ensure the provision of adequate nutrition’ while article 14(d) requires States to ‘combat disease and malnutrition’. Article 20(2)(a) also requires States to ‘take all appropriate measures to assist parents and other persons responsible for the child and in case of need, provide material assistance and support programmes particularly with regard to nutrition, health, education, clothing and housing’.
Most recently, at the African Union Summit of June 2014, Heads of State and Government adopted the Malabo Declaration, in which they commit to ending hunger and halving poverty by 2025.36
33 At para 83.34 Available at: www.achpr.org/files/instruments/women-protocol/achpr_instr_proto_women_eng.pdf.35 Available at: www.achpr.org/files/instruments/child/achpr_instr_charterchild_eng.pdf. 36 Available at: www.au.int/en/sites/default/files/Assembly%20AU%20Dec%20517%20-%20545%20(XXIII)%20_E_1.pdf.
Most recently, at the African Union Summit of June 2014, Heads of State and Government
adopted the Malabo Declaration, in which
they commit to ending hunger and halving
poverty by 2025.

18 The Right to Food in South Africa
Summary: international and regional right to food commitments
� South Africa has ratified and thus legally bound itself to a number of international and regional treaties and other instruments that recognise the right to food.
� These include the:
� International Covenant on Economic, Social and Cultural Rights (ICESCR)
� Convention on the Rights of the Child (CRC)
� African Charter on Human and Peoples’ Rights (ACHPR)
� Protocol to the African Charter on Human and Peoples’ Rights on the Rights of Women in Africa
� Under these treaties, South Africa is required to respect, protect and fulfil everyone’s right to food, as well as to ensure, at a minimum, that everyone is free from hunger.
� The obligation to respect existing access to adequate food requires the state not to take any measures that result in preventing such access. The obligation to protect requires measures by the state to ensure that enterprises or individuals do not deprive individuals of their access to adequate food. The obligation to fulfil means the state must proactively engage in activities intended to strengthen people’s access to and utilization of resources and means to ensure their livelihood, including food security.
� While States can, in limited circumstances, justify a failure to protect and fulfil the right to food by proving that they have taken reasonable steps to do so through the use of maximum available resources, no such excuse exists for a failure to respect peoples’ existing access to food.
� The right to food has been given substantive content at the international and regional levels through the issuance of guidance and comments by the bodies mandated to monitor and enforce these treaties, as well as by other authoritative sources such as the FAO, the UN Special Rapporteur on the Right to Food the UN Working Group on the SDGs, and the African Commission on Human and Peoples’ Rights.
� The principles established by these bodies should guide and give force to South Africa’s attempts to eradicate hunger and fulfil the right food.
� In relation to policy, under these treaties and guidance, South Africa must adopt a national strategy, through public participation, to ensure food and nutrition security for all.
� This strategy should be supported by framework legislation and be based on clearly defined, measurable objectives, the identification of available resources, and appropriate institutional mechanisms for implementation, including accountability for delivery.
� Independent judicial and other appropriate remedies must be available for individuals or groups whose right to food has been violated.
2.3. The right to food in the South African Constitution
There is a close synergy with the foundational values of the South African Constitution of human dignity, equality and freedom and the inclusion of economic, social and cultural rights as justiciable rights in the Bill of Rights. As former President Nelson Mandela said in explaining the inclusion of socio-economic rights in the Constitution:
A simple vote, without food, shelter and health care is to use first generation rights as a smokescreen to obscure the deep underlying forces which dehumanise people. It is to create an appearance of equality and justice,

19 Establishing the content of the right to food and the obligations on the state
which by implication socio-economic inequality is entrenched. We do not want freedom without bread, nor do we want bread without freedom. We must provide for all the fundamental rights and freedoms associated with a democratic society.37
2.3.1. ‘Everyone has the right to have access to sufficient food’South Africa is one of only 23 countries that explicitly recognise the right to food in a foundational document or Constitution, and one of only two with provisions that are justiciable38 (can be claimed by rights-holders and enforced by courts). The Constitution makes four provisions for the right to food from which the contours of the right can be established. The first two are found in Section 27 and Section 28 of the Bill of Rights:
Constitution of the Republic of South Africa,Section 27(1) Everyone has the right to have access to –
(b) sufficient food and water;
(2) The state must take reasonable legislative and other measures, within its available resources, to achieve the progressive realisation of each of these rights.
Section 28(1) Every child has the right –
(c) to basic nutrition, shelter, basic health care services and social services.
Section 27(2) is a very similar formulation of the States obligations to that found in Article 2 of the ICESCR, discussed above. However, unlike Section 27, the Constitution does not limit the states obligation to fulfil Section 28 (child) rights to ‘reasonable legislative and other measures’, ‘within available resources’, or ‘progressive realisation’.
The third constitutional provision is Section 35(2)(e), which guarantees adequate nutrition to all persons detained by the state. Section 25 deals with property rights in the context of the need for land reform. If access to land for agricultural purposes is considered an element of the right to food, this section is also indirectly relevant in setting out what the constitution provides for to ensure the right to food is realised.
These provisions must be read with Section 7 of the constitution, which also sets similar overarching obligations to that of the ICESCR:
Section 7
(2) The state must respect, protect, promote and fulfil the rights in the Bill of Rights39.
The states obligations to ensure rights in the Bill of Rights must also be guided by Section 9, which guarantees substantive equality for all, defined as ‘the full and equal enjoyment of all rights and freedoms’.40 In order to promote the achievement of substantive equality, the state must negotiate a balance between taking positive measures to advance persons, or categories of persons, disadvantaged by historical unfair discrimination while not unfairly discriminating through its actions against anyone on any ground, including race, gender, sex, religion or sexual orientation.
All rights and provisions in the Bill of Rights must also be understood in the context of the object and purpose of the constitution as a whole, which the Preamble to the Constitution states is to:
� Heal the divisions of the past and establish a society based on democratic values, social justice and fundamental human rights;
37 N.R Mandela ‘Address: On the occasion of the ANC’s Bill of Rights conference’ in A Bill of Rights for a Democratic South Africa: Papers and Report of a Conference Convened by the ANC Constitutional Committee, May 1991 (1991) 9 – 14 at 12.
38 Knuth, L and Vidar, M. 2011. ‘Constitutional and Legal Protection of the Right to Food.’ Food and Agricultural Organization of the United Nations. Available at: www.fao.org/docrep/016/ap554e/ap554e.pdf.
39 Constitution of the Republic of South Africa, 1996.40 Ibid.
Every child has the right to basic nutrition,
shelter, basic health care services and
social services.

20 The Right to Food in South Africa
� Lay the foundations for a democratic and open society in which government is based on the will of the people and every citizen is equally protected by law;
� Improve the quality of life of all citizens and free the potential of each person.
2.3.1.1. ‘Progressive realisation’ and the obligation to take ‘reasonable legislative and other measures’
As previously highlighted, the overarching obligations placed on the state to fulfil SERs by the South African Constitution (see Section 27(2) above) are very similar to those found in Article 2 of the ICESCR. The obligation in the ICESCR to ‘take steps … by all appropriate means, including particularly the adoption of legislative measures’ is formulated as an obligation to ‘take reasonable legislative and other measures’ in the SA Constitution. Similarly, the obligation to use ‘the maximum of its available resources’ in the ICESCR is formulated as an obligation to proceed ‘within available resources’ in the Constitution. Finally, the ICESCR requirement that states take steps ‘with a view to achieving progressively the full realization of the rights recognized in the present Covenant’ is identical to the Constitutional requirement that government ‘achieve the progressive realisation of each of these rights’.
While the CESCR has provided authoritative interpretations of the obligations found in the ICESCR, the Constitutional Court of South Africa has also given content and meaning to the SER obligations of the Constitution through the adjudication of a number of socio-economic rights cases which have been brought before it.41
In a ground-breaking case based on the Section 26 right of access to adequate housing, Government of the Republic of South Africa v. Irene Grootboom and others, the Court considered these obligations in detail. The Court found that the state’s housing policy was unconstitutional because it failed to make adequate provision for those in desperate need. However, it declined to indicate precisely how the state should remedy the unconstitutionality of its policies.42 This set an important precedent for the interpretation of SERs in South Africa. The Court, which drew upon the guidance and provisions of the ICESCR in parts of its judgement, affirmed the principle of progressive realisation and emphasised that it implied a recognition that the full realisation of SERs will generally not be achieved immediately or even within a short period of time. Justice Albie Sachs later wrote of the case:
In a unanimous judgment prepared by Justice Zak Yacoob, it was held that the key concept in the provisions on access to adequate housing was the obligation on the state to take “reasonable legislative and other measures” progressively to realise the right. We felt that the concept of reasonable measures was one capable of being adjudicated on by our court. If the measures failed to meet the standard of reasonableness then the state would be in breach of its constitutional obligations.43
As shown above, the term ‘reasonable’ qualifies the word ‘measures’ in both section 26 and section 27 of the constitution. In Grootboom, the Court found that in the context of SERs, this obligation of ‘reasonableness’ allows the legislature and the executive a margin of appreciation in deciding on the legislative and other measures that need to be taken in realising SERs. Similar reasoning can also be found in General Comment No.12 on the Right to Adequate Food produced by the CESCR, which states that ‘Every State will have a margin of discretion in choosing its own approaches … to ensure that everyone is free from hunger and as soon as possible can enjoy the right to adequate food.’44
The Court thus determined that it would not make prescriptions on exactly how the State should fulfil SERs. This determination meant that the court would also avoid giving substantive content to the right to adequate housing. Instead, the Court interpreted that the constitutional provisions for housing (reasonable legislative and other measures, within available resources, to achieve the progressive realisation of the right) empowered and required it to provide only general guidance on how the state should ensure access to the right. It therefore set down only
41 For a review of a selection of ground-breaking cases on SERs in South Africa, see Sandra Liebenberg. 2009. ‘South Africa’s evolving jurisprudence on socio-economic rights: An effective tool in challenging poverty?’ Refereed article for Law, Democracy and Development.
42 See: Government of the Republic of South Africa and Others v Grootboom and Others (1) SA 46 (CC). 2000 (I I) BCLR 1169 (CC).43 Ibid44 CESCR, General Comment No. 12: The Right to Adequate Food, at para 21.
In a unanimous judgment prepared
by Justice Zak Yacoob, it was held that the key concept in the
provisions on access to adequate housing
was the obligation on the state to take
“reasonable legislative and other measures”
progressively to realise the right.

21 Establishing the content of the right to food and the obligations on the state
general requirements that the state must meet in order for it to demonstrate constitutional compliance with SERs. In relation to ‘reasonable legislative and other measures’, these include the requirements that:
� Government move as expeditiously and effectively as possible towards meeting SERs, and (in line with international law);
� Deliberate retrogressive measures are not allowed.45
However, the constitutional obligation to ‘fulfil’ and progressively realise SERs means that the state is required to do far more than simply refrain from negatively violating SERs (such as by denying someone food or housing). Rather, it must take positive action to fulfil SERs for all. While the SERs of everyone must be fulfilled, the Constitutional Court found that governments SER policies and programmes must also recognise that:
� ‘The poor are particularly vulnerable and their needs require special attention.’46
� Therefore, the State has a duty to ‘plan, budget and monitor the fulfilment of immediate needs and the management of crises’.47
The Court found that the State must strike a ‘balance’ by devising programmes that cater to ‘short, medium and long-term needs’.48 This is important because, if the obligation of progressive realisation were to be interpreted as requiring the state only to devise programmes that promise to deliver SERs sometime in the future, this would severely limit the justiciability of SERs and thus the possibilities for people to hold the state accountable for delivery at any particular moment in time. Moreover, as Yacoob J correctly stated in the judgement:
The absence of this component [dealing with the circumstances of those in crisis] may have been acceptable if the nationwide housing programme would result in affordable houses for most people within a reasonably short time. However the scale of the problem is such that this simply cannot happen. […] The desperate will be consigned to their fate for the foreseeable future unless some temporary measures exist.49
Similarly (in terms of monitoring progress in realising SERs), the Court found that ‘It may not be sufficient to meet the test of reasonableness to show that the measures [adopted by the state] are capable of achieving a statistical advance in the realisation of the right … If the measures, though statistically successful, fail to respond to the needs of those most desperate, they may not pass the test.’50 The inclusion of a component in the states policy and budgetary effort dedicated to fulfilling the rights of those in desperate need is therefore a fundamental requirement of the Constitution.
The ‘reasonableness criteria’ established by Grootboom include the further requirements that:
� A co-ordinated state programme to fulfil a socio-economic right must be a comprehensive one determined by all three spheres of government in consultation with each other as contemplated by Chapter 3 of the Constitution;51
� There is a clear allocation of responsibilities and tasks to the different spheres of government;52
� Programmes are not haphazard but represent a systematic response to pressing social needs;53
� Policy-making must be transparent and the contents of policies (during and after formulation) must be made effectively known to the public;54
In terms of the requirement that right-specific legislation be enacted to give effect to SERs, the Court was less clear, stating that SERs ‘may also require framework legislation at national level’.55
45 Grootboom at para 46.46 Grootboom at para 36.47 Grootboom at para 68.48 Grootboom at para 43.49 Ibid at para 65.50 Ibid at para 44.51 Ibid at para 40.52 Ibid at para 39.53 Ibid at para 54.54 Ibid at para 49.55 Ibid at para 40.
The Court found that the State must strike a ‘balance’ by devising
programmes that cater to ‘short, medium and
long-term needs’

22 The Right to Food in South Africa
This question was not interrogated further in Grootboom because there was already national framework legislation in place to give effect to the right to housing. However, because the Constitution is quite clear that part of the States obligation to fulfil SERs is to take ‘reasonable legislative and other measures’, the enactment of legislation is generally regarded as a basic requirement imposed by all SERs.
2.3.1.2. ‘Within available resources’
In Grootboom, the Court also shied away from providing substantive guidance on the obligation to take measures ‘within available resources’. Following other notable SER cases, such as Soobramoney v Minister of Health (1998), the Court found that the obligation to take reasonable measures within available resources meant that, though ‘appropriate financial and human resources [must be made] available for SER policies and programmes’56, ‘the availability of resources is an important factor in determining what is reasonable.’57 The question of resource availability came up specifically only in relation to the Courts key finding that ‘the state must provide relief for those in desperate need’58, but even here Yacoob J stated only that ‘It is essential that a reasonable part of the national housing budget be devoted to this, but the precise allocation is for national government to decide in the first instance’.59
In the absence of further guidance by the Court on the meaning of the phrase ‘within available resources’, SPII’s SER Monitoring Tool has drawn on international legal norms and precedents, as well as the writings of well-known scholars and legal publicists, to determine much more specific budgetary obligations in respect of the right to food. These are elaborated in the introduction to Chapter 4 of this paper. For our present purposes it is sufficient to note that the constitutional provision of ‘within available resources’ is not seen to be fundamentally different from the provision in the ICESCR that requires the use of ‘maximum available resources’ in fulfilling SERs. Whether one is reading the constitutional or the international version of this obligation, both require the state to use all the resources that are available to it to realise SERs, and to justify to rights-holders if the resources allocated to SERs (collectively or individually) are limited, insufficient or not efficiently discharged and effectively utilised towards their goals.
Taking the ‘reasonableness test’ to the right to foodThe reasonableness review (or test) adopted by the Constitutional Court aims to balance the competing demands of providing effective oversight of the executive and developing the content of SERs to ensure that they are justiciable and operationalised for the majority of people, on the one hand, and respecting the separation of powers anticipated by the Constitution and the need for a ‘polycentric’60 review process for SERs, on the other. The approach favoured by the Court therefore leaves considerable room for the interpretation of SERs, room that Chapter 9 institutions such as the SAHRC, academics and CSOs have sought to fill with guidance of their own, as this paper attests. This is particularly true of the right to food, which hasn’t been substantively adjudicated on by the courts. There remains work to be done therefore to define exactly what ‘reasonable legislative and other measures’ would be in relation to the right to food, as well as what measures taken by the state could be considered as preventing access to this right. The summary of the State’s obligations provided by this chapter, can, however, act as a starting point for this important task.
Similarities between the ICESCR and the formulation of SERs in the South African ConstitutionThe formulation of economic and social rights in the ICESCR is broadly similar to the formulation of these rights in South Africa’s Constitution. South Africa has also aligned itself with the definition of the right to food adopted in General Comment No. 12 of the CESCR, that is: ‘the right to adequate food is realised when every man, woman and child, alone or in community
56 Ibid at para 39.57 Ibid at para 46.58 Ibid at para 66.59 Ibid at para 66.60 ‘The distinctive characteristic of polycentric review is a sharing of interpretive authority with the legislative and executive branches of
government and a consequent willingness by courts to respect constitutional interpretations by those branches that differ from their own.’ Brian Ray. 2009. ‘Polycentrism, Political Mobilization, and the Promise of Socioeconomic Rights’, 45 Stan. J. Int’l L. 153-154.

23 Establishing the content of the right to food and the obligations on the state
with others, has physical and economic access at all times to adequate food or means for its procurement’.61
However, as the following chapter will show, South Africa has not passed framework legislation since the adoption of the Constitution which gives effect to the right to food. Moreover, given the reported levels of hunger experienced in South Africa, namely, that one in four South Africans endure hunger pains62, right to food related policies do not go as far as the ICESCR in guaranteeing everyone the fundamental right to be free from hunger, and it is evident that policies are yet to meet the minimum requirements set out above. In domesticating the ICESCR by April 2017, then, the state must begin the process of drafting framework legalisation for the right to food, which adheres to international human rights law. Moreover, the framework legislation must not only guarantee that full realisation of the right to food will be achieved progressively, but that hunger itself will be eradicated within a reasonable period of time.
2.3.2. ‘Every child has the right to basic nutrition’While the state is under an obligation to take reasonable measures, within available resources, to progressively realise everyone’s right of access to sufficient food, the Constitution affords a further right to children (persons under the age of 18):
Section 28(1) Every child has the right –
(c) to basic nutrition, shelter, basic health care services and social services.
The inclusion of a specific section in the Constitution (Section 28) dedicated to the rights of children has engendered debate both within and outside the courts on the implications this has on the states obligations to fulfil SERs. On the face of it, the states obligation to fulfil the rights to basic nutrition, shelter, basic health care services and social services is not limited to the duty to take reasonable measures, within available resources, to progressively realise these rights. Moreover, the right to basic nutrition is not qualified by the term ‘access to’. This could imply that, unlike everyone’s right of access to sufficient food, children’s right to basic nutrition is immediately realisable and therefore immediately enforceable against the state. Further, the inclusion in the Constitution of a section dedicated to providing rights to children that are not limited by reasonable measures, within available resources, or progressive realisation, could be interpreted to mean that the Constitution requires the state to prioritise fulfilment of the rights of children in its policies and programmes.
The most authoritative take on these questions to-date was also provided by the Constitutional Court’s ruling in Grootboom. Here, as well as dealing with the states obligation to progressively realise access to housing, the court was asked to interpret the right of children to shelter. This included the question of whether this right placed further or different obligations on the state from everyone’s right of access to adequate housing. The Court found that, where parents or other carers are unable to provide shelter for their children, the state does not have an obligation to provide the requisite shelter on demand.63 This is because the term ‘housing’ in section 26 of the constitution is in fact synonymous with the term ‘shelter’ in section 28. The obligation to provide shelter to children could therefore not be disassociated or seen in isolation from the obligation to provide everyone with access to housing. Both rights are therefore subject to the implementation of reasonable measures, resource availability, and temporal constraints. Both rights would thus also be subject to the ‘reasonableness review’ when adjudicated upon by the Court.
While this reasoning sufficed in the case of Grootboom, Chirwa argues that, unlike ‘housing’ and ‘shelter’, the terms ‘food’ and ‘nutrition’ are not synonymous. A right of access to sufficient food is therefore different from a right to basic nutrition. This is because basic nutrition refers specifically to ‘the dietary variety and quality of food, in terms of its nutrient composition.’64 The right to basic nutrition thus entitles children only to ‘the minimum amount of food that is necessary to
61 Ibid.62 See: McLaren, D. 2015. ‘As World Food Day Approaches, One In Four South Africans Are Hungry’, SACSIS. Available at: http://sacsis.org.za/site/
article/2167 63 Grootboom, para 70.64 Chirwa, D.M. 2009. ‘Child poverty and children’s rights of access to food and basic nutrition in South Africa A contextual, jurisprudential and
policy analysis’. Socio-Economic Rights Project, Community Law Centre, University of the Western Cape, 20.
The inclusion of a specific section in the Constitution (Section 28) dedicated to the rights of children has engendered debate
both within and outside the courts on the implications
this has on the states obligations to
fulfil SERs

24 The Right to Food in South Africa
meet dietary requirements for their development, health and wellbeing.’65 The content of the right of access to sufficient food is actually much broader than this because it includes non-physical aspects of food (e.g. cultural, recreational, social, spiritual) and encompasses nutrition as a matter of course (through the food security concept of ‘use’ described above).66
Proudlock and Hall have also noted that children’s right to basic nutrition is not qualified as a right ‘of access to’ nutrition. This they interpret as meaning that, while access to sufficient food for everyone must be progressively realised, in its food-related programmes, the state ‘should prioritise the provision of basic nutrition to children.’67
Chirwa challenges this view, however, contending that:
…the word ‘access’ does not have any meaningful implications for understanding either the right to have access to sufficient nutrition or children’s right to basic nutrition. The idea that all rights entail the obligations to respect, protect, promote and fulfil has rendered the words ‘access to’ in the SERs provisions superfluous, as each of these rights, irrespective of whether they use ‘access to’ engenders these obligations. The manner in which the Constitutional Court was interpreting ‘access to’ [in the Grootboom case] simply mirrored the content of the duty to facilitate the realisation of a right, which is a mere aspect of the duty to fulfil.68
However, as noted above, the ‘reasonable test’ adopted by the Court in Grootboom included the criteria that policies and programmes include specifically tailored measures and programmes for the most vulnerable groups in society. Children are vulnerable by virtue of their dependency on their parents, carers and/or the state for their material and psycho-social wellbeing. Therefore, although children cannot demand the immediate fulfilment of their right to shelter or basic nutrition, they must be given special consideration in policies and programmes due to their status as a vulnerable group.69
Clearly, a key intervening factor between the state and its obligations to children is the role of parents. Parents generally have the primary obligation for ensuring the welfare of their children, but this is not absolute and does not mean that the state does not have obligations to children under parental care. The state has an obligation to assist parents with their responsibility to provide for their children (for example through the Child Support Grant). In cases of abuse and maltreatment, the state has a further obligation to protect and if necessary, provide direct and primary care and take custodianship of children. Similarly, where there are no parents, the state is obligated to provide directly for children and ensure that they enjoy all their rights. Thus, the welfare of children is not wholly the obligation of either their parents or the state but rather a shared (social) obligation that must be implemented ‘simultaneously at all times’.70
There are some instances where the state discharges its Section 28 obligations to children directly, bypassing the question of parents altogether. A good example is the National School Nutrition Programme, which is a direct intervention by the State to ensure school-going children’s right to basic nutrition.71
To simplify these complex, overlapping issues, Chirwa utilises Grootboom and the Convention on the Rights of the Child to summarise five obligations that arise from the ‘reasonableness test’ and the interplay between children’s dual right of access to sufficient food and to basic nutrition. These are:72
� To consider the needs of children adequately in general policies and to adopt specific policies concerning children;
� To identify priority areas for children and develop and implement policies to deal with them;
65 Ibid, 20.66 Ibid, 34.67 Proudlock, P & Hall, K. 2014. ‘Children’s Right to Food and Nutrition’ Children’s Institute, UCT.68 Chirwa, 2009, 19.69 Ibid, 24.70 Ibid, 23.71 Other examples include deworming and vitamin A supplementation programmes that improve the nutrition security of children through
initiatives administered by schools, as well as prenatal nutritional assistance to mothers and the promotion of breastfeeding.72 Chirwa, D.M. 2009. ‘Child poverty and children’s rights of access to food and basic nutrition in South Africa A contextual, jurisprudential and
policy analysis’. Socio-Economic Rights Project, Community Law Centre, University of the Western Cape, vi & p15.

25 Establishing the content of the right to food and the obligations on the state
� To protect the wellbeing of children in the face of calamities, emergencies and threats to their livelihoods;
� To prioritise children should competing interests with regard to resource allocation arise;
� If the state has the duty to prevent hunger and combat malnutrition, it also has an obligation to adopt programmes for the supplementary feeding of malnourished children.
Another important point raised by Chirwa is the fact that the state’s obligation to ensure the right of children to sufficient food and basic nutrition extends to pre-natal care for their mothers as their potential and future food security cannot be separated from this important developmental period.73 While mothers are covered by the right to food in general, they should also be afforded prioritisation in policies and programmes due to their influence and impact on children’s future wellbeing.
2.3.3. South African jurisprudence on the right to foodIn the 21 years of constitutional democracy in South Africa, there has been very limited jurisprudence involving the right to food. Contextually, three cases have dealt with the right, albeit in peripheral ways. Two of these cases had to do with upholding the rights of small-scale producers. In Kenneth George and Others vs. the Minister of Environmental Affairs and Tourism in 2007, artisanal fishers filed a case with the High Court after the enactment of a law on marine resources had the effect of stripping them of their access to the sea without providing for alternative fishing rights. This, they contended, constituted a violation of, inter alia, the states obligation to respect their right to food and to refrain from taking retrogressive measures in the pursuance of this right.74 The High Court ordered that the community’s access to the sea must be reinstated immediately and that a participatory process be established between government and fishing communities to draft a new law which would respect their fishing rights.75
Notably, in reference to socio-economic rights the case argued that the current legislative framework within the fisheries sector violates a number of other basic SERs, especially the right of access to sufficient food. For the claimants, the impact of this violation is felt by not only the fishers but by all members of their households and the extended community that depend on these livelihoods within the local marine and coastal economy. Moreover, the right to healthcare, housing and education, and the rights of the child to basic nutrition were also cited in the arguments presented to the Court as also being threatened by this violation.
The second relevant case, Wary Holdings vs. Stwalo, dealt with the legality of subdividing and selling land classified as ‘agricultural land’, and was heard in the Constitutional Court in 2008. While the judgment acknowledged that the government had a responsibility not to violate anyone’s right to food, it did not make an overt decision as to whether any particular approach to land ownership would do so. Instead it stated that:
As far as section 27(1)(b) of the Constitution specifically is concerned (the fundamental right of everyone to have access to sufficient food and water), the question is not whether large or small agricultural units are preferable for food production, a question debated during argument but on which there is no evidence before this Court. The questions are rather whether an interpretation which, as indicated in paragraph 81 above, accords a role to national government in the administration of ‘agricultural land’ through the provisions of the Agricultural Land Act, is one which would promote the spirit, purport and objects of the Bill of Rights or, if necessary, one which would better promote those considerations.76
The Court thus held that provisions of the Act complied with the Constitution, and that the purchase of the land in question was invalid, not because it affected anyone’s right to food,
73 Ibid 16.74 Kenneth George and Others v. Minister of Environmental Affairs & Tourism, 2007 (EC 1/05) Founding Affidavit by N. Jaffer at paras 94-96.75 Kenneth George and Others v. Minister of Environmental Affairs & Tourism, 2007 (EC 1/05) at paras 1-7, 10.76 Wary Holdings (Pty) Ltd v Stalwo (Pty) Ltd and Another (CCT78/07) [2008] ZACC 12; 2009 (1) SA 337 (CC); 2008 (11) BCLR 1123 (CC).
In the 21 years of constitutional
democracy in South Africa, there has
been very limited jurisprudence
involving the right to food.

26 The Right to Food in South Africa
however, but because the consent required of the Minister of Agriculture under the Act was not received.
A third relevant case followed a finding by the Competition Commission that three large bread producers (Pioneer Foods, Tiger Brands and Premier Foods) had illegally colluded to increase the price that consumers and distributors paid for bread.77 Following the Commission’s finding, some small-scale bread distributors wanted to put forward a lawsuit for the losses they suffered as a result of the producers’ uncompetitive behaviour. Both the Western Cape High Court and the Supreme Court of Appeal rejected the contention that a small distributor could bring a class action lawsuit against the companies. The Constitutional Court overturned these decisions.78 However, the class-action was admitted not on the basis that consumers’ right to food was infringed as a result of the anti-competitive behaviour of producers, but rather to allow business damages to be claimed by the bread distributors affected by the price collusion.
Although the right to food has been affirmed by various court’s in the above cases, considering the levels of hunger in the country, the right to food has been conspicuously absent from socio-economic rights litigation and jurisprudence during the first two decades of South Africa’s democracy. This is likely due to a range of reasons, including a lack of organised civil society mobilisation around the right to food and a corresponding lack of established policies and guidelines around the right to food, making it unclear what government delivery is aimed at and where it is falling short. Chapter 3 of this paper will detail how the fragmentation of responsibility and coordination for the right to food, a lack of accessible information on food-related policy and budget implementation, combined with the slow development of jurisprudence, make an assessment of progress, and accountability for (lack of ) progress in realising this right, extremely difficult for the layperson and public interest lawyers alike. The poor institutional framework for realising the right to food also means that it is unclear what remedy’s litigants could potentially seek for violations of their right to food. Potential solutions to these and other challenges in pursuing and litigating the right to food in South Africa will be discussed in Chapter 6 of this paper.
Summary: the right to food in the South African Constitution
� Section 27 of the Bill of Rights states that everyone has the right of access to sufficient food. The state is under an obligation to take reasonable legislative and other measures, within available resources, to achieve the progressive realisation of this right.
� In the socio-economic rights case Grootboom, the Constitutional Court outlined an approach to adjudicating on these obligations which became known as the ‘reasonableness review’.
� Section 28 guarantees children the right to basic nutrition. To fulfil this right, the state must pay special attention to children as a vulnerable group in its policies and programmes, for example, by including measures specially tailored for children.
� Section 35 states that all persons detained by the state have the right to adequate nutrition.
� The rights-based approach to development adopted by South Africa through its Constitution recognises the need to entrench the rights to sufficient food and basic nutrition in enforceable laws.
� Although the right to food has been upheld in South African courts, there is limited jurisprudence on the right to food in South Africa and the content of the right is not well defined.
77 Competition Commission v Pioneer Foods (Pty) Ltd (15/CR/Feb07, 50/CR/May08) [2010] ZACT 9,78 Mukaddam v Pioneer Foods Pty) Ltd and Others (CCT 131/12) [2013] ZACC 23; 2013 (5) SA 89 (CC); 2013 (10) BCLR 1135 (CC).

27 Establishing the content of the right to food and the obligations on the state
2.4. Summary of the state’s obligations to realise the right to sufficient food and basic nutrition
In establishing the content of the right to food and the obligations on the State to realise this right, this chapter has explored:
� The concepts of ‘food security’ and ‘food sovereignty’;
� The right to adequate food and the fundamental right to be free from hunger in international human rights law;
� The right to food in African regional human rights law;
� Guidance and recommendations provided by authoritative international and regional sources on the right to food;
� The right of access to sufficient food in the South African Constitution;
� The right of children to basic nutrition;
� Jurisprudence from the Constitutional Court on both SERs in general and the right to food specifically.
The multi-dimensionality of the right to food requires us to consider all of the above perspectives and contexts, and to find the most holistic approach possible towards ensuring this fundamental right for all. Unpacking the content of the right to food from the multitude of sources considered in this chapter allows us to begin that important process of developing a holistic understanding of the State’s obligations to ensure this right. These obligations can be broken down into two broad groups, that is, those relating to policy and those relating to budgeting. Within each of these groups, the following three sets of obligations can be determined:
� Overarching constitutional and human rights obligations
� Obligations to ensure everyone’s right to have access to sufficient food
� Obligations to ensure children’s right to basic nutrition
2.4.1. Policy obligations: reasonableness and progressive realisation
2.4.1.1. Overarching constitutional and human rights obligations
The obligations to respect, protect, promote and fulfil the right to foodInternational, regional and constitutional law provide four overarching obligations to realise the right to sufficient, nutritious food for all. These are the obligations to respect, protect, promote and fulfil the right to food. Under these overarching obligations, the State must:
� Respect existing availability and access to food by not taking any measures that result in reduced availability of food or the limitation of access to food.
� Protect people’s right to food by ensuring that enterprises or individuals do not deprive others of their access to food.
� Promote the right to food by defining the obligations of itself and private actors to ensure the right to food, and undertake public education on food and nutrition.
� Fulfil the right to food by ending hunger, ensuring universal access to sufficient, nutritious food for all people at all times. This requires taking positive, proactive measures and activities intended to strengthen people’s access to and utilisation of resources and the means to ensure their livelihood, included food security. Whenever an individual or group is unable to enjoy their right to food by means at their disposal, the state must provide for the right directly. This includes in situations of natural or other disasters.
The multi-dimensionality of the right to food requires us to consider all of
the above perspectives and contexts, and to find the most holistic
approach possible towards ensuring this
fundamental right for all.

28 The Right to Food in South Africa
The obligation of progressive realisation The State must ensure that enjoyment of the right to food is consistently expanded over time, towards an end goal of universal, full enjoyment of the right. The State must not take any retrogressive measures or backward steps which limit or decrease enjoyment of the right to food.
Persons detained by the StateAll persons detained by the State must be provided with adequate nutrition.
Non-discrimination and substantive equalityThe State must undertake its right to food obligations cognisant of the overarching constitutional requirement that substantive equality be promoted and achieved, that is, the full and equal enjoyment of all rights and freedoms. In order to promote the achievement of substantive equality, the state must negotiate a balance between taking positive measures to advance persons, or categories of persons, disadvantaged by historical unfair discrimination while not unfairly discriminating through its actions against anyone on any ground, including race, gender, sex, religion or sexual orientation.
2.4.1.2. Obligations to ensure everyone’s right to have access to sufficient food
Obligations of process � The State must create appropriate institutional mechanisms to secure a representative
policy-making process, based on the human rights principles of transparency and public participation, including by rights-holders and those most affected by food poverty and injustice.
� This process should include a systematic identification of policy measures and activities the State will take to fulfil the right to food, in collaboration with third-parties where possible and useful, relevant to the situation and context.
� There must be participation by all relevant stakeholders throughout the implementation (as well as the formulation) of right to food policies, if they are to continue to reflect the needs and benefit from the involvement of rights-holders, especially those most vulnerable to food insecurity.
Obligations relating to governance and institutional responsibilityEffective governance and institutional coordination and responsibility is required to ensure the implementation of the right to food. The State must:
� Define the obligations of itself and private actors to fulfil the right to food;
� Set targets with measurable indicators to track progress, and determine the timeframe within which these objectives should be met;
� Ensure effective mechanisms are in place to measure the impact of initiatives on these indicators, which can be used to evaluate progress towards universal enjoyment of the right;
� Run effective monitoring systems that indicate whether policies and legislation are successful in ensuring progressive realisation of the right over time;
� Establish further monitoring systems to detect and identify threats to the people’s enjoyment of the right to food;
� Ensure efficient coordination between relevant ministries and levels of government;
� The obligations and roles of non-state actors whose activities impact on the realisation of the right to food should also be defined and their participation in the realisation of the right promoted and facilitated;
� Food must never be used as a political tool or to reward supporters, or punish opponents.

29 Establishing the content of the right to food and the obligations on the state
Obligations to ensure accountability and remedies – the need for framework legislation � To support the implementation of policy and ensure accountability, the State should
enact framework legislation for the right to food;
� Establish clear lines of accountability to ensure that responsibilities are clearly allocated and precise timeframes for the realization of the dimensions of the right to food are set;
� The objectives of the policy/legislation should be clearly defined and appropriate, corresponding benchmarks and timelines, linked to measurable indicators, established for the achievement of those objectives;
� Objectives must include the aim to achieve the full realisation of the right to food progressively, as well as the aim to eradicate hunger itself within a reasonable period of time;
� Effective and reliable mechanisms should be established to measure the impact of legislative initiatives or policies on the right to food;
� The State must provide access to independent judicial and other appropriate remedies for persons or groups experiencing violations of the right to food;
� If the State does not meet the objectives of its food policy/strategy, or claims that it is unable to fulfil one or more of its right to food obligations, it has the burden of explaining why and/or proving that this is the case and that is has unsuccessfully sought to obtain the resources and capacity required to fulfil these duties.
Policies should be designed to ensure the four dimensions of food security:
Availability
The State must ensure that a sufficient supply of food is available for all people to meet their minimum dietary needs, at both the national and local levels. This will require monitoring the national supply of food and its distribution across the country. Effective institutional mechanisms should be in place to increase production or re-direct distribution if necessary (such as in the event of a disruption to supply). Where the national or local supply of food is insufficient to fulfil peoples’ food needs, the State must invest in and facilitate improved agricultural production and distribution.
Access
The state must ensure that communities, households and individuals have physical access either to the food they produce themselves or the food available on the market, as well as economic access – the means and ability to purchase the food that is available. This will require monitoring and where necessary regulating food prices to ensure economic access for the poorest people, and taking action against arbitrary or irregular increases in prices and to facilitate and incentivise the distribution of food by the private sector to hard-to-reach areas. In so doing taking direct action in areas where food is not easily available. This includes special measures in policies for vulnerable groups such as the disabled, elderly and children to ensure their physical and economic access to sufficient food. In no case shall the government arbitrarily limit or deprive individuals of their existing access to food.
Use
The State must promote good nutrition through public education to ensure a high level of knowledge about the appropriate, healthy utilisation and consumption of food; ensure that food within the country is safe and of a high quality to ensure that people benefit from it; and, ensure access to safe water and sanitation to facilitate healthy utilisation of food. It must also effectively regulate the availability of high-fat and high-sugar foods. In public health and education facilities, ensure food provided directly by the state is of a high nutritional content. Fortify certain foodstuffs with vitamins where necessary.
The State must ensure that a sufficient supply
of food is available for all people to
meet their minimum dietary needs, at
both the national and local levels.

30 The Right to Food in South Africa
Stability
The State must ensure that the supply of food and people’s access to it is stable over time and monitor the supply of food and have effective institutional mechanisms in place to ensure access to sufficient food in cases where there is a disruption to supply.
Policies should engage with the following issues raised by the food sovereignty movement
� Small-scale producers should be assisted to benefit from supply and value chains, and should be favoured wherever possible by government procurement processes;
� The State should investigate with a view to regulating the current private monopolies on seeds to ensure greater ownership and access to quality seeds on more favourable terms for small-holder farmers;
� Access to productive land for historically marginalised people must be facilitated and measures undertaken to protect local environments and ensure their sustainability for local farmers;
� Cooperative farmers associations should be supported and promoted;
� Review the impact of monopolies and oligopolies within the food system and the role of large corporations, including retailers, in the food value chain, with a view to improving the efficiency of the system and ensuring the needs of small producers are fulfilled rather than neglected;
� Agrarian systems should be reformed in such a way as to achieve the most efficient development and utilization of natural resources to meet the needs of small-scale farmers, vulnerable groups, and the public at large.
Obligations to regulate the actions of private individuals and enterprises � The State must protect rights-holders against localised violations of the right to food
such as farm owners who deny labour tenants and farm workers rightful access to grazing and crop land and water for production;
� The obligation to protect includes effective regulation of the private sector to ensure that basic foodstuffs are not beyond the reach of vulnerable people. The State must actively combat and punish fraud, unethical and predatory contractual and other behaviour by private actors in the food market, including in the marketing of food, as well as ensure the safety of food made available for public consumption. This will include punitive actions against private entities that produce unsafe products or engage in the dumping of hazardous goods;
� The State must be prepared to regulate food prices where necessary to ensure that basic foodstuffs are not inflated out of the reach of vulnerable groups.
2.4.1.3. Obligations to ensure children’s right to basic nutrition
� The State must undertake measures specifically tailored to advance vulnerable, marginalised, and historically disadvantaged groups and individuals, including women, children and the disabled;
� Whenever a vulnerable individual or a group is unable to enjoy the right to food by the means at their disposal, the State also has an obligation to fulfil the right immediately for those in desperate need. This is especially so when it comes to emergency situations, such as man-made or natural disasters, whether at the household, community or national levels;
� A needs assessment of vulnerable children should be conducted which enables the State to ensure that all children have access to adequate, nutritious foods. Where this need is unfulfilled, or at risk of being unfulfilled, the State must step-in to provide it directly;
� Programmes must be adopted for the supplementary feeding of malnourished children;

31 Establishing the content of the right to food and the obligations on the state
� Providing basic nutrition to children means providing ‘the minimum amount of food that is necessary to meet dietary requirements for [children’s] development, health and wellbeing.’79
� All segments of society, in particular parents and children, must be informed, have access to education and be supported in the use of basic knowledge of child health and nutrition;
� The State must take appropriate measures to assist parents and others responsible for the child to implement this right and shall in case of need provide material assistance and support programmes, particularly with regard to nutrition;
� Pregnant women and mothers should also be afforded prioritisation in policies and programmes due to their influence and impact on children’s future wellbeing.
2.4.2. Budgetary obligations: within available resources
2.4.2.1. Overarching constitutional and human rights obligations80
� The State must maximise the resources available to it for fulfilling the right to food;
� Once the maximum available resources have been generated and allocated to right to food policies and programmes, these resources must be utilised in such a way that they will have maximum impact on the enjoyment of the right to food;
� Actors allocated resources for right to food programmes and initiatives must endeavour to spend the maximum budget available to them, with any under-expenditure reasonably justified. Actors must not spend more than has been allocated to them.
2.4.2.2. Obligations to ensure everyone’s right to have access to sufficient food
� Identify the resources available to meet the objectives of food policies and programmes and the most cost-effective way of utilising them.
2.4.2.3. Obligations to ensure children’s right to basic nutrition
� Appropriate resources must be allocated to ensure the components of food legislation and policy directed at children are fully implemented;
� Children must be prioritised should competing interests with regard to resource allocation arise.
79 Chirwa. 2009. Op Cit, p20.80 Important to note is that social protection also plays a crucial role in the realisation of socio-economic rights. Emphasis must be placed
on the fact that the right to social security and the right to food are complementary and interdependent human rights. Social protection programs have a crucial impact in ensuring access to food, decent health care and education – in other words, all basic human rights that lead to an adequate standard of living.
The State must take appropriate measures to assist parents and
others responsible for the child to implement
this right and shall in case of need provide
material assistance and support programmes,
particularly with regard to nutrition.

32 The Right to Food in South Africa
Policy analysis: Assessing the reasonableness of policies and programmes to ensure the right to food
Step 1: Policy Analysis
"The State must take reasonable legislative and other measures"
• Assess the Policy E�ort• Constitutional obligations: reasonableness test• Content of SER policies & legislation and constitutionality of policy - making process
• Implementation challenges & accountability mechanisms
Step 2: Budget Analysis
"within available resources"
• Assess Resource Allocation & Expenditure• Generation of government revenue• Allocation & expenditure of resources on SERs• Budget cycle process
Step 3: Indicators"to achieve the
progressive realisation of this
right""
• Monitor and Evaluate Attainment of the Right• Access indicators (physical and economic) • Adequacy indicators• Quality indicators
In this chapter, we turn to government policies and programmes aimed at ensuring the right to food. This is the first step in the three-step approach to monitoring the progressive realisation of the right to food (see diagram above). First, we will look at how government’s approach to food security policy has evolved. Thereafter, we will turn to the institutions involved and run through the most important programmes in place that have a direct bearing on the right to food.
The chapter sketches out the various government-led initiatives related to food security and explores several areas of institutional responsibility to bring gaps into view. A key finding is that, despite widespread hunger and food insecurity, there has not been sufficient, coordinated effort by government around the right to food to ensure its realisation. Moreover, the policies that do exist have suffered from an implementation process that has failed to match government’s commitments to address food security, especially in terms of scope and high level support and accountability.
In order to do so, the chapter will assess the development of right to food related policy since 1994 in light of the international, regional, and national obligations and jurisprudence guiding the realisation of the right to food explored in the previous chapter. This will include both a summary of the development of legislation as well as a discussion of how government’s approach has evolved over the course of the first two decades of democracy. Five government initiatives will be summarised, unpacking certain departmental responsibilities and competencies related to the right to food, which will allow for a concluding discussion on where gaps lie in government effectively addressing the right to food. An analysis of the resources allocated to these programmes and a more in-depth evaluation of their performance will then be undertaken in the following chapter.
While South Africa’s policy response to socio-economic rights has generally been robust, the right to food has effectively been left behind. This is most evident in the fact that it remains the only SER not to have been legislated. This is for a range of reasons but in no small part because
CHAPTER
3

33 Policy analysis: Assessing the reasonableness of policies and programmes to ensure the right to food
its fulfilment is linked to a wide range of economic, trade, agricultural and social protection policies, and it cannot be met through a specific sectoral intervention.
Even in rural areas, most households are deficit food producers and therefore consume more food than they produce. This is evidence that food security is largely about the ability of households to purchase food and linked more to employment and social protection policies than agriculture. In spite of this, South Africa’s policies around food security have focused strongly on production. Government ‘still equates food security with national food security – and agricultural output in particular – rather than with household food security, suggesting that its residual institutional memory remains intact’.81
The desirability of a framework law on the right to food has been mentioned in many places: most recently in governments own National Food and Nutrition Security Policy (2013), but also over a decade earlier. A framework law has been described as a ‘flexible instrument that focuses systematically on the realisation of the right to food’.82 The process of developing such a law would ‘generate and/or strengthen the actors and monitoring mechanisms that will ensure that a framework law, once adopted, will be implemented’.83 Concrete steps to develop such a law have not yet taken place.
3.1. Chronological summary of right to food related policy development
Certain key legislation relevant to the right to food, particularly around food safety, was enacted prior to 1994 and is still in force. However, a range of policies have been developed subsequently, including policies which are explicitly directed at realising the right to food, and those which impact on it, such as through micronutrient supplementation or the provision of social grants. This chronology illustrates two things: the first is the continuing agricultural nature of the food security discussion; the second is the general lack of legislation providing for the right to food. Since it falls outside of any single departmental capability, legislation has generally been narrowly linked to the work of specific departments, for example the Department of Health, through its vitamin A supplementation programme.
A National Food and Nutrition Security policy was released in 2013, which was an important step to follow up on the largely moribund Integrated Food Security Strategy that had been in place since 2002. The new policy does provide some new thinking and guidance on government work around food security. As previously highlighted, no dedicated legislation exists to give effect to the right to food. The coordination of a Food Security Bill is one of the strategic interventions covered in the Department of Agriculture’s current strategic plan,84 though there have been references to planned legislation over the years that have not materialised.
Table 2: Evolution of policy and legislation around the right to food
Year Policy/legislation Focus
Government department / organisation
1972 Regulations in terms of the Foodstuffs, Cosmetics and Disinfectants Act No 54. While potentially out of date, this piece of legislation remains particularly relevant to food security discussions in South Africa. While the right to food debate usually centres very heavily on production, storage and food safety also feature, and this piece of legislation remains key.
Food safety Legal
81 Scott Drimie & Shaun Ruysenaar. 2010. The Integrated Food Security Strategy of South Africa: An institutional analysis, Agrekon: Agricultural Economics Research, Policy and Practice in Southern Africa, 49:3, 316-337. Available at: http://dx.doi.org/10.1080/03031853.2010.503377
82 Künnemann, R., Yakpo, K., Pabst, S., and Wolpold-Bosien, M. 2003. ‘Implementing the Right to Food in South Africa: From Legislative Framework to Framework Legislation’, FIAN International Working Paper, Right to Food Seminar Johannesburg, 7 and 8 March 2003, http://www.sahrc.org.za/home/21/files/Reports/5th_esr_food.pdf Accessed 4 August, 2014.
83 Ibid84 National Department of Agriculture, ‘Strategic Plan 2012-2016’. Available at www.nda.agric.za/doaDev/topMenu/StratPlan201213-201617.pdf.
Certain key legislation relevant to the right to food, particularly around food safety, was enacted prior to 1994 and is still
in force.

34 The Right to Food in South Africa
Year Policy/legislation Focus
Government department / organisation
1992 Kassier Committee of Inquiry on agricultural control schemes. The report of this committee was crucial in deregulating the agricultural market.
Agriculture Formal inquiry
1993 ANC Policy Brief on Food Security and Food Policy This paved the way for the ANC’s understanding and definition of food security, which has changed little in the subsequent years.
Food security (production and land redistribution, with some mention of economic access and markets)
ANC
1994 The Reconstruction and Development Programme (RDP), identified food security as a basic human need and mainstreamed food security as a priority policy objective.
Department of Agriculture and Land Affairs established the Food Security Working Group (FSWG). This was established in part due to the World Food Summit, where the working group developed a country position paper. However, the group then remained in place to establish the foundation of a food security policy.
Food security centred on production, rural development and access to land.
Food security (broad scope)
Multi-sectoral
Department of Agriculture and Land Affairs
1995 Amendment to Act 54 by the Department of Health, mandated iodation of food grade salt to combat the high prevalence of iodine deficiency among children. Subsequently, iodine deficiency disorder has been virtually eradicated.85
Nutrition supplementation
Department of Health (legislation)
1997 Department of Agriculture’s Discussion Document on Food Security. This also came out of the energy generated by the World Food Summit. This document strongly reflects the location of its writing, within the Department of Agriculture, and largely failed to integrate the more political dimensions of food security that emerged from the Food Summit.
Food security (production)
Department of Agriculture
2000 Department of Health introduces vitamin A supplementation programme. This was developed to address high levels of vitamin A deficiency, particularly in children, and will be discussed in more detail later in this chapter.
Nutrition supplementation
Department of Health
85 Jooste, Peter. ‘Solving Iodine Deficiency in South Africa: so near - and yet so far. Medical Research Policy Brief 2, 2000. Available at www.mrc.ac.za/policybriefs/2polbrief2000.htm.

35 Policy analysis: Assessing the reasonableness of policies and programmes to ensure the right to food
Year Policy/legislation Focus
Government department / organisation
2002 Department of Agriculture’s Integrated Food Security Strategy (IFSS). This strategy aimed simultaneously to ensure all South Africans have access to productive resources or incomes to allow them to access nutritious and safe food. This was the first broad, interdepartmental initiative on food security and will be examined later in this chapter.
Cabinet announced a special relief package amounting to R400 million drawn from its contingency reserve as a response to dramatic food price increases at the end of 2001.
Yiyo Lena (here it is) initiative was launched in November in response to a food price spike. It was primarily a temporary, state-sponsored subsidy of poor quality maize meal to the poor, especially in rural areas. While intended to be a short term relief measure, quantities were inadequate and stocks ran out quickly.
Food security (broad scope)
Once off food transfer
Once off food transfer
Multi-sectoral under Department of Agriculture leadership
2003 Department of Agriculture established the Food Price Monitoring Committee under the National Agricultural Marketing Council (NAMC). The objective of the Committee was ‘to act as a watchdog that will serve to protect the consumer against unfair price rises that have a detrimental effect on food security for the poor.
Consumer protection (food prices)
Department of Agriculture
2004 Social Assistance Act paved the way legislatively for the existing social grants system, which plays a critical role in alleviating hunger for beneficiaries.
Social security grant
Department of Social Development
2009 ANC manifesto. Food security played a prominent role in the 2009 ANC manifesto, which stated that ‘Rural infrastructure development and agricultural reforms are at the heart of our plan to improve our country’s food security’.
Zero Hunger Strategy/ Food for All Campaign was modelled off the Brazilian initiative. The campaign was launched in 2009 but barely implemented.
DPME Outcome 7 is entitled ‘Vibrant, equitable and sustainable rural communities and food security for all’. The delivery agreement for this Outcome frames food security around the general recognised standards of availability, access, utilization, and affordability. However, key work to be completed by 2014 and longer-term targets still indicate a largely production-based understanding of food security.
Rural development, production and land reform, largely focusing on initiatives supporting small-scale farming.
Focus on small-scale agriculture and food access – not implemented.
Rural development and land reform (production)
ANC
Department of Agriculture
Department of Rural Development and Land Reform
2010 Investigations and prosecution of bread companies accused of price fixing by the Competition Commission. Key corporations settled on large fines paving the way for further antitrust work.
Consumer protection (food prices)
Competition Commission

36 The Right to Food in South Africa
Year Policy/legislation Focus
Government department / organisation
2013
/ 14
National Development Plan (NDP), locates food security under the chapter on rural development. It includes a few economic and market based elements of food security, such as reducing the urban/rural price gap, but does not go far enough to expand the framing of food security from a health / nutrition / supplementation and availability/production approach.
National Policy on Food and Nutrition Security (NPFNS). This is a recent policy still in draft form. It is the current reference point for coordinated government work on food security, serving as a successor to the IFSS. However, it remains largely void of content beyond background information. Legislation and policy are both contained in half a page recommending the development of a Green Paper and White Paper.
National Aquaculture Policy Framework for South Africa. While this policy framework considers the role of large and small-scale fishers in food security, it is limited in scope by merit of its narrow focus, though it does go further than some previous work in building links between local demand, food security, and economic development.
Rural food security (food production)
Not clear
Food security (production and some economic access)
Multi-sectoral
Department of Agriculture
Department of Agriculture
The above timeline illustrates that, while food security has featured in numerous policies, there remains no clear, coordinated national strategy to end hunger and malnutrition. Although a new initiative has been launched every two or three years since 1994, activities have taken place across different government departments and the actions and programmes have not been well coordinated. Apart from the IFSS and the NPFNS, food security has been a minor consideration for a number of departments and departmental approaches and responsibilities to the right to food have remained fragmented.
3.2. Right to Food Programmes and Institutional Responsibilities
This section will look at the existing programmes within government that have been central to addressing the right to food. This will demonstrate how government currently understands its obligations around the right to food, and highlight gaps between rhetoric and practice. A study conducted by NALEDI in 2002 maps out the programmes of different government departments that have a large impact on food security, and is replicated below. While the specific initiatives and programmes have evolved over the past decade, the broad governmental functions and areas of responsibility remain the same. This underscores the complexity of coordinated work around food security given the large number of actors involved and the diversity of mandates, which often include much more than only the right to food.

37 Policy analysis: Assessing the reasonableness of policies and programmes to ensure the right to food
Table 3: Government departments and responsibilities regarding food security86
Department Programme/Function
Department of Health
� Integrated Nutrition programme
� HIV/AIDS related food programmes
� Food Fortification
� Regulation of Food Quality, Safety and labelling
Department of Agriculture and Land Affairs (including its agencies the ARC, NAMC and Land Bank)
� Various agricultural credit and production programmes
� Land Reform Programme
� Regulating Agricultural Products Standards
� Monitoring the effects of deregulation
� Monitoring food prices
Department of Trade and Industry (including its agencies the BTT, CSIR, SABS and IDC)
� Trade policy and Tariff regime
� Supply side-measures for food enterprise
� Trade Metrology
� Consumer Protection
Department of Social Development � Grants and pensions
� Social grants
Department of Labour � Sectoral wage determinations
� Enforcement of labour laws
Department of Environmental Affairs and Tourism
� Environmental regulations
� Enforcement of labour laws and mitigate the effects of drought
Department of Finance
� VAT
� Zero-rating of basic foodstuffs
� Other taxes and tax incentives in relation to food
Department of Transport � Port and rail tariffs
� Rural roads
Department of Water Affairs and Forestry
� Catchment management and water pricing
� Dams and irrigation scheme
� Sanitation and waste-water system
This section will look first at the Integrated Food Security Strategy (IFSS), which made an attempt at coordinating work on food security across government departments. It will then explore specific initiatives within government departments working on the right to food within their own mandates and areas of responsibility. While many more programmes could have been targeted, the illustrative cases chosen include the CASP Programme within the Department of Agriculture, Forestry and Fisheries, the National School Nutrition Programme within the Department of Basic Education, the Zero-Rating of basic foodstuffs within the National Treasury, the Integrated Nutrition Programme within the Department of Health, and the Department of Social Development’s Food For All/ Zero Hunger initiative.
3.2.1. Department of Agriculture, Forestry and Fisheries (DAFF)A first step to integrating these interventions and responsibilities in a coordinated way around the right to food took place in 2002 – following the food price crisis in 2001. This was led by the Department of Agriculture which proposed a draft Food Security Bill that never materialised.
86 Watkinson, E. 2002. ‘Overview of the Current Food Security Crisis in South Africa’, National Labour and Economic Development Institute (NALEDI). Available at: http://sarpn.octoplus.co.za/documents/d0000222/watkinson/Watkinson_SA_food_crisis.pdf.
A first step to integrating these interventions and responsibilities in
a coordinated way around the right to food took place in 2002 – following
the food price crisis in 2001.

38 The Right to Food in South Africa
Instead, an Integrated Food Security Strategy was developed which is coordinated by the Department of Agriculture.
3.2.1.1. Integrated Food Security Strategy (IFSS), 2002
The vision of the IFSS was ‘to attain universal physical, social and economic access to sufficient, safe and nutritious food by all South Africans at all times to meet there dietary and food preferences for an active and healthy life.’ The IFSS was the first attempt by government to formulate a national strategy which addressed the complexities of food security in a coordinated, interdepartmental way.
The strategy was organised around the following four pillars:
1. Production and trading: to ensure that identified food insecure populations gain access to productive resources to produce food;
2. Income opportunities: to ensure that people have access to income and job opportunities to enhance food related purchasing power;
3. Nutrition and food safety: to ensure that food insecure people are empowered to make appropriate decisions around nutritious and safe food; and
4. Safety nets and food emergencies: to ensure that the state provides relief measures which could be short to medium term as well as on a sustained basis.
The pillars of the IFSS reflect the various components of food security, in particular the question of access - with income opportunities, job creation and safety nets in the case of food emergencies all considered. The IFSS also reflects the role of various government departments and suggests a broader developmental approach with its emphasis on household food security alongside national food security or agricultural production.
Acknowledging that food insecurity manifests itself at both the national and household level requires different responses and interventions by different government departments. At the national level, the IFSS states that food security is primarily the responsibility of the Department of Agriculture with the Department of Trade and Industry, to ensure the availability of food in quantities sufficient to satisfy the needs of the population through national production and imports, as needed. The Departments of Labour and Social Development should ensure that people are able to afford adequate food, through employment or access to social grants. At a provincial level, the Department of Water Affairs must ensure irrigation infrastructure and water catchment management, while the Department of Environmental Affairs must mitigate the effects of drought, and the Department of Transport must ensure infrastructure is in place for food to reach all communities safely. The Departments of Health and Education should ensure that people have the information they need to make informed decisions about nutritional needs. Furthermore, the Departments of Health and Education should ensure that people have the knowledge and ability to prepare nutritious food safely. The IFSS approached this by organising its work into national and provincial ‘clusters’ (see diagram below) around different areas of its work with some clusters containing as many as ten government ministries, albeit without clear delineation of roles and responsibilities.87
87 IFSS, p30.

39 Policy analysis: Assessing the reasonableness of policies and programmes to ensure the right to food
Figure 3: IFSS Institutional arrangements
INTE
GRA
TED
PRO
GRA
MM
E IM
PLEM
ENTA
TIO
N
PUBLIC PRO
VATE CIVIL SOCIETY CO
NSU
LTATION
Source: NDA 2002
Ministers Social Cluster
DGs Social Cluster
Core DepartmentsNational
Coordinating Unit
National Food Security Forum
Provincial Food Security Forum
District Food Security Forum
Local Food Security Action Groups
Food security officers
District Food Security Officers
Provincial Coordinating Unit
PROGRAMMES• Food production and
training
• Income and job creation
• Nutrition and food safety
• Safety nets and food emergencies
• Analysis, information & communication management
• Capacity building
• Stakeholder dialogue
HOUSEHOLDS AND INDIVIDUALS
Despite the IFSS acknowledging the importance of different interventions and programmes (under the four pillars), it has been criticised for being driven in practice primarily by a focus on availability rather than access to food. Academics themselves have pointed to a ‘disjuncture’ between the IFSS and the reality and complexity of food insecurity in South Africa.88
The specific programmes (many of which are discussed in the following section, for example the National School Nutrition Programme (NSNP) to be coordinated by the IFSS have no doubt accomplished a lot to support the right to food in South Africa. For example, the Department of Social Development’s social grant programmes, to which the IFSS makes frequent mention, has clearly played an important role. What the IFSS largely failed to do, however, is to effectively coordinate these various programmes, some of which have been more successful than others, in a way that would explicitly align them to address food security in a systematic and comprehensive way.
Unfortunately, the effectiveness of the IFSS was limited by a large range of factors. Relegated to a directorate level within the Department of Agriculture, it failed to build sufficient political will to drive it strongly. This was particularly critical given the interdepartmental nature of the work, as well-meaning officials within the Department of Agriculture had no mechanism through which to compel people in other departments, with their own priorities, to collaborate. Perhaps more problematic, however, are the implications of the institutional arrangements seen above. It is apparent that coordinating units were envisaged at all levels, from national to local. While this is an admirable and necessary framing to respond to the varying dimensions of food security, the reality is that the relevant collaborating departments have very different national, provincial, district, and local structures which has made replicating food security forums at all levels difficult. Some agencies, like the South African Social Security Agency (SASSA) are under the remit of national government meaning that local officials, while playing a very important role, have little autonomy for independent planning. Provincial competencies, like education, still have different structures for budgeting, planning and accountability. The IFSS was tasked with providing the coordinating and overarching strategy to bring together efforts to sustain food security. However, in the absence of additional resources to fund such inter-departmental and co-ordination work, departments have been reluctant to work within the IFSS framework. This averseness hampers the development of collaborative food-security programmes.89
88 Drimie & Ruysenaar. 2010. 89 Koch, Josee. 2011. ‘The Food Security Policy Context in South Africa’, Country Study No. 21. Available at: www.ipc-undp.org/pub/
IPCCountryStudy21.pdf.
Unfortunately, the effectiveness of the
IFSS was limited by a large range of factors.

40 The Right to Food in South Africa
Due in part to these complexities, initiatives that have fallen under the responsibility of one particular department have been much more successful in implementation than ‘integrated’ approaches which have generally not managed to overcome hurdles of financing and management found in interdepartmental work. Due to the stubbornly “interdepartmental” nature of hunger, this means that responses have not been holistic. In fact, one expert paper on the IFSS concluded by saying, ‘In other words, it does no more than outline good intentions with no real attempt to apply them in reality’.90
Summary: Integrated Food Security Strategy, 2002
� The IFSS, though correctly identifying many of the most important aspects of food security, was never able to coordinate effective action to see that its goals were met.
� The inter-sectoral nature of food security policy and programmes requires that the overarching strategy clearly lay out responsibilities and ensure mechanisms are in place to make departments accountable for reaching goals. These were not adequately laid out and implementation was always a problem for the strategy.
� Placing the responsibility for food security policy with the Department of Agriculture, Forestry, and Fisheries has meant that thinking on food security has remained biased towards production and availability rather than physical and economic access.
3.2.1.2. The National Policy on Food and Nutrition Security (National Policy), 201491
The proposed replacement for the IFSS, the National Policy on Food and Nutrition Security (henceforth the National Policy), has largely been developed without public consultation. This centralised decision-making approach contradicts the one espoused in the document itself. It states that:
…Food and Nutrition Security is a complex issue characterised by inter-disciplinary approaches. This National Policy on Food Security and Nutrition seeks to provide an overarching guiding framework to maximise synergy between the different strategies and programmes of government and civil society.92
In evaluating the document, as many questions arise around what is missing, as what has been included. For example, while the level of food insecurity in urban informal areas has been recognised, there does not seem to be any specific targeting of the issue. The Policy still has a rural bias, with land reform and agriculture getting more attention than factors affecting urban informal food insecurity.
As the graph below shows, levels of urbanisation in the country vary widely – from 97.2% in Gauteng to just 17.9% in Limpopo. This requires that different approaches are taken to ensure food security in these different geographic areas – something that the new strategy does not pay enough attention to.
90 Drimie & Ruysenaar, 2010. 91 Available at: www.gov.za/sites/www.gov.za/files/37915_gon637.pdf.92 National Policy on Food and Nutrition Security for the Republic of South Africa. 2014, 5.

41 Policy analysis: Assessing the reasonableness of policies and programmes to ensure the right to food
Figure 4: Urbanisation by province, 2011
GP W.Cape
FreeState
N.Cape KZN E.
CapeNorthWest MP LP Total
Urban area 97.2 91.9 83.9 75.6 47.5 45.5 44.3 42.7 17.9 62.9Tribal or Traditional area 1.3 0 9.0 16.3 45.7 51.6 46.3 49.2 77.7 31.8Farm area 1.5 8.1 7.2 8.2 6.8 2.9 9.5 8.1 4.4 5.3
0102030405060708090
100
Perc
enta
ge
(Source: Stats SA Census 2011)
Another shortcoming is the lack of focus on employment creation. The policy does well to situate food security within the broader picture of poverty in South Africa, but is short on ideas on how to stimulate job creation. As will be seen later in Chapter 4 of this report, many of government’s agricultural support programmes (CASP, RECAP, Fetsa Tlala) have also fallen short when it comes to employment creation. This is despite the fact that labour-intensive agriculture could be an effective way to create sustainable livelihoods for low and unskilled people in the rural areas that government is so focused on.
Two positive moves outlined in the policy include:
� Acknowledgement of the need for a framework law on the right to food. The policy states that the ‘approval of this National Food and Nutrition Security policy could be an initial step towards a Food and Nutrition Security Act for South Africa, which would give statutory force to such structures. A Green and White Paper process is envisaged to prepare for this.’93
� Leadership for coordination of the government’s initiatives by a National Food and Nutrition Advisory Committee that will be chaired by the Deputy President. This committee is envisaged to be made up of a wide range of experts that could fittingly take on the inherently interdisciplinary nature of food security policy. What is required is a body with enough clout to direct efforts around food security when it comes to interdepartmental cooperation and accountability. Someone needs to be accountable should there be a lack in progress towards the realisation of the right to food.
As with any policy, setting noble goals is the easy part. While it must be acknowledged that the policy is making the right noises with regard to poverty alleviation and seeing food insecurity as a result of lack of access rather than availability, the difficulty always comes with implementation. The IFSS made similar noises and yet, as will be shown in Chapter 5, departments often tended to revert to thinking of food security as an availability issue.
A draft of the government’s implementation plan has been circulated, but it is as yet unfinished and it would be premature to comment on it. It is hoped that when it is finalised, civil society and the public at large will have the opportunity to shape its targets and priorities as well as its mechanisms for monitoring, evaluation, and overall accountability.
In order to illustrate the similarities and differences between the IFSS and the National Policy that has been proposed, the pillars of each policy have been presented side by side in the table below. The National Policy has a pillar that was not present before which deals with risk management with regard to food security and food production. Meanwhile, the IFSS pillar that looked specifically at income opportunities and mentioned the need for labour-intensive agriculture has been dropped. This may be because such concerns would be covered in pillar two of the National Policy which looks at assisting smallholder farmers. However, it would be advisable for the pillar to be as explicit as possible with regard to how it intended to
93 Ibid, 18.
As with any policy, setting noble goals
is the easy part. While it must be
acknowledged that the policy is making the right noises with
regard to poverty alleviation and seeing
food insecurity as a result of lack of access rather than availability,
the difficulty always comes with
implementation

42 The Right to Food in South Africa
change income opportunities. In this way, it seems that the National Policy is missing out on a vital pillar for ensuring food security. Increased employment and greater economic access to food needs to be a major component of any food security policy.
Table 4: Food security policy pillars compared
4 Pillars of the Integrated Food Security Strategy (2002)
5 Pillars of the National Policy on Food and Nutrition Security (2014)
1. Production and trading to ensure that identified food insecure populations gain access to productive resources to produce food.
1. The alignment of investment in agriculture towards local economic development, particularly in rural areas. This includes the provision or subsidisation of inputs and support services for increased food production, as well as more effective food storage and distribution networks, involving both government and private agencies, to eliminate waste and ensure better access to food for all.
2. Improved market participation of the emerging agricultural sector through public-private partnerships, including off-take and other agreements, a government food purchase programme that supports smallholder farmers, as well as through the implementation of the Agri-BEE Charter, which requires agro-processing industries to broaden their supply bases to include the emerging agricultural sector.
2. Nutrition and food safety to ensure that food insecure people are empowered to make appropriate decisions around nutritious and safe food
3. Improved nutrition education, including District level nutrition services to assist households and communities monitoring nutritional indices, providing consumer literacy and assisting with better food management and improved meal planning.
3. Safety nets and direct provision of food in emergencies to ensure that the state provides relief measures which could be short to medium term and on a sustained basis
4. The availability of improved nutritional safety nets, including government run and supported nutrition and feeding programmes, emergency food relief, as well as private sector, CBO and NGO interventions.
No similar pillar 5. Food and Nutrition Security Risk Management, including increased investment in research and technology to respond to the production challenges currently facing the country, such as climate change and bioenergy. It would also include the protection of prime agricultural land, and limitations on its alienation for other activities, including mining, game farming, and property development. Improved food security information management systems would also be required, with periodic scientific reviews of the state of food security in the country.
4. Income opportunities to ensure that people have access to income and job opportunities to enhance food related purchasing power: ‘it is important for the IFSS to support measures that create a labour-intensive and diversified agricultural sector with strong links to the other economic sectors.’
No similar pillar.94
(Source: DAFF 2002, DAFF 2014)94
94 Page 6 of DAFF’s Draft Implementation Plan states the following as a key outcome: ‘Improved access to food through social protection and development programs/schemes: This outcome will ensure improved food availability, affordability and accessibility through adoption of broad-based and inclusive approaches. This will be realized through promotion of market access; income generating activities and infrastructure development; improving of access to social grants; targeting; irrigations schemes; feeding programs; smallholder food production support; community works program; community and institutional gardens; self-reliant and diversified food production; rural development and mainstreaming of gender and youth.’ This makes reference to employment, but not labour-intensive agricultural employment as is explicitly referred to in the IFSS.

43 Policy analysis: Assessing the reasonableness of policies and programmes to ensure the right to food
Another concern about the National Policy is that it has not paid any special attention to the needs of children and other vulnerable groups. As mentioned in Chapter 2, the Constitution gives children the right to basic nutrition and while this does not afford them the right to demand the immediate fulfilment of this right, it places special obligations on the state to prioritise children in policies and programmes. The National Policy fails to mention the right of children to basic nutrition in section 2.1 (Constitutional Mandate) which is a serious oversight for a food and nutrition security policy. This indicates that the needs of children were not at the forefront of the drafter’s minds, and highlights the absence of civil society and the public from the policy formulation process.
As with the IFSS, the most important part of the new policy will be how it coordinates implementation between multiple departments and monitors overall progress. Accountability mechanisms and placing responsibility for coordination with the National Food and Nutrition Advisory Committee chaired by the Deputy President (or within the Presidency as the draft implementation plan states) may go a long way to ensuring progress. A participatory process towards the development of a framework law on the right to food would be a long-awaited step in the direction of much-needed national dialogue on the right to food, and provide the necessary roadmap and a framework for accountability in realising this right.
Summary: The National Food and Nutrition Security Policy, 2014
� The National Food and Nutrition Security Policy contains many promising developments such as the National Food and Nutrition Advisory Committee and a call for a framework law on the right to food.
� However, the policy still has a rural bias with land reform and agriculture getting more attention than factors affecting urban informal food insecurity.
� The policy does well to situate food security within the broader picture of poverty in South Africa, but is short on ideas for stimulating employment creation. Increased employment and greater economic access to food needs to be a major component of any food security policy.
� One big oversight of the National Policy is that it has not paid any special attention to the needs of children as it is obliged to do by section 28 (1)(c) of the Constitution.
� The Policy has suffered from its behind-closed-doors development, with little or no opportunity for engagement by the public.
3.2.1.3. Comprehensive Agricultural Support Programme (CASP), 200395
The Comprehensive Agricultural Support Programme (CASP) will be discussed in more detail in a dedicated case study in Chapter 4 of this paper. This section will give some important background information about the programme so that it can be understood in the broader context of government’s efforts.
CASP arose due to the acknowledgement of the failure of land reform to improve the livelihoods of rural households in the absence of post-settlement support including access to credit, skills, infrastructure and markets. CASP aims to ‘provide post settlement support to the targeted beneficiaries of land reform and to other producers who have acquired land through private means and are, for example, engaged in value-adding enterprises domestically or involved in export’.96 It endeavours to reach this aim through a variety of capacity building initiatives with one of the expected outcomes being ‘improved national and household food security.’97
CASP was conceptualised following an agricultural sector strategy in 2001 and explicitly acknowledges the gap created by an agricultural sector that needs to pursue both growth and equity. Given the reforms taking place in the agricultural sector, CASP was designed to support
95 Available at: www.nda.agric.za/docs/CASP/casp.htm.96 Ibid.97 Ibid.
As with the IFSS, the most important part of the new policy will be how it coordinates
implementation between multiple
departments and monitors
overall progress.

44 The Right to Food in South Africa
beneficiaries of agrarian and land reform programmes. It has had a budget disbursed through provincial departments of agriculture of approximately R200 million annually, constituting the bulk of funding available to provide capital support to small-scale farmers.98 In 2012, 72,856 farmers were assisted. While the programme has grown rapidly, it still demonstrates the limited support available to small-scale farmers.
The Department of Agriculture is one of several service providers within CASP, with different stakeholders playing varying roles in implementation. The Department of Agriculture itself is responsible for creating an enabling national environment, coordinating the various national services and programmes, establishing norms and standards, setting priorities and coordinating the implementation of CASP. The Provincial Departments of Agriculture are responsible for identifying beneficiaries of agricultural reform initiatives, and preparing them to develop and implement business plans in line with CASP. This body provides the capacity building services directly, as well as the relevant record keeping and information services. The Department of Land Affairs works with other stakeholders to assess business plans received, coordinate policy around land acquisition, set targets for farmer support, and maintain information on agrarian reform beneficiaries. The Land Bank provides financial support to the farmers, which includes monitoring the financial soundness of their plans, and facilitating access to finance. Additional role players include SETAs, universities, labour unions, and others.
There have been criticisms of CASP, such as the time it takes for small-scale farmers to receive support, as well as on the nature and extent of the support provided. A study by PLAAS has found that instead of CASP’s resources being allocated to a large number of small-scale farmers, in fact a small pool of farmers are receiving large capital injections, which means that CASP is struggling to address inequalities in the agricultural sector.99 This is exacerbated by the fact that providing extension support to small scale-farmers is a labour-intensive, expensive endeavour and CASP’s human, administrative, and financial resources are just not sufficient for the task at hand.
Even if CASP were fully capacitated and ideally executed, PLAAS argues that there are larger conceptual issues with the programme. Specifically, its focus on infrastructure on farms is not well targeted. Rather, the limiting factors on small-scale farming are linked, in the best case scenario, to ‘community-level infrastructure, market development, and institutional re-engineering.’ In the worst case, CASP is embedded into the existing land reform projects that themselves need a significant overhaul.100 Therefore, the most significant limitations of CASP are the limitations of South Africa’s rural development policies more broadly.101 The simultaneous strong emphasis on small-scale farmer support in food security initiatives without a comprehensive and strategic way of addressing the institutional rural development challenges mean that such support initiatives are inherently crippled even when ideally implemented.
In the case of small-holder farmers who have become successful as a result of CASP support, CASP has contributed to promoting the right to food. However, it’s wider impact on food security and food sovereignty is much harder to assess. Disappointingly, nowhere in CASP’s organisational documentation is the IFSS even mentioned. This absence of coordination even within initiatives of the same department is surprising and highlights the even greater challenge of coordinating initiatives across government departments.
3.2.1.4. National Agricultural Marketing Council (NAMC) – Food Price Monitoring
An additional initiative within the Department of Agriculture addressing the right to food is a price monitoring process within the NAMC. Following the spike in food prices in 2001, the Minister for Agriculture and Land Affairs developed a Food Prices Monitoring Committee. The purpose of the committee was:
� to monitor the price of a basic basket of food;
� to investigate sharp price increases;
� to understand price formation mechanisms throughout the supply chain;
98 Department of Agriculture, Forestry and Fisheries (DAFF), Annual Report 2012-13. Available at: www.daff.gov.za/about/annualreport/2012-1399 Hall, R & Michael, A. 2010. ‘The case for re-strategizing spending priorities to support small-scale farmers in South Africa’, PLAAS. Available at:
www.plaas.org.za/plaas-publication/wp-17. 100 Ibid.101 Ashton, Glenn. 2013. ‘Failing to Feed Our People: South Africa’s Lacklustre Food Security Policy’. SACSIS. Available at : www.sacsis.org.za/s/story.
php?s=1785

45 Policy analysis: Assessing the reasonableness of policies and programmes to ensure the right to food
� to establish and maintain a national food pricing monitoring database; and
� to carry out further work around the effectiveness of government’s interventions around food pricing, monitoring the regional food situation, and work with the competition commission to understand possible predatory tendencies around food pricing.102
An ongoing outcome of this work is NAMC’s Food Price Monitor: a quarterly publication that explores key information on food pricing.103 This includes, but is not limited to, monitoring the prices of a basic basket of food, urban-rural price differentials, inflation rates of various food items, and an outlook based on current market trends.
When the NAMC first began the food price monitoring initiative, certain recommendations were made. However, they were nearly all around the collection of stronger data with a few recommendations around social policies that may support household level food security. As was common thinking at the time, these were strongly linked to boosting household level food production (for example, having a means tested social grant linked to food and enabling small-holder farmers to grow their own food more efficiently). However, there were no recommendations provided that required any particular part of government do anything as a result of the food price findings.
What has resulted from the initiative is relatively robust information on food pricing, but it has been depoliticised. The broader analytical work of the NAMC has been deprioritised and ultimately very little has happened with the information.
3.2.2. Department of Basic Education (DBE)
3.2.2.1. National School Nutrition Programme (NSNP)
One of the most established and widely-known government programmes working to ensure the right to food is the school feeding scheme (see case study in the chapter 5 for greater detail). The first democratic government of South Africa called for the establishment of the Primary School Nutrition Programme (PSNP) in 1994,104 which aimed to protect learners living in poverty from malnutrition and hunger. For the first ten years of its existence, this programme was coordinated by the Department of Health. Its aim was to ‘improve the health and nutritional status of South African primary school children, to improve levels of school attendance and to improve the learning capacity of children’.105
In 2004, the programme was relocated to the Department of Basic Education and was renamed the National School Nutrition Programme (NSNP). Its objectives were expanded, and are now:
� to contribute to enhanced learning capacity through school feeding programmes;
� to promote and support food production and improve food security in school communities;
� to strengthen nutrition education in schools and communities; and
� to develop partnerships to enhance the programme. 106
The NSNP currently feeds over eight million children in over twenty thousand schools, and in 2013 had a budget of over R4.578 billion, making it wide reaching.107 It is implemented through a conditional cash transfer to the provincial level which is where the primary responsibility for education lies. Since its inception, the programme has been evaluated both internally and externally a number of times, giving significant information about its strengths and weaknesses. This has included several external evaluations between 1996 and 2012 as well as regular briefings in Parliament.
102 Department of Agriculture ‘Terms of Reference for the National Food Price Monitoring Committee’ 29 November 2002. Available at: www.nda.agric.za/docs/fpmc/fpmc.htm.
103 NAMC ‘Food Price Monitor’ All editions, 2006-2014. Available at: www.namc.co.za/pages/published-reports/food-price-monitoring.104 Subsequently renamed the National School Nutrition Programme (NSNP), when rolled out beyond the primary school level. For more
information see: www.education.gov.za/Programmes/NationalSchoolNutritionProgramme/tabid/440/Default.aspx. 105 Tomlinson, M. 2007. ‘School feeding in east and southern Africa: Improving food sovereignty or photo opportunity?’ Equinet Discussion Paper
46. Available at: www.equinetafrica.org/bibl/docs/DIS46nutTOMLINSON.pdf.106 Department of Education. ‘National School Nutrition Programme’. Available at: www.education.gov.za/Programmes/
NationalSchoolNutritionProgramme/tabid/440/Default.aspx.107 National School Nutrition Programme (NSNP) Annual report 2011/2012 Available at: www.education.gov.za/LinkClick.
aspx?fileticket=WEuFok4zUSM%3D&tabid=440&mid=1911.
One of the most established and widely-known government
programmes working to ensure the right
to food is the school feeding scheme

46 The Right to Food in South Africa
Since its inception, the programme has been significantly expanded and now provides a daily hot meal (as opposed to the previously cold one) to all learners in participating schools instead of targeting only the poorest, and in 2009, it was expanded to include secondary schools as well. When the programme was initially conceptualised, there was a means test for learners in school. In keeping with best practices, however, all learners in no fee schools qualified.
In spite of these expansions, the programme remains primarily a school feeding scheme with the other goals and objectives largely side-lined. The programme has been described as ‘an exclusively feeding programme with insufficient fiscal space for other vital aspects of an integrated nutrition strategy’.108 For example, in the Department of Basic Education’s Annual Performance Plan for 2013/2014, the only purpose of the programme listed was ‘to provide nutritious meals to targeted learners’.109 This is in keeping with criticisms of the programme as early as 1997, which pointed out that deworming and nutritional supplement schemes were considerably more cost effective and logistically easier than school feeding schemes but had nonetheless not been implemented.110 It is important to note, however, that a national deworming programme is planned to finally go ahead in 2015.
Evaluators of the NSNP programme generally agree that there are significant operational constraints to the programme working well, but in spite of this, the programme is delivering and having an important impact on child nutrition. In all provinces, over 98% of schools were feeding all targeted learners, and in six provinces, over 90% of the schools selected in a statistically representative sample were adhering to recommended menus.111 In the first decade of the programme, evaluations found that meals prepared in schools often failed to meet the basic nutritional guidelines provided by the Department of Health, which would ensure a balanced meal. While there remain occasional allegations that this remains an issue, it no longer seems to be as widespread a problem.
Problems in the NSNP are linked to more structural issues, including poor supply chain management and record keeping, insufficient staff, irregularities in the tendering process, and lack of infrastructure in schools to allow for adequate storage and preparation of food.
The school nutrition programme is one of the few government initiatives that has stood the test of time since its inception in 1994. Its mandate continues to expand, and its budget is growing accordingly. This speaks to its importance as well as its feasibility in terms of implementation. However, it continues to have a wide array of objectives in spite of being, essentially, a school feeding programme.
Perhaps one of the reasons this programme has been successful is that its responsibility is housed within the provincial Departments of Basic Education. While there may be problems with efficiency and effectiveness, there is no ambiguity in terms of responsibility, budgeting and implementation. There have, however, been a few cross-sectoral initiatives linked to the NSNP, such as a food security programme by the National Development Agency (NDA) within the Department of Social Development which has supported gardens at 153 early childhood development centres.
108 Wildeman. R & Mbebetho, N. 2005. ‘Reviewing Ten Years of the School Nutrition Programme, Budget Information Service’, Idasa. Available at: www.eldis.org/vfile/upload/1/document/0708/DOC20662.pdf.
109 Department of Basic Education, Annual Performance Plan 2013/2014. Available at: www.education.gov.za/LinkClick.aspx?fileticket=CQ9wvkQ9GUk.
110 Health Systems Trust ‘An Evaluation of South Africa’s Primary School Nutrition Programme’ (1997). Available at: www.healthlink.org.za/uploads/files/psnp.pdf.
111 Labadarios, D., Steyn, N., Mgijima, C., & Dladla, N. 2005. ‘Review of the South African nutrition policy 1994–2002 and targets for 2007: achievements and challenges.’ 21:1 Nutrition. 100-108.

47 Policy analysis: Assessing the reasonableness of policies and programmes to ensure the right to food
School Gardens
School gardens form part of the NSNP, but it is difficult to get comprehensive and reliable information on the extent to which they are being implemented nationally. In addition to the NDA, school gardens are a favourite initiative of local and international NGOs and corporate social responsibility programmes – ranging from the Kellogg Foundation to World Vision International. However, integrated information on initiatives provincially or nationally is missing, and it is not apparent whether or not these gardens feed explicitly into the NSNP at a school level. Their contribution to fulfilling the right to food in South Arica is therefore also difficult to assess.
3.2.3. National Treasury
3.2.3.1. Zero VAT Rating of basic foodstuffs
While the right to food in South Africa is still very much discussed in terms of production, the Value Added Tax (VAT) rate of zero for basic foodstuffs is one of few initiatives that acknowledges the important question of affordability regarding access to food in the lives of most South Africans. VAT was established for the first time in South Africa in 1991 and has been set at 14% since 1993. VAT provides a valuable, steady source of revenue for the government fiscus. Currently, nineteen basic foodstuffs are zero-rated for VAT, including bread, dried beans, rice, milk, and fresh produce. This is in addition to various other goods that are seen as either basic for survival, such as paraffin, or in the national interest, such as farming equipment.
National Treasury aims to develop a system of progressive taxation as a means of both raising money for the government while also playing a ‘redistributionary’ role. When universally applied, VAT is a regressive tax as all who purchase items must pay it equally, regardless of relative income. Unions have frequently demanded the expansion of zero-rating to include a wider array of goods. The Treasury’s policy of zero-rating certain foods has come into the spotlight several times since 1994, either to better understand the distributional impact of VAT, or in response to rising food prices.
There have been several studies and active debates about the impact that zero-rating has. One of the views that is relatively widely shared is that the current flat system of VAT with specific exemptions is not optimal, but there is little agreement about what a more optimal system would look like. In 2008, Treasury and the South African Revenue Service (SARS) organised a symposium with an explicit objective to explore ‘concerns about the incidence of VAT on the poor’.112 In spite of trade unions arguing to the contrary, the Minister of Finance declared that ‘evidence suggests that existing VAT zero-ratings and exemptions, in almost all cases, confer substantially more benefits on middle- and higher-income groups than on lower-income groups’.113
Evidence on consumption patterns among the poor is scarce, making decision-making difficult. Various claims are made in research, but there is often insufficient empirical information for evidence-based decision making. For example, two researchers from the University of Pretoria pointed out that “the VAT zero-rated basket has stayed the same since 1994, while consumption patterns have shifted significantly”.114
Additionally, there is a concern that there is inadequate research on how consumption patterns are affected by price elasticity. For example, one researcher questioned whether or not zero-rating red meats would increase or decrease food security. An initial study indicated that lower priced meats would replace fresh vegetables to the point that overall household nutrition was reduced. Another concern expressed relates to consumption dynamics within households. For example, due to a combination of patriarchy and cultural practices, meat may not be given to children, but lower prices could lead to this changing, with meat then replacing other nutritional foods that children currently have access to, thus resulting in a poorer diet for those children.115
112 SARS. Symposium and High Level Policy Questions; Tax Symposium, 17 & 18 March 2008, Pretoria.113 National Treasury. 2008. ‘Medium Term Budget Policy Statement’. Available at: www.treasury.gov.za.114 Watkinson, 2002. 115 Cutts, M and Johan, K. 2005. ‘An Economic Assessment of Zero Rating of VAT on Red Meat’. A paper presented at Agricultural Economics
Association of South Africa conference no. 4 at the University of Pretoria. Available at: www.aeasa.org.za/conf_05papers2.html.
Evidence on consumption patterns
among the poor is scarce, making decision-making difficult. Various
claims are made in research, but there is often insufficient
empirical information for evidence-based
decision making.

48 The Right to Food in South Africa
There is also significant controversy about whether the benefits of food being zero-rated for VAT are passed onto consumers or absorbed by suppliers and retailers.116
National Treasury’s initiative to zero-rate certain foodstuffs is encouraging in that it explicitly acknowledges the disproportionate burden of both VAT and food spending on poor households. It also acknowledges that access to food is primarily an affordability issue for poor households, and that the state has a role to play in enabling this access. However, this area possibly more than any other requires significantly more research to have a better understanding of the effects that such policies have on realising the right to food and basic nutrition.
3.2.4. Department of Social Development (DSD)
3.2.4.1. Social Relief of Distress (Food parcels) – South Africa Social Security Agency
The DSD has a wide mandate linked to social protection and social security, making it an important player in realising the right to food. DSD, possibly more than any other department working on the right to food, articulates the right to food in a way that is broadly connected to poverty, unemployment, and wider social and economic issues.
The South African Social Security Agency (SASSA) is mandated ‘to ensure the provision of comprehensive social security services against vulnerability and poverty within the constitutional and legislative framework’.117 Within this is the social relief of distress (SRD) initiative which is commonly referred to as the distribution of food parcels. This initiative is a little-known programme that is rarely advertised in the same way that most social grants are.
This programme is ‘a temporary provision of assistance intended for persons in such dire material need that they are unable to meet their or their families’ most basic needs.’118 This relief is offered for a period of 3 months with the possibility of extending it for another 3 months. Certain criteria are applied to determine whether or not a person is eligible for SRD, such as a household whose breadwinner has recently deceased, a single mother whose partner has not paid maintenance, someone who is awaiting the approval of a social grant, or who has been affected by a disaster that has not yet been recognised by the responsible government department. In theory, this grant could apply to a very large number of destitute and vulnerable people.
Applications for SRD grants are processed immediately and people receive a food parcel or voucher on the spot. The approval of a grant is at the discretion of the SASSA official on hand and must be co-signed by another SASSA employee. This means that the grant, more than perhaps any other social grant, is very much at the discretion of individual SASSA employees. There do not appear to be any established criteria for the awarding of the grant. However, the amount awarded will not exceed a stipulated maximum (for example, if someone is awaiting approval for a social grant, then the amount given for food will not exceed the amount they could expect for the social grant).
The total budget of the SRD programme in 2012 was about R200 million, making it relatively modest in size. In 2013, the SRD programme reached 3,766 households, but data are not available on how these households have been identified.
The nature of the programme makes it particularly difficult to implement transparently as households in distress are unlikely to be able to provide standard bureaucratic requirements. Furthermore, as decisions are made at the discretion of the SASSA official approached, consistency in service delivery is unlikely to be high. There have been widespread allegations of misuse of food parcels, including distribution of food parcels at ANC campaigning events. Two opposition parties brought a legal case forward during the 2014 elections campaign and the matter is also under investigation by the public protector.119
116 Ibid.117 South African Social Security Agency (SASSA) 2013 Annual Report 2012/2013. Available at : http://db3sqepoi5n3s.cloudfront.net/
files/131022sassareport.pdf. 118 Social Relief of Distress. ‘SASSA’, 2014. Available at: www.sassa.gov.za/index.php/social-grants/social-relief-of-distress Accessed May 30, 2014.119 South African Press Association (SAPA). 2014. ‘DA Goes to Court over Food Parcels’. Available at: www.polity.org.za/article/protector-probes-
food-parcels-for-votes-2014-04-22 and South African Press Association (SAPA). 2014. ‘Protector Proves Food Parcels for Votes’. Available at: www.timeslive.co.za/politics/2014/04/20/da-goes-to-court-over-food-parcels Accessed May 30, 2014
49 Policy analysis: Assessing the reasonableness of policies and programmes to ensure the right to food
Overall, this programme has the potential to provide a needed safety net to the most food insecure. However, lack of information and other challenges in access mean that it is unlikely to fulfil this role. People are not identified to receive this but are rather left to self-select, meaning that those most in need of food may be excluded.
Overall, the DSD has one of the strongest mandates to ensure the right to food, and it is backed up with significant institutional capacity and funding. However, most of its work in practice is around limited food parcel distribution. While a necessary relief measure which may take some steps to addressing food insecurity among households in crisis, this does not address the systemic nature of food insecurity which is experienced by a significant proportion of the population given its intersection with the crises of chronic poverty and mass unemployment. It is a missed opportunity, not to create stronger linkages between DSD’s work on food security and the extensive social grant system.
Summary:
� The DSD has a vital role to play in alleviating food insecurity – not only through social grants but also through the social relief of distress initiative.
� This programme, however, should be implemented in a transparent manner, receive greater funding, be more easily accessible and promoted, and should be free from political interference.
3.2.5. Department of Health (DoH)The Department of Health has played one of the most concrete roles in the realisation of the right to food in South Africa. It is responsible for a wide range of relevant areas of work, including nutrition education and food supplementation. Furthermore, it is at the forefront of responding to cases of severe malnutrition. Additionally, due to the nature of its work, the Department of Health often has some of the most accessible, best quality data on certain aspects of the right to food.
Most of the work of the Department of Health on the right to food has fallen under the remit of the Integrated Nutrition Programme which will be discussed below. Since it is a large programme, with more facets than can be explored in this paper, two elements of the programme will be looked at in detail: the food fortification programme and Vitamin A supplementation programme. While both have made a contribution to improving food security in the country, the programme as a whole is once again limited by a narrow, health-based approach to food security. Challenges of implementation aside, it is not sufficient to have a comprehensive response to food security that looks narrowly at nutrition. While the Department of Health has been included in broader food security initiatives to an extent, a systematic, coordinated effort is still lacking.
3.2.5.1. Integrated Nutrition Programme (INP)
The Integrated Nutrition Strategy was developed in 1995 and has guided policy for nutrition in the health sector ever since. It is a child-focused approach, linking it to the NSNP coordinated by the Department of Basic Education, particularly identifying protein-energy malnutrition among children below three as the most important nutritional problem. This means that the programme focuses heavily on nutrition education, fortification and supplementation, and growth monitoring.
Key elements of the Integrated Nutrition Programme (INP) include:
� promotion of breastfeeding;
� improving nutrition during the weaning process;
� coordination with the NSNP: ensuring that improving the nutrition of learners at school and improving educational outcomes is a shared goal of the programme;
� nutrition supplementation and the protein-energy malnutrition scheme;
� food fortification; and
Most of the work of the Department of Health on the right to food has fallen under the remit
of the Integrated Nutrition Programme...

50 The Right to Food in South Africa
� nutrition education and promotion.120
This is a broad programme and looking in great detail at the aims and implementation of each aspect of it would be beyond the scope of this paper. However, it is possible to talk in general terms about some of the successes and limitations of the programme.
The INP has been widely lauded for bringing nutrition to a level of high priority at the provincial level and for bringing together coordination mechanisms across departments that did not previously exist.121 It has also been relatively successful at disseminating a range of developed norms and guidelines on nutrition to relevant stakeholders, such as training volunteers preparing food through the NSNP initiative.
The effectiveness of the programme has been constrained by institutional challenges within the Department of Health. For example, there have been difficulties in the procurement process making supplements unavailable to pregnant mothers in certain localities; thus, over 70% of South African children are still found to be vitamin A deficient despite vitamin A supplementation being one of the flagship initiatives of the programme.
Vitamin A supplementation
Universal vitamin A supplementation (periodic distribution of vitamin A capsules) to children of 6-59 months is the main strategy in South Africa. The initiative was launched in 2000 and has been implemented through the disbursement of capsules through health centres. By the express admission of the Department of Health, this strategy has failed to reach most children, as they no longer come to health centres after the receipt of the last required vaccinations at 18 months of age. In 2008, an information campaign was launched to try and boost awareness and reach older children.
In addition to awareness raising, policy guidelines were developed that expanded the reach of the initiative beyond distributing vitamin A capsules. Dietary diversification and disease targeting are now also built into the programme, so activities ranging from the promotion of breastfeeding, nutrition education, community gardens, and training for health staff are now included. De-worming has also been integrated into the programme.
The programme has clearly delineated roles and responsibilities at the national, provincial and district levels, to ensure everything from the development of technical guidelines nationally, to monitoring and recording data at the district level. (See case study in chapter 4 for more information).
The Integrated Nutrition Programme has been constrained by a lack of human resources which has left particularly large gaps at the district and community levels. For example, many school districts reported being unable to identify a relevant nutrition worker to support community-based initiatives. The programme has also suffered from a lack of funding at all levels. While malnutrition fatality rates have declined significantly, in large part due to the training and capacity development of hospital staff as part of the INP, there are still many facilities without sufficient prioritisation and training in nutrition.122
Again, from a technical standpoint, the INP has had certain successes in addressing food and nutrition insecurity, particularly in micronutrients of children and pregnant women and training volunteers to prepare food as part of school feeding schemes to meet nutritional guidelines. However, this is a very narrow contribution in the realisation of the right to food. While the Integrated Nutrition Programme has widespread objectives, in reality, it is essentially a programme to support micronutrient availability in pregnant and lactating women and children. There is very little in the programme design that looks at nutrition from a community
120 National Nutrition Directorate, Department of Health. ‘Policy Summary, the National Integrated Nutrition Programme’ Available at: www.web.uct.ac.za/depts/chu/mch13m.rtf. See also, Department of Health, Integrated Nutrition Plan 2002-2006, Available at: www.westerncape.gov.za/text/2003/nutrition_strategic_plan_2001.pdf.
121 Immelman, E, and Bamford, L., ‘Implementing an Integrated Nutrition Programme: A situational analysis of progress in the Lower Orange Region of the Northern Cape,’ Health System Trust, April 2000. Available at: www.healthlink.org.za/uploads/files/integ_nutri.pdf.
122 Ibid.

51 Policy analysis: Assessing the reasonableness of policies and programmes to ensure the right to food
standpoint or that addresses the underlying causes of malnutrition. While this might arguably be done best in coordination with other departments better equipped to respond to the underlying social and economic factors of food insecurity, the INP is not equipped to work in an interdepartmental manner. The one exception to this may be the generally good coordination with the Department of Basic Education around the NSNP which may be because the programme was initially housed in the Department of Health.
Food Fortification
Government has taken steps to address micronutrient malnutrition by introducing a law mandating widely-consumed staple foods be fortified. This law came into effect in October 2013 and ensures the fortification of maize meal and wheat bread flour. The micronutrients that are included in the fortification mix are: Vitamin A, Thiamine, Riboflavin, Niacin, Pyridoxine, Folic Acid, Iron and Zinc.
The food fortification programme is controversial, with areas of effectiveness but also substantial gaps. Fortification of salt and maize meal have virtually eradicated folate and iodine deficiency. However, fortification is not a complete solution to malnutrition as not all micronutrients can be supplemented, and the approach of fortification above other efforts at increasing nutrition has been criticised for supporting commercialised farming and milling operations – which have themselves been criticised as the causes of some forms of food insecurity. Finally, the programme is criticised for focusing unduly on micronutrient availability. While this in itself is necessary, it may have come at the expense of emerging concerns around food use, such as fat and salt intake.
One challenge in an effective fortification programme is that it is dependent on compliance by large food manufacturing corporations. Standards are not in place for fortification mixes although steps are currently being taken to develop these.
3.3. Assessing the reasonableness of the policy effort
From this brief review of government programmes and policies to address the right to food, it is clear that there have been some successes while some programmes were ill-designed to have a meaningful impact. Programmes that have done well tend to be focused (have clear objectives), are housed within a single department (no difficulties with regard to coordination), and affect food security directly (rather than affecting intervening variables). Thus, nutrition programmes (supplementation and fortification) and feeding schemes (NSNP and food parcels) can be shown to be effective. Programmes that have a more indirect impact (food price monitoring, for example) cannot be assessed as clearly. This, however, should not imply that more attention be given to programmes whose outcomes can be assessed easily. It may be difficult to measure the impact of support for small-holder farmers (through the subsidisation of inputs, for example) on food security, but this does not prove that such a policy is not effective.
Chapter 2 of this paper showed how in Grootboom, the Constitutional Court affirmed and shed light on government obligations to ‘take reasonable legislative and other measures, within available resources, to achieve the progressive realisation’ of socio-economic rights. The Court established a ‘reasonableness test’ which provided that in order for a policy or programme to be considered as reasonable it must:
� Be comprehensive, coherent, and coordinated;
� Have appropriate financial and human resources made available to it;
� Be balanced, flexible and make appropriate provision for short, medium and long-term needs;
� Be reasonably conceived and implemented; and
� Be transparent, and its contents made known effectively to the public.
The food fortification programme is controversial, with areas of
effectiveness but also substantial gaps.
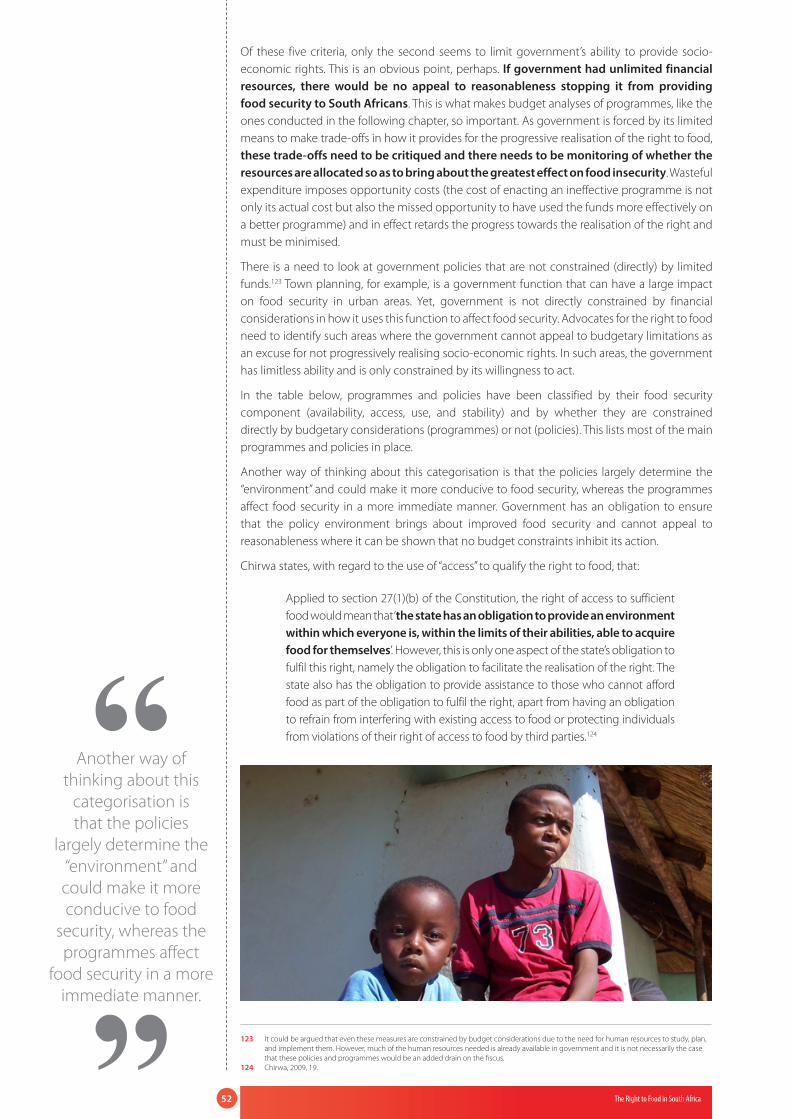
52 The Right to Food in South Africa
Of these five criteria, only the second seems to limit government’s ability to provide socio-economic rights. This is an obvious point, perhaps. If government had unlimited financial resources, there would be no appeal to reasonableness stopping it from providing food security to South Africans. This is what makes budget analyses of programmes, like the ones conducted in the following chapter, so important. As government is forced by its limited means to make trade-offs in how it provides for the progressive realisation of the right to food, these trade-offs need to be critiqued and there needs to be monitoring of whether the resources are allocated so as to bring about the greatest effect on food insecurity. Wasteful expenditure imposes opportunity costs (the cost of enacting an ineffective programme is not only its actual cost but also the missed opportunity to have used the funds more effectively on a better programme) and in effect retards the progress towards the realisation of the right and must be minimised.
There is a need to look at government policies that are not constrained (directly) by limited funds.123 Town planning, for example, is a government function that can have a large impact on food security in urban areas. Yet, government is not directly constrained by financial considerations in how it uses this function to affect food security. Advocates for the right to food need to identify such areas where the government cannot appeal to budgetary limitations as an excuse for not progressively realising socio-economic rights. In such areas, the government has limitless ability and is only constrained by its willingness to act.
In the table below, programmes and policies have been classified by their food security component (availability, access, use, and stability) and by whether they are constrained directly by budgetary considerations (programmes) or not (policies). This lists most of the main programmes and policies in place.
Another way of thinking about this categorisation is that the policies largely determine the “environment” and could make it more conducive to food security, whereas the programmes affect food security in a more immediate manner. Government has an obligation to ensure that the policy environment brings about improved food security and cannot appeal to reasonableness where it can be shown that no budget constraints inhibit its action.
Chirwa states, with regard to the use of “access” to qualify the right to food, that:
Applied to section 27(1)(b) of the Constitution, the right of access to sufficient food would mean that ‘the state has an obligation to provide an environment within which everyone is, within the limits of their abilities, able to acquire food for themselves’. However, this is only one aspect of the state’s obligation to fulfil this right, namely the obligation to facilitate the realisation of the right. The state also has the obligation to provide assistance to those who cannot afford food as part of the obligation to fulfil the right, apart from having an obligation to refrain from interfering with existing access to food or protecting individuals from violations of their right of access to food by third parties.124
123 It could be argued that even these measures are constrained by budget considerations due to the need for human resources to study, plan, and implement them. However, much of the human resources needed is already available in government and it is not necessarily the case that these policies and programmes would be an added drain on the fiscus.
124 Chirwa, 2009, 19.
Another way of thinking about this
categorisation is that the policies
largely determine the “environment” and could make it more conducive to food
security, whereas the programmes affect
food security in a more immediate manner.

53 Policy analysis: Assessing the reasonableness of policies and programmes to ensure the right to food
Table 5: Programmes and Policies
Programmes Policies
Availability
� Agricultural support programmes: CASP, RECAP, Fetsa Tlala.
� Land Reform.
� Agricultural subsidies.
� Transport infrastructure (ports, railways, and roads) essential for food distribution.
� Trade agreements.
� Macroeconomic stability (currency and balance of payments).
� Agricultural policy (focus on staples, increased production).
� Environmental protection and sustainability.
� Protection of water supply.
Access
� Social security grants.
� National School Nutrition Programme.
� Community Nutrition Development Centres (CNDCs)
� Public transport infrastructure.
� Public Works Programmes.
� Assisting subsistence farmers and funding food gardens.
� VAT zero-rating.
� Inflation targeting.
� Town planning (including public transport).
� Monitoring food prices.
� Employment creation (focus policies on labour-intensive industries).
� Gender equity policies.
� BBBEE
� Policies around informal traders.
� Getting food retailers into under-serviced areas.
� Minimum-wage policy.
Use
� Integrated Nutrition Programme (Vitamin A supplementation, Deworming, etc).
� Healthcare.
� Basic services (water, sanitation, and electricity, etc.)
� Food fortification policy.
� Food safety regulations.
� Nutrition education.
� Promoting dietary diversity.
Stability � Emergency relief (food parcels from SASSA).
� To be developed.
In assessing government’s policies and programmes to address food insecurity, we also need to consider what is missing. Focussing only on the adequacy and effectiveness of extant policies and programmes could lead to tunnel vision. To do this, we need to outline food security concerns that are not currently being addressed by the policies in place. These include, but are not limited to:
� Gender equity,
� Climate change,
� Genetically modified organisms,
� Food waste,
� Urban informal settlements.
Assessing each of these issues and giving policy proposals falls outside the scope of this report. It is enough to highlight that the current programmes do not address these issues adequately. Some could be addressed by indirect means (regulations and policies) while others would require programmes with budgets housed and in a department.

54 The Right to Food in South Africa
Summary:
� Government is constrained in its actions by limited resources and must make trade-offs as it seeks to provide socio-economic rights.
� It is important that budget analyses are done to ensure that government is distributing its limited resources optimally.
� Not all government action is constrained by budgetary considerations. Right to food advocates need to pay attention to areas where government cannot appeal to limited resources as an excuse for not progressively realising the right to food.
� Advocates also need to consider what is missing from government programmes and policies.
3.4. Evolution of Policy Logic on the Right to FoodIn an increasingly urbanised country where the availability of food is not a pressing issue, questions around access and use, and the problems of income, employment, ownership and distribution all come to the fore. Research has found that an individual’s ability to access food is largely determined by his or her ability to (a) earn an income from employment (or self-employment); (b) receive social transfers; or (c) produce their own food (for those who are able). Of these three, employment and social transfers are the most critical in a largely urbanised (63% of South Africans live in urban areas125) and still urbanising (should reach 70% by 2030126) country like South Africa. This means that the right to food overlaps significantly with the right to work and the right to social security guaranteed under articles 6 and 9 of the ICESCR.127
In rural areas of the country, agricultural production for own use is still a significant part of access to food. In 2014, around 1.5 million128 people were involved in subsistence agriculture in South Africa while around 700,000 were employed in commercial agriculture (about 4.5% of total employment). While agriculture and own production currently play a relatively small role in ensuring access to food, this does not mean that they cannot be used better in future to promote access to sufficient, nutritious food. Creating more employment through labour-intensive agriculture and bringing small-scale farmers into the commercial food system could have a beneficial effect on poverty rates and thus access to food. However, it must be kept clear that this route to greater food security is primarily via agriculture as a potentially labour-intensive industry and not as a result of an availability (production) approach to food security.
It is clear looking at the development of policies, programmes and practice around the right to food in South Africa that certain evolutions in thinking have happened in theory: for example, with the four dimensions of food security now acknowledged in some government documentation.129 The practice within government around the right to food, however, is still very much entrenched in an outdated understanding of food security as strongly linked to production. Real emphasis is still very strongly around availability at the expense of all other dimensions. Availability of food in South Africa, however, is not actually a significant barrier to realising the right to food.
This understanding of the right to food has led to a number of quite concrete consequences; the most obvious one being leadership for food security being housed within the Department of Agriculture which is not well equipped to develop programming that is coordinated across a range of departments taking a rights-based approach. It is also not well equipped to drive a change in understanding of the underlying causes of food insecurity and the kinds of responses that are necessary to be effective in remedying it.
The right to food is notoriously cross-sectoral and requires an interdepartmental response at multiple levels to address the inherently different natures of food insecurity at different levels. There is a need to balance national food security, which has so far dominated the debate,
125 Nombembe, P. 2014. ‘Cities on the skids’, Timeslive. Available at: www.timeslive.co.za/thetimes/2014/08/18/cities-on-the-skids. 126 National Development Plan. 2012. Executive Summary, 19.127 De Schutter, O. 2014. ‘Final report: The transformative potential of the right to food’, United Nations.128 StatsSA. 2014. Quarterly Labour Force Survey, 2014:Q2. Statistics South Africa.129 This began with the IFSS but has been more consist in recent years, for example in the National Nutrition Strategy
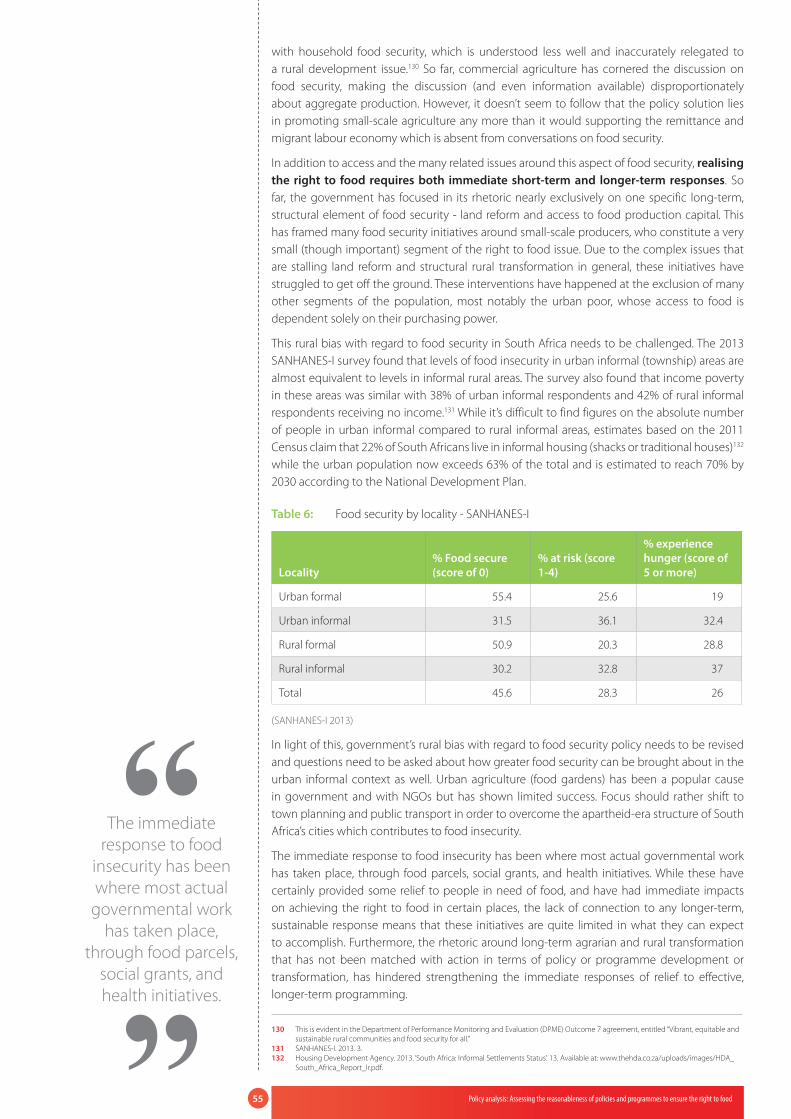
55 Policy analysis: Assessing the reasonableness of policies and programmes to ensure the right to food
with household food security, which is understood less well and inaccurately relegated to a rural development issue.130 So far, commercial agriculture has cornered the discussion on food security, making the discussion (and even information available) disproportionately about aggregate production. However, it doesn’t seem to follow that the policy solution lies in promoting small-scale agriculture any more than it would supporting the remittance and migrant labour economy which is absent from conversations on food security.
In addition to access and the many related issues around this aspect of food security, realising the right to food requires both immediate short-term and longer-term responses. So far, the government has focused in its rhetoric nearly exclusively on one specific long-term, structural element of food security - land reform and access to food production capital. This has framed many food security initiatives around small-scale producers, who constitute a very small (though important) segment of the right to food issue. Due to the complex issues that are stalling land reform and structural rural transformation in general, these initiatives have struggled to get off the ground. These interventions have happened at the exclusion of many other segments of the population, most notably the urban poor, whose access to food is dependent solely on their purchasing power.
This rural bias with regard to food security in South Africa needs to be challenged. The 2013 SANHANES-I survey found that levels of food insecurity in urban informal (township) areas are almost equivalent to levels in informal rural areas. The survey also found that income poverty in these areas was similar with 38% of urban informal respondents and 42% of rural informal respondents receiving no income.131 While it’s difficult to find figures on the absolute number of people in urban informal compared to rural informal areas, estimates based on the 2011 Census claim that 22% of South Africans live in informal housing (shacks or traditional houses)132 while the urban population now exceeds 63% of the total and is estimated to reach 70% by 2030 according to the National Development Plan.
Table 6: Food security by locality - SANHANES-I
Locality% Food secure (score of 0)
% at risk (score 1-4)
% experience hunger (score of 5 or more)
Urban formal 55.4 25.6 19
Urban informal 31.5 36.1 32.4
Rural formal 50.9 20.3 28.8
Rural informal 30.2 32.8 37
Total 45.6 28.3 26
(SANHANES-I 2013)
In light of this, government’s rural bias with regard to food security policy needs to be revised and questions need to be asked about how greater food security can be brought about in the urban informal context as well. Urban agriculture (food gardens) has been a popular cause in government and with NGOs but has shown limited success. Focus should rather shift to town planning and public transport in order to overcome the apartheid-era structure of South Africa’s cities which contributes to food insecurity.
The immediate response to food insecurity has been where most actual governmental work has taken place, through food parcels, social grants, and health initiatives. While these have certainly provided some relief to people in need of food, and have had immediate impacts on achieving the right to food in certain places, the lack of connection to any longer-term, sustainable response means that these initiatives are quite limited in what they can expect to accomplish. Furthermore, the rhetoric around long-term agrarian and rural transformation that has not been matched with action in terms of policy or programme development or transformation, has hindered strengthening the immediate responses of relief to effective, longer-term programming.
130 This is evident in the Department of Performance Monitoring and Evaluation (DPME) Outcome 7 agreement, entitled “Vibrant, equitable and sustainable rural communities and food security for all.”
131 SANHANES-I. 2013. 3.132 Housing Development Agency. 2013. ‘South Africa: Informal Settlements Status’. 13. Available at: www.thehda.co.za/uploads/images/HDA_
South_Africa_Report_lr.pdf.
The immediate response to food
insecurity has been where most actual
governmental work has taken place,
through food parcels, social grants, and health initiatives.

56 The Right to Food in South Africa
3.5. Conclusion (key findings, recommendations)Despite the right to food being explicitly recognised by government and enshrined in the Constitution, it does not fit easily into the existing bureaucratic organisation of government departments and agencies. The South African government, while active on realising the right to food through a number of initiatives, has nevertheless failed to develop a coordinated and comprehensive response to this right. While rhetoric occasionally indicates the social and political causes of food insecurity, when it comes to developing and implementing programmes, the right to food is still seen as a heavily technical issue and one that is strongly linked to agricultural production or, at best, social protection.
Civil society’s relative quiet on the right to food is ending and various organisations are beginning to come together to plan interventions to ensure the constitutional provision for sufficient food is translated into appropriate policy and implementable programmes. The following recommendations are important steps to ensure the heightened commitment to addressing food security in South Africa, as evidenced by the NDP and new policy on food security and nutrition, is actioned:
Recommendation 1A shared, multidisciplinary vision is required to clearly define the various dimensions of food security and the extent and core causes of food insecurity, which span elements of availability, access, stability and use, to inform the focus and priorities of policies and interventions. This vision needs to shift the discourse away from a narrow production and rural development paradigm and into a broader paradigm which acknowledges the inequality, exclusion and inadequacy in the food system. Such a vision must include both the national, household and individual nature of the right to food.
Recommendation 2This vision needs to combine political will at the highest levels with a strong, properly funded organisational mandate to drive this work. A food security unit within the Presidency, coordinated at a Ministerial level, could provide this role. This unit would take responsibility for ensuring the differentiated roles and responsibilities of various government departments who support the right to food are clearly delineated, institutionalised and budgeted for. This unit would also be responsible for improving coordination among national, provincial and local levels of government to work together to realise the right to food.
Recommendation 3Strong civil society action on the right to food is essential to engage government meaningfully in the development of policies and programmes to alleviate food insecurity. Civil society also has an important role in empowering citizens to claim their right to food and monitoring state actions. Civil society’s voice around realising the right to food and nutrition needs to be linked to broader struggles and discussions around what constitutes a decent living level in South Africa. This will then automatically link food security to education, health and social grants and widen the scope for interventions that go beyond agriculture.
Recommendation 4A legal framework to institutionalise the obligations on the state to realise the right to food needs to be developed through a participatory process and translated into appropriate policy and implementable programmes.
Recommendation 5Reliable and regular data on household food and nutrition security is critical to monitor and evaluate interventions. Investment in a monitoring system with measurement tools which generate indicators for the multiple dimensions of food security must be a priority.

57 Budget analysis: assessing the resource allocations and expenditures of government programmes to address the right to food
Budget analysis: assessing the resource allocations and expenditures of government programmes to address the right to food
State policies and programmes to provide for the progressive realisation of the right to food must receive adequate budgetary support if they are to be implemented effectively and attain their goals. This chapter undertakes a budget analysis of government programmes to address the right to food, and forms Step 2 of our 3-step analysis of the progressive realisation of the right to food. This step is vital to measure government’s effective and reasonable use of the available resources to realise this right.
Step 1: Policy Analysis
"The State must take reasonable
legislative and other measures"
• Assess the Policy E�ort• Constitutional obligations: reasonableness test• Content of SER policies & legislation and policy- making process• Implementation challenges & accountability mechanisms
Step 2: Budget Analysis
"within available resources"
• Assess Resource Allocation & Expenditure• Generation of government revenue• Allocation & expenditure of resources on SERs• Budget cycle process
Step 3: Indicators"to achieve the
progressive realisation of this
right"
• Monitor and Evaluate Attainment of the Right• Access indicators (physical and economic) • Adequacy indicators• Quality indicators
RECAP: The obligation to ensure socio-economic rights ‘within available resources’
Constitution of the Republic of South Africa,Section 27(3) Everyone has the right to have access to –
(b) sufficient food and water;
(4) The state must take reasonable legislative and other measures, within its available resources, to achieve the progressive realisation of each of these rights.
Section 28(2) Every child has the right –
(c) to basic nutrition, shelter, basic health care services and social services.
Chapter 2 of this paper identified and set out several obligations arising out of governments constitutional duty to realise socio-economic rights ‘within available resources’. This obligation
CHAPTER
4
This step is vital to measure government’s
effective and reasonable use of the available resources to
realise this right.

58 The Right to Food in South Africa
is firmly tied to the obligations to take ‘reasonable legislative and other measures’ to ‘achieve the progressive realisation’ of these rights, and is compatible with the international human rights law obligation of the ICESCR to use the ‘maximum available resources’ to fulfil SERs. Drawing on constitutional, regional and international jurisprudence and guidance, Chapter 2 identified the following budgetary obligations in relation to the right to food:
� Government must maximise the pool of resources available to it for the fulfilment of socio-economic rights, including the right to food;
� Precise budgetary allocations for SERs are for the government to decide, through participatory and transparent processes;
� The state must justify to rights-holders if the resources allocated to SERs (collectively or individually) are limited, insufficient or not efficiently discharged and effectively utilised towards their goals;
� The availability of resources is an important factor in determining the reasonableness of government’s efforts to fulfil the right to food;
� Appropriate resources must be identified and made available to fund the implementation of right to food policies and programmes;
� These resources must be sufficient to capacitate implementing actors to meet the objectives of these policies;
� Actors allocated resources for right to food programmes and initiatives must endeavour to spend the maximum budget available to them, with any under-expenditure reasonably justified. Actors must not spend more than has been allocated to them.
� In its budgetary allocations, the state must ensure that funds are available for the fulfilment of immediate needs and the management of crises’;
� The most cost-effective way of utilising resources should be identified, and any deviations from this planned expenditure justified;
� Resources must be used in such a way that they will have maximum impact on the enjoyment of the right to food;
� Appropriate resources must be allocated to ensure the components of food legislation and policy directed at children are fully implemented;
� Children and other vulnerable groups must be prioritised should competing interests with regard to resource allocation arise.
Other practical questions inherent in a human rights budget analysis can be grouped into four broad areas: adequacy, equity and priority, efficiency, and effectiveness.
� Adequacy: Are resource allocations transferred to implementing departments sufficient given the objectives of the programme, likely demand and the costs of intervention, and are they increasing in real terms over time? Are there any regressive spending patterns?
� Equity and Priority of allocations: Are resources being utilised to prioritise the needs of the most vulnerable and disadvantaged, to reduce disparities in line with the constitutional goal of substantive equality. Is the spread of resources across departments, spheres of government, geographic localities equitable and justified? Are funds available to cover emergency situations?
� Efficiency: Is the overall expenditure of the programme efficient given the costs of the intervention? Are institutions capable to spend the funds allocated to them efficiently? Are funds being accounted for and spent on their intended purpose? Are there any under or over-expenditure patterns? Can their cause and impact be identified?
� Effectiveness: Is the money being spent on the right things and having the desired results and impact? Is it bringing about tangible improvements in enjoyment of the right to food? Are targets being met? Is sufficient data available to assess this and it adequate monitoring taking place?
Finally, it should be noted that an assessment of resource availability and expenditure cannot be separated from an analysis of institutional arrangements, human resources and local capacity which are necessary for the efficient and effective spending of budgets.

59 Budget analysis: assessing the resource allocations and expenditures of government programmes to address the right to food
In this chapter, six case studies will be presented on various government programmes that have food security as one of their objectives. Each programme will be analysed with regard to its effectiveness in addressing food insecurity and with regard to its budget allocation, in accordance with the budgetary obligations incumbent upon government outlined above.
As will become clear, due to the range of factors that determine food security, the objectives and institutional arrangements of these programmes vary considerably. The National School Nutrition Programme, for example, has a clear mandate and has been largely successful in improving access to basic nutrition for millions of poor learners. The Comprehensive Agricultural Support Programme, on the other hand, has a range of objectives of which food security is peripheral, and it is not clear that this programme has had much of an impact on either national or household food security.
4.1. Case study 1: National School Nutrition Programme – Feeding Hungry Minds, by Zukiswa Kota133
In the 20th year of South Africa’s democratic era, the nation is reflecting on achievements and challenges in the advancement of social and economic rights. In particular, attention has been placed on government interventions towards the realisation of constitutionally-guaranteed rights such as the right to sufficient food. Government nutrition interventions in schools are a common way of addressing hunger and poverty. This approach recognises the impact of such interventions on children’s academic performance and school attendance. In South Africa, the National School Nutrition Programme (NSNP) supports over 9 million learners across the country. The NSNP is currently limited to learners in quintile 1 to 3 schools. While this constitutes a significant intervention for children from food insecure households, deserving learners in quintiles 4 and 5 are still excluded and in recent cases those that had been supported on the NSNP in some provinces have been ‘cut off’. Furthermore, while there have been several achievements associated with the NSNP, it is imperative that several issues relating to budget adequacy, effectiveness and programme sustainability are tackled in order to ensure that limited resources are optimally utilised.
Overall, between 2013/14 and 2015/16, the NSNP budget decreased in real terms by 0.54% while a minimal real increase of 3.22% is expected over the Medium Term Expenditure Framework. Several provinces such as the Eastern Cape, Gauteng, Kwazulu-Natal and Mpumalanga experienced budget decreases to the NSNP in 2014 in real terms. It was also found that despite past underperformance of the programme in some provinces, monitoring and evaluation continues to be a weak point across all NSNP programmes. In addition, this report cautions the Department of Basic of Education against the proposed reduction of the budget pertaining to monitoring and oversight of the NSNP. Critically, this report also places emphasis on the need for a drastic review of the quintile systems due to the influence they have on provisioning – or lack thereof – for vulnerable learners in quintile 4 and 5 schools.
This report concludes that while the NSNP has made substantial inroads and is a valuable intervention, the Department of Basic Education must take action to improve its current implementation in order to optimise the effective use of limited available resources.
133 Public Service Accountability Monitor (PSAM) Rhodes University, Grahamstown, South Africa.
In the 20th year of South Africa’s
democratic era, the nation is reflecting on achievements and challenges in
the advancement of social and economic rights. In particular, attention has been
placed on government interventions towards
the realisation of constitutionally-
guaranteed rights such as the right to
sufficient food.
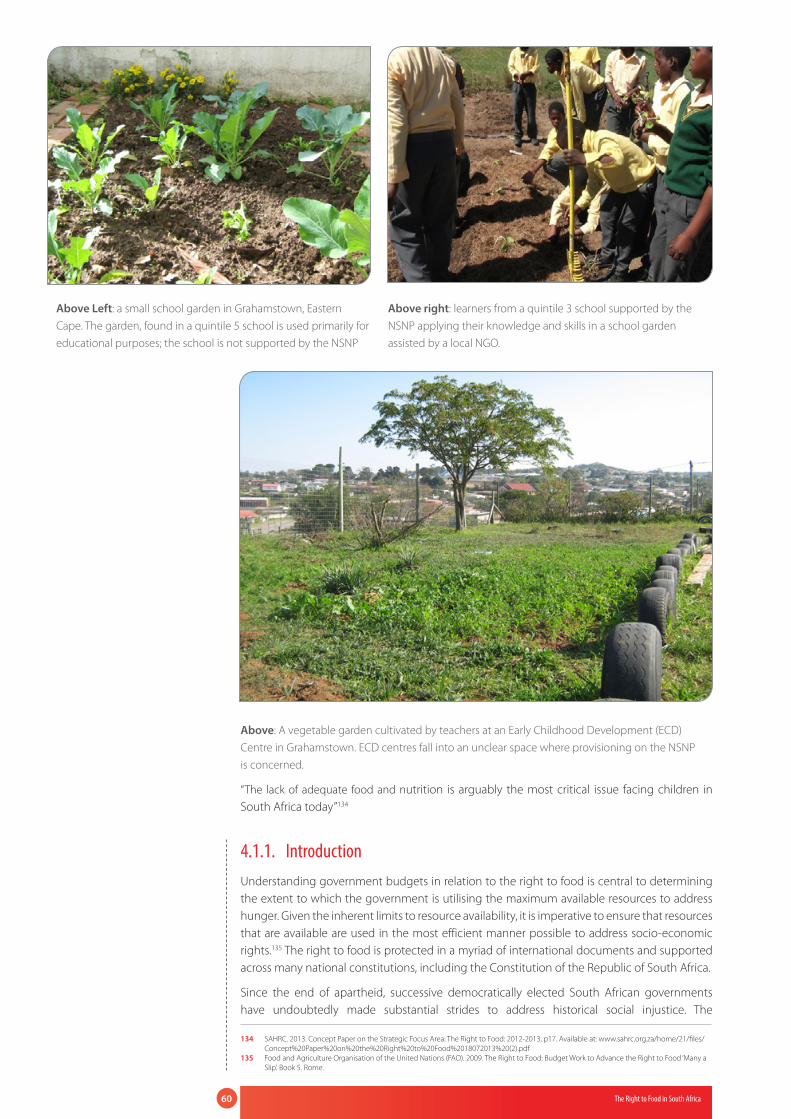
60 The Right to Food in South Africa
Above Left: a small school garden in Grahamstown, Eastern Cape. The garden, found in a quintile 5 school is used primarily for educational purposes; the school is not supported by the NSNP
Above right: learners from a quintile 3 school supported by the NSNP applying their knowledge and skills in a school garden assisted by a local NGO.
Above: A vegetable garden cultivated by teachers at an Early Childhood Development (ECD) Centre in Grahamstown. ECD centres fall into an unclear space where provisioning on the NSNP is concerned.
“The lack of adequate food and nutrition is arguably the most critical issue facing children in South Africa today”134
4.1.1. IntroductionUnderstanding government budgets in relation to the right to food is central to determining the extent to which the government is utilising the maximum available resources to address hunger. Given the inherent limits to resource availability, it is imperative to ensure that resources that are available are used in the most efficient manner possible to address socio-economic rights.135 The right to food is protected in a myriad of international documents and supported across many national constitutions, including the Constitution of the Republic of South Africa.
Since the end of apartheid, successive democratically elected South African governments have undoubtedly made substantial strides to address historical social injustice. The
134 SAHRC. 2013. Concept Paper on the Strategic Focus Area: The Right to Food: 2012-2013, p17. Available at: www.sahrc.org.za/home/21/files/Concept%20Paper%20on%20the%20Right%20to%20Food%2018072013%20(2).pdf
135 Food and Agriculture Organisation of the United Nations (FAO). 2009. The Right to Food: Budget Work to Advance the Right to Food ‘Many a Slip’. Book 5. Rome.

61 Budget analysis: assessing the resource allocations and expenditures of government programmes to address the right to food
formulation and implementation of progressive policy has seen important changes in access to housing, basic healthcare and education. Citing the introduction of “landmark” policies such as the South African Schools Act and the National Education Policy Act of 1996, Mestry and Ndhlovu agree that there is compelling evidence of the government’s efforts to address social justice in education136. Among these have been funding interventions to support school feeding programmes.
Over the past twenty years, however, “progress in tackling malnutrition has been pitifully slow”.137 This, according the Save the Children Fund, is representative of the global ‘picture’ of the fight against malnutrition both in terms of government and donor investment. In a recent report, the international community was said to be at a crossroads.138 This was highlighted in the context of sixteen high-burden countries whose governments have developed ‘costed’ plans to tackle malnutrition. The global charity organisation made a call to international donors and governments in developing countries to seize the opportunity to take action to address malnutrition. The Save the Children Fund laments the fact that despite the recognition of the cost effectiveness of nutrition interventions for a country, in the three years prior to 2013, donors only spent an average of 0.37% of total aid on nutrition interventions. It is reported that cost-benefit ratios for nutrition in reducing the burden of association diseases can be as high as 1:138.139
This case study uses a human rights framework as promoted by the UN Committee for Economic, Social and Cultural Rights (CESCR) to analyse South African government budgets for addressing hunger. In particular, the focus is placed on the DBE’s National School Nutrition Programme (NSNP). According to the FAO, budget analysis allows both civil society and government to assess the efficiency and effectiveness of resource use.140
As a starting point, the Preamble to the South African Schools Act (SASA) 84 of 1996 outlines the need for
…a new national system for schools which will redress past injustices in education provision, provide an education of progressively high quality for all learners…contribute to the eradication of poverty and the economic wellbeing of society,…and;…it is necessary to set uniform norms and standards for the education of learners at schools and … governance and funding of schools throughout the Republic of South Africa141…
In addition to the Constitution, the National Norms and Standards for School Funding provide a useful background to South African education budgets in relation to attempts to redress issues of past inequality and inequity within the country’s education system. It is important to keep in mind, therefore, that:
In terms of our Constitution and the Government’s budgeting procedure, the national Ministry of Education does not decide on the amounts to be allocated annually for provincial education departments. This is the responsibility of provincial governments and legislature, which must make appropriations to their education departments from the total revenue resources available to their provinces. Thus, each province determines its own level of spending on education, in relation to its overall assessments of needs and resources.142
Even more critically:
…the national and provincial levels of government will honour the state’s duty, in terms of the Constitution and the SASA, to progressively provide resources to safeguard the right to education of all South Africans. However, education needs are always greater than the budgetary provision for education. To effect
136 Mestry, R. and Ndhlovu, R. 2014. The implication of the National Norms and Standards for School Funding policy on equity in South African Public Schools. South African Journal of Education 34:3.
137 Save the Children. 2013. Food for Thought: Tackling Child Nutrition to Unlock Potential and Boost Potential, London, Available at: www.savethechildren.org/atf/cf/%7B9def2ebe-10ae-432c-9bd0-df91d2eba74a%7D/FOOD_FOR_THOUGHT.PDF
138 Ibid.139 Ibid.140 Food and Agriculture Organisation of the United Nations (FAO). 2009. The Right to Food: Budget Work to Advance the Right to Food ‘Many a
Slip’. Book 5. Rome.141 Preamble to the South African Schools Act (SASA) 84 of 1996142 Section 41 of the National Norms and Standards for School Funding GN 232-62 GG 19347 of October 1998. Notice in terms of the South
African Schools Act 84 of 1996, and section 3(4) (g) of the National Education Policy Act 27 of 1996.
In addition to the Constitution, the
National Norms and Standards for School
Funding provide a useful background
to South African education budgets in relation to attempts to redress issues of past
inequality and inequity within the country’s education system.

62 The Right to Food in South Africa
redress and improve equity, therefore, public spending on schools must be specifically targeted to the needs of the poorest.143
This report is concerned specifically with the NSNP and government provisioning for children’s right to food and basic nutrition within the public schooling system. According to a Statistics South Africa’s Report, Vulnerable Social Groups, the vast majority of South African children still live under conditions of poverty, facing significant inequality and poor health and education outcomes.144 The impacts of poverty and inequality have far-reaching implications for all highly-burdened countries. Adults who experience malnutrition during childhood, for example, are estimated to earn at least 20% less on average than those who did not.145
Between 2011 and 2012, the percentage of children living in households that reported hunger increased in the majority of populations (Figure 1). Between 2010 and 2011, however, a comparative look at the number of people living in households reporting hunger reflected significant decreases. Between 2010 and 2011, the percentage of all children living in these households decreased from 18.2% and 14.4%. The proportion of all South Africans living in households that reported hunger decreased from 15.9% to 12.8% between 2010 and 2011. This percentage increased to 13.1% for all South Africans, 15.3% for all children and 16.9% for African children in 2012 (Figure 1).
Figure 5: Percentage of Children Living in Households that Reported Hunger
2002 2003 2004 2005 2006 2007 2008 2010 2011 2012
All children 34.0 32.0 26.8 23.6 16.8 16.1 18.8 18.2 14.4 15.3
African children 39.0 36.9 30.9 26.7 19.1 18.0 21.1 20.1 15.7 16.9
Coloured children 16.5 13.5 11.2 13.1 9.9 11.9 10.9 15.5 13.3 12.4
Indian children 4.8 6.4 6.4 10.1 0.5 0.7 1.3 4.3 0.6 0.6
White children 2.2 2.4 0.6 1.0 1.0 0.2 3.0 0.7 0.3 1.5
South Africa 29.3 27.6 23.0 20.1 14.4 13.7 15.9 15.9 12.8 13.1
0.0
5.0
10.0
15.0
20.0
25.0
30.0
35.0
40.0
45.0
Perc
enta
ge
(Source: Stats SA 2013b)
According to the South African National Health and Nutrition Examination Survey (SANHANES-I) 2013, almost 25% of South Africans were at risk of hunger and another 25% experienced hunger.146 The research team outlined the need for the South African government to prioritise all aspects of food security while establishing a task team to focus on short, medium to long-term food security interventions for the various affected populations. Figure 1, taken from a report published by Statistics South Africa shows the percentage of children living in households that reported hunger between 2002 and 2012.147 The average for all children reflects that 15.3% of children in South Africa in 2012 lived in households that reported hunger. ‘African’ children were identified as the most likely to be living in household reporting hunger (16.9%) and the lowest percentage was amongst Indian children in 2012 (0.6%). The overall self-reported percentages of South African households experiencing hunger appears noticeably lower according to the Stats SA report as compared to the SANHANES. The overall national average has decreased from 29.3% in 2002 to 13.1% in 2012.148
143 Ibid; Section 44 (emphasis added).144 Statistics South Africa (StatsSA). 2013b. Social Profile of Vulnerable Groups 2002-2012. Available at: http://beta2.statssa.gov.za/publications/
Report-03-19-00/Report-03-19-002012.pdf. 145 Grantham-McGregor. S, et al. 2007. Development Potential in the first 5 years for Children in Developing Countries. The Lancet, 369:60-70.146 Shisana. O, et al. 2013. South African National Health and Nutrition Examination Survey (SANHANES-1). Cape Town: HSRC Press. Available at:
www.hsrc.ac.za/uploads/pageNews/72/SANHANES-launch%20edition%20(online%20version).pdf. 147 StatsSA. 2013b. 148 Ibid.
63 Budget analysis: assessing the resource allocations and expenditures of government programmes to address the right to food
A high percentage of South African children in rural areas depend on wild-growing foods (fruit, green leafy vegetables and roots) to supplement their daily nutritional needs as a result of living in food insecure households. A school-based study released in 2009, for example, revealed that 64% of school children and 40% of non-school-going children supplemented their diets with wild foods.149 In addition to enjoying the taste of the wild foods, children cited hunger as reasons for eating them. Children from rural communities are particularly vulnerable to hunger. There is a need, however, to map out the extent of food insecurity in rural and urban contexts as there may exist significant differences not only between but also within these contexts. This report also posits the need to review the exclusion of some children from a specific food security intervention – the NSNP.
Koch argues that South Africa is not likely to be given a priority ranking on the international agenda on food security given its status as a net exporter of agricultural commodities.150 Other reasons Koch gives for this is that South Africa is not landlocked, possesses an “innovative” constitution and has “no tight foreign exchange constraints”. In addition to this, according to studies by the Food and Agriculture Organisation (FAO), World Health Organisation (WHO) and the United Nations Educational and Scientific and Cultural Organisation (UNESCO), the three primary dietary deficiencies in South Africa are iron, Vitamin A and iodine.
In a study carried out in a peri-urban settlement of the Eastern Cape, it was found that while people’s dependence on wild foods has decreased, people from food insecure households still make use of various wild leafy vegetable species to supplement household diets.151 Furthermore, even though South Africa is not ranked amongst the countries that are hardest hit by hunger, South Africans are particularly vulnerable to micro-nutrient deficiencies. This has critical implications for children as micronutrient deficiency in the early stages of life has deleterious implications. According to Georgieff and Rao, iron deficiency prior to three years of life can significantly and potentially permanently impact on myelin which in turn has damaging effects on nerve cells in the brain that facilitate the rapid transmission of information and other complex neural processes.152 Combined with other factors, maternal and infant iron deficiencies place children at increased risk of future mental and physical impairments.
The South African governments first comprehensive policy to tackle food insecurity – the Integrated Food Security Strategy (IFSS) – was launched in 2000 with the aim of creating a comprehensive, multi-sectoral approach (government and civil society) towards addressing food insecurity. The lead department for the implementation of the strategy was the Department of Agriculture and Land Affairs. The IFSS was designed for integration across various government departments to focus on public spending on enhancing the food security of historically disadvantaged populations.153 The post-apartheid government created distinct policies that saw increased spending in areas such as school feeding, free child health services, child support grants, maternal health and pensioners. The IFSS initially became the IFSNP (The Integrated Food Security and Nutrition Programme). Then in 2013, a National Policy on Food and Nutrition Security was created following a review of the IFSS. In a document published by the Departments of Social Development and Agriculture, Forestry and Fisheries; three reasons were given for the need of a new strategy:
1. To establish common definitions and measures for food security and nutrition in South Africa aligned with the National Development Plan 2030;
2. To provide an over-arching guideline for government and civil society interventions and synergies;
3. To provide parameters for South Africa’s regional and international obligations for food security.154
This revised policy identifies key dimensions of food security: adequate availability of food; physical, social and economic accessibility of food; utilisation, quality and safety of food, and stability of food supply (DAFF and DSD, 2013). Also outlined are key ‘pillars’ of food and
149 McGarry, D. and Shackleton, C. 2009. Children Navigating Rural Poverty: Rural Children’s Use of Wild Resources to Counteract Food Insecurity in the Eastern Cape, South Africa. Journal of Child Poverty 15: 19-73.
150 Koch, J. 2011. The Food Security Policy Context in South Africa: Country Study # 21 International Policy Centre for Inclusive Growth. Available Online: www.ipc-undp.org
151 Kota, Z. & Shackleton, S. 2014. Harnessing Local Ecological Knowledge to Identify Priority Plant Species for the Restoration of Albany Thicket, South Africa. Forest, Trees and Livelihoods. 2-16.
152 Georgieff, M., & Rao, R. 1999. The role of nutrition in cognitive development. In: Nelson CA, Luciana M, editors. Handbook in Developmental.153 DoA, 2002. The Integrated Food Security Strategy for South Africa. Pretoria, South Africa.154 National Policy on Food and Nutrition Security, 2013.
In a study carried out in a peri-urban settlement of the
Eastern Cape, it was found that while
people’s dependence on wild foods has decreased, people from food insecure
households still make use of various wild leafy vegetable
species to supplement household diets.

64 The Right to Food in South Africa
nutrition security amongst which are effective food assistance networks which “could include an expanded and enhanced school nutrition programme”. Most recently (22nd August 2014), the Department of Agriculture, Forestry and Fisheries (DAFF) gazetted the ‘National Policy on Food and Nutrition Security for the Republic of South Africa”. The policy is intended as a key component of delivery against the objectives of the National Development Plan (NDP). The implementation of the policy is to be primarily led by DAFF and the Department of Social Development.
That “South Africa has enough food for its people”155 is an important assertion given the statistics on self-reported hunger and food insecure households. It is thus important to delve into the status of the right of access to sufficient food in the country. The right to sufficient food and basic nutrition is enshrined in the South African constitution, as well as a regional and international human rights law. It is against the backdrop of the constitutional and international obligations identified in Chapter 2 of this paper that the Department of Basic Education’s NSNP will be scrutinised in this report.
The South African Human Rights Commission (SAHRC) has noted the particular vulnerability of children given their nutritional requirements for growth and development and their dependence on adult caregivers for the provision of basic resources such as food and water. “The lack of adequate food and nutrition is arguably the most critical issue facing children in South Africa today”.156 The DBE has acknowledged shortcomings in the provisioning of food to learners in the NSNP. It has been reported to the SAHRC that some provinces have failed to ensure the implementation of the prescribed menus, partially as a result of corrupt activities in some provinces and partly due to a lack of capacity in others.157 While this report does not explore the instances and effects thereof, corruption and maladministration have been inadequately investigated and reported on by government. In several cases, provincial education departments’ annual reports point to ‘ongoing investigations’ with long delays in disciplinary procedures. The impact of corruption and poor capacity on the delivery of food to learners is certainly deserving of further in-depth research.
Lastly, it is important to assert that while highly useful, budget analysis does not encompass the entire spectrum of complexity when it comes to the right to food but forms an important foundation. In the same way, improved funding policies and increased budget allocations do not provide solitary solutions to inequality; it is equally important to focus on systemic, qualitative interventions as well.158
4.1.2. Objectives of the case studyThis case study attempts to explore core aspects of budgeting for the right to food in South Africa by focussing on one component of government food security interventions. As mentioned above, the NSNP has been a core aspect of IFSS, IFSNP and now the National Policy on Food and Nutrition Security. A primary objective is to examine key budgeting and planning trends of the NSNP.
It is important to conceptualise this case study under the broader umbrella of a variety of other nutrition interventions within the IFSS or Nutrition Security Policy. Given the limited coverage of the NSNP (food is served only on school days and once a day), it cannot – and should not – be viewed in the same light as more comprehensive nutrition programmes would be. This case study is therefore premised on the assumption that the NSNP is merely one of several government interventions intended to address issues of food insecurity and malnutrition in South Africa. In addition to these, the recently gazetted Food and Nutrition policy outlines several interventions that are implemented and promoted by various government custodian departments such as the Vitamin A supplementation programme of the Department of Health (see case study below). The policy acknowledges that addressing malnutrition and food insecurity is a complex process that requires interdisciplinary and interdepartmental interventions.
155 Brand, D. 2009. Between Availability and Entitlement: The Constitution, Grootboom and the Right to Food. Law, Democracy and Development. 1-26. Cognitive Neuroscience, Cambridge, MA: MIT Press, p 491-504
156 South African Human Rights Commission (SAHRC) (2013). Concept Paper on the Strategic Focus Area: The Right to Food 2013-2014. Available at: www.sahrc.org.za/home/21/files/Concept%20Paper%20on%20the%20Right%20to%20Food%2018072013%20(2).pdf.
157 Ibid158 This case study is extracted from a larger research paper that also considers- in addition to issues of costing, non-financial public resource
management questions.

65 Budget analysis: assessing the resource allocations and expenditures of government programmes to address the right to food
4.1.3. A brief history of the School Nutrition Programme
4.1.3.1. Programme inception and structure
The NSNP was first introduced as part of a poverty alleviation strategy in 1994 by the newly democratic South African government within the Reconstruction and Development Programme (DoE, 2004). Its inception was announced by President Nelson Mandela during his State of the Nation Address on 24 May 1994 and was officially introduced into schools in September 1994.159 The programme was initially housed within the Department of Health (DoH) and experienced mixed success. According to the manual and guiding document produced by the Department of Education (DoE) in 2004, the DoE commenced its version of the NSNP on 10 April 2004 focussed on primary schools in quintiles 1 to 3. Several models of delivery of the NSNP were implemented following the move of the programme from the DoH to the DoE. In the Eastern Cape, for example, this included the:
1. Centralised Model (implemented entirely by the ECDoE),
2. the Cooperative Model (implemented by schools and communities) and the
3. Decentralised Model (implemented by the district and schools).160
Under the custodianship of the DoE, the NSNP also experienced several problems including the complete collapse of the programme in the Eastern Cape in 2006.161 A detailed outline of the provincial department’s attempts to solve the problems highlighted the need for district and school administrators to follow administrative requirements after reports of “…irregularities and fraud that have crippled the programme” (Appendix: Extract 1). On a national scale, several research and media reports showed the programme was beset with many challenges. Amongst these were irregular feeding times at schools, nutritionally poor quality of food, late delivery of food to schools, poor geographical coverage and poor programme performance as a result of inadequate human resource capacity.162
In 2006, a survey by the Fiscal and Finance Committee highlighted the need to extend coverage of the programme. In response to this, the Minister of Finance at the time outlined a budget that also included secondary school learners in quintile 1 in October 2008.163 The NSNP is funded primarily through quarterly conditional grant transfers to provinces. At the level of the (now) Department of Basic Education (DBE), the programme is located within the Care and Support in Schools sub-programme and is aimed at improving access to education and learning (DBE, 2013). Between 2012/11 and 2013/14, the NSNP saw an increase in its budget allocation in order to include all primary and secondary learners in quintiles 1 to 3. All public schools are categorised on a national ranking mechanism from quintile 1 – 5 with quintile 1 comprising of the most poorly-resourced schools serving learners from the most vulnerable households. Currently, all learners in quintile 1 to 3 schools, which are also non fee-paying schools, and selected special schools are targeted on the NSNP.164
Provincial departments of education are accountable for the management and utilisation of the funds as well as the monitoring of implementation. The various roles of the DoE, provincial departments, school governing bodies, principals and educators are outlined according to the Division of Revenue Act (DoRA), the South African Schools Act (SASA) and the Public Finance Management Act (PFMA). The national department is responsible for, among other things, planning the conditional grant, developing the necessary NSNP guidelines, monitoring provincial expenditure (and accounting to National Treasury) as well as providing support to provincial departments. At school and district level, each provincial department provides funding for the NSNP to schools based on the quintile classification system.
Currently, the two primary models used in procuring food for the NSNP nationally are the centralised and decentralised models. The former is followed in Gauteng, KwaZulu-Natal,
159 Zafar, S. Kgobe, P., Napo, V., and Parker, B. 2005. An Analysis of the South African Education Policy from a Child Labour Perspective: Full Report of the Centre for Education Policy Development (CEPD). Department of Labour, Republic of South Africa and the International Labour Organisation, Pretoria, South Africa.
160 Fumba, L. 2007. Occasional Paper: A Study into the Delivery of the School Nutrition Programme (SNP) in Selected Schools and Districts in the Eastern Cape. Public Service Accountability Monitor (PSAM), Monitoring and Advocacy Programme. Grahamstown, South Africa.
161 Ibid162 Zafar et al 2005.163 DoE, 2009. National School Nutrition Programme: A Guide for Secondary Schools. Sol Plaatjie House, Pretoria.164 Wenhold, F., Rendall-Mkosi, K., and Sibanda, N. 2013. Case Study of the National School Nutrition Programme in South Africa. University of
Pretoria, South Africa.
In 2006, a survey by the Fiscal and
Finance Committee highlighted the need to extend coverage of the programme. In response to this,
the Minister of Finance at the time outlined a budget that also included secondary school
learners in quintile 1 in October 2008.

66 The Right to Food in South Africa
Limpopo, Mpumalanga and Western Cape, and the latter is used in the Eastern Cape, North West, and the Free State.165 Through the decentralised modeI of procurement, money for the NSNP is transferred to individual schools and school committees are responsible for inviting and awarding tenders for food suppliers from local communities. While parents and community members may be involved in the school’s NSNP, it is envisioned by the DBE that that school must create a ‘school nutrition committee’ that, amongst others, includes food handlers, a gardener and the school’s NSNP coordinator. This structure is in many respects distinctly different to that of the school governing body (SGB).
In the centralised model, food suppliers are contracted through a tender system via provincial education departments. Both appointment and payment is thus done centrally by the head office with districts playing an important administrative role after the disbursement of funds from the province. The awarding of tenders is guided by the Preferential Procurement Policy Framework Act, 2000.166 Prior to 2004, food served on the NSNP was a fortified biscuit or peanut butter sandwich for primary school learners. Currently, DBE regulations stipulate the serving, by 10h00 daily on school days, of a cooked meal that accounts for at least 30% of a child’s daily nutritional requirements.167
In more recent times, however, several problems have continued to plague the NSNP; most notably in provinces such as Limpopo (2012) and the Eastern Cape where allegations of tender fraud, corruption and maladministration of grant funds have been rife (Appendix: Extract 2).
4.1.3.2. Objectives of the NSNP and legislative framework
In addition to the right to food as enshrined in the constitution, the NSNP aims to “foster better education by enhancing children’s active learning capacity168”. In addition to this, the programme seeks to “address barriers to learning associated with hunger and malnutrition by providing nutritious meals to learners on all school days169”. According to the DoE, the objectives of the NSNP are to:
1. contribute to improving learning capacity,
2. promote self-supporting school food gardens and other production initiatives, and
3. promote healthy lifestyles amongst learners.170
The South African Human Rights Commission (SAHRC) outlines state obligations on the right to food which include the creation of an enabling environment in which all people are able to exercise their right to food. This is inclusive of policies and legislation geared towards adequate food supply and distribution. The SAHRC also highlights the state’s obligation in the delivery of public education on the right to food.171 Embedded in Section 26 and 27 of the South African Constitution are the state’s obligations to ensure that everyone has the right to sufficient food and water (s.27 (1)(b)) and according to Section 27(2) that:
The state must take reasonable legislative and other measures, within its available resources, to achieve the progressive realisation of each of these rights.
Prior to the recent policy on food and nutrition security, the framework guiding all government departments responsible for the fulfilment of this right across all spheres of government was limited at best. Its effectiveness remains to be seen as the policy implementation plan is currently at the draft/planning stages.
The significance of the NSNP in the lives of many learners from food insecure households should not be underestimated. This was starkly highlighted by a Public Service Commission evaluation in which learners in Limpopo commonly used NSNP food in a form of ‘stokvel’. This informal practice amongst learners allowed small groups of learners to jointly accumulate food provided on the NSNP to take home to their hungry families.172 While this was more of an
165 Ibid166 Ibid167 DoE. 2009. National School Nutrition Programme: A Guide for Secondary Schools. Sol Plaatjie House, Pretoria.168 Ibid 169 DBE. 2013. DBE annual report 2012/2013. Republic of South Africa. See: www.education.gov.za 170 DoE. 2009. National School Nutrition Programme: A Guide for Secondary Schools. Sol Plaatjie House, Pretoria.171 SAHRC. 2004. The Right to Food: 5th Economic and Social Rights Report Series 2002/2003 Financial Year. Available at: www.sahrc.org.za/
home/21/files/Reports/5th_esr_food.pdf. 172 Public Service Commission (PSC). 2008. Report on the Evaluation of the National School Nutrition Programme (NSNP). Pretoria, South Africa.
The significance of the NSNP in the lives
of many learners from food insecure
households should not be underestimated.

67 Budget analysis: assessing the resource allocations and expenditures of government programmes to address the right to food
anecdotal observation than a central finding of the research, it is an important indicator of a possible need to interrogate the adequacy of provisioning within the programme.
4.1.4. Budget analysis and strategic plan evaluation of the NSNP
4.1.4.1. Adequacy of overall NSNP budget
The NSNP currently supports more than 9 million children nationally. In 2011, with a total public school-going population of 12.3 million, approximately 70% of all children attending basic education institutions in South Africa were fed on the programme. In 2013/14, feeding 9.1 million learners, 76.3% of all learners in public schools were fed on the NSNP.173 The majority of the learners fed are those in No Fee schools. In its 2013/14 Annual Report, the DBE reported that there were a total of 8.8 million learners benefitting from No Fee schools, equating to 77.6% of all learners nationally. The highest coverage was reported in the Eastern Cape (92.9% - 1.6 million learners), the North West (93.1% - 178 000) and Limpopo (96.2% - 1.59 million learners). The lowest percentage was reported in the Western Cape (39.5% - 374 000 learners) and Gauteng (61.9% - 1.11 million). These percentages of learners benefitting from the programme correlate to some degree with the number of learners benefiting from No Fee schooling; the largest numbers of such schools exists in the Eastern Cape. However, given the relative dynamism of the education landscape (learner migration, school closure, and attrition rates), information about the distribution of vulnerable learners needs continuous updating in order to effectively and efficiently respond to change.
The question of ‘adequacy’ attempts to determine the degree to which resources allocated for food programmes and transferred to departments can be said to be sufficient given the demand and the costs of the intervention. In addition to this, it is important to consider budget allocation trends: are budgets increasing in real terms over time? Are allocations regressive or progressive? What justifications and explanations are provided in departmental budget and planning and documents?
Table 7: Provincial & National NSNP Expenditure & Allocations: 2010/11-2016/17174
2010/11 2011/12 2012/13 2013/14 2014/15 2015/16 2016/17
Nominal change
over MTEF
Nominal change
between 2013 &
2014 (%)
Real change
between 2013 &
2014 (%)
Eastern Cape 696 723 838 925 892 095 949 162 984 548 1 020 116 1 074 182 2.95 3.73 -2.29
Free State 189 926 248 201 257 762 274 820 299 205 317 157 333 966 3.73 8.87 2.55
Gauteng 358 975 468 832 584 640 616 516 640 541 678 974 714 960 3.73 3.90 -2.13
KwaZulu-
Natal 855 285 1 144 368 1 085 489 1 206 190 1 237 534 1 287 034 1 355 247 3.08 2.60 -3.36
Limpopo 654 383 779 024 959 029 932 050 991 153 1 030 799 1 085 431 3.08 6.34 0.17
Mpumalanga 396 785 447 973 506 561 504 835 524 913 545 910 574 843 3.08 3.98 -2.06
North West 250 289 311 080 323 345 354 858 366 890 381 566 401 789 3.08 3.39 -2.61
Northern
Cape 84 536 105 116 113 136 119 859 134 645 142 724 150 289 3.73 12.34 5.82
Western Cape 169 775 230 041 236 669 265 103 282 486 299 435 315 305 3.73 6.56 0.37
National 3 663 326 4 578 752 4 906 464 5 173 081 5 461 915 5 703 715 6 006 012 3.22 5.58 -0.54
(Source: National Treasury, 2014; Division of Revenue Act, 2014; and relevant Estimates of Provincial Revenue and
Expenditure, 2014)
173 Department of Basic Education. 2014. National Assembly Written Reply Question 643: Internal Question Paper 05/14: 18/07/2014. Available at: www.education.gov.za/LinkClick.aspx?fileticket=q5plgZH1CHk%3d&tabid=1200.
174 Figures in this table are expressed in nominal terms with an indication of the real change between 2013/14 and 2014/14 as well as the nominal change in allocation over the MTEF. For provincial and national budget allocations expressed in real terms (2010/11 to 2013/14) – refer to Table 3 in the Appendix.

68 The Right to Food in South Africa
Table 7: Provincial & National NSNP Expenditure & Allocations: 2010/11-2016/17 outlines provincial and national NSNP expenditure and projected allocations. Also reflected in Table 7 are the nominal and real changes between 2013/14 and 204/15 financial years. In terms of nominal increases from the 2013/14 adjusted appropriation, the highest nominal increase is expected in the Northern Cape Province (12.34%) – equating to a real increase of 5.82%. The Eastern Cape and KwaZulu-Natal constitute the two biggest education departments with the highest numbers of learners: a fact reflected in the respective budget allocations. The Eastern Cape is the province with the highest proportion of schools that are de facto eligible to be supported by the NSNP by virtue of being non-fee-paying schools. Interestingly, Kwazulu-Natal has a comparatively low percentage of learners in No Fee schools.
4.1.4.2. Efficiency175 of allocations and use of maximum available resources: under-spending trends
Expenditure in 2013/14 for each of the provincial departments reflects positive trends. This is despite under-expenditure in several departments prior to 2012/13. The KZNDoE underspent on the NSNP by R 93.8 million in 2012/13 and by R 27 million in 2011/12.176 177 The Western Cape Department of Education underspent on its 2012/13 NSNP budget of R 245 million by 3.6%.178 The reasons for this and other provinces’ under-spending on the programme varies but often relate to late invoices for food supplied, late payments of suppliers and/or food handlers. Findings of a budget analysis released in 2013 by the PSAM revealed that the NSNP was one of three programmes to which an overall departmental under expenditure of R 691.9 million (2.6%) was attributed (2012/13 budget) in the Eastern Cape. Positively, however, the ECDoE nutrition programme remains, generally, financially stable in as far as financial management and reporting at the level of Head Office. To determine the true state of affairs, a forensic evaluation that is inclusive of school-level financial management is necessary given the decentralised nature of the programme in the Eastern Cape.
Equity, non-discrimination and priority of allocations:179 reaching the most vulnerable of all - quintile targeting Amongst the important areas in need of further research is the efficacy of using the quintile system as a measurement - in as far as reaching the most vulnerable learners, regardless of the ‘wealth’ of their school. As will be discussed, a concern of the SAHRC is the lack of support for learners who are food insecure in quintile 4 and 5 schools as the NSNP covers the first three quintiles only. Inversely, Wenhold et al (2013), reporting on focus group discussions of educators and learners in the Eastern Cape and Limpopo, outlines the fact that even within quintile 1-3 schools not all learners targeted for feeding are food insecure, leading to significant food wastage in some instances. This report illustrates that, in some cases, learners who are targeted by the programme may be from food secure households and, as a result, prefer to provide their own food.
The most recent Annual Report of the NSNP (2013/14) states that compared to the previous year (2012/13), the number of learners fed on the programme decreased by 718 252. The reason given for this related to “non-submission of quarterly performance indicators by provinces”.180 This should be a cause for concern i.e. not knowing how many children are actually fed in some provinces.
The NSNP in its current form is not designed to reach all South African learners. It is also not currently reaching all vulnerable learners within the schooling system. The trends reflected in Figure 2 in relation to the geographic spread of the NSNP may be said to loosely reflect the areas of greatest vulnerability or food insecurity. This is not, however, explicitly outlined in NSNP annual reports nor is there an indication of the basis on which targets are rolled out. A
175 This is an important question that explores how (and if ) funds are spent on the intended purpose or whether they are redirected, lost or wasted.
176 Kwazulu-Natal Department of Education (KZNDoE). 2013. Annual Report 2012/13. p.41.177 Kwazulu-Natal Provincial Treasury. 2014. Estimates of Provincial Revenue and Expenditure 2014/15. p.44.178 Western Cape Department of Education. 2013. Annual Report 2012/13.179 The ‘equity and non-discrimination’ question attempts to characterise the spread of allocations and the extent to which the spread
(geographic, demographic) is equitable and reasonable given the objectives of the NSNP. In addition, this question explores the extent to which resources are utilised to prioritise and ensure coverage for the needs of the most vulnerable and to reduce disparities in access to sufficient, nutritious food.
180 Department of Basic Education. 2014. National Assembly Written Reply Question 643: Internal Question Paper 05/14: 18/07/2014. Available at: www.education.gov.za/LinkClick.aspx?fileticket=q5plgZH1CHk%3d&tabid=1200.
Amongst the important areas
in need of further research is the
efficacy of using the quintile system as
a measurement - in as far as reaching
the most vulnerable learners, regardless
of the ‘wealth’ of their school.

69 Budget analysis: assessing the resource allocations and expenditures of government programmes to address the right to food
particularly telling fact is that whilst the data from provincial departments of education are vital, the DBE itself relies not on this data but on Statistics South Africa data in order to determine the percentage of children that receive a daily meal on the NSNP. This is in spite of the fact that this is an indicator (25) within the DBE’s own strategic plans. In addition to this, provincial departments are not in a position to accurately determine whether or not quality school meals actually reach the intended target groups and with what frequency.181
Table 8: Number of learners benefitting from NSNP in Limpopo 2010/11-2016/17
Audited/actual performance Est. Medium term targets
2010/11 2011/12 2012/13 2013/14 2014/15 2015/16 2016/17
No. accessing NSNP
1435516 1591029 1585630 1612695 1593715 1593715 1593715
(Source: LDoE, 2014)
Between 2011/12 and 2012/13 the number of learners that were fed on the programme in Limpopo decreased. A total of 4 399 fewer learners were fed in 2012/13 (Table 8). Between 2013/14 and 2014/15 a similar trend is expected with considerably fewer numbers of learners being fed. The programme will be feeding 18 980 fewer learners in Limpopo in 2014. Despite this huge reduction in the number of learners accessing the feeding programme, the budget increases by 0.17% in real terms – from R 932.1 million to R 991.2 million, equating to 6.34% in nominal terms.
The number of beneficiaries of the NSNP exceeded the targets set in 2013. The DBE (2013:154) reported that the reason for this positive variance of targeted learners and the number that were actually fed on the NSNP in 2013 was a result of increases in the number of learners in several provinces, including Limpopo. The Western Cape, North West and Eastern Cape were the other provinces that contributed to the 2013 NSNP target being overshot by 267 685 learners. With respect to Limpopo, it would appear that the number of learners fed on the programme increased between 2012 and 2013 and then decreased radically between 2013 and 2014. While the numbers of learners fed is reported by departments on a quarterly or annual basis, detailed justification for changes benefitting learners is often omitted. This presents an obstacle for valuable monitoring evaluation. The LDoE182 reported, however, that the number of No-Fee schools was decreased from 3 861 to 3 832 between 2012/13 and 2013/14 which appears to contradict the DBE’s justification for the variance in learner numbers. A possible explanation for this is the merging of No Fee schools.
Between 2014/15 and 2016/17, the number of learners targeted on the NSNP in Limpopo is set to remain stagnant at 1.59 million learners. While the province has no plans to build new schools in 2016/17, 42 are planned for 2014/15 and two in 2015/16.183 It is not clear whether the 42 schools to be built will require support from the NSNP as no data for the planned establishment of No-Fee schools is provided in the most recent LDoE Annual Performance Plan beyond 2013/14.
181 Wenhold et al 2013. 182 Limpopo Department of Education (LCDoE). 2014. Annual Performance Plan 2014/15.170.183 Ibid p.102.
Between 2014/15 and 2016/17, the
number of learners targeted on the NSNP in Limpopo is set to remain stagnant at
1.59 million learners.

70 The Right to Food in South Africa
Figure 6: NSNP nominal Change between 2014/15 and 2016/17 and real change between 2013/14 and 2014/15 (%)
EC FS Gtg KZN Lmp Mp NW NC WC SANominal change over MTEF 2.95 3.73 3.73 3.08 3.08 3.08 3.08 3.73 3.73 3.22Real change between 2013 &
2014 (%) -2.29 2.55 -2.13 -3.36 0.37 -2.06 -2.61 5.82 0.37 -0.54
-4
-2
0
2
4
6
8
Perc
enta
ge re
al/n
omin
al c
hang
e
(Source: National Treasury)
Figure 6 outlines the nominal change in the budget for the NSNP between 2014/15 and 2016/17 (MTEF). Also illustrated are the real changes between 2013/14 and 2014/15 for each of the provincial departments as well as for the national department. The majority of the DBE’s support for this programme is through conditional grant transfers to provinces.184 The national budget reflects a real decrease of 0.54% between 2013/14 and 2014/15. In addition to this, the majority of provinces also reflect budget decreases in real terms; 2.29% in the Eastern Cape, 2.13% in Gauteng, 3.36% in Kwazulu-Natal, 2.06% in Mpumalanga and 2.61% in the North West province (Figure 6). The Free State and Northern Cape provinces at 3.73% and 5.82% respectively reflect the most notable increases in real terms. There is no clear explanation in the relevant documents for this variation.
Given the fact that over the past few years several departments have tended to reduce targets for NSNP beneficiaries only to deviate from or overshoot the reduced targets, the reduction of some budgets in real terms is concerning. If, as the DBE intends, learners in special schools are to be formally included in forthcoming targets – how is this to be achieved within current budget allocations? In the Gauteng province, for example, reductions in the 2014/15 budget for the NSNP have been accompanied by a reduction in the numbers of learners fed. There are a few changes worth noting over the MTEF. In the first instance, the DBE outlines the following according to a National Treasury publication (2014):
(T)o give effect to Cabinet approved budget reductions, the department will reduce spending in this programme by R 3.2 million over the medium term on the administration portion of the national school nutrition programme grant. These reductions are to be mainly effected in spending on travel and subsistence through implementing efficiency measures such as reducing the size of teams that travel on oversight visits…
The Department states that these reductions will not have a negative impact on service delivery. Given past and current evidence to the contrary, there is a great need for more effective and regular monitoring of the NSNP across all provinces, these budget reductions may well prove to be ill-advised. In 2008, the Public Service Commission (PSC) found that in both Limpopo and the Eastern Cape, schools reported weak monitoring and evaluation of the NSNP by departments despite frequent reports of corruption. Similarly, a series of UNICEF185 reports across the nine provinces found that monitoring and evaluation systems at both provincial and district level were very weak. More recently, a 2010 expenditure tracking survey carried out by the Public Service Accountability Monitor revealed similar problems and recommended ways in which monitoring of public resource flows in the programme could be better facilitated. It is important to note two things: firstly, that since each of these evaluations was carried out
184 National Treasury, 2014. Estimates of National Expenditure 2014/15 Vote 15: Basic Education. www.treasury.gov.za/documents/national%20budget/2014/enebooklets/Vote%2015%20Basic%20Education.pdf
185 UNICEF. 2008. Evaluation of the School Nutrition Programme: Provincial Report: Eastern Cape. Pretoria, South Africa.

71 Budget analysis: assessing the resource allocations and expenditures of government programmes to address the right to food
some of these provincial delivery models have been changed; and secondly, that there has been a limited number of recent evaluative studies carried out in a comprehensive manner. This is especially critical for provinces whose nutrition programmes are decentralised. It can be assumed that while the decentralisation of procurement, supplier appointment and payment from province and district to school level can increase programme efficiency, the increased scope of such processes requires greater rigor where monitoring and oversight is concerned.
In the third quarter of 2013/14, the DBE reported that in 70 schools across five districts in Kwazulu-Natal and in 150 schools across four districts in Limpopo there was no feeding of learners. It is thus rather disconcerting that only 150 schools nationally were subjected to monitoring by the DBE.
Equity and Quintile Targeting As previously noted, the DBE reduced the number of learners fed on the NSNP in 2013/14 by approximately ½ million learners (from 9.2 million to 8.7 million) owing to the extension of the programme to additional learners that provincial departments had fed from their own budgets. It is not clear whether alternative measures have been put in place to mitigate against potentially negative impacts and to support these additional learners. Effectively, the programme had been extended to feed ineligible learners. There have, according to reports, been further cuts reported at the provincial level in 2014/15. The impact of these reductions, it appears, has been under-estimated by the DBE. On 3 October 2014, the Federation of Governing Bodies of South African Schools (FEDSAS) announced that 64 000 learners in the Gauteng province would be cut off from the NSNP. This, according to FEDSAS, is a result of the learners being in quintiles 4 and 5 schools and thus being ineligible to be supported by the programme (Appendix: Extract 3). Similar reports were made in national media in 2012 in which hundreds of schools in Kwazulu-Natal appealed for support in feeding hungry learners within the wealthiest school categories (quintiles 4 and 5) who according to the NSNP policy fall outside the realms of eligibility (Appendix: Extract 4).
The SAHRC highlights the fact that despite the wide geographic reach of the NSNP, the programme is still only accessible to learners in quintiles 1 to 3. Importantly, according to SAHRC (2011), there are “no measures or commitments in place to facilitate access to school nutrition for learners in quintiles 4 and 5”.
The CEO of FEDSAS emphasises this point: “(P)eople should not make the mistake of thinking that there are not hungry children in quintile 4 to 5 schools. There is talk of providing learners with tablet computers yet some of these learners are unable to concentrate in class due to hunger” (Appendix: Extract 3). While it is evident that the majority of learners in the most impoverished schools are likely being supported by the NSNP, there is a lack of clarity around the number of eligible learners that are currently in quintile 4 and 5 schools.
If, therefore, these learners are no longer fed – neither through schools’ discretionary funds nor through the equitable share – the discontinuation of this programme for 500 000 learners that had previously been supported on it may arguably constitute discriminatory and regressive budgeting.186 In taking the ICESCR Article 2 into consideration that prohibits discrimination on a wide range of grounds - learners from historically oppressed and marginalised groups that are excluded from the NSNP may suffer the same consequences as targeted learners. The KZNDoE in 2012/13 was granted permission by the DBE to deviate from the NSNP bias towards learners in quintiles 1 to 3. The KZNDoE was thus able to feed primary school learners in quintiles 4 and 5 on the condition that “the minimum requirements of the NSNP conditional grant are being met”.187 In the case of the Gauteng province, it is unclear whether the non-feeding of quintile 4 and 5 learners was related to the Department’s inability to meet the minimum requirements of the conditional grant or if the decision was a response to policy restrictions.
In addition to raising questions relating to the ‘ineligibility’ of learners as a result of their school quintile classification, there have been historical challenges to the very quintile system used to
186 “The UN Committee on Economic, Social and Cultural Rights (CESCR) in its General Comment 20 makes clear that ICESCR article 2(2), which prohibits discrimination on a wide range of grounds (including socio-economic status), encompasses both formal and substantive discrimination (para.8). It says the following: (a) Formal discrimination: Eliminating formal discrimination requires ensuring that a State’s constitution, laws and policy documents do not discriminate on prohibited grounds…(b) Substantive discrimination: […] The effective enjoyment of […] rights is often influenced by whether a person is a member of a group characterized by the prohibited grounds of discrimination. Eliminating discrimination in practice requires paying sufficient attention to groups of individuals which suffer historical or persistent prejudice instead of merely comparing the formal treatment of individuals in similar situations.” (Blyberg and Hofbauer, 2014)
187 Kwazulu-Natal Department of Education (KZNDoE). 2013. Annual Report 2012/13.
It is not clear whether alternative measures
have been put in place to mitigate
against potentially negative impacts
and to support these additional learners.
Effectively, the programme had been
extended to feed ineligible learners.

72 The Right to Food in South Africa
target learners. The Norms and Standards for School Funding (NSSF) require that schools are funded according to the quintile system using a predetermined formula. As it determines what resources a school is eligible to receive, the quintile ranking has significant consequences for a school and its learners. Given the grave consequences for learners as discussed above, there is a real need to review the allocation of this particular conditional grant through the NNSSF.
In conclusion to a research report outlining the implication of the NNSSF on redress and social justice, Mestry and Ndhlovu (2014) advocate for the need to fund schools according to their “essential needs and the socio-economic status of parents attending the school rather than the poverty index of the community where the school is located”. They further state that this will effectively address the problem in which learners from poor households attending schools in affluent areas are not catered for as a result of their quintile 4 or 5 classification. According to Mestry and Ndhlovu (2014), examples where schools in quintile 4 or 5 in reality serve a large majority of poor learners are placed in a “diabolical situation”. It has therefore become critical to find improved, nuanced solutions to strengthen government responses to the existing obstacles to equal access to education in South Africa. A thorough review (and/replacement) of the quintile system is long overdue. In addition to the need to address the exclusion of eligible learners as a result of attending ‘affluent’ schools is the need to review the extent to which early childhood development centres and special schools are catered for within public school feeding programmes. Their prominence in NSNP policy documents is decidedly weak.
Accuracy of data to inform NSNP interventionsThe picture presented by the Statistics South Africa General Household survey is slightly different to the reports from the DBE in relation to percentages of learners benefitting from the NSNP. In general, the percentage of learners reportedly supported by the NSNP has increased over the past five years. The highest provincial coverage for 2012 was evident in the provinces of Limpopo (94%), the Eastern Cape (86.4%) and Mpumalanga (83.5%). These figures also correlate with the identification of the geographic spread of the most vulnerable households in South Africa as well as the spread of learners. In 2011, 16%, 23.2% and 13.8% of all learners were in the Eastern Cape, Kwazulu-Natal and Mpumalanga, respectively. A further 16.5% were in Gauteng schools.188 In relation to the geographic share of poverty, 26.3% of South Africa’s poor were in Kwazulu-Natal, 18.3% in the Eastern Cape and 16.1% in Limpopo. Across South Africa, however, while children (0-17 year olds) constituted 37.6% of the total population, 46% of all poor people were children - almost half of the country’s poor.189 The SANHANES (2013) report revealed, however, that the highest prevalence of children exhibiting signs of under nutrition (stunting, wasting and underweight) was evident in rural, informal settlements and particularly in the North West, Free State and Northern Cape.
Figure 7: Percentage of Learners Benefitting from the NSNP 2009 - 2013
EC FS Gtg KZN Lmp Mp NW NC WC SA
2009 76.6 54.5 45.5 65.9 75.8 73.0 64.5 86.6 57.7 65.6
2010 79.2 64.7 42.9 67.0 87.6 75.8 69.2 85.1 53.0 67.8
2011 84.3 71.5 44.5 76.7 94.6 82.4 78.8 86.1 50.4 73.1
2012 86.4 75.4 46.1 77.9 94.0 83.5 82.7 83.0 48.2 74.0
2013 88.4 77.3 49.0 76.9 99.2 83.2 81.5 82.0 51.9 74.5
88.477.3
49.0
76.9
99.283.2 81.5 82.0
51.9
74.5
0.010.020.030.040.050.060.070.080.090.0
100.0
% o
f lea
rner
s
(Source: StatsSA, 2012 and StatsSA, 2013)
188 DBE. 2013c. Education Statistics in South Africa 2011. Pretoria, South Africa.189 Statistics South Africa (StatsSA). 2013c. Poverty Trends in South Africa: An Examination of Absolute Poverty between 2006 and 2011. Pretoria,
South Africa.

73 Budget analysis: assessing the resource allocations and expenditures of government programmes to address the right to food
According to StatsSA, between 2009 and 2013, the national percentage of learners that reported being fed at school rose from 65.6% to 74.5%. The general increases from year to year (albeit sometimes marginal) may have some correlation with the general decreases in all children’s reports of experiencing hunger over a similar period (15.9% in 2010 and 13.1% in 2012) as reflected in Figure 5. While it is understood that the DBE itself uses StatsSA data for this indicator, its accuracy for NSNP indicators is questionable. Not all school feeding programmes are necessarily under the auspices of the DBE/NSNP. Amongst various entities that operate feeding schemes at schools that may or may not be supplementary to the NSNP are food chains and NGOs. It is recommended, therefore, that the DBE undertake rigorous data collection against this indicator to generate accurate information around the number of learners that are actually fed on the NSNP at schools.
It is unclear how the DBE determines coverage of all learners in need of NSNP interventions and whether or not any obstacles to learners accessing food have been taken into consideration. A pilot study carried out by the Accountability and Transparency for Human Rights (AT4HR) Foundation assisted by the PSAM concluded that while the South African government makes a fair amount of information publicly available explaining the design of child nutrition interventions, potential obstacles to accessing interventions such as the NSNP and vitamin A supplementation for infants are not adequately acknowledged. The study determined that improvements must be made in the way that such interventions are designed and in the publicising of the data informing their targets.190
The StatsSA data still remains valuable if possibly overstated. As evidenced in figure 4, the Western Cape is the only province in which the percentage of learners reported to be receiving food from the NSNP has decreased between 2009 and 2013 (from 57.7% to 51.9%). The Western Cape and Gauteng represent provinces with the lowest overall percentages of learners reported to be benefitting from the programme. In addition to determining the total numbers of learners in the lowest quintiles by province, information relating to where these learners are would be useful in determining the reach of the programme and should be made uniformly available by all provincial education departments as well as by the DBE.
As outlined in Table 7; Kwazulu-Natal is allocated the largest budget share for the NSNP conditional grant. Despite this, it is noteworthy that in 2013 this province had amongst the lowest percentages of learners supported by the programme at 76.9%: with only two other provinces feeding lower percentages of learners (the Western Cape and Gauteng).
Figure 8: Malnutrition amongst select children’s age groups in South Africa, 2005 and 2012
Stunting2005
Stunting2012
Severestunting
2005
Severestunting
2012
Waisting2005
Waisting2012
SevereWaisting
2005
SevereWaisting
2012
1-3 year olds 23.4 26.5 6.4 9.5 5.1 2.2 0.9 1.1
4-6 year olds 16.4 11.9 5.1 2.2 5.0 2.0 1.5 0.8
7-9 year olds 12.0 9.4 3.4 1.7 3.0 1.9 0.5 0.5
0.0
5.0
10.0
15.0
20.0
25.0
30.0
%
(Source: SANHANES)
Figure 8 is an outline of the key components of under nutrition (stunting, severe stunting, wasting and severe wasting). The figure compares data collected for the selected age groups in 2005 and 2012 (SANHANES, 2013). In several of these categories, 1-3 year olds exhibit the highest percentages. Particularly noteworthy are the figures for stunting and severe stunting
190 Accountability and Transparency for Human Rights (AT4HR) Foundation, International Budget Partnership (IBP) and Save the Children. 2013. Budget Transparency and Child Nutrition: Research Findings From: Kenya, South Africa, Uganda, Zambia and Zimbabwe. Available Online: www.at4hr.org .
According to StatsSA, between 2009 and 2013, the national
percentage of learners that reported being
fed at school rose from 65.6% to 74.5%.

74 The Right to Food in South Africa
in 2005 and 2012; the youngest children display notably higher degrees of stunting and severe stunting. Of greater concern is the clear increase between 2005 and 2012 in all categories for 1-3 year olds with the exception of wasting which decreased from 5.1% to 2.2%. It is, however, encouraging that for each of the other age categories, there were decreases in stunting and wasting. Severe wasting for the 7-9 year old cohort remained at 0.5%.
While the 1-3 years cohort is not, strictly speaking, catered for within the public school system and is thus not within the custodianship of the DBE, the shared responsibility across government departments should be emphasised. Learners between the ages of 4 and 6 are accommodated either within Public School Grade R or in Grade 1. For these learners, the levels of stunting (11.9%) in 2012 are a source of concern. As a general question relating to nutrition interventions targeted at children, the Departments of Health and Social Development are primarily accountable for the youngest cohort and, as such, scrutiny must be placed on the effectiveness of such programmes.
In an expenditure tracking report published by the PSAM in November 2013, it was noted that the ECDoE had committed to extending the reach of the provincial school nutrition programme to cater for ECD learners.191 It was also noted, however, that while some of these learners would be in community-based centres, there seemed to be limited integration between the DBE and DSD regarding planning and budget implementation provincially. The DSD in the Eastern Cape is the primary caretaker for learners in the ECD sector; particularly those within community-based ECD centres. The need for greater interdepartmental integration is evident at both provincial and national level. One such area where integration is sorely lacking is between the DBE, DSD, DoH and DoA where sustainable food production to support the NSNP is concerned.
Sustainable production and provisioning of food is one aspect of the NSNP that has not been achieved to date and is also not clearly articulated in DBE and provincial planning documents. This is despite the emphasis placed on sustainable food production as a programme objective. Amongst the objectives of the NSNP is to promote self-supporting school food gardens and other food production initiatives and to promote healthy lifestyles amongst learners (DoE, 2009). According to an Annual Report of the National School Nutrition Programme, such food production is prioritised in the NSNP within the Sustainable Food Production in Schools (SFPS) programme (DBE, 2011). Under this programme; tree planting and vegetable cultivation are planned. In the Eastern Cape, a plan for the NSNP in relation to food production is mentioned in a cursory manner as part of garden cultivation for school beautification in which a targeted 100 schools are to participate in 2013. Activities include planting vegetable gardens in addition to flowers, trees and toilet disinfecting.192 On a national scale, the 2010/11 Annual Report states the need to foster food production at schools and that “…although schools had vegetable gardens, these were largely non-productive. The majority of schools lack capacity to maintain gardens”. In the entire country, only two vegetable gardens (tunnels) were established; one in the Free State province and one in Gauteng (DBE, 2011).
The approach to sustainable food production is largely superficial. The Department remains significantly dependent on the existence of the conditional grant to support food security initiatives in schools and offers little by way of programme support and skills development. This, in the case of several provincial departments is misaligned with the objective of ensuring that schools are supporting community mobilisation. Engaging small scale farmers, local agriculture co-operatives, technical colleges and local food distributors must be central. It is recommended that, in addition to regular monitoring and evaluation of the NSNP, the DBE must use existing mechanisms within the IFSS/nutrition and food security strategy to foster real cooperation between the various implementing departments. Currently, the sustainability of the NSNP as a source of learning and food security for vulnerable learners is weak.
191 Eastern Cape Department of Education, Annual Report 2012/13, p.29.192 Province of the Eastern Cape Department of Education Annual Performance Plan 2012/13. (Refer to Performance Indicator 154 under Strategic
Goal 5).

75 Budget analysis: assessing the resource allocations and expenditures of government programmes to address the right to food
4.1.4.3. Effectiveness of the NSNP in budgeting terms193
Financial Record Keeping at District and School Level A pre-requisite for effective NSNP budgeting is the use of accurate, up-to date learner enrolment numbers. This information is collected from EMIS. Overy (2010), found that accurately determining learner numbers in the ECDoE, for example, was difficult partly as a result of severe staff shortages within the EMIS unit responsible for collecting and updating data.194 A UNICEF study revealed that financial mismanagement had crippled the functioning of the programme across the Eastern Cape and as a result of ongoing investigations, financial statements were not available to the research team. Research carried out in later years in the Grahamstown district of the Eastern Cape intended to track expenditure in the NSNP from province, district and school was hindered by similar problems. Overy reported that an accurate expenditure tracking survey would not be feasible in the absence of accurate food delivery reports from school and supplier contracts and payment details from the ECDoE. It is vital to note that attempts have been made to resolve some of these problems. In the Eastern Cape, for example, the provincial NSNP was decentralised soon after the above mentioned findings were made and presented to ECDoE senior staff and to the Provincial Research Committee of the Office of the Eastern Cape Premier.
4.1.5. Conclusion and recommendationsThe South African National School Nutrition Programme has undoubtedly contributed to addressing the basic nutritional needs of the most vulnerable South African learners. This is especially worth consideration in light of the fact that many learners reportedly receive their main (and sometimes sole) meal of the day at school. The progressive policy and school funding mechanisms introduced by the government after 1994 have had a decisive impact on access to education and basic nutrition. The public school system has certainly changed for the better for the majority of previously oppressed South Africans. It is clear, however, that much more remains to be done especially by way of sustainable funding mechanisms and strategic interventions to ensure equal access to education and basic nutrition for all.
The National School Nutrition Programme is undoubtedly an important intervention within the South African basic education system. While its explicit benefits in terms of maintaining high learner enrolments, decreasing dropout rates and generally enhancing learners’ academic performance have not been definitively studied or reported on, anecdotal evidence reflects that the NSNP has had significant impacts in these areas. At the very least is the acknowledgement that for many learners whose primary daily meal comes from school, this meal is a vital safety net against going hungry. There is a need, however, for an in-depth analysis of the nutritional quality and overall impacts of the NSNP. As this case study has shown, the DBE must make a concerted effort to ensure the monitoring and evaluation of the programme is undertaken regularly and rigorously to allow for this. While this case study does not explore the effects of corruption and maladministration on food delivery, this is an area that deserves in-depth research in addition to ongoing monitoring and evaluation.
This programme continues to be amongst the largest conditional grants across the key social spending sectors of the national budget. It is also arguably one programme where marked improvements on expenditure and performance can be highlighted in several provinces. The NSNP also has immense potential for providing forms of employment and skills development in food supply and preparation.
Despite these improvements over time and great potential, the NSNP requires a strategic review given the concerns raised in this report. The reach of the programme in its selective extension to some learners in need and not all as well as to ‘some’ learners in special schools, and the lack of clarity on the number of learners targeted and reached in ECD constitutes a challenge to the degree to which the programme is effectively and equitably targeted.
193 The issue of ‘effectiveness’ explores the effectiveness of expenditure and the extent to which the results constitute tangible improvements in the right to access adequate food. Budget effectiveness is also an exploration of the extent to which programme targets are met. An important consideration in determining the effectiveness of expenditure in relation to the NSNP is whether or there is adequate information available to evaluate budget effectiveness as well as the degree to which programme monitoring and evaluation exists.
194 Overy, N. 2010. An Evaluation of the School Nutrition Programme in the Grahamstown Education District, Eastern Cape, South Africa. Public Service Accountability Monitor (PSAM). Grahamstown, South Africa.
The National School Nutrition Programme
is undoubtedly an important
intervention within the South African basic
education system. While its explicit
benefits in terms of maintaining high
learner enrolments, decreasing dropout rates and generally enhancing learners’
academic performance have not been
definitively studied or reported on, anecdotal evidence reflects that
the NSNP has had significant impacts in
these areas.

76 The Right to Food in South Africa
It is also important to consider the implication of the budget gaps for children in ECD centres and special schools. Currently- the apparent lack of uniformity in programme reach for these learners presents a challenge that the DBE must, in collaboration with all departments complicit in rolling out the national anti-poverty strategy, Nutrition Roadmap and the Food and Nutrition Security policy, seek to address.
A major policy component of the NSNP is the cultivation of fresh produce from which to supplement the school food menu. This as an indicator is poorly and/or haphazardly reported against. Currently, anecdotal evidence indicates that school food gardens are not uniformly used as educational tools within schools nor is there a sustained effort across provinces to provide strategic inter-sectoral support between departments such as DAFF, DoH and DBE to ensure programme success. The NSNP has the potential to play a significant role in empowering the communities within which schools exist- rural and peri-urban in particular- in providing a market for locally produced fresh produce. If the programme were to function as it was originally intended within the Integrated Food Security Strategy
In conclusion, South Africa’s National School Nutrition Programme is undoubtedly a vital intervention in the lives of many vulnerable school children. The programme must therefore be further supported to improve on its mandate through a critical review of its budget allocations and performance across the provinces. Given the current budget limitations, there may be scope to create partnerships with research entities as well as Stats SA for this purpose. Accurate, ongoing data collection activities aimed at supporting the NSNP can also be undertaken by institutions of higher learning with whom the DBE has partnerships. While the food and nutrition security policy constitutes a broad framework, its guiding principles must seek to strategically influence key interventions in a direct, explicit manner. The following recommendations are therefore made with respect to the responsibility areas of the DBE, National Treasury and DAFF in particular:
Recommendation 1Review effectiveness of the quintile system in supporting all food insecure learners.
Recommendation 2Assess provisioning on the right to sufficient food and basic nutrition for learners in quintile 4 and 5 schools (related to Recommendation 1).
Recommendation 3Establish rigorous provincial and district monitoring systems for tracking expenditure and programme implementation.
Recommendation 4Treasury and the DBE must set corrective and/or punitive measures for departments that consistently underspend and/or feed irregularly on their NSNP conditional grant allocation.
Recommendation 5The South African government must bolster inter-departmental collaboration for sustainable food production to support the NSNP through the improved implementation of the Integrated Food Security Strategy.
Recommendation 6The DBE must administer rigorous statistical data collection relating to NSNP indicators to better inform planning and budgeting .

77 Budget analysis: assessing the resource allocations and expenditures of government programmes to address the right to food
4.2. Case Study 2: Vitamin A Supplementary Programme, by Muhammad Zakaria Suleman
4.2.1. Vitamin A Deficiency and the Need for SupplementationVitamin A deficiency is caused by a “habitual diet that provides too little bioavailable vitamin A to meet physiological needs”.195 Population groups that are particularly vulnerable to vitamin A deficiency are children under five; children with measles, diarrhoea, acute respiratory infections; and children in poor socio-economic conditions. Vitamin A deficiency (VAD) is a major contributor to under-five mortality, harms the vision of a child and can lead, in extreme cases, to permanently impaired vision. It can also increase the risk of illness and mortality from childhood infections such as measles and those causing diarrhoea. Further, it impacts on the mortality of women who are of reproductive age.196
The South African National Health and Nutrition Examination Survey (SANHANES-I, 2012) indicates that South Africa’s vitamin A deficiency prevalence (above 20%) makes VAD of “severe public importance” according to the World Health Organisation standards. In 2012, the prevalence of VAD in South Africa was 43.6%.
The Lancet series lists Vitamin A Supplementation (VAS) among the key interventions achievable at large scale that have been proven to reduce the number of preventable child deaths each year. VAS is therefore a prerequisite for achieving MDG4 (which focuses on improving child survival, and in particular reducing under-five mortality).
4.2.2. Vitamin A Supplementation in South AfricaThe National Vitamin A Supplementation Policy for South Africa (VAS Policy) was launched in 2001 following a survey that showed that vitamin A deficiency was a public health problem. The VAS Policy requires that each child should receive two VAS capsules per year (one every six months). The VAS programme has been integrated with the Expanded Immunisation Programme and Integrated Management of Childhood Illness Programme in health facilities. This approach has proved effective for children of 6 – 11 months as they frequent health facilities for immunisation.
VAS coverage of children of 12 - 59 months has remained low due to the fact that after 18 months children are no longer taken to health facilities for immunisation.197 In an attempt to reach 12 – 59 month old children, the DoH adopts a number of additional implementation mechanisms including routine VAS at health facilities and outreach. Outreach includes both the administering of VAS by Community Health Workers, dieticians and nutritionists who are part of the Primary Health Care outreach teams; and campaign style events such as the national integrated Child Health Week in 2009 which aimed to reach 80% of children aged 12-59 months with essential health services including VAS, catch-up immunisation, de-worming and nutritional screening.
While this document will deal only with VAS, it is worth noting that vitamin A deficiency is a nutritional problem and that VAS is not the only possible strategy to target vitamin A deficiency. Other strategies include: 198
1. Dietary Diversification – which includes the promotion of and advocating for food consumption that is rich in micronutrients including vitamin A;
2. Food fortification – fortifying micronutrients in staple foods such as wheat and maize;
3. Disease targeted supplementation – Structured for the individual who is acutely affected by vitamin A deficiencies.
195 Faber, M., and Wenhold, F. 2007. “Nutrition in Contemporary South Africa” 33:3 Water SA 395.196 Ibid, 396.197 National Vitamin A Supplementation Policy Guidelines for South Africa, 6.198 Ibid, 8
A deficiency prevalence (above 20%) makes VAD of “severe public
importance” according to the World Health
Organisation standards.
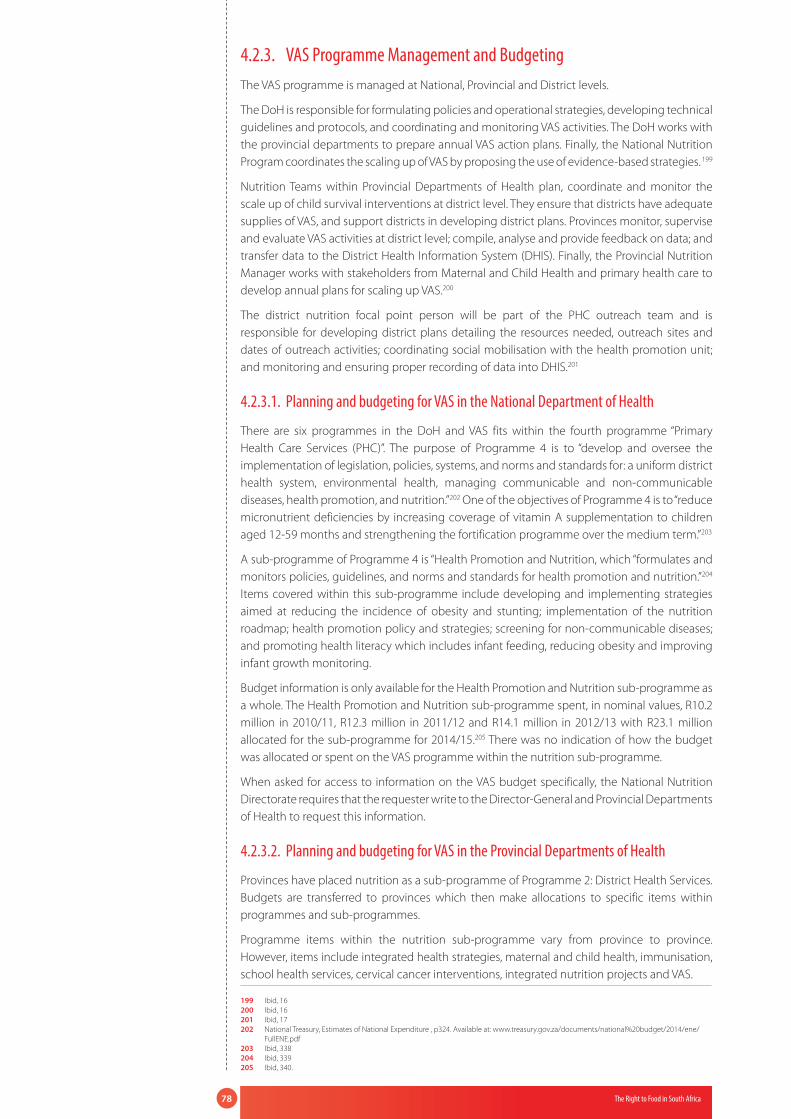
78 The Right to Food in South Africa
4.2.3. VAS Programme Management and BudgetingThe VAS programme is managed at National, Provincial and District levels.
The DoH is responsible for formulating policies and operational strategies, developing technical guidelines and protocols, and coordinating and monitoring VAS activities. The DoH works with the provincial departments to prepare annual VAS action plans. Finally, the National Nutrition Program coordinates the scaling up of VAS by proposing the use of evidence-based strategies. 199
Nutrition Teams within Provincial Departments of Health plan, coordinate and monitor the scale up of child survival interventions at district level. They ensure that districts have adequate supplies of VAS, and support districts in developing district plans. Provinces monitor, supervise and evaluate VAS activities at district level; compile, analyse and provide feedback on data; and transfer data to the District Health Information System (DHIS). Finally, the Provincial Nutrition Manager works with stakeholders from Maternal and Child Health and primary health care to develop annual plans for scaling up VAS.200
The district nutrition focal point person will be part of the PHC outreach team and is responsible for developing district plans detailing the resources needed, outreach sites and dates of outreach activities; coordinating social mobilisation with the health promotion unit; and monitoring and ensuring proper recording of data into DHIS.201
4.2.3.1. Planning and budgeting for VAS in the National Department of Health
There are six programmes in the DoH and VAS fits within the fourth programme “Primary Health Care Services (PHC)”. The purpose of Programme 4 is to “develop and oversee the implementation of legislation, policies, systems, and norms and standards for: a uniform district health system, environmental health, managing communicable and non-communicable diseases, health promotion, and nutrition.”202 One of the objectives of Programme 4 is to “reduce micronutrient deficiencies by increasing coverage of vitamin A supplementation to children aged 12-59 months and strengthening the fortification programme over the medium term.”203
A sub-programme of Programme 4 is “Health Promotion and Nutrition, which “formulates and monitors policies, guidelines, and norms and standards for health promotion and nutrition.”204 Items covered within this sub-programme include developing and implementing strategies aimed at reducing the incidence of obesity and stunting; implementation of the nutrition roadmap; health promotion policy and strategies; screening for non-communicable diseases; and promoting health literacy which includes infant feeding, reducing obesity and improving infant growth monitoring.
Budget information is only available for the Health Promotion and Nutrition sub-programme as a whole. The Health Promotion and Nutrition sub-programme spent, in nominal values, R10.2 million in 2010/11, R12.3 million in 2011/12 and R14.1 million in 2012/13 with R23.1 million allocated for the sub-programme for 2014/15.205 There was no indication of how the budget was allocated or spent on the VAS programme within the nutrition sub-programme.
When asked for access to information on the VAS budget specifically, the National Nutrition Directorate requires that the requester write to the Director-General and Provincial Departments of Health to request this information.
4.2.3.2. Planning and budgeting for VAS in the Provincial Departments of Health
Provinces have placed nutrition as a sub-programme of Programme 2: District Health Services. Budgets are transferred to provinces which then make allocations to specific items within programmes and sub-programmes.
Programme items within the nutrition sub-programme vary from province to province. However, items include integrated health strategies, maternal and child health, immunisation, school health services, cervical cancer interventions, integrated nutrition projects and VAS.
199 Ibid, 16200 Ibid, 16201 Ibid, 17202 National Treasury, Estimates of National Expenditure , p324. Available at: www.treasury.gov.za/documents/national%20budget/2014/ene/
FullENE.pdf 203 Ibid, 338 204 Ibid, 339 205 Ibid, 340.
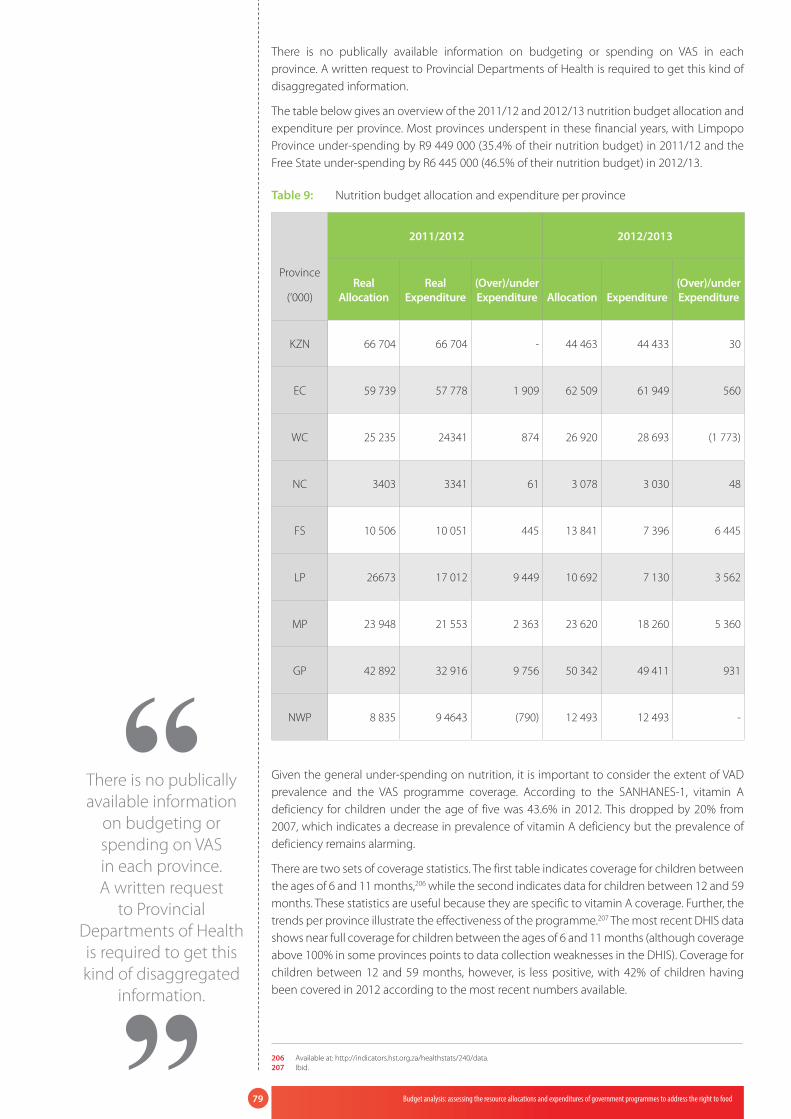
79 Budget analysis: assessing the resource allocations and expenditures of government programmes to address the right to food
There is no publically available information on budgeting or spending on VAS in each province. A written request to Provincial Departments of Health is required to get this kind of disaggregated information.
The table below gives an overview of the 2011/12 and 2012/13 nutrition budget allocation and expenditure per province. Most provinces underspent in these financial years, with Limpopo Province under-spending by R9 449 000 (35.4% of their nutrition budget) in 2011/12 and the Free State under-spending by R6 445 000 (46.5% of their nutrition budget) in 2012/13.
Table 9: Nutrition budget allocation and expenditure per province
Province
(‘000)
2011/2012 2012/2013
Real Allocation
Real Expenditure
(Over)/under Expenditure Allocation Expenditure
(Over)/underExpenditure
KZN 66 704 66 704 - 44 463 44 433 30
EC 59 739 57 778 1 909 62 509 61 949 560
WC 25 235 24341 874 26 920 28 693 (1 773)
NC 3403 3341 61 3 078 3 030 48
FS 10 506 10 051 445 13 841 7 396 6 445
LP 26673 17 012 9 449 10 692 7 130 3 562
MP 23 948 21 553 2 363 23 620 18 260 5 360
GP 42 892 32 916 9 756 50 342 49 411 931
NWP 8 835 9 4643 (790) 12 493 12 493 -
Given the general under-spending on nutrition, it is important to consider the extent of VAD prevalence and the VAS programme coverage. According to the SANHANES-1, vitamin A deficiency for children under the age of five was 43.6% in 2012. This dropped by 20% from 2007, which indicates a decrease in prevalence of vitamin A deficiency but the prevalence of deficiency remains alarming.
There are two sets of coverage statistics. The first table indicates coverage for children between the ages of 6 and 11 months,206 while the second indicates data for children between 12 and 59 months. These statistics are useful because they are specific to vitamin A coverage. Further, the trends per province illustrate the effectiveness of the programme.207 The most recent DHIS data shows near full coverage for children between the ages of 6 and 11 months (although coverage above 100% in some provinces points to data collection weaknesses in the DHIS). Coverage for children between 12 and 59 months, however, is less positive, with 42% of children having been covered in 2012 according to the most recent numbers available.
206 Available at: http://indicators.hst.org.za/healthstats/240/data. 207 Ibid.
There is no publically available information
on budgeting or spending on VAS in each province. A written request
to Provincial Departments of Health is required to get this kind of disaggregated
information.

80 The Right to Food in South Africa
Table 10: VAS Programme coverage of children 6 - 11 months (%)
EC FS GP KZN LP MP NC NW WCSOUTH AFRICA
2002 DHIS 60.4 56.9 - - - - 51.6 18.4 - [1] 27.9
2003 DHIS 79.8 76.8 - - 37.1 57.5 90.5 35.3 - [2] 57.6
2004 DHIS 76.6 75.0 62.9 71.2 83.4 81.7 79.6 62.9 - [3] 65.6
2005 DHIS 83.9 94.0 93.8 97.1 98.6 93.8 97.1 79.3 26.1 [4] 86.2
2006 DHIS 84.2 94.2 106.6 98.2 103.5 98.0 125.8 81.3 70.5 [5] 94.8
2007 DHIS 78.0 91.5 110.1 102.6 99.5 102.4 108.2 85.9 90.2 [6] 96.7
2008 DHIS 90.3 95.8 109.0 98.8 111.7 96.9 114.4 97.2 93.4 [7] 100.2
2009 DHIS 93.2 86.3 110.1 101.9 105.7 103.5 94.1 89.6 95.0 [8] 100.0
2010 DHIS 93.6 90.5 103.7 104.4 102.6 97.6 90.6 89.3 80.1 [9] 97.4
2011 DHIS 102.7 102.3 109.5 121.8 122.9 103.4 103.2 95.7 82.1 [10] 107.9
2012 DHIS 96.8 108.2 100.7 112.1 111.7 106.0 108.7 89.8 - [11] 93.2
Table 11: VAS Programme of coverage children 12-59 months (%)
EC FS GP KZN LP MP NC NW WCSOUTH AFRICA
2003 DHIS 9.9 21.1 3.7 8.6 11.1 16.4 12.8 6.7 0.0 [1] 8.8
2003 SADHS 57.7 45.8 32.3 42.3 44.6 46.6 49.4 30.2 29.6 [2] 39.4
2004 DHIS 11.8 23.0 10.2 14.3 17.0 17.6 16.7 12.7 - [3] 12.8
2005 DHIS 14.7 29.9 20.5 19.9 20.0 19.1 22.2 18.7 11.1 [4] 18.9
2005 NFCS 33.3 32.6 12.0 27.9 18.1 10.1 26.1 20.0 10.7 [5] 20.5
2006 DHIS 19.7 36.3 27.8 24.4 24.7 22.5 31.8 20.6 26.5 [6] 25.1
2007 DHIS 23.0 36.8 30.3 29.5 25.1 23.2 28.4 23.5 33.6 [7] 28.1
2008 DHIS 31.6 41.6 34.8 27.3 38.3 25.8 32.8 30.9 32.0 [8] 32.2
2009 DHIS 36.6 38.0 40.8 30.3 30.6 27.8 27.2 26.1 38.2 [9] 33.9
2010 DHIS 36.5 39.1 43.7 32.8 30.3 29.1 26.2 27.0 32.3 [10] 34.6
2011 DHIS 45.1 47.9 47.7 42.8 46.8 39.1 32.5 36.8 38.0 [11] 43.4
2012 DHIS 43.6 49.9 46.3 43.6 40.2 40.2 36.4 35.8 39.1 [12] 42.8

81 Budget analysis: assessing the resource allocations and expenditures of government programmes to address the right to food
4.2.4. Budget analysis of programme
Analysis per ProvinceAs noted above, while the total provincial health budgets are publically available, disaggregated budgets per programme and sub-programme are not available.
The table below shows the approach of each province to nutrition and the VAS Programme, where such approach has been made public.
Table 12: Provincial approaches to nutrition and VAS programme208
Provinces KwaZulu Natal Eastern Cape Western
CapeNorthern Cape Free State Limpopo Mpumalanga Gauteng North-West
Total Budget for Provincial Department of Health
R29.141 billion
R 17.5 billion R 54.73 billion R 3.7 billion R 8.1 billion R 14.73 billion R 8.9 billion R 32 billion R 8.18 billion
Population Estimates208 (Budgeted Amount Per Capita)
10 456 900 (R 2 786
peR person)
6 620 100 (R 2 643
peR person)
6 016 900 (R 9 096 per
person)
1 162 900
(R 3 181 per person)
2 753 200
(R 2 942 per person)
5 518 000
(R 2 669 per person)
4 128 000
(R 2 156 per person)
12 728 400
(R 2 514 per person)
3 597 600
(R 2 273 per person)
Budget 2012/13 Nutrition sub-programme
R 44.46 million
R 62.5 million R 26.92 million
R 3.07 million R 13.8 million R 10.69 million
R 23.62 million R 50.34 million
R 12.49 million
Budgeted Amount Per Capita for Nutrition sub-programme
R 4,25 R 9,44 R 4,47 R 2,65 R 5,03 R 1,94 R 5,72 R 3,96 R 3,47
Percentage increase/decrease in budget allocation from 2011/12 to 2012/13
Decrease of 33.3% from
R 66.7 million 2011/12
to R 44.46 million in 2012/13
Increase of 4.7% from
R 59.7 million in 2011/12 to R 62.5 million
in 2012/13
Increase of 6.8% from
R 25.2 million in 2011/12 to R 26.92 million in 2012/13
Decrease of 9.4% from
R 3.4 million in 2011/12 to R 3.08 million
in 2012/13
Increase of 31.8% from
R 10.5 million in 2011/12 to R 13.84 million in 2012/13
Decrease of 59.8% from
R 26. 6 million in 2011/12 to R 10.69 million in 2012/13
Decrease of 1.1% from
R 23.9 million in 2011/12 to
R 23.62 million in 2012/13
Increase of 17.7% from
R 42.8 million in 2011/12 to R 50.34 million in 2012/13
Increase of 41.9% from R 8.8 million in 2011/12 to R 12.49 million in 2012/13
Percentage of nutrition budget over or under spent in 2012/13
> 1% under-spent
> 1% under-spent
6.6% over-spent
1.5% under-spent
46.6% under-spent
33.3% under-spent
29.3% under-spent
1.8% under-spent
No over or under
expenditure occurred
VAS Coverage trend: 6 – 11 months
Increase from 71.2% in 2004 to 112.1% in
2012
Increase from 60.4% in 2002
to 96.8% in 2012
Increase from 26.1% in 2005
to 82.1% in 2011
Increase from 60.4% in 2003
to 96.8% in 2012
Increase from 51.6% in 2002 to 108.7% in
2012
Increase from 37.1% in 2003 to 111.7% in
2012
Increase from 57.5% in 2003 to
106% in 2012
Increase from 62.9% in 2004 to 100.7% in
2012
Increase from 18.4% in 2002 to 89.8% in
2012
VAS Coverage trends: 12 – 59 months
Increase of 8.6% in 2002 to 43.6% in
2012
Increase from 9.9% in 2002 to 43.6% in
2012
Increase from 0% in 2002 to 39.1% in
2012
Increase from 12.8% in 2002
to 36.4% in 2012
Increase from 21.1% in 2002
to 49.9% in 2012
Increase from 11.1% in 2002
to 40.2% in 2012
Increase from 16.4% in 2002 to
40.2% in 2012
Increase from 3.7% in 2002 to 46.3% in
2012
Increase from 0
6.7% in 2002 to 35.8% in
2012
208 StatsSA. 2013. Available at: http://beta2.statssa.gov.za/publications/P0302/P03022013.pdf.
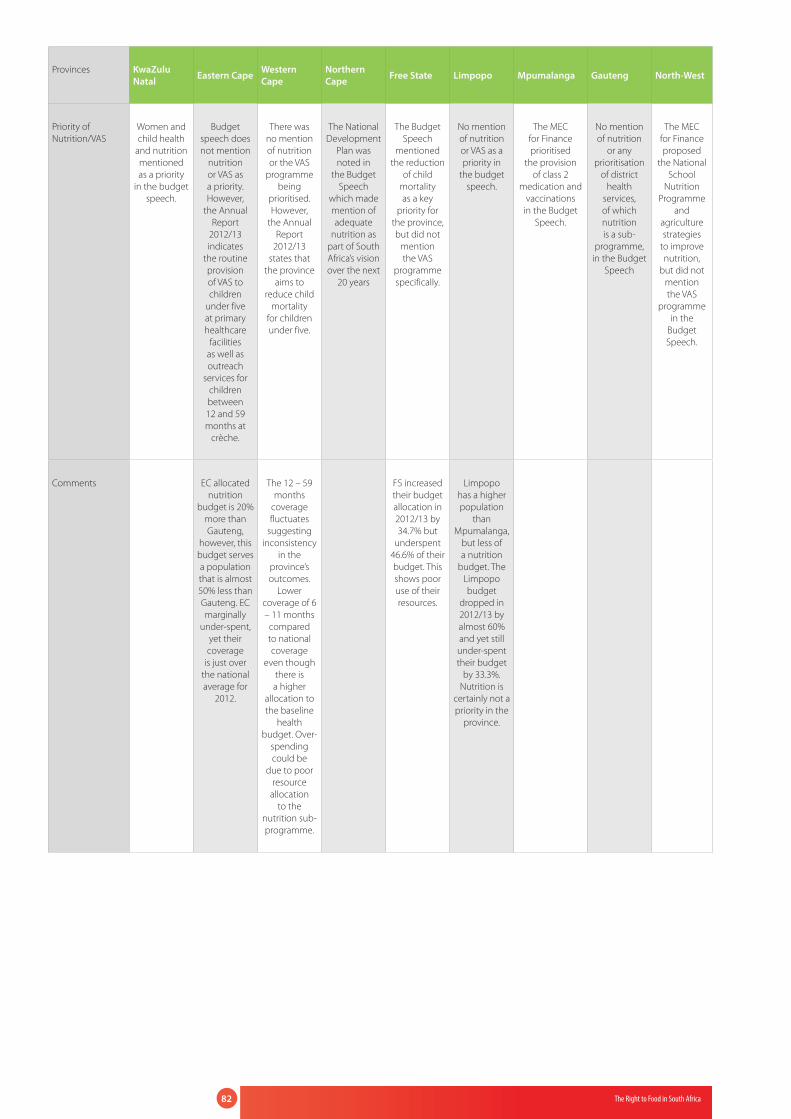
82 The Right to Food in South Africa
Provinces KwaZulu Natal Eastern Cape Western
CapeNorthern Cape Free State Limpopo Mpumalanga Gauteng North-West
Priority of Nutrition/VAS
Women and child health
and nutrition mentioned as a priority
in the budget speech.
Budget speech does not mention
nutrition or VAS as a priority. However,
the Annual Report
2012/13 indicates
the routine provision of VAS to children
under five at primary healthcare
facilities as well as outreach
services for children between 12 and 59 months at
crèche.
There was no mention of nutrition or the VAS
programme being
prioritised. However,
the Annual Report
2012/13 states that
the province aims to
reduce child mortality
for children under five.
The National Development
Plan was noted in
the Budget Speech
which made mention of adequate
nutrition as part of South Africa’s vision over the next
20 years
The Budget Speech
mentioned the reduction
of child mortality as a key
priority for the province, but did not
mention the VAS
programme specifically.
No mention of nutrition or VAS as a priority in
the budget speech.
The MEC for Finance prioritised
the provision of class 2
medication and vaccinations
in the Budget Speech.
No mention of nutrition
or any prioritisation
of district health
services, of which nutrition is a sub-
programme, in the Budget
Speech
The MEC for Finance proposed
the National School
Nutrition Programme
and agriculture strategies
to improve nutrition,
but did not mention the VAS
programme in the
Budget Speech.
Comments EC allocated nutrition
budget is 20% more than Gauteng,
however, this budget serves a population that is almost 50% less than Gauteng. EC marginally
under-spent, yet their coverage
is just over the national average for
2012.
The 12 – 59 months
coverage fluctuates
suggesting inconsistency
in the province’s outcomes.
Lower coverage of 6 – 11 months
compared to national coverage
even though there is a higher
allocation to the baseline
health budget. Over-
spending could be
due to poor resource
allocation to the
nutrition sub-programme.
FS increased their budget allocation in 2012/13 by 34.7% but
underspent 46.6% of their budget. This shows poor use of their resources.
Limpopo has a higher population
than Mpumalanga,
but less of a nutrition
budget. The Limpopo budget
dropped in 2012/13 by almost 60% and yet still under-spent their budget
by 33.3%. Nutrition is
certainly not a priority in the
province.

83 Budget analysis: assessing the resource allocations and expenditures of government programmes to address the right to food
4.2.5. Key findings
Data challenges: access to and quality of informationThere is poor access to information on the budget allocations and expenditure used for the VAS programme.
Both national and provincial departments publish information on their baseline budgets as well as budgets on their programmes. Some departments link their performances with their sub-programmes but no department lists any of their allocations or expenditures on specific items within sub-programmes.
In Annual Reports, provinces publish their programme expenditure patterns, including District Health Service programme spending patterns. Some provincial departments publish their overall expenditure for sub-programmes including the nutrition sub-programme. However, the VAS programme is one of a number of components of the nutrition sub-programme and there is no indication of what portion of the provincial budget has been allocated to the VAS programme or how much has been spent.
Both National and Provincial Departments of Health require written requests, detailing the purpose of research and other information, for the release of information for the VAS programmes. Unfortunately there was not enough time in the preparation of this document to obtain any of the required information (assuming requests would elicit such information).
The data available from the DHIS, which both district and provincial facilities feed information to, indicate that children between 6 and 11 months have higher than 100% coverage. This puts into question the quality of the information and the method by which the information was captured.
AdequacyThe funds that are transferred to provincial departments of health are allocated to programmes and sub-programmes within the department. Generally, with the exception of KwaZulu Natal, Northern Cape and Limpopo, there has been an increase in the budget allocation for the nutrition sub-programme over the 2011/12 and 2012/13 period. This increase in budget correlates with the reported increase in coverage. However, the increase in coverage of children between 12 and 59 months is much slower, and remains much lower than for children under 12 months.
The lack of provincial, district and other disaggregated budget information makes it difficult to measure the adequacy of governments budgeting for the VAS programme.
EfficiencyDue to the lack of information on budgeting for the VAS programme specifically, the efficiency of spending is also difficult to assess. Generally, according to the provincial spending table above, there is a trend of under-spending by provinces. All provinces, except the Western Cape, underspent their health budgets in 2012/13.
PriorityFrom provincial budget speeches as well as Annual Reports, VAS for children under 12 months is not a priority as the coverage is extremely high in all provinces. This, as mentioned earlier, is primarily due to integrating the VAS programme with the immunisation programme.
Even though coverage statistics indicate an increase in coverage of children between the ages of 12 and 59 months, there is a significant need for more focussed attention on this category as coverage is still very low.
Due to the lack of information on budgeting for the VAS programme specifically, the
efficiency of spending is also difficult to assess. Generally, according to the
provincial spending table above, there is a trend of under-
spending by provinces.

84 The Right to Food in South Africa
EffectivenessThe monitoring of vitamin A indicates a decrease in deficiency. This suggests, together with VAS coverage statistics, that the VAS Programme is having a positive impact.
VAS Programme coverage of children between 6 and 11 months is 93% nationally as vitamin A has become part of a child’s immunisation programme. VAS Programme coverage of children between 12 and 59 months is less impressive. One explanation given by the North-West Annual Report blames mothers for not taking their children to have VAS at facilities. Provinces such as the Eastern Cape have attempted to curb this by reaching out to crèches to have their children covered by VAS.
While the VAS Programme itself has had some success, the lack of disaggregated budget information makes it impossible to assess whether the budgets allocated to VAS have been effectively spent.
EquityDue to the lack of public information, it is difficult to make an assessment on whether the budget for the VAS programme was equitably allocated per province. A simple calculation of the nutrition sub-programme budget allocation per capita was made, however, this cannot be a true reflection of the equity of the VAS programme.
Monitoring and OversightIt is the duty of provinces to monitor, supervise and evaluate VAS activities while it is the duty of the district to feed coverage information into the District Health Information System in order to track and monitor the coverage. As indicated above, monitoring of coverage does occur but some of the data indicating over 100% coverage is questionable and there is no accessible information on the allocation and expenditure of the VAS programme.
4.2.6. RecommendationsThe programme has had an overall positive impact, as statistics show that coverage is being progressively improved. However, the rates of coverage for children between 6 – 11 months and children between 12 – 59 months are strikingly different.
The primary challenge lies in accessing specific information on the VAS programme. Both provincial and national departments of health have not made the programme’s information publically available. Without disaggregated budgetary information, it is difficult to make any analysis of the adequacy, equity, efficiency and effectiveness of the programme.
Recommendation 1National and Provincial departments should make disaggregated information publically accessible. Provincial departments should be transparent about the budgets they allocate to specific items within sub-programmes and should not stop disaggregating information at the sub-programme level.
Recommendation 2The VAS programme for children between 12 and 59 months should be integrated with other programmes, or made as part of the Road to Health Care chart for each child. After their vaccines schedules are complete, parents should be told of the need to bring 12 – 59 month olds to the clinic twice a year for their Vitamin A supplements. A reminder system, possibly using widely available technology such as SMS, could be implemented.
Recommendation 3The raw data at facility level that is fed into the District Information Health System needs to be standardised so that the quality of and access to the information can be improved.

85 Budget analysis: assessing the resource allocations and expenditures of government programmes to address the right to food
4.3. Case study 3: Comprehensive Agricultural Support Programme, by Jared Jeffery
The Comprehensive Agricultural Support Programme (CASP) is a schedule 4 conditional grant implemented under the Division of Revenue Act (DORA). The initiative has been in place since 2004 under the authority of the Department of Agriculture, Forestry, and Fisheries (DAFF). Although improved food security and poverty alleviation in rural areas are among the goals of the initiative, the driving force is to aid black subsistence, smallholder, and commercial farmers in an effort to rebalance the agricultural system after decades of preferential treatment and state support under apartheid for white commercial agriculture. The programme was one of the recommendations of the 1996 Strauss Commission which called for financial “sunrise” subsidies and packages to create an enabling environment for the beneficiaries of the land reform programme. It is not, however, a requirement that funded projects are linked to redistributed land. Initially, there was a 70%/30% split in funding between land redistribution beneficiaries and general beneficiaries209.
The programme’s annual reports and concept document pay lip service to food security but don’t mention in any detail how the grants will improve the food security of beneficiaries and country as a whole. The implicit logic is that transforming the agricultural sector and assisting smallholder and subsistence farmers will improve food security through direct access (subsistence) and sustainable livelihoods (economic access through employment and entrepreneurship). The reports also imply that food security will be improved by increased agricultural production (food availability). While these could be routes towards greater food security, without explicitly outlining the effects the programme should have on food security it is not clear how it hopes to measure its effectiveness in this area. Furthermore, while guided by the goal of improved food security, there is no acknowledgement of the right to food and the concomitant obligations and responsibilities this right places on the government in official CASP documents.
4.3.1. CASP institutional structure and beneficiariesThis case study will analyse CASP as a programme aimed at improving food security. CASP as a whole, however, needs to be judged on its own terms. In the 2009/10 annual report, it was stated that the success of the programme is weighed based on the following six outcomes:
1. Increased creation of income generation (wealth in agriculture and rural areas)
2. Increased sustainable employment
3. Increased farm and household incomes
4. Improved household food production
5. Established black entrepreneurs
6. Improved farming efficiency210
The first four outcomes can be directly linked to food security through their impact on improved economic and direct (subsistence farming) access to food. There is an additional aspect of the programme that relates to the stability of food access in times of emergency; DAFF is charged with supplying food packs in such eventualities. The programme also gives special mention to women, youth, and people with disabilities as targeted beneficiaries. Such attention could counter inequality of access within households that may cause these groups to be less food secure.
Beneficiaries are divided into four broad categories:
1. The hungry and vulnerable – the 2008/09 report states that although this group is primarily the responsibility of the Department of Social Development, DAFF has a responsibility to provide advice and supply agricultural food packs in times of crisis.
209 Hall, R. 2014. ‘Land Reform: Can’t we do better?’. ECSECC Seminar, University of Fort Hare, East London. PowerPoint presentation, slide 11. 210 DAFF. 2010. CASP Annual Evaluation Report 2009/10, 10.
The programme also gives special
mention to women, youth, and people with disabilities as
targeted beneficiaries. Such attention could
counter inequality of access within
households that may cause these groups to
be less food secure.

86 The Right to Food in South Africa
2. Subsistence and household food producers – the report states that support is given through food production although it is unclear what is meant by this. In addition, help is given through the special programme on food security (SPFS) and the Integrated Food and Nutrition Programme (IFSNP) where starter packs for own production (vegetable gardens) are provided.
3. Farmers – support is provided for the beneficiaries of the land redistribution programme and other strategic programmes (e.g. the rehabilitation of irrigation schemes). Private land owners from previously disadvantaged groups that are not beneficiaries of the land redistribution programme can also apply for assistance.
4. General public – this category includes commercial farmers to ensure that business and the regulatory environment is conducive to support agricultural development and food safety.211
These four beneficiaries are serviced the by six support “pillars” of the programme:
1. Information and Knowledge Management,
2. Technical and Advisory Assistance, and Regulatory Services,
3. Training and Capacity building,
4. Marketing and Business Development,
5. On-Farm and off-Farm Infrastructure and Production inputs,
6. Financial assistance.212
Figure 9 : CASP beneficiaries and programmes
CASP
The Hungry & Malnourished
6 Pillars
Household FS & Subsistence
Farm & Business level activity
Agr macrosystem within consumer economic
environment
Info
rmat
ion
& Kn
owle
dge
Man
agem
ent
Tech
nica
l &
adv.
Assis
tanc
e
Regu
lato
ry se
rvice
s
Trai
ning
&
capa
city b
uild
ing
Mar
ketin
g &
busin
ess
deve
lopm
ent
On - &
off-fa
rm
infra
stru
ctur
e
AGRICULTURAL SUPPORT
(Source: DAFF, CASP Concept Document)
The responsibilities for CASP at the department of agriculture’s various levels are spelled out in the concept document for the programme:213
National Level � The determination of agricultural categories including the criteria and principles
within which applications for support in the various categories will be evaluated.
211 DAFF. 2010. CASP Annual Evaluation Report 2008/09, p18.212 DAFF. CASP Concept Document: A draft document for the Deputy Director-General: Agricultural Production and Resource Management of
the Department of Agriculture, 9. 213 DAFF. CASP Concept Document: A draft document for the Deputy Director-General: Agricultural Production and Resource Management of
the Department of Agriculture, pg. 35-36.
87 Budget analysis: assessing the resource allocations and expenditures of government programmes to address the right to food
� The ratification of projects and applications for project finances approved by the provinces.
� The disbursement of funds and control over the provinces.
Provincial Level � The evaluation and prioritisation of projects/applications within the principles and
criteria stipulated by both the Land Redistribution for Agricultural Development (LRAD) policy document and the LRAD operational manual.
� The submission of the approved projects/applications to the National Department of Agriculture for ratification.
� The provision of support and capacity to applicants to comply with the principles/criteria/guidelines for project finance support.
� The provision of capacity, if requested by the applicants, to implement the project.
� Monitoring the implementation of the projects and effect remedial action when necessary.
� To devise a financial management system to facilitate disbursement of funds to the local level, provide timeous financial information to the national level, which will be subject to auditing.
Local Level � Provide a technical opinion on the proposed farm plan, land-use, and environmental
assessment.
Funds are divided among four programmes within CASP:
1. Projects Allocation: funds for supporting approved agricultural projects. In 2012/13, this area of CASP received 50% of the budget.
2. Disaster management: In 2012/13, this area of CASP received 26% of the budget.
3. Extension Recovery Programme (ERP): an advisory service that involves training and capacity building in the sector. In 2012/13, this area of CASP received 20% of the budget.
4. Agricultural colleges: there are 12 agricultural colleges that each receive between R4-R5 million per year in assistance. In 2012/13, this area of CASP received 3.5% of the budget.
Of these four areas, the budget analysis of the next section will focus on Projects Allocation as it is the area most clearly linked to CASP as a root to greater economic and direct access to food. While the other areas are important in understanding the programme’s effect, it would be difficult to analyse their role in the space provided by this case study.
4.3.2. CASP Budget AnalysisThe agricultural sector as a whole employs around 4.6% of economically-active South Africans and contributes around 2.6% to national GDP, but is allocated only around 0.5% of total government expenditure. This level of support is not only low compared to the sector’s contribution to employment and GDP, but also by international standards. Total Support Estimates for agriculture in South Africa are lower than many developed and developing countries. The total support estimates for agriculture in the table below include support for land redistribution. Thus, support for actual agricultural projects is even lower than indicated.
Of these four areas, the budget analysis of the next section will focus on Projects Allocation as it is the area most
clearly linked to CASP as a root to greater
economic and direct access to food.

88 The Right to Food in South Africa
Table 13: Total Support Estimates 1995 – 1997 and 2008 – 2010 (as % of GDP)
1995–1997 2008–2010
South Africa 1% 0.3%
China 1.5% 2.3%
Brazil 0.2% 0.5%
Mexico 0.8% 0.9%
Russia 2.6% 1.6%
Turkey 4.4% 3.2%
Korea 4.9% 2.2%
New Zealand 0.3% 0.2%
European Union 1.5% 0.8%
(Source: OECD data quoted in Black et al 2014214)
This low level of support seems at odds with government’s drive to create sustainable jobs as agriculture has the ability to be labour intensive and employ workers of low skill. In addition, Black et al point out that the “multipliers in agriculture are also extremely high because of the association with labour-intensive, non-farm employment”.215 If food security is to be improved through the creation of sustainable employment and increased direct access, it would appear that government has not allocated sufficient resources to meet this objective.
The new Agricultural Policy Action Plan (APAP) presented in October 2014 does focus more on labour-intensive forms of agriculture and this indicates a positive shift in DAFF’s approach.216 In line with the National Development Plan, APAP aims to create 969 500 jobs in the agriculture sector by 2030.217
Below is a graph showing real government expenditure (in 2012 Rands) and expenditure by the Department of Agriculture, Forestry, and Fisheries (DAFF) since the inception of CASP in 2004/05. It is clear that DAFF’s funding fortunes have fluctuated over the period.
214 Black. A, Conradie. B, and Gerwel. H. 2014. ‘Should agriculture receive greater support as part of an inclusive growth strategy?’ Available at: www.econ3x3.org/article/should-agriculture-receive-greater-support-part-inclusive-growth-strategy
215 Ibid216 DAFF. 2014. ‘Agricultural Action Plan’. Available at: www.agrisa.co.za/wp-content/uploads/2014/10/011-APAP-AgriSA.pdf 217 Ibid slide 6.
The new Agricultural Policy Action Plan (APAP) presented in October 2014 does focus more
on labour-intensive forms of agriculture and this indicates a positive shift in DAFF’s approach.

89 Budget analysis: assessing the resource allocations and expenditures of government programmes to address the right to food
Figure 10: Real government and DAFF expenditure, 2004/05 – 2014/15
R 0
R 1
R 2
R 3
R 4
R 5
R 6
R 7
R 0
R 200
R 400
R 600
R 800
R 1,000
R 1,200
Real
DA
FF e
xpen
ditu
re (2
012
rand
s -b
illio
ns)
sdnar 2102( erutidnepxe t'vog laeR-b
illio
ns)
Real government expenditure (2012 rands - billions)
Real DAFF expenditure (2012 rands - billions)
(Source: National Treasury, Stats SA CPI data, own calculations)
As can be seen in the graph below, real growth in expenditure for the agricultural department peaked in 2007/08 and expenditure has been growing at a declining rate since. In 2008/09, 2010/11, and 2013/14 expenditure in real terms declined.
Figure 11: Real growth rates for gov’t and DAFF expenditures (in 2012 Rands)
-30%
-20%
-10%
0%
10%
20%
30%
40%
50%
2005
/06
2006
/07
2007
/08
2008
/09
2009
/10
2010
/11
2011
/12
2012
/13
2013
/14
2014
/15
(est
.)
Real growth rate of DAFF expenditure Real growth rate of gov't expenditure
(Source: National Treasury, Stats SA CPI data, own calculations)
If we look inside DAFF, however, we can see that the CASP has doubled its share of the department’s resources since 2004.

90 The Right to Food in South Africa
Figure 12: CASP expenditure as % of total DAFF expenditure, 2004/05 – 2012/13
9% 8%
11%10%
17% 18%
22%20%
21%
0%
5%
10%
15%
20%
25%
2004
/05
2005
/06
2006
/07
2007
/08
2008
/09
2009
/10
2010
/11
2011
/12
2012
/13
CASP exp. as % of DAFF exp.
(Source: Annual Reports, National Budget)
In absolute terms, CASP’s budget has grown steadily since its inception from R200 million in 2004/05 to R1, 5 billion218 in 2012/13. As the programme has matured and institutional capacity has increased, it has been able to spend more of its allocation — just 61.5% of the first year’s budget was spent, compared to 81% in 2012/13.
Table 14: CASP budget allocation and expenditure, 2004/05 – 2012/13
CASP Budget Allocation (000s)
Expenditure (000s) % Spent
Real growth in budget allocation
(in 2004 Rands)
2004-2005 200,000 123,000 61.5
2005-2006 250,000 157000 62.8 22%
2006-2007 300,000 252000 84 16%
2007-2008 415,000 333,000 80.2 30%
2008-2009 535,000 497,145 75.1 17%
2009-2010 715,000 695,915 96.9 25%
2010-2011 862,000 854,803 99 16%
2011-2012 1,029,000 984,808 94 14%
2012-2013 1,534,000 1,260,000 81 41%
Total 5,840,000 5,058,000 87
(Source: Annual Reports, Stats SA, own calculations)
The CASP annual reports state that the increase in the proportion of the allocation spent is due to an increase in demand for support services. This makes sense as it would take time for the programme to become well known. However, this does not explain the decline in the proportion of the allocation utilized since 2010/11. In the 2012/13 annual report DAFF states that this decline is due to timing and making sure projects were of good quality.219 That these issues should cause a decline in the proportion of allocation spent two years in a row is a concern.
218 The 2015/16 National Budget indicates that CASP’s allocation in 2012/13 was R1.3 billion rather than R1.5 billion, but I have chosen to use the numbers reported by DAFF in the CASP annual performance review reports.
219 DAFF. 2013. ‘Comprehensive Agricultural Support Programme Annual Evaluation Report 2012/13’, p12
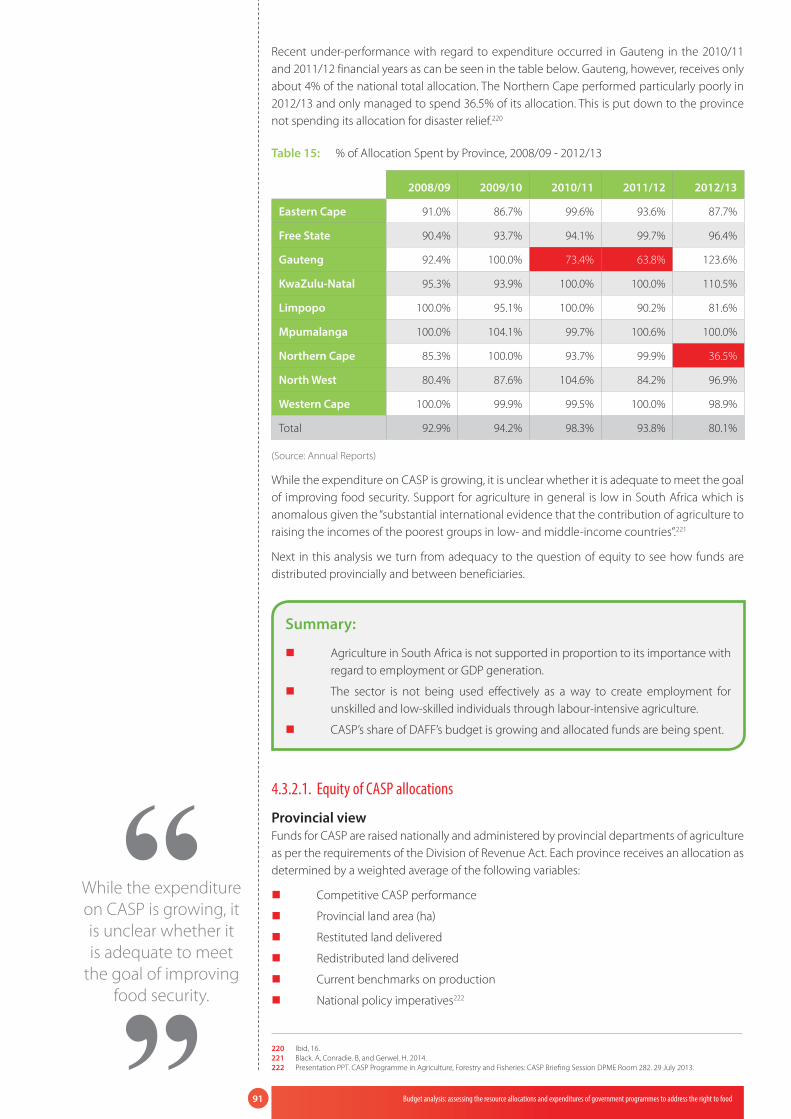
91 Budget analysis: assessing the resource allocations and expenditures of government programmes to address the right to food
Recent under-performance with regard to expenditure occurred in Gauteng in the 2010/11 and 2011/12 financial years as can be seen in the table below. Gauteng, however, receives only about 4% of the national total allocation. The Northern Cape performed particularly poorly in 2012/13 and only managed to spend 36.5% of its allocation. This is put down to the province not spending its allocation for disaster relief.220
Table 15: % of Allocation Spent by Province, 2008/09 - 2012/13
2008/09 2009/10 2010/11 2011/12 2012/13
Eastern Cape 91.0% 86.7% 99.6% 93.6% 87.7%
Free State 90.4% 93.7% 94.1% 99.7% 96.4%
Gauteng 92.4% 100.0% 73.4% 63.8% 123.6%
KwaZulu-Natal 95.3% 93.9% 100.0% 100.0% 110.5%
Limpopo 100.0% 95.1% 100.0% 90.2% 81.6%
Mpumalanga 100.0% 104.1% 99.7% 100.6% 100.0%
Northern Cape 85.3% 100.0% 93.7% 99.9% 36.5%
North West 80.4% 87.6% 104.6% 84.2% 96.9%
Western Cape 100.0% 99.9% 99.5% 100.0% 98.9%
Total 92.9% 94.2% 98.3% 93.8% 80.1%
(Source: Annual Reports)
While the expenditure on CASP is growing, it is unclear whether it is adequate to meet the goal of improving food security. Support for agriculture in general is low in South Africa which is anomalous given the “substantial international evidence that the contribution of agriculture to raising the incomes of the poorest groups in low- and middle-income countries”.221
Next in this analysis we turn from adequacy to the question of equity to see how funds are distributed provincially and between beneficiaries.
Summary:
� Agriculture in South Africa is not supported in proportion to its importance with regard to employment or GDP generation.
� The sector is not being used effectively as a way to create employment for unskilled and low-skilled individuals through labour-intensive agriculture.
� CASP’s share of DAFF’s budget is growing and allocated funds are being spent.
4.3.2.1. Equity of CASP allocations
Provincial viewFunds for CASP are raised nationally and administered by provincial departments of agriculture as per the requirements of the Division of Revenue Act. Each province receives an allocation as determined by a weighted average of the following variables:
� Competitive CASP performance
� Provincial land area (ha)
� Restituted land delivered
� Redistributed land delivered
� Current benchmarks on production
� National policy imperatives222
220 Ibid, 16.221 Black. A, Conradie. B, and Gerwel. H. 2014. 222 Presentation PPT. CASP Programme in Agriculture, Forestry and Fisheries: CASP Briefing Session DPME Room 282. 29 July 2013.
While the expenditure on CASP is growing, it is unclear whether it is adequate to meet
the goal of improving food security.
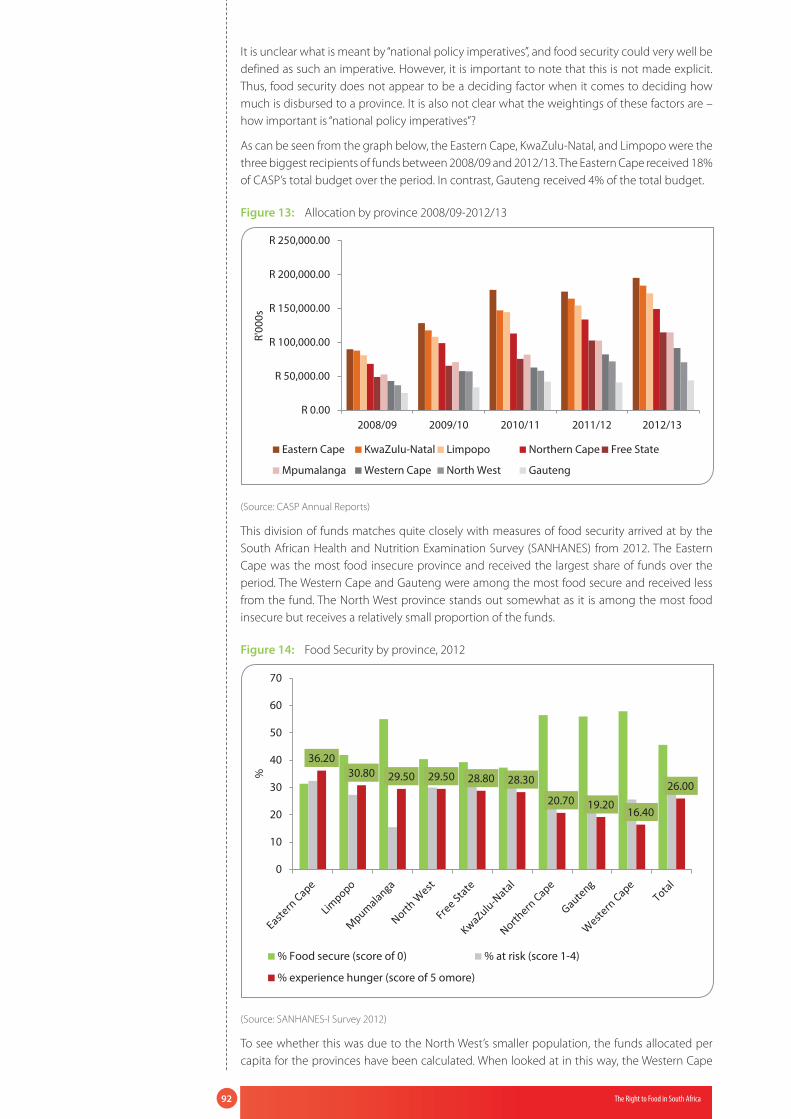
92 The Right to Food in South Africa
It is unclear what is meant by “national policy imperatives”, and food security could very well be defined as such an imperative. However, it is important to note that this is not made explicit. Thus, food security does not appear to be a deciding factor when it comes to deciding how much is disbursed to a province. It is also not clear what the weightings of these factors are – how important is “national policy imperatives”?
As can be seen from the graph below, the Eastern Cape, KwaZulu-Natal, and Limpopo were the three biggest recipients of funds between 2008/09 and 2012/13. The Eastern Cape received 18% of CASP’s total budget over the period. In contrast, Gauteng received 4% of the total budget.
Figure 13: Allocation by province 2008/09-2012/13
R 0.00
R 50,000.00
R 100,000.00
R 150,000.00
R 200,000.00
R 250,000.00
2008/09 2009/10 2010/11 2011/12 2012/13
R'00
0s
Eastern Cape KwaZulu-Natal Limpopo Northern Cape Free State
Mpumalanga Western Cape North West Gauteng
(Source: CASP Annual Reports)
This division of funds matches quite closely with measures of food security arrived at by the South African Health and Nutrition Examination Survey (SANHANES) from 2012. The Eastern Cape was the most food insecure province and received the largest share of funds over the period. The Western Cape and Gauteng were among the most food secure and received less from the fund. The North West province stands out somewhat as it is among the most food insecure but receives a relatively small proportion of the funds.
Figure 14: Food Security by province, 2012
36.2030.80 29.50 29.50 28.80 28.30
20.70 19.2016.40
26.00
0
10
20
30
40
50
60
70
%
% Food secure (score of 0) % at risk (score 1-4)
% experience hunger (score of 5 omore)
(Source: SANHANES-I Survey 2012)
To see whether this was due to the North West’s smaller population, the funds allocated per capita for the provinces have been calculated. When looked at in this way, the Western Cape

93 Budget analysis: assessing the resource allocations and expenditures of government programmes to address the right to food
receives far more funding per capita than other provinces despite the fact that it is the most food secure province. There are obviously other considerations (agricultural opportunity and capacity, for example) but this is an interesting result if the focus is on food security and subsistence agriculture. The Western Cape had only 18,250 individuals (on average) occupied in subsistence agriculture in 2013 (1.1% of South Africa’s total subsistence farmers) (see Figure 16).
Figure 15: Provincial CASP allocation per capita (2012/13)
R 0.00R 20.00R 40.00R 60.00R 80.00
R 100.00
Allocation per capita
(Source: CASP Annual Reports, Stats SA Mid-year Population Estimates May 2014, own calculations)
Figure 16: Subsistence farmers by province (avg for 2013)
- 100,000 200,000 300,000 400,000 500,000 600,000
Subsistance farmers (avg for 2013)
(Source: Stats SA Quarterly Labour Force Survey 2008-2013)
Thus, it can be seen that disbursement to provinces is broadly in line with food security needs, but there are some anomalies (such as the low proportion given to the North West and the high per capita proportion given to the Western Cape).
The beneficiaries view Although food security is not mentioned explicitly in the criteria for provincial disbursements of the grant, it is one of the criteria for grant eligibility for prospective beneficiaries. The criteria are:
1. Agricultural category: The project must fall within the agricultural related categories.
2. Long-term sustainability and economic viability: The project must be economically viable and in the long run independently sustainable. Grants should not be continuously depended upon to make the project viable.
3. Community involvement and ownership: Projects must be demand led. Community ownership and or farmers commitment is a prerequisite.
Although food security is not mentioned explicitly in the
criteria for provincial disbursements of the grant, it is one of the criteria for grant eligibility for prospective beneficiaries.

94 The Right to Food in South Africa
4. Target Beneficiaries: The target beneficiaries must be from historically disadvantaged groups. Women and youth projects are given priority.
5. Food security: The project should enhance national food security (i.e. be surplus producing) and household food security through greater income levels and own consumption.
6. Institutional and technical support: Project finance support is only provided for those agricultural activities which have the required level of institutional and technical support to ensure their sustainability and viability. The quality and level of sophistication should be acceptable to communities and appropriate in terms of skills and affordability levels
7. Submission of a business plan: A request for the grant funding of an agricultural related project must basically adhere to the guidelines as proposed in the Land Redistribution for Agricultural Development (LRAD) operational manual.
8. Job creation - Projects that will generate employment opportunities should be given priority.
These criteria are quite stringent and may be seen as an obstacle for the poorest to gain access to support through the programme. The move in focus towards “quality” over “quantity” with regard to projects and their “value add”, as the 2010/11 Annual Report223 has put it, may be viewed as a way of imposing even stricter standards on the viability of projects to be funded. This could have implications for the ability of poorer applicants to successfully access funding. Food security through direct access for subsistence farmers may thus be negatively affected through this trend. If the quality projects are labour intensive, food security through economic access may not be affected and could be improved.
In line with the statement in the 2010/11 annual report, we can see that in that year the expenditure per beneficiary began to decline and the expenditure per project increased. As Hall (2014) has commented, this leads to a bureaucratic impetus towards fewer, larger projects.224
Figure 17: Expenditure per project and per beneficiary
R 0.00
R 5,000.00
R 10,000.00
R 15,000.00
R 20,000.00
R 25,000.00
R 0R 200,000R 400,000R 600,000R 800,000
R 1,000,000R 1,200,000R 1,400,000R 1,600,000R 1,800,000
Real
exp
. per
ben
e�ci
ary
Real
exp
. per
pro
ject
Real expenditure per project Exp. per bene�ciary
(Source: CASP Annual Reports)
A focus on fewer, larger projects and increased stringency with regard to the application process both seem to work against the ability of the poorest to access these funds and benefit from CASP.
223 Department of Agriculture, Forestry, and Fisheries. 2011. CASP Annual Evaluation Report 2010/11, 14.224 Hall, R. 2014, slide 14.

95 Budget analysis: assessing the resource allocations and expenditures of government programmes to address the right to food
Summary:
� Disbursement to provinces is broadly in line with food security needs, but there are some anomalies.
� Increased stringency for project funding and a focus on fewer, larger projects may work against those most in need of assistance to become food secure.
4.3.2.2. Effectiveness of the programme
As stated in the beginning of this case study, CASP is not solely concerned with improving food security and its other goals must be kept in mind when evaluating its performance. This section, however, will focus on its ability to increase access to food through increased employment (economic access) and its effect on levels of subsistence farming (direct access).
EmploymentIn the decade between 2003 and 2013, the number of people employed in agriculture fell by 188 000.225 The results of CASP need to be studied in the context of this structural decline in employment in the sector, which can be attributed to a number of factors: including an increase in capital-intensive farming methods. CASP’s effect can thus be seen as mitigating the effects of this structural change in the sector.
Figure 18: Agricultural employment (2003-2013)
500
550
600
650
700
750
800
850
900
950
2003 2004 2005 2006 2007 2008 2009 2010 2011 2012 2013
Empl
oym
ent i
n ag
ricul
tura
l sec
tor
(tho
usan
ds)
Agriculture employment
(Source: Stats SA)
If we look at employment generated by CASP, we can see that it has been quite erratic. In 2011/12, for example, 6 658 jobs were created through the programme while just a year later 13 684 were created. This speaks to the nature of the projects implemented with some naturally being more labour intensive than others. It must also be noted that reporting on employment through the programme is not always reliable.226
225 Stats SA. 2013. ‘National and provincial labour market trends: 2003-2013’.226 Discrepancies were found with regard to the numbers from the Free State with jobs for women and men not matching the total number of
jobs created when added together. Other issues with regard to temporary and permanent employment were noted.
If we look at employment
generated by CASP, we can see that it has
been quite erratic.

96 The Right to Food in South Africa
Table 16: Employment generated through CASP (2009/10 - 2012/13)
2009/10 2010/11 2011/12 2012/13
Eastern Cape 544 4591 1133 1,133
Free State 1675 1613 590 582
Gauteng 166 109 54 312
KwaZulu-Natal 1067 628 844 7,112
Limpopo 435 386 1277 468
Mpumalanga 245 842 539 1,277
Northern Cape 870 756 336 963
North West 532 115 445 492
Western Cape 2650 321 1440 1,345
Total 8,184 9,361 6,658 13,684
(Source: Annual Reports)
We can work out the cost of each job created between 2009/10 and 2012/13 by adding up the totals for each year and dividing total expenditure by this amount.
Table 17: CASP expenditure per job created
Total jobs Total expenditureTotal expenditure
per job
CASP (2009/10 - 2012/13) 37 887 R 3 795 526 000 R 100 180
(Source: Annual reports, own calculation)
If DAFF hopes to achieve the APAP and NDP goal of creating 969,500 jobs in agriculture by 2030 at the average same cost per job, this would amount to just over R 97bn (around R 6.5bn per year for 15 years). Clearly, this level of expenditure is not going to happen. The amount spent per job created through the CASP programme is not in line with the goal of the NDP.
Even more concerning is that the jobs that are being created are mostly temporary (such as for setting up the project) which means that sustainable livelihoods are not being created on this scale. It is also a factor with regard to the stability of food access with seasonal falls in employment opportunities. Below are graphs comparing the distribution of employment through CASP by province coupled with illustrations of temporary versus permanent employment.
Even more concerning is that the jobs that
are being created are mostly temporary (such as for setting
up the project) which means that sustainable
livelihoods are not being created on
this scale.

97 Budget analysis: assessing the resource allocations and expenditures of government programmes to address the right to food
Figure 19: CASP employment 2010/11
0
500
1000
1500
2000
2500
3000
3500
4000
4500
5000
Permanent Temporary
(Source: Annual Reports)
Figure 20: CASP employment 2011/12
0
200
400
600
800
1000
12002011/12
Permanent Temporary
(Source: Annual Reports)
Figure 21: CASP employment 2012/13
0500
100015002000250030003500400045005000
Permanent Temporary
(Source: Annual Reports)
It is clear that the overwhelming majority of employment created has been of a temporary nature and its impact on long-term food security can’t be as effective as would be the case with permanent employment. With regard to gender and employment, it can be seen from the

98 The Right to Food in South Africa
table below that in general men have benefitted from employment more than women from the programme.
Table 18: Breakdown of employment generation by gender (2011/12 & 2012/13)
2011/12 2012/13
Male Female Total Male Female Total
Eastern Cape 839 294 1,133 839 294 1,133
Free State 394 196 590 481 101 582
Gauteng 36 19 54 199 113 312
KwaZulu-Natal 398 446 844 3,591 3,521 7,112
Limpopo 674 603 1,277 266 202 468
Mpumalanga 465 74 539 791 486 1,277
Northern Cape 243 93 336 720 243 963
North West 306 139 445 420 72 492
Western Cape 909 491 1,440 672 669 1,345
Total 4264 2355 6658 7,979 5,701 13,684
(Source: Annual Reports)
Other than the division between types of employment (permanent or temporary) and gender, it is unclear what the quality of the employment is. A better idea of the incomes generated through this employment would give us a better sense of its impact on food security.
Direct access (subsistence farming)Around 1.58 million South Africans (3% of the population) are involved in subsistence agriculture. DAFF defines subsistence farmers as “resource-poor farmers producing mainly for household consumption and according to their household food requirements rather than producing surpluses for the market”.227 As can be seen from the graph below, there is clear seasonality with regard to involvement in subsistence agriculture with most of the peaks in the first quarter of the year – as is to be expected. What is also clear is that two provinces stand out from the pack. KwaZulu-Natal and the Eastern Cape have roughly twice as many subsistence farmers as the province that comes third – Limpopo.
227 Department of Agriculture, Forestry, and Fisheries. 2013. CASP Annual Evaluation Report 2012/13, 23.
Around 1.58 million South Africans (3% of the population) are
involved in subsistence agriculture.

99 Budget analysis: assessing the resource allocations and expenditures of government programmes to address the right to food
Figure 22: No. of people involved in subsistence agriculture by province, 2013
0
100,000
200,000
300,000
400,000
500,000
600,000
700,000
800,000
900,000
Jan-Mar 2008 Jan-Mar 2009 Jan-Mar 2010 Jan-Mar 2011 Jan-Mar 2012 Jan-Mar 2013
Eastern Cape Free State Gauteng
KwaZulu Natal Limpopo Mpumalanga
North West Northern Cape Western Cape
(Source: Stats SA228)
If we look at CASP assistance for subsistence farmers, however, it was much higher for Mpumalanga in 2012/13 than elsewhere. The Eastern Cape’s department of agriculture only assisted 1 647 subsistence farmers despite the province having over 400 000 such farmers. Limpopo didn’t manage to assist any of their over 200 000 subsistence farmers in this financial year.
Figure 23: CASP assistance by type of agriculture, 2012/13
Mpumalanga
KwaZulu-Natal
FreeState
EasternCape
NorthWest
NorthernCape
GautengWestern
CapeLimpopo
Subsistence 9,788 4,656 1,794 1,647 139 138 46 19 0
Smallholder 11,218 5,878 898 1,076 5,460 995 113 2,363 539
Black Commercial 1,273 898 28 5 671 123 108 2,567 0
0
2,000
4,000
6,000
8,000
10,000
12,000
Subsistence Smallholder Black Commercial
(Source: CASP Annual Report 2012/13)
When one looks closer at some of the projects that were assisted in this year (2012/13), it is unclear what classified the beneficiaries as subsistence farmers and what warranted the amounts they received.229 For example, in Ladybrand in the Free State a private subsistence vegetable project called Mahlomaholo was assisted with R 3 million in funds for four beneficiaries. In Gauteng, Mr. Mvelase received R600 000 for the construction of his broiler structure. He is the sole beneficiary and there is no indication of employment generation from the project. In the Eastern Cape, the Alice project in Tyhume (involved in beef production) received R 1.5 million for its eight beneficiaries and created 21 temporary jobs. However, it is unclear if these were once-off jobs or recurring seasonal work. These are but a few of the projects that stand out as inconsistent examples of assistance for subsistence farmers.
228 Stats SA. 2014. ‘Quarterly labour force survey: Historical revisions of the QLFS 2008 to 2013. 229 The information in this paragraph is from excel sheets made available by DAFF here: www.nda.agric.za/doaDev/sideMenu/links/RelatedLinks.
html. The department should be commended for making this information available so readily.

100 The Right to Food in South Africa
It is difficult to reconcile such anecdotal proof with ideas of subsistence agriculture as production for oneself and one’s family. These projects are receiving substantial funds and it would be disingenuous to claim that the funds were for own production or in any way linked to food security as a pressing need. If direct access to food through own production is a route that CASP seeks to support to increase household food security, this doesn’t seem to be what is happening on the ground. As Hall puts it, the emphasis is on fewer, larger projects instead.
Why might this be the case? There seems to be an incentive to spend the budget,230 but dealing with a large amount of projects would be complicated and require more work. This creates a situation where subsistence agriculture is inconvenient for administrators and the definition of projects that fall into this category may be stretched to fill quotas. While this is only conjecture, it is clear that CASP is not reaching nearly as many subsistence farmers as it should and the ones it is reaching are often difficult to classify as subsistence farmers. Hall has referred to these projects as “political Smarties”.231 We could also think of these outcomes as the unfortunate result of perverse incentives for bureaucrats to meet quotas and avoid more complex administration. Whether one wants to see political undertones or human and institutional failings as the driving force is a matter of perspective; what is clear is that assistance to subsistence farmers on a scale and in a manner that would improve food security for the most vulnerable is not happening.
Summary:
� It is clear that the overwhelming majority of employment created by CASP has been of a temporary nature, diminishing its impact on long-term food security
� Men have benefitted from employment more than women from the programme
� The programme does not seem to be effective in supporting subsistence agriculture on a scale and in a manner that would have a positive impact on food security.
4.3.3. Conclusion and recommendationsAgriculture has the potential to pull many South Africans out of poverty and food insecurity. Yet current levels of support for agriculture, whether it be large commercial agriculture or subsistence agriculture, is not sufficient to reach this objective. Focus needs to be placed on labour-intensive forms of agriculture at the commercial scale and on assisting as many subsistence farmers as possible at the other end of the scale. The drive for “quality” over “quantity” with regard to funding may end up making access to funds more difficult for the poorest and most food insecure households.
Food security is not the sole objective of the Comprehensive Agricultural Support Programme, but in relation to this objective the programme appears to be failing.
Recommendation 1An increase in government support for agriculture in line with its contribution to employment and GDP – to bring South Africa closer to other developing and developed countries levels of expenditure on agriculture.
Recommendation 2Focus on labour-intensive projects for funding.
Recommendation 3Seek to create more permanent employment to ensure greater stability of incomes and food security.
230 When Gauteng failed to spend its allocated budget, the provincial department was taken to task. 231 Hall, 2014, slide 14.
Agriculture has the potential to pull
many South Africans out of poverty and food insecurity. Yet
current levels of support for agriculture,
whether it be large commercial agriculture
or subsistence agriculture, is not sufficient to reach
this objective.

101 Budget analysis: assessing the resource allocations and expenditures of government programmes to address the right to food
Recommendation 4Increase the number of women and youth benefitting from programmes so that equity is met in this regard.
Recommendation 5The focus on subsistence agriculture needs to be on more projects rather than fewer, bigger projects.
Recommendation 6Ensure that the incentives of department bureaucrats are aligned with food security and the elimination of poverty.
Recommendation 7Join CASP, RECAP, and Fetsa Tlala into one comprehensive programme for agricultural support (see RECAP case study for further motivation for this recommendation).
4.4. Case Study 4: Fetsa Tlala, by Jared Jeffery
4.4.1. IntroductionIn October 2013, the Department of Agriculture, Forestry and Fisheries (DAFF) launched Fetsa Tlala (“End Hunger”) which became its central food security programme in place of the embattled Zero Hunger Campaign, which never really got off the ground due to a lack of political buy-in. As Fetsa Tlala is still relatively new, and information on it is scarce, this case study will be shorter than the others. However, it is an important case as it illustrates how government action and policy towards promoting food security can be capricious, hostage to political machinations up the pecking order, and even regressive. The cancellation of the Zero Hunger Campaign, which was based on a largely successful programme in Brazil (Fome Zero), must make us wary of considering any programme put in place to counter food insecurity as assured (long term). This then also emphasises the need for the right to food to be cemented in law with clear content so that progress towards greater food security is not dependent solely on changeable government programmes.
4.4.2. Background: the Zero Hunger CampaignBefore discussing Fetsa Tlala, it may be instructive to have an idea of the goals of its predecessor, the Zero Hunger Campaign. This will show how drastically the approach to food security can shift within a short span of time. The objectives of the Zero Hunger Campaign were to:
� Ensure access to food for the poor and vulnerable members of society
� Improve the food production capacity of households and poor resource farmers
� Improve the nutrition security of citizens
� Develop market channels through bulk government procurement of food linked to the emerging agricultural sector
� Foster partnerships with relevant stakeholders within the food supply chain232
One of the key ways the campaign was hoping to achieve these objectives was by ensuring that government departments purchased at least 35% of the food they required from local, smallholder farmers. This would help stimulate this sector of agriculture which has been shown internationally to be important in efforts to alleviate rural poverty and increase food security.233 There is no reliable information available to assess whether this or the other objectives of the campaign were met.
232 Mohlabi. S (Director of Subsistence Farming at DAFF). 2012. Food Security Policy / Zero Hunger Programme for the Republic of South Africa. Presentation. Slide 19.
233 Black, Conradie, and Gerwel, 2014.

102 The Right to Food in South Africa
4.4.3. Fetsa Tlala: objectivesIf we contrast these objectives with those of its successor, Fetsa Tlala, it becomes clear that thinking on food security within DAFF has regressed back to the production/availability perspective. Fetsa Tlala’s core objective is:
� 1 million hectares of land under production by the 2018/19 production season234
A plan to achieve this goal presented to the Portfolio Committee on Agriculture, Forestry and Fisheries in September 2014 said nothing more about what type of farmers were to be targeted. It also said nothing about how this programme would stimulate employment and economic access to food in the country. In fact, in neither of the two presentations given to the committee was food security mentioned. In a further document accompanying the presentations, food and nutrition security is mentioned in the introduction:
“Food and Nutrition Security is identified as a key element to alleviate poverty, reduce unemployment and inequality by 2030. In an attempt to address these fundamental challenges, the Fetsa Tlala Food Production initiative was introduced.”235
This change in objective, with most of the progressive aims of the Zero Hunger Campaign dropped, led the authors of this report to question whether Fetsa Tlala was in fact the successor of the Zero Hunger Campaign. Phone calls to DAFF confirmed that this programme is meant to replace the Zero Hunger Campaign and its name (translated as “End Hunger”) leaves one in no doubt that it is intended as the department’s food security programme.
The simplicity of the programme goal (1 million hectares under the plough in five years) must surely be among its attractions for the department. It is a distant target that agricultural technocrats can work towards. However, the multi-level, multi-causality of food insecurity seemingly sets the department up for failure every time. Moreover, a key question remains: is there any evidence to suggest that 1 million more hectares under the plough would significantly improve food security? Who is set to benefit from this extra production?
In his address to the House of Traditional Leaders in March 2015 (after the State of the Nation Address), President Zuma stated that the land targeted for Fetsa Tlala would be communal land.236 This is not elaborated upon in the plan presented to the Portfolio Committee on Agriculture.
The plan presented to parliament last year assures us that
“It is expected that beneficiation of One Million Hectares programme will in the main accrue to the indigent and vulnerable sections of the society”.237
However, the plan does not indicate how it will ensure that this will be the case. Without more specific targets and a more explicit theory of change and implementation plan the department is able to claim victories should they appear while denying any failures as being outside the scope of the project. In order to hold the department to account for its efforts to fight food insecurity, we need to have a clearer idea of how the programme will assure that the poor and indigent are the main beneficiaries.
In contrast to the department’s claim, an incentive to get vast tracts of land under cultivation seems to hint at large-scale operations: an emphasis on capital-intensive efficiency rather than labour-intensive employment. Nowhere in the plan is employment mentioned. However, increased food security through economic access resulting from employment must surely be the focus of food security programmes. South Africa, as has been mentioned multiple times throughout this report, is food secure at the national level. Food availability is not a pressing issue that the government needs to focus on in its efforts to counter food insecurity, yet this programme seems to focus on little else.
Apart from economic access through employment, the strategy could have been to stimulate direct access through greater subsistence agriculture. However, the plan makes it clear that
234 DAFF. 2014. “Presentation to the Portfolio Committee on Agriculture, Forestry and Fisheries: The 2014/15 Fetsa Tlala Plan.2 September 2014. 235 DAFF. 2014. “Fetsa Tlala: Production Plan 2014/15”. Compiled by: the Deputy Director General for the programme Food Security and Agrarian
Reform, 1.236 Goosen. Z. 2015. ‘Zuma addresses National House of Traditional Leaders’ The Citizen Online. Available at: http://citizen.co.za/338775/zuma-
addresses-national-house-of-traditional-leaders/. 237 Ibid.

103 Budget analysis: assessing the resource allocations and expenditures of government programmes to address the right to food
production on the land under cultivation must feed into formal markets,238 while subsistence farming is not mentioned. The drive is towards commercial agriculture rather than own production. Although personal production may be an outcome for the farmers involved, if these farmers are relatively few and drawn from the middle class (as seems to be the case with other agricultural support programmes, CASP and RECAP - see case studies in this report) it is unlikely that direct access generally will be much affected by the programme.
4.4.4. Fetsa Tlala: budget analysisWith regard to funding, the programme is estimated to require R 11.4 billion over the Medium Term Strategic Framework period, which will be raised, in part, by appropriating 70% of the Comprehensive Agricultural Support Programme’s (CASP) infrastructure grant.239 By its own admission, this amount is unlikely to be enough for the programme to meet its goal of 1 million hectares under cultivation – at less than a billion per year, it will fall well short of the R 11.4 billion the plan states is needed over the five-year MTSF period. The plan states that government will need to “think outside the box” and draw on partners to achieve its goal.
Figure 24: Fetsa Tlala budget estimate, 2014/15 - 2017/18
R -
R 100.00
R 200.00
R 300.00
R 400.00
R 500.00
R 600.00
R 700.00
R 800.00
R 900.00
R 1,000.00
2014/15 2015/16 2016/17 2017/18
Mill
ions
Fetsa Tlala budget estimate (millions)
(Source: National Treasury – National Budget 2015/16, own calculation)
If we compare the Fetsa Tlala budget allocation (70% of CASP’s infrastructure grant allocation) with total CASP budget allocation, we can see that Fetsa Tlala will receive around half of CASP’s total budget.
Table 19: Fetsa Tlala budget estimates based on CASP allocations, 2014/15 –2017/18
CASP budget allocation
Fetsa Tlala budget estimate
% of CASP budget going to Fetsa Tlala
2014/15 R 1 366 800 000 R 720 000 000 49%
2015/16 R 592 400 000 R 300 000 000 52%
2016/17 R 625 100 000 R 370 000 000 52%
2017/18 R 748 400 000 R 990 000 000 52%
(Source: National Treasury – National Budget 2015)
We can see below that the programme exceeded its targets for hectares under production for 2013/14. However, the DAFF presentation attributes these numbers to CASP projects. Which raises the question, where does CASP end and Fetsa Tlala begin?
238 DAFF. 2014. “Presentation to the Portfolio Committee on Agriculture, Forestry and Fisheries: The 2014/15 Fetsa Tlala Plan. Slide 7.239 DAFF. 2014. “Fetsa Tlala: Production Plan 2014/15”. Compiled by: the Deputy Director General for the programme Food Security and Agrarian
Reform, 1.
With regard to funding, the programme is
estimated to require R 11.4 billion over the Medium Term
Strategic Framework period, which will
be raised, in part, by appropriating 70% of the Comprehensive Agricultural Support Programme’s (CASP) infrastructure grant.

104 The Right to Food in South Africa
Table 20: Hectares under production, 2013/14
Province2013/14 ha
planned2013/14 ha
achieved
Difference between
planned & achieved
2014/15 ha planned
Eastern Cape 13415 6579 6836 17200
Free State 2430 4986 -2556 5321
Gauteng 2045 2850 -805 2265
KwaZulu -Natal 10952 14673 -3721 13160
Limpopo 26691 51970 -25279 46175
Mpumalanga 27208 43969 -16761 33960
Northern Cape 1110 1198 -88 2037
North West 20014 27167 -7153 9015
Western Cape 447 837 -390 640
Total 104312 154229 -49917 129773
(Source: DAFF 2014 (a))
The rollout schedule for the programme is given in the table below. It should be noted that for the 2014/15 period the department has already said that it is unlikely to reach its targets due to limited funds for the programme.
Table 21: Roll out schedule for the programme, 2013/14 - 2018/19
Financial Year Year 02013/14
Year 12014/15
Year 2 2015/16
Year 32016/17
Year 42017/18
Year 52018/19
Cumulative targets (ha)
350 000 470 000 590 000 710 000 850 000 1000 000
(Source: DAFF 2014 (a))
In the next table we can see the targets and budget for 2014/15 by province. It is clear that the amount budgeted per province does not follow the extent of the land area targeted. The Northern Cape, for example, is allocated R 32,720 per hectare while Limpopo is only allocated R 1,279 per hectare. It is unclear why these numbers differ so drastically

105 Budget analysis: assessing the resource allocations and expenditures of government programmes to address the right to food
Table 22: Summary of Fetsa Tlala target for 2014/15 financial year
ProvinceFetsa Tlala allocation
(R’000)Hectares planned
Rands per hectare
Eastern Cape R 143,233,000 17200 R 8,328
Free State R 61,502,000 5321 R 11,558
Gauteng R 10,561,000 2265 R 4,663
KwaZulu-Natal R 103,500,000 13160 R 7,865
Limpopo R 59,062,000 46175 R 1,279
Mpumalanga R 109,446,000 33960 R 3,223
Northern Cape R 66,650,000 2037 R 32,720
North West R 46,062,000 9015 R 5,109
Western Cape R 14,200,000 640 R 22,188
TOTAL R 614,216,000 129773 R 4,733
(Source: DAFF 2014 (a))
While DAFF will be the lead department in the rollout of the programme, there will be a National Task Team comprised of DAFF (national and provincial), the Department of Rural Development and Land Reform, the Department of Water Affairs, the Department of Trade and Industry, the Department of Social Development, the Department of Public Works, and the National Treasury. The plan does not elaborate as to the different roles these departments would have in ensuring the success of the plan.
4.4.5. Conclusion and recommendationsFetsa Tlala appears to be a reversion to the production/availability approach to food security. The programme pays no attention to household access to food through either increased employment (economic access) or subsistence farming (direct access). This highlights that progress with regard to food security policy is not assured and programmes are at the whim of larger political and budgetary games. As such, a rights-based approach to food security and the monitoring of government efforts is vital in ensuring that policy moves towards the progressive realisation of the right to food.
Cynically, one could conclude that this is not a separate food security programme at all but rather a CASP objective dressed up as a food security initiative. While food security is among the objectives of CASP, there are many problems with the manner in which the programme seeks to address food security (see previous case study). Leaving food security policy within the Department of Agriculture, Forestry, and Fisheries risks it always being framed within agricultural production terms.
Recommendation 1Fetsa Tlala should be reorganised so that it targets access to food rather than an increase in production.
Recommendation 2There need to be targets for job creation so as to improve economic access to food.
Fetsa Tlala appears to be a reversion
to the production/availability approach
to food security.

106 The Right to Food in South Africa
Recommendation 3Labour-intensive agriculture or smallholder and subsistence farmers should be the focus of the programme.
Recommendation 4The biggest recommendation to draw from this case study is that food security needs to be the responsibility of a dedicated, accountable office (in the Presidency/Vice Presidency, for example, as proposed in government’s new National Food and Nutrition Security Policy, or the creation of a Special Rapporteur for Food Security as was done in Brazil) that is not affiliated/dependent on another department and with authority to coordinate efforts around food security.
4.5. Case Study 5: Recapitalisation and Development Programme (RECAP), by Jared Jeffery
The Department of Rural Development and Land Reform (DRDLR) replaced the Department of Land Affairs in 2009 with a mandate to work towards rural development and the government’s Outcome 7: the creation of “vibrant, equitable and sustainable rural communities.” On the back of the 2005 Land Summit and findings that many redistributed farms were in distress, the new department took a more comprehensive approach to land reform. This meant giving post-settlement grants and assisting land recipients to become commercial farmers through a mentorship programme and linking them with strategic partners. These functions were carried out through the Recapitalisation and Development Programme (RECAP) which was launched in 2010; its objectives initially included the following:
1. Increase agricultural production.
2. Guarantee food security.
3. Graduate small farmers into commercial farmers.
4. Create employment opportunities in the agricultural sector.
5. Establish rural development monitors (rangers).240
Under these original objectives, food security was targeted directly and would improve through greater economic access to food for beneficiaries, their employees, and those employed in linked industries/activities. However, the original policy never went into any detail as to how food security would be targeted and no measures were created to monitor progress in food security for beneficiaries or their wider community.
In the Department of Monitoring and Evaluation’s (DPME) assessment of the programme (2013), they asked a sample of RECAP beneficiaries (from the six provinces covered in the report) about changes in their food security and dietary diversity. The results are summarised in the table below.
Table 23 : Effect of RECAP on beneficiaries’ diets
East
ern
Cape
Free
Sta
te
Gau
teng
KwaZ
ulu-
Nat
al
Lim
popo
Nor
th W
est
All
6 pr
ovin
ces
% of respondents saying diet improved.
66.67 40.91 20 45.83 61.54 50 46.94
(Source: DPME)
240 Business Enterprises at University of Pretoria for the DPME. 2013 ‘Implementation Evaluation of the Recapitalisation and Development Programme (from its inception in 2010 to June 2012)’ ix.

107 Budget analysis: assessing the resource allocations and expenditures of government programmes to address the right to food
Less than half of respondents overall stated that there had been a positive effect on their diets since the programme started. This may be surprising given that beneficiaries are paid around R 15 000 per month for the first year of the five-year programme (after which they are meant to create their own income through production). However, it makes more sense if we consider that the beneficiaries are drawn largely from the middle class. Thus, it can be inferred that there was no improvement in their diets because they were food secure to begin with. Anecdotal evidence of this comes from a DPME interview with a Free State mentor at a Bloemfontein Abattoir who said:
“RECAP funding is not reaching the target population. It is about who knows who. Most of the beneficiaries really didn’t need support as they are already established while some have no interest in becoming commercial farmers.”241
Elsewhere in the DPME’s report it states that:
“There were instances where it was difficult to understand how some farms came to be included in RECAP because the owners seemed to be financially strong and could afford to provide their own funds. This aspect is of great concern to the review team and suggests a considerable wastage of public funds. There are a number of cases where beneficiaries benefitted from RECAP funds when their own net asset position seemed to be much more than the value of the farms.”242
The original RECAP policy only ever paid lip service to addressing rural food security and never made it clear how it hoped to improve the situation. Meanwhile, the manner in which the policy was carried out, with its focus on large-scale commercial agriculture and benefitting members of the middle class, leaves one in doubt whether food security was ever a priority for the programme.
When the policy was reformulated in 2013, food security was dropped as a strategic objective. The revised RECAP policy has the following goals:
1. All land reform farms are 100% productive.
2. The class of black fledgling commercial farmers which was destroyed by the 1913 Natives Land Act is rekindled.
3. The rural-urban population flow is significantly reduced.243
As food security is no longer among the stated objectives of the programme, it would be difficult to hold government to account for its poor performance in ensuring it through RECAP. The programme should be judged against its stated goals. However, the policy still acknowledges that it has a role to play in bringing about greater food security. In the latest policy document it is stated that:
The formulation of this policy forms part of Government’s undertaking to review all land reform policies as enunciated in the 2011 Green Paper on Land Reform, with a view to address issues relating to the historical exclusion, equitable access to land, and participation in the optimal utilization of land; as well as to address challenges relating to access to food at both household and national level to bring about household food security and national food self-sufficiency.244 (Author’s emphasis).
Thus, it is with an understanding that food security is no longer a priority for this programme that this analysis will seek to study its possible effect on food security. In doing so, the case study will place an emphasis on the effect of the programme on employment and through employment economic access to food. Unlike CASP, RECAP does not target subsistence agriculture and thus direct access to food is not among its intended effects. Furthermore, as previously discussed, the beneficiaries of RECAP were not likely to be among the food insecure prior to the programme being implemented. Thus, their economic upliftment cannot be counted among
241 Ibid, 27. 242 Ibid, x.243 DRDLR. 2013. ‘Three Years Review of Recapitalization and Development Programme’. 7.244 DRDLR. 2013. ‘Policy for the Recapitalisation and Development Programme of the Department of Rural Development and Land Reform’, 6.
As food security is no longer among
the stated objectives of the programme, it would be difficult to hold government
to account for its poor performance
in ensuring it through RECAP.

108 The Right to Food in South Africa
the gains to food security brought about by the programme. From a food security perspective, RECAP should be judged solely on its ability to provide sustainable livelihoods through greater employment. This could be linked to its third objective to reduce the rural-urban population flow which must be in part due to the lack of employment opportunities in rural areas.
Summary:
� While food security is no longer a strategic target of RECAP it is still considered to be an important outcome for the programme to achieve.
� Indications are that most beneficiaries of the programme were food secure to begin with.
� RECAP’s ability to improve economic access to food through increased rural employment will be the focus of this analysis.
4.5.1. How RECAP works.RECAP has sought to aid struggling land reform beneficiaries by offering the financial and technical support needed to help them graduate to sustainable, commercial agricultural enterprises. As such, it is very similar DAFF’s CASP programme. However, RECAP enlists the help of mentors (commercial farmers) and strategic partners (agricultural organisations and corporations) to help the beneficiaries learn the ropes of commercial agriculture. Their involvement takes the place of CASP’s extension services. Furthermore, the emphasis is squarely on medium to large-scale commercial agriculture and smallholder and subsistence farmers are not targeted.
Like CASP, the programme is not limited to land reform beneficiaries but can include emerging farmers who attained their land through private means. The programme can be applied to the following categories of property:
� Selected distressed land reform properties;
� Properties selected by District Land Reform Committees;
� Sites within the former homelands and other communal areas; and,
� Farms, acquired by individuals or collectives from historically disadvantaged communities, requiring strategic support.245
The programme differs from CASP in that beneficiaries of the Proactive Land Acquisition Strategy (PLAS), a land reform strategy enacted since 2006 in which the government buys strategic land and leases it to beneficiaries rather than handing over the title deeds, can seek assistance from RECAP whereas they are not assisted by DAFF’s CASP. The reluctance of DAFF to assist beneficiaries of PLAS is down to the presumption that they cannot support projects on leased land.246
The programme helps fund projects over a five-year period with the following funding cycle in which beneficiaries are slowly made independent of the programme:
Year 1: 100% funding for infrastructure and operational costs;
Year 2: 80% funding for development needs;
Year 3: 60% funding for development needs;
Year 4: 40% funding for development needs; and
Year 5: 20% funding for development needs247
245 Policy for the Recapitalisation and Development Programme of the Department of Rural Development and Land Reform. 23 July 2013, p17.246 Ensor. L. 2015. ‘Critics want land scheme review’. Business Day Online. 06 February 2015. Available at: www.bdlive.co.za/national/2015/02/06/
critics-want-land-scheme-review. 247 Business Enterprises at University of Pretoria for the DPME, 2013, 2.

109 Budget analysis: assessing the resource allocations and expenditures of government programmes to address the right to food
Profits from the previous year are meant to fill in for the decline in RECAP funding. Flexibility in this regard is given to projects that need longer-term support due to the nature of the concern (for example, timbre production). Thus, instead of years there are five phases with the first being the incubation phase and the remaining four phases focus on value change developments.248
RECAP is also distinct from CASP in that it involves the private sector in its mentorship programme and help from strategic partners; it funds projects on PLAS land; and it focuses solely on commercial agriculture. However, it seems that these differences are not fundamental and do not necessitate a separate programme being provided by a different government department. Indeed, the programmes have far more similarities than differences and separating them surely leads to inefficiencies due to duplication of efforts, confusion by prospective beneficiaries, and wastage of government funds.
4.5.2. BeneficiariesAlthough the impetus for the programme came from the number of failing/distressed redistributed farms, the beneficiaries of RECAP need not be beneficiaries of land reform programmes. Indeed, what exactly qualifies one to be a beneficiary of RECAP is not completely clear. This is another complaint made about the programme by the DPME’s report – which calls the lack of clarity on selection one of the programme’s “major weaknesses”.249 What is clear is that beneficiaries must be black and their farms/projects must have commercial potential.
With food security in mind, the ideal would be that selection looked at the prospect for job creation through the project. Labour intensive forms of agriculture should be prioritised in order to bring about greater economic access to food in rural areas. To this end, smallholder farmers should be targeted as they tend to be more labour intensive (greater capital intensity is required to compete in large-scale commercial agriculture). The move towards larger, more capital-intensive agriculture has been a driving force behind the decline in agricultural employment in recent decades. It is thus inappropriate for a policy that seeks to increase rural employment and improve rural livelihoods to focus on large-scale commercial agriculture. This is a point argued by Aliber and Cousins who remind us that the Reconstruction and Development Programme of 1994 clearly sought to restructure the agricultural sector in favour of small-scale farming.250 They state that “Relying on the large-scale commercial model has meant inappropriate business plans are imposed on land reform beneficiaries in South Africa. And even when land reform beneficiaries are able to ‘farm productively’ on large scale commercial farms, the poverty reduction benefits are minimal or non-existent.251
248 Ibid, 2. 249 Ibid, 26.250 Cousins. B, and Aliber. M. 2013. ‘Unworkable land reform project designs offer inappropriate farming models to rural dwellers’. Available at:
www.plaas.org.za/blog/unworkable-land-reform-project-designs-offer-inappropriate-farming-models-rural-dwellers 251 Ibid.
With food security in mind, the ideal would
be that selection looked at the prospect
for job creation through the project.

110 The Right to Food in South Africa
Table 24: RECAP projects by land reform type252 and province as of June 2012
EC FS GP KZN LP MP NC NW WC Total
SLAG 2 5 0 3 2 0 2 2 0 16
SPLAG 0 0 1 1 0 0 0 0 0 2
LRAD 5 30 2 54 40 2 13 43 1 190
IRRIG/LRAD 1 0 0 0 0 0 0 0 0 1
PLAS 4 77 106 47 24 52 19 34 11 374
Restitution 1 2 2 0 1 1 0 22 0 29
Communal 0 0 0 0 0 0 0 1 0 1
LRAD/SLAG 0 0 0 1 0 0 0 0 0 1
State 0 0 0 0 0 0 4 3 0 7
Other 0 1 0 0 1 0 0 0 0 2
Unknown 1 0 6 4 2 4 0 0 0 17
Total 14 115 117 110 70 59 38 105 12 640
(Source: DPME)
As can be seen from the above table, the majority of RECAP beneficiaries have been drawn from those receiving leases on land through the Proactive Land Acquisition Strategy (PLAS). An attempt to compare the number of RECAP projects on PLAS land with total number of PLAS farms shows that there are some issues with the available data. In the table below, we can see that for Gauteng, at least, the numbers do not tally.253 If we assume that the other numbers give a reasonable view of what is happening, we can see that only in the Free State are the majority of PLAS farms receiving RECAP assistance. Overall, 44% of PLAS farms received RECAP assistance in the period 2009 – 2012.
Table 25: PLAS and RECAP farms,254 2009 – 2012
EC FS GP KZN LP MP NC NW WC Total
PLAS farms 123 102 56 154 92 122 57 99 41 848
RECAP projects for PLAS farms
4 77 106 47 24 52 19 34 11 374
% of PLAS farms benefitting from RECAP
3% 75% 189% 31% 26% 43% 33% 34% 27% 44%
(Source: DPME 2013, DRDLR 2012)
252 SLAG=Settlement Land Acquisition Grant, SPLAG= Settlement Production and Land Acquisition Grant; IRRIG=Irrigation, LRAD=Land Redistribution for Agricultural Development, PLAS=Proactive Land Acquisition Strategy.
253 The numbers for total PLAS beneficiaries are from the ‘Mid-term Review of the Department of Rural Development and Land Reform’ 2012 by the DRDLR. The number for PLAS beneficiaries are for the period 1 May 2009 - 31 March 2012 while those for RECAP (taken from the DPME’s report 2013) are from its inception in 2010 to June 2012. Thus the periods overlap quite closely and there is no reason why the number for Gauteng should be so far off. If we look at newer numbers from the 2014 End of Term Report, we can see that in December 2013 Gauteng had 93 PLAS farms – still below the number of RECAP projects on PLAS farms recorded by the DPME. While a project can involve more than one farm (which makes the DRDLR’s shifting use of these terms confusing at times) I’m not sure whether one farm can have more than one project.
254 In some reports the DRDLR refers to PLAS “projects” and in others “farms”. The numbers indicate that these are usually synonyms.
111 Budget analysis: assessing the resource allocations and expenditures of government programmes to address the right to food
The significance of this is due to the fact that PLAS farms are not deemed eligible for CASP assistance due to the farms not being owned by the prospective beneficiaries. This means that the majority of PLAS land recipients are not receiving any form of assistance.
PLAS is subject to the state’s Land Leasehold and Disposal Strategy (SLDP). According to Cousins, this strategy divides beneficiaries into four categories:255
1. Households with no or very limited access to land, even for subsistence production.
2. Small-scale farmers farming for subsistence and selling part of their produce on local markets.
3. Medium-scale commercial farmers already farming commercially at a small scale and with aptitude to expand, but constrained by land and other resources
4. Large-scale or well established commercial farmers farming at a reasonable commercial scale but disadvantaged by location, size of land and other resources or circumstances, but with potential to grow.
Cousins argues that the manner in which the leasehold system (PLAS) and RECAP are set up – with the need for emerging commercial farmers to team up with commercial mentors and strategic partners to achieve goals (large-scale commercial farming) – strongly suggests that applicants that fall within categories 3 and 4 are likely to be the targeted beneficiaries of RECAP.256 Thus, RECAP beneficiaries will tend to be medium to large-scale commercial farmers rather than subsistence or small-scale farmers. This is not ideal for job creation and increasing economic access to food in rural areas. Cousins finishes his analysis by saying:
Since 2009 policy documents on land reform have been full of fine-sounding phrases on the need for ‘agrarian transformation’, defined as ‘a rapid and fundamental change in the relations (systems and patterns of ownership and control) of land, livestock, cropping and community’, and the creation of ‘vibrant, equitable and sustainable rural communities’. Smallholder farmers and the rural poor are often named as key beneficiaries. This populist discourse masks the reality that the rural poor and potentially highly productive small-scale farmers are not really intended to be the main beneficiaries of government’s land redistribution policies, which, as in other sectors such as mining, are aimed at promoting the interests of an emergent black bourgeoisie.257
Summary:
� It is unclear how RECAP beneficiaries are selected.
� Most RECAP projects are on PLAS land, but the majority of PLAS farms receive no assistance from either RECAP or CASP as the latter cannot assist on leased land.
� It seems clear that RECAP targets medium to large-scale farms rather than small-scale agriculture.
4.5.3. EmploymentThe numbers reported by the DRDLR for employment created by RECAP are inconsistent. In one of its most recent publications, End of Term Report 2009-2014, the department states that 5 392 jobs were created through RECAP (2 731 permanent and 2 661 temporary/seasonal)258 from its inception (2010 until the end of December 2013). However, in the pages that follow detailing developments by province, the following information on employment is presented:
255 Cousins, B. 2013. ‘Briefing paper: new policies on land redistribution in South Africa’. Pg. 1 Accessed from: www.plaas.org.za/plaas-publication/2013redistribution-policy-briefingpaper.
256 Ibid, 4.257 Ibid. 258 DRDLR. 2014. ‘End of Term Report 2009-2014’, 15.
Since 2009 policy documents on land reform have been
full of fine-sounding phrases on the
need for ‘agrarian transformation’,
defined as ‘a rapid and fundamental
change in the relations (systems and patterns
of ownership and control) of land,
livestock, cropping and community’,
and the creation of ‘vibrant, equitable
and sustainable rural communities’.

112 The Right to Food in South Africa
Table 26: Jobs created through RECAP 2010 - 2014
Jobs created
Eastern Cape NA
Free State 1 375
Gauteng 347
KwaZulu-Natal 4 493
Limpopo NA
Mpumalanga NA
North West 1 068
Northern Cape 945
Western Cape NA
Total 8 228
(Source: DRDLR 2014)
It is important to question the accuracy of these numbers: how can we reasonably estimate the number of jobs created through the programme?
The DPME’s survey of 98 RECAP farms in six provinces found that 540 jobs had been created (111 full-time and 429 part-time jobs) up to June 2012 – an increase of 53% over previous employment on these farms.259 They found that RECAP added on average 4.51 jobs per project (around 1 full-time and 4 part-time jobs). If we apply this average to the DRDLR’s statement that as of 31 December 2013 1 357 farms had been recapitalised, we get an approximation of 6 120 jobs created (1 357 of which are full-time jobs). This number sits comfortably between 5 392 and 8 228 and will be used for our estimates.
The DPME found that employment creation differed markedly from province to province and in line with the nature of the farming venture. In Limpopo, for example, employment on RECAP farms increased 234% thanks to the programme while in the Free State employment was actually down 1% after recapitalisation. This, according to the report, is due to the emphasis in the Free State on livestock production.
What is clear is that employment is skewed towards part-time or temporary/seasonal work. This is problematic as food security requires stability of access to food. Thus, efforts should be made to increase funding of projects that offer full-time employment.
259 Business Enterprises at University of Pretoria for the DPME, 2013, 63.
What is clear is that employment is
skewed towards part-time or temporary/seasonal work. This is problematic as
food security requires stability of access
to food.

113 Budget analysis: assessing the resource allocations and expenditures of government programmes to address the right to food
Table 27: Employment on RECAP farms (DPME survey, n = 98, 6 provinces)
East
ern
Cape
Free
Sta
te
Gau
teng
KwaZ
ulu-
Nat
al
Lim
popo
Nor
th W
est
Total employment
No. before RECAP 28 102 176 550 35 128
No. after RECAP 75 101 215 849 117 202
Average before RECAP 3.11 4.64 17.6 22.92 2.69 6.4
Average after RECAP 8.33 4.59 21.5 35.38 9 10.1
Change (number) 47 -1 39 299 82 74
% change 167.86 -0.98 22.16 54.36 234.29 57.81
Full-time employment
No. full-time before RECAP 23 98 95 245 31 73
No. full-time after RECAP 35 93 92 280 72 104
Average full-time before RECAP 2.56 4.45 9.5 10.21 2.38 3.65
Average full-time after RECAP 3.89 4.23 9.2 11.67 5.54 5.2
Change (number) 12 -5 -3 35 41 31
% change 52.17 -5.1 -3.15 14.28 132.26 42.47
Part-time employment
No. part-time before RECAP 5 4 81 305 4 55
No. part-time after RECAP 40 8 123 569 45 98
Average part-time before RECAP 0.56 0.18 8.1 12.71 0.31 2.75
Average part-time after RECAP 4.44 0.36 12.3 23.71 3.46 4.9
Change (number) 35 4 42 264 41 43
% change 700 100 51.85 86.56 1025 78.18
(Source: DPME)

114 The Right to Food in South Africa
If we use the number of 6 120 for total employment from 2010 to December 2013 and consider that the DRDLR spent R 2 954 895 179 on RECAP in this period,260 we get an average of R 482 826 spent per job created. If we consider only full-time employment, we get R 2 177 520 per permanent job created.
Furthermore, if we compare this figure to the number of jobs created through DAFF’s Comprehensive Agricultural Support Programme between 2009/10 and 2012/13, we can see that RECAP jobs have been nearly five times more expensive to create261 -- and this is after we inflated the number of jobs created through RECAP beyond DRDLR’s reported numbers.
Table 28: The cost of job creation, CASP and RECAP compared
Total jobs Total expenditureTotal expenditure
per job
CASP (2009/10 - 2012/13) 37 887 R 3 795 526 000 R 100 180
RECAP (2010 – 2014) 6 120 R 2 954 895 179 R 482 826262
(Sources: CASP annual reports, DRDLR 2014, DPME, own calculations)262
The DPME’s report summed up the situation with regard to employment generation through RECAP by saying that, “the number of employment opportunities is too small to justify the amount of RECAP investment. There does not seem to be enough emphasis on job creation as a condition for receiving RECAP assistance on the part of beneficiaries263.
Summary:
� Inaccuracies in the data presented by DRDLR mean that reported RECAP employment numbers are not trustworthy
� RECAP is far more costly than CASP at creating employment
� The vast majority of jobs created through RECAP are temporary or part-time which is not ideal for alleviating food insecurity and improving rural livelihoods.
4.5.4. RECAP: budget analysisFrom the outset it must be stated that it is difficult to analyse the budget for RECAP as the DRDLR does not have a dedicated line item for the programme’s allocation and expenditure. The budget for RECAP is 25% of the budget for land reform as a whole (Programme 5 in the most recent annual reports). While it is easy enough to work out 25% of these totals, it is not clear whether the amounts allocated were spent on the programme or reallocated later to other projects within the land reform programme. In addition, there is no breakdown of expenditure for provinces, so it is difficult to get a sense of how funds are distributed.
The graph on the next page shows that the RECAP budget has declined in real terms (in nominal terms as well) since the 2011/12 financial year. For the purposes of this report, we will assume that expenditure equalled allocation as around 99% of the total allocation for the land reform programme was spent during this period.
260 DRDLR. 2014. ‘End of Term Report 2009-2014’, pg. 15.261 Note that the reporting of employment numbers for CASP is also a bit unreliable – see case study.262 The DPME found that for the period 2010 to June 2012 R588, 284 was spent per job. Thus, this is probably an under-estimate of the actual
cost per job.263 Business Enterprises at University of Pretoria for the DPME. 2013. ‘Implementation Evaluation of the Recapitalisation and Development
Programme (from its inception in 2010 to June 2012)’, pg. xi.
... we can see that RECAP jobs have been nearly five times more
expensive to create.

115 Budget analysis: assessing the resource allocations and expenditures of government programmes to address the right to food
Figure 25: Real RECAP allocation 2010/11 – 2014/15 (2010 Rands – 000s)
R -
R 200,000.00
R 400,000.00
R 600,000.00
R 800,000.00
R 1,000,000.00
2010/11 2011/12 2012/13 2013/14 2014/15R
'000
s
Real RECAP allocation (2012 rands - 000s)
(Source: Annual Reports, own calculations)
If we look at RECAP in relation to DRDLR’s budget as a whole, it is clear that the programme takes up relatively little of the department’s total resources.
Table 29: RECAP expenditure as % of DRDLR total expenditure
Real RECAP expenditure*
(000s)Real DRDLR
expenditure (000s)RECAP exp. as %
DRDLR exp.
2010/11 R 566 673.47 R 8 075 850.34 7.0%
2011/12 R 882 883.37 R 8 636 825.05 10.5%
2012/13 R 839 519.43 R 9 120 245.40 9.4%
2013/14 R 668 762.09 R 9 148 646.03 7.6%
2014/15 R 608 113.04 R 8 528 076.57 7.6%
(*assuming allocation = expenditure. 2012 Rands Source: National Budget 2015, own calculations)
Fortunately, the DPME’s report managed to find numbers for RECAP expenditure by province (excluding land acquisitions). What is clear is that expenditure is quite erratic. This is no doubt due to the nature of the projects financed within the given year. Mpumalanga stands out in 2012/13 as by far the biggest spending province. It is also clear that Gauteng saw a surge in expenditure in 2012/13 and had previously used up little of the RECAP budget.

116 The Right to Food in South Africa
Figure 26: RECAP expenditure by province excluding land acquisitions (000s)
EasternCape
Free State GautengKwaZulu-
NatalLimpopo
Mpumalanga
NorthernCape
North WestWestern
Cape
2009/2010 R 2,463 R 1,636 R 404 R 1,519 R 2,294 R 2,226 R 713 R 1,710 R 4,033
2010/2011 R 17,457 R 52,550 R 8,633 R 46,127 R 54,542 R 21,268 R 8,269 R 23,381 R 22,552
2011/2012 R 16,394 R 28,995 R 2,302 R 31,646 R 20,255 R 37,734 R 15,232 R 107,984 R 1,562
2012/2013 R 77,715 R 80,822 R 50,692 R 53,285 R 66,600 R 152,044 R 31,347 R 85,156 R 22,332
R 0
R 20,000
R 40,000
R 60,000
R 80,000
R 100,000
R 120,000
R 140,000
R 160,000
000s
2009/2010 2010/2011 2011/2012 2012/2013
(Source: DPME)
If we look at the proportion of total expenditure over the period by each province, the North West (19%) and Mpumalanga (18%) were the biggest recipients (2009/10 – 2012/13) while the Western Cape (4%), Northern Cape (5%), and Gauteng (6%) spent the least over the period.
Figure 27: Proportion of RECAP expenditure by province (2009/10 – 2012/13)
0%
5%
10%
15%
20%
% total expenditure (2009/10-2012/13) % of total RECAP projects
(Source: DPME)
If we compare the share each province has of total expenditure to the share they have of RECAP projects, it is clear that funding is not necessarily in proportion to number of projects. Mpumalanga, for example, received 18% of the RECAP budget but only had 14% of all projects. On the other side, Gauteng had 10% of all projects but received 6% of total funds. This hints at the relative size of the projects involved.
Looking at the table below, we see that of the 19 projects in the funding category of over R 10 million, six were in Mpumalanga and four were in the North West while Gauteng, the Northern Cape, and the Western Cape had no projects of that size.

117 Budget analysis: assessing the resource allocations and expenditures of government programmes to address the right to food
Table 30: No. of RECAP projects funded by province & funding category, 2009-2013 (ex-cluding amounts for land acquisition)
Fund
ing
cate
gory
(R)
East
ern
Cape
Free
Sta
te
Gau
teng
KwaZ
ulu-
Nat
al
Lim
popo
Mpu
mal
anga
Nor
ther
n Ca
pe
Nor
th W
est
Wes
tern
Cap
e
Tota
l
% o
f tot
al e
xp
0 14 43 30 24 15 49 13 55 7 250 19.7%
1 - 99 999 37 41 40 31 33 25 27 55 15 304 24.0%
100 000 - 200 000 15 26 20 7 18 20 4 17 5 132 10.4%
>200 000 - 500 000 18 27 9 36 53 18 10 18 5 194 15.3%
>500 000 - 1 000 000 19 3 10 28 33 16 2 11 11 133 10.5%
>1 000 000 - 2 000 000 15 11 11 12 8 19 5 7 6 94 7.4%
> 2 000 000 - 5 000 000 9 19 9 11 12 12 12 23 7 114 9.0%
>5 000 000 - 10 000 000 2 3 1 4 5 7 1 5 1 29 2.3%
> 10 000 000 2 3 0 3 1 6 0 4 0 19 1.5%
Total 131 176 130 156 178 172 74 195 57 1269
(Source: DPME)
Taking a closer look at this information allows us to get a sense of how much is spent on each funding category (i.e. whether RECAP favours fewer, bigger projects or many, smaller projects). The number of projects in the funding category has been multiplied by the mid-point of that category’s range (for example, there are 132 projects that received between R100 000 and R200 000. Thus, we multiply 132 by R 150 000 to get R 19 800 000). For the last category, the number of projects has been multiplied by the minimum (R 10 million). While this is not an exact way of getting the information, we can see that it comes close to estimating the actual spread of expenditure: the total is R1. 15 billion, which is the same as the amount spent in the period 2009/10 – 2012/13, excluding amounts for land acquisitions).
Table 31: Estimate of expenditure per funding category (2009/10 – 2012/13)
Funding category (R) Number of projectsNumber of projects x mid-point of
funding category
1 - 99 999 304 R 15,200,000
100 000 - 200 000 132 R 19,800,000
>200 000 - 500 000 194 R 67,900,000
>500 000 - 1 000 000 133 R 99,750,000
>1 000 000 - 2 000 000 94 R 141,000,000
> 2 000 000 - 5 000 000 114 R 399,000,000
>5 000 000 - 10 000 000 29 R 217,500,000
> 10 000 000 19 R 190,000,000
Total 1019 R 1,150,150,000
(Source: DPME, own calculations)
Taking a closer look at this information allows
us to get a sense of how much is spent on each funding category
(i.e. whether RECAP favours fewer, bigger
projects or many, smaller projects).
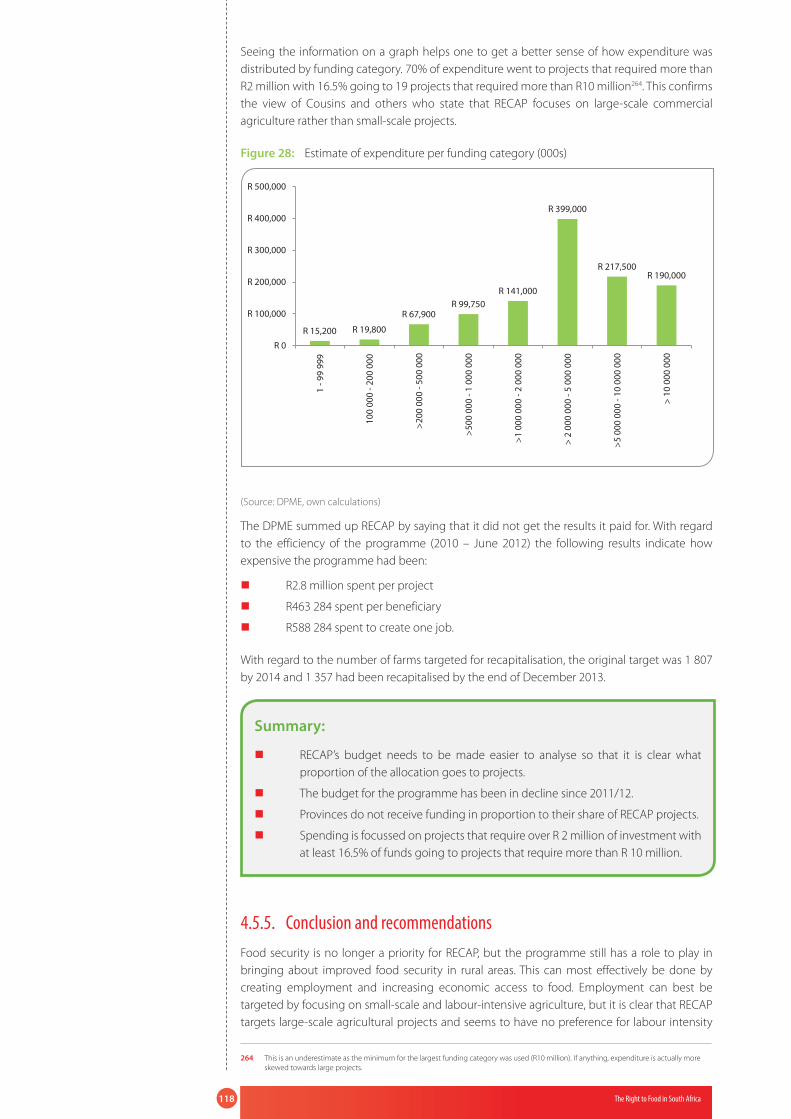
118 The Right to Food in South Africa
Seeing the information on a graph helps one to get a better sense of how expenditure was distributed by funding category. 70% of expenditure went to projects that required more than R2 million with 16.5% going to 19 projects that required more than R10 million264. This confirms the view of Cousins and others who state that RECAP focuses on large-scale commercial agriculture rather than small-scale projects.
Figure 28: Estimate of expenditure per funding category (000s)
R 15,200 R 19,800
R 67,900R 99,750
R 141,000
R 399,000
R 217,500R 190,000
R 0
R 100,000
R 200,000
R 300,000
R 400,000
R 500,000
1 - 9
9 99
9
100
000
- 200
000
>20
0 00
0 - 5
00 0
00
>50
0 00
0 - 1
000
000
>1
000
000
- 2 0
00 0
00
> 2
000
000
- 5
000
000
>5
000
000
- 10
000
000
> 1
0 00
0 00
0
(Source: DPME, own calculations)
The DPME summed up RECAP by saying that it did not get the results it paid for. With regard to the efficiency of the programme (2010 – June 2012) the following results indicate how expensive the programme had been:
� R2.8 million spent per project
� R463 284 spent per beneficiary
� R588 284 spent to create one job.
With regard to the number of farms targeted for recapitalisation, the original target was 1 807 by 2014 and 1 357 had been recapitalised by the end of December 2013.
Summary:
� RECAP’s budget needs to be made easier to analyse so that it is clear what proportion of the allocation goes to projects.
� The budget for the programme has been in decline since 2011/12.
� Provinces do not receive funding in proportion to their share of RECAP projects.
� Spending is focussed on projects that require over R 2 million of investment with at least 16.5% of funds going to projects that require more than R 10 million.
4.5.5. Conclusion and recommendationsFood security is no longer a priority for RECAP, but the programme still has a role to play in bringing about improved food security in rural areas. This can most effectively be done by creating employment and increasing economic access to food. Employment can best be targeted by focusing on small-scale and labour-intensive agriculture, but it is clear that RECAP targets large-scale agricultural projects and seems to have no preference for labour intensity
264 This is an underestimate as the minimum for the largest funding category was used (R10 million). If anything, expenditure is actually more skewed towards large projects.

119 Budget analysis: assessing the resource allocations and expenditures of government programmes to address the right to food
when choosing beneficiaries. The programme has thus not been successful in generating employment in line with its expenditure. In fact, the programme spends nearly five times more to create a job as the Department of Agriculture’s Comprehensive Agricultural Support Programme. The jobs that are created are mostly temporary or part-time (four part-time jobs for every permanent job) which is not ideal for ensuring food security for members of the wider community (less stability of access). Indications are that beneficiaries of the programme tend to be drawn from the middle class and were unlikely to have been food insecure prior to receiving assistance. Overall, the programme does not appear to be pro-poor or aimed at increasing rural employment and food security.
Recommendation 1There seems to be no reason why agricultural support for emerging farmers and land reform beneficiaries should be split between two departments (DAFF and DRDLR) and two programmes (CASP and RECAP, respectively). It is likely that bringing support programmes under one entity would gain from synergies, greater efficiency, and would be less confusing for prospective beneficiaries.
Recommendation 2RECAP needs to shift its focus to supporting small-scale and/or labour-intensive forms of agriculture if it is going to positively influence employment, poverty reduction, and food security in rural areas.
Recommendation 3The selection procedure for beneficiaries needs to be made transparent. Beneficiaries should not be in a position to fund their own projects as was reported in some cases by the DPME’s evaluation. The focus needs to be on uplifting poor farmers.
Recommendation 4Reporting on the budget for RECAP and employment creation need to be improved so that other stakeholders can evaluate the progress of the programme with ease.
4.5.6. RECAP turn-around strategy and new policyDuring the writing of this case study, the RECAP policy was reviewed and public hearings were held (4 February 2015) so that stakeholders could raise their concerns about the programme. After hearing the public’s criticisms, the DRDLR submitted a turnaround strategy to the Portfolio Committee on Rural Development and Land Reform.265 The strategy takes on board the recommendations made by the DPME’s evaluation and admits that the “best and lasting solution would entail a redesign and overhaul of all public agricultural support programmes and doing away with existing silos of funding for agricultural support services. This would entail the establishment of an all-inclusive fund to support land acquisition, extension services and mentorship, agricultural finance and market access.”266 If implemented, this would address our first recommendation above.
The turn-around strategy also states that focus needs to placed on small-holders in Mega Agri-Parks. Furthermore, it acknowledges that the criteria for project selection need to be made clearer and monitoring and evaluation of implementation is important. This turn-around strategy could address many of the criticisms raised in this case study. However, there still seems to be too little emphasis put on job creation through the programme and there were no specifics in the turn-around strategy as to how the programme will improve its ability to create sustainable employment. As this case study has argued, this is the most important aspect with regard to RECAP and food security.
265 DRDLR, 2015. ‘Presentation on the Turn-around Strategy for the Recapitalisation and Development Programme’. Presented 18 February 2015. Available at https://pmg.org.za/committee-meeting/19977/
266 Ibid, slide 3.
During the writing of this case study, the RECAP policy was
reviewed and public hearings were held (4 February 2015)
so that stakeholders could raise their concerns about the programme. After hearing the
public’s criticisms, the DRDLR submitted a turnaround strategy
to the Portfolio Committee on Rural Development and
Land Reform

120 The Right to Food in South Africa
The DRDLR is set to present its new RECAP policy in July 2015 (its third policy in five years). Hopefully the new policy will address how best the programme can create employment and thus help alleviate food insecurity through greater economic access to food.
4.6. Case Study 6: Food for All Programme, by Jared Jeffery
4.6.1. IntroductionThe Food for All Programme (FFAP) was launched by the Department of Social Development (DSD) in December 2011 and was meant to form part of the Zero Hunger Campaign that was led by the Department of Agriculture, Forestry, and Fisheries (DAFF). The Zero Hunger Campaign, based on Brazil’s Fome Zero, has since been discontinued by DAFF and replaced by the Fetsa Tlala Programme., which has far few food security objectives. However, it must be made clear that these developments are not certain. While phone calls to DAFF confirmed informally that Fetsa Tlala replaced the Zero Hunger Campaign, there does not seem to be any official statement on the change in programmes. Phone calls to various offices within the DSD (both provincial and national offices) indicated a surprising lack of knowledge around the Food for All Campaign among DSD staff.267 In fact, not one person seemed to be familiar with the programme. It is unclear how the Food for All Programme and the Zero Hunger Campaign were originally linked. While both initiatives are referred to in the DSD’s 2012/13 annual report, it does not give any detail about how the departments were going to coordinate efforts around the programme. Meanwhile, in the DSD’s 2014/15 Annual Performance Plan the programme is only mentioned once in order to state that the budget for it should increase in the medium term.268
Despite this confusion and lack of information, it seems that the Food For All Programme is envisaged to be a government version of FoodBank South Africa. Indeed, the DSD worked with FoodBank up until 2013 on its operations but has since not assisted the organisation and has begun its own, similar programme. Thus, this initiative can be categorised as a direct food transfer programme using provincial and community distribution centres to get surplus food from the retail sector and food producers to community-based non-profit organisations and needy individuals.
4.6.2. ObjectivesThe stated objectives of the programme are to:
� Ensure access to food for the poor and vulnerable people
� Improve nutrition security of citizens
� Improve food production capacity of households
� Develop market channels through bulk government procurement of food
� Fostering partnerships with relevant stakeholders within the food supply chain269
Targeted groups include:
� Infants within the first 1000 days of life
� Malnourished children under six years of age
� Child-headed households
� Children in drop in centres
� Orphaned children
� Risky pregnant and lactating women
267 Phone calls were made to the national office and provincial offices (Western Cape, Gauteng, Mpumalanga, Northern Cape, and KwaZulu-Natal). The author also visited the Western Cape department but nobody could tell me who to speak to with regard to the programme. Emails to the national office told SPII researchers to contact DAFF for more information.
268 Department of Social Development. 2014. ‘Annual Performance Plan 2014-2015,’ 98. 269 Department of Social Development. 2013. ‘Social Development Zero Hunger Programme’ presentation to the Portfolio Committee on
Social Development. 19 March 2013. PowerPoint presentation. Slide. 9. Available at: www.google.co.za/url?sa=t&rct=j&q=&esrc=s&source=web&cd=2&ved=0CCIQFjAB&url=http%3A%2F%2Fpmg-assets.s3-website-eu-west-1.amazonaws.com%2Fdocs%2F130319zero.ppt&ei=qkf4VJbDFIfZU7bOg7gL&usg=AFQjCNGoOiIzwIM3ou3KGU_ESA13khj-kg&sig2=3k0TrJCtXT8m_0PE1QbeTw.

121 Budget analysis: assessing the resource allocations and expenditures of government programmes to address the right to food
� Primary school children from poor households
� People suffering from chronic diseases of lifestyle or communicable diseases
� At-risk elderly persons
� People with disabilities
� Female-headed households
� HIV/AIDS-infected and affected households270
The criteria for beneficiaries are laid out in the implementation plan for the programme and include:
� Members of the household must be unemployed
� The monthly income of the household (combined income of all members) must be less than R 2 160 per month. In line with SASSA’s means test
� The applicant is not receiving assistance from any other organization
� The breadwinner is deceased and lack insufficient means for food provision
� The applicant acts as a place of safety for children in need of care or food support and has not yet received place of safety allowance.271
The table below shows the targets for the number of people accessing food through the programme. It is clear that the number dropped significantly after the DSD stopped collaborating with FoodBank South Africa in 2013/14 (down around 38%).
Table 32: No. of people accessing food through feeding programmes per year
Number of people accessing food Growth rate
2011/12 377 998
2012/13 555 957 47%
2013/14 346 632 -38%
2014/15 600 000 (estimate) 73%
2015/16 600 000 (estimate) 0%
2016/17 900 000 (estimate) 50%
2017/18 900 000 (estimate) 0%
(Source: DSD 2013)
Operationally, the programme is run through three types of centres from the provincial to the community level. This network includes:
� Provincial Food Distribution Centres (PFDCs): functions include procuring bulk food items, packaging them and distributing them to Community Food Depots. The bulk goods are secured through donations from manufacturers, food processors, and growers. Retailers are asked to deliver food directly to PFDCs if they are not perishable and to Community Food Depots if they are perishable or non-bulk items. PFDCs are only for storage and distribution and cannot be approached by the public for their food needs.
� Community Food Depots (CFDs): these depots receive food from the PFDCs or directly from local food producers/retailers. These will be mainly rural based depending on the prevalence of malnutrition and vulnerability. Non-profit organisations and households can receive food directly from the CFDs. These depots should keep track of the number of households and organisations assisted.
� Community Nutrition and Development Centres (CNDCs): these centres provide a cooked meal to members of the public who don’t have access to food. The centres are also envisaged to have a skills development function so that community members
270 Ibid, slide 10.271 Department of Social Development. 2013. ‘Model for the Implementation of Household Food and Nutrition Security Programme’, 10.
Operationally, the programme is run
through three types of centres from the
provincial to the community level.

122 The Right to Food in South Africa
learn skills to make them self-sufficient in time. There is no charge for the meal offered although the plan states that in time it would be preferable to charge a minimal amount so that individuals feel empowered and have enhanced self-respect.272
The rollout plan envisaged in 2013 is presented in the table below. It is interesting that the Western Cape already had 27 CNDCs established – all the other centres would be new.
Table 33: Rollout of food distribution centres
Cluster Province PFDC CFD CNDCs
Cluster 1 (2013/14)
Free State 1 5 8
Mpumalanga 1 5 8
Northern Cape 1 5 8
Cluster 2 (2014/15)
North West 1 5 8
Limpopo 1 5 8
Eastern Cape 1 5 8
Cluster 3 (2015/16)KwaZulu-Natal 1 5 8
Gauteng 1 5 8
Cluster 4 (2013/14) Western Cape 1 5 27 existing
Total 9 45 91
(Source: DSD 2013)
4.6.3. Food For All Programme: budget analysisHowever, this rollout plan is contradicted by the budget allocation presented later in the implementation plan. In the budget allocation, nine PFDCs are established by 2014/15 whereas in the rollout plan only six are scheduled to have been established. The estimated costs of establishing these centres are R 31 million in the 2013/14 financial year, R 41 million in 2014/15, and R 51 million in 2015/16. These allocations seem incongruent as between 2013/14 and 2014/15 the number of PFDCs and CNDCs was meant to triple but the allocation does not increase accordingly. Meanwhile, in 2015/16 the goal is simply to maintain the established centres yet the cost is R 51 million. No explanation is given for the allocation.
Table 34: Budget allocation for the MTSF273
Outputs 2013/14 deliverables 2014/15 deliverables 2015/16 deliverables
Establishment of PFDCs
Establish 3 PFDCs and 24 CNDCs
Establish 6 additional PFDCs (9 in total) and 72 CNDCs.
Maintenance of 9 PFDCs and 72 CNDCs
Budget R31 million R41 million R51 million
(Source: DSD 2013)
The 2015 National Budget states that the goal of establishing nine PFDCs and 72 CNDCs should be reached in the 2015/16 financial year.274 These centres should service 600 000 people in 2015/16 and this number should increase to 900 000 by 2017/18.275
272 DSD. 2013. ‘Model for the Implementation of Household Food and Nutrition Security Programme’, 10273 Medium Term Strategic Framework.274 National Treasury. 2015. ‘Estimates of National Expenditure 2015’ 295. Available at: www.treasury.gov.za/documents/national%20
budget/2015/ene/FullENE.pdf. 275 Ibid.

123 Budget analysis: assessing the resource allocations and expenditures of government programmes to address the right to food
According to the National Budget, the programme is located within the Social Policy and Integrated Development programme within the DSD and R 17.4 million has been allocated over the medium term to set up an office to oversee the implementation of the FFAP. The actual budget allocation for the programme is difficult to ascertain from the National Budget. Within the Social Policy and Integrated Development programme the Food For All Programme is located within the Community Development sub-programme. This sub-programme accounts for around a quarter of the Social Policy and Integrated Service Delivery budget and has seen its budget allocation increase considerably from R 21.6 million in 2011/12 to R 94.8 million in this fiscal year. However, it is unclear how much of this allocation will be spent on the Food for all Programme. If the budget allocation envisaged in the implementation plan (presented in the table above) is accurate, we can see that the Food For All Programme will receive over half of the budget allocated to the Community Development sub-programme.
Table 35: Social Policy and Integrated Service Delivery expenditure trends
Aud
ited
outc
ome
Adj
uste
d ap
prop
riat
ion
Med
ium
-ter
m
expe
nditu
re
estim
ate
% o
f tot
al
expe
nditu
re
R million
2011
/12
201
2/13
201
3/14
201
4/15
201
5/16
201
6/17
201
7/18
Social Policy Research and Development
3.7 3.7 4.6 5.2 5.2 5.4 5.8 1.50%
Special Projects and Innovation
11.7 9.8 9.3 9.4 8.5 8.8 9.5 2.40%
Population Policy Promotion
24.7 25.4 27.2 28.1 27.3 28 29.3 7.60%
Registration and Monitoring of Non-Profit Organisations
14.3 23.9 24.7 31.1 30.5 32.2 34.1 8.60%
Substance Abuse Advisory Services and Oversight
5.9 3.9 4.3 6.4 6.1 6.3 6.6 1.70%
Community Development
21.6 26.1 58.3 85.4 94.8 98.8 103.2 25.80%
National Development Agency
161.4 166.3 171.7 178.3 184.4 194.2 203.9 51.40%
Programme Management
1.6 1.1 4.2 3 3.1 3.2 3.4 0.90%
Total 244.9 260.3 304.5 346.9 359.8 377 395.8 100%
(Source: National Treasury)
According to the National Budget, the
programme is located within the Social
Policy and Integrated Development
programme within the DSD and R 17.4 million
has been allocated over the medium term to set up an
office to oversee the implementation of
the FFAP.

124 The Right to Food in South Africa
4.6.4. Conclusion and recommendationsThe Food for All Programme has the potential to make an impact on food insecurity in the country and mirror the success of FoodBank South Africa. It is unclear why the DSD and FoodBank no longer collaborate to help vulnerable people.
The department needs to be more forthright about the programme. There is too little information in the public domain and even staff members in the department appear to be in the dark as to its operations. The 2015/16 budget indicates that the allocation for the programme is set to grow and it targets reaching 900 000 individuals with food aid by 2016/17. This is an ambitious target and should make a real impact on food insecurity in affected communities if implemented.
Recommendation 1The DSD needs to make information available so that civil society can monitor the progress of the programme.
Recommendation 2The programme should work in conjunction with similar organisations (like FoodBank) in order to reach as many people as possible. It is clear that the number of people assisted dropped significantly after the collaboration with FoodBank came to an end.

125 The Status of the Right to Food in South Africa: what indicators tell us
The Status of the Right to Food in South Africa: what indicators tell us
As can be seen from the diagram below, chapter 5 presents the final step of this reports monitoring process to track the progressive realisation of the right to sufficient food.
Step 1: Policy Analysis
"The State must take reasonable legislative and other measures"
• Assess the Policy E�ort• Constitutional obligations: reasonableness test• Content of SER policies & legislation and policy - making process• Implementation challenges & accountability mechanisms
Step 2: Budget Analysis
"within available resources"
• Assess Resource Allocation & Expenditure• Generation of government revenue• Allocation & expenditure of resources on SERs• Budget cycle process
Step 3: Indicators"to achieve the progressive
realisation of this right"
• Monitor and Evaluate Attainment of the Right• Access indicators (physical and economic) • Adequacy indicators• Quality indicators
The first two steps of the analysis have taken a close look at the policies and legislation guiding the realisation of SERs, and the allocation and expenditure of resources dedicated to their implementation.
This chapter is based on Step 3: the development of statistical indicators which allow us to assess and track the enjoyment of SERs by rights holders over time. While the previous two steps focus largely on the state’s obligations of conduct (allocating adequate resources, formulating progressive, constitutionally-aligned policy), step 3 measures the state’s obligations of result. It aims to provide an indicative measure of the actual enjoyment of SERs, and therefore of the impact and outcomes of government policies and programmes.
The SER Monitoring Tool has refined a methodology for developing SER indicators. The application of this process to developing indicators for the right to food will be elaborated below, however, the key steps involved may be summarised as:
CHAPTER
5
The first two steps of the analysis have taken a close look at the policies and legislation guiding
the realisation of SERs, and the allocation and expenditure of
resources dedicated to their implementation.

126 The Right to Food in South Africa
Figure 29: The process of developing indicators
Summary of the process of developing indicators
1. Literature review to unpack the normative content of the right – this entails looking at South African and international jurisprudence as well as academic and other literature which deals with the content of the right in question
2. Identify and analyse key reporting formats and indicators that exist for the right – this step aims to draw upon existing reporting formats and indicators that may have been developed by government, international bodies or civil society for evaluating performance and/or the attainment of rights
3. Develop list of conceptual indicators for each right – this is an ‘ideal’ list of indicators that we would like to measure for the right
4. Host initial meeting with sectoral content and rights-specific experts and civil society partners, including relevant committees of the SAHRC where appropriate – this step aims to incorporate the perspectives and experience of as wide a range of stakeholders as possible, both to draw upon their knowledge and to ensure the indicators are accessible and relevant to their needs
5. Identification of potential indicators – at this stage the conceptual indicators identified in step 3 have been refined based on the feedback and insights received from stakeholders
6. Verification of the existence of reliable data sets for each indicator – indicators must be populated with data that is reliable and freely available, ideally on an annual basis, and from a baseline of at least 2002, so that trends can be analysed over time. Data should also be capable of being disaggregated by region, race, gender, age and other sub-sets, where necessary or useful
7. Hosting of subsequent meeting with initial group of sectoral experts to present verified indicators – this allows for further feedback to be incorporated before the indicators are finalised
8. Final set of indicators developed and populated with data
5.1. The process of developing indicators
5.1.1. Unpack the content of the rightThis step was undertaken in Chapter 2 of this paper. Briefly re-stated, the first question to ask when developing human rights indicators is: what to measure? The answer to this can be found through an examination of the content of the right in question. Here we want to know what the constitution and international human rights law provides in terms of the right to food, how these provisions have been interpreted through jurisprudence in foreign and domestic courts, specialist commentary (such as by the United Nations human rights treaty bodies or legal scholars), and by states themselves grappling with the challenge of implementing the right through policy, legislation and other measures.
As Chapter 2 of this paper showed, the Constitution of the Republic of South Africa has four provisions for the right to food, three of which deal with the right to food directly, and one indirectly. From these provisions, the essential content of the right can be established. The first two provisions guarantee the fundamental right of everyone to sufficient food, and of children (aged under 18) to basic nutrition:
� Section 27(1)(b) provides that ‘everyone has the right to have access to sufficient food’. Section 27 also includes rights to health care, water and social security, and is followed by

127 The Status of the Right to Food in South Africa: what indicators tell us
� Section 27(2), which establishes the basic obligation that these rights impose on the state: ‘The state must take reasonable legislative and other measures, within its available resources, to achieve the progressive realisation of each of these rights’.
� Section 28(1)(c) provides that ‘every child has the right to basic nutrition’. Importantly, in terms of obligations on the state, this right is not limited by available resources and must be realised immediately.
The third constitutional provision is section 35(2)(e), which guarantees adequate nutrition to all persons detained by the state. Section 25 deals with property rights in the context of the need for land reform. If access to land for agricultural purposes is considered an element of the right to food, this section is also relevant in setting out what the constitution provides for in ensuring the right to food is realised.
5.1.2. Identify frameworks and indicators that existGenerally speaking, a wide range of indicators have been developed for different purposes including for decision making in emergency situations and local and national policy processes, for project planning, and to provide information for monitoring progress on the achievement of national and international targets such as the Millennium Development Goals (MDGs)276. Juxtaposed with several other indices globally available that use different methods to measure hunger and malnutrition at the national-level, such as the United Nations Food and Agriculture Organization (FAO) index of under-nutrition, the Global Hunger Index developed by the International Food Policy Research Institute, and the Action Aid’s HungerFREE Scorecard - available national data on food insecurity in the country indicates that the South African government needs to develop or accelerate its existing interventions to effectively target and improve the lives of the poor, and in particular those going without food.
All the same, there appears to be renewed interest in and commitment to addressing food security in South Africa, as evidenced by the nutrition programmes that target vulnerable children and pregnant women that feature prominently in the list of interventions to tackle acute poverty277 in the National Development Plan (NDP).278 Also, the Department of Planning, Monitoring and Evaluation’s (DPME) adopted Delivery Agreement for Outcome 7279: A vibrant, equitable and sustainable rural communities and food security for all highlights improved access to affordable and diverse food as an output to be delivered to ensure household food security.280 Significantly, a new policy on food security and nutrition was gazetted in 2014, under the leadership of the Department of Agriculture, Forestry and Fisheries (DAFF) and the Depart of Social Development (DSD). Notably, annual and performance reports of right to food implementing departments such as DAFF, DSD, Department of Rural Development and Land Rural (DRDLR), Department of Basic Education (DBE) and the Department of Health (DoH) were of great value to the indicator research process.
5.1.3. Verify data sourcesThe right to food indicators developed provide a synopsis of available national data sets which contribute to our better understanding of how food security is conceptualised, framed and assessed in the country. However, the various available data sets engage the issue of food security in a way that reflects the survey-specific terms of reference of a given national survey. As such it must be noted that each of the data sets has its own unique methodological approach with varying strengths and weaknesses.281 As a result, the various surveys referenced
276 Interestingly, South Africa’s 2010 MDG country report reveals a glaring information gap with regard to household food and nutrition security data.
277 Acute poverty refers to absolute poverty or destitution, speaking to the deprivation of basic human needs, which commonly includes food, water, sanitation, clothing, shelter and health care. Relative poverty on the other hand is defined contextually as economic inequality in the location or society in which people live
278 The National Development Plan is a plan for the country to eliminate poverty and reduce inequality by 2030 through uniting South Africans, unleashing the energies of its citizens, growing an inclusive economy, building capabilities, enhancing the capability of the state and leaders working together to solve complex problems.
279 The Delivery Agreement requires government departments that provide services for food security to plan strategically for alignment with the delivery agreement. The indicators to measure household food security is based on food-production initiatives supported in rural areas, early warning systems and local storage of food minimising vulnerability, losses and seasonal unavailability, access to nutritious, safe food and supplements and finally access to income to buy food facilitated. See www.dpme.gov.za
280 Department of Monitoring and Evaluation (DPME). 2014. Outcome 7: Vibrant, equitable and sustainable rural communities and food security for all. See www.dpme.gov.za.
281 Labadarios, D., Davids, Y.D., Mchiza, Z. & Weir-Smith, G. 2009. The Assessment of Food Insecurity in South Africa. Centre for Poverty Employment and Growth. Human Sciences Research Council (HSRC), p6. Available at: www.hsrc.ac.za/en/research-outputs/ktree-doc/2602.
The right to food indicators developed
provide a synopsis of available national
data sets which contribute to our
better understanding of how food security
is conceptualised, framed and assessed
in the country.

128 The Right to Food in South Africa
in the development of indicators - the National Food Consumption Surveys (NFCS), Income and Expenditure Survey (IES), National Income Dynamic Survey (NIDS), South African National Health and Nutrition Examination Survey (SANHANES) and Food and Agriculture Organisation (FAO) statistics – sometimes differ in their precise findings. Comparing findings over time thus proved to be a challenge and required caution mainly due to the technical differences and/or similarities of the surveys and their key findings. Noticeably, despite the potential for the better utilisation of existing data sets, a more food security specific national survey would be ideal in addressing most of the shortcomings that have been identified.
Given the multi-dimensional nature of food security, various approaches, tools and indicators are needed to address the different information needs which arise from the various dimensions. These include measures at national level, such as the value of imports over exports for specific food stuffs. Such indicators, however, are a poor predictor of overall food security and therefore household and individual measures are crucial. Examples of these include the Households Food Insecurity Access Scale (HFIAS), the Household Dietary Diversity Score (HDDS) and Anthropometry. A review of the various household surveys from Statistics South Africa (StatsSA) which include food security measures as well as food consumption and nutrition surveys conducted in South Africa has led experts in the field to conclude that no regularised way of monitoring food security in South Africa exists.282 This is not only because different surveys measure different aspects of food security (availability, access, utilisation, and stability) at different levels (national, household, and individual) but these studies have occurred with dissimilar frequency, have different methodologies, samples and sampling techniques, and have logically therefore produced different results.283 This is evident in the table below.
Table 36: Food security data at individual and household level284
QuestionNFCS1999
NFCS2005
SASAS 2008
StatsSAGHS
2012SANHANES-1
2012
Food security (adequate access) 25.0% 19.8% 48.0% 78.5% 45.6%
At risk of hunger 23.0% 27.9% 25.0% 15.0% 28.3%
Experiencing hunger 52.3% 52% 25.9% 6.5% 26.0%
(Source: Stats SA, SANHANES-I, NFCS, SASAS)
The General Household Survey (GHS) has a food module, which was revised in 2009 to reflect the HFIAS and is the main source of data cited by policy makers. The GHS has shown a steady and significant decrease in self-reported incidents of hunger, allowing for claims that the war on food insecurity is being won. As a primary source of data, however, this survey has been widely criticised for measuring only extreme levels of hunger and being based solely on subjective responses of one household informant.285 As a result, despite the GHS being one of the few surveys which is replicated on an annual basis, it is very difficult to draw any conclusions about the overall food security situation in South Africa, and particularly about how it has changed over time.
South Africa carried out a comprehensive nationwide health and nutrition survey in 2013, which provided important information about the knowledge, attitude, and behaviour of South Africans towards non-communicable diseases and nutrition, as well as key information on food security. It revealed that fewer than half of South African households can be considered food secure. Furthermore, in all households, over a third of all children under the age of three experienced moderate to severe growth stunting as a result of under nutrition.286 While this
282 D’Haese, L., Schönfeldt, H., & Karaan, M. 2013. ‘Local studies on household food security – lessons from recent studies using anthropometric and food access measures’, DST and HSRC seminar on “Policy-relevant indicators to monitor household food-security status in South Africa”, Cape Town.
283 Ibid284 Ibid.285 Hendricks, S. L. 2005. ‘The challenges facing empirical estimation of household food (in) security in South Africa.’ Development Southern
Africa, vol. 22, no. 1, pp.103-123; Jacobs, P. 2013. ‘Diversity of food access among low-income households in South Africa – comparative evidence from household surveys’, DST and HSRC seminar on “Policy-relevant indicators to monitor household food-security status in South Africa”, Cape Town.
286 HSRC. SANHANES-1, 2013

129 The Status of the Right to Food in South Africa: what indicators tell us
demonstrates considerable improvement in the food security situation since 1994, it is a step back from 2005, when rates of stunting were lower.287
Given the dependence of so many South Africans on purchasing food, food security has not been stable in South Africa, with spikes in food prices – most recently around 2001 and 2008 – having significant impacts on household food access. The food crisis in 2001 drove the Integrated Food Security Strategy (IFSS), which was launched in 2002, nearly seven years after the World Food Summit, without any clear location in governmental institutions. This points to a general trend whereby the state reacts to food crises, rather than developing a proactive strategy for realising the right to food.
The process of documenting the progressive realisation of the right to food in South Africa into a simple list of quantifiable targets and indicators has led to the conclusion that there is a need to expand the framework for thinking about and interrogating the question of food security in the country. Undoubtedly, the role of SPII’s research on right to food indicators is not necessarily to produce an exhaustive list of comprehensive indicators geared towards the realisation of the right to food, but rather to provide a platform that will arouse debates on matters pertaining to the realisation of a sufficient, nourishing food system for all.
5.2. Right to Food Indicators
5.2.1. Dimensions of SERs: Access, Adequacy, QualitySPII has adapted international best practice in socio-economic rights monitoring to the South African context – evaluating attainment of socio-economic rights using the dimensions of Access, Adequacy and Quality. Drawing from the concept of ‘food security’ which is integral to the realisation of the right to food, when unpacking SPII’s access, adequacy and quality dimensions what must be noted is that issues of availability such as the sufficiency of food supply to meet needs at national, provincial and household level are included under access. The stability criteria is also reflected under access, measuring the stability of food availability and access over time, including in the face of national, local or household level shocks and stressors. On the other hand, utilisation, which encompasses diet diversification, attempts to increase nutritional standards, micronutrient availability, protein quality and food safety and therefore straddles both the adequacy and quality dimensions.
In the context of the right to food, the following apply:
Access indicatorsAn analysis into access to sufficient and nutritious food in South Africa reveals a clear disjuncture between what the Bill of Rights promises and the socio-economic reality of many South Africans. Both economic and physical barriers exist that prevent millions of people from enjoying, in particular, access to food. The SAHRC’s Food Rights Report (1999/2003) established definitions of economic and physical accesses as the following:
Economic access refers to the individual or household’s financial means needed to acquire adequate food, whereas physical access refers to the access that will enable vulnerable groups such as children, the elderly and the disabled to have food. This also includes people with unrelenting medical problems.288
Whilst acknowledging the state’s role in assuring access to food, the SAHRC asserts that, “such access requires the elimination of barriers to food acquisition”.289 It then follows that fulfilling the demand for access requires that the state employ a variety of intervention schemes to ensure that citizens are able to enjoy and exercise their right to food.290 The access indicators that have been developed speak to:
287 World Health Organisation. Food security in South Africa: a review of national surveys, 2011. Available at: www.who.int/bulletin/volumes/89/12/11-089243/en/
288 Ibid.289 Ibid.290 Ibid.
SPII has adapted international best practice in socio-economic rights
monitoring to the South African
context – evaluating attainment of socio-
economic rights using the dimensions of Access, Adequacy
and Quality.

130 The Right to Food in South Africa
� the sufficiency of food supplies to meet needs at national, provincial and household levels
� households’ physical and economic ability to acquire or produce sufficient food
� the stability of food availability and access over time
Adequacy indicatorsAdequacy Indicators look at the dietary needs of an individual, which must be fulfilled not only in terms of quantity but also in terms of nutritious quality of the accessible food. It also includes the importance of taking into account non-nutrient-values attached to food, be they cultural ones or consumer concerns. The adequacy indicators that have been developed speak to:
� Food safety
� Consumer protection
� Nutritional adequacy
Quality indicatorsThe quality indicators that have been developed speak to the prevalence of food insecurity and health and nutritional outcomes - tabling amongst others the prevalence of underweight, overweight, vitamin-A deficiency and iron deficiency in South Africa. In developing quality indicators the research process discovered that the state runs programmes to ensure that food is nutritious and safe. The most important being the DoH’s Integrated Nutrition Programme providing nutritional education and addressing the lack of micronutrients in some foods, and the DBE’s National School Nutrition Programme. Nutritious food refers to the nutritional quality of food – there must be enough food available and accessible with the correct amount and balance of nutrients to enable a person to live a healthy and dignified life.
The indicators must also meet the SMART criteria: that is, be Specific, Measurable, Attainable, Relevant, and Time-framed.
5.2.2. Indicator ‘wish list’As stated above, the right to food indicators developed by SPII rely on mainly national data sets. One challenge in this regard has been that the various available data sets engage the issue of food security in different ways, which reflect the survey-specific terms of reference, while the actual questions asked or assessed can change. Comparing findings over time thus proved to be a challenge, requiring caution and technical guidance. It must be noted that each of the data sets has its own unique methodological approach with varying strengths and weaknesses.291 Even with the potential for the better utilisation of existing data sets, more specific and regular scientific food and nutrition surveys would prove an invaluable tool at understanding and therefore improving the food security situation in the country.
There were also many indicators that we wanted to measure but were unable to due to a lack of data. Ultimately, the indicators for the right to food attempt to include the perspectives of different stakeholders and experts, and are presented in a way which invites comment and deliberation. They should not be seen as prescriptive or the ‘final word’ but be used to deepen understanding of the status of the right to food 20 years into South Africa’s democracy, as well as lead to fresh thinking and deliberation about how to move universal access to sufficient and nutritious food forward.
291 See: Labadarios et al, 2009, 6.

131 The Status of the Right to Food in South Africa: what indicators tell us
5.3. Presentation and analysis of the indicatorsTable 37: Indicators for the Right of Access to Sufficient Food and Basic Nutrition
ACCESS INDCATORS
Availability:
� sufficiency of food supply to meet needs at national, provincial and household level
Access (physical and economic): � households’ physical and economic ability to
acquire or produce sufficient food
Stability (cross-cutting measure): �the stability of food availability and access over
time, including in the face of national, local or household level shocks and stressors
ADEQUACY INDICATORS
Utilisation:
� Food safety and consumer protection
� Prevalence of food insecurity
� Nutritional adequacy
QUALITY INDICATORS
Utilisation:
� Health and nutritional outcomes
NATIONAL MEASURES
Availability1. Per capita food supply2. Per capita value of food production
Stability3. Per capita food supply variability4. Per capita food production variability5. Food trade balance (value of food imports over
exports for primary and processed agricultural products
Economic access: affordability6. Annual food price inflation
HOUSEHOLD MEASURES
Economic access: affordability and vulnerability7. Proportion of total household consumption
expenditure spent on food, bottom 3 income deciles
8. % of population below upper-bound poverty line
Physical access: access to land for food production9. % of households who report land degradation
in their communities or on their or neighbouring farms
10. % of households producing food crops
NATIONAL MEASURES
Physical access: coverage of state nutrition programmes
11. % of children accessing school nutrition programme
12. % of children 6-11 months and 12-60 months receiving vitamin A supplements
NATIONAL MEASURES
Utilisation: food safety13. a) number of imported food
consignments and local food products inspected for food safety standards
13. b) Number of vessels, factories and retail stores inspected for food safety standards
ANTHROPOCENTRIC MEASURES
Utilisation: prevalence of food insecurity14. a) % of population who are
experiencing hunger14. b) % of population who are at risk
of experiencing hunger
Utilisation: nutritional adequacy15. % of population with poor dietary
diversity score (DDS<4)
ANTHROPOCENTRIC MEASURES
Utilisation: health and nutrition outcomes (adults)16. % of underweight male (BMI<20)
and female (BMI<19) adults 17. % of overweight male and female
adults (BMI>25)
Utilisation: health and nutrition outcomes (women)18. % of females of reproductive age
with vitamin A deficiency19. % of females of reproductive age
with iron deficiency (anaemia)
Utilisation: health and nutrition outcomes (children)20. % of stunted / severed stunted
children (under 4)21. % of children wasting / extreme
wasting (under 4)

132 The Right to Food in South Africa
5.3.1. ACCESS INDICATORS
5.3.1.1. Availability
INDICATOR 1: Per capita food supply (kilocalories (kcal)/per capita/per day)
DESCRIPTION: This indicator measures the supply of food in South Africa. It shows how much food (measured in kilocalories) would be available per person/per day if all the food available in the country were shared equally among the population. This is calculated by adding the total quantity of foodstuffs produced for human consumption to the total quantity of foodstuffs imported, minus the total quantity of exported foodstuffs, divided by the total population. The FAO recommends that each person consume a minimum of 1,800 kcal per day.
INDICATOR 2: Per capita value of food production ($USD per annum)
DESCRIPTION: This indicator measures the supply of food in South Africa in terms of the value of the food produced. It is calculated by dividing the total value of annual food production by the total population.
DATA SOURCE: Food and Agriculture Organisation of the United Nations (FAO), 1999-2011.
2,835
2,942
2,910
2,950
3,007
$206
$219
$228
$245$241
200
205
210
215
220
225
230
235
240
245
250
2,800
2,850
2,900
2,950
3,000
3,050
1999 2000 2001 2002 2003 2004 2005 2006 2007 2008 2009 2010 2011
2. P
er c
apita
val
ue o
f foo
d pr
oductio
n ($
USD
/per
ann
um)
)yad/atipac/lack( ylppus doof atipac reP 1
From the onset it must be acknowledged that food insecurity defined in terms of food availability and access will give a different picture about the extent of food insecurity than will a definition based on nutrient intake or actual food consumption.292 South Africa is largely deemed a food ‘secure’ nation, producing enough staple foods or having the capacity to import food if needed in order to meet the basic nutritional requirements of its population, as demonstrated in indicators 1 and 5.293 However, the national supply and value of food hardly reflects the nature of household food security (especially for the poor) within South Africa. The indicators speaking to per capita food supply and per capita value of food show that a disruption to the steady pattern in per capita supply and per capita value in the country began in 2006 whereby the value of per capita food production surpassed that of per capita food supply.
This could be due to the fact that, South Africa, like the rest of the world, felt the impact of the instability of world markets between 2007 and 2009. However, the drop in the per capita value of food production recorded in 2010 may be an indication that the country is not heading back to the price levels seen pre-2006 (when food prices were increasing due to low production of staple foods such as cereals). Although the FAO pegs food insecurity as it relates to per capita food supply at a minimum of 1,800 kcal per day, according to the South African Medical Research Council (SAMRC), an individual is classified to be food insecure if he/she receives less than 2261 kilocalories per day.294 By translating this in economic terms and assuming that food is districuted equally, this represents the recommended daily allowance (RDA) which the country has succesfully achieved over the last two decades. The country has to a large extent
292 Jacobs, P 2009 The status of household food security targets in South Africa. Agrekon Vol 48, No 4, 414.293 Du Toit, D.C. 2011. Food Security. Directorate Economic Services: Production Economics Unit, 14. Available at: www.nda.agric.za/docs/
genreports/foodsecurity.pdf.294 See: www.mrc.ac.za

133 The Status of the Right to Food in South Africa: what indicators tell us
achieved this goal by producing a surplus in most of the agricultural commodities. This means that South Africa is characterised by surpluses and exports amidst food shortages – a situation of “hunger and malnutrition next to the granary”.295
It should be noted that the supply and value of food involves more than merely agricultural production. The food distribution system should also be taken into account, as well as the processing of food products and their movement through the marketing channels, collection, storage and transport.
Notably, a connection exists between indicators 1, 2 and 6: inflation generally reflects unusually large changes in supply and/or demand patterns. However, it must be acknowledged that generally speaking both food supply and food demand respond slowly to changes in prices.296 On the other hand, although this publication has no explicit focus on demand-patterns, according to the FAO the recent global decline in crop yields and the slowing down in the growth rates of world agricultural production, which have raised fears that the world may not be able to grow enough food and other commodities to ensure that future populations are adequately fed, has occurred not because of shortages of land or water but rather because demand for agricultural products has also slowed.297 For the FAO, this is mainly because world population growth rates have been declining since the late 1960s and fairly high levels of food consumption per person are now being reached in many countries, beyond which further rises will be limited.298 Yet, it is also true that a high share of the world’s population remains in poverty and hence lacks the necessary income to translate its needs into effective demand.
5.3.1.2. Stability
INDICATOR 3: Per capita food supply variability (kcal/per capita/day)
DESCRIPTION: This indicator shows how stable the supply of food available to South African’s has been. It shows the average number of kilocalories the daily food supply fluctuated by during the course of each year. A higher number means a less stable food supply.
INDICATOR 4: Per capita food production variability ($USD/per capita/day)
DESCRIPTION: This shows how stable the value of food produced in South Africa has been. It shows the average amount by which the value of food produced fluctuated during each year. A higher number means less stability in the value of food production.
DATA SOURCE: FAO, 1999-2011
16
13
22
19
9
10
17
22
21$15
$13$11
$9 $8
$5
$7
$12 $12
$4
$6
$8
$10
$12
$14
$16
7
9
11
13
15
17
19
21
23
1999 2000 2001 2002 2003 2004 2005 2006 2007 2008 2009 2010 2011
Per c
apita
food
pro
duct
ion
varia
bilit
y ($
USD
/per
cap
ita/d
ay)
ytilibairav ylppus doof atipac reP(k
cal/c
apita
/day
)
As illustrated above, from 2002, per-capita food supply variability in South Africa took a turn for the better. Observing the high levels that were recorded in 2001 (noting that there was a sharp increase from 13(kcal/capita/day) to 22(kcal/capita/day) in one year); the 2002-2005 period was favourable as there was a constant decline in per capita food supply variability to
295 Van Zyl, J & Kirsten, J. 1992. Food Security in South Africa. Agrekon, Vol 31, No 4, 1.296 Polaski, S. 2008. Food prices, poverty, and small-scale farmers: Getting the global trade regime right. Carnegie Endowment for International
Peace. Available at; www.un.org/en/ecosoc/docs/statement08/s_polaski.pdf.297 Food and Agriculture Organization of the United Nations (FAO). 2002. World Agriculture: Towards 2015/2030, Summary Report, 1. Available at:
www.fao.org/docrep/004/y3557e/y3557e03.htm 298 Ibid, 1.
It should be noted that the supply
and value of food involves more than merely agricultural
production. The food distribution system
should also be taken into account, as well as the processing of food products and
their movement through the marketing
channels, collection, storage and transport.

134 The Right to Food in South Africa
an all-time low of 9(kcal/capita/day) for the period under review. However, in 2006 these gains were reversed as that year marked the beginning of another steady rise in per capita food supply variability that ultimately matched the high-levels of 2001 at 22(kcal/capita/day). On the other hand, per capita food production variability appears to have been positive before the economic downturn of 2006, noting the steady decline in per capita food production variability from $15 in 1999 to $5 in 2006. Sadly, in the same way as food supply variability, these gains were reversed post-2006. Consequently both food supply variability and food production variability in South Africa have been less stable following the global recession. Nevertheless, after 2009, there seems to be slight improvements in both supply variability and production variability which could be an indication that the country is on the road to more stability.
Amidst the above, it must also be highlighted that the stability of food in South Africa, generally speaking, varies between urban formal and informal areas and rural areas.299 Urban formal and informal hubs often have well-stocked food retailers, whereas low-income informal settlements and rural areas usually fall outside the parameters of the main food distribution networks. As a result, the food retail environment in these settings consists of small general dealers, spaza300 shops and street vendors, which stock a limited variety of foods.301
INDICATOR 5: Food Trade Balance: value of food imports over exports for primary and processed agricultural products (R’ million, nominal)
DESCRIPTION: This indicator shows trends in the total value and the kinds of foods that South Africa imports and exports. If the value of exported goods is higher than the value of imported goods, this indicates a positive food trade balance. The reverse would indicate a negative food trade balance.
DATA SOURCE: Trade Law Centre (TRALAC), 2002-2013
R 0
R 10
R 20
R 30
R 40
R 50
R 60
R 70
R 80
2002 2003 2004 2005 2006 2007 2008 2009 2010 2011 2012 2013
R' B
illio
n (n
omin
al)
Total Agric. Exports Total Agric. Imports Processed Agric. ImportsPrimary Agric. Exports Processed Agric. Exports Primary Agric. Imports
Over the past two decades, South Africa’s agricultural sector has been extensively liberalised, both in the domestic as well as in foreign markets. This process has been well researched and the results suggest net gains to the sector and to the economy at large, although there have been winners and losers.302 Since 2009, South Africa has experienced a lot of economic uncertainty mainly due to higher imports of fuel and high value added goods while exports have been hurt by several strikes particularly in key mining sectors. Yet, amid the tumult, national food availability indicators reveal that South Africa has at least been meeting the availability needs of its growing population.
The sector as a whole is a net earner of foreign exchange. South Africa is self-sufficient in most major agricultural products and is a net food exporter in an average year. However, cognisance must be taken that the processed food sector is a net importer.303 Significantly, industrial food processing is now the main shaping force of the global food system and a
299 Oxfam. 2014. Hidden Hunger in South Africa: The faces of hunger and malnutrition in a food-secure nation. Oxfam GB, 19.300 In South Africa, the word ‘spaza’ is a colloquial term for a small unofficial store in a township, often based in a private house.301 Loc cit.302 Vink, N., Tregurtha, N., & Kirsten, J. 2002. South Africa’s Changing Agricultural Trade Regime. Trade and Industrial Policy Strategies (TIPS), 1.
Available at: www.tips.org.za/files/562.pdf.303 DAFF, 2011. South African Agricultural Production Strategy: 2011-2025, 10. Available at: www.daff.gov.za/doaDev/doc/IGDP/AGRIC_
PRODUCTION_STRATEGY_FRAMWK.pdf.

135 The Status of the Right to Food in South Africa: what indicators tell us
fundamental determinant of recent changes in diets and related states of health and wellbeing.304 International research shows that ultra-processed products now dominate the food supplies of high-income countries and consumption of these products is rapidly increasing in middle-income countries like South Africa. This is further affirmed by the fact that indicator-11 denotes the value of processed agricultural imports as having been on the rise consistently for the period under review.
Observations on exports reveal that South Africa’s Agriculture Forestry and Fisheries exports decreased by 5% between 2011 and 2012 and imports increased by 4% during the same period. Notably, for the first-time Zimbabwe and China have become the country’s largest export and import partners, respectively. Total agricultural export revenues accounted for about 5% of total export revenue in 2010 at approximately R45 billion, while imports were only 2% at approximately R35 billion. South Africa’s agriculture trade balance post-1994 has been positive although according to the World Wide Fund for Nature’s (WWF) report on agriculture facts and trends in South Africa, the country’s shift from low-value basic food crops to high-value export crops has made the country a net importer of food in terms of volume for the first time.305 While this may be regarded as a negative by those who believe that national food security requires national production to meet demand, elsewhere it has been argued that this is a positive in terms of generating foreign exchange and profits for local farmers.
5.3.1.3. Economic Access: affordability and vulnerability
INDICATOR 6: Annual food price inflation.
DESCRIPTION: This indicator shows how much the price of food has increased each year.
DATA SOURCE: FAO/StatsSA, 2001-2013.
INDICATOR 7: Proportion of total household consumption expenditure spent on food, bottom expenditure decile.
DESCRIPTION: This indicator shows what proportion of expenditure the poorest spend on food.
DATA SOURCE: Income and Expenditure Survey (IES), StatsSA, 2000-2010.
INDICATOR 8: Percentage of the population living in poverty.
DESCRIPTION: This indicator uses the monetary based upper-bound poverty line (R753 per person/month in 2014 prices) to show what percentage of South African’s cannot afford an absolute minimum level of essential goods and foodstuffs.
DATA SOURCE: IES/Living Conditions Survey (LCS), StatsSA, 2006-2011.
49.1%
30.2%28.1%
5.4%
6. Annual food pricein�ation
16.6%
9.9%
3.0%
17.5%
1.5%
7.9% 7.3%
8. % of population below UBPL
57.2% 56.8%
45.5%
0%
10%
20%
30%
40%
50%
60%
2000 2001 2002 2003 2004 2005 2006 2007 2008 2009 2010 2011 2012 2013
7. Proportion of HH consumption expenditure on food, bottom decile
According to the IES there has been a steady decline in the proportion of total household consumption expenditure on food among the poor and the percentage of the population living below the upper-bound poverty line. There are three different types of poverty lines used in Stats SA reporting (as at 2011). These are the food poverty line (R321 a month to buy food),
304 Human Sciences Research Council (HSRC). 2013. Concept Note: Science seminar on indicators for household food security in South Africa, Department of Science and Technology and the HSRC, 1. Available at: www.hsrc.ac.za/en/review/hsrc-review-march-2014/news-roundup#sthash.LkkZUYGJ.dpuf
305 World Wide Fund. Agriculture: Facts & Trends, South Africa , p19. Available at: http://awsassets.wwf.org.za/downloads/facts_brochure_mockup_04_b.pdf.
While this may be regarded as a negative by those who believe
that national food security requires
national production to meet demand,
elsewhere it has been argued that this is a positive in terms of generating foreign
exchange and profits for local farmers.

136 The Right to Food in South Africa
lower-bound poverty line (R433 a month to buy food and clothing), and the upper-bound poverty line (R620 a month to buy food, clothes and provide shelter).306 Using the upper-bound poverty line, the evidence suggests that South Africa has made credible strides in the fight against poverty. The four-million fewer South Africans living in poverty, as measured by the upper-bound poverty line, means that as of 2011 there were 23-million people (45.5% of the population) living in poverty compared to 27-million (57.2%) in 2006.307
While the improvement in the proportion of poor households’ consumption expenditure on food over time is welcome, the number of people being affected by poverty is still unacceptably high. When analysing the distribution of expenditure by income group, the Bureau for Market Research (BMR) at the University of South Africa shows that households in the poorest income group still spend nearly half (47.7%) of their income on food whereas those in the affluent categories spend only 7% of their total income on similar food items.308 This implies that there is little left for other vital expenditure items such as education, health and even savings among poor households whose expenditure on food was 28.1% of total expenditure in 2010, according to the IES.
Moreover, inflation in rural areas is higher than in urban areas. As such, when one looks at the impact of inflation on the rural/urban divide it emerges that inflation hits rural poor households the hardest. This is particularly important in light of the finding in April 2012 by the Food Price Monitor – compiled by the National Agricultural Marketing Council (NAMC) – that rural communities paid R14.89 more than urban consumers for the same food basket— far higher than the R2.37 that was recorded in the previous month.309 Moreover, rural shoppers paid R8.24 more than their urban counterparts for 5kg of maize meal, which was also significantly higher than the price difference in April the previous year (2011).310 While access to income, or a lack thereof, lies at the heart of characterising inequality and poverty in society, poor households’ welfare levels are greatly influenced by fluctuations in the real values of whatever incomes they do have access to.311
When reading the indicator on annual food price inflation it must be emphasised that when looking at the impact of inflation on the poor, one finds that their purchasing power is being eroded because the basket of goods on which the Consumer Price Index (CPI) is based is determined by the middle and upper-classes. Yet, it must be understood that consumer price indices, as with any aggregate, hide a wealth of information irrespective of which method is used to calculate it. The CPI is skewed by South Africa’s extreme levels of inequality. Nonetheless, an understanding of movements in food prices is imperative in terms of understanding developments in a country’s socio-economic and political milieu. In South Africa, erratic, rapid food inflation has been prevalent for little over a decade. According to the Bureau for Food and Agricultural Policy (BFAP) based at the University of Stellenbosch, the “year-on-year food price inflation reached 20% in the last quarter of 2002, driven by a sharp increase in international commodity prices and a significant depreciation in the Rand/USD exchange rate.312” From 2005 to 2008 there was again significant inflation where factors, such as increased bio-fuel production, droughts in key grain-producing regions, and rapid growth in developing countries such as India and China, all contributed to push commodity prices to unprecedented levels. In 2011, local food inflation again approached double digits, with year-on-year inflation in July 2011 reaching 8.9 %. The BFAP further asserts that this increase was driven by “higher international commodity prices, but also by a steep increase in local administrative prices, such as electricity, which increased costs throughout the value chain.313” What is particularly unsettling about these increases, particularly in the last half of 2011 and early 2012, is that rapid food price inflation was observed for maize meal, margarine, coffee, bread and chicken, with maize meal and bread being the two staple products consumed most
306 Business Environment Specialists. 2014. National Minimum Wage: A Complicated Issue. A background paper prepared for Business Unity South Africa, 18. Available at: www.rebosa.co.za/wp-content/uploads/2014/10/National-Minimum-Wage-Background-Paper.pdf.
307 South African Press Association (SAPA). 2014. Poverty on the decline in South Africa. Mail and Guardian newspaper. Available at: http://mg.co.za/article/2014-04-03-four-million-less-in-poverty-in-sa.
308 The Bureau for Market Research, University of South Africa (Unisa). Available at: www.unisa.ac.za/default.asp?Cmd=ViewContent&ContentID=2359.
309 Radebe, H. 2012. Food more expensive in rural areas in SA. BDlive newspaper. Available at: www.bdlive.co.za/articles/2012/05/30/food-more-expensive-in-rural-areas-in-sa.
310 Ibid.311 Bhorat, H. & Oosthuizen, M. 2005. The relative inflation experience of poor urban South African households. Labour Market Frontiers. South
African Reserve Bank. P1. Available at: www.resbank.co.za/Lists/News%20and%20Publications/Attachments/346/Relative%20inflation%20experience%20of%20poor%20urban%20SA%20households.pdf.
312 See: www.bfap.co.za/index.php/focus/consumer-and-retail-analysis/food-prices.313 Ibid.

137 The Status of the Right to Food in South Africa: what indicators tell us
by the poorest households in South Africa.314 As a result, the rapid price increases in these products directly influenced food security in terms of food affordability.
Notably in South Africa, access to basic foods is facilitated by zero-rating Value Added Tax (VAT) on food items such as maize meal, samp, maize-rice, brown bread, and unprocessed fruit and vegetables. Therefore, VAT zero-rating does afford some benefit to low income households, but these benefits have been eroded by a lack of compliance by business and shifts in consumption expenditure (i.e. the VAT zero-rated basket has stayed the same since 1994, while consumption patterns have shifted significantly315). Additional state intervention is required to prevent consumer subsidies from being eroded by increased food prices.
Research conducted by South Africa‘s Competition Commission further suggests that an increase in anti-competitive behaviour negatively impacts food productivity, food availability and affordability within the country. High food prices may therefore not be a function of low levels of production, climate change and profitability alone. Although a credible analysis is yet to be conducted in the country that speaks to pricing and costing structures across the production value chain, in developing indicators on the right to food the research process revealed that there is a need for an in-depth analysis into market costing and pricing structures as they relate to issues of food demand and production levels. The underlying motive being that there are disparities between production levels, food availability, and food affordability.
5.3.1.4. Physical access: access to land for food production
INDICATOR 9: Percentage of households who report land degradation in their communities or on their or neighbouring farms
DESCRIPTION: Land degradation includes over-utilisation of natural resources and soil erosion.
INDICATOR 10: Percentage of households producing food crops
DESCRIPTION: Food crops includes field crops and grains such as maize, wheat, beans, sorghum etc.
DATA SOURCE: General Household Survey (GHS), StatsSA, 2002-2013.
15.5%
17.5%
23.1%
33.9%
11.8%
9.0%
9.8%
9.0%
9.5%
10.0%
10.5%
11.0%
11.5%
12.0%
12.5%
13.0%
10%
15%
20%
25%
30%
35%
2002 2003 2004 2005 2006 2007 2008 2009 2010 2011 2012 2013
% o
f HH
s pr
oduc
ing
food
cro
ps
noitaderged dnal troper ohw s
HH fo
%
Access to land is one of the most socially and politically sensitive issues in Southern Africa. An estimated 28% (13 million) of the South African population is crowded in the former homeland areas (13% of the land), where rights to land are often unclear or contested, and the system of land administration is in disarray. Meanwhile, commercial agricultural areas (82 million hectares; 69% of the land) outside the former homelands remain mostly under white ownership.
In terms of the United Nations Convention to Combat Desertification in Countries Experiencing Serious Drought and/or Desertification (UNCCD), particularly in Africa, to which South Africa is signatory, land degradation is defined as the reduction or loss of biological or economic productivity of agricultural lands, woodlands and forests resulting mainly from human
314 Ibid.315 Watkinson, E. 2003. Overview of the current food security crisis in South Africa. National Labour and Economic Development Institute
(NALEDI), 8. Available at: www.sarpn.org/documents/d0000222/watkinson/Watkinson_SA_food_crisis.pdf.
Notably in South Africa, access to basic
foods is facilitated by zero-rating Value
Added Tax (VAT) on food items such
as maize meal, samp, maize-rice, brown bread, and unprocessed fruit and vegetables.

138 The Right to Food in South Africa
activities.316 Although the true costs of degradation are poorly understood, the effects of land degradation on the economy are considerable. Worryingly, indicator 9 shows a rapid and constant increase in reported land degradation from 2002 to 2013. According to the Department of Environmental Affairs, about 35% of the net agricultural income in the country is overstated because the environmental costs are not currently included in our accounts.317 The department goes further to state that “if the environmental costs of agriculture were internalised, the income from agriculture would be far lower.”318
Demographic and economic factors related to historical land policies and inappropriate land uses imposed on top of vulnerable resources are major contributors to the high levels of land degradation in South Africa, especially in the former homeland areas. Interestingly, both the Johannesburg Plan of Implementation and the Environmental Initiative of the New Partnership for Africa’s Development (NEPAD) emphasise the need for sustainable land management. Key to sustainable land use is the recognition of the cross-cutting nature of the land resource. Nevertheless what we can say about this indicator is that it suggests that trade-offs will be needed between environmental well-being and agricultural expansion and intensification but, given South Africa’s limited agricultural potential and water resources, further expansion may be limited.
The percentage drop of household’s who grew food crops in South Africa between 2002 and 2009 and the subsequent marginal increase by 2013 serves as substantiation to the fact that, though on the decline, it must be understood that agricultural production is still an important sector for the economy in terms of people. A significant portion of the population live in rural areas with significant engagement in agriculture. As such, whether part time or marginal, own small-scale production can be a significant source of food supply for households and markets in both rural and urban areas.319 Own food production is widely practiced; according to the General Household Survey (GHS), nearly a quarter (23%) of all South African households are engaged in food production for own consumption - predominantly (86%) for the purpose of obtaining extra source of food.320 It is also widely acknowledged that while efforts are being made to strengthen agricultural support services, they remain very weak. For instance, the 2011 GHS found only 12.3% of households involved in agriculture reported getting any agricultural-related support from the government during the year preceding the survey.321
5.3.1.5. Physical access: coverage of state nutrition programmes
INDICATOR 11: Percentage of learners accessing national school nutrition programme, by province
DATA SOURCE: Department of Basic Education, 2004-2013
0%
20%
40%
60%
80%
100%
2004 2005 2006 2007 2008 2009 2010 2011 2012 2013
Limpopo
MpumalangaEasternCapeNorth West
Free State
KwaZuluNatalNorthernCapeGauteng
WesternCape
316 UNCCD. 1994. Article 1, UNCCD. United Nations Environment Programme, Geneva. See: www.unccd.int/en/about-the-convention/Pages/Text-Part-I.aspx#art1
317 Ibid, 15.318 Ibid..319 Ibid, 6320 Ibid.321 Statistics South Africa (StatsSA). 2011. General Household Survey (May 2012). Available at: www.statssa.gov.za/publications/p0318/
p0318april2012.pdf.
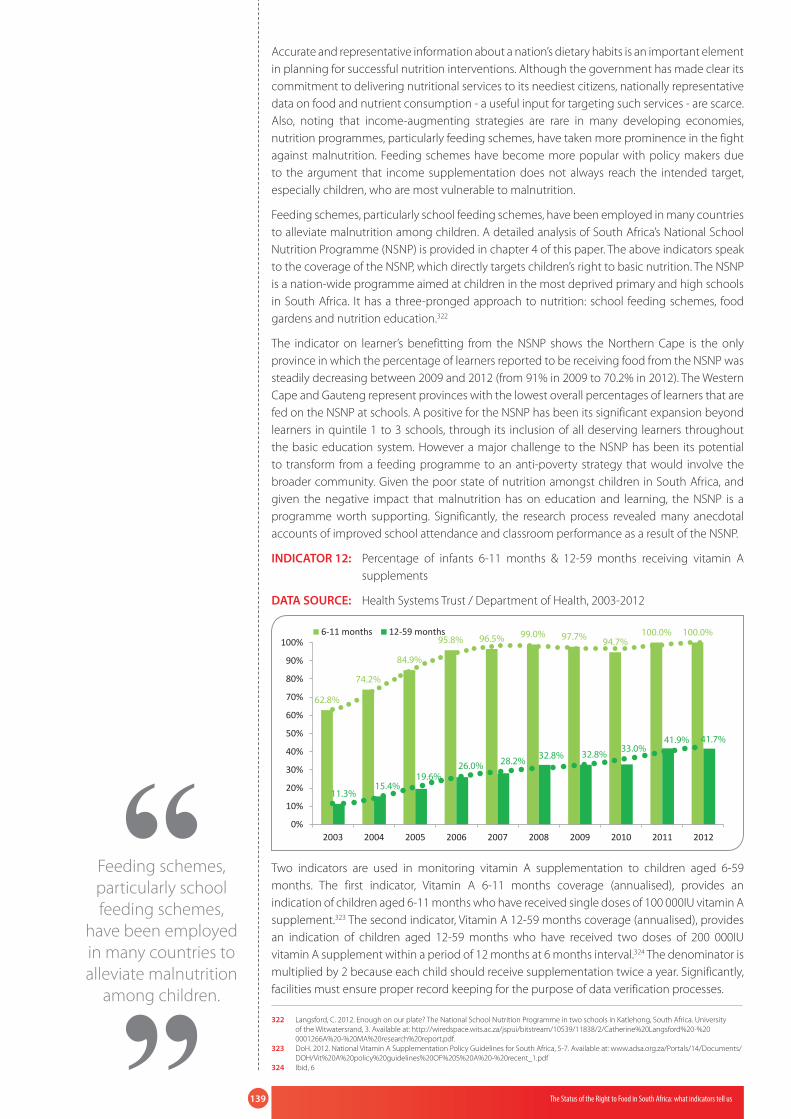
139 The Status of the Right to Food in South Africa: what indicators tell us
Accurate and representative information about a nation’s dietary habits is an important element in planning for successful nutrition interventions. Although the government has made clear its commitment to delivering nutritional services to its neediest citizens, nationally representative data on food and nutrient consumption - a useful input for targeting such services - are scarce. Also, noting that income-augmenting strategies are rare in many developing economies, nutrition programmes, particularly feeding schemes, have taken more prominence in the fight against malnutrition. Feeding schemes have become more popular with policy makers due to the argument that income supplementation does not always reach the intended target, especially children, who are most vulnerable to malnutrition.
Feeding schemes, particularly school feeding schemes, have been employed in many countries to alleviate malnutrition among children. A detailed analysis of South Africa’s National School Nutrition Programme (NSNP) is provided in chapter 4 of this paper. The above indicators speak to the coverage of the NSNP, which directly targets children’s right to basic nutrition. The NSNP is a nation-wide programme aimed at children in the most deprived primary and high schools in South Africa. It has a three-pronged approach to nutrition: school feeding schemes, food gardens and nutrition education.322
The indicator on learner’s benefitting from the NSNP shows the Northern Cape is the only province in which the percentage of learners reported to be receiving food from the NSNP was steadily decreasing between 2009 and 2012 (from 91% in 2009 to 70.2% in 2012). The Western Cape and Gauteng represent provinces with the lowest overall percentages of learners that are fed on the NSNP at schools. A positive for the NSNP has been its significant expansion beyond learners in quintile 1 to 3 schools, through its inclusion of all deserving learners throughout the basic education system. However a major challenge to the NSNP has been its potential to transform from a feeding programme to an anti-poverty strategy that would involve the broader community. Given the poor state of nutrition amongst children in South Africa, and given the negative impact that malnutrition has on education and learning, the NSNP is a programme worth supporting. Significantly, the research process revealed many anecdotal accounts of improved school attendance and classroom performance as a result of the NSNP.
INDICATOR 12: Percentage of infants 6-11 months & 12-59 months receiving vitamin A supplements
DATA SOURCE: Health Systems Trust / Department of Health, 2003-2012
62.8%
74.2%
84.9%
95.8% 96.5% 99.0% 97.7% 94.7%100.0% 100.0%
11.3%15.4%
19.6%26.0% 28.2% 32.8% 32.8% 33.0%
41.9% 41.7%
0%
10%
20%
30%
40%
50%
60%
70%
80%
90%
100%
2003 2004 2005 2006 2007 2008 2009 2010 2011 2012
6-11 months 12-59 months
Two indicators are used in monitoring vitamin A supplementation to children aged 6-59 months. The first indicator, Vitamin A 6-11 months coverage (annualised), provides an indication of children aged 6-11 months who have received single doses of 100 000IU vitamin A supplement.323 The second indicator, Vitamin A 12-59 months coverage (annualised), provides an indication of children aged 12-59 months who have received two doses of 200 000IU vitamin A supplement within a period of 12 months at 6 months interval.324 The denominator is multiplied by 2 because each child should receive supplementation twice a year. Significantly, facilities must ensure proper record keeping for the purpose of data verification processes.
322 Langsford, C. 2012. Enough on our plate? The National School Nutrition Programme in two schools in Katlehong, South Africa. University of the Witwatersrand, 3. Available at: http://wiredspace.wits.ac.za/jspui/bitstream/10539/11838/2/Catherine%20Langsford%20-%200001266A%20-%20MA%20research%20report.pdf.
323 DoH. 2012. National Vitamin A Supplementation Policy Guidelines for South Africa, 5-7. Available at: www.adsa.org.za/Portals/14/Documents/DOH/Vit%20A%20policy%20guidelines%20OF%20S%20A%20-%20recent_1.pdf
324 Ibid, 6
Feeding schemes, particularly school feeding schemes,
have been employed in many countries to alleviate malnutrition
among children.

140 The Right to Food in South Africa
In 2005, the NFCS showed that 9.3% of children aged 1 – 9 years were underweight, 18% were stunted and 4.5% were wasted.325 The NFCS showed that despite implementation of a national vitamin A supplementation programme and mandatory fortification of maize meal and wheat flour, 64% of children aged 1 – 6 years were vitamin A deficient.326 Notably, the vitamin A supplementation programme coverage of children between 6 and 11 months is around 100% nationally as vitamin A has become part of a child’s immunisation programme.327 On the other hand, coverage of children between 12 and 59 months is less impressive. One explanation given by the North-West Annual Report blames mothers for not taking their children to facilities that administer vitamin A supplementation. Provinces, such as the Eastern Cape, have attempted to curb this by reaching out to crèches to have their children covered by the vitamin A supplementation programme. Indicators 20 and 21 provide more information on whether this has been successful.
5.3.2. ADEQUACY INDICATORS
5.3.2.1. Utilisation: food safety
INDICATOR 13a: Number of imported food consignments and local food products inspected for food safety standards
INDICATOR 13b: Number of vessels, factories and retail stores inspected for food safety standards
DATA SOURCE: National Regulator for Compulsory Specifications (NRCS), 2008-2013
11948
22787
17893
15619
19748
331 791 843 722 711
2008/09 2009/10 2010/11 2011/12 2012/1313a. Number of imported food consignments and local food products inspected for food safety standards13b. Number of vessels, factories and retail stores inspected for food safety standards
Accessing data on food inspection in South Africa is a difficult task because there is no one department or organization that is responsible for food safety and quality inspection in South Africa as a whole. After engaging the South African Bureau of Standards (SABS) and DAFF, we could not get any reliable data on food production and distribution establishments. Food inspection is fragmented and no one organization is responsible for food control and inspection as different regulators are responsible for inspecting different food products and food distributing establishments. For example, the National Regulation Council of South Africa (NRCS) regulates and inspects fisheries and canned meat products both for import and export in the country, while DAFF regulates plants production, animal husbandry, abattoirs, restaurants, and so on.
Along with the challenge of finding data on food quality standards, a major concern noted during the development of right to food indicators has to do with the issue of street food vendors – noting that street foods have an important socio-economic role. These foods represent a significant part of food consumption for millions of low-and-middle-income urban consumers, yet there is no regulation or inspection of food quality within this particular sector. Although this is an essential income for many people as well as a source of cheap food for poorer people, poor hygiene, inadequate access to potable water supply and garbage disposal, and unsanitary environmental conditions further exacerbate the public health risks associated with street foods.
325 Hendricks, M. 2009. Op Cit, p46.326 Ibid, 46.327 Ibid.

141 The Status of the Right to Food in South Africa: what indicators tell us
5.3.2.2. Utilisation: prevalence of food insecurity
INDICATOR 14a: Percentage of population who are experiencing hunger
INDICATOR 14b: Percentage of population who are at risk of experiencing hunger
DATA SOURCE: National Food Consumption Survey (NFCS), 1999 & 2005, South African Social Attitudes Survey (SASAS) 2008, South African National Health and Nutrition Examination Survey (SANHANES-1), 2012
52.3% 52.0%
25.9% 26.0%
23.0% 27.9%
25.0% 28.3%
0%
10%
20%
30%
40%
50%
60%
70%
80%
90%
100%
1999 (NFCS) 2005 (NFCS) 2008 (SASAS) 2012 (SANHANES)
14.b % ofpopulation whoare at risk ofexperiencinghunger14.a % ofpopulation whoare experiencinghunger
A decline in agrarian activities, including subsistence agriculture, and growing urbanization have meant that the South Africans overwhelmingly rely on food purchases for their access to food rather than own production. This means that household cash income deficits are a major cause of inadequate access to food.328 In 2012, the South African National Health and Nutrition Examination Survey (SANHANES) found that 45.6% of the population was food secure; juxtaposed with the 1999-NFCS which noted the food secure population at 29.3%. This indicator illustrates that the country has made credible strides in the fight against food insecurity.
Despite large declines in the vulnerability to hunger of South African households over the past two decades, the methodological challenges identified in assessing the country’s food security with certainty must be noted. Recently, there has been a lack of clarity regarding food security and dietary diversity status of the South African population: This is due in part to large temporal differences in data collection on food security obtained by the different surveys. It is difficult to determine whether the higher levels of hunger in 2005 as determined by the NFCS (52%) compared with that of 2008 as determined by the SASAS (25.9%) reflect an improvement in food security or whether other factors, including differences in the sampling methodologies of the relevant surveys, may have influenced the outcomes. Moreover, when one compares the contrasting perspectives on the state of hunger in the country as generated by the General Household Survey329 (GHS) which has not been referenced in this indicator for a number of reasons mentioned above, and the National Food Consumption Survey/s (NFCS), meanings of hunger, and likewise food (in)security, differ. The question arising from this conflicting evidence is: which conceptual and methodological approach might offer the foundation for a meaningful food security baseline?
As noted by Jacobs, hunger and under-nutrition are both outcomes of inadequate food intake, but the meanings need to be clarified.330 Hunger is commonly understood to mean “not eating enough food’, whereas under-nutrition refers to the lack of essential micro-nutrients – like key vitamins, iron and zinc.331” The research process has led to the conclusion that out of all the surveys detailing food in/security in South Africa, the NFCS asks a credible set of questions about hunger. However, given the lack of consistent baseline data on food security, any comparative assessment of current knowledge about household food insecurity must be interpreted with caution. Further research is required to consistently match the conceptual and methodological puzzles evident when carrying out this task.
328 Baleta, H., & Pegram, G. 2014. Water as an input in the food value chain. Understanding the Food Energy Water Nexus. WWF-SA, South Africa, 10. Available at: www.environment.gov.za/sites/default/files/docs/waterasaninputintothefoodvaluechain.pdf.
329 The GHS is an annual household survey specifically designed to measure the living circumstances of South African households. The GHS collects data on education, health and social development, housing, household access to services and facilities, food security, and agriculture.
330 Jacobs, P. 2010. Identifying a Target for Food Security in South Africa. Agrekon Launch. Centre for Poverty Employment & Growth (CPEG), 16. Available at: www.hsrc.ac.za/en/research-outputs/ktree-doc/1646.
331 Ibid, 16-17.
A decline in agrarian activities, including
subsistence agriculture, and
growing urbanization have meant that South Africans
overwhelmingly rely on food purchases for their access to
food, rather than own production.

142 The Right to Food in South Africa
5.3.2.3. Utilisation: nutritional adequacy
INDICATOR 15: Percentage of population with poor dietary diversity score (DDS<4)
DATA SOURCE: NFCS 2005 & SANHANES 2012.
0%
10%
20%
30%
40%
50%
60%
70%
yrateid roop htiw noitalupop fo
%)4<S
DD( erocs ytisrevid
2005
2012
Generally speaking, South Africans do not have sufficient variety in their diet. This has been shown by the high prevalence of certain micronutrient deficiencies in the population. Confidently determining dietary diversity (DDS) in South African adults has not been possible to date since there are no national dietary data on adolescents or adults. Also, for the poor in particular, access to a variety of foods will remain a struggle unless issues of ‘access’ are addressed. Likewise, it needs to be realised that including more variety in the diet will in all likelihood increase the cost. Nationally, as shown by the NFCS and the SANHANES, there are significant provincial differences when it comes to DDS. The three provinces with the highest prevalence of poor dietary diversity (DDS <4) pegged above 50% were the Eastern Cape at 59.6% in 2005, although the province has since gained ground on its dismal showing by recording a 17.5% reduction by 2012. On the other hand, the Limpopo province has gone from bad to worse having regressed with the recorded DDS<4 in 2005 at 61.8% and 65.6% 2012. A further cause for concern is the major setback that took place in the North West province during the period under review – from 44.1% in 2005 to 61.3% in 2012. The fact that in the present study we did not try to evaluate nutrition security and hence do not know whether other factors like access to health care and safe water are adequate – future studies explicitly looking at nutrition security as it relates to food security may paint a different picture from the one presented above. Achieving nutrition security requires policies, strategies and plans to include specific nutrition considerations.
5.3.3. QUALITY INDICATORS
5.3.3.1. Utilisation: health and nutrition outcomes (adults)
INDICATOR 16: Percentage of underweight male and female adults (BMI<18.5)
INDICATOR 17: Percentage of overweight male and female adults (BMI>25)
DESCRIPTION: Body Mass Index (BMI) is a simple method to assess how much an individual’s body weight departs from what is normal or desirable for a person of his or her height.
DATA SOURCE: NFCS 2005, National Income Dynamics Survey (NIDS) 2008, and SANHANES 2012.

143 The Status of the Right to Food in South Africa: what indicators tell us
26.6% 26.3%24.8%
5.7%4.6% 4.2%
13.1%12.1% 12.8%
19.9% 20.2% 20.1%
0%
5%
10%
15%
20%
25%
30%
1998 (DHS) 2008 (NIDS) 2012 (SANHANES)
17. % of overweight females (BMI>25) 16. % of underweight females (BMI<18.5)
16. % of underweight males (BMI<18.5) 17. % of overweight males (BMI>25)
South Africa reflects the global trend of widespread overweight and obesity in adults. Individuals with a BMI above 25 kg/m2 are classified as being overweight, and those with a BMI above 30 kg/m2 as obese. In South Africa, overweightness is increasing for men, while there has been a slight decrease for women since 1998, the figure remains high at almost a quarter of all women. The 2012 SANHANES found that levels of underweight are generally higher for males than females (12.8% versus 4.2%) and levels of overweight are higher amongst females (20.1% versus 24.8%). These sex differences in underweight and overweight hold almost all categories of age, education and location.
5.3.3.2. Utilisation: health and nutrition outcomes (women)
INDICATOR 18: Percentage of females of reproductive age with vitamin A deficiency
INDICATOR 19: Percentage of females of reproductive age with iron deficiency (anaemia)
DATA SOURCE: NFCS 2005 and SANHANES 2012
25.9%
13.3%10.5%
9.7%
0%
5%
10%
15%
20%
25%
2005 (NFCS) 2012 (SANHANES)
17. % offemales ofreproductiveage withvitamin Adeficiency
18. % offemales ofreproductiveage with irondeficiency(anaemia)
According to scholars, the most common nutrient deficiency in South Africa is vitamin A, a nutrient that is needed for maintaining vision and eye health, healthy embryonic development and the maintenance of the immune system, which is critical for resistance against disease.332 South Africa, like many other countries, has adopted multiple strategic approaches to prevent vitamin A deficiency, namely: food fortification, vitamin A supplementation and dietary diversification. The Lancet series lists vitamin A supplementation among the key interventions achievable at a large scale that have proven to reduce the number of preventable deaths each year, particularly for children.333 Maternal vitamin A deficiency is increasingly being recognised as a major public health problem in many developing countries, but its consequences have so far been assumed to be mainly related to infant health status, morbidity, and mortality. Credible
332 Ottermann, B. 2013. South Africa’s Hidden Hunger. Health24 Newspaper, p1. Available at: www.health24.com/Diet-and-nutrition/Nutrition-basics/South-Africas-hidden-hunger-20130411.
333 Department of Health. 2012. Op Cit, 5.
South Africa reflects the global trend of widespread
overweight and obesity in adults.

144 The Right to Food in South Africa
investigation into the consequences of vitamin A deficiency on maternal health and survival is yet to take place in South Africa. However, the country has gained success in reducing the prevalence of the number of females of reproductive age with vitamin A deficiency – a significant 12.6% decrease between 2005 and 2012. The Department of Health should be commended for the success of its efforts thus far in this regard.
Anaemia is considered to be an indicator of poor nutrition and poor health, and it is a marker of socio-economic disadvantage in many settings. Iron deficiency is thought to be responsible for at least 50% of all anaemia cases reported in South Africa.334 In 2012, the SANHANES reported updated national anaemia and iron status data that paint a similar picture when compared to data from the 2005 NFCS. The SANHANES noted a slight reduction in iron deficiency anaemia in females of reproductive age at 9.7% - having improved by 0.8% from 2005 estimates - classifying it as of moderate public health importance.
5.3.3.3. Utilisation: health and nutrition outcomes (children)
INDICATOR 20: Percentage of children under 4 years with stunting and severe stunting
DESCRIPTION: Stunting, or low height for age, is caused by long-term insufficient nutrient intake & frequent infections, and affects many aspects of physical and cognitive development
INDICATOR 21: Percentage of children under 4 years wasting or extreme wasting
DESCRIPTION: Wasting, or low weight for height, is a strong predictor of mortality among children.
DATA SOURCE: NFCS 1999 & 2005 and SANHANES 2012
21.6%23.4%
26.5%
6.5% 6.4%
9.5%10.3%
5.1%2.2%1.4% 0.9%
1.1%0%
5%
10%
15%
20%
25%
30%
1999 (NFCS) 2005 (NFCS) 2012 (SANHANES)
20.Stunting(under 4)
20.Severestunting(under 4)21.Wasting(under 4)
21.Severewasting(under 4)
Child malnutrition is a major contributor to child morbidity and mortality in South Africa and the country is yet to make credible strides in combating this issue. Indicators for assessing wasting and stunting levels in the country provide a mixed-bag of results. The SANHANES study of 2012 recorded 2.2% of children aged below four as underweight – a major improvement from the 10.3% that was documented in the 1999 NFCS. While there have been major improvements in the percentage of children with low weight for height, there has been a significant increase in the number of children who are stunted in South Africa. 9.5% of children under the age of four were classified as severely stunted and 26.5% were affected by stunting in the 2012 SANHANES. Juxtaposed with the 6.5% recorded for children affected by extreme stunting and the 21.6% for those affected by stunting in the 1999 NFCS – South Africa is losing the war on stunting. Coupled with the fact that a secondary analysis of the 1999 NFCS data found that 17% of 1 – 9-year-old children were overweight and obese335, it becomes evident that South Africa’s children are affected by a double burden of under- and over-nutrition.
Stunting indicators suggest that malnutrition in South Africa has been worsening over time. Notably, the 2005 NFCS revealed that one out of every five children aged 1-9 years is
334 Visser, J. 2013. ‘Anaemia in South Africa: the past, the present and the future’ Guest editorial, SA Journal on Clinical Nutrition 26(4), 166. Available at: http://sajcn.co.za/index.php/SAJCN/article/viewFile/839/1094.
335 Hendricks, M. 2009. Op Cit, p1

145 The Status of the Right to Food in South Africa: what indicators tell us
stunted. This is only marginally better than the 1999 survey findings.336 Interestingly, the Integrated Food Security Strategy (IFSS) that was adopted by government in 2002 concludes that ‘compared to international ranges, protein energy malnutrition, as measured by stunting levels, is a moderate public health problem in South Africa.337’ Such view-points from government are worrying due to the fact that the evidence of high levels of stunting is particularly serious since it reflects chronic malnutrition resulting from systemic and structural conditions – and has long-term consequences for affected individuals. It must be acknowledged that malnutrition is a developmental challenge relevant to a broad set of economic and social policies, not just individually focused assistance.
336 Altman, M., Hart, T & Jacobs, P. Household food security status in South Africa. Agrekon Vol 48, No 4, 351. Available at: http://ageconsearch.umn.edu/bitstream/58211/2/1.%20Altman,%20Hart%20&%20Jacobs.pdf.
337 Department of Agriculture, Forestry and Fisheries. 2002. The Integrated Food Security Strategy for South Africa, 23. Available at: www.nda.agric.za/doaDev/sideMenu/foodSecurity/policies.pdf.
Such view-points from government are worrying due to the
fact that the evidence of high levels of
stunting is particularly serious since it reflects chronic malnutrition
resulting from systemic and structural
conditions – and has long-term consequences for affected individuals.

146 The Right to Food in South Africa
Ensuring the progressive realisation of the right to food in South Africa: report recommendations based on findings
The process of building a more just society implies a transformation of the existing unequal social and economic order, with a view to achieving a situation in which the dignity of people is guaranteed, their wellbeing cared for, and where everyone’s capabilities can flourish. The inclusion of socio-economic rights in South Africa’s post-apartheid Constitution recognised the fundamental interdependency between all rights and freedoms. As Nelson Mandela said at the ANC Bill of Rights Conference in 1991, ‘We do not want freedom without bread, nor do we want bread without freedom.’ 338 Consequently, ensuring that ‘everyone has the right to have access to sufficient food’ and all children have ‘the right to basic nutrition’ as the Constitution requires, is not a political option that government can choose to implement or ignore. Yet, despite making progress in many socio-economic areas, in the third decade of democracy, after five successful democratic elections, nationally representative data sets find that 1 in 4 South African’s continue to go hungry.
This report has taken the constitutionally enshrined rights to sufficient food and basic nutrition as its starting point. Chapter 2 provided, for the first time, a substantive discussion on the content and meaning of the right to food in South Africa. Drawing upon international and regional human rights law in addition to the Constitution and relevant jurisprudence, chapter 2 set out the fundamental obligations the state has towards rights-holders, including in respect of policies and programmes, resource allocation and expenditures and monitoring implementation and ensuring accountability. Chapter 3 introduced Step 1 of SPII’s SER Monitoring Tool: an analysis of government’s policy effort in light of the obligations identified in chapter 2. Chapter 4 implemented Step 2 of the Tool by undertaking a budget analysis of government programmes to address the right to food. Step 3: the development and assessment of indicators to monitor the enjoyment of the right to food, was presented in chapter 5. By bringing together the major findings of our 3-Step analysis, this final chapter 6 provides several recommendations based on those findings.339 These recommendations are followed by a discussion on how government, civil society, the private sector and all interested and affected citizens may begin to forge new paths towards the universal fulfilment and enjoyment of the right to food in South Africa.
6.1. STEP 1: Policy recommendations1. Begin a participatory process of drafting framework legislation for the right
to food. The right to food remains the only constitutional right not legislated for in South Africa. As a result, coordination on right to food programmes is extremely weak, accountability for delivery on this right largely non-existent, and remedies for rights-holders who would wish to claim a violation of their right are not available. A legal framework to institutionalise the obligations on the state to realise the right to food that can ensure accountability for delivery needs to be developed and translated into appropriate policy and implementable programmes.
2. Shift the discourse on the right to food away from a narrow production and rural development paradigm and into a broader paradigm which acknowledges the inequality, exclusion and inadequacy in the food system, and the fundamental issue of poor economic access to sufficient, nutritious food. Such a vision must include both the national, household and individual nature of food insecurity.
3. Increased political will at the highest levels with a strong, funded organisational mandate to drive work towards greater food security. A right to food unit within the
338 N.R Mandela ‘Address: On the occasion of the ANC’s Bill of Rights conference’ in A Bill of Rights for a Democratic South Africa: Papers and Report of a Conference Convened by the ANC Constitutional Committee, May 1991 (1991) 9 – 14 at 12.
339 Policy and programme specific recommendations are also provided at the end of each chapter throughout the paper.
CHAPTER
6

147 Ensuring the progressive realisation of the right to food in South Africa: report recommendations based on findings
Presidency, coordinated at a Ministerial level, could provide this role (as mentioned in the National Food and Nutrition Security Policy). Such high-level organisation is required to ensure that the effective coordination necessary for the successful implementation of right to food programmes is achieved.
4. Greater civil society participation in the drawing up of the new food security strategy and implementation plan. Civil society’s voice around realising the right to food and nutrition needs to be linked to broader struggles and discussions around what constitutes a decent living level in South Africa. This will then automatically link food security to education, health and social grants and widen the scope for interventions that go beyond agriculture.
5. Reliable and regular data on household food and nutrition security is critical to monitor and evaluate interventions. Investment in a monitoring system with measurement tools which generate indicators for the multiple dimensions of food security must be a priority.
Recommendations pertaining to childrenTo address children’s right to basic nutrition more fully, the NSNP needs to be part of a more comprehensive nutrition programme that covers all children in need. The state has the duty to prevent hunger and combat malnutrition. It also has an obligation to adopt programmes for the supplementary feeding of malnourished children. In this regard, children who are particularly vulnerable (such as street children, children with disabilities, child-headed households, refugee children and those who have been displaced) may need special measures. To improve child nutrition, there must be adequate household food security, a healthy environment and control of infections and adequate maternal and child care.340 The state should also be able to monitor the nutritional needs of children and identify causes of malnutrition and the means of dealing with them. In particular, the state should implement measures that seek to eliminate diseases caused by nutrient deficiencies.
The health and nutritional well-being of an infant may be impaired well before its birth. The child of a malnourished or under-fed pregnant mother may inherit physical and mental deficiencies caused by insufficient nutrition that may not be easy to cure or that may impede the child’s proper development. Thus, to ensure the well-being of children and their potential to develop optimally, attention needs to be paid to pre-natal care. It is therefore important to ensure that adequate food is provided to women during pregnancy and lactation.
6.2. STEP 2: Programme and budget recommendations
6.2.1. Budget recommendationsAllocations and expenditures on the right to food should be accounted for within the national and provincial budgets, and within right to food implementing departments reports, so that assessments can be made as to the extent and impact of the resources dedicated to fulfilling this right. There should also be a chapter in the budget review dedicated to the right to food.
6.2.2. National School Nutrition Programme1. Review the effectiveness of the quintile system in supporting all food insecure learners.
2. Assess provisioning on the right to basic nutrition for learners in quintile 4 and 5 schools (related to Recommendation 1).
340 Gillespie, S. & Mason, J. 1991. Nutrition Relevant-Actions: Some Experiences from the Eighties and Lessons for the Nineties. Administrative Committee on Coordination – Subcommittee on Nutrition. United Nations. Nutrition Policy Discussion Paper No. 10, Available at: www.unsystem.org/scn/archives/npp10/begin.htm#Contents.
The health and nutritional well-being
of an infant may be impaired well before
its birth.

148 The Right to Food in South Africa
3. Establish rigorous provincial and district monitoring systems for tracking expenditure and programme implementation.
4. Treasury and the DBE must set corrective and/or punitive measures for departments that consistently underspend and/or spend irregularly on their NSNP conditional grant allocation
5. The South African government must bolster inter-departmental collaboration for sustainable food production to support the NSNP.
6. The DBE should administer rigorous statistical data collection relating to NSNP indicators to inform planning and budgeting
6.2.3. The Vitamin A Supplementation Programme:1. National and Provincial departments should make disaggregated information
publically accessible. Provincial departments should be transparent about the budgets they allocate to specific items within sub-programmes and should not stop disaggregating information at the sub-programme level.
2. The VAS programme for children between 12 and 59 months should be integrated with other programmes, or made part of the Road to Health Care chart for each child. After their vaccines schedules are complete, parents should be reminded and encouraged to bring 12 – 59 month olds to the clinic twice a year for their Vitamin A supplements.
3. The raw data at facility level that is fed into the District Information Health System needs to be standardised so that the quality of and access to the information can be improved.
6.2.4. Comprehensive Agricultural Support Programme:1. Join CASP, RECAP, and Fetsa Tlala into one comprehensive programme for
agricultural support.
2. An increase in government support for agriculture in line with the sector’s contribution to employment and GDP – and in line with other developing and developed countries.
3. Focus on labour-intensive projects for funding.
4. Seek to create more permanent employment to ensure greater stability of incomes and food security.
5. Increase the number of women and youth benefitting from programmes so that equity is met in this regard.
6. The focus on subsistence agriculture needs to be on more projects rather than fewer, bigger projects.
7. Ensure that incentives of department bureaucrats are aligned with food security and the elimination of poverty.
6.2.5. Fetsa Tlala:1. Fetsa Tlala should be reorganised so that it targets access to food rather
than production.
2. There need to be targets with regard to job creation so as to improve economic access to food.
3. Labour-intensive agriculture or smallholder and subsistence farmers should be the focus of the programme.
4. The biggest recommendation to draw from this case study is that food security needs to be the responsibility of a dedicated office (in the office of the Presidency/

149 Ensuring the progressive realisation of the right to food in South Africa: report recommendations based on findings
Vice Presidency, for example, as proposed in government’s new National Food and Nutrition Security Policy or the creation of a Special Rapporteur for Food Security as was done in Brazil) that is not affiliated/dependent on another department and has the authority to coordinate efforts around food security.
6.2.6. RECAP1. RECAP and CASP should be made into a single comprehensive agricultural sup-
port programme.
2. RECAP needs to shift its focus to supporting small-scale and/or labour-intensive forms of agriculture if it is going to positively influence employment, poverty reduction, and food security in rural areas.
3. The selection procedure for beneficiaries needs to be made transparent. Beneficiaries should not be in a position to fund their own projects as was reported in some cases by the DPME’s evaluation. Focus needs to be on uplifting poor farmers.
4. Reporting on the budget for RECAP and employment creation need to be improved so that other stakeholders can evaluate the progress of the programme with ease.
6.2.7. Food for All Campaign1. The Department of Social Development needs to make information available so
that civil society can monitor the progress of the programme.
2. The programme should work in conjunction with similar non-governmental organisations (e.g. FoodBank) in order to reach as many people as possible. It is clear that the number of people assisted dropped significantly after the collaboration came to an end.
6.2.8. National Treasury and VAT Zero Rating1. VAT zero-rating for basic foods acknowledges the important fact that food security is
largely an issue of economic access. More needs to be done to study the effects of VAT zero-rating and how the effects can be better targeted to assist the poor.
6.2.9. NAMC and Food Price Monitoring1. There is a need for an in-depth analysis into market costing and pricing structures as
they relate to issues of food demand and production levels.
Since food subsidies and food price stabilisation systems have come under increasing criticism over the years, due mainly to the regressive nature of food financial support programmes (higher-income persons buy more food and gain more than do those with a low income, who are more vulnerable). As such, noting that food-pricing strategies in South Africa are consumer-oriented, the challenge facing the country is how to design well-targeted food policies, such as food subsidy and food price stabilisation programmes aimed at addressing social concerns related to high, volatile food prices. Evidently, unrealistic pricing currently limits access to food for poor households. For example, why didn’t consumer prices respond to 2008 declines in commodity prices? Explicitly, the government needs to start linking annual wage and social grant increases to the CPI-Food and raising the CPI-Food component in the CPI to better reflect the high proportion of food expenditures in the total expenditure of poor households.
The eradication of food insecurity in South Africa requires, in the long term, increasing the actual earnings of households so that they can be able to buy enough food whatever the immediate situation. Fair and unified implementation of the above could serve to reduce food insecurity in South Africa substantially.
government needs to start linking annual
wage and social grant increases to the
CPI-Food

150 The Right to Food in South Africa
6.3. STEP 3: Indicators – recommendations to improve the monitoring of the progressive realisation of the right to food
6.3.1. The process of developing indicators: key learningsThe combined processes of rapid urbanisation, concentration of ownership of food production resources and distribution, and the globalisation of the food trade have resulted in rapid changes in the South African food environment. The findings stemming from the process of developing indicators on the right to food synthesise and in essence reflect conclusions of the available data which speaks to the state of food security in the country, and indicates that the South African government is faced with a serious challenge to provide a clear definition of appropriate measurement tools for assessing the prevalence of, and thus tackling, food insecurity. Such tools are absolutely necessary if effective policies and programmes are to be designed to fulfil the right to food. It is encouraging to see that thinking around this has begun within the Department of Planning, Monitoring and Evaluation (DPME) and the South African Vulnerability Assessment Committee (SAVAC), which is housed within the Department of Agriculture, Forestry and Fisheries (DAFF). However, improving and monitoring food and nutrition security requires many elements. Firstly, a clear and universally agreed upon definition of food security and the right to food must be identified, ideally through a participatory process that includes the voices of those most affected by food insecurity. Secondly, a sound conceptual and theoretical framework to guide the choice of right to food indicators is also required. It must be admitted that the last food crisis occurred at a time of high productivity.341 This highlights the importance of a broad set of indicators and emphasises the need for more refined indicators that speak to sustainable and equity-oriented access to sufficient food and basic nutrition, as the constitution requires. The presence of effective, accessible and reliable safety nets, micronutrient interventions, corporate food reserves and institutional regulation are all important drivers of food security to keep track of, but the nature of recent food insecurity calls for an enhanced focus particularly on the role of markets, especially in terms of their short term impacts. This is presently lacking in the existing available data and indicators reviewed and presented in this publication.
6.3.2. Monitoring and evaluating the progressive realisation of the right to food
Methodologically, in South Africa there are no specific and accepted indicators of food security and there are no regularised ways of monitoring it. These gaps restrict the ability of human rights defenders and policy makers to address food insecurity. Practitioners are therefore constrained in their ability to identify interventions appropriate to different situations and needs. These challenges are also further exacerbated by weak links between government, the private sector and civil society. Although this publication provides an incomplete picture, it yields some interesting observations about the monitoring and evaluation of food insecurity in South Africa.
The scale of the measured food insecurity (and poverty) problem is so large that there is on-going disagreement about the extent to which food insecure households should be targeted with support programmes as opposed to using macro-economic price controls or general consumer subsidies.342 Overall, when it comes to food security analysis in the country it must be noted that only a few of the required-indicators have been monitored consistently over time. The realisation of the right to sufficient food is a multi-pronged challenge that demands engagement with various issues that include amongst others: social security, land reform and rural development, micro-credit programmes, access to safe water, transfer of agricultural technology to small farmers, income generation programmes for the urban poor, food security status for displaced populations (such as non-nationals and migrants), community-based
341 Erlanger, Steve. 2008. U.N. Panel Urges Changes to Feed Poor While Saving Environment. New York Times newspaper. Available at: www.nytimes.com/2008/04/16/world/europe/16food.html?_r=0.
342 Watkinson, E. Op Cit, 1.

151 Ensuring the progressive realisation of the right to food in South Africa: report recommendations based on findings
health care, targeted food price subsidies, and so forth. Nonetheless, this publication has concluded on a broad set of 21 indicators that cover as many of these themes as possible, in-light of available data constraints.
While providing a broad picture of food security and governments efforts to progressively realise the right to food, the indicators developed by the SER Monitoring Tool naturally have some inherent limitations. For example, the supply of food in South Africa as illustrated in indicator-1 through an assessment of calorie availability (per capita) is limited in the sense that it does not cover the intake of micronutrients, although dietary diversity scores (DDS) as made use of in indicator-15 can be used as complements. Also, it must be noted that calorie availability ignores the issue of access. This is why it is vital to read the indicators together and study carefully the linkages between them. Additionally, it must be acknowledged that direct outcomes in terms of accessibility, particularly at a household level, on a nationally representative scale, are difficult to identify, both on an ongoing or once-off basis. Nonetheless, some scholars have asserted that the households’ budget shares devoted to purchasing food products and commodities is the most direct indicator speaking to the issue of access. Granted, this indicator could even be disaggregated according to the composition of the food basket. However, when used as a national average, this indicator would conceal inequality in access.
6.3.3. Enable improvements to current national survey instrumentsThe food security data presented in this report indicates that the South African government needs to synthesise and coordinate its existing interventions better to effectively target and improve the lives of the poor and marginalised, particularly those going without food. The government’s approach also needs to be “innovative with regard to new, more comprehensive and purpose-specific approaches to the assessment of food (in)security in the country.343” There is value in expanding the questions in current national research tools so as to allow a deeper and more meaningful probe into issues of food security. The state could capitalise more effectively and strategically on the various existing instruments. Significantly, it must be emphasised that instruments need to be inter-disciplinary and inter-sectoral in focus.
This report has made an attempt at familiarising readers with the contested issues surrounding the monitoring of the progressive realisation of the right to food in South Africa. By articulating and clarifying the different definitions of the right to food and discussing the various perspectives on the country’s food security, the report has highlighted some key issues that call for urgent attention.
6.3.4. Indicators for the right to foodWhilst the Courts have provided valuable guidance on what progressive realisation of some of the socio-economic rights entails, there needs to be commonly understood indicators of progress in service delivery and the state needs to set clearer goals and objectives. Food and nutrition measurement tools and data collection methodologies should be enhanced, resulting in indicators that capture the multiple dimensions of the right to food.
The setting of targets with clear deliverables is key and should be done in consultation with vulnerable groups. As such, the plea is for the establishment of a common food security target for South Africa motivated by the fact that a food security target will enable more effective pro-poor policy responses and will ensure efficiency in fiscal spending in relation to food security interventions.344 Scholars such as Peter Jacobs from the Human Sciences Research Council (HSRC) have asserted that the development of a credible household food security target would have to take into account the following:345
� Household composition: household size and the number of children (to account for economies of scale in consumption)
� Wealth and livelihood strategy: income, education and assets (land, livestock, labour etc.)
343 Labadarios et al, 2009.344 Jacobs, P. 2009. Op Cit, 412.345 Adapted from Jacobs, P. 2009. Op Cit, 412.
The state needs to set clearer goals and
objectives for the right to food that can be tracked over time.

152 The Right to Food in South Africa
� Geography: rural/urban location and formal/informal settlements – e.g. distance from food markets and the related costs
� Institutions: markets, the state, social capital/networks
� Time: whether the food security condition is transitory or chronic
� Risk: shocks that are weather-related, health-related and so forth, and commodity price movements
Development of these targets must involve diverse stakeholders including civil society organisations and research institutions among others. Government needs to dedicate its resources to the development of such a system based on agreed upon right to food targets. Such a system must include “impact assessment ex-post which can feed into learning, reviews and design of interventions.346” The need to identify appropriate tools and methodologies for measuring levels of food insecurity is particularly important. An opportunity exists for harnessing government commitment to effective monitoring and evaluation to develop such a system.
6.3.5. Investment in Qualitative In-depth StudiesSouth Africa is, despite the recognised high prevalence of food insecurity, still uncertain regarding the exact number of households who are food insecure. In this regard, scholars such as Sheryl Hendricks from the University of Pretoria have argued that quantitative studies have limitations to helping us understand the experience of poverty at the household level.347 In the absence of sound nationally representative studies, funding and support should be provided for qualitative local studies of household experiences of vulnerability and insecurity in order to develop a credible baseline knowledge of how households respond to food security shocks and stressors. Studies need to adopt a more combined and multidimensional approach to understanding the effects of stressors on households whilst identifying and focussing on the vulnerable, including children under five, orphans, older persons, female-headed households, etc., and their responses to shocks.
6.4. Uniting and organising to end hungerThe challenges of reducing food insecurity in South Africa are different today from what they were in the past. Addressing food insecurity in modern-day South Africa requires innovative responses and solutions that fundamentally reconsider the underpinnings of food insecurity and how to respond.
The year 2015 marks the end of the Millennium Development Goals (MDG’s), and despite headway in some areas, a lot remains to be done to end poverty and hunger. In particular, the many aspects of food security – interlinked through production and consumption chains, natural resource use, and interactions between countries – call for a holistic and integrated approach moving forward. Hopefully, the transition towards the Sustainable Development Goals (SDG’s) will culminate in a worthwhile response to the issue of global hunger and poverty, post-2015. There appears to be general agreement among governments that the SDG’s should include a goal on food security and agriculture but agreeing on some aspects of the goal may still prove challenging. While targets focusing on food access enjoy broad support, sustainability targets are politically more difficult. Production of biofuels, genetically modified organisms (GMOs), trade-distorting subsidies and “land-grabbing” are also contested areas. Yet, beyond goals and targets, negotiations must still address indicators, the means of implementation, monitoring and, not least, financing. Poverty is perpetuated by malnutrition and hunger and as the world looks back on the MDG era it may well be time to acknowledge that it is impossible for us to reach the goal of halving poverty without simultaneously combating hunger and malnutrition.
There is no doubt that the global community has articulated a strong commitment to ensuring fulfilment of the right to food, as demonstrated by the evolution of international law and by repeated international conferences and corresponding action plans signed by the majority of
346 Ibid.347 Hendriks, S.L. 2005. The challenges facing empirical estimation of household food (in)security in SouthAfrica, Development Southern Africa, 22:1, 118.

153 Ensuring the progressive realisation of the right to food in South Africa: report recommendations based on findings
nations. But law makes little difference unless it can be implemented in practice, and conference documents remain mere rhetoric unless undergirded by political will.
South Africa is a food secure nation in terms of availability at the national level. The country has an advanced agricultural production and distribution sector that should be able to ensure stable access to sufficient, nutritious food for all. However, this national availability of food stands in stark contrast to the pervasive hunger and malnutrition that continues to afflict the majority of the population. The South African Food Sovereignty Campaign, governments new Food and Nutrition Security Strategy, the formation of the Southern African Vulnerability Assessment Committee, and at least rhetorical commitment by the ruling party to securing the right to food, combined with the strong agricultural sector and high food availability within the country, give hope that a sustained, coordinated approach to ensuring the right to food is not beyond our grasp. Implementation of the recommendations of this report, and use of the findings presented, will go a long way to ensuring that this is the case. However, nothing can replace the need for united and concerted action between all sectors of society.
6.4.1. Using Indicators for AdvocacyThere is a growing recognition globally that reliable human rights data and indicators have a vital role to play in advancing human rights fulfilment and other sustainable development goals.348 In evaluating the state against its obligation to progressively realise rights within available resources, human rights indicators, when combined with policy and budgetary analysis, help us to identify the successes, failures, gaps and trends in current and previous government interventions, while highlighting priority areas for action. Regrettably, very little work has been done on developing and using these tools. The human rights community has traditionally shied away from measurement and quantification, and the development community has only recently begun introducing human rights standards and principles into its work349. In both of these contexts, the subject of measuring human rights standards and principles has attracted growing attention.
The information generated by this report, including the indicators developed for the right to food, should be used by a variety of actors, including: government and policy-makers, civil society, advisory and oversight bodies such as the DPME and Chapter 9 institutions, especially the SAHRC, United Nations treaty monitoring bodies, the judiciary and public interest lawyers, academia – to monitor and guide progress made in fulfilling human rights, and as a tool for supporting development and progressive change.
A human or constitutional right is not a political option that governments can choose to implement or to ignore. All departments with food security programmes must be aware of their right to sufficient food and basic nutrition obligations. Such programmes should be designed to meet these obligations. SPII’s monitoring of the implementation of SERs is not simply about taking a ‘watch-dog’ role to ensure this is the case, but to inspire and support a range of collective actions designed to guide policy around SERs and to move all actors towards developing roadmaps and time-frames for how and by when universal access to SERs for all people living in South Africa will be achieved – as guaranteed in the Constitution.
348 For example, the United Nations is calling for a ‘Data Revolution for Sustainable Development’, see: www.undatarevolution.org349 Ibid
A human or constitutional right is not a political option
that governments can choose to implement
or to ignore.

154 The Right to Food in South Africa
Bibliography N.B. all internet sources checked and accessed 15 July 2015
Government policies and plans (in order of department and date)
Department of Agriculture, Forestry and Fisheries (DAFF)‘The Integrated Food Security Strategy for South Africa’ (2002) Pretoria, South Africa. Available at: www.nda.agric.za/doaDev/sideMenu/foodSecurity/policies.pdf.
‘Terms of Reference for the National Food Price Monitoring Committee’ 29 November 2002. Available at: www.nda.agric.za/docs/fpmc/fpmc.htm.
Comprehensive Agricultural Support Programme (CASP) (2006) Available at: www.nda.agric.za/docs/CASP/casp.htm.
‘CASP Concept Document: A draft document for the Deputy Director-General: Agricultural Production and Resource Management of the Department of Agriculture’ (2011).
‘South African Agricultural Production Strategy: 2011-2025’ (2011) Available at: www.daff.gov.za/doaDev/doc/IGDP/AGRIC_PRODUCTION_STRATEGY_FRAMWK.pdf.
‘Strategic Plan 2012-2016’ (2012) Available at: www.nda.agric.za/doaDev/topMenu/StratPlan201213-201617.pdf.
‘The Framework for the Zero Hunger Strategy Programme: Actuating the Integrated Food Security Strategy for South Africa’ (2012) Available at: www.docstoc.com/docs/135003704/framework-for-the-Zero-Hunger-Programme---Paqrliamentary .
‘National Policy on Food and Nutrition Security for the Republic of South Africa’ 22 August 2014. www.nda.agric.za/docs/media/NATIONAL%20POLICYon%20food%20and%20nutrirition%20security.pdf.
‘Fetsa Tlala: Production Plan 2014/15’ Compiled by: the Deputy Director General for the programme Food Security and Agrarian Reform, September 2014.
Department of Basic Education (DBE)Annual Performance Plans available at: www.education.gov.za/DocumentsLibrary/Reports/tabid/358/Default.aspx.
Policies available at: www.education.gov.za/DocumentsLibrary/Policies/tabid/390/Default.aspx
Department of Health (DoH)‘Roadmap for Nutrition in South Africa 2013-2017’ (2013) Directorate: Nutrition, Pretoria.
‘National Vitamin A Supplementation Guidelines for South Africa’ (2012) Available at: www.adsa.org.za/Portals/14/Documents/DOH/Vit%20A%20policy%20guidelines%20OF%20S%20A%20-%20recent_1.pdf.
Government annual and other reportsDepartment of Agriculture, Forestry and Fisheries (DAFF) ‘CASP Annual Evaluation Report 2008/09’ (2010).
DAFF ‘CASP Annual Evaluation Report 2009/10’ (2010).
DAFF ‘CASP Annual Evaluation Report 2010/11’ (2011).
DAFF ‘CASP Annual Evaluation Report 2012/13’ (2013).
DAFF 2013. ‘Comprehensive Agricultural Support Programme Annual Evaluation Report 2012/13’.

155 Ensuring the progressive realisation of the right to food in South Africa: report recommendations based on findings
Department of Agriculture (DoA). 2006. ‘Integrated Food Security and Nutrition Strategy Task Team: Status Report’, Cape Town, South Africa.
DAFF 2014. ‘Presentation to the Portfolio Committee on Agriculture, Forestry and Fisheries: The 2014/15 Fetsa Tlala Plan’.
DAFF Annual Reports, available at: www.daff.gov.za.
Department of Basic EducationAnnual and other reports, available at: www.education.gov.za/DocumentsLibrary/Reports/tabid/358/Default.aspx.
DBE & UNICEF ‘Evaluation of the School Nutrition Programme: National Report’ (2008).
‘National School Nutrition Programme: A Guide for Secondary Schools’ (2009).
‘National School Nutrition Programme: Implementation, Monitoring and Reporting Manual’ (2012).
‘Education Statistics in South Africa 2011’ (2013). Pretoria, South Africa.
National Assembly Written Reply Question 643: Internal Question Paper 05/14: Date of Publication: 18/07/2014. Available at: www.education.gov.za/LinkClick.aspx?fileticket= q5plgZH1CHk%3d&tabid=1200.
South African casesGovernment of the Republic of South Africa and Others v Grootboom and Others (1) SA 46 (CC). 2000 (I I) BCLR 1169 (CC).
Kenneth George and Others v. Minister of Environmental Affairs & Tourism, 2007 (EC 1/05).
Wary Holdings (Pty) Ltd v Stalwo (Pty) Ltd and Another (CCT78/07) [2008] ZACC 12; 2009 (1) SA 337 (CC); 2008 (11) BCLR 1123 (CC) (25 July 2008).
Competition Commission v Pioneer Foods (Pty) Ltd (15/CR/Feb07, 50/CR/May08) [2010] ZACT 9.
Mukaddam v Pioneer Foods Pty) Ltd and Others (CCT 131/12) [2013] ZACC 23; 2013 (5) SA 89 (CC); 2013 (10) BCLR 1135 (CC)
International human rights instrumentsConvention on the Elimination of All Forms of Discrimination Against Women (CEDAW) adopted 18 Dec. 1979 G.A. Res 34/180 U.N. GAOR 34th session U.N. Doc A/34/46 (entered into force 3 Sept. 1981).
Convention on the Rights of the Child (CRC) adopted and opened for signature, ratification and accession by G.A. Res 44/25 of 20 November 1989 (entry into force 2 September 1990). Available at: www.ohchr.org/EN/ProfessionalInterest/Pages/CRC.aspx.
International Covenant on Economic, Social and Cultural Rights (ICESCR) (adopted 16 Dec 1966, entered into force 3 Jan 1976) GA Res 2200 A (XXI) UN Doc A/6316, 993 UNTS 3.
Open Working Group proposal for Sustainable Development Goals, Full Report of the Open Working Group of the General Assembly on Sustainable Development Goals, UN Doc A/68/970. Available at: http://undocs.org/A/68/970.
United Nations Committee on Economic, Social and Cultural Rights (CESCR), General Comment No. 12: The Right to Adequate Food (Art. 11 of the Covenant) 12 May 1999. Available at www.refworld.org/docid/4538838c11.html.
Voluntary Guidelines to support the progressive realization of the right to adequate food in the context of national food security, Adopted by the 127th Session of the Food and Agriculture Organisation of the United Nations (FAO) Council, November 2004.

156 The Right to Food in South Africa
African regional human rights instrumentsAfrican Charter on Human and Peoples’ Rights (adopted Nairobi, Kenya, 27 June 1981) 21 ILM 59 (1981), entered into force 21 October 1986. Available at: www.achpr.org/files/instruments/achpr/banjul_charter.pdf.
African Charter on the Rights and Welfare of the Child, adopted 1990, entered into force 1999. Available at: www.achpr.org/instruments/child.
African Commission on Human and Peoples’ Rights ‘Principles and Guidelines on the Implementation of Economic, Social and Cultural Rights in the African Charter on Human and People’s Rights’ adopted October 2011. Available at: www.achpr.org/instruments/economic-social-cultural.
Protocol to the African Charter on Human and Peoples’ Rights on the Rights of Women in Africa, adopted 2003. Available at: www.achpr.org/instruments/women-protocol.
BooksBilchitz, D. 2007. Poverty and Fundamental Rights: The Justification and Enforcement of Socio-Economic Rights. Oxford: OUP.
Chapters in booksBrand, D. 2005. ‘The right to food’, in Brand, D in Heyns, C (eds) Socio-economic rights in South Africa, 153-189.
Georgieff, M., & Rao, R. 1999. The role of nutrition in cognitive development. In: Nelson CA, Luciana M, editors. Handbook in Developmental.
JournalsAltman, M., Hart, T & Jacobs, P. 2009. ‘Household food security status in South Africa’ 48:4 Agrekon 351. Available at: http://ageconsearch.umn.edu/bitstream/58211/2/1.%20Altman,%20Hart%20&%20Jacobs.pdf
Baiphethi, M & Jacobs, P. 2009. ‘The contribution of subsistence farming to food security in South Africa’ 48:4 Agrekon 459.
Brand, D. 2009. ‘Between Availability and Entitlement: The Constitution, Grootboom and the Right to Food’. Law, Democracy and Development 1.
Drimie, Scott & Shaun Ruysenaar. 2010. The Integrated Food Security Strategy of South Africa: An institutional analysis, Agrekon: Agricultural Economics Research, Policy and Practice in Southern Africa, 49:3, 316-337, Available at: http://dx.doi.org/10.1080/03031853.2010.503377.
Faber, M., and Wenhold, F. 2007. “Nutrition in Contemporary South Africa” 33:3 Water SA 395.
Hendricks, S. L. 2005. ‘The challenges facing empirical estimation of household food (in) security in South Africa.’ Development Southern Africa, vol. 22, no. 1, 103-123.
Jacobs, P 2009 The status of household food security targets in South Africa. Agrekon Vol 48, No 4, 414.
Jacobs, P. 2010. Identifying a Target for Food Security in South Africa. Agrekon Launch. Centre for Poverty Employment & Growth (CPEG). Available at: www.hsrc.ac.za/en/research-outputs/ktree-doc/1646.
Labadarios, D., Steyn, N., Mgijima, C., & Dladla, N. 2005. ‘Review of the South African nutrition policy 1994–2002 and targets for 2007: achievements and challenges.’ 21:1 Nutrition. 100-108.
Labadarios, D., Davids, Y.D., Mchiza, Z. & Weir-Smith, G. 2009. The Assessment of Food Insecurity in South Africa. Centre for Poverty Employment and Growth. Human Sciences Research Council (HSRC), p6. Available at: www.hsrc.ac.za/en/research-outputs/ktree-doc/2602.

157 Ensuring the progressive realisation of the right to food in South Africa: report recommendations based on findings
Liebenberg, S. 2009. ‘South Africa’s evolving jurisprudence on socio-economic rights: An effective tool in challenging poverty?’. Refereed article for Law, Democracy and Development. Available at: www.ldd.org.za/images/stories/Ready_for_publication/V6-2_SA_evolving_jurisprudence.pdf
McGarry, D. and Shackleton, C. 2009. Children Navigating Rural Poverty: Rural Children’s Use of Wild Resources to Counteract Food Insecurity in the Eastern Cape, South Africa. Journal of Child Poverty 15: 19-73.
Mestry, R. and Ndhlovu, R. 2014. The implication of the National Norms and Standards for School Funding policy on equity in South African Public Schools. South African Journal of Education 34:3.
Ray, B. 2009. ‘Polycentrism, Political Mobilization, and the Promise of Socioeconomic Rights’. 45 Stan. J. Int’l L. 151.
Visser, J. 2013. ‘Anaemia in South Africa: the past, the present and the future’ Guest editorial, SA Journal on Clinical Nutrition 26(4), 166. Available at: http://sajcn.co.za/index.php/SAJCN/article/viewFile/839/1094.
Reports, working papers, policy briefs, conference papersAccountability and Transparency for Human Rights (AT4HR) Foundation, International Budget Partnership (IBP) and Save the Children. 2013. Budget Transparency and Child Nutrition: Research Findings From: Kenya, South Africa, Uganda, Zambia and Zimbabwe. Available Online: www.at4hr.org .
Baleta, H & Pegram, G. 2014. ‘Water as an input in the food value chain. Understanding the Food Energy Water Nexus’. WWF-SA. Available at: www.environment.gov.za/sites/default/files/docs/waterasaninputintothefoodvaluechain.pdf
Bhorat, H & Oosthuizen, M. 2005. ‘The relative inflation experience of poor urban South African households’. Labour Market Frontiers. South African Reserve Bank. Available at: www.resbank.co.za/Lists/News%20and%20Publications/Attachments/346/Relative%20inflation%20experience%20of%20poor%20urban%20SA%20households.pdf
Biersteker, L. 2012. ‘Early Childhood Development Services: Increasing Access to Benefit the Most Vulnerable Children’ in Hall, K, Woolard, I, Lake, L & Smith, C (eds) South African Child Gauge 2012, Children’s Institute, University of Cape Town.
Black Sash ‘You and Your Rights’. 2012. Available at: www.blacksash.org.za/index.php/your-rights/consumer-protection/item/you-and-your-rights-consumer-protection-act
Black, A., Conradie, B & Gerwel, H. 2014. ‘Should agriculture receive greater support as part of an inclusive growth strategy?’. Available at: www.econ3x3.org/article/should-agriculture-receive-greater-support-part-inclusive-growth-strategy.
Blyberg, A & Hofbauer, H. 2014. ‘Article 2 and Governments Budgets: The Use of Maximum Available Resources’. Article 2 Project.
Brockerhoff, S. 2013. ‘A Review of the Development of Social Security Policy in South Africa’, Studies in Poverty and Inequality Institute, Working Paper 6. Available at: http://spii.org.za/wp-content/uploads/2014/01/Working-Paper-6_Social-Security-policy-review.pdf.
Business Enterprises at the University of Pretoria for the DPME ‘Implementation Evaluation of the Recapitalisation and Development Programme (from its inception in 2010 to June 2012)’ (2013).
Business Environment Specialists ‘National Minimum Wage: A Complicated Issue’ (2014) A background paper prepared for Business Unity South Africa. Available at: www.rebosa.co.za/wp-content/uploads/2014/10/National-Minimum-Wage-Background-Paper.pdf.
Chirwa, D.M. 2009. ‘Child poverty and children’s rights of access to food and basic nutrition in South Africa: A contextual, jurisprudential and policy analysis’, Socio-Economic Rights Project, Community Law Centre, University of the Western Cape. Available at: http://repository.uwc.ac.za/xmlui/bitstream/handle/10566/203/ChirwaChildPoverty2009.pdf?sequence=3.
Cooperative and Policy Alternative Centre (COPAC). 2014. ‘Discussion Paper: The Right to Food and Food Sovereignty in South Africa: Challenges and Prospects’. Available at: www.copac.org.za/files/Final%20Discussion%20Paper.pdf.

158 The Right to Food in South Africa
Cousins, B. 2013. ‘Briefing paper: new policies on land redistribution in South Africa’, Institute for Poverty, Land and Agrarian Studies (PLAAS). Available at: www.plaas.org.za/plaas-publication/2013redistribution-policy-briefingpaper.
Cousins, B & Aliber, M. 2013. ‘Unworkable land reform project designs offer inappropriate farming models to rural dwellers’, Institute for Poverty, Land and Agrarian Studies (PLAAS). Available at: www.plaas.org.za/blog/unworkable-land-reform-project-designs-offer-inappropriate-farming-models-rural-dwellers.
Council for Scientific and Industrial Research (CSIR) ‘The Magnitude and Cost of Food Waste in South Africa’ Briefing Note 2013/1, February 2013.
Crush, J & Frayne, B. 2010. ‘The invisible crisis: urban food security in Southern Africa’, The African Food Security Network (AFSUN), Cape Town.
Cutts, M & Johan, K. 2005. ‘An Economic Assessment of Zero Rating of VAT on Red Meat’ A paper presented at Agricultural Economics Association of South Africa conference, no. 4, University of Pretoria. Available at: www.aeasa.org.za/conf_05papers2.html.
D’Haese, L., Schönfeldt, H & Karaan, M. 2013. ‘Local studies on household food security – lessons from recent studies using anthropometric and food access measures,’ DST and HSRC seminar on “Policy-relevant indicators to monitor household food-security status in South Africa”, Cape Town, 12 November 2013.
Dawson, H & McLaren, D. 2015. ‘A Framework for Monitoring and Evaluating the Progressive Realisation of Socio-Economic Rights in South Africa’. Studies in Poverty and Inequality Institute. Available at: http://spii.org.za/wp-content/uploads/2015/03/SPII-A-Framework-for-Monitoring-the-Progressive-Realisation-of-SERs-....pdf.
Dawson, H. 2014. ‘Public participation and citizen-based monitoring in realising socio-economic rights’. Studies in Poverty and Inequality Institute, Policy Brief 7. Available at: http://spii.org.za/wp-content/uploads/2014/10/Policy-brief-7-Community-Monitoring-Report.pdf.
Du Toit, D.C. 2011. Food Security. Directorate Economic Services: Production Economics Unit, 14. Available at: www.nda.agric.za/docs/genreports/foodsecurity.pdf.
Food Sovereignty Campaign (FSC). 2015. ‘Declaration of the South African Food Sovereignty Campaign and Alliance’ Available at: www.copac.org.za.
Fumba, L. 2007. Occasional Paper: A Study into the Delivery of the School Nutrition Programme (SNP) in Selected Schools and Districts in the Eastern Cape. Public Service Accountability Monitor (PSAM), Monitoring and Advocacy Programme. Grahamstown, South Africa.
Gillespie, S. & Mason, J. 1991. Nutrition Relevant-Actions: Some Experiences from the Eighties and Lessons for the Nineties. Administrative Committee on Coordination – Subcommittee on Nutrition. United Nations. Nutrition Policy Discussion Paper No. 10, Available at: www.unsystem.org/scn/archives/npp10/begin.htm#Contents.
Hall, R & Michael, A. 2010. ‘The case for re-strategizing spending priorities to support small-scale farmers in South Africa’, PLAAS. Available at: www.plaas.org.za/plaas-publication/wp-17.
Hall, R. 2014. ‘Land Reform: Can’t we do better?’. ECSECC Seminar, University of Fort Hare, East London. PowerPoint presentation.
Immelman, E, and Bamford, L., ‘Implementing an Integrated Nutrition Programme: A situational analysis of progress in the Lower Orange Region of the Northern Cape,’ Health System Trust, April 2000. Available at: www.healthlink.org.za/uploads/files/integ_nutri.pdf.
Jacobs, P. 2013. ‘Diversity of food access among low-income households in South Africa – comparative evidence from household surveys’, DST and HSRC seminar on “Policy-relevant indicators to monitor household food-security status in South Africa”, Cape Town.
Jooste, Peter. ‘Solving Iodine Deficiency in South Africa: so near - and yet so far. Medical Research Policy Brief 2, 2000. Available at www.mrc.ac.za/policybriefs/2polbrief2000.htm.
Koch, Josee. 2011. ‘The Food Security Policy Context in South Africa’, Country Study No. 21. Available at: www.ipc-undp.org/pub/IPCCountryStudy21.pdf.
159 Ensuring the progressive realisation of the right to food in South Africa: report recommendations based on findings
Kota, Z. & Shackleton, S. 2014. Harnessing Local Ecological Knowledge to Identify Priority Plant Species for the Restoration of Albany Thicket, South Africa. Forest, Trees and Livelihoods. 2-16.
Künnemann, R., Yakpo, K., Pabst, S., and Wolpold-Bosien, M. 2003. Implementing the Right to Food in South Africa: From Legislative Framework to Framework Legislation, FIAN International Working Paper, Right to Food Seminar Johannesburg, 7 and 8 March 2003, http://www.sahrc.org.za/home/21/files/Reports/5th_esr_food.pdf
Polaski, S. 2008. Food prices, poverty, and small-scale farmers: Getting the global trade regime right. Carnegie Endowment for International Peace. Available at; www.un.org/en/ecosoc/docs/statement08/s_polaski.pdf.
Overy, N. 2010. An Evaluation of the School Nutrition Programme in the Grahamstown Education District, Eastern Cape, South Africa. Public Service Accountability Monitor (PSAM). Grahamstown, South Africa.
Oxfam. 2014. ‘Hidden Hunger in South Africa: The faces of hunger and malnutrition in a food-secure nation.’ Available at: www.oxfam.org/sites/www.oxfam.org/files/file_attachments/hidden_hunger_in_south_africa_0.pdf.
Public Service Commission (PSC). 2008. Report on the Evaluation of the National School Nutrition Programme (NSNP). Pretoria, South Africa.
Save the Children. 2013. Food for Thought: Tackling Child Nutrition to Unlock Potential and Boost Potential, London, Available at: www.savethechildren.org/atf/cf/%7B9def2ebe-10ae-432c-9bd0-df91d2eba74a%7D/FOOD_FOR_THOUGHT.PDF
Stats SA. 2013. ‘National and provincial labour market trends: 2003-2013’.
Statistics South Africa (StatsSA). 2013b. Social Profile of Vulnerable Groups 2002-2012. Available at: http://beta2.statssa.gov.za/publications/Report-03-19-00/Report-03-19-002012.pdf.
Statistics South Africa (StatsSA). 2013c. Poverty Trends in South Africa: An Examination of Absolute Poverty between 2006 and 2011. Pretoria, South Africa.
Tomlinson, M. 2007. ‘School feeding in east and southern Africa: Improving food sovereignty or photo opportunity?’ Equinet Discussion Paper 46. Available at: www.equinetafrica.org/bibl/docs/DIS46nutTOMLINSON.pdf.
Vink, N., Tregurtha, N., & Kirsten, J. 2002. South Africa’s Changing Agricultural Trade Regime. Trade and Industrial Policy Strategies (TIPS), 1. Available at: www.tips.org.za/files/562.pdf.
Watkinson, E. 2002. ‘Overview of the Current Food Security Crisis in South Africa’, National Labour and Economic Development Institute (NALEDI). Available at: http://sarpn.octoplus.co.za/documents/d0000222/watkinson/Watkinson_SA_food_crisis.pdf.
Wenhold, F., Rendall-Mkosi, K., and Sibanda, N. 2013. Case Study of the National School Nutrition Programme in South Africa. University of Pretoria, South Africa.
Wildeman. R & Mbebetho, N. 2005. ‘Reviewing Ten Years of the School Nutrition Programme, Budget Information Service’, Idasa. Available at: www.eldis.org/vfile/upload/1/document/0708/DOC20662.pdf.
World Health Organisation. Food security in South Africa: a review of national surveys, 2011. Available at: www.who.int/bulletin/volumes/89/12/11-089243/en/
World Wide Fund. Agriculture: Facts & Trends, South Africa. Available at: http://awsassets.wwf.org.za/downloads/facts_brochure_mockup_04_b.pdf.
Zafar, S. Kgobe, P., Napo, V., and Parker, B. 2005. An Analysis of the South African Education Policy from a Child Labour Perspective: Full Report of the Centre for Education Policy Development (CEPD). Department of Labour, Republic of South Africa and the International Labour Organisation, Pretoria, South Africa.
Food and Agriculture Organisation of the United Nations (FAO)Food and Agriculture Organisation of the United Nations (FAO). 2009. ‘The right to food and access to justice: examples at the national, regional and international levels’. FAO, Rome. Available at: www.fao.org/docrep/016/k7286e/k7286e.pdf.

160 The Right to Food in South Africa
Food and Agriculture Organisation of the United Nations (FAO). 2009. ‘Budget Work to Advance the Right to Food: Many a Slip… Book 5. FAO: Rome. Available at: www.fao.org/3/a-i0717e.pdf.
Food and Agriculture Organization of the United Nations (FAO). 2002. World Agriculture: Towards 2015/2030, Summary Report, 1. Available at: www.fao.org/docrep/004/y3557e/y3557e03.htm
Knuth, L and Vidar, M. 2011. ‘Constitutional and Legal Protection of the Right to Food.’ Food and Agricultural Organization of the United Nations. Available at: www.fao.org/docrep/016/ap554e/ap554e.pdf.
South African Human Rights Commission (SAHRC)South African Human Rights Commission. 2004. 5th Economic and Social Rights Report Series 2002/2003 Financial Year, ‘The Right to Food’. Available at: www.sahrc.org.za/home/21/files/Reports/5th_esr_food.pdf.
South African Human Rights Commission. 2013. Concept Paper on the Strategic Focus Area: The Right to Food: 2012-2013, p17. Available at: http://www.sahrc.org.za/home/21/files/Concept%20Paper%20on%20the%20Right%20to%20Food%2018072013%20(2).pdf
United Nations Special Rapporteur on the Right to FoodDe Schutter, O. 2010. ‘Countries tackling hunger with a right to food approach: Significant progress in implementing the right to food at national scale in Africa, Latin America and South Asia’. Briefing Note 01 May 2010.
‘Mandate of the Special Rapporteur on the Right to Food - Mission to South Africa from 7 to 15 July 2011’ Pretoria, 15 July 2011 - Preliminary observations and conclusions. Available at: www.ohchr.org/en/NewsEvents/Pages/DisplayNews.aspx?NewsID=11243&LangID=E.
Report of the Special Rapporteur on the right to food, Olivier De Schutter, ‘Final Report: The transformative potential of the right to food’ 24 January 2014. Available at: www.srfood.org/images/stories/pdf/officialreports/20140310_finalreport_en.pdf.
Report of the Special Rapporteur on the right to food, Olivier De Schutter, ‘Mission to South Africa’ 13 January 2012. Available at: www.srfood.org/images/stories/pdf/officialreports/20120306_southafrica_en.pdf.
Newspapers, websites and other online sourcesAshton, G. 2013. ‘Failing to Feed Our People: South Africa’s Lacklustre Food Security Policy’, SACSIS. Available at: www.sacsis.org.za/s/story.php?s=1785
Dugard, J and Benjamin, M. 2015. ‘Human rights “made whole”’ The New Age 28 January 2015. Available at: www.seri-sa.org/images/ICESCR_OpEd_Jan2015.pdf.
Ensor. L. 2015. ‘Critics want land scheme review’. Business Day Online. 06 February 2015. Available at: www.bdlive.co.za/national/2015/02/06/critics-want-land-scheme-review.
Erlanger, Steve. 2008. U.N. Panel Urges Changes to Feed Poor While Saving Environment. New York Times newspaper. Available at: www.nytimes.com/2008/04/16/world/europe/16food.html?_r=0.
McLaren, D. 2015. ‘Ratification of Human Rights Treaty Reaffirms SA’s Commitment to Socio-Economic Rights and Internationalism’, SACSIS. Available at: http://sacsis.org.za/site/article/2264.
McLaren, D. 2015. ‘As World Food Day Approaches, One In Four South Africans Are Hungry’, SACSIS. Available at: http://sacsis.org.za/site/article/2167
Nombembe, P. 2014. ‘Cities on the skids’, Timeslive. Available at: www.timeslive.co.za/thetimes/2014/08/18/cities-on-the-skids.
Ottermann, B. 2013. South Africa’s Hidden Hunger. Health24 Newspaper, p1. Available at: www.health24.com/Diet-and-nutrition/Nutrition-basics/South-Africas-hidden-hunger-20130411.
Proudlock, P & Hall, K. 2011. ‘Children’s Right to Food and Nutrition’, Children’s Institute, University of Cape Town. Available at: http://childrencount.ci.org.za/rights_nutrition.php.

161 Ensuring the progressive realisation of the right to food in South Africa: report recommendations based on findings
Radebe, H. 2012. Food more expensive in rural areas in SA. BDlive newspaper. Available at: www.bdlive.co.za/articles/2012/05/30/food-more-expensive-in-rural-areas-in-sa.
South African Press Association (SAPA). 2014. ‘DA Goes to Court over Food Parcels’. Available at: www.polity.org.za/article/protector-probes-food-parcels-for-votes-2014-04-22
South African Press Association (SAPA). 2014. ‘Protector Proves Food Parcels for Votes’. Available at: www.timeslive.co.za/politics/2014/04/20/da-goes-to-court-over-food-parcels

162 The Right to Food in South Africa
APPENDIX Table 38 below outlines the estimates an expenditure in real terms for the School Nutrition Programme for all provincial education departments and the DBE between 2010/11 and 2016/17.
Table 38: Real Estimates and Expenditure for the National School Nutrition Programme Conditional Grant
Province ('000 Rand) 2010/11 2011/12 2012/13 2014/15 2015/16 2016/17 Average Growth Over MTEF
Real Change Between 2013 and 2014 (%)
Eastern Cape 867,763 995,114 1,001,559 1,007,642 1,007,642 1,007,642 984,548 1,020,116 1,074,182 2.95 -2.29Free State 236,551 294,410 289,391 291,468 291,752 291,752 299,205 317,157 333,966 3.73 2.55Gauteng 447,101 556,118 656,378 621,210 654,501 654,501 640,541 678,974 714,960 3.73 -2.13Kwazulu Natal 1,065,251 1,357,424 1,292,956 1,280,506 1,280,506 1,280,506 1,237,534 1,287,034 1,355,247 3.08 -3.36Limpopo 815,029 924,061 1,076,706 989,476 989,476 989,476 991,153 1,030,799 1,085,431 3.08 0.17Mpumalanga 494,193 531,376 568,718 527,262 535,939 535,939 524,913 545,910 574,843 3.08 -2.06North West 311,733 368,996 363,021 370,409 376,722 376,722 366,890 381,566 401,789 3.08 -2.61Northern Cape 105,289 124,686 127,018 127,244 127,244 127,244 134,645 142,724 150,289 3.73 5.82Western Cape 211,453 272,869 265,709 276,590 281,437 281,437 282,486 299,435 315,305 3.73 0.37National 4,562,644 5,431,213 5,508,510 0 5,491,808 0 5,461,915 5,703,715 6,006,012 3.22 -0.54
2013/14
Extract 1: ECDoE Circular No. 26 of 2007 Dated 05/09/07 Signed by the Superintendent General

163 Ensuring the progressive realisation of the right to food in South Africa: report recommendations based on findings
Extract 2: Media coverage of fraud and corruption allegations in the NSNP in Limpopo. (Source Mail and Guardian, 26 October 2012) (Extract typological errors due to incompatible text formats)
Malema's 'list' of pals feed on school meals
This was apparently after he presented a list of people he wanted to receive a cut of the money They include two of his cousins his part-time bodyguard and security adviser his former driver his former driver s girlfriend and two of his close allies in the provincial ANC Youth League Send us your questions about this story and watch our live video with the reporters involved nbsp Five sources ndash two of them senior administrators in the provincial education department at the time ndash independently told the Mail amp Guardian they heard Malema had handed provincial education minister Dickson...continue reading
Source: http://mg.co.za/article/2012-10-26-00-malemas- list-of-pals-feed-on-school-meals
Extract 3: Federation of Governing Bodies of South African Schools (FEDSAS) outlines consequences of NSNP cuts on Gauteng learners (Source: http://www.politicsweb.co.za/politicsweb/view/politicsweb/en/page71639/page71654?oid=739731&sn=Detail&pid=71616)

164 The Right to Food in South Africa
Extract 4: Hunger amongst KZN learners in quintile 4 and 5 schools (Source: www.iol.co.za)
‘Thousands of KZN pupils are hungry’
January 31 2012 at 09:50am By Leanne Jansen Comment on this story
INDEPENDENT NEWSPAPERS The Congress of SA Trade Unions’ nationwide protest affected schools in Polokwane on Wednesday. Photo: Matthews Baloyi
Education stakeholders are again calling for the controversial quintile ranking system, which they say has resulted in thousands of KwaZulu-Natal primary school pupils going hungry over December and January, to be reviewed.
According to the system, quintile one schools are in the poorest areas and generally have inadequate resources and infrastructure.
At the other end of the scale, quintile five schools are in affluent areas and have better facilities. The lower the quintile, the more financial support a school receives.
While the National School Nutrition Programme has a dedicated budget to feed pupils in schools from quintile one to three for 12 months of the year – at R2.15 a head a day – it uses money left over from other budgets to feed children in the higher quintiles.
However, there is only enough money to do so for 10 months, meaning that children in quintiles four and five went hungry in December and January on those days when school was open.
More than 600 primary schools in quintile four and more than 400 in quintile five depend on the scheme.
On Monday stakeholders argued that even one day was too long for a child to go hungry, calling the situation “unacceptable” and “unconscionable”. They again argued that many schools were incorrectly ranked because the system failed to use the socio-economic status of a school’s population as a determining factor.
Earlier this month, the Westville Methodist Church wrote to The Mercury, appealing for food donations for the Kranskloof Primary School at KwaDabeka in the Pinetown school district. Although the school is classified quintile four – because it has electricity, running water and tarred roads leading to it – some of its pupils are orphaned and are the heads of their households.
Challenged
The church has stepped in to feed pupils, but can only do so twice a week. The school has more than 700 pupils, but in the interim only the neediest 300 are fed. It is often the only meal the

165 Ensuring the progressive realisation of the right to food in South Africa: report recommendations based on findings
children will have all day.
Reginald Chiliza, chairman of the Association of School Governing Bodies of KZN, said the quintile system should be challenged.
“There are a lot of informal settlements in KwaDabeka. For a school in that area to be ranked quintile four means that something is seriously wrong with the system,” he said.
Trevor Bennison, KZN head of the Governing Body Foundation, agreed that the system needed “reviewing”.
“Schools in certain areas have changes in their pupil populations (registering more poor pupils over the years) but are still classified as affluent schools due to physical characteristics. If a school qualifies for the feeding scheme, it should be for the whole school year. Even one day (without food) is unacceptable,” he said.
In KZN, the government’s nutrition programme provides for one hot meal a day, usually a protein such as sugar bean curry, pilchard stew or soya mince; a starch such as pap or rice; and a vegetable – except on Mondays, when fruit replaces the vegetable.
KZN Education Department spokeswoman Mbali Thusi said yesterday that while the department was aware of the problems with the system, it was a national policy that it had to follow.
She said that the national department was working on ways to remedy the situation.
A spokesman for the Department of Basic Education, Panyaza Lesufi, said that a policy document was doing the rounds among stakeholders for comment.
Last year, the department said that the quintile system would be dumped by April 2012 and replaced with two categories: fee-paying and non-fee-paying schools.
- The Mercury© 1999 - 2010 Independent Online. All rights strictly reserved. Independent Online is a wholly owned subsidiary of Independent News & Media. Reliance on the information this site contains is at your own risk.


Studies in Poverty and Inequality Institute (SPII)
31 Quinn Street, NewtownJohannesburgSouth Africa2000
Phone: + 27 11 833 0161Fax: + 27 11 832 3085www.spii.org.za
For a complete list of SPII’s partners, please visit www.spii.org.za
Design & layout: SUN MeDIA Bloemfontein | [email protected]


![Geometry Extra Credit [2]€¦ · Geometry, Subpart 2 Geometry, Subpart 3 Part of a proof is shown. 23 Given: ARST APTS, SPII RT, and SR Il PT Calculator Allowed A right triangle](https://img.pdfslide.net/doc/110x75/5f2f024e12193c50e751b43d/geometry-extra-credit-2-geometry-subpart-2-geometry-subpart-3-part-of-a-proof.jpg)