Embed Size (px)
Citation preview

1
Spinning Future ThreadsThe Potential of Agricultural Residues as Textile Fibre Feedstock

32
Spinning Future Threads
June 2021
This reasearch was conducted by the Institute for Sustainable Communities, the World Resources Institute India and Wageningen University and Research. Laudes Foundation funded the research. All views expressed in the report are those of the research team and not necessarily those of Laudes Foundation. The boundaries and other information shown on any map in this work do not imply any judgement on the part of Laudes Foundation concerning the legal status of any territory or the endorsement or acceptance of such boundaries.
Authors and Contributors:
Institute for Sustainable CommunitiesVivek Adhia, India Country Director Anannya Mishra, Program Assistant, Energy and EnvironmentDivya Banerjee, Research Assistant
World Resources Institute-India A. Nambi Appadurai, Director, Climate Resilience PracticeParvathi Preethan, Senior Project Associate, Climate Resilience PracticeYasar Khan, Consultant, Climate Resilience Practice
Wageningen University & Research Dieuwertje de Wagenaar, Project Leader Circular Fashion Lab®, Corporate Value CreationPaulien Harmsen, Senior Scientist Circular Fashion Lab®, Wageningen Food and Biobased ResearchBerien Elbersen, Senior Researcher, Wageningen Environmental ResearchMichiel van Eupen, Senior Researcher, Wageningen Environmental ResearchIgor Staritsky, Senior Researcher, Wageningen Environmental ResearchWolter Elbersen, Senior Researcher, Wageningen Food & Biobased ResearchEdwin Keijsers, Senior Researcher, Wageningen Food & Biobased Research
Spinning Future ThreadsThe Potential of Agricultural Residues as Textile Feedstock

54
Spinning Future Threads
Acknowledgements
This report was enabled by the support of
Expert Contributors & Reviewers
The authors gratefully acknowledge the contributions and support of the following individuals, organisations and institutions, in helping steer, guide, and advance the research with their expert insights and perspectives:
Ajay Chadha, NikeAnders Schorling Overgård, BESTSELLERCamilla Skjønning Jørgensen, BESTSELLERDanique Lodewijks, BESTSELLERDeepan Kannan, H&MDr Raquel Prado-Garcia, Ananas AnamEmmi Berlin, SpinnovaEnrica Arena, Orange FiberGeorgia Parker, Fashion for GoodHannah Walker, Roundtable on Sustainable BiomaterialsHeikki Sojjaka, Fiber-XHeli Virkki, FortumJayesh Vir, Green WhisperJothi Kanayalal, Fashion For GoodKaran Kumar, Laudes FoundationLakshmi Poti, Laudes FoundationLinus Mueller, AgraloopTM, Circular SystemsMike Ruuska, Fiber-XMukul Agarwal, Birla CelluloseNicola Noponen, Roundtable on Sustainable BiomaterialsPaivi Lonka, FortumPia Qvintus, SpinnovaRaffaele Germano, NanolloseRicardo I. Garay, AgraloopTM, Circular SystemsSeppo Rikkinen, Fiber-XValerie Langer, Canopy
The authors also wish to thank Schuttelaar & Partners for their work on the design and layout of the report, along with Shubhi Vijay, Brand and Communications Specialist, Laudes Foundation for her inputs.

76
Spinning Future Threads
About this Report
This report explores a new avenue for materials innovation in textile manufacturing – harnessing the potential of agricultural waste and residues as an alternative feedstock for producing textile fibres at scale. This cutting-edge innovation offers strong potential to decrease extensive crop burning and its associated negative environmental and climate impacts; generate new, additive low-cost revenue streams for low-income agricultural communities in South and Southeast Asia; and, activate a scalable and more environmentally sustainable source of fibre for the booming apparel and fashion industry.
The report systematically reviews the current state of innovation in technology and processes, and existing economic and market potential to activate major agro-residue hubs in eight countries in South and Southeast Asia – Bangladesh, Cambodia, India,
The authors of this report acknowledge the healthy debate surrounding the sustainability of biomass removal and its existing uses, particularly agricultural waste and residues. Valid concerns and questions have been raised about the long-term sustainability of large-scale biomass initiatives, and about their potential adverse environmental and socio-economic impacts – particularly in low-income or rural communities.
The authors understand and share these concerns, and have taken great care in their review, and in this report, to account for and address them. The agro-residues identified herein for further exploration comprise a large, already existing and currently unused or under-used biomass resource base that, properly captured and processed, can be used to generate cellulose-based feedstocks for producing textile fibres. Activating these innovations would not require increasing land under cultivation, or increasing crop volumes, and the authors would not put them forward otherwise.
Additionally, the authors emphasize that in exploring or commercialising these value chain
alternatives, the overarching concern must be ensuring that they will not cause negative disruptions in existing socio-economic conditions or ecosystems, particularly rural or agricultural ecosystems. All of the focus countries in South and Southeast Asia included in this study already face unique vulnerabilities, challenges and risks due to rapidly changing environmental and climate conditions. Labour conditions in farming communities in these countries can be challenging, and income stability precarious. The authors have aimed to offer specific pathways that reduce waste, utilise existing resources, and ensure that issues like land use pattern, food security, water security and sustainable agrarian practices are addressed. The authors believe that conscious sourcing decisions can help farmers, farm communities, and the textile industry achieve greater sustainability while ensuring that the delicate balance between people, planet and profits is upheld and safeguarded. The report offers a modest beginning for a steep learning curve.
The ecological and socio-economic sustainability of biomass: Acknowledging the debate
Indonesia, Pakistan, Sri Lanka, Thailand and Viet-nam. The authors outline actionable recommenda-tions and chart a roadmap for setting up alternative textile value chains based on specific agro-residues.
Scaling up existing niche innovations could unlock the potential of widely available, yet under-used, natural resources to benefit the global economy and environment. A responsible and environmentally conscious approach to sourcing and utilising agro-residues will be essential for building long-term alternatives to conventional textile value chains. Through this effort, the authors hope to nudge manufacturers, innovators, design experts and global brands to rethink business as usual, and take concrete steps towards building a more sus-tainable future for the fashion industry.

98
Spinning Future Threads

1110
Spinning Future Threads
Table of Contents
Foreword 12 Executive Summary 14
1 Background and Scope 181.1 Context 201.2 Scope of the study 241.2.1 Overview 241.2.2 Approach and Methodology 24
2 Understanding Fibres, Processing and Innovations 342.1 Fibre classification 362.2 Processing approaches 382.3 Innovator’s landscape 41
3 Availability of Crop Residue in Regions 443.1 Longlisting of crops and residues in the eight countries 463.2 Spatial analysis to identify hub locations 55
from eight countries 3.2.1 Rice straw and other cereal straws 563.2.2 Sugarcane trash and bagasse 583.2.3 Empty fruit bunches (EFBs) from oil palm 603.2.4 Banana pseudo-stems and Pineapple leaves 60
4 Pre-feasibility and Viability Considerations 644.1 Value chain design and assumptions for cost assessment 664.2 Cost calculations and considerations 734.2.1 At-gate delivery cost for cellulose biomass sources 734.2.2 At-gate delivery costs for fibre rich biomass sources 79
5 Landscape: Barriers, Opportunities and Sustainability 825.1 Agricultural production and practices 845.2 Technology, design and innovation 865.3 Processing and manufacturing 865.4 Commercialization and scale-up 875.5 Socio-economic and sustainability perspectives 885.6 Climate change and environmental externalities 92
6 Roadmap towards Commercialisation 96
Annexures 104
1312
Spinning Future Threads
Foreword
Fashion’s material mix is ripe for disruption - and the emergence of innovations over the last few years is testament to this. From grow-ing fibres in petri dishes, to extracting them from food waste and textile waste; the possibilities are endless. These innovations signal a beacon of hope for an industry that is today so heavily reliant on unsustainable fibres that are harming people and the planet. Agriculture-residue based fibres are one such class of innovations that holds promise and could potentially speak to dual objectives. One, as a solution to the fashion industry’s search for alternatives and in parallel, a pathway for millions of farmers who burn their crop residues and set off dangerous levels of emissions for the want of better options. Inno-vators have been working to iterate the technical capabilities to suit the fashion industry’s requirements. However, the industry’s use of them at commercial scale rests on uncovering critical links to feedstock avail-ability, quality, and downstream logistics. The use of agriculture waste as a source for fashion materials is still a niche and it is ever so critical that the system is designed right, from the start as one that is techni-cally fit-for-purpose while also valuing the planet and producers at the core, ensuring that they are not left worse-off in the future. To this end, Laudes Foundation commissioned this study undertaken by a consortium consisting of the Institute for Sustainable Communities, Wageningen University & Research, and the World Resources Institute to identify agro-residue hubs in South and Southeast Asia, map out the logistics and technical requirements to move unused agro-residues into fashion’s fibre mix, and begin to examine the case for producers while outlining any unintended consequences of doing so. The study shows that there is sufficient crop residue that can be channelled to fibre pro-duction and underscores the importance of collaborative interventions across the agri-food and fashion systems to enable this at scale. It lays out the initial building blocks for a blueprint to help the industry navi-gate this transition. The study provides a stepping stone for innovators to forge ahead on designing pathbreaking solutions, practical guidance for manufacturers to integrate agriculture residues in their supply chains, a roadmap for brands to move from thought to action, and insights to drive participa-tion of civil society and producers to co-create this system. As Laudes Foundation pushes forward on its journey to foster a just and regenerative materials system, we know that we must purpose-fully stitch together unlikely alliances to scale truly innovative solu-tions that recognise the larger issues of climate and inequity. It is only with our collective efforts that we will be able to unlock the necessary investments to transform fashion’s material mix. We hope that this research inspires stakeholders to act towards this vision.
Lakshmi PotiSenior Programme Manager, Materials Laudes Foundation

1514
Spinning Future Threads
Executive Summary
A booming industry, an unstable resource base, and a call to action
The global textile industry has grown by leaps and bounds, boosted by population growth, a booming global middle class, rising income levels, and the proliferation of fast fashion.
In parallel with this stupendous growth, concerns related to water, energy, chemicals and resource management have come to the forefront, fuelling a drive towards sustainable fashion. Sustainability considerations are being elevated across the entire value chain, from raw materials, to efficiencies of production, transport and use, to closing the loop on recycling and reuse.
The current fibre mix in the textile industry is not sustainable. Synthetics rely on fossil fuels, heavy processing, and intensive chemical use. Recycled fibres – whether from textile waste or alternative regenerative processes – show promise, but so far lasting, long-term solutions remain elusive. Even traditional natural fibres like cotton, linen, hemp, etc. face major challenges. Cotton is the largest tex-tile commodity under cultivation, and conventional cotton relies on intensive water and chemical use, and intensive land use. Major cotton growing areas in Asia and Africa face increasing vulnerability to cli-mate-driven shocks and stresses, and conventional cotton’s future sustainability as a textile feedstock is highly uncertain.
Agro-residues: a new and promising part of the solution
An industry-wide hunt for newer, better materials indicates that bio-based alternatives show great promise. As this study shows, regions like South Asia and Southeast Asia, already critical natural fibre pro-ducers and textile hubs, generate massive amounts of potentially usable – and currently unused or under-used – agricultural waste products, by-products and residues (“agro-residues”). Several areas where agro-residues already coincide geographically with existing or potential processing capacity, present ready-made avenues for directing these residues towards productive uses. Activating this value chain offers great potential to: decrease extensive crop
burning and its associated negative environmental and climate impacts; generate new, additive low-cost revenue streams for low-income agricultural commu-nities in South and Southeast Asia; and, activate a new, scalable and more environmentally sustainable source of fibre for the booming apparel and fashion ndustry.
Systematically quantifying the true potential of agro-residues
This report synthesizes the findings, insights and outcomes from comprehensive quantitative and qual-itative analyses to assess the physical, technological and economic feasibility, and long-term viabili-ty, of agro-residue-based cellulose and fibre value chains. The study focused on existing innovations and technologies for producing agricultural fibres and manmade cellulose fibres (MMCFs) for use in textile manufacturing. A combination of methods, including statistical analysis of secondary databases; GIS map-ping; ground validation exercises; and stakeholder consultations; were used to assess the pre-feasibility considerations – including and especially, environ-mental sustainability – and develop a set of actionable recommendations for implementing and scaling up these alternative value chains.
Eight countries in South and Southeast Asia – Bangladesh, Cambodia, India, Indonesia, Pakistan, Sri Lanka, Thailand and Vietnam – form the geographic scope of the study. These were selected due to their abundant biomass resources (especially agro-residues), large textile manufacturing output, and status as current and future global economic growth centers.
Key study findings and outcomes
The study generated the following key findings and-outcomes:
• Several existing technological innovations have already demonstrated early promise in pro-ducing usable textile fibres from sustainably sourced agro-residues from agricultural products like banana, citrus, mushrooms, pineapple, etc.

1716
Spinning Future Threads
• Unused or under-used agro-residues are already present in South and Southeast Asia in massive quantities, including large-scale avail-ability of rice (husk and straw), wheat (husk and straw), empty fruit bunches (EFBs) from oil palm, sugarcane bagasse, and banana plantains.
• A spatial mapping analysis identified at least ten specific locations in South and Southeast Asia where large-scale availability of existing agro-residues coincides with existing or poten-tial processing capacity, indicating that hubs for converting agro-residues to textile fibre at scale could be established with a biomass sourcing radi-us of 100 kms, and in some cases, of just 50 kms.
• Cost projections vary and require further vet-ting through pilots, but are favorable. The lowest cellulose-based biomass extraction-plant gate cost is projected at USD 63 per tonne of cellulose, with the upper end of the range at USD 160 per tonne.
• Potential socio-economic and environmental consequences of establishing agro-residue value chains appear to be minimal, and in fact, these value chains appear to offer considerable positive socio-economic and environmental benefits in terms of diversifying agricultural revenues without sig-nificant additional investments, and reducing the harmful effects of crop burning and disposal1.
In short, the findings of this report present a strong foundation for mainstreaming agro-residues in textile fibre and apparel production, and highlight existing opportunities to pursue a deliberate tran-sition strategy. Following the sections that detail the methodologies employed in the study and a discussion of the findings and implications, this report offers a roadmap that highlights existing opportunities and steps that could be taken to pursue a thoughtful and deliberate approach to activating agro-residue value chains, and pave the way for industry and brand pilots to mainstream these new approaches.
Priority questions for the study
• Which agro-residues contain usable fibres, obtainable through existing or promising processes?
• Where are these agro-residues available and accessible in large quantities?
• Where do they overlap spatially with existing or potential processing capacity?
• What are the cost, technical and logistical factors involved in converting agro-residues to usable feedstock?
• What are the socio-economic, environmental and sustainability considerations?
1 As noted in “About This Report” above, the authors acknowl-edge and understand extant concerns about the large-scale use of biomass, and reiterate here their overriding commitment to ensure that any decision to commercialize new approaches should be governed by the principles of: maintaining ecolog-ical balance in the regions where they will be implemented; ensuring that they will enhance, not encumber, local livelihoods; and, respect the planetary boundaries that govern all natural resources.

2Titel
1Background and Scope

2120
Spinning Future Threads
1.1 Context
Apparel production: A huge influence on envi-ronmental resource consumptionClothes constitute a basic need, and the textile and clothing industry meets this need with a staggering volume and variety of products. In the last decade, this industry has grown by leaps and bounds, bol-stered by megatrends like a growing global popula-tion, increasing income levels, “fast fashion”, rapid urbanization and rapidly maturing markets in the Asia-Pacific. In 2019, the global textile industry was valued at $1.9 trillion and by 2030, it is estimated to touch $3.3 trillion (Pulse of the Fashion Industry 2019). Textile production places a large demand on resources like water, energy, chemicals, as well as sources of fibre feedstock both natural and synthetic. Globally, total fibre production has doubled in the last twenty years and in 2019, it crossed 111 million tonnes, the highest point to date. By 2030, this is expected to grow by nearly 35 million tonnes, as per
pre-COVID estimates (Textile Exchange 2020). Of this, synthetic fibres such as polyester, polyamides and nylon form nearly two-thirds, with the remain-ing shared between natural and manmade cellulosic fibres (MMCFs). An unsustainable fibre mixThe current fibre mix in the textile industry is not sustainable. Synthetics, despite their low prices, conducive properties and wide range of applications, are not viewed favourably due to their fossil fuel origins, heavy processing requirements and inten-sive chemical use. As the larger global sentiment shifts decisively towards conscious consumption and production, natural fibres such as cotton, linen, hemp, ramie and jute are seeing a resurgence among consumers. The latest figures estimate that the global cotton production is around 26 million tonnes, with over 80 countries involved in its culti-vation (OECD/FAO 2020). However, only one-fourth of this volume is cultivated using sustainable, and
1 Background and Scope environmentally and community conscious measures like Better Cotton Initiative (BCI), Fair Trade, Organic Cotton, International Sustainability and Carbon Cer-tification (ISCC) and others (Textile Exchange 2020). Conventional cotton continues to have the largest share in total cotton production, with prevailing practices relying on high water demand, heavy chemical dependency, intensive land use and forced labour. (CottonUP; US Department of Labour 2020; WWF). With several low- to middle-income coun-tries in Asia and Africa engaged in cotton cultivation and also having greater vulnerability to climate risks, its future as a textile feedstock relies on its ability to transition to sustainable production practices.
MMCFs, which are natural polymer structures devel-oped from cellulose sources (mainly wood and bam-boo) through a pulping and extrusion process, are viable alternatives to natural and synthetic fibres. Viscose, lyocell, modal and cupro provide significant functional advantages over natural fibres and have much lower processing requirements than synthetic fibres. Since the 1990s, MMCFs have more than doubled their market share in terms of output from three million tonnes (Fashion for Good 2020), and are projected to grow at a six percent CAGR in the next three years (Textile Exchange 2020). MMCFs produced using closed loop processes, such as EU’s BAT and ZDHC’s MMCF Guidelines, and sustain-able forestry standards offer sustainable options. However, two major issues plague MMCFs: first, responsible sourcing, as they require large-scale forest fragmentation and deforestation, a third of which takes place in ancient and endangered forests; and second, proper management of hazardous chemicals used in processing through re-use and recycling (Canopy Hot Button Report 2020).
This largely linear production model places a huge burden on virgin resources, energy and the environ-ment, thus prompting a shift to recycled alternatives, including used textiles. rPET, or recycled polyester, utilises existing pre- and post-consumer plastic waste2, to produce fabrics and retains most of the
qualities of virgin polyester. From 2009-2019, the market share of rPET in the apparel and garment industry has grown from 9% to 14%, propelled by the growing athleisure trend in garments, footwear, jackets and bags. Textile wastes, including post-in-dustrial scraps, used garments, vehicle upholstery and household items, also find use as raw materi-als for textile production. Globally, the recycling of textiles is slow on the uptake, with only 12% of the material used for clothing and textiles undergoing downcycling or cascaded recycling3, and less than 1% following closed loop recycling4 (Ellen MacArthur Foundation 2017). Nike, H&M and Patagonia are some brands driving initiatives for the collection and recycling of used textiles.
The jury remains divided on “how much” better are these recycled alternatives. Although recy-cled materials are driven by the principles of circular economy5, they do not provide a complete solution. A major sticking point surrounding recy-cled fibres is the discrepancy in calculating their overall environmental impact – current calculations methods do not account for their first life impacts; if these were to be included, then a different picture would emerge (Rengel 2017). Besides this, the recycling process has limited iterations. Each itera-tion in the mechanical recycling process causes the original fibre to lose critical properties like strength, durability and elasticity, necessitating reinforcement through intensive chemical processing and blending with virgin raw materials (Brancato 2008).
A search for better alternatives and new starting materialsThese alternatives answer only a part of the most important question faced by the textile industry, and the world at large: how can the global textile industry lower its harmful impacts and become more sustainable? On its present growth trajectory, characterised by destructive megatrends like rising demand, mass production and limited re-use and recycling, by 2050 the textile industry will have: consumed 300 million tonnes of non-renewable
In the next decade, the global textile industry is estimated to grow by ~42% in value...
... and place an increasing demand on raw materials as textile feedstocks...
... whether, natural or chemical in origin. The current textile fibre mix is unsustainable - high fossil-fuel dependency, combined with extraction of virgin sources.
2019
2030
1.9 billion USDGlobal textile industry
value in 2019
3.3billion USD
Estimated value by 2030
>111 million t
Global fibre production in 2019
~136 million t
Estimated volume by 2030
Global fibre mix in 2019
~63% ~29%
~6.4% ~1.4%
52% is Polyester(others include polyamide,
PET, PLA, etc.)
23% is Cotton(others include hemp,
jute, kenaf etc.)
79% is Viscose(others include acetate,
lyocell, modal etc.)
71% are wools(others include down & other feathers, silk etc.)
Regenerated cellulose fibres, or MMCFs
Animal-based fibres (wools, down & silk)
Synthetic fibresCotton and plant-
based fibres
2 rPET can be made from both post-industrial and post-consum-er wastes such as plastic bottles, ocean waste, pre-processing fabric scraps and discarded polyester clothing.
3 This refers to the recycling of clothing into lower value applica-tions like insulation material, wiping cloths or mattress stuffing.
4 This refers to the recycling of clothing into the same or similar quality applications.
5 While enabling a circular economy, such alternative uses of recycled bottles may not address the primary issue, i.e., the unsustainable, mass production of these products, in the first place.

2322
Spinning Future Threads
inputs6; taken up 26% of the carbon budget asso-ciated with the 2⁰°C pathway; and added 22 million tonnes of synthetic microfibres to the world’s oceans (Ellen MacArthur Foundation 2017). The profitabil-ity of the industry also faces dire prospects – by 2030, textile brands could face profit losses of up to 52 billion USD per year in the business-as-usual scenario (Pulse of the Fashion Industry 2017). These projections inject extraordinary urgency into a drive to alter this course and ramp up efforts to identify, support and scale alternative, low-impact and sus-tainable innovations through coordinated action.
Bio-based materials innovations: Unlocking the potential in South and Southeast AsiaSeveral distinct solutions have been outlined to achieve sustainability in textile production – among them, materials innovation stands out in terms of promise. The appeal for materials innovation lies in the fact that it looks closely at the root of the textile sustainability conundrum, and provides solutions from the bottom up. In a recent global survey, close to 67% respondents from the fashion industry indicated that using innovative and sustainable material mixes is an important focus area for their brand (The State of Fashion 2020). Global brands are exploring alternatives to the standard material mixes in textile production to include more sustain-able substitutes that can still perform on function and aesthetics. Leading experts postulate that future research and development efforts in textiles will increasingly focus on material sciences in the search for new fibres and textiles that can be scaled. At present, innovations in developing novel biomass materials or unique combinations of existing mate-rials in textiles take place at a smaller scale, often restricted to the laboratory and pilot stages. A few of these have reached commercial level, backed by global brands like BESTSELLER x Spinnova, Tommy Hilfiger x Frumat and Adidas x Bolt Threads.
A recent but surging trend within this space is the industry’s spotlight on bio-based materials. In the last few years, rising industry-wide consciousness and acknowledgement of consumer perceptions and ethical/environmental concerns are driving textile innovators and brands to greater efforts to identify sustainable alternative materials, especially those with natural origins.
Currently, several mainstream textile materials are bio-based including cotton, silk, wool, linen, leather and jute. While plant-based or cellulose fibres are generally preferable over those that are animal-based, the former still incur significant environmental costs in terms of water, energy and nutrients. An evolved understanding of product sustainability in textiles, encompassing the entire life cycle – from raw material extraction, to land use change, to manufacturing, and then to transporta-tion, end-use and disposal (Amos 2019) – under-scores the need for bio-based “alternatives.” The industry needs more sustainable options that utilise existing and available plant-based biomass, require no additional resources from their journey as raw material to textile fibre, and have overall lower production impact vis-à-vis traditional production processes. Wood-based residues are a source of bio-based alternatives being used in textiles (Forest for Fashion 2017), but there are concerns around their sourcing, and ecological as well as carbon impacts constrain their solution potential.
Some textile innovators like AltMat, Orange Fibre, Green Whisper and Agraloop, in collaboration with Fashion For Good’s Innovation Programme, are exploring bio-based alternatives through propri-etary products, processes and technologies that have been successful in producing cellulose pulps or fibres from pineapple leaves, hemp, citrus fruit waste, banana stem and food-crop waste (flax and hemp), respectively. These pulps and fibres are then used in manufacturing textiles and garments. Each of these innovators, along with others in this space, relies on a specific bio-based feedstock and operates at small scale.
Another promising domain within bio-based textile alternatives that has yet to be thoroughly explored, is – agricultural residues and waste (see Box 1.2 for definition).
Agro-residue biomass is a by-product of agricultural activities and can be found in abundance across the world. Sustainable management of these residues is among the key challenges accompanying a grow-ing agricultural sector. Particularly in Asia, which accounts for 63% of global agricultural value and has the largest share of cropland (~38%), abundant volumes of agricultural residues pose a formida-ble environmental threat. The inability of agrarian communities to re-use, dispose of and manage these large volumes of residues, leads them to opt for low-cost, low-effort options like mass burning to clear their fields for the next season. Domestic uses like fuel, fodder, animal bedding, mulching and composting, and even industrial uses, can only utilise a small part of these residues. Countries in South and Southeast Asia that depend heavily on agriculture, are particularly vulnerable to environ-mental damage and pollution resulting from large-scale residue burning.
In India, which is the second largest agro-based economy in the world and employs a year-long cultivation system (FAOSTAT 2020), 500 million tonnes of agricultural residues are generated annu-ally. After their utilization as fuel, fodder and other domestic and industrial uses, a surplus of about 140 million tonnes of residues remains, of which about 92 million tonnes are burnt7. For most farmers, residue burning is a convenient route with negligi-ble costs for preparing the field for the next sowing
6 Non-renewable inputs comprise of oil for producing synthetic fibres, fertilisers to grow cotton, and chemicals for producing, dyeing and finishing fibres and textiles.
7 Estimates by Ministry of New and Renewable Energy, Govern-ment of India.
season, as opposed to hiring combines to remove residues. A study by the Indian Agricultural Research Institute estimated that residue burning releases 149.24 million tonnes of carbon dioxide, 9 million tonnes of carbon monoxide, 0.25 million tonnes of sulphur oxides, 1.28 million tonnes of particulate matter and 0.07 million tonnes of black carbon each year (Jitendra et al. 2017). This adversely affects air quality levels in the region, and especially for nearby towns and cities, endangering both the environment and society.
This problem is not limited to India. Due to high agricultural dependency in South and Southeast
Box 1.1: Understanding “bio-based” materials
There is a growing buzz around “bio-” prefixed terminology, some of which includes bio-materials, bio-based, bio-design, bio-fabricated and bio-assembled. While there is a high chance of generalization, ambiguity and erroneous usage of these terms, each carries distinct meanings and implications, which are covered with refreshing clarity and depth in a recently published report (Biofabricate and Fashion For Good 2020).
For the purposes of this study, the authors define bio-based materials or products as those that are “wholly or partly derived from biomass, such as plants, trees or animals (the biomass can have undergone physical, chemical or biological treatment)”, as outlined by the European Committee for Standardization European Committee (“Bio-based products”).
Box 1.2: Defining agricultural residues and waste
Generally, agricultural wastes refer to waste materials derived from agricultural operations. The United Nations defines agricultural waste to include manures and other wastes from farms, poultry houses and slaughterhouses; harvest waste; fertilizer run-off; pesticides entering water, air and soil; and, salt and silt drain from fields (Nagendran 2011; UN 1997; OECD 2011).
In this study, agricultural waste and residues (or agro-residues) will primarily refer to harvest residues, also known as crop residues. Crop residues comprise both field residues and process residues. The first refers to the residues left in the agricultural field or orchard after the crop is harvested; some examples are stalks, stubble (stems), leaves and seed pods. The latter refers to the residues left after the crop is processed into a usable resource; common examples are sugarcane bagasse and molasses (Agamuthu 2009; Hoornweg and Tata 2012; Obi, Ugwuishiwu and Nwakaire 2019; UN 1997).

2524
Spinning Future Threads
Asia, several countries including Indonesia, Myanmar, Vietnam and Bangladesh also opt for the slash and burn method of agriculture. The mass burning of agricultural residues and forests (specifically, oil palm plantations in Indonesia) caused the infamous Southeast Asian Haze in 2015. A study estimated that in the period from September to October 2015, the total carbon emissions from these fires was 0.23 million tonnes, of which 83% was carbon dioxide, 16% was carbon monoxide and 1% was methane (Huijnen et al. 2016). Once environmental aberrations, these events are becoming more commonplace and have long-lasting and negative ripple effects on the envi-ronment and quality of life.
Identifying, supporting and scaling up innovations that use agro-residues as a bio-based alternative feedstock for producing textile fibres, can provide a solution to most of these issues. Several studies have found these residues to be readily available lignocel-lulosic alternatives to mainstream plant fibres like cotton due to their similar structures, composition and properties. These properties can support the use of agro-residues in applications like textile, paper and packaging. Some of the major lignocellulosic crop residues are wheat straw, rice straw, barley straw, corn stover, sorghum stalks, coconut husks, sugarcane bagasse, pineapple leaves and banana leaves (Adhikari, Nam and Chakraborty, 2018; Panthapulakkal and Sain 2015).
With advances in textile material innovations, specifically those involving crop residues, there lies an unexplored pathway to developing mutually beneficial solutions to drive sustainability and reduce the impact of the textile industry as well as the agriculture sector. For South and Southeast Asian countries with growing market economies, rising spending levels and resource abundance, these material innovations can prove to be strong drivers for economic development and sus-tainable growth in the region. Grounded in conscious consumption and production, these innovations offer unique potential to advance systems-level thinking and dismantle a traditionally silo-based approach to achieving sustainability goals, generating co-benefits for a large number of stakeholders. Subsequent sec-tions will expand on this opportunity and delve deeper into the technical and economic feasibility of textile innovations using agro-residues as fibre feedstock, with a specific focus on South and Southeast Asia.
1.2 Scope of the study
1.2.1 Overview This report is the outcome of a detailed assess-ment of the geographic scope, technological and economic feasibility, and commercial viability of using agricultural waste and residues as alternative sources of raw materials to produce textile fibres. A key driver behind this assessment is to address the high synthetic material dependency of textiles and promote sustainability in textile production, by exploring alternative natural sources through map-ping economical value chains, fostering innovative technologies and supporting industrial applications. The goal is to identify and enable practicable, inno-vative solutions that enhance resource efficiency and reduce the environmental burden of the textile industry.
The report focuses on identifying cellulose-based biomass sources for two types of textile fibres – agricultural fibres and manmade cellulose fibres (MMCFs). Other types of fibres, like animal-based fibres and synthetic fibres (made by polymeriza-tion of monomers to polymers like polyamide) are not part of the study scope. Biomass sources from agricultural waste streams and crop residues found in eight South and Southeast Asian coun-tries – Bangladesh, Cambodia, India, Indonesia, Pakistan, Sri Lanka, Thailand and Vietnam – form the geographic scope.
The assessment involved rigorous scientific efforts, primary and secondary research and analysis, GIS mapping, ground validation exercises, stakeholder consultations, and overall viability assessment to ensure a high degree of practical value in the proj-ect’s findings and recommendations.
1.2.2 Approach and Methodology
1.2.2.1 Technical viability assessment The starting point for this report on technical viability was the publication “Textiles for Circu-lar Fashion Part 1: Fibre Resources and Recycling Options” (Harmsen & Bos 2020). This was supple-mented with desktop review and secondary liter-ature study. A basic classification of textile fibres is made on the basis of biomass into agricultural fibres, MMCFs and bio-based synthetic fibres. Along
with this, an overview of current state-of-the-art processing routes for fibre production are described. Finally, the current landscape of various innovators in the fibre processing and textile manufacturing field is developed using inputs from the stakeholder consultations (see Section 1.2.2.4).
1.2.2.2 Statistical and Spatial analysis of residuesA detailed statistical analysis of existing databases on agricultural production and land was carried out to identify suitable crop residues from the study regions, and was then spatially analysed to identify the best hub locations. Existing secondary databas-es like FAOSTAT 2018 were statistically analysed, and gaps were supplemented by primary methods like stakeholder consultations. A five-step meth-odology was developed to carry out the statistical assessment.
Selection of suitable agricultural residues from the eight countriesAs a first step, it was critical to outline and define the two major types of residues, primary and secondary (see Box 1.3).
A systematic quantitative assessment of the most recent data (from FAOSTAT 2018) on total agricul-tural production volumes (in tonnes, t) and culti-vation areas (in hectares, ha.) was carried out to understand the major crops in each of the eight countries.
Box 1.3: Defining primary and secondary agricultural residues
Agricultural residues (also called crop residues or agro-residues) in this study are distinguished into two categories: primary and secondary. Primary agricultural residues are found at the source where they are produced, like agricultural fields, plantations or orchards. These residues consist of the biomass that remains after the main product of the crop (for e.g., fruit, grains) is harvested. Some examples are straw, stalks, stubble (stems), leaves, prunings and seed pods.
Secondary agricultural residues refer to the residual biomass that remains after the crop is processed into a commodity at the processing mill. Common examples of these are sugarcane bagasse and molasses that are co-products of the sugar extraction process and are found in sugar mills. Similarly, when rice is processed it is de-husked, which results in secondary residues in the form of husk. After the rice is polished to produce white rice (final product), the resulting secondary residue is bran.

26
Spinning Future Threads
27

2928
Spinning Future Threads
From this, a longlist of top crops was developed by selecting the most important crops in terms of production volume and area under cultivation. The authors ensured that the top crops of all eight countries were captured. For the top 30 crops on this list, the primary and secondary residues were identified and their technical potential was assessed (see Box 1.4). These were also further characterised in terms of cellulose and fibre content.
The longlist of residues was further narrowed down to a shortlist by using certain pre- determined criteria for biomass following the two main processing routes: cellulose based and fibre extraction. The criteria for each route are:
For cellulose pulp• At least 30% cellulose content• Availability of at least one million tonne/year/country• Reasonable expectation of a large unused residue
potential
For fibre extraction• Degree of polymerization, or DP, should be
over 2500• Should belong to a fibre plant family• Should be identified in literature as suitable for
fibre extraction
For cellulose pulps, the last criteria on large unused potential implies that the residual biomass is likely to have limited competing uses, and/or its conver-sion into textiles would be an acceptable alternative sustainable use option. A large unused potential is particularly evident when the selected crop residues are being burnt on the field.
For fibre extraction, the minimum availability of residues was set much lower, because the sizes of fibre extraction plants can be much smaller than for cellulose dissolving factories (see Box 1.5 for exam-ples of larger existing factories)
In this study, hub identification was done by defin-ing different mill sizes for cellulose dissolving plants on the basis of their production capacities. Building on the findings presented in Box 1.5, the follow-ing mill sizes were defined – for fibre extraction, a standard mill size of 100-1000 tonnes of fibre per year; and for the cellulose dissolving plants, three
Box 1.4: Assessment of the technical potential of the residual agricultural biomass
Technical potential represents the absolute maximum amount of residual biomass that is potentially available in the field (in case of primary residue) or at the processing mill (in case of secondary residue), by assuming the absolute minimum of technical constraints and the absolute minimum constraints from competing uses and sustainability constraints. It is calculated using the following formula:
Residue yield [t/dry matter] = crop area [ha] * yield [ton/ha] * RPR [-] * DM_content [-]
Here,
• Crop area is derived from FAOSTAT 2018 figures for each country.
• Yield level of the main product (like grains for cereals, sugarcane stems etc.) is derived from FAOSTAT 2018 figures for each country.
• RPR levels are derived from different sources (see Annexure 1 for details on the values used per crop).
• DM content stands for dry matter content in the crop (see Annexure 1 for levels used per residue).
Residue-to-product ratio (RPR) refers to the ratio between main crop product (e.g., grains, sugarcane stalk) and the amount of residue (e.g., the straw or trash) in kg dry matter (dm) per tonne. The RPR ratios used in this study are based on former studies done by WUR in different countries in the world. The RPR ratio therefore refers to an average and does not take into account specific crop varieties or local production factors. This technical residue potential is applied to make a first selection of crop residues with large technical abundance in the eight focus countries of this study.
sizes were outlined:I. Small-scale mill, which produces 75 kilotons of
cellulose per year. II. Medium-scale, or intermediate mill, which pro-
duces 150 kilotons of cellulose per year. III. Large-scale mill, which produces 500 kilotons of
cellulose per year.
To bring into perspective the biomass demand for the different mill sizes: assuming that at least 30% of the cellulose can be extracted from residual bio-mass sources, the large size mill will require at least 1,600 kiloton dm biomass each year. Large size mills with this demand quantum are expected to strongly impact the local market for residues. Additional-ly, such biomass requirements cannot be fulfilled
Box 1.5: Examples of existing cellulose dissolving pulp factories and production capacity
by sourcing only one type of agricultural residue. Keeping this in mind, the delivery chains designed in this study also review the option of combining different types of agro-residues that can be sourced to a cellulose dissolving plant. Pre-treatment plants at intermediate stages are also set up to densify, dry and store the biomass before it is further transport-ed to the cellulose dissolving mills (see Section 4.1). Spatial analysis to identify hub locations The final selection of residues, as discussed in the previous section, was the starting point for the spatial identification of hub locations. Based on the three sizes of cellulose dissolving plants (small, medium and large), a minimum demand for biomass was specified for each type of residual biomass on
While around 7% of the world’s virgin cellulose pulp comes from non-wood vegetal sources (van Dam et al. 2018), the use of primary residual biomass from crops is still very limited. Most of the current vegetal sources come from harvested crops that are deliberately grown as feedstock, such as bamboo or eucalyptus. Mills that extract
cellulose from wood or other renewable sources are generally range in size from 75-850 kilotons of cellulose production per year (see table below). These are mostly based on woody biomass sources (rich in cellulose, easy to transport) and are mostly aimed at producing cellulose pulp for the paper and viscose industry.
The largest factory is the SAICCOR mill in South Africa, using a sulphite process. The most recent expansion of this mill makes it possible to produce 800 kilotons of dissolved cellulose pulp per year. The feedstock used in this mill is eucalyptus
wood grown at relative near proximity in Durban, the location of the SAICCOR mill. SAICCOR is only suitable for woody feedstock, and it is not realistic to assume a similar mill size for sourcing agricultural residues.
Location Biomass source Production capacity of cellulose pulp [Kton cellulose/year]
Portugal Eucalyptus wood 115
Laos Local Wood 250
Finland Wood 430
South Africa Wood 850
Table 1.1: Examples of existing cellulose dissolving pulp factories and production capacity

3130
Spinning Future Threads
the basis of its cellulose content. For fibre extraction, the minimal demand for biomass in a hub location was assumed to be between 100-1000 tonnes of fibres per year; a real minimum demand was not set. Ideally, locations selected for sourcing yearly biomass quantities were mapped withing a radius of 100 kms. Therefore, the biomass density and total amount per region, in combination with the mini-mum capacity of the extraction mill, were critical in determining the best hub locations.
Using a geographic information system (GIS) analy-sis, the most promising hub locations were selected for the proposed biomass delivery chains for the eight focus countries. The spatial analysis involved mapping agricultural residues –primary residues, which rely on the RPR of the main crop yield, were distributed using the spatial crop production data from MAPSPAM; for secondary residues, like sug-arcane bagasse and empty fruit bunch (EFBs) of palm oil, the locations of the sugar mills and palm oil plants were included respectively, and residue availability spatially linked. The combined informa-tion from these inputs was used to identify the most promising hub locations. The final locations were typically those having the largest and most concen-trated availability of the shortlisted residual biomass in the focal countries.
A detailed discussion on the use of MAPSPAM and the techniques adopted for developing spatial maps is given in Annexure 4.
1.2.2.3 Cost assessment for at-gate delivery of biomass for cellulose and fibre extractionBased on the initial review of the suitability of agro-residues for cellulose and/or fibre extraction, and the size of the technical potential available in every hub location selected, a few general delivery chain designs were developed for the sourcing of residues. These chain designs formed the basis for carrying out the cost calculations for delivering the residual biomass from the field (primary residues) or the mills (secondary residues), to the gate of the cel-lulose dissolving or fibre extraction plant in the hub.
The major factors considered for cost assessment include the following:I. Purchase cost of the biomassII. Compensation cost for the loss of nutrients lost
from the field due to residue removal III. Up and off-loading cost when the biomass is
transportedIV. Densification cost in case of intermediate con-
version to pellets before long distance transportV. Storage cost in case biomass is not available
year-round because of seasonality, despite the need to keep the cellulose dissolving mill opera-tional year-round
VII. Transportation cost, which can be local, short and long distance.
It was assumed that currently unused residues are available for sourcing. Part of the residues are left on the land as fertiliser and part of the residues is burned to obtain heat and power for the processing of the main product from the biomass. In practice, other biomass that is less suited for the production of cellulose can be used for these purposes. This allows significantly larger availability of biomass residues. It is also possible to use by-products resulting from the cellulose and fibre extraction process as fertilisers and/or energy sources.
In the chain cost assessment, the return transpor-tation cost was also included when the remnants of the biomass after extraction of fibres were suitable to be brought back to the fields as fertilizers. If this is not possible, an additional cost was allocated for fertiliser to compensate the farmer for the nutri-ents removed in the residue (see Section 4.2 and Annexure 5 for details).
1.2.2.4 Stakeholder mapping and consultationsThe findings for the above components are based on the review of existing secondary databases and pro-vide a strong, data-driven foundation for developing alternative sourcing models. It was critical to contextualize their applicability enhance through validation against on-ground realities. As agro-res-idue value chains rely on high interdependencies between the agriculture sector and textile industry, particularly in agrarian communities and relat-ed social entrepreneurship initiatives driving rural livelihoods, stakeholders’ insights and perspectives are indispensable. These were captured through stakeholder consultations.
Stakeholder mapping and analysisAn extensive mapping exercise was carried out
to identify a heterogeneous mix of stakeholders, representing diverse needs, influences and inter-ests associated with the residue-based value chains. Preliminary examination of relevant literature was used to identify 11 major stakeholder groups and their geographic scope (see Figure 1.2). These stakeholders include both those who affect, and are affected by, a decision or action, whether potentially or currently.
An evaluation of the unique “stake” of these stake-holders, which is a combination of interests and
influences, was carried out (see Annexure 6). These stakeholders were classified into three levels – primary, secondary and tertiary – depending on their ability to influence and operationalize alternate value chains based on agro-residues (see Figure 1.3). These stakes were further analysed to devel-op an interest-influence matrix to ascertain the level of importance of each stakeholder (see Annexure 6). This provided an understanding of the socio-economic dynamics for managing resources, and highlight the stakeholders with a comparatively dominant position in the ecosystem
Figure 1.2: Identified stakeholders and their geographic scope
Local / Regional Pan-regional / Global
Farmers/Farmer cooperatives Textile processors and manufacturers
Logistics network, including transport, storage etc. Technology developers
Industry associations Social and environmental experts
Apparel brands Start-up organizations
Agricultural experts Textile innovators and design experts
Government and its agencies
TERTIARY STAKEHOLDERS
SECONDARY STAKEHOLDERS
PRIMARY STAKEHOLDERS
OBJECTIVE
Industry associations, Retail apparel brands, Start-ups, Govt agencies, Social & environmental experts
Logistics (transport, storage), textile mills and processing plants, agricultural experts
Farmers, textile innovators, technology developers
Viability of use of agri-residue as textile
fibre feedstock
Figure 1.3: Classification of identified stakeholders across three levels

3332
Spinning Future Threads
of residue-based textile value chains. Additional-ly, this helped identify non-central groups, and in developing strategies on how best to ensure their representation (Reed et al. 2009). Stakeholder consultationsFollowing the mapping and analysis, a comprehen-sive consultation plan was developed to gather the insights, perspectives, interests and experiences of the diverse stakeholder groups on the differ-ent factors related to the alternate value chains. Consultations were facilitated by questionnaires, developed to gather contextual and sectoral information on various aspects such as agricultur-al practices and systems; specialization in inno-vation and technology; textile fibre production; commercialization and market prospects; socio- economic implications; and the impact of climate change (see Annexure 7 for the question sets).
These consultations were conducted virtually via video-conferencing or through telephone calls due to COVID-19 mobility restrictions and other resource constraints. On occasion, these conversations were captured through recordings and interview notes. The stakeholder consultations were also helpful in filling in information and data gaps in the existing secondary literature like competing uses of residues, labour costs, fuel costs, local agricultural practices, fertilizer prices and local infrastructure for logistics. 1.2.2.5 Pre-feasibility and Landscape AssessmentInformation on dominant trends, sectoral perspec-tives and contextual influences gathered through the stakeholder consultations was used to conduct a current landscape assessment for implement-ing agro-residue-based value chains for textile fibres. A pre-feasibility assessment was carried out to capture various factors affecting the alternative value chains that can act as barriers and oppor-tunities (both potential and existing). These were categorised into five main pillars – agriculture; technology, design and innovation; processing and manufacturing; commercialization and scaling-up; and, socio-economic and sustainability perspectives (see Section 4.3). While some of these insights were more local and context-specific in nature (for e.g., agricultural practices, local infrastructural arrange-ment, existing market relations, pricing consid-
erations and stakeholder networks), others were pan- regional (for e.g., advancements in innovations, fibre development techniques and industry outlook). For some factors, their potential effect on the pro-posed alternative biomass value chains will vary with time and regional developments.
1.2.2.6 Assessing the impact of climate change and environmental externalitiesClimate change poses one of the biggest uncertainties globally. The resulting effects are crucial determinants in assessing possible threats and identifying vulnerabilities for the alternate value chains for textile fibres. Changes in climate variables like minimum and maximum temperatures, annual precipitation, amount of rainfall received per day as well as the moisture stress index, were analysed using predictions from an Ensemble Climate Model for RCP 4.5 scenario, for a medium-term scenario of 2040-59, as compared to baseline levels9. Besides this, the effects of climatic and environmental externalities on the selected crops across the focal countries – including the effect of disaster and diseases, the consequences of different cultiva-tion practices (like monoculture), crop and residue burning and pesticide use that affect crops and by consequence, the agro-residues – were analysed. A comprehensive table providing insights on the impacts of climate change on shortlisted crops and their farming in the eight countries, the associated challenges, as well as emerging trends in promis-ing in-country practices to build resilience against climate impacts, can be found in Annexure 8.
These analyses provide a macro-level picture of ways in which climate change, environmental conditions, and changing practices can affect the proposed biomass chains. An in-depth environ-mental impact analysis of these value chains will require a detailed life cycle assessment. This is not possible presently due to inadequate information on the impact of different processing stages, as well as the overall impact on the environment. Such assess-ments will become feasible when this sub-industry matures, and products made with these biomass residues near the end of their life cycles.
9 All Climate Projections arrived using Climate Change Knowledge Portal of World Bank Group. https://climateknowledgeportal.worldbank.org/

2Titel
2Understanding Fibres, Processing and Innovations

3736
Spinning Future Threads
2 Understanding Fibres, Processing and Innovations
2.1 Fibre classification
A transition from fossil fuels and virgin natural sources to alternative bio-based feedstock for textile fibre production, like agro-residues, requires a closer look at the different fibre types with bio- origins. Within the class of bio-based fibres, three major categories can be defined based on composition (cellulose and/or starch): agricultural fibres, manmade cellulose fibres (MMCFs) and bio-based synthetic fibres. Each of these fibre types requires complex processing for conversion into textile fibres. Figure 2.1 illustrates the major differences in these fibres.
Agricultural fibresThese have the highest potential for maintaining the natural fibre structure. Only specific plants are capable of producing agricultural fibres suitable for textiles. Agricultural fibres are obtained from vari-ous parts of the plants, i.e., seed, bast, leaf or fruit. Some examples include:
• Seed: Cotton, kapok• Bast (stem): Banana, flax, hemp, jute, ramie,
kenaf, hop, nettle• Leaf: Abaca, banana, sisal, raffia, pineapple• Fruit: Coir (from coconuts)
Classification of Fibre Types
Agricultural fibreMan-made
cellulose fibreBio-based
synthetic fibre
Seed fibresCotton
Lyocell PolyestersBio PET, Bio PTT
Bast fibresHemp, Flax Viscose Polyamides
PLA, Nylon 6
Fibre length, strength and fineness
Staple Fibre
Cleaning
Cellulose-rich biomass
Cellulose Quality (DP, Purity)
Filament
Cellulose Extraction,
Solution spinning
Glucose Yield
Filament
Glucose Extraction, Conversion,
Polymerization, Melt Spinning
Main Biomass Characteristics
Type of Fibre
Processing involved
Examples of Fibre
Figure 2.1: Three main fibre categories and their production routes from biomass
Not all agricultural fibres are suitable for textile applications. Fibres with high cellulose content and low or negligible lignin content are preferred, as lignin is known to provide structural strength to the plant and is less suited to apparel.
Agricultural fibres that are most ideal for textile applications are soft, long with a fine fibre structure, and high cellulose. Soft bast fibres like flax, which is used to make linen, have a wide range of appli-cations in apparel. They have high cellulose and low lignin content, which is in sharp contrast to hard leaf fibres like abaca, banana and sisal, that con-tain both lignin and cellulose. Out of the different natural sources, seed fibres like cotton and possibly kapok are the most suitable for producing textile fibres.
MMCFs MMCFs, or manmade cellulose fibres, are made from cellulose pulps extracted from biomass and then re-formed into new cellulose fibres (filaments). In theory, MMCFs can be made from all types of biomass containing cellulose; primarily wood, followed by cotton linter and bamboo, are com-mon feedstocks for MMCFs, with microbial cellulose grown on food waste, recovered cotton and algae are emerging feedstocks.
Depending on the initial cellulose content in the biomass, major or minor processing is required to obtain MMCF that can be used for textile fibres. The main parameters for selection of biomass to produce MMCFs include composition (very high cellulose, no lignin) and length of the cellulose polymer (intrin-sic viscosity and degree of polymerisation). Other parameters like the amount of ash or silica content are also important, as beyond a certain level these can affect the dissolution of cellulose.
Bio-based synthetic fibresThese fibres are made by the polymerization of monomers to form polymers. Synthetic fibres are originally made from fossil fuels, and examples include polyester (PET) and the polyamide nylon. Due to their non-renewable origins, the major chal-lenge for synthetic fibres is to transition to viable renewable sources. The key to addressing this is glucose, which is the feedstock for making synthetic
fibres which are then converted into a filament. Previous studies have shown that it is technically possible to produce all major monomers from bio-mass (Harmen et al. 2013). Monomers with acid‐ and alcohol functionalities, such as lactic acid and succinic acid, can be produced well from biomass like sug-ars (i.e., glucose), since the oxygen atoms needed for these building blocks are already present in the biomass. These findings pave the way for producing synthetic fibres from bio-based renewable sources, since the production route for bio-based polymers usually starts with a glucose molecule. The glucose molecule is converted by chemical means or fermen-tation to the target molecule. Accordingly, no spe-cific type of biomass is required to produce synthetic bio-based fibres; the only requirement is that the selected biomass should contain glucose in the form of sucrose, starch or cellulose.
Box 2.1: Grasses, new fibre sources for textiles
Growing interest in alternative resources for textile fibres has focused attention on lignocellulosic agricultural by-products. These residues can be potential sources of glucose, cellulose (to produce cellulose pulp), or even vegetable fibres. Typically, grasses have hollow lignocellulosic stems with dense nodes.
By-products (residues) such as husk, bagasse and straw from crop plants like wheat, maize, rice, sugarcane, sorghum and barley are some commonly available sources of grasses. Besides these, plants like bamboo and miscanthus are partial sources of grass-based biomass. All these share some common features in lignocellulosic composition that includes 35-40% cellulose, 20-25% hemicellulose and 15-20% lignin.
Bamboo is widely used for production of cellulose pulps that are used to produce textile fibres (for e.g., viscose). About 7% of the world’s virgin cellulose pulp is made from non-wood sources like straw, bamboo and bagasse (van Dem 2018).
3938
Spinning Future Threads
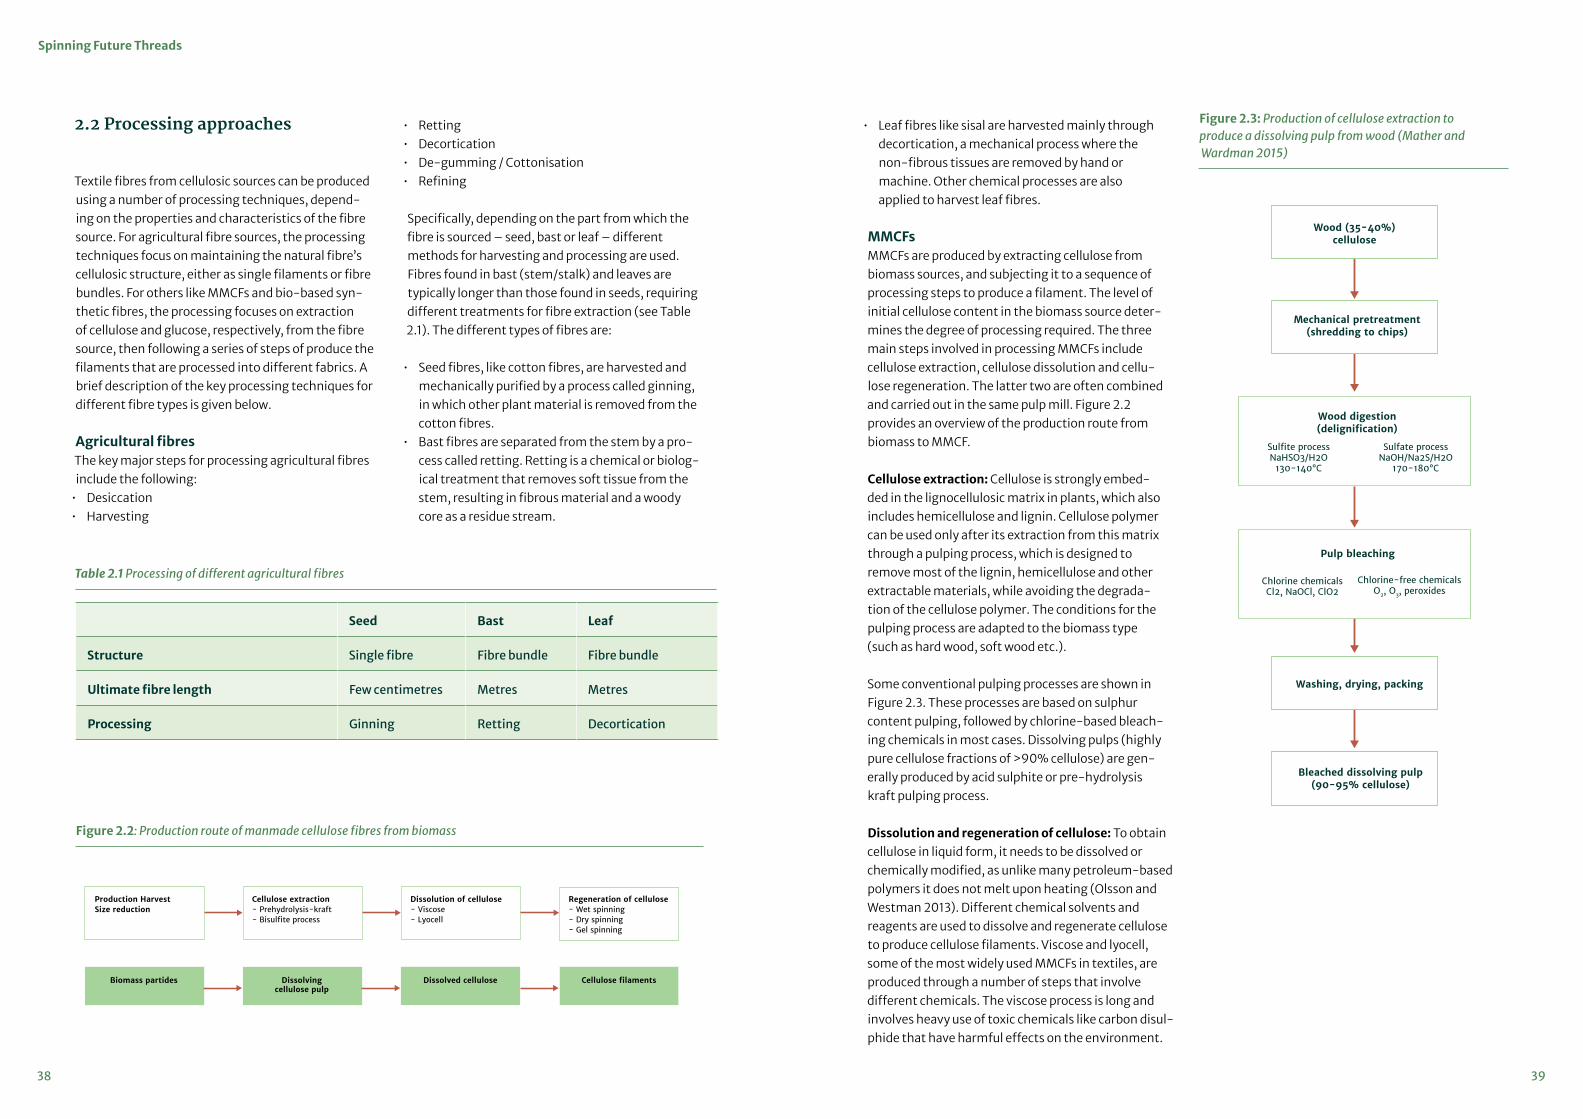
2.2 Processing approaches
Textile fibres from cellulosic sources can be produced using a number of processing techniques, depend-ing on the properties and characteristics of the fibre source. For agricultural fibre sources, the processing techniques focus on maintaining the natural fibre’s cellulosic structure, either as single filaments or fibre bundles. For others like MMCFs and bio-based syn-thetic fibres, the processing focuses on extraction of cellulose and glucose, respectively, from the fibre source, then following a series of steps of produce the filaments that are processed into different fabrics. A brief description of the key processing techniques for different fibre types is given below.
Agricultural fibresThe key major steps for processing agricultural fibres include the following:
• Desiccation• Harvesting
• Retting• Decortication• De-gumming / Cottonisation• Refining
Specifically, depending on the part from which the fibre is sourced – seed, bast or leaf – different methods for harvesting and processing are used. Fibres found in bast (stem/stalk) and leaves are typically longer than those found in seeds, requiring different treatments for fibre extraction (see Table 2.1). The different types of fibres are:
• Seed fibres, like cotton fibres, are harvested and mechanically purified by a process called ginning, in which other plant material is removed from the cotton fibres.
• Bast fibres are separated from the stem by a pro-cess called retting. Retting is a chemical or biolog-ical treatment that removes soft tissue from the stem, resulting in fibrous material and a woody core as a residue stream.
• Leaf fibres like sisal are harvested mainly through decortication, a mechanical process where the non-fibrous tissues are removed by hand or machine. Other chemical processes are also applied to harvest leaf fibres.
MMCFsMMCFs are produced by extracting cellulose from biomass sources, and subjecting it to a sequence of processing steps to produce a filament. The level of initial cellulose content in the biomass source deter-mines the degree of processing required. The three main steps involved in processing MMCFs include cellulose extraction, cellulose dissolution and cellu-lose regeneration. The latter two are often combined and carried out in the same pulp mill. Figure 2.2 provides an overview of the production route from biomass to MMCF. Cellulose extraction: Cellulose is strongly embed-ded in the lignocellulosic matrix in plants, which also includes hemicellulose and lignin. Cellulose polymer can be used only after its extraction from this matrix through a pulping process, which is designed to remove most of the lignin, hemicellulose and other extractable materials, while avoiding the degrada-tion of the cellulose polymer. The conditions for the pulping process are adapted to the biomass type (such as hard wood, soft wood etc.).
Some conventional pulping processes are shown in Figure 2.3. These processes are based on sulphur content pulping, followed by chlorine-based bleach-ing chemicals in most cases. Dissolving pulps (highly pure cellulose fractions of >90% cellulose) are gen-erally produced by acid sulphite or pre-hydrolysis kraft pulping process. Dissolution and regeneration of cellulose: To obtain cellulose in liquid form, it needs to be dissolved or chemically modified, as unlike many petroleum-based polymers it does not melt upon heating (Olsson and Westman 2013). Different chemical solvents and reagents are used to dissolve and regenerate cellulose to produce cellulose filaments. Viscose and lyocell, some of the most widely used MMCFs in textiles, are produced through a number of steps that involve different chemicals. The viscose process is long and involves heavy use of toxic chemicals like carbon disul-phide that have harmful effects on the environment.
Table 2.1 Processing of different agricultural fibres
Seed Bast Leaf
Structure Single fibre Fibre bundle Fibre bundle
Ultimate fibre length Few centimetres Metres Metres
Processing Ginning Retting Decortication
Production Harvest Size reduction
Cellulose extraction- Prehydrolysis-kraft- Bisulfite process
Dissolution of cellulose- Viscose- Lyocell
Regeneration of cellulose- Wet spinning- Dry spinning- Gel spinning
Biomass partides Dissolving cellulose pulp
Dissolved cellulose Cellulose filaments
Figure 2.2: Production route of manmade cellulose fibres from biomass
Wood (35-40%) cellulose
Mechanical pretreatment(shredding to chips)
Wood digestion (delignification)
Sulfite processNaHSO3/H2O
130-140°C
Sulfate processNaOH/Na2S/H2O
170-180°C
Pulp bleaching
Chlorine chemicalsCl2, NaOCl, ClO2
Chlorine-free chemicalsO2, O3, peroxides
Washing, drying, packing
Bleached dissolving pulp (90-95% cellulose)
Figure 2.3: Production of cellulose extraction to produce a dissolving pulp from wood (Mather and Wardman 2015)

4140
Spinning Future Threads
Viscose process
AlkalisationCaustic soda water
Preaging
Xanthogen
Dissolving
Ageing
Viscose
Spinning
Desulf.BleachingFinishingDrying
CS2 recovery
Make-upCarbon
disulphide
Sulphuric acidZinc sulphate
Water
Pulp
Fibre
Spin bath evaporation
Water
Crystallisation
Waste water
Sodium sulphate
Caustic soda water
Lyocell process
DissolvingMake up: NMMO
Spinning
Washing
Finishing Drying
Pulp
Fibre
NMMO/water
NMMO recovery
Spin bathWater
Efforts devoted to finding better alternatives led to the development of the lyocell process, which is more environmentally friendly. Further efforts are under-way to finding alternative solvents for cellulose, and low-impact processes for MMCFs.
Bio-based synthetic fibresSynthetic fibres, traditionally made from polymer-izations of fossil fuel-based monomers, can also be made from renewable bio-based sources. For this, glucose, found in several biomass sources, forms the critical feedstock and is converted into a fila-ment. The key steps included in this processing are: first, glucose extraction from the biomass; second, production of a chemical building block (monomer); third, polymerization to a polymer; and fourth, spin-ning to form a filament that can be spun or woven to a textile. Figure 2.5 provides an overview of this process (the pink blocks represent commodities that can be produced at different factories).
Processing innovations for agro-residues as feedstocksWith advancements in textile manufacturing, these processing methods have undergone numerous iter-ations to improve efficiency, reduce costs and lower environmental impact. In the case of agro-residues as fibre feedstock, these methods can be used in different combinations and modified to suit the type and composition of a given agro-residue to produce cellulosic textile fibres. After extraction of fibres/cellulose from these residues, additional process-ing is required to enhance their functionality and increase textile applications. Apparel production in particular requires high-quality fibres that are soft, durable and can be easily dyed, among other desirable properties. Blending with conventional fibres like cotton is a highly preferred route for most textile innovators to enhance the functional aspects of fibres from agro-residues. Most textile manufac-turers opt for chemical-based processing methods due to their efficiency, higher yield and potential for permutations that can yield higher quality cellulose with wider applications. While doing so, it is import-ant to be wary of the potential consequences arising from these processes, particularly as environmental and social costs.
Low-impact processing methods to produce agro-residue based textile fibres are also being
Figure 2.4 Key stages in the manufacture of viscose and lyocell fibres (The Chemistry of Textile Fibres, R. Mather, 2nd edition)
Production Harvest Size reduction
Glucose extraction Production chemical building block- Chemical conversion- Fermentation
Polymerisation
Biomass partides Glucose Chemical building block
Polymer
SpinningExtrusion and drawing
Filament
Figure 2.5: Production route of biomass to bio-based synthetic fibres
explored. Several such innovations are supported by Fashion For Good’s Innovation Platform, that works extensively with textile innovators and businesses that have sustainable sourcing and fibre processing methods, to accelerate and scale their models. The next section looks at the current innovator’s land-scape in textiles more closely.
2.3 Innovator’s landscape
The last decade has seen a flurry of innovators demon-strating great promise with successes in fine tuning residue processing technologies. Collaborations between fashion designers, brands, industries and experts have enabled these innovators to test different residue types either as standalones, or via a combi-nation of blending approaches. The following matrix (Table 2.2) maps out the current landscape of innova-tors, technologies and residue types. This list covers only a part of the diverse and vast landscape of inno-vators working with novel biomass sources, such as agro-residues, for textile fibre and apparel production, some of which are happening in real time with limited outflow of information.
The move towards sustainable fashion, being led by prominent artists, fashion designers, and apparel professionals, is creating a positive feedback loop for companies and consumers to create and meet demand. Several prominent global fashion brands are joining hands with innovators to bring products from alternative materials to mainstream consum-ers. Waste and residues from sources like apples, pineapples, citrus fruits, cactus, mushrooms, algae are steadily entering the apparel and textile mar-ket through products like bags, shoes, clothes and leather goods.
South Asian countries too are joining this vanguard. Start-ups in this region are producing fibre and leather from alternative bio-based materials at a small scale, in collaboration with local artisans and weavers. Some have found success in using a diverse mix of residues from banana, pineapple, sugarcane, eucalyptus, corn, lotus stems, and other crops as the raw material base for textile products.
The innovators’ landscape is in a state of flux, evolving and experimenting at incredible speed – with a con-

4342
Spinning Future Threads
Conventional Agro – Residues(Field)
Agro-residues(Process)
Recycled Streams
Flax, Hemp:9FiberAgraloop StexFibre Bast Fiber TechnologyBohecoBastcoreThe Hurd Co.GencrestAltMatBear FiberThe Hampley Backpack
Jute:FarFarmEcoloomCastanhal
Nettle:Himalayan Wild Fibres
Nettle:Gesine Jost
Kapok:FlocusKapok Knot
Fruits:Agraloop (banana)Pinatex by Ananas Anam (pineapple)
Date palm:Palmfil
Bagasse:Louisiana State University
Floral stems:RaydanPhoolSamatoa (lotus)DUPONTTM SORONA
Potato:Chips Board(Parblex)
Dairy: QMilchDueDiLatte
Fruits: Green Whisper (banana)AltMat (banana)Melior Handbags (pineapple)Orange Fiber (citrus fruits)Fru-Mat (apple)Von D Shoes (apple)Samara Bags (apple)Beyond Leather (apple)
Mushroom:Bolt Threads (Mylo)MycoTexEcovative
Wine / Beer residues:Vegea (grape-marc) Nanollose
Textile waste:Ioncell Infinited fiber Evrnu Refibra RENEWCELLCircRe;codeSuaveBirla Cellulose
Floral stems:Pond Textile
Coconut:Nanollose (bacterial cellulose)
Mushroom:Amadou Leather
Algae:AlgalifeAlgi-knit
Wood:Birla Cellulose
Algae:Algi-KnitECOPELBusatti (Mario the Blanket)
Wood:SpinnovaTree to TextileCircular SystemsFiber-X
* The above list is illustrative and does not comprehensively cover all innovations, some of which are emerging or evolving in parallel with this report
certed effort across academia, designers, manufactur-ers and brands. Factories across textile hubs in Tirupur, India and Dhaka, Bangladesh have quietly been stepping up manufacturing capacities for integrating the use of bio-based materials. However, in spite of the early promises and successful pilots for vegetable and plant-based approaches, the arena for use of residues across rice, wheat, maize, sorghum, bagasse, oil palm and other sources is still wide open and remains rela-tively unexplored.
Table 2.2 Innovator’s landscape

3Availability of Crop Residue in Regions

4746
Spinning Future Threads
3 Availability of Crop Residue in Regions
3.1 Longlisting of crops and residues in the eight countries
The eight focal countries for this assessment from South and Southeast Asia—Bangladesh, Cambodia, India, Indonesia, Pakistan, Sri Lanka, Thailand and Vietnam—are known for their abundant agricultural activities with a wide variety of crops under cultivation. This provides a large range of potential cellulose-based feedstocks that can be used to produce textile fibres.
From the eight countries, a long list of desirable crops was developed for screening their suitability to produce cellulose pulps, or to extract fibres, on the basis of two parameters – first, the total area under cultivation in hectares (see Table A1.1 in Annexure 1), and second, the total annual production volume in metric tonnes (see Table A1.2 in Annexure 1). The latter was determined to be a better estimate of the indicative amount of residual biomass that can be available on the ground. To maintain uniformity in crop selection across regions, it was ensured that the longlist included the top 20 crops from each country. Then a ranking was carried out for these crops for the eight countries (see Table A1.3 in Annexure 1).
Some key trends were observed after the analysis:• Rice is the most abundant crop across the eight
countries, with 30% of the total cultivation area (~97,216,038 ha) and 20% of the total crop pro-duction volume (~413,652,648 t). It ranked among the top three main crops in each of the countries.
• Wheat is the second most important crop across countries, with 12% cultivated area (~38,729,676 ha) and 6% crop production volume (~125,876,873 t). India and Pakistan are among the top producers of wheat out of the eight coun-tries.
• Sugarcane is another prominent crop produced in large volumes, particularly in India, Pakistan and Thailand. It ranks among the top five crops in all eight countries by total production volume. Due to high biomass production, sugarcane forms 29% (~593,001,814 t) of the total production volume in all countries with only 2% (~8,022,937 ha) cumulative cultivation area. The large volume
of biomass production indicates very high residual biomass production as well, in the form of trash and bagasse.
• Maize is a fourth key staple crop in these regions, comprising 6% of the cultivation area and 4% of the production volume in the eight countries. It is the fourth main crop in Bangladesh, Cambodia, Indonesia and Pakistan, and fifth in Thailand and Vietnam. India has the largest abso-lute area under maize, but ranks seventh in total production volume.
• Other crops that have a significant share in the cultivation area and production volumes are cassava (with largest production volumes in Indonesia and Thailand), potatoes (with largest production volumes in India, Bangladesh and Paki-stan), oil palm (only large in Indonesia), bananas (large in India, Indonesia, Thailand and Vietnam), and mangoes and guava (significant volumes in India, Bangladesh, Indonesia, Pakistan and Ban-gladesh).
• Among the eight countries, India is the largest country, with a diverse climate, and as a result, the largest crop production volumes for almost all the top crops. Sri Lanka is at the opposite end of the spectrum, with rice the largest crop produced, but a comparatively low one million hectares under cultivation.
• A rich variety of vegetables and fruits is also grown in these regions such as sweet pota-toes, pumpkins, green beans, tomatoes, papayas, watermelons and citrus fruits (mandarins, oranges, grapefruits). However, it is difficult to determine the residual biomass and composition for these varieties, thus, they are not considered as poten-tial feedstock for textile fibres for this assessment.
Following this, the technical potential of the top 20 crops from all eight countries was calculated, to understand the absolute maximum amount of residual biomass potentially available in the field (for primary residues) or at the processing mill (for secondary residues).
From Table 3.1, it can be seen that:• The largest volume of primary residues come
from rice, amounting to more than 600 million
Crop Production main product in 8 countries (in tonnes, t)
Residue type
Description RPR* Total technical residue potential (t dm)
Sugarcane 593,001,814 Trash Field residue, leaves & tops
0.14 83,020,254
593,001,814 Bagasse Pressed sugarcane, effluent
0.14 83,020,254
Rice 413,652,648 Straw Field residue, stalks 1.25 517,065,810
413,652,648 Husk or hulls Coating on a grain of rice
0.28 115,822,741
Wheat 125,876,873 Straw Field residue, stalks 0.85 106,995,342
125,876,873 Bran Coating on a grain of wheat
0.2 25,175,375
Oil, palm fruit (fresh bunch)
230,420,117 Fronds Leaves & petiole 1.2 276,504,140
230,420,117 Petiole 0.05 11,521,006
230,420,117 Empty fruit bunch
Bunch after removal of oilseeds
0.19 43,779,822
230,420,117 Oil palm shell Coating of kernel 0.08 18,203,189
230,420,117 Oil palm mesocarp fibre
Palm press fibre 0.21 48,388,225
Maize78,423,490 Stover Stalks and leaves 0.5 39,211,745
78,423,490 Maize cobs What remains after removal of grains
0.5 39,211,745
Cassava 70,264,241 Cassava stalk Stalks and leaves 0.2 14,052,848
70,264,241 Peels Peels from root 0.1 7,026,424
70,264,241 Fibre from starch extraction
Fibres in root after extraction of starch
0.17 11,944,921
Table 3.1: Primary and secondary residues, and technical potential for the crops on the longlist

4948
Spinning Future Threads
Crop Production main product in 8 countries (in tonnes, t)
Residue type
Description RPR* Total technical residue potential (t dm)
Bananas + Plantains**
42,967,055 Banana fronts Leaves 0.14 6,015,388
42,967,055 Pseudo-stems/trunk
Trunk after cleaning plantation
0.15** 6,445,058
42,967,055 Inflorescent 1 42,967,055
42,967,055 Rejected fruit 0.15 6,445,058
Coconuts35,888,245 Coconut husk Husk around the
coconut0.6 21,532,947
Copra cake Remains after oil extraction from copra
0.1 3,588,825
Coconut shell Shell of coconut after removal of milk and cocos
0.5 17,944,123
Mangoes, mangosteens and guavas
33,789,591 Woody prunings
Orchard residues from pruning
0.1 3,378,959
33,789,591 Mango peels Fruit peels 0.15 5,068,439
Tomatoes 21,500,464 Stalks and leaves
0.1 2,150,046
Seed cotton 19,546,231 Cotton stalks 3.5 68,411,809
19,546,231 Linter 0.03 586,387
Soy beans15,148,147 Straw Stalks and leaves 2.5 37,870,368
Citrus fruits (oranges, tangerines, mandarins, lemons, grape fruit)
18,888,588 Woody prun-ings
Orchard residues 0.1 1,888,858
Pulp (skin) 0.3 5,666,576
Pulp (from juice indus-try)
0.15 2,833,288
Crop Production main product in 8 countries (in tonnes, t)
Residue type
Description RPR* Total technical residue potential (t dm)
Millet12,014,153 Straw Stalks 1 12,014,153
Rubber, natural
10,601,870 Old trees after replanting
0.1 1,060,187
Rapeseed 9,042,060 Stalks 1 9,042,060
Groundnuts, with shell
7,852,501 Groundnut shells
2.5 19,631,252
Papayas 7,191,433 Woody prunings
Orchard residues 0.1 719,143
Pineapple*** 6,547,762 Leaves 0.25 1,636,941
Okra**** 6,246,637 Stalks 0.28 1,749,058
Sorghum 4,983,142 Stalks and leaves
2.62 13,055,832
Sweet pota-toes
4,927,062 Leave and vines
0.5 2,463,531
Coffee
2,705,260 Coffee silver-skin
0.042 113,621
2,705,260 Coffee husk/pulp
2.13 5,762,204
2,705,260 Spend coffee grounds
0.65 1,758,419
* RPR, or residue to product ratio indicates the ratio between main crop product (e.g., grains, sugarcane) and the amount of residue (e.g., straw, trash) in kg dry matter (dm) per tonne. Several sources were used to derive the RPR ratios and typical moisture levels for these residues, particularly, OECD/IEA (2010) and Feedipedia . These were fine-tuned with observations and measurements of WUR projects all over the world. Three examples of how the RPR was calculated are:
** Per tonne of bananas harvested, 4 tonnes of residues remain. These consists for 75% of pseudo-stem. The moisture content of the pseu-do-stem is 95%. This implies that the RPR= 4* 0.75 *0.05 = 0.15
*** Per tonne of pineapple harvested, 1.6 tonnes of pineapple leaves remain. These leaves have a moisture content of 85%. This implies that the RPR = 1.6*0.15= 0.25
**** Per tonne of okra beans harvested, 1.25 tons of residues remain (IEA, 2010). These residues consist of leaves and stems. However, the fibres come from the stem. Residues consist for 50% of stems with a moisture content of 65%. This implies that the RPR = 1.6*0.5*0.35= 0.28

5150
Spinning Future Threads
tonnes of dry mass straw and rice husk in the eight countries combined.
• The second largest amount of residue comes from oil palm, as this crop produces large vol-umes of different residues of which the palm fronds (in the field) and the palm press fibre and the empty fruit bunches (in the oil palm mill) are most abundant. Every year, palm oil residues amount to at least 400 million tonnes of dry mass material in the focus regions, especially in Indone-sia.
• The third largest residue volume comes from sugarcane, consisting of trash and bagasse, of which 160 million tonnes of dry mass material is produced per year and this production is most strongly found in India, Pakistan and Thailand.
• Finally, the volume of straws of wheat and maize is also very large in the focus regions, reaching a technical dry mass potential per year of at least 200 million tonnes of straw.
After determining the annual amount of residual biomass produced for the longlisted crops in these countries, the next stage was to calculate the total cellulose and fibre content and related volumes. High cellulose content is a critical condition to extract cellulose from these residues and produce cellulose-based textile fibres. The threshold value for high cellulose was set at greater than or equal to 30% (see Table A1.4 in Annexure 1). It was found that sugarcane trash and bagasse; rice straw, husks and hulls; wheat straw; oil palm fronds, petioles and empty fruit bunches; maize stover and cobs; soy-bean straw; and, sorghum stalks were among the crop residues with cellulose values >=30%, thus, making them feasible for cellulose extraction.
In addition, the longlisted crops were assessed on the basis of the degree of polymerization (DP), their crop family, and if there is scientific evidence demonstrating their utility as a agricultural fibre. Using these criteria (see Table A1.4 in Annexure 1), the crop residues with the highest suitability for fibre extraction for textiles were found to be banana pseudo-stems and fronds; pineapple leaves; okra stems; and, coconut husk. Out of these, residues from okra and coconut are found to produce textiles of low quality and hence these were not shortlisted.
While there are several crops from which cellu-lose can be extracted, these were not shortlisted due to a number of reasons, including a relatively small technical potential in a given region; ideally, a minimum of over one million tonnes of dry matter (dm) should be available. But keeping in mind the small size of fibre extraction plants, the minimum availability of residues was set at a lower threshold than for cellulose extraction. Table 3.2 shows the shortlist of selected crop residues for textile fibre extraction.
Table 3.2: Shortlist of selected crop residues from each of the eight countries
Crop Residue type Country For cellulose or fibre?
Sugarcane Trash India Cellulose
Sugarcane Trash Thailand Cellulose
Sugarcane Bagasse India Cellulose
Sugarcane Bagasse Thailand Cellulose
Sugarcane Trash Pakistan Cellulose
Sugarcane Bagasse Pakistan Cellulose
Rice Straw Bangladesh Cellulose
Rice Straw Cambodia Cellulose
Rice Straw India Cellulose
Rice Straw Indonesia Cellulose
Rice Straw Pakistan Cellulose
Rice Straw Sri Lanka Cellulose
Rice Straw Thailand Cellulose
Rice Straw Vietnam Cellulose
Wheat Straw India Cellulose
Wheat Straw Pakistan Cellulose
Sorghum Stalks/straw India Cellulose
Oil palm Empty fruit bunch Indonesia Cellulose
Oil palm Empty fruit bunch Thailand Cellulose
Maize Stover/straw India Cellulose
Maize Stover/straw Indonesia Cellulose
Banana and plantain Banana fronts (leaves) India Fibre
Banana and plantain Pseudo-stem/trunk India Fibre
Pineapple Leaves India Fibre
Pineapple Leaves Indonesia Fibre
Pineapple Leaves Thailand Fibre
Pineapple Leaves Vietnam Fibre
Note: Cotton stalks and linter are also technically viable agro-residues. However, these were not shortlisted as they are derived from cotton crop, which is already the most important and widely used feedstock in the textile industry. This study aims to highlight other viable agro-residue based sources that can be used as textile fibre feedstock. Presently, linter is used to make cupro and has industrial and medical purposes, while cotton stalks are viable bio-energy sources and alternative for conventionally wood-based products like particle boards. The existing cotton-sourcing and logistical value chains should be taken into account when assessing the viability of these residues.

5352
Spinning Future Threads

5554
Spinning Future Threads
The last criterion used for final residue selection was the availability of a given residue in relation to its exist-ing competing uses. This proved to be one of the most challenging criteria to assess due to incomplete infor-mation. The information on competing uses of the shortlisted crop residues was collated through exten-sive literature reviews, with the gaps filled in through interviews with regional agricultural experts (see Annexure 3). Using this, a classification of the avail-ability of the unused residue potential (high, medium and low) was made.Further narrowing of the above shortlist was based on two factors: low levels of competing uses for the residue, and a relatively even spread of hub locations across the eight study countries. Table 3.3 shows the final selection of crop residues that can be sourced from each focal country.
Table 3.3: Final selection of crop residues per country
Study regions Residues possible
Bangladesh Cellulose: Rice straw Fibre: Banana pseudo-stem
Cambodia Cellulose: Rice straw
India Cellulose: Rice straw, wheat straw, maize straw, sorghum straw, sugarcane trash and bagasse Fibre: Banana pseudo-stem and pineapple leaves
Indonesia Cellulose: Rice straw, maize straw, oil palm EFB, sugarcane trash and bagasse Fibre: Banana pseudo-stem
Pakistan Cellulose: Rice straw, wheat straw, maize straw, sugarcane trash and bagasse
Sri Lanka Cellulose: Rice straw
Thailand Cellulose: Rice straw, maize straw, oil palm EFB, sugarcane trash and bagasse Fibre: Banana pseudo-stem, pineapple leaves
Vietnam Cellulose: Rice straw, maize straw Fibre: Banana pseudo-stem, pineapple leaves
3.2 Spatial analysis to identify hub locations from eight countries
Following the final selection of crops (in Table 3.3), the spatial analysis was carried out to determine the hub locations in the most promising residue-country com-binations for sourcing cellulose and fibres. These hubs indicate the presence of existing local infrastructure like transportation, processing facilities and proximity to nearby towns/cities that can be utilized and even expanded to accommodate the processing capacity required for the two routes, i.e., cellulose dissolution and fibre extraction. As the eight countries vary in size, more than two hub locations are investigated for the larger countries like India and Indonesia, and only one hub location is chosen for the smaller countries like Sri Lanka and Cambodia.
Additionally, different sizes of processing mills for both routes are also outlined for the different hub locations, keeping in mind the varying physical availability of residues in each country. While the availability of minimum of over one million tonnes dry matter (dm) biomass is the ideal criterion for setting up processing plants, in this analysis, the minimum threshold was lowered to suit the context of the eight countries.
Some key observations on sourcing and identifying hub locations from the spatial analysis are:
• Large hubs can be established in many locations,
Small75,000 tonnes cellulose /year
Medium150,000 tonnes cellulose /year
Large500,000 tonnes cellulose /year
Standard100-1000 tonnes
�bre/year
cellulose �bre
particularly for rice straw, for which sourcing bio-mass to produce 500 kilotons of cellulose per year is easy to do within a 100-km radius in countries like India, Bangladesh, Vietnam and Indonesia.
• In India, the large sourcing size can be met by combining rice straw with cereal straw, and in Indonesia, a combination of rice straw with maize stover can be used. In the other countries, com-bining straws is less attractive because the amount of production of straws other than rice are smaller and often, the cultivation fields for rice and other cereals do not coincide spatially.
• Large cellulose dissolving plants for sugarcane residues (trash and bagasse) can easily source a combination of trash and bagasse in India, even within a 50-km sourcing circle.
• In some countries, biomass sourcing for a small cellulose dissolving mill, i.e., a maximum of 75 kilotons of cellulose per year, is possible such as
Figure 3.1: Sizes of mills for different processing routes
Note: While empty fruit bunches (EFBs) from oil palm are secondary residues, i.e., sourced directly from processing mills, and are technically feasible cellulose-based raw materials to produce textile fibres, it is important to take note of the challenges surrounding oil palm cultivation. The expansion oil palm cultivation has adversely affected tropical biodiversity, through widespread loss of rainforests and wildlife habitat, while also driving deforestation, fragmentation and degradation in natural forests (Astari and Lovett 2019; Azhar et al. 2017; Baron et al. 2017; Dharmawan et al. 2020). Several initiatives have been launched to improve the sustainability in oil palm cultivation, leading to the establishment of mandatory certification standards like RSPO (Carlson et al. 2018). In principle, the option to use the EFBs from palm oil mills to produce textile fibres may help in improving the efficiency of this sector. However, it will be important to ensure that the EFBs come from sustainable plantations certified by bodies like the RSPO and FSC.

5756
Spinning Future Threads
rice straw in Sri Lanka and Pakistan, and sugar-cane trash in Thailand and Pakistan.
• Sourcing of empty fruit bunches (EFBs) from oil palm trees for cellulose dissolving and regen-erating plants is only possible in Indonesia and Thailand, and is best suited for medium and small plants, respectively.
• For banana pseudo-stems and pineapple leaves, the most promising fibre sourcing regions are primarily found in India, Bangladesh, Thailand, Vietnam and Indonesia. These regions are best
Banana pseudo-stem
Pineapple leaves
Fibre Hotspots
Oil palm EFBs (medium)
Oil palm EFBs (small)
Rice straw (large)
Rice straw (small)
Rice straw (medium)
Sugarcane trash and bagasse (large)
Sugarcane trash and bagasse (small)
Sugarcane trash and bagasse (medium)
Cellulose Hotspots
Map 3.1: Final hub locations identified for vegetal cellulose and fibre sourcing (for region-specific locations, see also tables in Annexure 4)
suited for cultivating these tropical crops and have the highest concentrations of their plantations.
An overview of all hub locations in eight countries is given in Map 3.1.
3.2.1 Rice straw and other cereal straws As noted earlier, rice is one of the primary cereal crops cultivated among all eight countries, with the exception of Pakistan. This makes straw from rice one of the major large-scale crop residues
potentially available for cellulose production for textiles. Rice straw is available in abundance and has limited competing uses (see Annexure 3). Although sometimes used as cattle fodder, rice has a slow decomposition rate and often, abundant leftover rice straw is burnt in the fields after harvesting. This is an easy, low-cost method of residue disposal and the clearing of fields for the next sowing season. Burning of rice straw is further driven by a lack of equipment and machinery in rice-growing regions that could harvest grains and remove straw simul-taneously. Although mass burning is seen as an environmental threat, and prohibited by regulations in most countries10, it remains the quickest and most effective method of managing abundant straw residues from rice crop.
Map 3.2: Cellulose potential from rice straw in the eight focus countries and hub locations for sourcing small, medium and large-scale cellulose extraction plants within a 100-km radius.
10 Increasingly, countries are prohibiting and penalising the burn-ing of residues through legislative or regulatory actions such as India, Thailand and Indonesia in South and Southeast Asia, along with other countries like China and Russia.
%,%,
%,
%,
%,
%,
%,
%,
%,
%,
%,
%,
%,
%,
%,
%,
%,
%,
%,
%,
%,
%,
%,
%,
%,
%,
%,
%,
%,
%,
%,
%,
%,
%,
%,
%,
%,
%,
M a l eM a l e
D i l iD i l i
T o k y oT o k y o
K a b u lK a b u l O s a k aO s a k a
S e o u lS e o u l
D h a k aD h a k a
H a n o iH a n o i
K y o t oK y o t o
K o t t eC o l o m b oKo t t e
M u m b a iM u m b a i
T a i p e iT a i p e i
M a n i l aM a n i l a
J a k a r t aJ a k a r t a
B e i j i n gB e i j i n g
C h e n g d uC h e n g d u
B a n g k o kB a n g k o k
R a n g o o nR a n g o o n
T h i m p h uT h i m p h u
C o l o m b o
C a l c u t t aC a l c u t t a
S h a n g h a iS h a n g h a i
D u s h a n b eD u s h a n b e
M e l e k e o kM e l e k e o k
H o n g K o n gH o n g K o n g
S i n g a p o r eS i n g a p o r e
B a n g a l o r eB a n g a l o r e
N e w D e l h iN e w D e l h i
P y o n g y a n gP y o n g y a n g
N a y p y i d a wN a y p y i d a w
V i e n t i a n eV i e n t i a n e
K a t h m a n d uK a t h m a n d u
I s l a m a b a dI s l a m a b a d
P u t r a j a y aP u t r a j a y a
P h n o m P e n hP h n o m P e n h
B a g u i o C i t yB a g u i o C i t y
K u a l a L u m p u rK u a l a L u m p u r
B a n d a r S e r i B e g a w a nB a n d a r S e r i B e g a w a n
Sources: Esri, USGS, NOAA
Legend RiceHub locations
! Large > 500 kTons
! Medium 150-500 kTons
! Small 75-150 kTons
! Other hubs for Rice >75 kTons
Cellulose potential (kTons)
75-80
75-100
100-125
125-150
150-300
300-500
>500
below threshold: 10-75 kTons
The distribution of rice production across the eight countries is shown in Map 3.2. The best hub loca-tions coincide with the regions with the highest concentrations of rice production (see Table A4.2 in Annexure 4). This is particularly seen in Rajshahi, Bangladesh; Andhra Pradesh, Punjab and West Ben-gal, India; the island of Java, Indonesia; and in the Thái Bình and An Giang regions of Vietnam.

5958
Spinning Future Threads
Combination with other cereal strawsThe combination of rice straw with other cereal straws like wheat, maize and sorghum were also analysed to explore options to securing a steady supply of straws to the cellulose dissolving plants. An example of this can be found in the Punjab region in India, where rice and wheat are cultivated in a rotation on the same fields, with the produc-tion of wheat being the largest (see Map 3.3). An entire chain relying only on cereal straws as textile feedstock was not examined, as there are sever-al competing uses for cereal straws such as cattle feed, bedding and other material uses, vis-à-vis rice straw. This also increases the price of cereal straws. While cereal straws are also burnt, their burning happens on a much smaller scale as compared to rice straws.
3.2.2 Sugarcane trash and bagasseSugarcane is most widely cultivated in India, which is the largest global producer of sugarcane in the world after Brazil. Pakistan, Thailand and Indonesia
also grow sugarcane but at a much smaller scale. As a result, in India it is feasible to source from loca-tions where a large amount of sugarcane trash and/or bagasse is available to feed into a large cellulose dissolving and regeneration plant with 500,000 tonnes of annual capacity (see Map 3.4). In the other countries, only small and medium-sized processing plants are feasible. Trash and bagasse are the two main residues from sugarcane crops.
Sugarcane trashTrash is a primary residue available on the field, and consists of the tops and leaves of the sugarcane. The average RPR for sugarcane is 14%, which means that large amount of trash is produced per hectare of sugarcane crop. For every tonne of sugarcane harvested, 12-16% of trash is technically available on the field. For example, if the average annual yield per hectare of sugarcane is 80 tonnes, then about 10 tonnes dm is available annually per hectare on an average. But it is important to note that this reflects only the technical potential of the residual biomass
Map 3.3: Wheat production in the eight focus countries
(Kumar et al. 2017; Jain et al. 2014). Sustainable removal rates necessary to maintain soil nutrients as much as possible, are likely to be much lower.
The use of sugarcane trash is very limited, with an estimated 25% being burnt on the field (Jain et al. 2014). A study on 10 Indian states producing sugar-cane found that about 3 tonnes of trash is mulched for conserving soil moisture and nutrients, about 30% is transported to the sugar mill with the crop, and only 40% of the trash remains, most of which is burnt on the field (Kumar et al. 2017). About 28 million tonnes of unutilised trash is left on the field and can be used for cellulose extraction. Out of this, about 13 million tonnes is available in the state of Uttar Pradesh, India (see Annexure 3).
Sugarcane bagasseBagasse, the other residue from sugarcane, is an example of secondary residue found in sugar mills. In
India, there are about 600 sugar mills in operation that process over 200 million tonnes of sugarcane annu-ally, and this generates about 75-90 million tonnes of bagasse with 40% moisture content (Qureshi et al. 2020). Bagasse has a major competing use as a fuel, due to its high caloric value (8021 kJ.kg) and is used in boilers to generate steam and electricity within the sugar mills. Other applications include use as a raw material in agro-residue-based pulp and paper mills. It is not possible to source all the bagasse available in sugar mills as it forms a key fuel source for the mill. Its replacement will result in a higher dependency on other energy sources like fossil fuels, which could adversely affect the greenhouse gas (GHG) balance of sugar mills.Map 3.4 shows the hub locations for sourcing sugarcane residues (trash and bagasse) for cellulose extraction and their capacities. It also maps the sugar mill locations for India. Mill locations for other coun-tries like Pakistan, Thailand and Bangladesh could not be mapped due to unavailability of data.
Map 3.4: Cellulose potential from sugarcane residues and hub locations for sourcing small-, medium- and large-scale cellulose extraction plants within a 100-km radius (Note: Sugar mill location are only mapped for India, for other countries no locational data were identified)
%,%,
%,
%,
%,
%,
%,
%,
%,
%,
%,
%,
%,
%,
%,
%,
%,
%,
%,
%,
%,
%,
%,
%,
%,
%,
%,
%,
%,
%,
%,
%,
%,
%,
%,
%,
%,
%,
M a l eM a l e
D i l iD i l i
T o k y oT o k y o
K a b u lK a b u l O s a k aO s a k a
S e o u lS e o u l
D h a k aD h a k a
H a n o iH a n o i
K y o t oK y o t o
K o t t eC o l o m b oKo t t e
M u m b a iM u m b a i
T a i p e iT a i p e i
M a n i l aM a n i l a
J a k a r t aJ a k a r t a
B e i j i n gB e i j i n g
C h e n g d uC h e n g d u
B a n g k o kB a n g k o k
R a n g o o nR a n g o o n
T h i m p h uT h i m p h u
C o l o m b o
C a l c u t t aC a l c u t t a
S h a n g h a iS h a n g h a i
D u s h a n b eD u s h a n b e
M e l e k e o kM e l e k e o k
H o n g K o n gH o n g K o n g
S i n g a p o r eS i n g a p o r e
B a n g a l o r eB a n g a l o r e
N e w D e l h iN e w D e l h i
P y o n g y a n gP y o n g y a n g
N a y p y i d a wN a y p y i d a w
V i e n t i a n eV i e n t i a n e
K a t h m a n d uK a t h m a n d u
I s l a m a b a dI s l a m a b a d
P u t r a j a y aP u t r a j a y a
P h n o m P e n hP h n o m P e n h
B a g u i o C i t yB a g u i o C i t y
K u a l a L u m p u rK u a l a L u m p u r
B a n d a r S e r i B e g a w a nB a n d a r S e r i B e g a w a n
Sources: Esri, USGS, NOAA
Legend WheatCellulose potential (kTons)
75-80
75-100
100-125
125-150
150-300
300-500
>500
10-75 kTons

6160
Spinning Future Threads
3.2.3 Empty fruit bunches (EFBs) from oil palmEmpty fruit bunches (EFBs) are an example of sec-ondary residues from oil palms. After the extraction of palm oil from fresh fruit bunches, EFBs are left behind in the palm oil mills and form very bulky res-idues with high moisture content. In addition to cel-lulose, these residues contain highly lignified spikes, and their fibre bundles are covered in silica bodies.
As secondary residues, EFBs do not presently have many competing uses. If not left as waste or burnt (without energy recovery), EFBs are generally mulched and returned to the field. There may be real opportunities to find other applications that offer additional revenue streams, even while com-bating issues like environmental degradation, air pollution and GHG emissions arising from the burn-ing of these residues.Among the eight countries, Thailand and Indonesia stand out as the largest producers of oil palm. These countries can provide sourcing hubs to support both
small and medium cellulose processing plants with 75 kilotons and 150 kilotons cellulose pulp per year, respectively (see Maps 3.5 and 3.6).
3.2.4 Banana pseudo-stems and Pineapple leavesOut of the crop residues assessed for the fibre extraction route, only primary, field-based residues were considered that are not primarily produced for fibre extraction, but have reasonable quality of fibres known to be extracted at small-scale facto-ries. Banana pseudo-stems and pineapple leaves stood out among the other crop residues, since their fibres can produce high quality textiles (see previous chapters). While okra leaves and coir from coconut were also considered initially, they were eliminated because fibres extracted from them are rough and not suitable for most apparel uses.
Banana pseudo-stems and pineapple leaves are currently under-utilized (see Annexure 3). In some regions of the world, fibres from banana and pine-
Map 3.5: Oil palm production in study regions and possible hub locations for a cellulose dissolving plant
PLACEHOLDER
Map 3.6: Locations of palm oil mills in Indonesia and Thailand from which the EFB residues can be sourced to cellulose dissolving mills and possible hub locations
apple are already being used to produce textiles at a small scale. It is estimated that about 200 kilo-tons of banana-based fibres and almost 14 million tonnes of pineapple-based fibres are produced globally (Dunne et al. 2016). Residues from banana and pineapple trees are also often left in the field as a rich nutrient source; however, excessive residues may contribute to increases in pest attacks as well.
In the spatial assessment for banana pseudo-stems and pineapple leaves, the annual factory fibre output capacity was assumed to be 100-1000 tonnes per year. Accordingly, the quantity of feedstock was calculated on this basis and hub locations were identified.
Maps 3.7 and 3.8 show the distribution of these crops and their related fibre potentials. Banana is produced widely in all eight countries, but in India, particularly in the regions of Tamil Nadu, Gujarat, Maharashtra and Bihar, the size and concentra-
tion of the banana production is significantly large, which makes these locations highly promising. On the other hand, areas of pineapple production are less widespread than for banana. Thailand has the largest and most densely concentrated production of pineapple among the eight countries. For the cost analysis, hub locations for sourcing banana fibres are evaluated in India, Bangladesh, Thailand, Vietnam and Indonesia, which have very different banana plantation densities (see Annexure 5).
%,%,
%,
%,
%,
%,
%,
%,
%,
%,
%,
%,
%,
%,
%,
%,
%,
%,
%,
%,
%,
%,
%,
%,
%,
%,
%,
%,
%,
%,
%,
%,
%,
%,
%,
%,
%,
%,
M a l eM a l e
D i l iD i l i
T o k y oT o k y o
K a b u lK a b u l O s a k aO s a k a
S e o u lS e o u l
D h a k aD h a k a
H a n o iH a n o i
K y o t oK y o t o
K o t t eC o l o m b oKo t t e
M u m b a iM u m b a i
T a i p e iT a i p e i
M a n i l aM a n i l a
J a k a r t aJ a k a r t a
B e i j i n gB e i j i n g
C h e n g d uC h e n g d u
B a n g k o kB a n g k o k
R a n g o o nR a n g o o n
T h i m p h uT h i m p h u
C o l o m b o
C a l c u t t aC a l c u t t a
S h a n g h a iS h a n g h a i
D u s h a n b eD u s h a n b e
M e l e k e o kM e l e k e o k
H o n g K o n gH o n g K o n g
S i n g a p o r eS i n g a p o r e
B a n g a l o r eB a n g a l o r e
N e w D e l h iN e w D e l h i
P y o n g y a n gP y o n g y a n g
N a y p y i d a wN a y p y i d a w
V i e n t i a n eV i e n t i a n e
K a t h m a n d uK a t h m a n d u
I s l a m a b a dI s l a m a b a d
P u t r a j a y aP u t r a j a y a
P h n o m P e n hP h n o m P e n h
B a g u i o C i t yB a g u i o C i t y
K u a l a L u m p u rK u a l a L u m p u r
B a n d a r S e r i B e g a w a nB a n d a r S e r i B e g a w a n
Sources: Esri, USGS, NOAA
Legend Oil PalmHub locations
! Medium 150-500 kTons
! Small 75-150 kTons
Cellulose potential (kTons)75-80
75-100
100-125
125-150
150-300
300-500
>500
10-75

6362
Spinning Future Threads
%,%,
%,
%,
%,
%,
%,
%,
%,
%,
%,
%,
%,
%,
%,
%,
%,
%,
%,
%,
%,
%,
%,
%,
%,
%,
%,
%,
%,
%,
%,
%,
%,
%,
%,
%,
%,
%,
M a l eM a l e
D i l iD i l i
T o k y oT o k y o
K a b u lK a b u l O s a k aO s a k a
S e o u lS e o u l
D h a k aD h a k a
H a n o iH a n o i
K y o t oK y o t o
K o t t eC o l o m b oKo t t e
M u m b a iM u m b a i
T a i p e iT a i p e i
M a n i l aM a n i l a
J a k a r t aJ a k a r t a
B e i j i n gB e i j i n g
C h e n g d uC h e n g d u
B a n g k o kB a n g k o k
R a n g o o nR a n g o o n
T h i m p h uT h i m p h u
C o l o m b o
C a l c u t t aC a l c u t t a
S h a n g h a iS h a n g h a i
D u s h a n b eD u s h a n b e
M e l e k e o kM e l e k e o k
H o n g K o n gH o n g K o n g
S i n g a p o r eS i n g a p o r e
B a n g a l o r eB a n g a l o r e
N e w D e l h iN e w D e l h i
P y o n g y a n gP y o n g y a n g
N a y p y i d a wN a y p y i d a w
V i e n t i a n eV i e n t i a n e
K a t h m a n d uK a t h m a n d u
I s l a m a b a dI s l a m a b a d
P u t r a j a y aP u t r a j a y a
P h n o m P e n hP h n o m P e n h
B a g u i o C i t yB a g u i o C i t y
K u a l a L u m p u rK u a l a L u m p u r
B a n d a r S e r i B e g a w a nB a n d a r S e r i B e g a w a n
Sources: Esri, USGS, NOAA
Legend Pineapple LeavesHub locations
!( Hub for fibre extraction
Fibre production (kTonne)1.4
1.0
0.1 - 1
Map 3.8: Fibre potential from pineapple leaves in the eight focus countries, and selected hub locations
%,%,
%,
%,
%,
%,
%,
%,
%,
%,
%,
%,
%,
%,
%,
%,
%,
%,
%,
%,
%,
%,
%,
%,
%,
%,
%,
%,
%,
%,
%,
%,
%,
%,
%,
%,
%,
%,
M a l eM a l e
D i l iD i l i
T o k y oT o k y o
K a b u lK a b u l O s a k aO s a k a
S e o u lS e o u l
D h a k aD h a k a
H a n o iH a n o i
K y o t oK y o t o
K o t t eC o l o m b oKo t t e
M u m b a iM u m b a i
T a i p e iT a i p e i
M a n i l aM a n i l a
J a k a r t aJ a k a r t a
B e i j i n gB e i j i n g
C h e n g d uC h e n g d u
B a n g k o kB a n g k o k
R a n g o o nR a n g o o n
T h i m p h uT h i m p h u
C o l o m b o
C a l c u t t aC a l c u t t a
S h a n g h a iS h a n g h a i
D u s h a n b eD u s h a n b e
M e l e k e o kM e l e k e o k
H o n g K o n gH o n g K o n g
S i n g a p o r eS i n g a p o r e
B a n g a l o r eB a n g a l o r e
N e w D e l h i
P y o n g y a n gP y o n g y a n g
N a y p y i d a wN a y p y i d a w
V i e n t i a n eV i e n t i a n e
K a t h m a n d uK a t h m a n d u
I s l a m a b a dI s l a m a b a d
P u t r a j a y aP u t r a j a y a
P h n o m P e n hP h n o m P e n h
B a g u i o C i t y
K u a l a L u m p u rK u a l a L u m p u r
B a n d a r S e r i B e g a w a nB a n d a r S e r i B e g a w a n
Sources: Esri, USGS, NOAA
Legend Banana PseudostemHub locations
Hub for fibre extraction
Fibre production (kTonne)
1 - 1.5
1.5 - 2
2 - 2.5
2.5 - 3
3 - 10
0.1 - 1
Map 3.7: Fibre potential from banana pseudo-stem in the eight focus countries, and selected hub locations

4Pre-feasibility and Viability Considerations

6766
Spinning Future Threads
4 Pre-feasibility and Viability Considerations
4.1 Value chain design and assump-tions for cost assessment
The selected crop residues listed in Table 3.3 exhibit diverse characteristics, such as varying cellulose, fibre and moisture contents, that affect costs associated with their sourcing and delivery including transporta-tion, labour, energy and pre-processing.
Some residues, like banana pseudo-stems, pineapple leaves, sugarcane bagasse and oil palm EFBs, have very high moisture content. As a result, trans-porting these residues to cellulose dissolving or fibre extractions plants can be inefficient. While
Note: The complete effect of densification of the biomass on the cellulose extraction process is unknown. A higher degree of densification may influence the quality of the cellulose. This requires further review.
pre- processing treatments like drying and densifi-cation can make their transportation easier, these would add higher energy and handling costs, and have not been considered in this assessment’s cost calculations.
For residues like rice straw and sugarcane trash a densification step was considered at an intermediate collection point, or ICT (see Figure 4.1), where the residues are converted into pellets to increase bulk density from 150 kg/m3 to about 600 kg/m3. This pelletising process adds additional cost (for details, see Annexure 5) to the delivery of the biomass to the processing plant. However, this additional cost
may be partially or fully compensated by the lower overall transportation costs which is shown in the results. The alternative is to transport the loose straw or trash bales, that have much lower bulk density but are more expensive to transport, straight from the field to the cellulose dissolving plant. The long-distance transportation costs become higher for these bales, but the costs for densification into pellets are not incurred in this option (see Chain 3 in Figure 4.1). The cost calculation exercise will deter-mine the efficacy of these scenarios (see Section 4.2 for cost calculations).
In addition to the densification costs, the pre-pro-cessing stage at the ICT will also involve addition-al costs such as labour costs for off-loading and uploading. There may also be a possibility of storing
Agricultural residues for cellulose dissolving plant Agricultural residues for fibre extraction plant
Biomass type Rice straw (combined with cereal straw in Punjab, India)
Sugarcane trash Sugarcane bagasse Empty fruit bunch (EFB) of oil palm
Banana-pseudostem Pineapple leaves
Field (primary) or Mill (secondary) residue
Field residue Field residue Mill residue Mill residue Field residue Field residue
Cellulose and fibre content (kg cellulose/tonne dry residue mass)
380 kg cellulose/ tonne dry straw
340 kg cellulose/ tonne dry trash
460 kg cellulose/ tonne dry bagasse
410 kg cellulose/ tonne dry EFB
20 kg fibre/ tonne dry pseudo-stem
100 kg fibre/ tonne dry pineapple leaves
Average moisture content after harvest or at mill
14% 14% 40% 50% 95% 70%
Storage assumptions 3 months 3 months No storage needed No storage needed No storage needed. No storage needed.
Chain designs applied (see Fig 4.1) Chains 1 and 3 Chains 1 and 3 Chain 2 Chain 2 Chain 3 Chain 3
Contractibility levels assumed Costs are calculated for two contractibility levels of tech-nical potential:60%30%
Costs are calculated for two contractibility levels of tech-nical potential:60%30%
Maximum 20% of the bagasse produced per sugar mill is available for cellulose extraction.
Costs are calculated for two contractibility levels of tech-nical potential:60%30%
Costs are calculated for three contractibility levels of tech-nical potential:100%60%30%Higher contractability is possible if mill residues are returned to fields.
Costs are calculated for three contractibility levels of tech-nical potential:100%60%30%Higher contractability is possible if mill residues are returned to fields.
Table 4.1: Summary of value chain design and cost assumptions per selected biomass type
the biomass at the ICP in case it cannot be delivered year-round to the cellulose dissolving (CD) plant. Storage can also be done at the CD plant if there is no ICP plant involved in the delivery chain.

6968
Spinning Future Threads
ICP = Intermediate collection point. These are always located a maximum of 4 kms from the fields.CD plant = Cellulose dissolving plant
Agricultural residues for cellulose dissolving plant Agricultural residues for fibre extraction plant
Biomass type Rice straw (combined with cereal straw in Punjab, India)
Sugarcane trash Sugarcane bagasse Empty fruit bunch (EFB) of oil palm
Banana pseudostem Pineapple leaves
Options for collection and pre-treat-ment of residue and associated transportation cost (USD/tonne/km)
1) Straw bales are transport-ed from field to ICP* where pellets are made increasing bulk density from 150 kg/m3 to about 600 kg/m3.
0.05 USD/tonne/km
2) No densification takes place and straw bales are transported directly to CD plant.
0.20 USD/tonne/km
1) Trash bales are transport-ed from field to ICP* where pellets are made increasing bulk density from 150 kg/m3 to about 600 kg/m3.
0.05 USD/tonne/km
2) No densification takes place trash bales are trans-ported directly to CD plant
0.20 USD/tonne/km
Bagasse is collected at the sugar mills into a large lorry and transported directly to the CD plant.
0.05 USD/tonne/km
Collection at the oil palm mills, direct transportation to the CD plant with large lorries.
0.05 USD/tonne/km
1) Only outer pseudo-stem is removed from field.
2) Whole pseudo-stem is removed from field.
In both cases, direct trans-port from the field to fibre extraction plant. After fibre extraction, remaining resi-dues are returned to fields.
0.20 USD/tonne/km
Leaves are collected from the field and transported directly to fibre extraction plant. After fibre extraction remaining residues are returned to fields.
0.20 USD/tonne/km
Purchase cost (see Annexure 5 for a detailed explanation of the costs involved)
A market price is assumed per tonne of dry straw and a compensation cost for removal of nutrients (NPK).
A market price is assumed per tonne of dry residue and a compensation cost for removal of nutrients (NPK) is allocated.
A market price is assumed per tonne of dry residue.
A market price is assumed per tonne of dry residue.
A purchase cost level of 0.05 USD/kg of fibre contained in the residual biomass is assumed.
A purchase cost level of 0.05 USD/kg of fibre contained in the residual biomass is assumed.
Up- and off-loading cost Up- and off-loading costs are allocated every time biomass needs to be transported from field to ICP, from ICP to CD plant and at CD plant. Up- and off-loading costs are estimated at 0.5 USD per tonne biomass.

7170
Spinning Future Threads
For the cost assessment of the delivery chains, three major chain designs were considered (see Figure 4.1):
• Chain design 1, in which the field residue biomass is harvested and baled in the field and then trans-ported to an intermediate collection point (ICP), located within a short distance of the fields (max. 4 kms), where the biomass can be densified into pellets and stored.
• Chain design 2, only applicable to secondary res-idues like sugarcane bagasse or oil palm EFBs. In this design, residues are collected at the sugar or oil palm mill respectively and transported by large lorries to the cellulose dissolving (CD) plant.
• Chain design 3, in which the residues are harvested and baled in the field and then directly transported for the CD or fibre extraction plant.
It should be noted that not all designs are applica-ble to all types of residual biomass (see Table 4.1 and Figure 4.1). Depending on the technology route (cellulose or fibre extraction) and factors like bulk density and moisture content, as well as require-ment for pre-processing, the three chain designs
are allocated to different crop residues. These chain designs also involve varied cost considerations.
Pre-processing requirements In the case of straws from rice and cereals (wheat, maize and sorghum), and sugarcane trash, Chain Design 1 can be employed. These residues are harvested in the field when they are relatively dry (10-20% moisture), either by hand or by a combine, and formed into bales with a bulk density up to 150 kg/m3 (Bakker et al. 2013). These bales are trans-ported by 1-2 tonne capacity vehicles (e.g., rickshaw vans, a tractor and trolley, or a mini-van) to the ICP, which is about 4 kms from the field. These vehicles can even transport bales further to a CD plant. The latter implies that the transportation distance of the bales could even reach 100 kms, if needed.
Banana pseudo-stems and pineapple leaves, which follow Chain Design 3, can also be transported from fields to fibre extraction plants using the same small vehicle type and capacity. This transportation mode will become costlier if the distances become too large. It should be noted that fibre extraction plants do not require very large facilities to reach optimal econo-mies of scale, whereas for CD plants, scale may be much more important to make a good business case. As discussed earlier, rice straw chains can be made either entirely from rice straw, or in combination with other cereal straws. Particularly for Punjab in India, a chain with a combination of rice and wheat straw can be a feasible option as these crops are cultivated in a rotational manner. In this case, a large-scale mill for cellulose extraction can be established. In this combination, rice straw will be in higher proportion to wheat straw (say, in a 3:1 ratio) since wheat straw has a number of competing uses due to its better quality.
Purchase cost for biomassThere are two methods of determining the purchase cost of residual biomass:
• In the first method, the actual market price paid for the biomass can be used to determine its purchase cost. This may not be applicable for all residues, as they do not currently constitute a commodity sold in the market. Market prices usu-ally exist for residues that have several competing uses such as wheat straw, rice straw, sugarcane trash and bagasse. However, these prices differ
Figure 4.1: The three value chain designs considered for the delivery of biomass to the processing plant
Long distance transportlocal transport
Crop �elds producing residues
Local densi�cationand storage
Field residue biomass is harvested and baled in the �eld. After that, the bales are transported to an intermediate collection point within short distance of the �elds (max. 4 km). Here, the biomass is densi�ed (by making pellets) and stored before transport to a cellulose dissolving mill
Cellulose dissolving plant
Chain 1: Local hub storage
FAC TORY
Long distance transportFactory resources
Chain 2: Factory to factoryThe producers bring their crops to a mill for processing. The residue from the sugar factory and the oil palm mill is then collected, and transported in large lorries for long distance transport to the cellulose dissolving plant.
Sugarcane and oil palm producers
Sugar and oil palm mill
Cellulose dissolving plant
Long distance transport
Chain 3: Farm to factoryThe residues are collected and baled in the �elds, after which they are transported directly to a cellulose dissolving plant or a �bre extraction plant.
Crop �elds producing residues Cellulose dissolving plant or �bre extraction plant
Box 4.1: Effect of the quality of rice straw on cellulose extraction
While it can be realistically assumed that rice straw is likely to be the largest unused crop residue in the eight focus countries, the extraction of cellulose is a challenge and remains to be proven commercially viable. This is primarily due to a high silica content in rice straw than other residues like wheat straw and sugarcane trash. MMCFs require cellulose pulps to be virtually free of silica.
Different rice varieties have varying degrees of silica content. Paddy rice, which is the dominant variety produced in most of Asia, has high silica content. Comparatively, the Basmati variety, grown in many regions in India, has lower silica levels. Further research is needed to understand ways of addressing high silica levels at the cellulose dissolution stage, and also to ascertain which rice varieties are most suitable as textile fibre feedstock.

7372
Spinning Future Threads
0 35 70 105 140 175
8. Uttar Pradesh - 50% bagasse & 50% trash (bales)
5. Sugarcane trash (pellets)
3. Punjab - Straw (75% rice/25% cereal) (pellets)
1. Rice straw (pellets)
9. Uttar Pradesh - 100% trash (bales)
6. Sugarcane trash (bales)
4. Punjab - Straw (75% rice/25% cereal) (bales)
2. Rice straw (bales)
10. Oil palm EFB
greatly between regions and also according to the season. Therefore, assuming an average market price for residues is not feasible.
• In the second method, the residue is valued on the basis of its cellulose or fibre content; the higher the cellulose/fibre content, the greater the price paid for the biomass. A review of prices paid for fibres showed that banana fibres were priced at 0.1-0.8 USD/kg and pineapple leaf fibres were priced at 0.05 USD/kg (Dunne et al. 2016). For this study’s cost analysis, a purchase cost of 0.05 USD/kg for fibres contained in biomass is considered as a rea-sonable estimate for the initial cost calculations (see Table A5.1 in Annexure 5 to see how this assumption works for the different fibre sources). In the case of cellulose derived from vegetable sources, it is difficult to establish the purchase cost of the biomass due to the diversity in sources and their qualities. In this assessment, a rough market price is assumed for the residues.
For certain countries, the prices are higher because of known competing use levels. For example, in Vietnam, rice straw costs are known to have increased because of the increase in demand for rice straw to make cattle feed, produce compost fertilizer and cultivate mush-rooms. As the purchase costs are highly uncertain and limited reliable information is available, the total deliv-ery cost of biomass to the plant gate is calculated both with and without the purchase cost.
Nutrient compensation The cost of compensating for potential nutrient loss is also considered in the purchase price. Removal of residues from fields leads to the removal of nutrients that may be used to maintain soil quality, and thus carry ecological value. These nutrients need to be replaced and replenished by adding manure or arti-ficial (purchased) fertilizers to maintain soil quality. Fertiliser-based compensation is applicable only for crop residues undergoing cellulose extraction, as the high intensity of processing in the cellu-lose extraction route makes it challenging to bring used residues back to the fields. The cost of fertiliser compensation for residues processed through the cel-lulose extraction route was calculated using the content of the NPK minerals contained in the field residues (based on FAO 2005, for rice and cereal straw in India and on Suma et al. 2015, for sugarcane trash) (see Annexure 5).
By contrast, in the fibre extraction route, spent residues can be brought back to the fields and partially compensate for nutrient loss, due to the simplicity of processing and smaller scale. While this negates the need to include fertilizer costs, it necessitates the inclusion of return transportation costs to the fields. This is particularly applicable for banana pseudo-stems. It is important to return nutrients to the plantations in which bananas are cultivated, due to the high nutrient requirements of banana, specifically nitrogen, potassium and phos-phorus.
In the case of pineapple leaves, also a fibre-based value chain, loss of nutrients caused by residue removal is a concern, but removal has greater ben-efits. If these residues are left on the field, planting new pineapple plants is not possible. Also, decay-ing pineapple leaves attract insects like stable flies that cause diseases in humans and livestock; thus, removal of dead pineapple leaves is a necessary sanitation measure. While return transportation cost to the field as a way of compensating nutrient loss is applicable in case of pineapple leaves, it is important to design proper processing techniques to convert these mill residues into compost (or fertilizers) along with outlining the right application meth-ods. This is not considered in the cost calculations. However, similar to banana pseudo-stems, return transportation costs for pineapple leaves are includ-ed in the cost analysis.
Distance and Transportation Small trucks and vehicles can be used at a cost level of 0.20 USD/tonne/km for short distance transpor-tation and for all non-densified residues that are transported directly from the field to the cellulose and fibre extraction plants.
For long distance transportation, more efficient large lorries are expected to be used which are much cheaper at 0.050 USD/tonne/km. These larger lorries cannot be used for direct collection of residues from fields, as the road networks may not allow it. These lorries are only expected to be used for transporta-tion from one ICT or mill location to the CD or fibre extraction plant (see Annexure 5).
4.2 Cost calculations and considerations
The final costs for at-gate delivery of the residual biomass from the fields are outlined using separate cost factors, which include:I. Purchase cost of the biomass and compensation
cost for nutrients lost in the field due to removal of residues
II. Densification cost, in the case of intermediate conversion to pellets before long distance trans-port
III. Storage cost, in the case biomass is not available year-round because of seasonality, and the need to ensure year-round operations for cellulose dissolving mills
IV. Transportation costs (including up- and off-loading), which can be local, short and long distance.
These factors and the assumptions outlined earli-er were used to calculate the final at-gate delivery costs for the two residue processing routes -- cel-lulose dissolution and fibre extraction. The calcula-tions are outlined in the subsequent sections.
4.2.1 At-gate delivery cost for cellulose biomass sourcesThe total cost and detailed costs have been assessed
for different sourcing combinations, with and without a densification step, and assuming 30% contractibility on average. Figure 4.2 presents the total average costs for sourcing in USD per tonne of cellulose. Table 4.2 shows the detailed cost levels and characteristics of the hub and chain combinations. The numbers of the hub chain combinations in Figure 4.2 correspond to the numbers in the first column of Table 4.2.
Among the various residue-country combinations: • The lowest cellulose-based biomass delivery cost is
for oil palm empty fruit bunches (EFB) at 63 USD/tonne of cellulose.
• Sugarcane residue, particularly bagasse, has the highest cost for sourcing biomass for cellulose disso-lution.
• The sourcing of rice straw, among the most widely available residues, as bales is also among the cheap-est options at 100 USD/tonne of cellulose.
Oil palm EFBs have the lowest total costs because their purchase costs are relatively low, since no competing uses exist. These residues can be bought at very low prices, have no storage requirement as their produc-tion is season-agnostic, and by nature are secondary residues that can be collected from oil extraction mills using larger lorries. Additionally, the large number of oil palm plantations contribute to a high availability of this residue. The opposite is the case for rice and
Figure 4.2: Total average at-gate sourcing cost expressed in USD/tonne cellulose

7574
Spinning Future Threads
cereal straws, and sugarcane trash, as they need to be collected from every field, their transportation is challenging, and their seasonal nature requires stor-age facilities to ensure their availability throughout the year. These concerns can be addressed in part by combining rice straws with cereal straws that available in the remaining seasons of the year.
Another key conclusion that can be drawn is that densification through pelletization is very costly, and the lower transportation cost resulting from it does not compensate for the higher transport costs of the bales, as is evident from the comparison between the different chains in Figure 4.3 and Table 4.2. For all delivery chains, the most dominant costs are the purchase costs. Transportation costs, even in cases of long distances and large bulk, is very small compared to the purchase costs. It is important to note that purchase costs are highly variable, and this analysis only uses rough estimates. Estimates were based on imperfect information derived from mar-ket prices that are hard to gather, and are affected by regional and temporal variations. Price levels are not published centrally or regularly, and an in-depth study would be required to determine a more accurate price that could be paid to farmers. Additionally, fixing the final purchase price requires an understanding of the
Figure 4.3: Division of total sourcing costs into different cost items in USD/tonne cellulose
essential farm-based costs to support the mobilisation of residual biomass for cellulose extraction for textile fibres. If prices remain too low, there is no incentive for farmers to supply agro-residues or make efforts to secure an additional income source.
Since transportation costs make up a relatively small share of the total delivery cost, the effect of distance is also limited. This becomes clear from Figures 4.4 and 4.5, in which the relationship between the distance to a hub location, the accumulated sourcing costs and accumulated cellulose, is displayed for selected hub locations. In West Bengal, the availability of rice straw is very large and spatially concentrated, and can sup-port the sourcing requirements of a CD plant with a capacity of 500 kilotons/year within 20 kms assuming a 30% contractibility of rice straw in the region (Figure 4.4).
In case no purchase costs are considered, the average sourcing cost for straw bales is around 15 USD/tonne cellulose, and for pellets it is almost 80 USD/tonne cellulose. The transportation cost for pellets is limited and increases minimally with distance, while for bales these costs become steeper as distance to hub location increases (Figure 4.5). This is no surprise, since for EFB transport costs are the main cost item.
Transport (short and long distance& up & off-loading)
Biomass storage
Pelletising cost
Purchase (market & fertiliser compensation cost)
0
45
90
135
180
10. Oil palm EFB2. Rice straw (bales)
4. Punjab-Straw (75% rice/25% cereal)
(bales)
6. Sugarcane trash (bales)
9. Uttar Pradesh 100% trash (bales)
1. Rice straw (pellets)
3. Punjab-Straw (75% rice/25% cereal)
(pellets)
5. Sugarcane trash (pellets)
8. Uttar Pradesh - 50% bagasse &
50% trash (bales)

7776
Spinning Future Threads
Hub Plant sizes (Ktonne cellulose/year)
Total average cost (30% contractability) (USD/tonne cellulose)
Purchase cost (market & fertiliser compensation) (USD/tonne cellulose)
Pelletising cost (USD/tonne cellulose)
Biomass storage (USD/tonne cellulose)
Transport (short and long distance, and up- & off-loading) (USD/tonne cellulose)
No. no. Avg Min Max Avg Min Max Avg Min Max Avg Min Max Avg Min Max
1 Rice straw (pellets) 12 75/150/500 139 130 187 78 73 126 48 39 61 9 9 12 5 3 6
2 Rice straw (bales) 12 75/150/500 100 97 147 78 73 126 n.a. n.a. n.a. 9 9 12 14 10 18
3 Punjab- Straw (75% rice/25% cereal) (pellets)
1 150/500 141 - - 78 - - 49 - - 9 - - 5 - -
4 Punjab - Straw (75% rice/25% cereal) (bales)
1 150/500 102 - - 78 - - n.a. n.a. n.a. 9 - - 15 - -
5 Sugarcane trash (pellets)
4 75/150/500 147 143 167 79 70 103 53 52 55 10 9 10 5 4 6
6 Sugarcane trash (bales)
4 75/150/500 107 103 125 79 70 103 - - - 10 9 10 19 14 28
8 Uttar Pradesh - 50% bagasse & 50% trash (bales)
1 150/500 158 - - 146 - - n.a. n.a. n.a. n.a. n.a. n.a. 12 - -
9 Uttar Pradesh - 100% trash (bales)
1 150/500 113 - - 102 - - n.a. n.a. n.a. n.a. n.a. n.a. 11 - -
10 Oil palm EFB 1 75/150 63 - - 49 - - n.a. n.a. n.a. n.a. n.a. n.a. 14 - -
Table 4.2: Cost calculation results at gate delivery of biomass for cellulose dissolving at plant gate

7978
Spinning Future Threads
1.400.000
1.050.000
700.000
350.000
0
5B1A1B111
Cummulative tons cellulose
Distance to hub (km)
Acc
um
ula
ted
ton
s ce
llulo
se a
t 30
% c
on
trac
tib
ilit
y
31 5 7 9 11 13 15 17 19 21 23 25 27 29 31 33 35 37 39 41 43 45
160,0
120,0
80,0
40,0
0,0
Sourc
ing c
ost
US$
/Ton
ne
cell
ulo
se
Average cost pellets
Average cost bales
Cost pellets no purchase
Cost bales no purchase
PLACEHOLDER
4.2.2 At-gate delivery costs for fibre rich biomass sourcesThe sourcing of the two residues selected for fibre extraction involves the transportation of very wet biomass – both banana pseudo-stem and pineapple leaves have more than 90% moisture content, when harvested.
Figure 4.4: Cost distance relationship for pellets and bales from rice straw for hotspot in West Bengal in India
Figure 4.5: Cost distance relationship for oil palm EFB sourcing to hotspot in Riau in Indonesia
An overview of the sourcing cost for these residues for the different hub locations is presented in Table 4.3.
Banana pseudo-stem biomass is delivered at lowest cost in Maharashtra, India and at highest cost in the hubs located in Vietnam and Thailand. This is due to a high concentration of banana plan-tations in Maharashtra that can provide biomass to
S.No. Country Region Sourcing feedstock
Average cost (USD/tonne of fibre) 60% contractibility
Average cost (USD/tonne of fibre) 30% contractibility
500 tonnes fibre/yr
1000 tonnes fibre/yr
500 tonnes fibre/yr
1000 tonnes fibre/yr
1 Bangla-desh
Khulna Banana outer pseudo-stem
999 1,334 2,254 4,814
2 Bangla-desh
Khulna Banana complete pseudo-stem
2,898 3,902 6,663 14,343
3 India Maharashtra Banana outer pseudo-stem
281 281 281 281
4 India Maharashtra Banana complete pseudo-stem
743 743 743 743
5 Thailand Samut Pra-kan
Banana outer pseudo-stem
1,360 2,432 4,014 n.a.
6 Thailand Samut Pra-kan
Banana complete pseudo-stem
3,979 7,195 11,943 n.a.
7 Vietnam Kiên Giang Banana outer pseudo-stem
1,560 2,689 4,334 n.a.
8 Vietnam Kiên Giang Banana complete pseudo-stem
4,579 7,968 12,903 n.a.
9 Indonesia Jawa Barat Banana outer pseudo-stem
885 1,362 2,201 3,481
10 Indonesia Jawa Barat Banana complete pseudo-stem
2,554 3,985 6,503 10,343
11 Thailand Kamphaeng Phet
Pineapple 1,547 1,905 2,469 3,365
Table 4.3: Overview of delivery cost of biomass to fibre extraction gate in USD/tonne of fibre for different chains
7,66 14,26 24,36 27,96 31,70 36,12 37,89 39,34 42,47 45,03 48,55
Distance to hub (km)
160,0
120,0
80,0
40,0
0,0
Cost
(U
SD/t
on
cel
lulo
se)
160.000
120.000
80.000
40.000
0
Cum
mula
tive
ton
s ce
llulo
se (
30%
con
trac
tib
ilit
y)
Cummulative tons cellulose Average cost EFB

8180
Spinning Future Threads
0
7500
15000
22500
30000
52,2550,2547,2542,2540,2539,2538,2534,2530,2529,2527,2522,2520,2514,2511,252,25
Cum
mula
tive
ton
s fi
bre
cummulative tons fibre average cost whole pseudostemaverage cost outer pseudostem
Distance from hub (km)
produce 500-1000 tonnes of fibre per year within a short distance and with minimal transportation costs (Figure 4.7).
For fibre sourcing residues, the cost structure is simpler than for cellulose-based biomass. It con-sists of three cost items: transportation cost, up- & off-loading cost, and purchase cost determined according to the fibre content in the residue. The latter is the reason that the purchase cost of pineapple is higher than that for banana pseudo-stems (Figure 4.6).
Two cases for sourcing banana pseudo-stemsFor the sourcing of the banana pseudo-stem, two delivery scenarios are assessed. The first involves sep-aration of the outer part of the pseudo-stem, which contains the fibres, and the rest of the biomass on the
field. This is a labour-intensive process, but greatly reduces the amount of biomass to be removed from the field and transported. Using this measure, trans-portation weight is reduced to 30% of the original pseudo-stem volume in the field, but still retains a high moisture content of 90%. The outer pseudo-stem residues are collected at roadside and then transported to the fibre extraction mill. This lowers the transporta-tion cost significantly. The purchase cost is higher for the outer pseudo-stem since it has about three times more fibre concentration than in the whole pseu-do-stem.
The second scenario involves harvesting the whole pseudo-stem in the field and taking it to the road-side, where it is uploaded into a simple truck or cart for transportation to the fibre extraction mill. The har-
Figure 4.6: Cost structure for sourcing outer and whole banana pseudo-stem in Khulna (Bangladesh)
vesting of the whole pseudo-stem up to the roadside is assumed to be less labour intensive than the first scenario, but the volume transported is bulkier. Trans-portation costs are therefore higher per tonne fibre and more residues are removed from the field, which would need to be transported back to the field after extraction of the fibres at the plant.
On comparing the cost levels for the two sourcing scenarios, the results for two of the five regions indicate that the sourcing of the outer pseudo-stem is cheaper. The purchase costs are higher but fully compensated for by lower transportation costs. This is also shown in Figure 4.6, where cutting out the outer pseudo-stem reduces the sourcing cost significantly. Table 4.3 also shows that the overall sourcing cost of
banana residues for fibre extraction is almost in line with the sourcing cost of pineapple leaves in most regions.
Additionally, spatial concentration and degree of contractibility strongly influence price levels, as illustrated by comparing the sourcing cost-distance relationship in Maharashtra, India and Samut Prakan, Thailand (Figures 4.7 and 4.8). The sourcing costs are significantly higher when the whole pseudo-stem is sourced in Samut Prakan. For 500 tonnes fibre, a price of 3000 USD/tonnes fibre needs to be paid, while in Maharashtra the price is not even 1000 USD/tonnes assuming the whole pseudo-stem is sourced. For outer pseudo-stem sourcing, this cost level is significantly lower, particularly in Maharashtra.
Figure 4.7: Comparison between delivery costs of outer and whole banana pseudo-stems, and distance to fibre extraction plant in Maharashtra, India
Figure 4.8: Comparison between delivery cost of outer and whole banana pseudo-stems, and distance to fibre extraction plant in Samut Prakan, Thailand
Contract 30%Contract 60%Contract 100%
transport cost gate purchase price feedstock wetup-off loading
Banana outer pseudo-stem sourcing cost in Khulna, Bangladesh (USD/tonne fibre)
Cost
sourc
ing b
iom
ass
(USD
/ton
fib
re)
0
4.000
8.000
12.000
16.000
0
4.000
8.000
12.000
16.000
Contract 30%Contract 60%Contract 100%
transport cost gate purchase price feedstock wetup-off loading
Banana whole pseudo-stem sourcing cost in Khulna, Bangladesh (USD/tonne fibre)
Cost
sourc
ing b
iom
ass
(USD
/ton
fib
re)
Cum
mula
tive
ton
s fi
bre
cummulative tons fibre average cost whole pseudostemaverage cost outer pseudostem
Distance from hub (km)
0
1750
3500
5250
7000
50,2542,2539,2534,2529,2522,2514,252,25

5Landscape: Barriers, Opportunities and Sustainability

8584
Spinning Future Threads
Previous sections assessed the physical availabil-ity of agricultural residues and their suitability as feedstock for textile fibres. Their potential to serve as viable commercial alternatives to conventional fibre sources is also dependent on structural factors relating to the landscape where these agro-residues exist i.e., the enabling environment, or surrounding ecosystem, including processing and manufacturing capacity, agricultural practices, transportation infra-structure, social and environmental priorities, among others.
This section considers and evaluates, from a theo-retical perspective, the current value chain landscape across the following five dimensions:
• Agricultural production and practices• Technology, design and innovation • Processing and manufacturing• Commercialization and scale up • Socio-economic and sustainability perspectives
The information for this assessment was collect-ed through consultations with stakeholders, sector experts and practitioners either working directly in these domains, or performing an ancillary function. These stakeholders offered pan-regional expertise, experience and insights that grounded the study’s analyses, estimates and conclusions in real-world contexts (see Annexure 6). They illuminated prevail-ing trends and sectoral nuances that could influence and shape outcomes resulting from this study. A detailed description of these trends, including any opportunities or challenges they present, is provided in the following sections.
5.1 Agricultural production and practices
Seasonality – ensuring steady supplies of seasonally produced productsAgricultural production databases and numerical esti-mates show large potential agro-residue availability in the eight countries selected for this assessment. How-ever, much like all agricultural products, their availabil-ity is seasonal in nature. For most crops, like rice, wheat and sugarcane, their highest volume is available during
their annual growing season (planting to harvest). Out of season, their availability depends on their preserva-tion and storage in safe facilities. Agro-residues follow these same trends. Due to textile manufacturing being a year-round industrial process, it becomes necessary to account for seasonal variability in the availabili-ty of agro-residue feedstocks, and consider options like pre-processing, densification and safe storage to ensure consistent supplies that align with demand. Standardising quality across suppliersAgricultural crops and yields differ across regions as a result of geographic and environmental factors like weather conditions, temperature, soil composition, and water quality, and also depending on the use of additives such as pesticides, fertilizers and other chemicals. Dominant consumer preferences may also affect the variety and quality of crops culti-vated in a given region. Differences may also arise even between different farmers cultivating the same crop within the same geographic region. As a result, ensuring that agro-residue feedstocks consistently meet necessary standards regarding fibre length, uniformity and durability, can present a challenge. Crop variability can be managed if manufactur-ers, individually or as a group, are able to specify required characteristics (type and quantity, quality, etc.) for agro-residues and communicate these to farmers and farm associations effectively – enabling growers to identify and deploy best-practice pro-cesses for delivering products to these standards. Such processes could include proper techniques for separation and removal from the field, pre-treat-ment processes that increase quality or durability, and safe storage methods that safeguard against spoilage, fire or other types of damage. Such processes could be tailored to the specific technologies or techniques used to extract cellulose from a given agro-residue.
The prevalence of decentralised, small-scale landholding patterns Agricultural production in South and Southeast Asia, especially in the selected countries, is distinctive for its decentralised, even fragmented nature. Even in areas with relatively higher concentrations of a
5 Landscape: Barriers, Opportunities and Sustainability
particular crop, small landholdings are the rule, with a high incidence of subsistence farming. Farmer associations are generally far and few, and middle-men or intermediaries dominate the stages between harvesting and sale of produce. This distributed, decentralised model poses challenges for sourc-ing agro-residues in commercially viable quantities for use by textile processors and manufacturers. Consolidating smallholder farms is not recommended, because it could lead to unintended or adverse social and financial repercussions. Alternative methods for aggregating agro-residues should be explored, including the establishment of farmer collectives and associations, which have proven effective and profit-able in a variety of contexts.
However, it must be noted that aggregation and transportation costs of the agro-residues can become additional expenses. One of the possible ways of mitigating these costs is to explore options of breaking down the existing textile innovations into smaller processes that can be spread along the value chain. After the initial set-up costs, this can bring down the long run total costs and also help in greater community acceptance of these value chains (covered below).
Competing uses Many agricultural systems and practices followed in South and Southeast Asia follow a regenerative or circular model of production. This ensures that the most parts of a crop plant such as husk, bran, stalks, stover, straw and skins are used as fuel, cattle fodder, fertilizer, or industrial raw material. The potential uses of agro-residues are broadly classified by the “Five F’s” – fodder, fertilizer, fibre, feed-stock and fuel. For example, in case of rice, rice husk briquettes are used to manufacture bricks. Rice husk can also serve as fuel to produce fly ash, which is used by the steel industry as a carbon source. Rice straw can be used as animal bedding, as compost, and to produce biogas (Koopmans and Koppejan 1997). Bio-fuels are a key competing use for res-idues from crops like rice, wheat, sugarcane and maize, which are increasingly used to produce biogas and bio-ethanol as alternatives to conventional fossil fuels (Box 5.1).
As agro-residues offer existing or potential alterna-tive competing uses, these uses must be taken into account in assessing the feasibility and long-term
Box 5.1: Bio-fuel applications for agro-residues
Biofuels offer potential solutions to several growing global concerns including fluctuating oil prices, environmental threats, climate change, energy security and inadequate energy access in developing countries. In 2018, an estimated 160 billion litres of biofuels were produced globally (World Bioenergy Association 2020). After Europe and the Americas, Asia is the strongest player in the biofuels and bioenergy market. South and Southeast Asia particularly have seen a growing bio-economy in the last ten years. Examples include:
• In India, 34% of the annual gross crop residues is estimated to be a viable surplus for bioenergy production that could fulfill ~17% of the country’s primary energy consumption. MNRE estimates about 2665 megawatts (MW) of power is generated by 288 biomass power and cogeneration projects and the surplus residue potential is the highest in Uttar Pradesh (40 tonnes), followed by Maharashtra (31 tonnes) and Punjab (28 tonnes) (Hiloidhari et al. 2014).
• In Thailand, sugarcane waste like bagasses and molasses are increasingly being used as a source for biogas and bio-ethanol. Since 2004, bio-ethanol from sugarcane grew to account for 59% of Thailand’s total ethanol production (Gheewala et al. 2019).
• In Bangladesh, over 60% of total energy demand for cooking and heating, especially in rural areas, is met by biomass resources.
• The Vietnamese government has strongly promoted the use of bio-ethanol in place of fossil fuels. Currently, sugarcane molasses and cassava are used to produce bio-ethanol; but rice straw, which comprises 75% of agricultural residues produced there, is also being considered as a potential feedstock for ethanol production (Diep et al. 2012).
As noted elsewhere in this report, a number of concerns have been raised about the social and environmental impacts – and real sustainability potential – of bio-fuel production at large scale. While their potential is attractive in some ways, their long-term viability as fuel sources has yet to be determined or realised.

8786
Spinning Future Threads
commercial viability of activating any given agro- residue as a feedstock for textile fibre production.
5.2 Technology, design and innovation
Lead times for testing and commercialization can constrain innovationResearch and innovation follow an iterative devel-opment process which involves multiple rounds of testing, error identification, correction and re- testing. A common observation among stakeholders consulted for this review, was it usually takes two to three years before a new technology or process can move from the concept stage, to a pilot project. It then takes another two to three years before the innovation can break even and become viable in the market. In a rapidly evolving and high-volume industry such as textile and apparels, these lead times are not considered encouraging for econom-ic viability by most large textile brands. Therefore, many textile and technology innovators aim to develop concepts that are considerably ahead of the larger industry curve, while also being a lucrative near-term option for investors – a ideal balance that can be challenging to achieve.
Adaptability of current technologies and inno-vations to process different agro-residuesAt present, most of the textile innovators focus on working with specific agro-residues that are avail-able under very specific conditions. While these have achieved economic feasibility, these innovations currently are yet to explore other potential cellu-lose-based biomass residues. This largely limits the utility and scalability of their process/technology. Additionally, this assessment also found that these innovators have limited cross-sectoral interac-tions and operate independently of each other, in silos. This can adversely impact their versatility and adaptability to changing conditions in the market, in the long run. This barrier can be addressed if inno-vators explore the feasibility of processing multiple agro-residue types and sourcing locations. However, as majority of these are early-stage innovators, the level of risk involved may be cost-prohibitive.
Addressing the technical viability of agro-residue-based fibres for textile production – blendingTextile brands, manufacturers and processors note that in their basic composition and characteristics, agro-residue-based fibres currently don’t offer char-acteristics that make them attractive replacement options for existing fibres. Critical requirements for softness, stretchability and flexibility are not com-pletely met. Blending fibres becomes necessary step to address this challenge. Most textile innovators and manufacturers noted that blending is feasible with a conventional fibre, like cotton, in ratios such as 70:30 or 85:15, so that the conventional fibre acts like a carrier fibre. This allows the resulting blended fibre or yarn to retain most of the favourable proper-ties of the carrier fibre, like strength and stretchabil-ity, while reducing cultivation needs by incorporating the agro-residue-based fibre. A target focus for future innovation, could be identifying favourable blends that improve durability, flexibility and elastic-ity while increasing the ratio of agro-residue-based to conventional fibres.
Retro-fitting existing technologies and processes In general, it will be cheaper and easier to scale agro-residue-based fibre innovations if it involves minimal retrofitting of existing equipment and pro-cesses designed for conventional fibres – as opposed to establishing entirely new manufacturing models, which would be far costlier. Additional, in-depth cost modelling is recommended to identify optimal adaptation strategies for migrating production to a model that accommodates cellulose extraction and agro-residue-based textile manufacturing.
5.3 Processing and manufacturing Pre-processing and shipping of agro-residue feedstock from source countriesCurrently, textile production using conventional fibre sources is often concentrated in the Global South, where climatic conditions are conducive to diverse, year-round cultivation and labour costs are comparatively low. Yet many agro-residue inno-vators base their pilots – sourcing, extraction and manufacturing alike – in the Global North, nearer the headquarters of major textile brands. Full-scale
commercialization may require transferring these innovations and related processing to source coun-tries, and accounting for any resulting shipping, transportation and logistical costs as well as the resulting carbon footprint.
Regulatory and policy considerationsThe agricultural sector is large and vital in all eight focus countries, representing a significant source of livelihoods, raw materials, nutrition and often, national pride. Unsurprisingly, agriculture – agro-residues included – garners significant atten-tion and care in government policies and regulatory frameworks. These countries vary in their consider-ation of agro-residues, but often seek to promote organic and regenerative agricultural practices that support, for example, the use of agro-residues to produce compost to enhance soil health. As noted above, bio-fuels are also a focus in policies reg-ulating agro-residues. Comparatively, the use of agro-residues in textile fibre production is a new proposition, as yet almost unconsidered or unad-dressed in most existing policy frameworks.
Cluster-based aggregation and processing – a promising model As noted earlier, the fragmented geographic distribution of agriculture with small land holding patterns in the eight focus countries, poses a chal-lenge to the generation and collection of adequate quanitites of agro-residues for textile manufac-turing. Some innovators-cum-manufacturers have already devised aggregation mechanisms that partially address this challenge. The most com-monly followed aggregation technique involves breaking down the processing into different stages, and setting up localised aggregation centres with small-scale processing mills within a defined radius of a cluster of farms. These aggregation/processing clusters cover the collection and pre-processing of agro-residues from farms located within a radius of 20-50 kms. The processed outputs from these clusters are then transported to a larger process-ing plant, which serves as a central hub for several such smaller clusters. Such a model allows man-ufacturers to limit the costs involved in long-dis-tance, cross-regional shipping, while also investing in the local economy around each sourcing location. Storage infrastructure is also a key component in such a model.
Heavy dependency on locally available infrastructure and resourcesCountries in the Global South are marked by their relatively lower levels of industrialization, tech-nological advancement and limited infrastructural development, as compared to those in the Global North. While the eight selected countries in this study continue to develop and expand their econ-omies, existing infrastructure around the selected agricultural belts in these countries including road-ways, end-to-end connectivity, mobility options, and availability of energy and water, may not be adequate in every community to support the logis-tics of local value chains to transport and process agro-residues for textile production. Significant initial investments and capital could be required to establish such value chains and ensure their continued maintenance and repair. Most private entities will find such expenses beyond their scope, and will need to rely on partnerships with the local government and authorities, and/or with other local players like textile manufacturers/brands, farmer associations, and transportation services.
5.4 Commercialisation and scale-up
Long-term contracting to ensure year-round supplyHigh seasonal dependency of agro-residues leads to uncertainty in ensuring a stable supply of feed-stock over time. Consultation with a leading textile innovator-cum-manufacturer revealed one way to circumvent this challenge – long-term contracts with farmers in the sourcing countries, to ensure a guaranteed agro-residue quantity in accordance to a set of pre-defined quality parameters outlined by the manufacturer.
These contracts can be made lucrative by incorpo-rating incentives for meeting the stated agro-res-idue supply and quality requirements, such as time-based incremental unit pricing. These incen-tive-based contracting arrangements offer supply stability to manufacturers, enabling them to plan for longer horizons and expand their operations. Additionally, local farming communities gain access to a viable economic growth path.

8988
Spinning Future Threads
Pricing implications for the final productA number of factors are expected to influence the price of the final textile produced from agro-resi-dues. The shared perspective among the consulted textile manufacturers, innovators and large retail brands is that the manufacturing costs associated with setting up new value chains that would support the aggregation, processing, storing and shipping
Box 5.2: Long-term supply contracting with pineapple cultivators
Long-term supply contracts are particularly useful when there is limited availability of residues that require certain pre-defined quality standards to be met. A leading European textile innovator and manufacturer working with pineapple residues has developed a model in which the sourcing of residues, along with pre-treatment processes, are carried out in a tropical country in Southeast Asia. Due to the specific residue demand and geographic availability of the pineapple residues, the textile manufacturer opted to enter into long-term contracts with the local agrarian communities involved in pineapple cultivation.
These contracts have helped ensure a steady supply of pineapple residue feedstock over time for production, while also incentivising the farmers by factoring in the market conditions and prevailing trends at regular intervals to determine the final prices they receive. Additionally, the innovator regularly conducts training workshops for these farmers to improve their cultivation practices and ensure removal of pineapple residues using proper techniques. Such contracts demonstrate that a long-term relationship between innovators and local farming communities, can provide an alternative and steady source of income to farmers while securing long-term supply stability for the innovator – resulting in a self-sustaining, cross-sector local stakeholder network.
specifically those for bio-based value chains (see Box 5.3).
Possible unintended and environmental consequencesThe unique value of bio-based value chains and production models stems from their potential to de-couple economic growth from fossil fuel dependency, and their higher degree of biodegrad-ability. These benefits could obscure an under-standing of the overall environmental impact and sustainability of these value chains. Potential unintended consequences that could accompany these value chains include changes in agricultural practices, depletion of soil nutrients, introduction of industry-focused agricultural systems, unsus-tainable demand for agro-residues, or dependency on additives or intensive farming practices to meet residue quality requirements. These effects could be exacerbated as these textile value chains find com-mercial viability and move towards increasing scales of production.
As a prescriptive counter-measure, the commoditi-sation of agro-residues can be accompanied by the development of agro-residue focused policies that standardise sustainable utilisation, and define stake-holder responsibilities for ensuring effective imple-mentation. Local NGOs working in natural resource management could serve as important non-partisan members in these stakeholder networks, and help balance commercial pursuits with strong represen-tation for local agrarian communities. In the short run, a life cycle assessment of the proposed value chains is recommended to assess its true value as a sustainable and environmentally conscious model.
The next section delves in more detail into the potential climate change and environmental considerations, in particular, that can accompany these value chains.
Box 5.3: Assessing and certifying the sustainability of agro-residue based value chains
The Roundtable on Sustainable Biomaterials (RSB) is a leading global certification body that conducts sustainability assessments for value chains and products using bio-based feedstocks and materials, including biomass and biofuels. Using a set of 12 sustainability principles, RSB assesses the potential environmental, economic and social impacts surrounding bio-based and recycled carbon products and fuels, at every stage of the value chain –producer, processor, supplier, and end-user. It follows a risk-based approach to identify and prioritise specific risks for a given regional and contextual scenario.
For agricultural residues, RSB standards cover bio-based feedstocks and advanced products that utilise residues from crops like sugarcane, wheat, maize, sorghum and oil palm. It also outlines sustainability standards for novel and established technologies and processing techniques that utilise biomass or recycled carbon feedstocks. Some of the key assessment criteria include sustainable removal, soil conservation, protection of forests, local livelihoods, food security and GHG emissions, to ensure overall environmental and social sustainability for a growing global bio-based and circular economy.
RSB’s certification process and standards are acknowledged as rigorous, reliable and user-friendly by sustainability leaders like UNEP, WWF, IUCN, NRDC, Blue Angel and Canopy. The European Union and Japan, among others, recognise and provide preferential market access to RSB-certified materials.
of agro-residues, are expected to be at a premium. Additionally, the costs of installing and running innovations and technologies required to process agro-residues would be higher.
Thus, the collective outlook is that at least initial-ly, the price of a final textile product made from agro-residues would be higher than prevailing mar-ket prices for its competitor products. Optimization of costs and prices, along with tapping into a large consumer base, is expected to happen over a longer time horizon.
5.5 Socio-economic and sustainability perspectives
Community engagement and developing local economies Agrarian communities play a pivotal role in build-ing a textile value chain based on agro-resi-dues. Farmer buy-in is an essential component to ensuring adequate supply, proper harvesting, and consistent quality for ultimate textile processing and manufacturing. It is critical for textile manufactur-ers, particularly those who intend to source directly from farmers, to engage closely with and form mutually beneficial partnerships within local agrari-an communities. Livelihood diversification, incentive programs, and local capacity building programs are some ways manufacturers can engage productively with communities and boost local economic development around agro-residue sourcing hubs.
Sustainability assessment and certification of new textile value chainsAn increasing number of textile brands and man-ufacturers are seeking alignment with globally recognized certifications and standards to bench-mark their value chain sustainability, minimise envi-ronmental impact and improve consumer perception. GOTS (Global Organic Textile Standard), bluesign, ZDHC (Zero Discharge of Harmful Chemicals), ECO PASSPORT by OEKO-TEX and Responsible Care are some well-known textile sustainability stan-dards. While agro-residue-based value chains offer a potential pathway to establish low-impact, environmentally conscious production and boost social value, it will be important to ensure that these comply with the existing sustainability standards,

9190
Spinning Future Threads

9392
Spinning Future Threads
Cambodia
Vietnam
Thailand
Indonesia
Pakistan
Sri Lanka
Bangladesh
India
-30 0 30 60 90 120 150
MMXT maxima
MMXT minima
MMNT maxima
MMNT minima
Annual precipitation
SEPI moisture stress index
Rainfall on very wet days (%)
5.6 Climate change and environmental externalities
South Asia and climate changeCountries in South and Southeast Asia are largely rural agrarian societies. A majority of the workforce in these countries (~40%-60%) derives its live-lihood from the agriculture sector. Yet agriculture in these regions is largely rainfed, dependent on the south-east or north-east monsoons (barring the tropical climate of islands in Indonesia), with most of these countries facing high vulnerability to climate change and related disasters and extreme events like droughts, floods etc. Seven out of the eight countries being assessed, are among the top 20 most vulnerable countries to climate change, based on the Global Climate Risk Index 2019 (David Eckstein and Winges 2018). Temperature projec-tions for the eight countries estimate a rise in Mean Maximum Temperature (MMXT) and Mean Mini-mum Temperature (MMNT) of 0.87 to 2.22° C by 2040-59, while annual precipitation is projected to increase by 6.21mm to 143.61 mm11.
Climate and environmental impacts on agricultureClimate variables like temperature, rainfall, soil moisture and carbon dioxide concentration are crit-ical for agricultural productivity and have different, non-linear impact on different crops. For example, the IPCC AR4 suggests an increase in the yield of C3 crops (rice, wheat, banana, coconut and cotton) by 10-25% and increase by 0-10% for C4 crops (maize, sugarcane and pineapple) when atmospheric CO2 levels reach 550ppm due to carbon fertilisation (Zhai and Zhuang 2009). However, there are also studies indicating that climate variability and asso-ciated changes can potentially reduce agricultural production by 5-20%, particularly in countries like Indonesia where the number is as high as reducing rice yields by 20% and maize yields by 40% (Anan-da and Wododo 2019). Climate change has also increased the incidence and threat of disasters and extreme events. Intensive land-use and unsuitable production practices often contribute to increasing the vulnerability of crops to disasters, and farmers have limited capacity to cope with them. Some of the major impacts are given below:
Figure 5.1: Changes in climate variables for 2040-59
Note: All projections for 2040-59 based on RCP 4.5 emissions and Ensemble model.
Soil health and conservation: Soil health is a key determinant of crop productivity. Climate change accentuates the existing vulnerabilities related to land degradation while adding new challenges. The climate projections in Figure 4.12 indicate the increased stress in soil moisture. There is also an increased threat of soil salinisation due to higher evaporation rates associated with higher tempera-tures, and due to sea level rise in coastal areas that causes salinity intrusion in lower delta regions. This is of particular concern in the eight countries studied as they have extensive agricultural land in down-stream regions. Further, soils are a rich ecosystem that serve as important carbon sinks. If inappropri-ately managed apart from a reduction in the pro-ductivity of crops, soils can turn into another source of carbon emissions (European Environment Agency 2020).
Diseases and pest attacks: Higher temperatures and low moisture can increase abiotic stress on plants, increasing their susceptibility to attacks from pathogens (Cohen and Leach 2020). This is a major concern for developing countries, where agriculture is increasingly shifting towards monocul-ture, particularly for fruits like banana, and oil palm in Indonesia (Fones 2020). Indonesia is a classic example, where preference for cash crop cultivation has meant that hundreds of acres of forest land and biodiversity are routinely being cleared to make way for palm oil. Monoculture often contributes to soil degradation and other detrimental environmental consequences, as well as reduced ability to with-stand pests. The 2020 locust swarm attack in South Asia is an indicator of the new pest attacks to which these countries might be exposed.
Effect of crop residue burning: Besides climate change, environmental repercussions also accompa-ny different cultivation and harvesting patterns. For example, residue burning contributes to increasing the concentration of aerosol particles like PM10 and PM2.5 in the air, a recurring trend in North India
11 These projections are as under RCP 4.5 (Representative Concentration Pathway), or the intermediate scenario where emissions peak by 2040 and then decline, as per the Intergovernmental Panel on Climate Change (IPCC). The model used is an Ensemble model.
during the months of October and November. Rice straw has limited use apart from cattle fodder, and a majority of farmers (S. Kaur 2020) cannot afford more expensive straw management machines like the ‘Happy Seeder’. A recent study found that an estimated 20.3 Mt and 9.6 Mt of crop residue was burnt in Punjab and Haryana, respectively (Singh et al. 2020), for the agricultural year 2017-18, resulting in an emission of 137.2, 56.9 giga-grams of PM2.5 and 163.7, 72.1 gigagrams of PM10 respectively for the two states. Rice and wheat are the major contributors to burnt residue (>90%), leading to high-quantity atmospheric emissions in the Indo-Gangetic plains. Similar trends in resi-due burning practises have also been observed in Cambodia, Indonesia and Thailand (Kumara, et al. 2020) (Vibol and Towprayoon 2009).
Dominant practices: Agriculture in South and South-east Asia is also characterised by intensive pesticide use and groundwater extraction – environmental consequences that are often misaddressed by policy regulations and incentives. The incorrect disposal of pesticide wastes contributes to the pollution of groundwater, surface water, and soil – for example, pesticide residues have found to be 33% above max-imum residue allowances in samples from Vietnam, and 9% in Thailand (Skretteberg et al. 2015). Thus, when considering the potential of crop resi-dues for textile production, it is important to under-stand the prevalent cultivation practices in the major producing regions, so as to map their environmental footprints and discourage prevailing unsustainable methods, along with building resilient agricultural systems to withstand climate stressors and ensure production at scale.
Regional trends in agriculture for climate change adaptation While climate change poses disproportionate risks to farmers and communities in the eight countries, the countries are increasingly aware of these. All the countries have adopted their own approaches to improving adaptation and resilience to climate change, particularly in the agriculture sector. Broad-ly, the major trends and approaches observed are (see also Annexure 8):

9594
Spinning Future Threads
• Projected increases in temperature and precip-itation are largely expected to decline agricul-tural yields of most of the selected crops across the major production belts in the focus countries, in both low- and high-emission scenarios.
• However, there are some non-linear trends. In some instances, like banana – in 27 countries accounting for 86% of global dessert banana production, changing climate conditions since 1961 has increased annual yields. However, these could dampen to 0.59t/Ha and 0.19t/Ha by 2050 under the climate scenarios for RCP 4.5 & 8.5 respective-ly, driven by declining yields in the largest produc-ers (Varma and Bebber 2019). Another example is maize cultivation in Indonesia, where areas with increased rainfall will see a positive effect on yields, while those with higher temperatures will experience reduced yields, the net result being positive (Hecht 2016).
• In addition to droughts brought by increased temperatures, sea level rise and saltwater intrusion leading to high salinity is another threat posed by climate change. Studies indi-cate the high threat of salinity to crops like rice, okra etc. across coastal and low- lying regions in countries. For example, sea level rise and saltwater intrusion could reduce rice yield by 15.6% in nine coastal sub-districts (Dasgupta, et al. 2017).
• Cultivation practices like intensive pesticide use, can also contribute to negative consequences. For example, the carbon footprint of pineapple cultivation in Thailand for 158 ha. area was found to be 172 g CO2eq/kg of fresh pineapple with main contribution from fertilizer usage (Usubharatana and Phungrassami 2017).
• Countries are devising different strategies to adapt to the vagaries of climate change – a combination of changing both farming prac-tices, and market mechanisms. These include shifting to hybrid and nitrogen-efficient crop varieties, production technologies with lower demand of water and fertilizers, crop diversifica-tion, and practices like double mulching, System of Rice Intensification (SRI) etc. There are also efforts to shift away from malpractices and have more effective disease and pest control measures.
Efforts to reduce agriculture-related GHG emissions or investments for mitigation in the agriculture sector, still remain on the lower side. Apart from a
handful of implicit domestic projects (like in India) and a few internationally funded efforts (World Bank in Sri Lanka and Bangladesh, and ICRISAT in India), Climate Smart Agriculture (CSA) projects aren’t as popular (Kishore, et al. 2018, World Bank 2020, World Bank 2019, ICRISAT 2016). The adoption rate of CSA practices is also low in these countries. (CIAT; World Bank 2017, CIAT; World Bank 2017, Ninh, et al. 2017, World Bank; CIAT 2015). Further, there are instances when short-term livelihood interests overshadow the long-term sustainabili-ty and ecological interests in the local context. In the absence of appropriate political will, as well as incentives for local communities and monitoring of progress, these agricultural lands and communities face even higher risks.
Effects of regional differences and temporal variability in climate change – A cautionWhile this section highlights the major find-ings published in the public domain for identified crop-country combinations, there are limitations on the extent to which they can be relied on for activities envisaged under this assessment. There are wide regional variations in productivity and climate vulnerabilities, which may differ from those projected at the national level, and extrapolations do not accurately represent ground-level realities or inter-regional variability. There are also signifi-cant variations of climate impacts based on a crop’s genetic variety.
For certain crops, there is inadequate research on country-specific impacts of climate change, like okra in Pakistan, and coconut and pineapple in Indonesia. Further, data collection and representation regarding crop yields is not uniform across countries and thus, cross-country comparisons may not be appropriate. For instance, Indonesia uses total harvested area for calculation of productivity (yield) while Bangladesh, India and others, adopt gross cropped area.
Due to limitations of time, the focus was on the medium-term climate scenario of 2040-59 and RCP 4.5 scenario alone to assess the relative vulnerabil-ities. The most prominent published literature on documenting climate vulnerabilities as well as other environmental externalities, and emerging new trends in farming practices was also reviewed.In terms of geography and farming practices, South
Asia and Southeast Asia are very diverse. There is a need to dive deeper to identify specific climate vulnerabilities and potential impact on crops and residue, as well as on supply chains and technolo-gies that can enhance the commercial viability of converting agro-residue to textiles. This would help avoid unintended negative environmental impacts, and build resilient systems that can endure climate shocks.
Policy-data interplay, guiding environmentally conscious decisionsDevelopment imperatives often drive key stake-holders in the agriculture sector to make decisions on how to use land and where to invest resources. For example, switching to cash crops and monocul-ture often leads to negative environmental conse-quences in the long run. The negative impacts are further exacerbated by climate-induced changes. The textile and fashion industry too, plays its part in adding to these negative consequences. Using agricultural waste and feedstock in an environmen-tally conscious manner is a welcome step to making the fashion industry more responsible, and sustain-able. Sustainability of feedstock depends largely on the health of the ecosystem, namely water, soil and biodiversity. While focusing on the possibilities to offset farm-level consequences, rigorous efforts are needed to contain the off-farm challenges mainly arising out of skewed economic, social and environ-mental policies.
Today, there is a wide choice of advanced techno-logies and dissemination tools to inform stake-holders to measure, monitor and take appropriate actions. It is important to build off existing knowl-edge and develop a risk matrix for cultivation sys-tems for the selected crops in this assessment study. This can incorporate provisions to understand both the impact of climate and environmental risks, while identifying optimal methods of yields. This will be an important step to address the existing data and knowledge gaps and leverage the niches available to make the textile industry more sustainable and greener going forward.

6Roadmap towards Commercialisation

9998
Spinning Future Threads
This report documents a detailed and thorough evaluation of the availability, suitability and feasi-bility of agro-residues as a viable alternative feed-stock for textile fibres supplying the global apparel and fashion industries. This section reviews key findings, summarizes opportunities and barriers for commercialising these alternative value chains at scale, and proposes next steps industry stakeholders and others can consider to accelerate activation and maturation.
6.1. Key findings – A review
Agro-residues represent a viable and potentially valu-able lever for addressing integrated economic, social and environmental challenges in the textile supply chain. They offer the potential to: advance sustainable apparel; increase the uptake of regenerative agricul-tural practices in agricultural communities; and, create new and relatively resource-light revenue streams for low-income farmers in South and Southeast Asia, and likely, in many other agricultural regions globally.
6 Roadmap towards Commercialisation
As of today, the processes and systems that enable converting agro-residues to fibre are still in their infancy. A range of technological, logistical and com-mercial challenges will need to be overcome to achieve commercialisation at the scale required for agro-resi-due-based fibres to be established as a significant per-centage of global fibre supply for the textile industry.
Agro-residues that offer optimal promise for commercialisationThis report assessed an exhaustive list of agricultural products and by-products across nine dimensions of suitability and feasibility for uptake as fibre feed-stocks – availability, cellulose content, suitability to textile production, competing uses, cost consider-ations, existing technology, existing infrastructure, performance, and potential for scalability. Figure 6.1 shows raw scores, on a scale of 1 to 100, for eight different agro-residue crop sources across all nine dimensions. Based on this assessment and subsequent analysis, the following conclusions can be drawn:
• Across all eight countries, rice and wheat straws/
husks, and sugar bagasse, have the highest and most consistent widespread availability.
• EFBs from oil palm, while less widespread, join the top of the suitability list because they lack major existing alternative uses.
• Rice, wheat and sugarcane all offer existing, basic pre-processing infrastructure – other crops, like banana and pineapple, could require higher processing and set-up investments due to their comparatively high moisture content.
• Rice husk and oil palm offer the best cost eco-nomics. Bagasse, with its higher cellulose content and yield potential, also offers attractive cost parameters.
• Overall, the findings indicate that rice husk and rice straw offer the largest potential across all eight countries. Wheat straw, bagasse, banana plantain, maize and sorghum also offer potential if technical challenges to optimal cellulose extraction (like silica content) can be overcome.
Important considerations and potential bar-riers for optimal configurationsThe report identifies the following key consider-ations and potential barriers for activating, optimis-ing and commercialising potential agro-residue/fibre feedstock systems:
• The costs and logistics of harvesting, collecting, densifying, storing and transporting agro-residues are critical factors. This is a systems challenge, involving collaboration among disparate stake-holders and dependant on local conditions and infrastructure.
• Purchase and transport costs are generally the highest cost hurdles in activating agro-residue chains for processing in bulk. These can be miti-gated by identifying areas where agro-residues are available in large volumes, and are co-located with near-by processing capacity. The closer processing sites are to the residue source, the more stable supply logistics will be.
• Therefore, infrastructure is the biggest logistical challenge and cost variable – i.e., the extent to which farms and farm communities are in sync (geographically and systemically) with, have work-ing relationships with, and are readily accessible to, transporters, processors, millers and manu-facturers. Several of the recommendations in this report center on this challenge.
• A stable, sustainable agro-residue capture and
processing operation is a cross-sector system involving effective collaboration among dispa-rate stakeholders. Successful pilots to date have accounted for this through targeted, multistake-holder community engagements; tie-ups between larger farmers or farm collectives, and mill asso-ciations; and the use of third-party aggregators whose express purpose is managing relationships between various commercial partners.
• Soil health must be maintained, and any potential adverse effects mitigated. Soil quality is a critical component of sustainable agricultural production. Accommodation must be made for leaving nutri-ents on the field where possible, and/or, returning unusable product to the field after usable cellulose is extracted.
• Competing or alternative uses for agro-residues must be catalogued, mapped and accounted for. In some cases, agro-residues may be used for nutri-ent management (compost, manure), livestock feed, or alternative energy (bio-fuels). These uses and their impacts on local ecosystems, agricultural practices, and cost implications must be evaluated case by case.
6.2 Recommendations – A roadmap to tipping the scales toward sustain-able fibre value chains
Following is a list of recommendations, organised across four key topics:R1. Investing in additional targeted research
or studyR2. Geographic and spatial considerations –
where to focus, and whyR3. Decentralize and diversify – iterate to
innovateR4. Stakeholder engagement, industry leadership,
and tools for acceleration
Figure 6.2 provides an overview of the stage-spe-cific recommendations to build an overall ecosystem for the alternative textile value chains based on agro-residues.
Figure 6.1 Priority matrix for the top combinations
Okra
Pineapple
Banana
Maize
Wheat
Sugarcane
Oil Palm
Rice Performance
Scalability
Technological Suitability
Cost Economics Pre-Processing Infrastructure
Non-Competing Uses
Suitability to Produce Textiles
Cellulose Content
Residue Availability
20
40
60
80

101100
Spinning Future Threads
R1. Investing in additional targeted research or studyEfforts to further activate and mature commercial-ised agro-residue value chains would benefit from additional research or study into:
• Benchmarking for purchase costs and price struc-tures for a given agro-residue and geography, accounting for market factors and socio-econom-ic/environmental factors.
• The actual availability yield of agro-residues in selected locations. Residual biomass potential is determined not just by physical availability, but ultimately, by what can actually be mobilised once collection, processing (e.g. for high moisture con-tent, or densification), agronomy, environmental concerns, and transportation are accounted for.
• The nuanced social, environmental, climate and overall sustainability impacts of specific mod-els at scale. Most data are only available from pilot-scale projects that can’t account for the effects of large-scale implementation on factors like emissions, climate mitigation, social equity and rural livelihoods. Better modeling, statistical analysis, and participatory assessments are needed to develop more accurate evaluations of impacts and implications.
R2. Geographic and spatial considerations – where to focus, and why
• This study identified at least 10 hubs across South and Southeast Asia well positioned to become hubs for agro-residue-based fibre production, based on high biomass concentration, existing infrastructure, proximate processing capacity, and co-location with segments of the textile manufac-turing supply chain. These include locations where plants producing 500,000 tonne or more of cel-lulose per year should be feasible from a sourcing perspective. These locations include:
EFBs from oil palm: • Surat Thani, Thailand • Riau, Indonesia
Straw from rice: • Sindh, Pakistan • Andhra Pradesh, India • Suphan Buri, Thailand • Takêv, Cambodia • Polonnaruwa, Sri Lanka • Jawa Timur, Indonesia
Combination of rice straw with cereal straw: • Punjab, India • Rajshahi, Bangladesh • West Bengal, India • Thái Bình, Vietnam • An Giang, Vietnam • Jawa Tengah, Indonesia
Trash and bagasse from sugarcane: • Uttar Pradesh, India • Punjab, Pakistan • Maharashtra, India • Uthai Thani, Thailand • Lampung, Indonesia
Banana pseudo-stems: • Maharashtra, India • Khulna, Bangladesh • Samut Prakan, Thailand • Kiên Giang, Vietnam • Jawa Barat, Indonesia
Pineapple leaves: • Kamphaeng Phet, Thailand
• Cellulose extraction based on EFB from oil palm mills are possible in Indonesia and Thailand, but plants should remain modest in size. EFB’s offer high cellulose yields and currently have limited or no competing alternative uses, but the authors recommend caution with this commodity, as its use could lead to an expansion in oil palm cultiva-tion – a sector already challenged by documented and significant sustainability challenges.
• For this study, hub recommendations were made based on size and yield potential of available agro-residues, and proximity to industrial and urban locations. For final selection, the authors recommend integrating other factors including logistical infrastructure, interest of local actors, textile production flows, market stability, etc.
R3. Decentralise and diversify – iterate to innovate
• A strategy to innovate alternative agro-residue textile supply chains will benefit from a more d istributed processing model than has been typical to date in apparel manufacturing.
- Agro-residue processing is currently a highly local affair, best tailored to the unique agricul-
tural, socioeconomic, industrial and logistical considerations of any given residue and geo-graphic combination. On-ground partnerships between manufacturers and residue-providers offer the most promising potential.
– Unlike wood and forest residues, which work well with physical processing only, agro- residues generally work best with a combination of physical and chemical processing. The envi-ronmental, social and economic implications of scaling any given residue are varied and unique, and have to be approached accordingly.
- New technologies require several rounds of iterations, in the lab and in the field, in order to properly demonstrate mainstream pilot manufacturing potential.
• As a result – as well as the advisability of max-imising proximity of agro-residue resources to processing capacity – in the near-term, iterating a set of distributed local efforts will likely prove more effective than investing in larger, individual vertical efforts.
R4. Stakeholder engagement, industry lead-ership, and tools for accelerationA set of actions and steps have been identified that the apparel and fashion as a whole – and particular-ly, brands and sector leaders – can take to activate and accelerate the commercialisation of agro-resi-dues as a sustainable alternative fibre feedstock:
• Establish a South/Southeast Asia Fibre Alliance. The industry should establish a steering and exploratory alliance to help drive coordinated and ambitious action across the region. The Alli-ance should include key academic and research institutions (ICRISAT, MSSRF), current innova-tors (Spinnova, Nanollose, Agraloop, Phool, etc.), leading brands, manufacturers and local industry associations (Ramatex, Arvind, Dyers Associa-tion of Tirupur, etc.), farmer cooperatives, and government extensions (Krishi Vikas Kendra’s), and should include regional sub-platforms. The Alliance should aim to boost collaboration around targeted investments in infrastructure, technology, manufacturing tie-ups, and stakeholder engage-ment. The Alliance would bring together key players, spread risks and costs, help source and process agro-residues, ensure sustainability, and advance technological innovation.
- Third party aggregation- Direct community engagement- Tie-up with the largest provider- Open market purchases Storage tie-ups
Feedstock selection based on fibre length,cellulose content, low silicates
Distributed, franchise model with relativelysmaller to medium processing capacaties
Closest to scource
Co-locating centrally
Field Fibre Fodder Fuel
Addressing competing uses
Feedstock procurement
Pre processing
Technology and innovator tie-ups
More sustainable but limited residue coverage
Physical
Premium against mass market, performance etc.
Product line
Works across a larger spectrum of resideus
Chemical and physical
ProcessingManufacturing, retail and marketing
Low
est l
ogis
tics c
ost
Blen
ding
of d
iffer
ent a
gro-
resi
deu
type
s
Follo
w u
p bl
endi
ng w
ith n
atur
al an
d m
an-m
ade fi
bers
Opt
imiz
atio
n fr
om cu
rren
t 1.2
- 1.
5 x c
ostin
g, to
com
mer
cial
scal
e
Consumer awareness and brand building
Certi�cation and traceability
Figure 6.2 Stage-specific recommendations to build an ecosystem for alternative textile value chains

103102
Spinning Future Threads
• Conduct intensive stakeholder communi-ty-based engagement and relationship building to strengthen the enabling environment for agro-residue collection and processing. This could include direct engagement with promising hub communities to socialise ideas and identify opportunities; establishing collaborative working relationships between farmers, farm cooperatives, and manufacturers or manufacturing associations; working with third-party aggregators to advance prototypes for fibre production; identifying poten-tial socio-economic and environmental impacts of proposed models; and, developing infrastructure plans for addressing any gaps in existing systems and capacities.
• Conduct a consumer awareness-building campaign. Cost projections of well-optimised agro-residue-based textile fibre production are expected to be higher than the existing range in the industry. As in other sectors, like green construction, PV solar, lighting, etc., studies have shown that consumer awareness and sustain-ability impact campaigns, along with supporting regulations and voluntary commitments, can help support and accelerate the mainstreaming of alternative sustainable value chains in major consumer industries. Science-based targets and consumer awareness can help brands, innovators and manufacturers tip market demand in favour of agro-residue-based apparel.
• Convene industry and cross-sector poli-cy dialogues. Activating agro-residue value chains is a cross-sector systems challenge. The research in this report highlights opportunities for industry collaboration and policy develop-ment to help address existing barriers. A series of dialogues spotlighting the potential, current state of the field, and recommendations for the future, would help bring more resources and expertise to bear and develop new strategies for tackling or overcoming obvious challenges. Topics could include waste accumulation and aggregation, waste disposal and transportation, farm cooper-ative models, environmental and climate benefits, and market & commercial guidelines for agro- residue uptake and processing.
• Decision support tools. A decision support tool or scenario generator – online, or easily distributable
– would help communities, government agencies,
manufacturers, innovators and brands interested in agro-residue-based fibres to assess and model different approaches. Such a tool would include standard estimates on labor and logistical costs, residue availability, impurity and yield estimates, etc. Such tools would help demystify agro-residue value chains, and help model possible applications using best practices and standard assumptions. It would also help facilitate community participation and secure community buy-in.
• Centralised data warehousing, and capacity building. A series of decentralised deep dive stud-ies would help fine-tune the findings in this report, and dial in specific future prospects for commer-cialisation (for example, given the prominence of rice husk across the study region, it could form the basis of a deeper-dive study). These studies could be paired with up with specific community and stakeholder capacity building sessions, to close the loop on establishing buy-in and securing environ-mental benefits and livelihood opportunities.
Box 6.1: Cases of intermediary pulping processors
Kriya Labs, a start-up at the Indian Institute of Technology Delhi, pulps large quantities of rice and wheat crop residues generated after harvesting in the northern states of India. Kriya Labs converts 15-20 million tonnes of rice straw to cellulose pulp annually. This pulp can be used as an intermediary product for industries such as paper, bioethanol, fabrics, and specialty chemicals like cellulose acetate and carboxymethyl cellulose.
Another intermediary BIO-LUTIONS India, purchases a variety of agricultural residues from farmers in Ramangagara, Bengaluru, to make bio-degradable packaging and tableware. Their patented technology converts these residues into self-binding natural fibres through a mechanical process that does not require chemical- or energy-intensive cellulose extraction or bleaching.

2Annexures
107106
Spinning Future Threads
Table of Contents
Annexure 1 108From top crops to most promising agricultural residual sources
Annexure 2 128Crop production systems in the eight countries
Annexure 3 142Review of competing uses of selected agricultural biomass sources
Annexure 4 156Identification of hub locations and spatial mapping
Annexure 5 163Detailed description of chain design and cost assumptions for delivery of selected residual biomass at plant gate
Annexure 6 172 Stakeholder mapping and analysis
Annexure 7 174Questions sets for stakeholder consultations
Annexure 8 182Climate change and associated impacts on the shortlisted crops
Bibliography and References 196

109108
Spinning Future Threads
Annexure 1From top crops to most promising agricultural residual sources
Table A1.1: Top crops in terms of area (ha)
Crop Bangladesh Cambodia India Indonesia Pakistan Sri Lanka Thailand Vietnam Croparea_8_countries [ha]
%area Accumulated area share
Rice, paddy 11,910,361 2,981,680 44,500,000 15,995,000 2,810,030 1,040,954 10,407,272 7,570,741 97,216,038 30% 30%
Wheat 351,228 29,580,000 8,797,227 1,221 38,729,676 12% 41%
Maize 400,478 123,439 9,200,000 5,680,360 1,318,104 70,895 1,110,944 1,032,598 18,936,818 6% 47%
Seed cotton 15,544 182 12,350,000 5,291 2,372,968 - 2,000 606 14,746,591 4% 51%
Beans, dry 83,340 67,442 13,545,518 191,965 177,335 5,767 106,236 143,492 14,321,095 4% 56%
Chick peas 5,027 11,899,185 976,580 12,880,792 4% 60%
Soybeans 59,445 105,000 11,400,000 723,804 30 1,511 32,000 53,364 12,375,154 4% 63%
Millet 32,651 9,107,000 455,818 6,770 1,862 9,604,101 3% 66%
Rubber, natural 68,438 21,199 456,365 3,671,302 136,875 3,230,242 689,486 8,273,907 3% 69%
Sugar cane 90,155 26,830 4,730,000 416,671 1,101,946 15,732 1,372,169 269,434 8,022,937 2% 71%
Oil palm fruit 14,744 6,777,498 710,103 7,502,345 2% 74%
Rapeseed 307,516 6,700,000 223,402 7,230,918 2% 76%
Coconuts 43,000 13,035 2,098,946 3,247,986 1,417 455,330 194,448 154,684 6,208,846 2% 78%
Groundnuts, with shell 38,044 18,000 4,940,000 353,768 98,639 15,752 30,000 185,899 5,680,102 2% 79%
Pigeon peas 464 5,583,059 5 5,583,528 2% 81%
Sorghum 73 4,960,000 241,456 85 16,614 5,218,228 2% 83%
Vegetables, fresh nes 191,414 105,269 2,583,190 51,002 65,567 6,587 92,463 865,681 3,961,173 1% 84%
Mangoes, mangosteens, guavas
48,947 5,214 2,258,000 235,121 232,837 30,313 427,004 77,689 3,315,125 1% 85%
Cassava272,172 228,000 697,384 22,360 1,385,817 513,021 3,118,754 1% 86%

111110
Spinning Future Threads
Crop Bangladesh Cambodia India Indonesia Pakistan Sri Lanka Thailand Vietnam Croparea_8_countries [ha]
%area Accumulated area share
Potatoes 477,419 2,151,000 68,683 193,992 5,174 7,639 24,673 2,928,580 1% 87%
Pulses nes 90,179 2,210,202 2,679 3,995 107,328 135,838 2,550,221 1% 88%
Lentils 154,678 2,215,397 13,632 2,383,707 1% 88%
Coffee, green 476 444,256 1,241,514 7,005 43,254 618,879 2,355,384 1% 89%
Fruit, fresh nes 88,571 12,119 1,677,013 103,641 30,514 10,980 36,348 246,365 2,205,551 1% 90%
Sesame seed 37,568 40,000 1,730,000 83,372 11,873 45,000 29,059 1,976,872 1% 90%
Onions, dry 178,506 1,315,000 156,779 150,199 5,492 1,186 101,656 1,908,818 1% 91%
Cashew nuts, with shell 1,003,601 504,317 17,005 14,718 283,986 1,823,627 1% 91%
Cocoa, beans 78,369 1,678,269 2,225 42 1,758,905 1% 92%
Jute 758,248 254 764,359 11 142 125 1,523,139 0% 92%
Fruit, tropical fresh nes 105,944 454,000 196,628 64,535 502,815 1,323,922 0% 93%
Bananas 49,123 31,185 884,000 120,408 30,031 77,028 128,508 1,320,283 0% 93%
Tea 67,045 628,193 113,215 202,540 10,827 116,633 1,138,453 0% 94%
Chillies and peppers, dry 101,072 14,183 781,737 65,275 91,675 70,922 1,124,864 0% 94%
Peas, dry 15,638 997,735 40,355 1,053,728 0% 94%
Oranges 417 11,892 613,000 68,335 137,265 6,840 23,886 97,077 958,712 0% 94%
Spices nes 46,538 887,391 5,086 17,153 583 1,910 958,661 0% 95%
Tomatoes 28,130 786,000 53,850 58,359 6,712 5,190 938,241 0% 95%
Areca nuts 228,371 495,000 154,565 17,877 23,856 919,669 0% 95%
Castor oil seed 380 1,472 900,000 4,522 984 924 8,289 916,571 0% 96%
Anise, badian, fennel, cori-ander
885,435 7,091 892,526 0% 96%
Eggplants (aubergines)736,000 44,016 8,575 10,834 651 800,076 0% 96%
Tobacco, unmanufactured 42,458 7,526 417,754 203,014 46,331 1,338 19,585 13,463 751,469 0% 96%

113112
Spinning Future Threads
Crop Bangladesh Cambodia India Indonesia Pakistan Sri Lanka Thailand Vietnam Croparea_8_countries [ha]
%area Accumulated area share
Barley 297 661,000 57,582 13,092 731,971 0% 97%
Pumpkins, squash and gourds 27,990 580,244 7,737 26,469 8,469 8,303 659,212 0% 97%
Beans, green 20,594 252,366 122,699 1,716 7,345 167,982 572,702 0% 97%
Peas, green 543,000 26,992 265 570,257 0% 97%
Cloves 561,212 6,354 567,566 0% 97%
Cabbages and other brassicas 18,574 402,000 66,110 4,923 4,202 16,523 36,869 549,201 0% 97%
Okra 514,000 15,713 529,713 0% 98%
Cauliflowers and broccoli 19,459 459,000 12,531 12,620 1,023 7,289 511,922 0% 98%
Pepper (piper spp.) 369 130,870 187,003 43,508 435 107,392 469,577 0% 98%
Sunflower seed 280,000 104,736 31,000 415,736 0% 98%
Garlic 71,414 303,000 5,013 8,699 11,915 400,041 0% 98%
Apples 301,000 88,584 389,584 0% 98%
Sweet potatoes 25,739 8,239 122,336 90,707 1,586 4,099 117,933 370,639 0% 98%
Lemons and limes 22,304 302 286,000 11,937 10,094 14,410 345,047 0% 98%
Chillies and peppers, green 9,634 308,547 13,553 1,435 333,169 0% 99%
Linseed 5,633 320,000 2,821 328,454 0% 99%
Nutmeg, mace and carda-moms
83,618 202,325 870 286,813 0% 99%
Pineapples14,260 2,385 103,000 14,704 5,543 86,038 45,529 271,459 0% 99%
Source: FAOSTAT, data for 2018

115114
Spinning Future Threads
Crop Bangladesh Cambodia India Indonesia Pakistan Sri Lanka Thailand Vietnam Production 8 countries [tons]
% production
cumfreq
Sugar cane 3,638,731 594,252 376,900,000 21,744,000 67,173,975 644,785 104,360,867 17,945,204 593,001,814 29% 29%
Rice, paddy 56,417,319 10,647,212 172,580,000 83,037,000 10,802,949 3,929,831 32,192,087 44,046,250 413,652,648 20% 49%
Oil palm fruit 160,000 115,267,491 15,400,000 130,827,491 6% 55%
Wheat 1,099,373 99,700,000 25,076,149 1,351 125,876,873 6% 61%
Maize 3,288,102 604,333 27,820,000 30,253,938 6,308,897 270,041 5,004,125 4,874,054 78,423,490 4% 65%
Cassava 7,646,022 4,651,000 16,119,020 323,108 31,678,017 9,847,074 70,264,241 3% 69%
Potatoes 9,744,412 48,529,000 1,284,762 4,591,776 88,897 125,106 376,377 64,740,330 3% 72%
Vegetables, fresh nes 1,634,000 679,522 34,430,087 515,855 1,074,356 67,884 1,092,313 14,879,631 54,373,648 3% 75%
Oil, palm 32,000 40,567,230 2,776,800 43,376,030 2% 77%
Bananas 810,347 144,403 30,808,000 7,264,383 135,056 1,045,352 2,087,275 42,294,816 2% 79%
Coconuts 466,975 69,365 11,706,343 18,555,371 9,731 2,623,000 885,751 1,571,709 35,888,245 2% 80%
Mangoes, mangosteens, gua-vas
1,407,308 69,825 21,822,000 3,083,643 2,320,050 516,210 3,791,208 779,347 33,789,591 2% 82%
Onions, dry 1,737,714 22,071,000 1,503,438 2,119,675 107,050 31,035 400,587 27,970,499 1% 83%
Tomatoes 385,038 19,377,000 976,790 550,979 101,404 109,253 21,500,464 1% 84%
Seed cotton 56,809 242 14,657,000 417 4,828,439 - 2,994 330 19,546,231 1% 85%
Fruit, fresh nes 664,103 74,197 10,043,008 1,340,787 174,880 65,870 604,876 2,835,078 15,802,799 1% 86%
Soybeans 98,699 170,000 13,786,000 953,571 29 2,500 56,000 81,348 15,148,147 1% 87%
Oranges 3,315 66,462 8,367,000 2,510,442 1,589,856 56,788 516,426 852,685 13,962,974 1% 88%
Eggplants (aubergines) 12,826,000 551,552 87,587 129,212 19,926 13,614,277 1% 88%
Cottonseed 37,800 174 9,527,000 250 3,151,152 - 2,000 220 12,718,596 1% 89%
Fruit, tropical fresh nes 1,057,143 5,916,000 2,533,498 433,092 2,340,218 12,279,951 1% 89%
Cabbages and other brassicas 321,719 9,035,000 1,407,932 79,804 111,141 264,377 872,767 12,092,740 1% 90%
Table A1.2: Top crops in terms of production of main (food) product (tonnes/year)

117116
Spinning Future Threads
Crop Bangladesh Cambodia India Indonesia Pakistan Sri Lanka Thailand Vietnam Production 8 countries [tons]
% production
cumfreq
Millet 12,713 11,640,000 350,010 8,060 3,370 12,014,153 1% 91%
Chick peas 4,964 11,380,000 323,364 11,708,328 1% 91%
Palm kernels 9,350 10,330,000 645,000 10,984,350 1% 92%
Rubber, natural 6,878 21,872 978,317 3,630,268 82,560 4,744,250 1,137,725 10,601,870 1% 92%
Cauliflowers and broccoli 274,297 8,800,000 152,122 212,431 14,220 140,387 9,593,457 0% 93%
Rapeseed 351,537 8,430,000 260,523 9,042,060 0% 93%
Groundnuts, with shell 66,820 20,000 6,695,000 457,026 97,291 27,602 32,000 456,762 7,852,501 0% 94%
Papayas 131,598 5,989,000 887,591 7,201 176,043 7,191,433 0% 94%
Beans, dry 134,860 86,460 6,220,000 182,706 124,702 6,761 80,619 179,039 7,015,147 0% 94%
Pumpkins, squash and gourds 303,073 5,569,809 454,001 266,137 123,261 120,851 6,837,132 0% 95%
Pineapples 208,401 25,023 1,706,000 1,805,506 34,651 2,113,380 654,801 6,547,762 0% 95%
Cotton lint 18,900 65 4,690,000 125 1,677,287 - 700 110 6,387,187 0% 95%
Okra 6,126,000 120,637 6,246,637 0% 96%
Peas, green 5,430,000 178,231 3,680 5,611,911 0% 96%
Sorghum 87 4,800,000 148,729 169 34,157 4,983,142 0% 96%
Sweet potatoes 246,816 42,953 1,400,281 1,806,389 12,636 43,323 1,374,664 4,927,062 0% 96%
Watermelons 2,520,000 481,744 540,209 162,012 1,200,104 4,904,069 0% 97%
Pigeon peas 465 4,290,000 4 4,290,469 0% 97%
Lemons and limes 67,077 2,898 3,148,000 64,528 316,260 120,177 3,718,940 0% 97%
Cashew nuts, with shell 785,925 136,402 44,756 22,292 2,663,885 3,653,260 0% 97%
Jute 1,613,762 223 1,951,864 12 270 532 3,566,663 0% 97%
Grapes 2,920,000 67,180 82,820 25,165 3,095,165 0% 97%
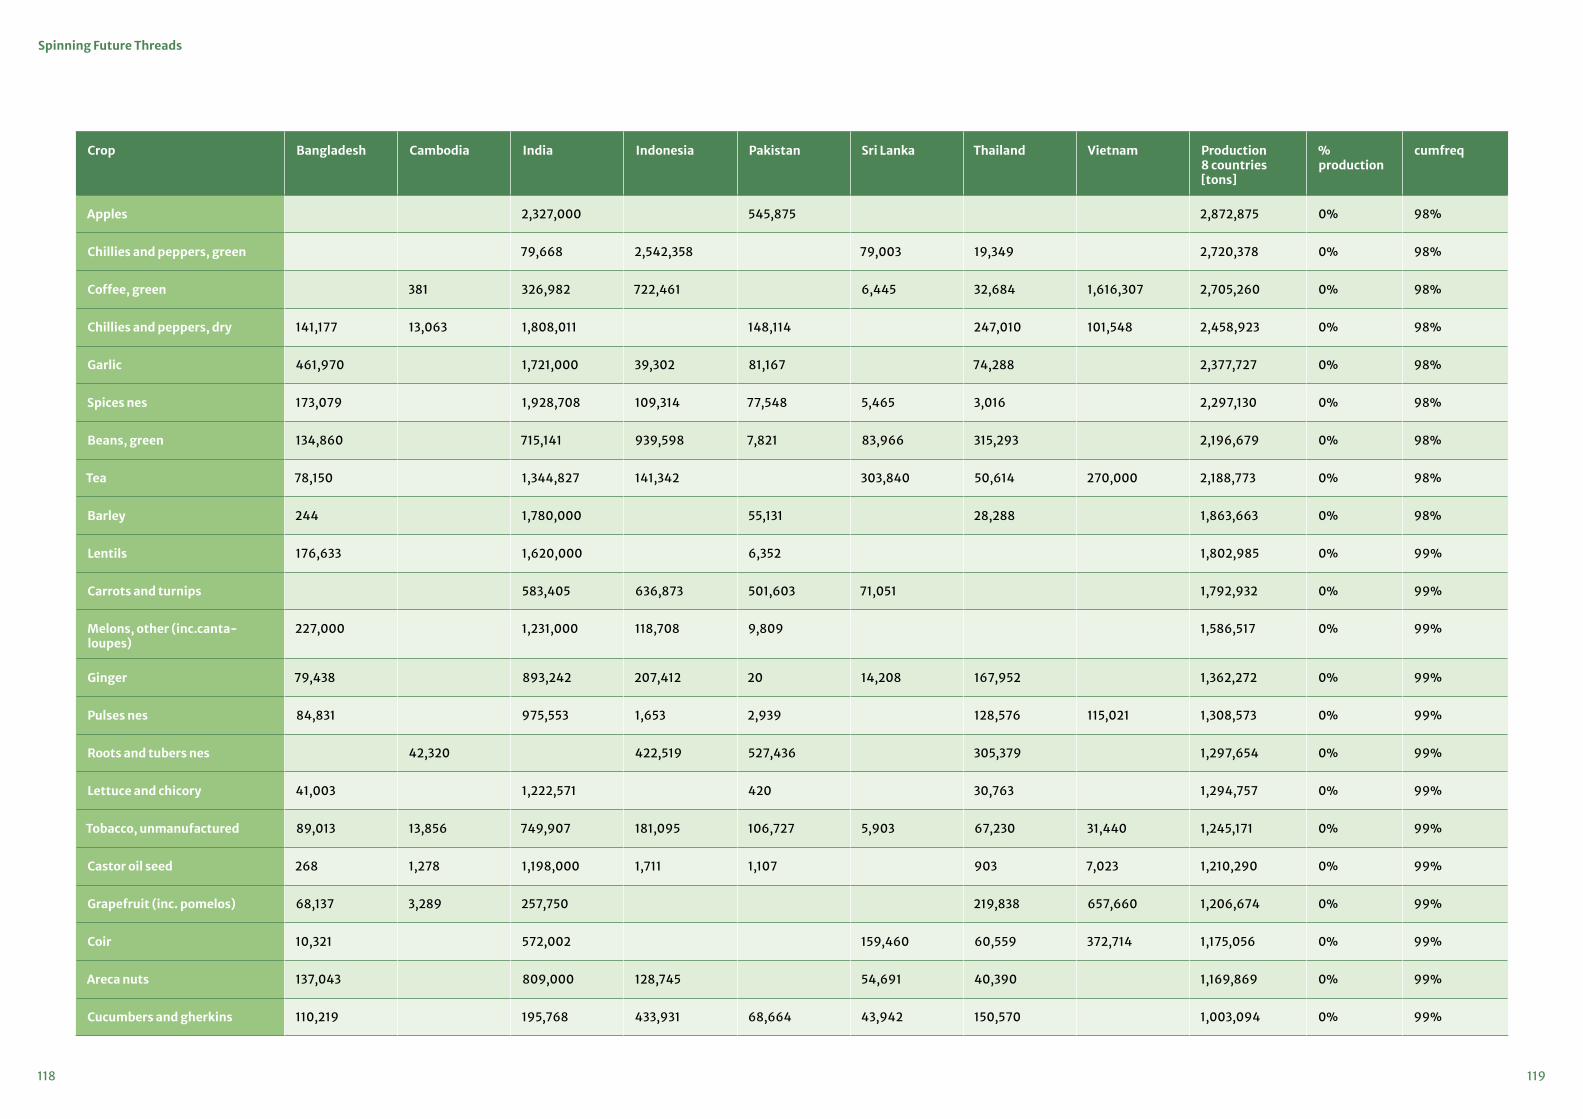
119118
Spinning Future Threads
Crop Bangladesh Cambodia India Indonesia Pakistan Sri Lanka Thailand Vietnam Production 8 countries [tons]
% production
cumfreq
Apples 2,327,000 545,875 2,872,875 0% 98%
Chillies and peppers, green 79,668 2,542,358 79,003 19,349 2,720,378 0% 98%
Coffee, green 381 326,982 722,461 6,445 32,684 1,616,307 2,705,260 0% 98%
Chillies and peppers, dry 141,177 13,063 1,808,011 148,114 247,010 101,548 2,458,923 0% 98%
Garlic 461,970 1,721,000 39,302 81,167 74,288 2,377,727 0% 98%
Spices nes 173,079 1,928,708 109,314 77,548 5,465 3,016 2,297,130 0% 98%
Beans, green 134,860 715,141 939,598 7,821 83,966 315,293 2,196,679 0% 98%
Tea 78,150 1,344,827 141,342 303,840 50,614 270,000 2,188,773 0% 98%
Barley 244 1,780,000 55,131 28,288 1,863,663 0% 98%
Lentils 176,633 1,620,000 6,352 1,802,985 0% 99%
Carrots and turnips 583,405 636,873 501,603 71,051 1,792,932 0% 99%
Melons, other (inc.canta-loupes)
227,000 1,231,000 118,708 9,809 1,586,517 0% 99%
Ginger 79,438 893,242 207,412 20 14,208 167,952 1,362,272 0% 99%
Pulses nes 84,831 975,553 1,653 2,939 128,576 115,021 1,308,573 0% 99%
Roots and tubers nes 42,320 422,519 527,436 305,379 1,297,654 0% 99%
Lettuce and chicory 41,003 1,222,571 420 30,763 1,294,757 0% 99%
Tobacco, unmanufactured 89,013 13,856 749,907 181,095 106,727 5,903 67,230 31,440 1,245,171 0% 99%
Castor oil seed 268 1,278 1,198,000 1,711 1,107 903 7,023 1,210,290 0% 99%
Grapefruit (inc. pomelos) 68,137 3,289 257,750 219,838 657,660 1,206,674 0% 99%
Coir 10,321 572,002 159,460 60,559 372,714 1,175,056 0% 99%
Areca nuts 137,043 809,000 128,745 54,691 40,390 1,169,869 0% 99%
Cucumbers and gherkins 110,219 195,768 433,931 68,664 43,942 150,570 1,003,094 0% 99%

121120
Spinning Future Threads
Crop Bangladesh Cambodia India Indonesia Pakistan Sri Lanka Thailand Vietnam Production 8 countries [tons]
% production
cumfreq
Peas, dry 17,429 920,473 27,123 965,025 0% 99%
Sesame seed 34,859 30,000 746,000 35,699 8,589 31,000 21,250 907,397 0% 99%
Maize, green 590,000 304,833 894,833 0% 99%
Fruit, citrus nes 773,250 14,088 787,338 0% 99%
Tangerines, mandarins, clem-entines, satsumas
22,086 593,572 139,147 754,805 0% 100%
Source: FAOSTAT, data for 2018
Table A1.3: Longlist of crops screened in terms of suitability for cellulose pulp and fibre extraction represented in the order of importance per country & in terms of production amount (of main product tonnes/year)
Top 40+ crops with largest production (tons) Ba
ngla
desh
Cam
bodi
a
Indi
a
Indo
nesi
a
Paki
stan
Sri L
anka
Thai
land
Viet
nam
Rice, paddy 1 1 2 2 3 1 2 1
Sugarcane 3 5 1 5 1 4 1 2
Vegetables, fresh nes 6 3 5 31 12 21 11 3
Cassava 2 1 7 6 3 4
Maize/Maize green 4 4 7 4 4 9 5 5
Fruit, fresh nes 12 10 17 19 29 15 6
Cashew nuts, with shell 28 7
Bananas 11 8 6 9 33 12 8
Coffee 31 25 39 9
Coconuts 13 12 14 6 57 2 13 10
Sweet potatoes 21 14 45 15 55 30 11
Top 40+ crops with largest production (tons) Ba
ngla
desh
Cam
bodi
a
Indi
a
Indo
nesi
a
Paki
stan
Sri L
anka
Thai
land
Viet
nam
Watermelons 36 32 17 26 12
Rubber, natural 51 19 50 10 18 6 13
Cabbages and other brassicas 17 19 18 42 13 21 14
Oranges 54 13 22 14 11 23 16 15
Mangoes, mangosteens, guavas 8 11 9 11 8 5 7 16
Grapefruits 37 26 23 17
Pineapples 23 18 43 16 31 10 18
Groundnuts, with shell 39 20 23 33 39 32 49 19
Onions, dry 5 8 17 9 14 50 20
Potatoes 2 4 20 6 16 1 21
Coir 10 22

123122
Spinning Future Threads
Top 40+ crops with largest production (tons) Ba
ngla
desh
Cam
bodi
a
Indi
a
Indo
nesi
a
Paki
stan
Sri L
anka
Thai
land
Viet
nam
Tea 8 23
Beans, dry 28 9 24 41 35 38 37 25
Cauliflowers and broccoli 19 20 44 27 61 27
Soybeans 32 6 12 22 71 44 42 31
Tobacco, unmanufactured 33 21 56 42 38 40 40 32
Sesame seed 44 17 58 87 50 36 51 36
Millet 49 15 22 37 40
Jute 7 33 38 76 73 65 75 41
Seed cotton 40 32 11 63 5 66 42
Cottonseed 43 34 18 66 7 68 43
Cotton lint 47 35 31 67 10 73 44
Chillies and peppers, green 73 22 72 80 84 68 59 62
Sugar crops 20 58 42 56 41 69 40 63
Roots and tubers nes 76 15 88 36 18 74 18 71
Tangerines, mandarins, clem-entines, satsumas 46 75 90 89 13 81 28 78
Dates 20 84
Oil palm fruit 7 1 4
Fruit, tropical fresh nes 10 27 13 21 9
Palm kernels 23 8 14
Beans, green 17 17
Cereals nes 20
Papayas 30 26 24 59 24
Top 40+ crops with largest production (tons) Ba
ngla
desh
Cam
bodi
a
Indi
a
Indo
nesi
a
Paki
stan
Sri L
anka
Thai
land
Viet
nam
Pumpkins, squash and gourds 18 28 35 25 12 32
Lemons and limes 38 27 34 7 34
Tomatoes 15 10 21 15 15 34
Sorghum 61 30 30 47 47
Eggplants (aubergines) 13 30 40 11 58
Peas, green 29 28 63
Wheat 9 3 2 70
Plantains and others 3
Carrots and turnips 19 20
Oilseeds nes 14
Apples 16
Chick peas 44 16 23
Rapeseed 16 21 26
Okra 25 36
Pigeon peas 57 33 74
Garlic 14

125124
Spinning Future Threads
Table A1.4: Crop-residue combinations on longlist characterised according to various parameters
Crop Residue RPR to dm Total residue [tonnes dm]
% dry in field/ mill
Conversion factor to cel-lulose
Total cellulose[tonnes dm]
Primary resi-due (field)
Secondary residue (mill)
DP (1 >2500, 2<2500)
Type of crop*
Option for vegetable fibre?**
Sugar cane Trash 0.14 177,900,544 88% 34% 18,145,856 1 1 3
Bagasse 0.14 83,020,254 46% 46% 17,567,086 1 1 3
Rice Straw 1.25 517,065,810 85% 38% 167,012,257 1 1 3
husk or hulls 0.28 115,822,741 90% 37% 38,568,973 1 2 3
Wheat Straw 1 125,876,873 85% 43% 46,007,997 1 1 3
Bran 0.2 25,175,375 87% 10% - 1 2 3
Oil, palm fruit (fresh bunch, incl oil)
Fronds 1.2 276,504,140 40% 30% 33,180,497 1 1 3
Petiole 0.05 11,521,006 35% 43% 1,713,750 1 3
Empty fruit bunch
0.37 85,255,443 50% 41% 8,974,864 1 1 3
Oil palm shell 0.079 8,203,189 85% - 1 1 3
Oil palm mesocarp fibre
0.21 48,388,225 84% 29% - 1 2 3
Maize Stover 0.5 39,211,745 30% 34% 3,999,598 1 2 3
Maize cobs 0.5 39,211,745 92% 40% 14,429,922 1 1 3
Cassava Cassava stalk 0.2 14,052,848 22% 18% - 1 2 -
Bananas+Plantains Banana fronts 0.14 6,015,388 14% 32% 269,489 1 1 3 1
Pseudostem 0.15 6,445,058 5% 62% 198,186 1 1 3 1
Inflorescent 1 42,967,055 - 1 3
Rejected fruit 0.15 6,445,058 - 2 3
Coconuts coconut husk 0.5 17,944,123 90% 35% 5,652,399 1 1 1 1 & 3 2
copra cake 0.1 3,588,825 91% 22% - 1 2 1 & 3
Mangoes, mango steens and guavas
Mango peels 0.15 5,068,439 16% 16% - 1 2 -
Mango seed 0.3 10,136,877 53% 4% - 1 2 -

127126
Spinning Future Threads
Crop Residue RPR to dm Total residue [tonnes dm]
% dry in field/ mill
Conversion factor to cel-lulose
Total cellulose[tonnes dm]
Primary resi-due (field)
Secondary residue (mill)
DP (1 >2500, 2<2500)
Type of crop*
Option for vegetable fibre?**
Tomatoes Stalks and leaves
0.1 2,150,046 5% - 1 1 -
Seed cotton Cotton stalks 3.5 68,411,809 50% 40% 13,682,362 1 1 1 1
Linter 0.03 586,387 95% 50% 278,534 -
1 1 1 1 1
Soy beans Straw 2.5 37,870,368 24% 31% 2,817,555 1 1 -
citrus add: Oranges, tangerines, manderines, lemons, grape fruit
Woody prun-ings
0.1 1,888,858 90% - 1 1 -
Pulp (skin) 0.3 5,666,576 50% - 1 1 -
Pulp (from juice industry)
0.15 2,833,288 50% - 1 1 -
Millet Straw 1 12,014,153 85% 12% - 1 1 -
Rubber, natural Old trees after replanting
0.1 1,060,187 90% - 1 1 3
Rapeseed Stalks 1 9,042,060 85% - 1 1 -
Groundnuts, with shell Groundnut shells
2.5 19,631,253 90% 20% - 1 2 -
Pineapple Leaves 0.25 1,636,941 5% - 1 1 3 1
Okra leaves 0.28 1,749,058 5% - 1 1 3 2
Sorghum Stalks and leaves
2.62 13,055,832 88% 44% 4,710,544 1 1 3
Sweet potatoes Leave and vines
0.5 2,463,531 13% 23% - 1 -
* Scoring: 1 Fibre crop textile; 2 Fibre crop other; 3 Fibre plant other primary use** Scoring: 1 Excellent suitability; 2 Only suitable to produce rough textiles from; 3 Related
to fibre plant, but no or little-known technical experience with conversion into textiles from the fibre; 4 New developments, known technical experience with conversion into textiles.
*** cellulose content (% of total dry mass and total cellulose available in tons dm), type of residue (primary or secondary residue), DP value (degree of polymerisation of the fibre in the residue, if DP more than 2500 fibre extraction may be considered for textile generation) and classification of fibre crops according to type* and suitability to be used for vegetal fibre extraction** for textile production.

129128
Spinning Future Threads
Annexure 2From top crops to most promising agricultural residual sources
Table A2.1: Description of crop production systems for selected crops in eight countries
Crop selected Country Crop production and processing system followed
Sugarcane India Climate: Sugarcane is a long duration crop, essentially considered as a tropical crop and thus encounters all the seasons, viz. Winter, summer and rainy during the crop cycle. Soil: Sugarcane grows best on medium heavy soils, but can also be raised on lighter soils and heavy clays, provided there is adequate irri-gation available in the former type of soils and drainage is good in the latter type of soils Season: In India, Sugarcane is planted thrice a year, October, Feb-March & July. Harvesting: Early varieties have to be harvested at 10 to 11 months age and mid-season varieties at 11 to 12 months age Plant part used as a food: The stem is an excellent source of sugar and is very nutritious
Sugarcane Thailand Climate: Climate change can directly affect crops through rising tem-perature and changing rainfallpatterns, or indirectly affect crops through soil, nutrients, and increas-ing pest interference. Studies revealed that crop yields have been affected by the variability of temperature, rainfall, and the interaction between them and climate change impacts will be different across locations, types of crop, scenarios, and farmer adaptation (Raymundo et al.2018)Soil: For a crop like sugar cane, soil water stress will invariably result in reduced growth and yield. Soil needs to be conserved and nourished. Sugarcane is well grown in loam, clay loam, or sandy loam. The topo-graphic area may be sloped, and hilly that may cause high erosion by forces of rain and wind. Furthermore, sugarcane requires a big planta-tion. In such conditions, there is a need for conservation and nourish-ment to sustain soil fertility (GAP, 2010).Season: Sugarcane farmers in the Northeast region generally plant their cane in October and November, and in the Eastern Central Plains region, November to February. Planting in the irrigated area of the North region is December to April and May to June in the rain-fed area. In the Western Central Plains area, planting in irrigated areas is from January to March and in the rain-fed area May to June. While the sugarcane crop calendar varies by region, the growing period is about 10-14 months depending on the variety of cane (FAO, 1997a).Harvesting: Sugarcane is harvested from November to March in Thai-land.
Crop selected Country Crop production and processing system followed
Sugarcane Thailand Sugarcane shall be harvested at the age of not less than 10 months or the Degree Brix of juice is not less than 20 degree Bx.Plant part used as a food: The stem is an excellent source of sugar and is very nutritious. Cultivation of sugarcane crop is carried out for crushing purpose to obtain sugar, Panela (Jaggery, gur) and other products. By-products like alcohol used in the pharmaceutical industry, ethanol used as a fuel, bagasse used for paper-making and chipboard manufacturing and press mud used as a rich source of organic matter that adds to soil fertility are derived after the cane is crushed.
Sugarcane Pakistan Climate: Sugarcane cultivation requires a tropical or subtropical cli-mate, with a minimum of 600 mm annual rainfall. In Pakistan sugar-cane is cultivated in three ecological zones i.e. north western, central and southern zones. Climatic conditions of lower Sindh (southern) are more favourable having hot and semi-humid climate.Soil: Sugar cane can be grown successfully on a great variety of soils. Sugarcane is a deep-rooted crop and proper soil preparation plays an important role in the development of the cane root system, and achieving optimal growth of the crop. The land should be prepared by deep ploughing at least after every two years. The soil should be disked (valleyirrigationpakistan.com).It is very important that well-rotted farmyard manure (FYM) should be applied a month prior to land preparation. Press mud from the sugar industry is another excellent source of organic matter and nutri-ents.Season: There are mainly two planting seasons for sugarcane: fall and spring. Fall planting starts from the first week of September and continues to mid-October in the Punjab and Sindh, while in the NWFP planting is done in October and November. Spring planting starts from mid-February and lasts until the end of March in Punjab and Sindh (Qureshi and Afghan, 2005).Harvesting: The harvesting period follows the pattern of many other northern hemisphere crops, beginning in November/December and ending in April/May. Punjab and NWFP mostly plant in spring, and harvest 8 to 10 months later (FAO, 1997b).Plant part used as a food: Stem
Rice Bangladesh Climate: The uneven topography and humid tropical climate of Ban-gladesh with abundant monsoon rain offers a unique environment for the rice plant. Aman crop experiences two extreme climates at two ends the period between April to August experiences higher tempera-tures with minimum diurnal fluctuation, moderate humidity during the reproductive stage, but with occasional scanty rainfall during the early vegetative growth period. Such a climate is very much conducive to higher vegetative growth of the crop with the lowest partitioning coefficient and development of pests and diseases.

131130
Spinning Future Threads
Crop selected Country Crop production and processing system followed
Rice Bangladesh Soil: The crop can be grown in a wide range of climatic and soil con-ditions, provided water is available, it has the widest adaptability to different soil types.Season: There are three rice-growing seasons in Bangladesh: aus, aman, and boro. Aus is the pre-monsoon upland rice growing sea-son under rainfed conditions. The monsoon-season rainfed rice is the aman, which is the most widespread, including along the coastal areas. Boro is the dry-season irrigated rice planted from December to early February.Harvesting: The largest harvest is aman, occurring in November and December and accounting for more than half of annual production. Some rice for the aman harvest is sown in the spring through the broadcast method, matures during the summer rains, and is harvested in the fall.Plant part used as a food: Rice milling is a process by which the husk is removed, and further produces an edible, rice grain that is suffi-ciently milled and free of impurities. If only the husk is removed then
‘brown’ rice is the product. If the rice is further milled or polished then the bran layer is removed to reveal ‘white’ rice.
Rice Cambodia Climate: Rice is the most important crop and accounts for 80% of Cambodia’s total agricultural production (Dek et al, 2017).Rice in Cambodia is grown in lowland rainfed, irrigated, upland rainfed, and deepwater ecosystems (Cosslett and Cosslett, 2018). Lowland rain-fed rice is produced across all provinces. Soil: The two broad types of rice soils in the lowlands are: a) old alluvial and colluvial plains which account for 67% of the lowland rice area and are generally light-tex-tured soils of low fertility used for rainfed wet season rice.b) soils in the active floodplains around the Tonle Sap Lake and the Mekong and Bassac Rivers that account for 30% of the rice area. These soils are heavy-textured and fertile, being formed from fresh alluvium deposited by annual floodwaters. They are submerged for three to five months of the year and are commonly used for deep-wa-ter rice and recessional/irrigated Dry Season rice (White et al. 1997).Season: Cambodia has two rice crops in a year. The major monsoon (long-cycle) planting season falls in late May through July. For the heavy rain wet climate, rice shoots are transplanted during sum-mer months through September. The annual flooding of the Mekong during the rainy season deposits a rich alluvial sediment that accounts for the fertility of the central plain and provides natural irrigation for rice cultivation.Harvesting: Crops are manually harvested and tied into sheaves. These sheaves are placed on top of the standing stubble or transported to a central threshing site where they are dried for 2-3 days. Depend-ing on locality, threshing is done at a central site in the field or in the village. The main harvest occurs for Short life rice (3months old) is in Aug/Sept and Long-life rice (6months old) in Dec/Jan.Plant part used as a food: Grain - Sticky rice - known as sweet rice or glutinous rice, Red rice or brown rice - a type of unpolished rice that has higher nutritional value and white rice.
Crop selected Country Crop production and processing system followed
Rice India Climate: In India rice is grown under widely varying conditions of altitude and climate. Rice crops need a hot and humid climate. It is best suited to regions which have high humidity, prolonged sunshine and an assured supply of water. The average temperature required throughout the life period of the crop ranges from 21 to 37º C. Soil: Rice can be cultivated in wide varieties of soils such as silts, loams and gravels. Deep fertile clayey or loamy soils are best suited for rice cultivationSeason: In India, rice is mostly cultivated in Kharif season i.e., June to October. Depending upon the water availability it can be grown in Rabi (Oct-Jan) and summer (Jan-May) season as well (FAO, 1997c).Harvesting: Normally short duration varieties take 100−120 days, medium duration 120−140 days, and long duration +160 days to har-vestPlant part used as a food: Grain
Rice Indonesia Climate: The Indonesian Ministry of Agriculture has developed a tool called “Integrated Cropping Calendar System (KATAM)” to support in increasing food production and helping farmers to adapt to the changing climate (Riga, 2016). Most of Indonesia has a moist tropical climate, with abundant rain and high temperatures. Rice production is heavily concentrated on the islands of Java and Sumatra. Rice is grown year-round, with some farmers being able to grow three crops a year, but it is common to grow two rice crops a year.Soil: Rice is cultivated in both lowland and upland elevations through-out Indonesia, with the upland crop typically being rainfed and receiv-ing only low levels of fertilizer applications. Irrigated lowland rice is both well-watered and heavily fertilized. The nutritional requirements of the rice crop and the availability of nutrients in soil and irrigation water is calculated to ensure the proper amount of fertilizer for each field. (International Nature Farming Research Center, 1988)Season: There are three rice growing periods or seasons in Indonesia, a single wet season crop followed by two dry season crops.Harvesting: Rice is planted and harvested twice a year in Ubud. Planting seasons are from January to February and July to August. Harvesting takes place from April to May and October to November. Approximately 45 percent of total production is usually from the wet season crop, cultivated from October to December and harvested from March through April (IPAD, 2016).Plant part used as a food: Grain. Indonesians typically eat steamed long-grain rice with their meals (sticky rice is usually used for desserts or sweet snacks). Indonesian rice isn’t exported, but jasmine or other long-grain rice may be substituted.

133132
Spinning Future Threads
Crop selected Country Crop production and processing system followed
Rice Pakistan Climate: Pakistan is considered amongst the highly vulnerable coun-tries under the impact of climate change due to its varied demographic and topographic structure. Climate plays a holistically significant role for agricultural productivity. The rice crop, grown in mild temperature with standing water in paddy fields, is already under heat stress and further rise in temperature may affect the crop badly (PIDE, 2016). Soil: Punjab is the largest rice-producing province and the famous Basmati rice is produced between the Ravi and Chenab rivers. Rice is planted only under irrigated conditions and three methods of land preparation for rice are used for the production purpose: complete puddling, partial puddling, and dry land preparation, depending upon the availability of water, soil type, and farm implements. Rice is cul-tivated in many different climates and on a wide range of soils, with tremendous differences in soil properties.Season: “Kharif “and “Rabi” are two agricultural seasons in Pakistan. The kharif season falls in the summer growing period from May to November, with one of the major crops cultivated being rice. The rabi or winter growing season runs from December through April. Harvesting: Rice crop is mainly rainfed and it is planted in the months of May-June during the kharif season. The annual rice har-vesting occurs from October-December.Plant part used as a food: There are various types of rice created during the growing and threshing of grains such as Kernel rice, Super Kernel, Irri-6, Basmati, Saila, Tota, etc
Rice Sri Lanka Climate: Sri Lanka exemplifies a variety of climatic conditions depend-ing on the geographical settings of respective locations. In Sri Lanka, rice is grown under a wide range of physical environments such as dif-ferent elevations, soils and hydrological regimes. There is a wide range of climatic and soil conditions in the country. There are 7 major AEZs based on rainfall and elevation, which are further subdivided into 24 agro-ecological regions, considering the rainfall distribution, soil type and the landform, where rice is produced (Papademetriou et al. 2000).Soil: Soils with a sulfuric horizon or sulfidic materials within 50 cm of the soil surface are not considered suitable for rice production. Alluvial soils are reddish to brownish in colour, moderately fine textured and imperfectly to poorly drained. These soils majorly occur in the flood plains and these soils are generally deep. They are more suitable for rice cultivation.Season: Based on inter-monsoon rain fed systems with the North-east monsoon, the major cultivation season (Maha) begins from late September to early March. The minor cultivation season (Yala) based on an irrigated system, begins from early April to early September, bringing rain mostly to the Southwest region of Sri Lanka. Farmers are encouraged to follow a uniform cultivation calendar, as correct tim-ing in planting and harvesting within the season, reduces the risk of terminal drought and pest and disease incidences.
Crop selected Country Crop production and processing system followed
Rice Sri Lanka Harvesting: According to the GAIN Report 2019, the Maha crop is typ-ically harvested in March/April and provides about 60 to 65 percent of Sri Lanka’s annual rice production. The Yala crop is typically harvested in August/ September and provides 35 to 40 percent of Sri Lanka’s annual rice production.Plant part used as a food: Across the country, varietal preferenc-es include both long grain and short grain rice, raw or boiled form, in white or red pericarp. Long grain raw rice (non-parboiled) is the most-consumed type.
Rice Thailand Climate: Rice production in Thailand can be classified into four eco-systems; irrigated, rainfed lowland, deepwater, and upland. Rainfed lowland is the most predominant, followed by irrigated, deepwater, and upland. The major production constraints are rainfall variabili-ty, drought, submergence, and inherently low soil fertility (FAOSTAT, 2012). Soil: Most of the non-aromatic white rice for the domestic and export markets is produced in the irrigated areas of the Central Region, whereas most of the fragrant KDML105 rice is produced under rainfed conditions in the Northeast. Most paddy land is rainfed and can only support a crop of rice in the wet season (May to October). The Rainfed lowland rice are cultivated in the shallow depressions with more clayey soils, called the lower paddies (Wada, 2005).Season: Rice is grown in all provinces of Thailand. More than 50 percent of the total rice growing areas are in the northeast region, but the Central Plains is known as the “rice bowl” of Thailand (FAO, 2002). In northern and northeastern regions, the main rice season lasts from May to December, while in the southern region, the main rice crop lasts from September to May.Harvesting: The rice-planting season in Thailand usually starts in May. The rice enjoys the rainfall during the monsoon season through till September. The rice turns from emerald, to a darker green and finally to dry gold under the strong sun. Rice is ready to be harvested by November end. Plant part used as a food: The vast majority is rainfed rice, grown only in the wet season; the rest is irrigated, with small amounts of dry-season production. The most well-known variety is Jasmine rice, a long-grain, flowery smelling rice.
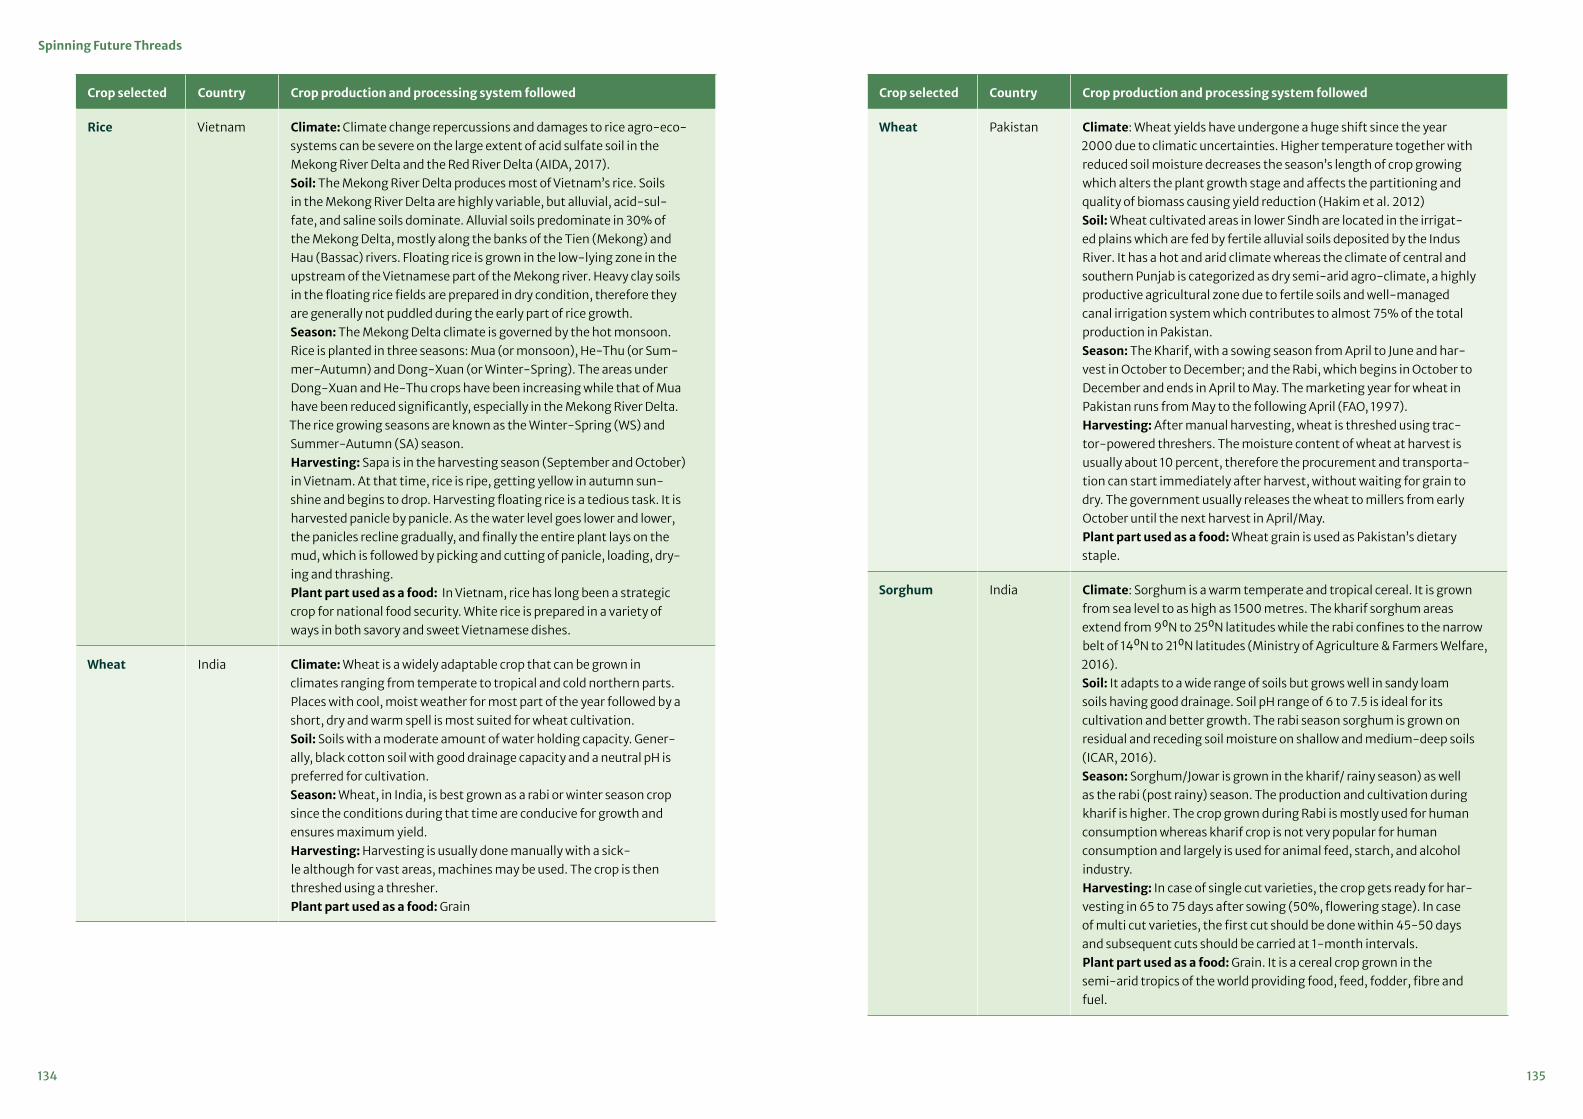
135134
Spinning Future Threads
Crop selected Country Crop production and processing system followed
Rice Vietnam Climate: Climate change repercussions and damages to rice agro-eco-systems can be severe on the large extent of acid sulfate soil in the Mekong River Delta and the Red River Delta (AIDA, 2017). Soil: The Mekong River Delta produces most of Vietnam’s rice. Soils in the Mekong River Delta are highly variable, but alluvial, acid-sul-fate, and saline soils dominate. Alluvial soils predominate in 30% of the Mekong Delta, mostly along the banks of the Tien (Mekong) and Hau (Bassac) rivers. Floating rice is grown in the low-lying zone in the upstream of the Vietnamese part of the Mekong river. Heavy clay soils in the floating rice fields are prepared in dry condition, therefore they are generally not puddled during the early part of rice growth.Season: The Mekong Delta climate is governed by the hot monsoon. Rice is planted in three seasons: Mua (or monsoon), He-Thu (or Sum-mer-Autumn) and Dong-Xuan (or Winter-Spring). The areas under Dong-Xuan and He-Thu crops have been increasing while that of Mua have been reduced significantly, especially in the Mekong River Delta. The rice growing seasons are known as the Winter-Spring (WS) and Summer-Autumn (SA) season.Harvesting: Sapa is in the harvesting season (September and October) in Vietnam. At that time, rice is ripe, getting yellow in autumn sun-shine and begins to drop. Harvesting floating rice is a tedious task. It is harvested panicle by panicle. As the water level goes lower and lower, the panicles recline gradually, and finally the entire plant lays on the mud, which is followed by picking and cutting of panicle, loading, dry-ing and thrashing. Plant part used as a food: In Vietnam, rice has long been a strategic crop for national food security. White rice is prepared in a variety of ways in both savory and sweet Vietnamese dishes.
Wheat India Climate: Wheat is a widely adaptable crop that can be grown in climates ranging from temperate to tropical and cold northern parts. Places with cool, moist weather for most part of the year followed by a short, dry and warm spell is most suited for wheat cultivation.Soil: Soils with a moderate amount of water holding capacity. Gener-ally, black cotton soil with good drainage capacity and a neutral pH is preferred for cultivation.Season: Wheat, in India, is best grown as a rabi or winter season crop since the conditions during that time are conducive for growth and ensures maximum yield. Harvesting: Harvesting is usually done manually with a sick-le although for vast areas, machines may be used. The crop is then threshed using a thresher. Plant part used as a food: Grain
Crop selected Country Crop production and processing system followed
Wheat Pakistan Climate: Wheat yields have undergone a huge shift since the year 2000 due to climatic uncertainties. Higher temperature together with reduced soil moisture decreases the season’s length of crop growing which alters the plant growth stage and affects the partitioning and quality of biomass causing yield reduction (Hakim et al. 2012)Soil: Wheat cultivated areas in lower Sindh are located in the irrigat-ed plains which are fed by fertile alluvial soils deposited by the Indus River. It has a hot and arid climate whereas the climate of central and southern Punjab is categorized as dry semi-arid agro-climate, a highly productive agricultural zone due to fertile soils and well-managed canal irrigation system which contributes to almost 75% of the total production in Pakistan.Season: The Kharif, with a sowing season from April to June and har-vest in October to December; and the Rabi, which begins in October to December and ends in April to May. The marketing year for wheat in Pakistan runs from May to the following April (FAO, 1997).Harvesting: After manual harvesting, wheat is threshed using trac-tor-powered threshers. The moisture content of wheat at harvest is usually about 10 percent, therefore the procurement and transporta-tion can start immediately after harvest, without waiting for grain to dry. The government usually releases the wheat to millers from early October until the next harvest in April/May. Plant part used as a food: Wheat grain is used as Pakistan’s dietary staple.
Sorghum India Climate: Sorghum is a warm temperate and tropical cereal. It is grown from sea level to as high as 1500 metres. The kharif sorghum areas extend from 9⁰N to 25⁰N latitudes while the rabi confines to the narrow belt of 14⁰N to 21⁰N latitudes (Ministry of Agriculture & Farmers Welfare, 2016).Soil: It adapts to a wide range of soils but grows well in sandy loam soils having good drainage. Soil pH range of 6 to 7.5 is ideal for its cultivation and better growth. The rabi season sorghum is grown on residual and receding soil moisture on shallow and medium-deep soils (ICAR, 2016).Season: Sorghum/Jowar is grown in the kharif/ rainy season) as well as the rabi (post rainy) season. The production and cultivation during kharif is higher. The crop grown during Rabi is mostly used for human consumption whereas kharif crop is not very popular for human consumption and largely is used for animal feed, starch, and alcohol industry. Harvesting: In case of single cut varieties, the crop gets ready for har-vesting in 65 to 75 days after sowing (50%, flowering stage). In case of multi cut varieties, the first cut should be done within 45-50 days and subsequent cuts should be carried at 1-month intervals.Plant part used as a food: Grain. It is a cereal crop grown in the semi-arid tropics of the world providing food, feed, fodder, fibre and fuel.

137136
Spinning Future Threads
Crop selected Country Crop production and processing system followed
Oil Palm Indonesia Climate: With high rainfall (minimum 1600 mm/year) and a tropical climate within 10 degrees of the equator, the east coast of Sumatra is the most suitable area for growing Palm oil (Budidarsono, 2013). There are negative consequences of land conversion and deforestation on biodiversity and temperature due to plantation of Palm oil. Soil: Palm oil production is land-intensive, and much of Indonesia’s rainforest had been cleared to make way for plantations for palm oil. In core smallholders, palm plants are cultivated on mineral soils, therefore the largest composition of land used is mineral soils com-pared to peatlands.Season: The oil palms usually take 2.5 to 3 years after the plantation in the main field to be ready for harvest. Determining harvesting time is very important in oil palm cultivation as it greatly impacts the qual-ity and quantity of oil.Harvesting: The young palms begin to produce the first harvestable fruit bunches after 30-36 months in the field. Peak harvest occurs from years 8 to 15. The economically viable lifespan of an oil palm is typically 22 to 25 years depending upon oil price, economically harvestable height, and yield. The 25 feet height is an industry limit which is based loosely on the height of the average harvester plus the length of the long sickle harvesting pole (IPAD, 2016).Plant part used as a food: Palm oil is extracted from the fruit of the oil palm tree. Itis an important plantation crop-producing food oil, industrial oil, and biofuels
Oil Palm Thailand Climate: Oil Palm thrives in wild, semi-wild and cultivated areas in the regions of equatorial tropics. The tree requires a deep soil, a rel-atively stable high temperature and continuous moisture throughout the year.Soil: Oil Palm thrive best in well- drained deep loamy moist and alluvial soils rich in organic matter. These trees require at least 1 meter soil depth. Most of Thailand’s palm oil is grown in the southern part of the country. In one protected area, called Pru Kachin, oil palm is grown in peatlands, for which the swampy peat must be drained – which releases carbon into the atmosphere and makes the forests that over-lay them more susceptible to fire.Season: The oil palm requires an evenly distributed annual rainfall of 1500 - 2000 mm or more, without a defined dry season. Best oil palm yields are obtained in those places where there is a maximum average temperature of 29°C - 33°C and a minimum average temperature of 22°C - 24°C.Harvesting: Oil palm normally harvests all through the yearPlant part used as a food: Palm oil extracted from the fruit, is used in a wide variety of products such as food items (cooking oil, margarine, sweet), commodities (cosmetics, soap, candle), and alternative fuel source-biodiesel. (Phitthayaphinant et al. 2012)
Crop selected Country Crop production and processing system followed
Maize India Climate: Maize is cultivated on nearly 150 m ha in about 160 coun-tries having wider diversity of soil, climate, biodiversity and manage-ment practices. Soil: Variety of soils ranging from loamy sand to clay loam can be used to grow maize. However, soils with good organic matter content having high water holding capacity with neutral pH are considered good for higher productivity in India (farmer.gov.in). Season: Maize can be grown in all seasons such as Kharif (monsoon), post monsoon, Rabi (winter) and spring. During Rabi and spring sea-sons to achieve higher yield, irrigation facilities are required (Parihar et al. 2011).Harvesting: Maize grows best in fertile well irrigated, medium, heavy loamy soil. It is also commonly grown in the carse ravel soils of hilly maize tracts. In India the maize crops are generally sown in June-July and harvested in September-October.Plant part used as a food: maize can be consumed directly or used for corn ethanol, animal feed and other maize products, such as corn starch and corn syrup. The six major types of maize are dent corn, flint corn, pod corn, popcorn, flour corn, and sweet corn.
Maize Indonesia Climate: The tropical and wet climate of Indonesia is favourable to grow multiple crops in the same piece of land within the same year. Average temperature is around 26-28⁰C, with total annual rainfall ranging from 1,000 mm in East Nusa Tenggara and Palu Valley to more than 3,000 mm in most parts of Sumatra, South Kalimantan, West Java, Central Java, and South Sulawesi.Soil: The maize ecozones are divided into four: Java and Bali, Sumatra, Sulawesi and Nusa Tenggara, and Kalimantan (Swastika et al. 2004). Indonesia is home to the volcanic soil, which has been scientifically proven to be rich with the necessary nutrients needed by plants to grow. The regular PH level of around 2-7 is the perfect condition for plants to grow. Season: Maize can grow in regions with consistent weather that ensures the sustainable supply of sunlight and water. Indonesia’s first maize season normally takes place from October to February followed by the second season which takes place from March to June, while the third runs from July to September (GAIN Report, 2019).Harvesting: Java, the main maize producing area in Indonesia, fol-lowed by Sulawesi, Sumatera, and Nusa Tenggara.Plant part used as a food: In some provinces, such as East Java, East Nusa Tenggara (NTT), North Sulawesi, South-East Sulawesi, and Irian Jaya, maize is consumed as a staple food.

139138
Spinning Future Threads
Crop selected Country Crop production and processing system followed
Banana & plantain
India Climate: Banana is a tropical plant requiring a warm and humid climate. Banana requires on an average, 1700mm rainfall distributed throughout the year for its satisfactory growth.Soil: Deep soils with good drainage, rich loamy and silty clay loam soil with pH between 6-7.5 is most preferred for banana cultivation. Ill drained, poorly aerated and nutritionally deficient soils are not suitable for bananas. Extreme clayey, Sandy soil, Saline soil and Calcareous soil is not suitable for Banana cultivation.Season: Banana plantation can be done in April-May or Septem-ber-OctoberHarvesting: The dwarf banana varieties are ready for harvest with-in 11-14 months after planting, while tall cultivars take about 14-16 months to harvest. A bunch usually takes 90-120 days to mature after shooting.Plant part used as a food:Fruits
Coconut India Climate: Coconut is a tropical crop and grows well in a hot climate. Temperature is an important weather factor that has great influence on the growth and productivity of the coconut palm as it requires plenty of sunlight. As per the Tamil Nadu Agricultural University, a mean annual temperature of 27 degree C is best for vigorous growth and good yield.Soil: Coconut is grown in different soil types such as laterite, coastal sandy, alluvial, and also in reclaimed soils of the marshy lowlands. It tolerates salinity and a wide range of pH (from 5.0-8.0). Imperfectly drained soil, shallow soils with underlying hard rock, low-lying areas, and heavy clay soils are not suitable for coconut cultivation. Season: The fruit of the coconut palm is harvested at different stag-es of maturity. For copra, it is harvested fully ripe at about 11 to 12 months when the husk has turned brown. For coir, it is picked at least a month earlier, when the fruit is still green.Harvesting: The harvesting period in Tamil Nadu and Karnataka lie between February to August, while in case of Kerala, it is December to May. The seed nuts are harvested during April-May which are planted in June in the west coast region, whereas sowing is done in October – November in the East Coast region.Plant part used as a food: Flesh and water
Coconut Indonesia Climate: The locations of coconut are scattered almost evenly throughout the country islands mainly in Sumatera, Java, Sulawesi, Bali, West Nusa etc.Soil: The coconut tolerates a very wide range of soil conditions, from the almost pure coral found on atolls, to peats and acid swamps. Clay-ey soils are not suitable for coconut production. Season: The coconut palm can grow and bear fruits with a well dis-tributed rainfall of 100 cm but for profitable cultivation, 100 cm to 225 cm per annum, evenly distributed throughout the year are necessary. Coconut plants require an even amount of rainfall throughout the year of 2500-3500 mm (Y Matana et al. 2020).
Crop selected Country Crop production and processing system followed
Coconut Indonesia Harvesting: Coconut includes annual crops that bear fruit through-out the year. Coconut trees entering productive age can produce 12–15 bouquets a year, which means that a coconut tree produces a wreath almost every month (Simpala et al., 2015). Coconut is har-vested by farmers by climbing trees using hands or notches on tree trunks as a foothold. Farmers used machetes to cut ripe coconuts from bunches. The harvested fruits were then grouped according to their age.Plant part used as a food: The white, fleshy part of the coconut seed is called coconut meat. Coconut water is high in potassium and sugar which makes it a great drink.
Pineapple India Climate: Pineapple is suitable for cultivation in humid tropics. The fruit grows well near the sea coast as well as in the interior; so long the tem-peratures are not extreme. It grows well, both in the plains and also at elevations of 900-1100m above sea level. It tolerates neither very high temperature nor frost. The optimum temperature required for successful cultivation is 220-320 °C. The cultivation of pineapple is confined to high rainfall and humid coastal regions in the peninsular India and hilly areas of north-eastern region of the country. Soil: Pineapple grows in almost any type of soil, provided it is free-draining. Slightly acidic soil with a pH range of 5.5 to 6.0 is considered optimum for pineapple cultivation. The soil must be well drained and light in texture. Heavy clay soil is not preferred. It can grow in sandy, alluvial or laterite soil.Season: Areas with heavy rainfall are best for pineapple growth. Optimum rainfall is 1500 mm per year although it can grow in areas having 500 mm to 5550 mm of rainfall.Harvesting: Pineapple plants flower 12-15 months after planting and the fruits become ready 15-18 months after planting depending upon the variety, time of planting, type and size of plant material used and prevailing temperature during the fruit development. Under natural conditions, pineapple comes to harvest during May-August. The fruit usually ripens about 5 months after flowering. Irregular flowering results in the harvesting spread over a long period. Most common varieties grown in India are - Kew, Giant Kew, Queen, Mauritius, jaldh-up, lakhat etc. (icar.gov.in)Plant part used as a food: Pineapple core and flesh
Pineapple Indonesia Climate: Pineapple cultivation is plannable, which is one of its major characteristics. Depending on the pedoclimatic conditions, it is pos-sible to organise continuous year-round production. Moreover, the choice of starting plant stock makes it possible to predict the fruit size upon harvesting; generally larger for industrial applications.Soil: Quality of pineapple varies due to cultivation technique, growing environment and variety. Good quality pineapple grows well in acidic loams, sandy loams and clay loams soils under warm and humid cli-mate with sunny days and cool nights (Hossain, 2016).

141140
Spinning Future Threads
Crop selected Country Crop production and processing system followed
Pineapple Indonesia Season: Indonesia has a dry season in which irrigation activities are needed to grow plants. Irrigation on pineapple plant is very important because it affects the growth and production (Cahyono et al. 2018).Harvesting: One of the pineapple varieties In Indonesia is called the ‘Nanas Palembang’ and as the name suggests is grown in the area around Palembang - capital of South Sumatra. For this variety of Indonesian pineapple, the bumper harvest times are during the months of December, January and July. Plant part used as a food: Flesh
Pineapple Thailand Climate: Thailand has the right range of temperature and the type of soil to grow pineapples. They can grow well in the temperature ranging from 23.9 °C to 29.4 °C with rainfall ranging from 1,000-1,500 ml per year. Soil: The types of soil that are good for pineapples are loose loam, sand loam, gravel soil, and seashore soil. The plantation areas are mostly low plain with a mixture of loose and sandy soil. Most farm-ers rely on natural water resources and small numbers employ water irrigation during a period of drought.Season: A crop of pineapples can be grown to maturity at any time of the year, with suitable size of plants, planting time and flower induc-tion, but the physical characteristics and eating quality vary widely with seasons. The crop harvested in summer has the highest fruit weight and the fruit is mainly conical in shape with a rosette crown, while most of fruits harvested in the rainy season and in winter crops are cylindrical and spherical with elongate crowns (Joomwong and Jinda , 2005).Harvesting: In Northern Thailand pineapple is harvested three times per year in the summer, rainy season and winter. Fruits were harvest-ed 110-160 days after full bloom (DAFB) during different crop seasons. Plant part used as a food: Flesh
Pineapple Vietnam Climate: Pineapple requires areas where the climate is warm, humid and free from extreme temperatures (25 °C being the optimal tem-perature). The fruit is grown all year round, although the sweetness of the fruit varies depending on various conditions.Soil: The fruit takes longer to grow at higher altitudes and latitudes, where temperatures are lower. Pineapple must have an acid soil with pH around 4-5 or it will not grow successfully. Fertile soils are not required, provided nutrients are added (FAO, 2004).Season: The pineapple is mostly cultivated in the tropics between 25°N and S. Temperature range of growing areas is 23 to 32°C. Pine-apple cannot tolerate frost, and high temperatures, and fruit is sensi-tive to sunburn, but can withstand considerable drought. Continuous warm conditions favour rapid growth and development.
Crop selected Country Crop production and processing system followed
Pineapple Vietnam Harvesting: The fruits are harvested when their eyes turn yellow. Fruits can be harvested all year round although the plant can be forced to flower almost any time of the year, depending on climates, through the use of a chemical (ethylene and other inductants) in order to facilitate harvesting. Average weight of fruit varies from 600 – 800 g. CAYENNE pineapple (Smooth Cayenne’ or ‘Cayenne’, ‘Cayena Lisa’) is the second most popular pineapple in Vietnam, planted & harvested mostly in Tam Diep (Ninh Binh), Quynh Luu Nghe An), Dac Lac, Don Duong (Lam Dong). Plant part used as a food: Flesh
Okra India Climate: Okra grows best within a temperature range of 24-27⁰C, as it gives good yield in warm humid conditions (Kumar & Choudhary 2014).Soil: Sandy loam and clay-loam soils are best for Okra cultivation in India. The optimum pH range lies between 6 and 6.8. Soils with high organic matter are preferred. Okra can also be grown in mild salt affected soils.Season: It requires a long warm growing season during its growing period. Depending on the region, the crops are sown between Janu-ary-March or June-August.Harvesting: Crop is harvested in 55 to 65 days after planting when pods are 2 to 3 inches long and tender. The summer crop is sown during February–March and harvested between April–June. Plant part used as a food: Pods, Leaves and Flower
Okra Pakistan Climate: Okra is a warm season, kharif crop which requires high soil temperatures for best production.Soil: The type of soil and preparation methods, time and method of sowing, seed quality, irrigation and fertilizer applications, inter-cul-turing etc plays a pivotal role in Okra production. Well drained-sandy loans (high in organic matter) are the most desirable, as Okra grows best in neutral to slightly alkaline soils with 6.5 pH. Season: The yield of okra varies from 8 to 10 t/ha. of green fruit during summer and 10-12 t/ha in the rainy season (Khalid, 2015).Harvesting: Farmers start their cultivation from during the off season i.e. January. Okra generally takes two months for harvestable pods, which extends from February through November, but most of the pro-duction occurs in the summer months. Plant part used as a food: The leaves of the okra plant are eaten raw in salads. The flowers and pods are eaten as vegetables.

143142
Spinning Future Threads
Annexure 3Review of competing uses of selected agricultural biomass sources
Table A3.1: Current competing uses per shortlisted residue and likeliness for large unused potential
Crop Residue Country Known competing uses Likeliness of unused potential
Sugarcane Trash India To maintain soil nutrients a share of trash is needed. The quantity depends on soil and climate conditions. It is estimated that about 3 tons of trash per hectare should be left behind which would be around 20%- 30% when an average per hectare yield of between 10-15 MT cane is assumed for most regions in IndiaAbout 30% of the trash is taken to the sugar mill together with the cane.So about 40% of the trash remains. A small fraction of this is fed to animals, but mostly it is burned in the field (with high GHGs emissions and an important source for fine particles and smog). So accord-ing to Kumar et al. (2017) there is 28 million tonnes of unutilised trash, which is now still burned in the field. Of this trash almost half, 13 million tonnes dm, is available in the state of Uttar Pradesh (see Kumar et al., 2017; Jain et al., 2014).Earlier, most of the trash was being burned in the field due to its bulky nature and high cost incurred in collection and transporta-tion. However, now farmers bale the trash with a baling machine for easy handling, transport and storage and use it for crop mulching. Mulching with trash helps in reducing evapotranspiration loss and the crop is saved from high temperature. Very few farmers (approx. 10%) burn the trash.
Medium (20%-40% of technical potential)
Sugarcane Trash Thailand Cane residues (mainly tops and leaves) are left in the field. These residues serve as soil enrichments thus improving the physical, chemical and biological properties of soil.
Sugarcane Trash Pakistan Agricultural Mechanization Research Insti-tute (AMRI) Wing, Faisalabad has designed and developed a sugarcane stripper. Sugar cane stripper can be used to remove trash from the sugarcane stalks, which can be used as one of the available biomass resources for energy production.
The most common use and management practices followed with the shortlisted residues was deter-mined by using a combination of primary informa-tion (from stakeholder consultations with farming experts) and secondary information based on liter-ature review on the crop production systems in the eight countries, specifically for the main production regions for the selected crops. This information has been used to describe the competing uses situation in the Table A3.1. The classification is determined in terms of high, medium and low availability of unused potential which influenced the further selec-tion of the residue for hub location identification and further cost assessment in this study. Some of the key insights on the competing uses:
• For sugarcane trash and bagasse, the availability of the unused potential is expected to be between 20% and 40% in the two main production regions in India. For bagasse it can be expected that there is a smaller unused potential than for the trash. Therefore, the sourcing of cellulose extraction plants will be reviewed with both a combination of trash and bagasse. Besides this, the bagasse demand for alternative uses, such as for cellu-lose extraction for textiles, in a region should not become too high as this will increase the price and it may lead to an increase of fossil energy to replace the bagasse-based energy demand of sugar mills.
• Based on the findings it was indicated that the competing uses for straw is limited in all the countries because it is not significantly used as a feed for livestock and it decomposes very slowly in the soil. Therefore, straw as residue is often difficult to dispose of in time for the next season or crop. This is further complicated by the fact that in many rice producing regions, machinery is missing to harvest the grains and the straw in combination. Therefore, burning the residue even though banned in many countries, is still the most viable option for many farmers. In India howev-er, the information in the table below confirms a relatively large unused potential for rice straw in the Punjab and Uttar Pradesh regions, but not in
West Bengal. The identification of the hub location for rice straw based cellulose extraction will there-fore be focused on the first two regions and not in West Bengal.
• For maize and sorghum stover/straw, as indicated it seems that these residues have a high com-peting use and that the likely unused potential is very low. It is therefore logical to exclude them from the hub location assessment for cellulose extraction.
• For wheat straw alternative uses are also large. Basing a full cellulose extraction mill on it would not be recommended. However, in combination with a rice straw cellulose extraction chain will be reviewed in India, where in the Punjab region it is very common to grow rice in rotation with wheat. By combining both straw sources securi-ty of supply in the chain may be increased. The wheat straw demand will need to remain modest as compared to rice straw though given the much larger unused rice straw potential.

145144
Spinning Future Threads
Crop Residue Country Known competing uses Likeliness of unused potential
Sugarcane Bagasse Pakistan According to a research, 17,900,000 tonne of bagasse were produced from 8 sugar mills during 2009 in Pakistan. It was esti-mated that around 1,400 MWh electricity could be produced from such an amount of bagasse (Khan, 2010). Ramzan Sugar Mills Limited (RSML) is a 12,000 TCD sugar plant operating for about 120 days in a year. The factory has a capacity of about 500 TCH. Considering the utilization factor at 90%, the total cane crushed for 120 days turns out to be 1296000 tonnes. The bagasse generation in the plant is 30% on cane Once fine bagasse is used for enhancing filtration in the sugar process, a bagasse quantity of 29% on the cane crushed is available for use in the boilers. So, the total bagasse production is 375840 Tons which is currently being used to generate 60 MW of electricity for 150 days including a crushing period of 120 days.
Rice Straw Bangladesh According to ‘Methanogenic populations involved in the degradation of rice straw in anoxic paddy soil’, the direct incorpo-ration of rice straw in the soil can have a bad impact on the next crop and also may cause increasing CH4 emissions from the fields (Weber et al., 2001). Since, rice straw has large potential for plant nutrients in organic farming, there-fore, composting of agricultural waste is a sustainable solution to the common prob-lem of organic wastes disposal (Mastouri et al., 2005).According to a study by Bangladesh Institute of Nuclear Agriculture, rice straw can also be used in strawberry production through composting to increase the yield and sweetness of strawberry.
Rice Straw Cambodia Rice straw is used as fertilizer for the next crop to be sown in many cases. This is common in the provinces around the Tonle Sap lake. Bales of straw are also used for cattle fodder. Rice bran is also used for this. Local rice millers are known to use rice husk for biofuel purposes.
Crop Residue Country Known competing uses Likeliness of unused potential
Sugarcane Bagasse India Bagasse is used as a fuel for sugar mill boilers and in case if surplus is available, tendering process is followed and buyer collects the bagasse at their own cost.
Sugarcane Bagasse Thailand Traditionally, rice residue is either burnt or incorporated into the fields for the next crop (Phongpan and Mosier 2003).Residues of rice and sugarcane consist of approximately 83% of the total burnt res-idue in Thailand (Kumar et al. 2020). Rice residue burnt annually is about 4.8 million tonnes (70% of the total) followed by sug-arcane at an average of 1.1 million tonnes (13% of the total). Central and Northeast-ern regions have the highest contribution to burnt rice residue, whereas the North has the highest percentage of burnt sugar-cane residue.The Electricity Generating Authority of Thailand has adopted the small power producers (SPP) program which is a multi-national program that accounts for about 15% of the country’s total installed gen-erating capacity and fuel from biomass is used in many of these SPPs. Out of these SPPs (10-90 MW), 16 use paddy husk as fuel at an installed capacity of 140 MW, straw however has not been used due to limitations in logistics.The Thailand government implemented the Alternative Energy Development Plan (AEDP) in 2012, in which they hope to achieve about 5570 MW of power from biomass by 2036. Current usage of resi-due for biofuel is only at 42% of the total potential, and paddy straw and sugarcane top and trasher is yet to be used, however, a small percentage of sugarcane bagasse is being used (Kumar et al. 2020).In 2016, sugar factories in Thailand left bagasse around 30.68 million tons which were used to generate 3885.34 million kWh electricity. (Chunhawong et al. 2018)
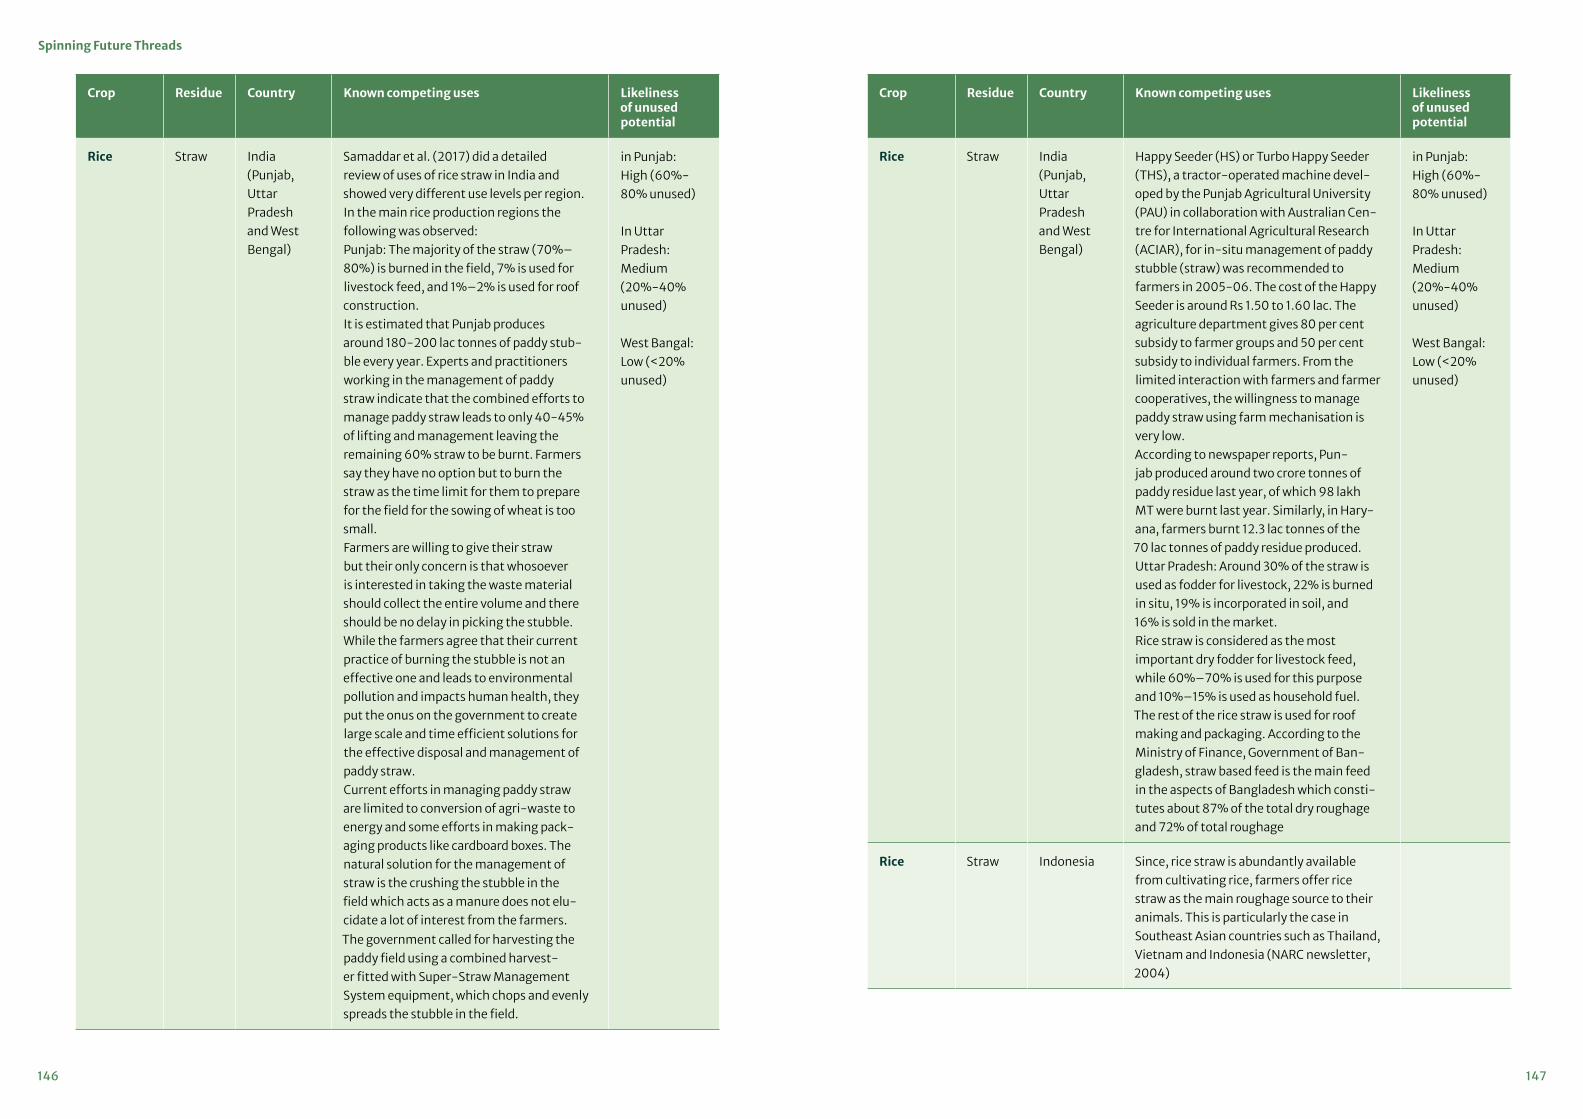
147146
Spinning Future Threads
Crop Residue Country Known competing uses Likeliness of unused potential
Rice Straw India (Punjab, Uttar Pradesh and West Bengal)
Happy Seeder (HS) or Turbo Happy Seeder (THS), a tractor-operated machine devel-oped by the Punjab Agricultural University (PAU) in collaboration with Australian Cen-tre for International Agricultural Research (ACIAR), for in-situ management of paddy stubble (straw) was recommended to farmers in 2005-06. The cost of the Happy Seeder is around Rs 1.50 to 1.60 lac. The agriculture department gives 80 per cent subsidy to farmer groups and 50 per cent subsidy to individual farmers. From the limited interaction with farmers and farmer cooperatives, the willingness to manage paddy straw using farm mechanisation is very low. According to newspaper reports, Pun-jab produced around two crore tonnes of paddy residue last year, of which 98 lakh MT were burnt last year. Similarly, in Hary-ana, farmers burnt 12.3 lac tonnes of the 70 lac tonnes of paddy residue produced.Uttar Pradesh: Around 30% of the straw is used as fodder for livestock, 22% is burned in situ, 19% is incorporated in soil, and 16% is sold in the market.Rice straw is considered as the most important dry fodder for livestock feed, while 60%–70% is used for this purpose and 10%–15% is used as household fuel. The rest of the rice straw is used for roof making and packaging. According to the Ministry of Finance, Government of Ban-gladesh, straw based feed is the main feed in the aspects of Bangladesh which consti-tutes about 87% of the total dry roughage and 72% of total roughage
in Punjab: High (60%-80% unused) In Uttar Pradesh: Medium (20%-40% unused) West Bangal: Low (<20% unused)
Rice Straw Indonesia Since, rice straw is abundantly available from cultivating rice, farmers offer rice straw as the main roughage source to their animals. This is particularly the case in Southeast Asian countries such as Thailand, Vietnam and Indonesia (NARC newsletter, 2004)
Crop Residue Country Known competing uses Likeliness of unused potential
Rice Straw India (Punjab, Uttar Pradesh and West Bengal)
Samaddar et al. (2017) did a detailed review of uses of rice straw in India and showed very different use levels per region. In the main rice production regions the following was observed:Punjab: The majority of the straw (70%–80%) is burned in the field, 7% is used for livestock feed, and 1%–2% is used for roof construction.It is estimated that Punjab produces around 180-200 lac tonnes of paddy stub-ble every year. Experts and practitioners working in the management of paddy straw indicate that the combined efforts to manage paddy straw leads to only 40-45% of lifting and management leaving the remaining 60% straw to be burnt. Farmers say they have no option but to burn the straw as the time limit for them to prepare for the field for the sowing of wheat is too small.Farmers are willing to give their straw but their only concern is that whosoever is interested in taking the waste material should collect the entire volume and there should be no delay in picking the stubble. While the farmers agree that their current practice of burning the stubble is not an effective one and leads to environmental pollution and impacts human health, they put the onus on the government to create large scale and time efficient solutions for the effective disposal and management of paddy straw.Current efforts in managing paddy straw are limited to conversion of agri-waste to energy and some efforts in making pack-aging products like cardboard boxes. The natural solution for the management of straw is the crushing the stubble in the field which acts as a manure does not elu-cidate a lot of interest from the farmers.
in Punjab: High (60%-80% unused) In Uttar Pradesh: Medium (20%-40% unused) West Bangal: Low (<20% unused)
The government called for harvesting the paddy field using a combined harvest-er fitted with Super-Straw Management System equipment, which chops and evenly spreads the stubble in the field.

149148
Spinning Future Threads
Crop Residue Country Known competing uses Likeliness of unused potential
Rice Straw Vietnam An experiment carried out on buffaloes by Cantho University, Haugiang, Vietnam, (Nguyen Van Thu et al 1994a) indicated that giving molasses-urea cake to native buffaloes in the Mekong river delta fed on rice stubble and straw improved health and productivity. The study further conclud-ed that supplement cakes containing urea, molasses, rice bran, coconut oil meal, salt, bone meal and trace elements supported good health and working capacity of native cattle and buffaloes in areas where feed and water shortages occurred. In addition, Thu et al (1996), reporting several on-station and on-farm experiments, showed that 4% urea treated rice straw either fed alone or together with urea-molasses cake resulted in increased nitrogen content of straw, feed intake, health status, draught power and milk yield of working and dairy buffalo compared with those of buffalo fed on untreated straw as controls (FAO, 1998).Vietnam has about 44.0 million tonnes of dry rice straw per annum. Hung et al. (2016) reported about 90% of rice production area is harvested by combine harvesters which only cut 1/3 the upper top of the rice tree. This part of rice straw is collectable and can be used as ruminant feed. Therefore, rice production annually generates approximate-ly 13.0 million tonnes of dry collectable rice straw. This is an abundant and sustainable feed source for ruminant feed. Rice straw can be used directly or treated by different preserved methods to store and improve nutritive value of the rice straw for animal feed during forage-shortage period.Rice-straw bioethanol production could reduce annual gasoline consumption by >20%, and plant construction costs account-ed for 8-22% of the total investment (Yoji & Tatsuki, 2013).
Crop Residue Country Known competing uses Likeliness of unused potential
Rice Straw Pakistan For every 4 tons of rice or wheat grain, about 6 MT of straw is produced. Around 43,437,000 tonnes of RWS is produced in Pakistan (Bhutto et al, 2010). In Pakistan wheat and rice straw form the basis of ani-mal feed resources and are used in high rates. Straw is also used in paper and packaging material, mat, wall construction etc.
Rice Straw Sri Lanka In the dry zone areas some of the straw is used for biofuel purposes. Paddy husk is used as an input in cement factories and is often transported large distances to be used in these factories. Compared to straw, paddy husk has a more concrete presence in Sri Lanka, especially in the biofuel sector. Incorporation into the soil is common where mechanized harvesting is implemented. Half-burnt husk is incorporated into the soil in wet-zone regions. Straw is also used as fertilizer in many cases.
Rice Straw Thailand Traditionally, rice residue is either burnt or incor-porated into the fields for the next crop (Phongpan and Mosier 2003).Residues of rice and sugarcane consist of approx-imately 83% of the total burnt residue in Thailand (Kumar et al. 2020). Rice residue burnt annually is about 4.8 million tonnes (70% of the total) followed by sugarcane at an average of 1.1 million tonnes (13% of the total). Central and North-eastern regions have the highest contribution to burnt rice residue, whereas the North has the highest percent-age of burnt sugarcane residue.The Electricity Generating Authority of Thailand has adopted the small power producers (SPP) program which is a multinational program that accounts for about 15% of the country’s total installed generat-ing capacity and fuel from biomass is used in many of these SPPs. Out of these SPPs (10-90 MW), 16 use paddy husk as fuel at an installed capacity of 140 MW, straw however has not been used due to limitations in logistics.The Thailand government implemented the Alter-native Energy Development Plan (AEDP) in 2012, in which they hope to achieve about 5570 MW of power from biomass by 2036. Current usage of res-idue for biofuel is only at 42% of the total potential, and paddy straw and sugarcane top and trasher is yet to be used, however, a small percentage of sug-arcane bagasse is being used (Kumar et al. 2020).

151150
Spinning Future Threads
Crop Residue Country Known competing uses Likeliness of unused potential
Wheat Straw Pakistan There are three types of wheat straw con-sumers: (1) Dairy farms; (2) Landless livestock rearers who own a small number of animals for household use; and (3) Better off live-stock owners who grow straw but are only able to meet about 50% of their need. Dairy farms often buy a large amount from traders and stockists and store it within the farm’s courtyard, while landless livestock rearers buy from retailers. (Matthews & Hussain, 2015)
Sorghum Stalks/ straw
India Sorghum residue and grain is mainly used in animal feed, alcohol distilleries and starch industries in India (Kleigh et al. 2018).
Oil Palm Empty Fruit Bunch
Indonesia The availability of Oil Palm Empty Fruit Bunches (OPEFB) will continue to increase along with the increase in the produc-tion of fresh fruit bunches of palm oil in Indonesia. OPEFB has enormous potential to be developed into high value-added products. Chemically the OPEFB contains lignin> 20%, hemicellulose> 25% and lignocellulose> 35%. All three components can be converted into various chemicals, materials and valuable products. Utilisation of soil improver and co-composting has been widely applied in Indonesia. However, due to the environmental pollution, the incineration of OPEFB has been avoid-ed. In order to protect the environment and to ensure the sustainability of the oil palm industry, the OPEFB must be fully converted. The building block of native OPEFB fibre is made up from a complex matrix of three main polymers which are cellulose, hemicellulose and lignocellulosic. The lignocellulosic material from OPEFB has been considered as a very good source of fermentable sugar for conversion into value added products (Rame, 2018).OPEFB were extensively largely dumped and traditionally been burnt in the incin-erator of the palm oil mill and ash recycled into the plantation as fertilizer. Utilization of soil improver and co-composting has been widely applied in Indonesia.
Crop Residue Country Known competing uses Likeliness of unused potential
Wheat Straw India (Punjab)
In Punjab, the main wheat production area, Jair (2014) reports that between 10%-23% of the straw is burned in the field. The remaining straw is used for feed and other uses. It is believed that almost 40 % of the wheat straw produced in the state of Punjab is used as dry fodder for animals. However, to encourage the use of rice residue as fodder for animals, a pilot project was taken up by PSCST at PAU under which trials on natural fermentation of paddy straw for use as protein enriched livestock feed were conducted. The cattle fed with this feed showed improvement in health and milk production. The technolo-gy was demonstrated in district Gurdaspur, Ludhiana, Hoshiarpur and Bathinda. The department of Animal Husbandry, Punjab has propagated the technology in the state (Anoop & Ritesh, 2018)
Low (<20% unused)
Wheat Straw Pakistan Wheat is harvested on a massive scale every year and the residues are helpful in maintaining the soil fertility if added as such or by mixing with the urea to balance the nitrogen content in the field (Murray and Bruehl, 1983). Extracellular hydrolytic enzymes are being produced using wheat straw under submerged Fermentation (SF) as well as Solid-State Fermentation (SSF) systems. A large number of second-ary metabolites can also be obtained by fermentation of Wheat Straw (Yasin et al., 2010).Non-wood fibres containing cellulose and hemicellulose have a long history as a raw material in study and pulp industry (Singh et al., 2009). Wheat straw can be easi-ly pulped and bleached with about 40% yield and it produces fine textured study (Mubeen & Khan., 2012).Wheat straws are traded within and among the districts of Sindh each year in bulk. Large traders buy wheat straw from rural areas and sell where they find profit. Some of them store the straw for longer periods to maxi-mise the profit and some do pressing as well.

153152
Spinning Future Threads
Crop Residue Country Known competing uses Likeliness of unused potential
Coconut Husk India Coconut husk has many uses in India. A spongy material that binds the coconut fibre in the husk known as Coir Pith husk fibre, is used as a raw material for carpets, stuffing seats and cushions, fertilizers in agriculture etc., (Samant and Gaikwad 2020). The fibrous husk is also used to brush teeth in South India for its benefits in dental care. Coconut coir fibre is used to make ropes, binderless board produc-tion, as shell for buttons, as charcoal and in decorative carving. Activated carbon derived from the coconut husk is charac-terized by a high percentage of micropores that help in removing odorous and volatile organic compounds. Coconut husk can also be used in the building of cost-effective building material and roofing for houses (Srivastava and Kumar 2018).
Coconut Husk Indonesia Coconut husk is a coarse fibre extracted from the fibrous outer shell of a coco-nut. Studies have shown the possibility of preparing particle boards using coconut husk and its by-products, which confirms to the specification of wood. Coconut husk is one of the important by-products of coconut tree and coconut-based activ-ities. Husks are the outer fibre (35%) of the nut, followed by the hard protective shell (12%). Coir wood is the material for a sustainable future made from the husk of the coconut. Husks are a useful source of potash and valuable mulch for the conser-vation of moisture. Husks are often burned to produce ash, which is used to fertilize the trees. Burying the husk in the soil is more beneficial than burning. These husks are used as mulch for the conservation of moisture in the soil. A layer of husk is placed in a ring, convex side upwards from about 0.3 m up to a distance of 1.8- 2.1 m from the base of the palm. This meth-od is beneficial during periods of drought. Husks can also be used in planting holes during coconut seedling transplantation (Annamalai et al, 2017).
Crop Residue Country Known competing uses Likeliness of unused potential
Oil Palm Empty Fruit Bunch
Thailand Thailand has an interest in the use of alter-native energy sources more. Thailand has conducted research to support the EFB to bring it back to beneficial use. In the south of the country is used it as fuel to generate electricity
Maize Stover/ straw
India A significant majority of maize residue is used as cattle fodder (Bimbraw 2019). Other uses include but are not limited to soil mulching, bio-manure, thatching for huts and fuel for domestic and industrial use (Devi et al. 2017).
Maize Stover/ straw
Indonesia Maize stover (or straw) normally consists of variable proportions of the leaves, stalks, and cobs of maize plants left in a field after harvest. It can be a valuable addition in ruminant feeding systems (dairy, beef, heifers, as well as sheep and goats) as it has the highest feeding value of all cere-al straws. It is also a good source of fibre, which can replace cereal straws if they are not available, if additional fibre is needed or if there is a lack of forage.
Banana & plantain
Pseudo-stem
India Banana leaves are used as a fodder and mulching purpose. Some of the residues are processed to be used in construction applications. Banana peels and sugar-cane waste are being utilized in the paper industry.
Banana & plantain
Pseudo-stem/trunk
India In Jalgaon district of Maharashtra state, bulk of banana pseudo-stem is used to prepare a plant growth regulator. There is no transportation required from the farm-er’s end as the manufacturer collects the biomass directly from the farmer’s field. Few farmers with the help of rotavator bury the pseudo stem residues in the field only which afterwards decomposes and improves soil organic matter. In case of surplus biomass availability, farmers use decomposing culture to convert the resi-dues in compost

155154
Spinning Future Threads
Crop Residue Country Known competing uses Likeliness of unused potential
Pineapple Leaves Thailand Due to a large amount of leftover every day, the idea of converting these fibres into handmade paper which can increase their commercial value as well as create jobs for villagers was conceived. One sheet of finished pineapple fibre paper can sell much higher than the price of raw fibres sold as animal feed (Yusof et al, 2012).
Pineapple Leaves Vietnam Extracted fibres from pineapple leaves being utilized for developing successfully eco-friendly and cost-effective pineapple fibres (PFs) aerogels by using polyvinyl alcohol as a cross-linker and following a freeze-drying method. (Luu et al, 2020).
Okra Leaves/ stems
India Okra leaves are used in Indian cuisine in many cases due to its vitamin A & C content, calcium, protein and iron (Grant 2019).
Okra Leaves/ stems
Pakistan Okra foliage can be used for biomass. The stem of the okra plant provides fibre which is used in the paper making industry (Ford-Lloyd and Armstrong, 1993).
Crop Residue Country Known competing uses Likeliness of unused potential
Pineapple Leaves India In India, Pineapple leaves are mostly just either burnt or incorporated into the soil (Hazarika et al. 2017). The pineapple leaves can be used to extract bromelain (an enzyme mixture present in the pineap-ple) at local level (Nair Anand 2019) and is also used by a few of the industries in the manufacture of medicines and cosmetics, due to other useful compounds such as cit-ric acid and anti-inflammatory properties. Leaves may also be used to produce prod-ucts like fabrics, papers, bags and ropes. It can also be used as a low-cost feedstock for bioethanol production using 2% dry yeast (Casabar, Unpaprom, and Ramar).
Pineapple Leaves Indonesia Density of PALF is similar to other natural fibres while Young’s modulus is very high, and tensile strength is highest among the related natural fibres. These properties are suitable for its application as building and construction materials, automotive com-ponents, and furniture.
Pineapple Leaves Thailand According to a journal based on ‘Pulp and Paper Production from Pineapple Leaves’, only 52 % of pineapple fruit is used for jam and juice production and the remaining 48% consists of fruit peel and leaves forming the waste. The pineapple wastes are rich in lignin and cellulose and form a very good raw material for allied fibres. According to several studies, the textile made from pineapple leaf fibres can be used as an alternative to leather. The discovery was made by a Spanish designer, Carmen Hijosa, who was in the business of designing and manufacturing leather goods in Ireland. PALF can be produced using better processing and made accessible to discerning customers. The silky white fibre can easily be dyed and made into a firm fabric that’s softer than hemp, resembling linen (Yogesh and Hari, 2015). PALF blends well with other materials such as Recycled Polyester, Organic Cotton and Lyocell/Tencel to form yarn of different sizes, single or multi-ply. The result: comfortable, eco-friendly apparel, footwear and interiors.

157156
Spinning Future Threads
Annexure 4Identification of hub locations and spatial mapping
Description of hub locations identificationGiven the three different capacity levels for cel-lulose extraction mills, the starting points for the identification of different hubs in the region per type of biomass are presented in Table A4.1. For fibres the minimal demand for biomass is based on a fibre amount ranging from between 100 to 1000 tons fibres a year. A real minimum demand is not set. Except that the hub locations selected for these fibre chains are placed where there is the largest and most concentrated availability in the eight focus countries.
Table A4.1: Biomass types and assumptions to identify hub locations in the spatial assessment
Crop Residue Type of residue Field or mill
For cellulose or fibre?
RPR to technical potential in ton dm
% cellulose in residue
% fibre in residue
Min. cellulose or fibre production Year in hub [kton dm/year]
Sugarcane Trash Field Cellulose 0.3 0.34 n.a. 75
Sugarcane Bagasse Sugar mill Cellulose 0.14 0.46 n.a. 75
Sugarcane Bagasse Sugar mill Cellulose 0.14 0.46 n.a. 150
Sugarcane Bagasse Sugar mill Cellulose 0.14 0.46 n.a. 500
Sugarcane Bagasse & trash Combination Cellulose 0.14 See above n.a. 150
Sugarcane Bagasse & trash Combination Cellulose 0.14 See above n.a. 500
Rice Straw Field Cellulose 1 0.38 n.a. 75
Rice Straw Field Cellulose 1 0.38 n.a. 150
Rice Straw Field Cellulose 1 0.38 n.a. 500
Rice & Wheat Straw Field Cellulose 0.85 0.4 n.a. 500
Oil Palm EFB Oil palm mill Cellulose 0.19 0.41 n.a. 75
Oil Palm EFB Oil palm mill Cellulose 0.19 0.41 n.a. 150
Banana & plantain Pseudo-stem Field Fibre 0.15 n.a. 2% 0.1-1
Pineapple Leaves Field Fibre 0.25 n.a. 10% 0.1-1

159158
Spinning Future Threads
Table A4.2: Best hub locations identified for rice straw sourcing for cellulose extraction
HS code Country Region Size of cellulose extraction plant (Kton cellulose/year)
Sourcing feedstock
9 Bangladesh Rajshahi Medium & -Large (250/500 Kton/yr) Rice straw
5 Cambodia Takêv Small/Medium (75/150 Kton/yr) Rice straw
3 India Andhra Prades Medium/large (150/500 Kton/yr) Rice straw
8 India Punjab Medium/large (150/500 Kton/yr) Rice straw & wheat straw
10 India West Bengal Medium/large (150/500 Kton/yr) Rice straw
7 Indonesia Jawa Timur Medium/large (150/500 Kton/yr) Rice straw
13 Indonesia Jawa Tengah Medium/large (150/500 Kton/yr) Rice straw
2 Pakistan Sind Small/Medium (75/150 Kton/yr) Rice straw
6 Sri Lanka Polonnaruwa Small/Medium (75/150 Kton/yr) Rice straw
4 Thailand Suphan Buri Medium/large (150/500 Kton/yr) Rice straw
11 Vietnam Thái Bình Medium/large (150/500 Kton/yr) Rice straw
12 Vietnam An Giang Medium/large (150/500 Kton/yr) Rice straw
Table A4.3: Best of hub locations identified for sugarcane trash and bagasse sourcing for cellulose extraction
ID Country Region Size of cellulose extraction plant (Kton cellulose/year)
Sourcing feedstock
16 India Uttar Pradesh Medium/large (150/500 Kton/yr) Bagasse & trash
17 Pakistan Punjab Small/Medium (75/150 Kton/yr) Trash
19 Thailand Uthai Thani Small/Medium (75/150 Kton/yr) Trash
20 Indonesia Lampung Small/Medium (75/150 Kton/yr) Trash
Table A4.4: Best hub locations identified for biomass sourcing for fibre extraction
ID Country Region Size of cellulose extraction plant (Kton cellulose/year)
Sourcing feedstock
0 Bangladesh Khulna 100-1000 ton/year Banana pseudo-stem
1 India Maharashtra 100-1000 ton/year Banana pseudo-stem
2 Thailand Samut Prakan 100-1000 ton/year Banana pseudo-stem
3 Vietnam Kiên Giang 100-1000 ton/year Banana pseudo-stem
4 Indonesia Jawa Barat 100-1000 ton/year Banana pseudo-stem
14 Thailand Kamphaeng Phet
100-1000 ton/year Pineapple
Explanation for spatial mapping using MAPSPAM There were no spatial data on crop area land use until recently, therefore a collaboration was start-ed in 2002 between FAO, IFPRI (International Food Policy Research Institute) and SAGE (Center for Sustainability and the Global Environment, University of Wisconsin-Madison) titled ‘Agro-MAPS’ (Mapping of Agricultural Production Systems). Firstly, a large database on Agro-Maps was compiled, which was filled by crop area and production data collected in a large network of organisations from various local subnational offices in many countries throughout the world. Currently, most of the data used are from World Food Programme (WFP) crop and food supply assessment mission surveys, agricultural perfor-mance surveys, national bureaus of statistics, region-al agricultural centers, ministries of agriculture, rural and extension services, regional NGOs, household services, ministries of the environment, and water resource groups. This resulted in a robust data-base with crop production data for more crops, and smaller administrative units than any single global collection of subnational production data currently available. These data were compiled from a variety of formats into standard spreadsheets and database files (the 2010 data were used in this study).
In total, 42 different crops were included in the SPAM 2005 and 2010 databases. Their definition follows FAO terminology (especially crop nes = crop not elsewhere specified). For this project crop data layers were used for all the crops that produce the selected residues as presented in Table 3.3.
Estimation of crop distribution within a statistical unit is done in SPAM for the physical area. How-ever, statistical information refers in general to harvested areas, from where crops are gathered. SPAM considers 42 crops and handles each crop as if it was grown by itself on a plot, which often is not the case. In many countries, there are regions and seasons where more than one crop is grown simultaneously on one plot. Frequently there is a succession of different crops on one plot throughout the year, especially in tropical countries. All these facts are combined in a cropping intensity parameter for each crop, which is larger than 1 when there is multi-cropping, or more than one harvest per year from one plot, of different crops.
For the allocation of the crop in SPAM to the physi-cal area crop-specific suitability information is taken into account, such as climate and soil conditions. Different crops have different thermal, moisture,

161160
Spinning Future Threads
and soil requirements, particularly under rainfed conditions. FAO, in collaboration with the Interna-tional Institute for Applied Systems Analysis (IIASA), has developed the agro-ecological zones (AEZ) methodology based on an evaluation of existing land resources and biophysical limitations and potentials for specific crops (FAO/IIASA). This methodolo-gy provides maximum potential and biophysically attainable crop yields and suitable crop areas. For SPAM three production system types from the FAO/IIASA suitability datasets: Irrigated high-high input; rainfed – high input/commercial; rainfed – low input/subsistence were utilised. The latter type is also used for rainfed – subsistence farming when attainable yields are needed. For each crop and in each production system, the suitable land is defined as the sum of the four suitability classes in the AEZ model: very suitable, suitable, moderately suitable, and marginally suitable.
For the cropland extent to which the crop data are allocated satellite-based land cover datasets were used.
There are several global and regional land cover datasets publicly available for various years: Glob-Cover 2005, MODIS v.5, AFRICOVER, GLC-2000, ISCGM, CORINE, and a number of national maps. Each dataset has its own pros and cons depending on the region of the world. Following the methodol-ogy described in Fritz et al: “Mapping Global Crop-land and Field Size”, IIASA/IFPRI, 2015. all data sets were combined resulting in a global cropland map at a resolution of 30 arc seconds (approx. 1x1km at the equator) and aggregated to a five-minute (approx-imately 10x10km2 at the equator and mostly 9*9 km2 in most of the 8 focus countries of this study) resolution for input to the SPAM allocation.
The final spatial allocation in SPAM is subject to constraints (limits) dictated by existing:
• agricultural area• irrigated area• suitable area (suitability per crop)• crop area statistics (totals per administrative
region)
According to these constraints the optimal allocation is solved in an optimization model written in GAMS. For further details see You (2014 and 2020).
The data that was used from MAPSPAM in this study refer to statistical data from the year 2010. For the spatial distribution data for okra and pineapple, the data from the year 2000 were used. The spatial data from MAPSPAM was compared with more recent statistical data (for 2018-2020 years) and in some regions small crop area changes were seen, but since these are in the error range they had minimal effect on the final cost assessment results than the more general conversion factors for RPR (residue to prod-uct ratio) and average cellulose and fibre contents used to calculate the residual biomass total and cellulose and fibre potentials per location.

163162
Spinning Future Threads
Annexure 5Detailed description of chain design and cost assumptions for delivery of selected residual biomass at plant gate
For the purchase cost A review of prices paid for fibres by Dunne et al. (2016) showed that prices paid for extracted fibres from bananas were between 0.1-0.8 USD/kg. For fibres from pineapple leaves this level was 0.05 USD/kg. The study assumes that a purchase cost level of 0.05 USD/kg of fibre contained in the biomass is a reasonable level to make initial cost calculations with. See Table A5.1 for how this assumption works out per fibre source.
For the purchase level cost for the residues used for the cellulose extraction process assumed for the selected residual feedstocks are presented in Table A5.2. These are based on a very rough estimation of the average market price of the residue.
For the compensation cost for fertiliser removal, these costs were allocated only to the field residues used for cellulose extraction. This is because it will be very challenging to bring any residues back to the field after extraction of the cellulose. For fibres this would be possible, so the return transport cost is allocated.
The cost of the fertiliser compensation for residues for cellulose extraction were calculated taking the content of the NPK minerals contained in the field residues (based on FAO, 2005, for rice and cereal straw in India and on Suma et al. (2015) for sugar-cane trash). The cost of fertilisers was ascertained from FAO (2005) and cost levels were extrapolated from 2005 to 2020 using an inflation correction rate. Differences in price levels between countries were calculated based on fossil fuel price levels. The results of this approach are presented in Table A5.3.
For up and off-loading cost when the biomass is transported, it is assumed that this would cost 0.50 USD/tonne for every up and offloading combination in the chain. In chains, for treatment in an ICP, the up and off-loading will double vis-à-vis the chains that assume transport of biomass directly from the field or mill to the cellulose of fibre extraction mill.
Densification cost: Densification of residues to form pellets is a key intermediate process carried out at the ICP plant. These densification costs prior to long-distance transport are estimated on the basis
Fibre contents in dm residue
Cost per ton biomass dm (USD)
Cost per ton biomass wet (USD)
Cost per ton biomass wet (USD)
Banana pseudo-stem 2% 1 0.15 or 0.45* 0.45
Pineapple leaves 10% 2 0.5
Okra stem 12% 2.4 0.672
Table A5.1: Purchase cost level for residual biomass for fibre extraction
Table A5.2: Purchase cost level for residual biomass for cellulose extraction
Table A5.3: Purchase cost level for residual biomass for cellulose extraction
* 0.15 USD is for a whole pseudo-stem and 0.45 is for the prepared out pseudo-stem which has the same amount of fibre, but concentrated in 30% of the biomass of the pseudo-stem.
* According to Elbersen & Keijser (2019) ‘ Farmer gets €21 per ton rice straw’ in Haryana region. In other Indian regions competing use levels can be higher, so an average cost level of 24 US$/ton
** Many increasing competing uses (see: https://www.phnompenhpost.com/business/mekong-delta-rice-farmers-earn-big-selling-straw)
Sources: On mineral content and price of fertilisers: • FAO (2005). Fertilizer use by crop. FAO Land and Plant Nutrition Management Service Land
and Water Development Division in India. First version, published by FAO, Rome, 2005.• Suma R, Savitha CM (2015) Integrated Sugarcane Trash Management: A Novel Technology
for Sustaining Soil Health and Sugarcane Yield. Adv Crop Sci Tech 3: 160. doi:10.4172/2329-8863.1000160
Fossil fuel price levels per country: https://www.theglobaleconomy.com/rankings/diesel_pric-es/ and https://nl.globalpetrolprices.com/diesel_prices/
Bang
lade
sh
Cam
bodi
a
Indi
a
Indo
nesi
a
Paki
stan
Sri L
anka
Thai
land
Viet
nam
Purchase price Rice straw (USD/tonne 14% moisture)*
24 24 24 24 24 24 24 30**
Purchase price Wheat straw (USD/tonne 14% moisture) 40
Purchase price Sugarcane trash (USD/tonne 14% moisture) 20 20 20 20
Purchase price Sugarcane bagasse (USD/tonne 40% moisture but high cellulose content then trash)
20 20 20 20
Purchase price EFB of palm oil mill (USD/tonne 50% moisture) 10 10
Bang
lade
sh
Cam
bodi
a
Indi
a
Indo
nesi
a
Paki
stan
Sri L
anka
Thai
land
Viet
nam
Rice straw (USD/tonne) 4.8 5.9 5.6 3.6 5.5 5.2 4.4 4.6
Sugarcane trash (USD/tonne) 4.8 3.1 4.1 3.8

165164
Spinning Future Threads
of a previous study covering the pelletising costs for straw and miscanthus in Ireland (Nolan et al. 2010). The table below translates the pelletising costs (cap-ital and operating) from Ireland to India. This anal-ysis, and further extension from India to the other seven countries, accounts for differences in fuel and labour costs in each country.
Storage cost in case biomass is not available whole year round because of seasonality and need to keep cellulose dissolving mill operational through the year. Storage costs were based on the BECOOL project review on storage cost. The average cost of storage covered is about 1.1 USD per m3 per month.
Transport which can be local and short and long distance For short distance transport and for all non-densi-fied residues that are transported directly from the field to the cellulose and fibre extraction plant it was assumed that they use small trucks with 70 to 140 kg capacity to bring the residues further. Cost assumed for local transport = 0.20 US$ per ton/km.
For long term transport of densified biomass or of biomass that can be picked up from sugar or oil palm mills the cost of freight movement by road information was used from the Indian National Transport Development Policy Committee.1 They published that road transport costs are INR 2.58/tonne/km (=0.034 USD/tonne/km) as compared to INR 1.41/ton/km for rail and INR 1.06/tonne/km for waterways. Since the cost level is for 2014 a con-version rate in 2014 was 60 INR to 1 USD. Transport cost was: 0.043 USD/tonne/km. To compensate for inflation, 0.050 USD/ton/km. was used. From the Indian cost levels, it was derived that extrapolated the cost level to the other seven focus countries by applying the index for differences in fossil fuel prices.
Detailed cost calculation results for cellulose sourcing from rice strawFor delivering rice straw to the cellulose dissolving plant, two chains are considered. The first involves the densification of the straw to pellets in intermediate collection point which makes long distance transport cheaper. The second chain excludes this densi fication,
Ireland (2010)Ireland (2020)
@14.25% inflation for 2010-20*
India (2020)
(all costs in USD/tonne) Capital cost
Operating cost
Capital cost
Operating cost
Capital cost
Operating cost
Straw grinding plant 1.78 8.11 2.03 9.27 2.03 5.2
Pelleting cooling plant 2.47 9.04 2.82 10.33 2.82 5.8
Misc. electric equipment 0.66 0 0.75 0.00 0.75 0.0
Compressed air plant 0.02 0.16 0.02 0.18 0.02 0.1
Storage bin 0.06 0.01 0.07 0.01 0.07 0.0
Industrial loader & fork lift
0.33 0.21 0.38 0.24 0.38 0.1
Office, building, land use
1.31 0.47 1.50 0.54 0.15 0.3
Labour 9.31 0.00 10.64 1.1
TOTAL 6.6 27.3 7.6 31.2 6.2 12.5
* Source for inflation rate: https://www.inflationtool.com/euro/2010-to-present-value Nolan (2010)
1 National Transport Development Policy Committee. India Transport Report—Moving India to 2032. 2014. Cited by NITI Aayog. 2018. EFFICIENCY AND SUSTAINABILITY IN INDIAN LOGISTICS.
but assumes direct transport of the straw bales from the field to the cellulose dissolving plant.
The results of the cost calculations for cellulose capacities of 75, 150 and 500 kilotons cellulose production per year are presented in Table A5.4 assuming a 30% contractibility level for rice straw per hub. In the first 6 columns, all costs are includ-ed, while in the last six columns of the purchase costs are assumed to be zero. Presenting cost with and without purchase cost is done because there is large uncertainty about these costs which can vary strongly per region and per year. Presenting the total cost excluding the purchase cost will also provide a better understanding of the process of transport cost changes with increasing collection distances and spatial biomass dispersion.
From Figure A5.1 and Table A5.4, it becomes clear that densification in an intermediate collection point is relatively expensive and increases the delivery cost of biomass significantly. The effect of densifi-cation on cost reduction in transport is not enough to compensate for the high pelletising cost. It seems that in hub locations direct transport of bales from the field to the cellulose dissolving plant is cheaper. This is also shown in the Figure A5.1 in which the relation between total delivery cost and distance to hub location for Andhra Pradesh is presented.
If the purchase costs are not considered, it can be concluded that the lowest at-gate cost for rice straw delivery at the dissolving plant gate is found in the two hub locations in Indonesia where bales can be delivered to a medium and large dissolving plant at 28 and 35 USD/ton cellulose, respectively.
The highest cost for such situation is found in Pakistan for the medium size cellulose dissolving plant and in Andhra Pradesh in India for the large cellulose plant. On average over the 12 hub locations the delivery cost of rice straw pellets amounts to 37, 37 and 43 USD/ton cellulose for a small, medium and large size dissolving plant respectively. If the purchase cost assumed in the study are included in the total cost this average becomes 100, 114 and 123 USD/ton cellulose, respectively.
In case of pellets, if the purchase cost is not includ-ed, the lowest delivery cost for a medium size dissolving plant is found in Indonesia in Jawa Timur amounting to 65 USD/ton cellulose. Looking at the large cellulose dissolving plant, the lowest delivery cost for bales are also found in the same location at almost the same costs. On average for all hub loca-tions these delivery costs amount to 75, 81 and 83 USD/ton cellulose to a small, medium and large size dissolving plant respectively. The cost of delivery of pellets is around twice that of bales.
160.0
120.0
80.0
40.0
0.0
700,000
525,000
350,000
175,000
0
Cummulative tons cellulose
Distance to hub (km)
Cum
ula
ted
ton
s ce
llulo
se
Cost
US$
/ton
cel
lulo
se
Average cost pellets
Average cost bales
Cost Pellets no purchase
Cost bales no purchase
31 5 7 9 11 13 15 17 19 21 23 25 27 29 31 33 35 37 39 41 43 45
Figure A5.1: Relationship between total delivery cost and distance to dissolving plant location at different sourcing capacities for Andhra Pradesh in India

167166
Spinning Future Threads
Pellet cost_including purchase cost (USD/ton cellulose)
Bales cost_including purchase cost (USD/ton cellulose)
Pellet cost_NO purchase cost (USD/ton cellulose)
Bales cost_NO purchase cost (USD/ton cellulose)
HS Country Region 75 Kton 150 Kton 500 Kton 75 Kton 150 Kton 500 Kton 75 Kton 150 Kton 500 Kton 75 Kton 150 Kton 500 Kton
9 Bangladesh Rajshahi n.a. 138 139 n.a. 98 102 n.a. 75 76 n.a. 34 39
5 Cambodia Takêv n.a. 147 149 n.a. 102 110 n.a. 84 85 n.a. 39 47
3 India Andhra Pradesh n.a. 144 148 n.a. 101 117 n.a. 81 85 n.a. 38 54
8 India Punjab n.a. 144 146 n.a. 102 109 n.a. 81 83 n.a. 39 46
10 India West Bengal n.a. 145 146 n.a. 104 111 n.a. 81 83 n.a. 41 48
7 Indonesia Jawa Timur n.a. 126 129 n.a. 91 100 n.a. 63 65 n.a. 28 37
13 Indonesia Jawa Tengah n.a. 208 209 n.a. 168 172 n.a. 72 73 n.a. 31 35
2 Pakistan Sind 142 144 n.a. 102 110 n.a. 79 81 n.a. 102 47 n.a.
6 Srilanka Polonnaruwa 134 136 n.a. 98 105 n.a. 71 73 n.a. 98 42 n.a.
4 Thailand Suphan Buri n.a. 141 144 n.a. 100 114 n.a. 78 81 n.a. 37 51
11 Vietnam Thái Bình n.a. 209 210 n.a. 113 118 n.a. 130 131 n.a. 34 39
12 Vietnam An Giang n.a. 208 209 n.a. 168 172 n.a. 72 73 n.a. 31 35
Average 138 158 163 100 114 123 75 81 83 100 37 43
Max 142 209 210 102 168 172 79 130 131 102 47 54
Min 134 126 129 98 91 100 71 63 65 98 28 35
Table A5.4: Overview of rice straw delivery cost in USD/tonne of cellulose for different chains
Pellet cost_including purchase cost (USD/ton cellulose)
Bales cost_including purchase cost (USD/ton cellulose)
Pellet cost_NO purchase cost (USD/ton cellulose)
Bales cost_NO purchase cost (USD/ton cellulose)
HS Country Region 75 Kton 150 Kton 500 Kton 75 Kton 150 Kton 500 Kton 75 Kton 150 Kton 500 Kton 75 Kton 150 Kton 500 Kton
16 India Uttar Pradesh n.a. 177 179 n.a. 132 141 n.a. 89 91 n.a. 44 52
17 Pakistan Punjab 145 148 n.a. 100 112 n.a. 86 89 n.a. 41 54 n.a.
19 Thailand Uthai Thani 143 n.a. n.a. 102 n.a. 117 84 n.a. n.s. 44 n.a. n.a.
20 Indonesia Lampung 140 142 n.a. 93 98 n.a. 82 83 n.a. 34 40 n.a.
Average 143 156 179 98 114 129 84 87 91 40 46 52
Max 145 177 179 102 132 141 86 89 91 44 54 52
Min 140 142 179 93 98 117 82 83 91 34 40 52
Table A5.5: Overview of sugarcane trash delivery cost in USD/ton of cellulose for different chains

169168
Spinning Future Threads
Smaller rice production areas are found specifically in Pakistan and Sri Lanka. In both countries there is not enough production of rice within a 100-km cir-cle from any hub to source a large capacity cellulose dissolving plant. Sourcing small and medium size plants can be done in these countries but delivery costs are relatively high, particularly for bales.
Detailed cost calculation results for cellulose sourcing from sugarcane residuesFor sugarcane residue, sourcing to cellulose dissolv-ing plants the cost situation in 4 hub locations was investigated. Only in the Uttar Pradesh region of India, the sourcing of a combination with trash and bagasse was investigated. While, in all other hubs
only sourcing of trash was investigated.
Table A5.5 represents sourcing only based on trash therefore it is concluded again that pellets are far more expensive compared to bales. Excluding the purchase cost, the lowest cost is for bales in Indone-sia where they can be delivered to the plant gate for 34 and 40 USD/ton cellulose at a small and medium cellulose dissolving plant. For bales this amounts to 82 and 83 USD/ton cellulose, which is double the price of bales. The cost of sugarcane trash delivery is higher than for rice straw which is likely to be related to the spatial distribution of sugarcane and related collection cost.
Figure A5.5: Distribution of cost over cost items for sugarcane trash pellets and bales at different sourcing levels for Indonesia
Figure A5.6: Relationship between total delivery cost and distance to dissolving plant location at different sourcing capacities for sugarcane trash in Uttar Pradesh in India
Figure A5.2: Distribution of cost over cost items for rice straw pellets and bales at different sourcing levels for Bangladesh
Figure A5.3: Distribution of cost over cost items for rice straw pellets and bales at different sourcing levels for Pakistan
Figure A5.4: Distribution of cost over cost items for rice straw pellets and bales at different sourcing levels for Thailand
0
35
70
105
140
Transport shortLoading shortPurchase cost Fertilizer loss
Transport longLoading long
Pelletizing Storage
Cost
USD
/ton
cel
lulo
se
Pellet 60% 150Kton
Pellet 30% 150Kton
Pellet 60% 500Kton
Pellet 30% 500Kton
Bales 60% 150Kton
Bales 30% 150Kton
Bales 60% 500Kton
Bales 30% 500Kton
0
40
80
120
160
Transport shortLoading shortPurchase cost Fertilizer loss
Transport longLoading long
Pelletizing Storage
Cost
USD
/ton
cel
lulo
se
Pellet 60% 75Kton
Pellet 30% 75Kton
Pellet 60% 150Kton
Pellet 30% 150Kton
Bales 60% 75Kton
Bales 30% 75Kton
Bales 60% 150Kton
Bales 30% 150Kton
0
40
80
120
160
Transport shortLoading shortPurchase cost Fertilizer loss
Transport longLoading long
Pelletizing Storage
Cost
USD
/ton
cel
lulo
se
Pellet 60% 75Kton
Pellet 30% 75Kton
Pellet 60% 150Kton
Pellet 30% 150Kton
Bales 60% 75Kton
Bales 30% 75Kton
Bales 60% 150Kton
Bales 30% 150Kton
0
40
80
120
160
Transport shortLoading shortPurchase cost Fertilizer loss
Transport longLoading long
Pelletizing Storage
Cost
USD
/ton
cel
lulo
se
Pellet 60% 75Kton
Pellet 30% 75Kton
Pellet 60% 150Kton
Pellet 30% 150Kton
Bales 60% 75Kton
Bales 30% 75Kton
Bales 60% 150Kton
Bales 30% 150Kton
200.0
150.0
100.0
50.0
0.0
900,000
675,000
450,000
225,000
0
Cummulative tons cellulose
Distance to hub (km)
Cum
ula
ted
ton
s ce
llulo
se
Cost
US$
/ton
cel
lulo
se
Average cost pellets
Average cost bales
Cost Pellets no purchase
Cost bales no purchase
0 12 20 27 32 37 40 48 52 56 60 64 68 72 76 80 82 85 89 91 93 96 99

171170
Spinning Future Threads
The cost composition for sugarcane trash delivery in Figures A5.4 and A5.5 illustrates large differences in cost levels between pellets and bales. Also, it is clear that in Indonesia cost levels are lower than in Thai-land for the bale delivery. In the Uthai Thani hub in Thailand the availability of sugarcane is rather small which makes it impossible to source a 150-kiloton capacity cellulose plant at a contractibility level of 30%. In all other 3 hubs this is not a problem. Figure A6.6 illustrates that pellets and bales have very large cost differences and that these differences do not decline strongly with increased distance.
For Andhra Pradesh the cost in a combined sourcing with trash and bagasse was analysed. The results of this analysis are presented in Figure A5.7 for sourcing a 150-kiloton capacity plant and in Figure A5.8 for sourcing the largest cellulose dissolving plant. Trash delivered in bales is by far the cheapest sourcing solution. Since bagasse is more expensive to deliver any combination of sourcing with bagasse is more expensive.
Detailed cost calculation results for cellulose sourcing oil palm EFBFor the analysis of delivery cost for EFB to a cellu-lose dissolving plant the hub in the region of Riau in Indonesia on the island of Sumatra was chosen. Transport of EFB is quite expensive because of the high content of water. On the other hand, it is also concluded that the delivery cost of EFB to produce one ton of cellulose is cheaper than for rice straw, or sugarcane trash or bagasse unless large biomass demands are placed on the market as establishing a 500-kiloton cellulose dissolving factory in Riau would not be possible.
Figure A5.8: Biomass delivery cost at different biomass chain options combining trash and bagasse to a large size cellulose dissolving plant in Uttar Pradesh (India)
Figure A5.9: bution of cost over cost items for EFB at different sourcing levels for Riau in Indonesia
Figure A5.7: Biomass delivery cost at different biomass chain options combining trash and bagasse to a medium size cellulose dissolving plant in Uttar Pradesh (India)
0
75
150
225
300
Trash Bagasse
Cost
USD
/ton
cel
lulo
se
100% Trash_60% contract
100% Trash_30% contract
50% bagasse & 50% Trash_60% contract
60% bagasse & 40% Trash_60% contract
50% bagasse & 50% Trash_30% contract
60% bagasse & 40% Trash_30% contract
0
45
90
135
180
Trash Bagasse
Cost
USD
/ton
cel
lulo
se
100% Trash_60% contract
100% Trash_30% contract
50% bagasse & 50% Trash_60% contract
60% bagasse & 40% Trash_60% contract
50% bagasse & 50% Trash_30% contract
60% bagasse & 40% Trash_30% contract
0.0
17.5
35.0
52.5
70.0
Truck cost Up-off loading Gate purchase price feedstock wet
Bio
mas
s so
urc
ing c
ost
(U
SD/t
on
cel
lulo
se)
Contract 100%_75Kton
Contract 60%_75Kton
Contract 30%_75Kton
Contract 100%_150Kton
Contract 60%_150Kton

173172
Spinning Future Threads
Annexure 6Stakeholder mapping and analysis
The interest-influence matrix for stakeholders is divided into four major sections, depending on their degree of interest and influence, and different approaches are ascribed to engaging with the stake-holders that fall within these sections:
• ▪Those with low influence and low interest: Regu-lar minimal contact
• Those with low influence and high interest: Keep completely informed
Stakeholder group Associated stake
Farmers/farmer cooperatives
• Alternative uses of agro-residue• Addition to income from produce• Costs associated with residue removal (for e.g., labour)
Technology devel-opers
• Introduction of new/innovative technology for the market• Capacity to support mainstreaming of new/innovative technology • Energy intensity associated with new/innovative technology
Textile innovators and design experts
• Knowledge of essential fibre characteristics• Developing new textile fibre for market• Addition to income stream• Employment generation
Logistics network (for e.g. transport and storage)
• Establishing critical transportation connections in the delivery chain• Expansion in storage infrastructure • Addition to income stream• Employment generation
Textile processors and manufacturers
• Diversification in operations • Knowledge of new processes/technology• Associated capital inputs (technology, labour, upgrading facility etc) • Addition to existing income • Increased buyer (i.e. brands) interest regionally and globally
Apparel brands • Enhanced sustainability standards• Ability to influence market demand• Improved consumer perception and base• First movers’ advantage (through pilot models; limited)• Distinctive reputation among rival brands• Potential for business lobbying alternatives
Industry associa-tions
• Assess scope of aggregation for industry• Shared costs and benefits among members• Distinctive leverage with buyers and regulatory agencies
Agricultural experts
• Knowledge of suitable crops and their fibre characteristics• Ascertain sustainability of alternative feedstock through
Start-up organi-zations
• Entry into a niche market segment• Mainstreaming of alternative products• Improved market reputation and value• Larger income base
Stakeholder group Associated stake
Government and its agencies
• Existing regulatory provisions for sale, storage and transport of agro-residue• Securing rural economy through like agriculture and allied activities• Effective management of agro-waste and residue, and reduced externalities
like air pollution, environmental burden• Potential to introduce new conducive regulations
Social and envi-ronmental experts
• Knowledge of socio-economic implications on communities like livelihood generation,
• Knowledge of environmental impacts like sustainable removal rates of residue, ecological burden
• Knowledge of climate change on crop patterns and seasons• Potential to influence policy and lobbying for alternatives
Figure A6.1: Major stakeholder groups and their associated stakes in the domain
Figure A6.1: Major stakeholder groups and their associated stakes in the domain
high
low
INT
ERES
T
highlowINFLUENCE
KEEP COMPLETELY INFORMED (low influence/high interest)
MANAGE MOST CLOSELY (high influence/high interest)
REGULAR MINIMAL CONTACT (low influence/low interest)
ANTICIPATE AND MEET NEEDS (high influence/low interest)
• Start-up businesses• Policy think tanks (including civil society organizations)• Industry associations
• Farmers• Technology developers• Textile innovators and design experts
• Agricultural experts• Socio-economic experts• Environmental and climate experts
• Logistics network• Textile processors and manufacturers• Apparel brands
• Those with high influence and low interest: Anticipate and meet needs
• Those with high influence and high interest: Manage most closely
The figure below shows the influence-interest matrix for the stakeholders relevant for this project.

175174
Spinning Future Threads
Annexure 7Questions sets for stakeholder consultations
SURVEY FOR FARMERS(To be administered through farmer cooperatives, representative civil society organizations, agriculture universities and field workers)
Name of the farmer: ___________________________________________________
Location of field (state/region and country): ____________________________________
Ownership-tenancy model for farm land1. Are you an owner or a tenant?2. Total land holding (in acre) ___________3. How much acreage is under cultivation in your farm?4. Is your land irrigated or unirrigated
a. If irrigated, what kind of irrigation system is used? (for e.g. groundwater, sprinkler, drip irrigation etc.)5. What kind of cost-sharing model exists between the owner and tenants in your farm?
a. Sharing of input costs (seeds, fertilizers, pesticides, equipment, irrigation)b. Sharing of logistics (transport, storage)c. Rent paid to ownerd. Any loan extension/credit arrangement between owner and tenant
6. What kind of revenue-sharing model exists between the owner and tenant in your farm?a. % revenue shared between owner and tenant from sale of produce
Main crops cultivated 1. Which are the main sowing seasons followed by you?2. List the crops grown during different seasons.3. What kind of cropping pattern is followed by you?
a. Mono-cropping (only one crop grown on the piece of land across seasons)b. Inter-cropping (growing two or more crops simultaneously on the same piece of land in a definite
patternc. Mixed inter-cropping (growing two or more crops simultaneously on the same piece of land in no
definite pattern)d. Sequential cropping/Crop rotation (growing of different crops on the same piece in a pre-planned
sequence)e. Any other pattern _____________________________________
4. Which are the most resource-intensive crops, in terms of:o Water/Irrigationo Energyo Fertilizerso Pesticideso Manure
5. Does the crop cultivation involve heavy usage of chemicals and such inputs? If so, please list the chemi-cals used.
Yield, produce and revenue of the selected crop 1. Name of the selected crop: _____________________________________________2. Type of crop:
a. Stapleb. Non-staplec. Non-food
Input Unit Quantity used Cost per unit Total cost
Water/Irrigation cycles
Seeds
Fertilizers
Pesticides
Chemicals
Electricity
Type of farm equipment/ animal labour
Human labour hours
TOTAL COST OF CULTIVATION
3. What are the inputs, quantities and costs per unit quantity used in cultivating this crop?4. What is the per acre yield of the selected crop?5. What is the total production of the selected crop?6. What is its market price (per quintal/per kg)?7. How much is the total revenue from the produce? (5*6)8. What is the net income from the produce? (Total revenue less total cost of cultivation)9. How many family members can you support through this revenue?10. Are you engaged in other economic activities to support your income? If yes, then specify the type and
the income from each:a. Poultry farmingb. Dairy farming
i. cowsii. buffaloesiii. goats etc.
c. Horticulture d. Any other ______________________________________________________
11. What trend has the yield of the selected crop shown over the last 5-10 years – increasing, decreasing or remained fairly constant?
12. Has the amount of water available been adequate to support cultivation of this crop over the last 5-10 years? If not, what changes have you experienced in terms of water demand? Have you adopted new methods of irrigation in the last 5-10 years? If so, please briefly describe them.

177176
Spinning Future Threads
Agro-residues of the selected crops1. Which parts of the selected crop are considered residue/waste?
a. Husk/Hullb. Bagassec. Leavesd. Stalks/strawe. Any other ____________________________________________________
2. What quantity of agro-waste/residue is generated for the selected crop per harvest cycle?o approx. % weight of the yield, oro approx. % weight of the total produce
3. What are the common methods of disposal and/or alternate uses for the agro-waste/residue from the selected crop?a. In case of commercial value:
i. What are the ways of approaching the agro-residue buyer?o Individual direct contacto Group contacto Third party contact (middlemen)o Other, please specify: _____________________________________
ii. What part of the agro-residue is sold?iii. Who buys this agro-residue? (for e.g. Paper mills, Fertilizer companies, Brick kilns, or other
industries/ sectors)iv. How much quantity of residue is sold per buyer?v. What is the per unit revenue earned for the sale of the residue?vi. What are the costs involved in selling this residue (i.e. labour/machinery for removal, power,
transportation, storage)? b. In case of domestic use:
i. What part of the agro-residue is used domestically?ii. Which domestic purposes are fulfilled?
o Cattle feedo Manure/compost for the fieldo Fuel for domestic useo Any other ___________________________________________
iii. How much quantity of residue is utilized per domestic purpose?iv. Does the use of this residue allow you to save on other costs?
o If yes, then how much do you save (approx.)?v. (in case of no current commercial value) Are you willing to sell this residue if you are paid for it?
c. In case of disposal:i. Which are the common disposal methods for this residue?
o Burningo Collection and transported to landfillo Keeping it in the fieldo Any other ____________________________________________
ii. Is there a logistics support (for e.g. transport) available for disposal and management of this res-idue? If yes, specify:o Government o Privateo Local and informal, based on social relationso Any other ____________________________________________
iii. What kind of costs are involved in disposing this residue?iv. (in case of no current commercial value) Are you willing to sell this residue if you are paid for it?
FOCUS GROUP DISCUSSION ON CLIMATE CHANGE AND ITS EFFECTS ON AGRICULTURE
(to be conducted with farmers, agricultural universities and researchers)
1. Have you experienced crop failure in the last 5-10 years? If yes, how many times has this occurred?2. To what reasons would you attribute crop failure? Please describe them briefly.3. Have you experienced a change in the temperature pattern over the course of previous years (approx.
5-10 years)? If yes, what is the change?4. Have you experienced a change in the pattern of precipitation over the previous years (approx. 5-10
years)? If yes, what is the change?5. Here are a few indicators of change in temperature pattern. Please mention if you have experienced
these:a. Increased summer daysb. Frequent occurrence of heat-induced crop diseasec. Frequent occurrence of heat-induced livestock diseased. Frequent occurrence of heat-induced human diseasee. Emergence of new plant species/invasive species, in the form of weedsf. Quick disappearance of water sources/points due to high evaporation
6. Here are a few indicators of change in rainfall pattern. Please mention if you have experienced these:a. Late onset of monsoonb. Early onset of monsoonc. Reduced period of rainy seasond. Erratic nature of rainfalle. Increased volume of rainfall in a short durationf. Long dry spells after onset of rainsg. Crop failure due to water shortage
7. What kind of measures do you undertake in the following situations:a. Droughtb. Floodc. Heavy rainfalld. Extreme heate. Outbreak of pests and/or diseases

179178
Spinning Future Threads
INTERVIEW QUESTIONS
For Agricultural Experts1. Are you aware of any existing pilot models or studies that showcase the use of agro-residue as a textile
fibre feedstock? If yes, please provide a brief description.
2. What are the critical success factors required in the agricultural setup to support the mainstreaming of agro-residue as an alternative raw material to produce textile fibres? (regulations, financing, logistics, more R&D, demand, low setting-up and input cost)
3. What kind of logistics network (from farm-to-roadside) is required to support the delivery chains for this initiative? How do the existing logistics arrangements fare in these respects? What changes can be recommended?
4. What kind of policy support and barriers exist currently that can affect the mainstreaming of agro-res-idue as a textile fibre feedstock, directly or indirectly? What opportunities can be created through policy modifications to support such initiatives? (prompts: cross-boundary regulations on transportation of agro-waste; recommendations for management and disposal of agro-residue; financing schemes for innovative technology development and scale-up; research grants)
5. What factors can act as barriers to this model in an agricultural setup? How can these be addressed?
6. In case of other uses for the agro-residue, what are some key anticipated trade-offs in shifting the sup-ply of residue from those uses to the proposed use? What are the costs associated with these trade-offs?
7. How would these models affect the farming practices of the source crops (land use pattern; crop rotation practices; use of fertilizers and chemicals; irrigation)?
8. What could be some other unintended consequences of mainstreaming this sourcing model? How would this impact the sustainability of these models?
Technology 1. What kinds of innovative technologies/processes are available, both at pilot stage or commercial use, to
process agro-residue to produce textile fibres? Please describe them briefly.
2. Which kinds of agro-residue can be processed using this technology? What is the minimum lot size of agro-residue required for processing in this technology? What is the subsequent quantity of output (fibre) generated from this technology/process?
3. What are the costs involved in developing this technology/process (raw materials, water, energy, labour)? How will these be affected when the technology is scaled-up? Will there be any additional costs involved in scaling up? If so, what kind?
4. What are the key success factors necessary to scale-up this technology/process to be used at a commer-cial level (for e.g. a basic minimum level and regular supply agro-residue; availability of inputs; infra-structural requirements; financing etc.)?
5. What are the current barriers/challenges affecting the scaling-up of production and use of this technolo-gy? In what ways can these be addressed?
6. What is the future outlook for this technology in the textile industry? How does it compare with the other widely-used technologies in textile manufacturing? What modifications can make this innovative tech-nology/process more feasible for use?
7. What are the environmental impacts associated with the development and use of technology (for e.g., air pollution, effluent release, energy demand)? How can these be mitigated/abated?
8. What could be the unintended consequences of mainstreaming the use of this technology/process?
Fibre1. Which types of agro-residue are being currently utilized to produce textile fibre? How prevalent/at what
scale are these residues being used?
2. What are the costs involved in the production of these fibres (for e.g. removal from field, transportation, storage, stages of processing, inputs like water, energy, chemicals, labour)?
3. What are the key characteristics and quality features of such fibres? What are their current textile appli-cations? Is there a scope for expanding their future applications? If so, what are these potential applica-tions?
4. What are the current textile applications of the fibres generated through this technology? Are there other potential applications in textiles and garments? If so, what will enable their realization?
5. How do these fibres compare with the more conventional and widely used in textile production (on parameters like quality, applicability, cost of production, price, ease of sourcing etc.)?
6. Which factors will positively bolster the mainstreaming of these fibres in the textile industry?
7. What are the main barriers and challenges to the commercialization of these fibres? How can these be addressed? What kind of challenges can arise in the future?
8. What is the potential for recycling, reuse and disposal of the textiles made from these fibres, after their use? How do they impact the environment and the climate?
Commercialisation & Market Perspectives1. Are there any apparels brands/innovators involved in processing agro-residue for fibre/utilizing the fibres
made from agro-residue to produce textiles? If so, please briefly describe them.
2. In which textiles/apparel segments are these fibres being currently used? Is there potential to expand these applications? If so, how and in which area can this be done? (probe into any modifications required in these fibres)
3. How do products made from these fibres fare in comparison with the products made from more prev-alent/conventional fibres in terms of their market demand and ability to compete (includes factors like cost of production, price of fibre, brand awareness, demand, consumer awareness, typical consumer base)? Are there any large brands using it in their production? If so, which ones are these?
4. How do these fibres compare with the other conventional and widely-available fibres on key sustainabil-ity parameters (ease of reuse, recycling, disposal; energy demand; resulting emissions from production; intensity of water use; use of chemicals and dyes; health and well-being of workers)?

181180
Spinning Future Threads
5. How do the apparel brands perceive the current market value and demand of textiles made from agro-residue? How are these expected to take shape in the future?
6. What are the pre-requisites for large brands to take up these fibres into their main production lines (for e.g. investments in skill, technology, infrastructure; regular supply of agro-residue; established delivery chains; marketing and building consumer awareness etc)? How can economies of scale be achieved in this?
7. How do the existing logistics arrangements (from farm-to-roadside and roadside-to-mill) support this model? What changes can be recommended? What role can the brands/textile processors play in this?
8. What role can aggregation mechanisms play in supporting this model? How feasible are they in the cur-rent textile supply chain context?
9. What are the key barriers and challenges to the mainstreaming of these fibres? How are these expected to change in the future?
10. What role can international standards, policies and regulations for textile manufacturing play in support the large-scale commercialization of these fibres?
11. What are the other kinds of innovations expected to take place in the textile industry to enhance its sustainability? How does this initiative (agro-residue as textile fibre feedstock) compare with them (any scope of converging, complementing or being overshadowed)?
12. What could be the unintended consequences/externalities (positive and negative) for the textile industry stakeholders arising from the mainstreaming of these fibres?
Socio-Economic and Environmental Implications1. What changes could occur in the prevailing socio-economic conditions in rural areas due to the commer-
cialization of use of agro-residue as textile fibre feedstock (economic set-up, new sources for livelihoods, social relations etc.)?
2. What kind of environmental impacts are expected to follow the scaling-up of use of agro-residue as a textile fibre feedstock (for e.g. land use pattern, transportation, energy use, water use, soil quality)? How can these be addressed?
3. What role will climate change and its effects (like change in weather patterns, irregular monsoons) play in the use of agro-residue in textile industry? Conversely, will this transition mitigate some effects of climate change?
4. How do the existing intra-regional policies, international treaties and agreements enable and/or hamper the transition from conventional fibres to agro-residue for textile fibres?
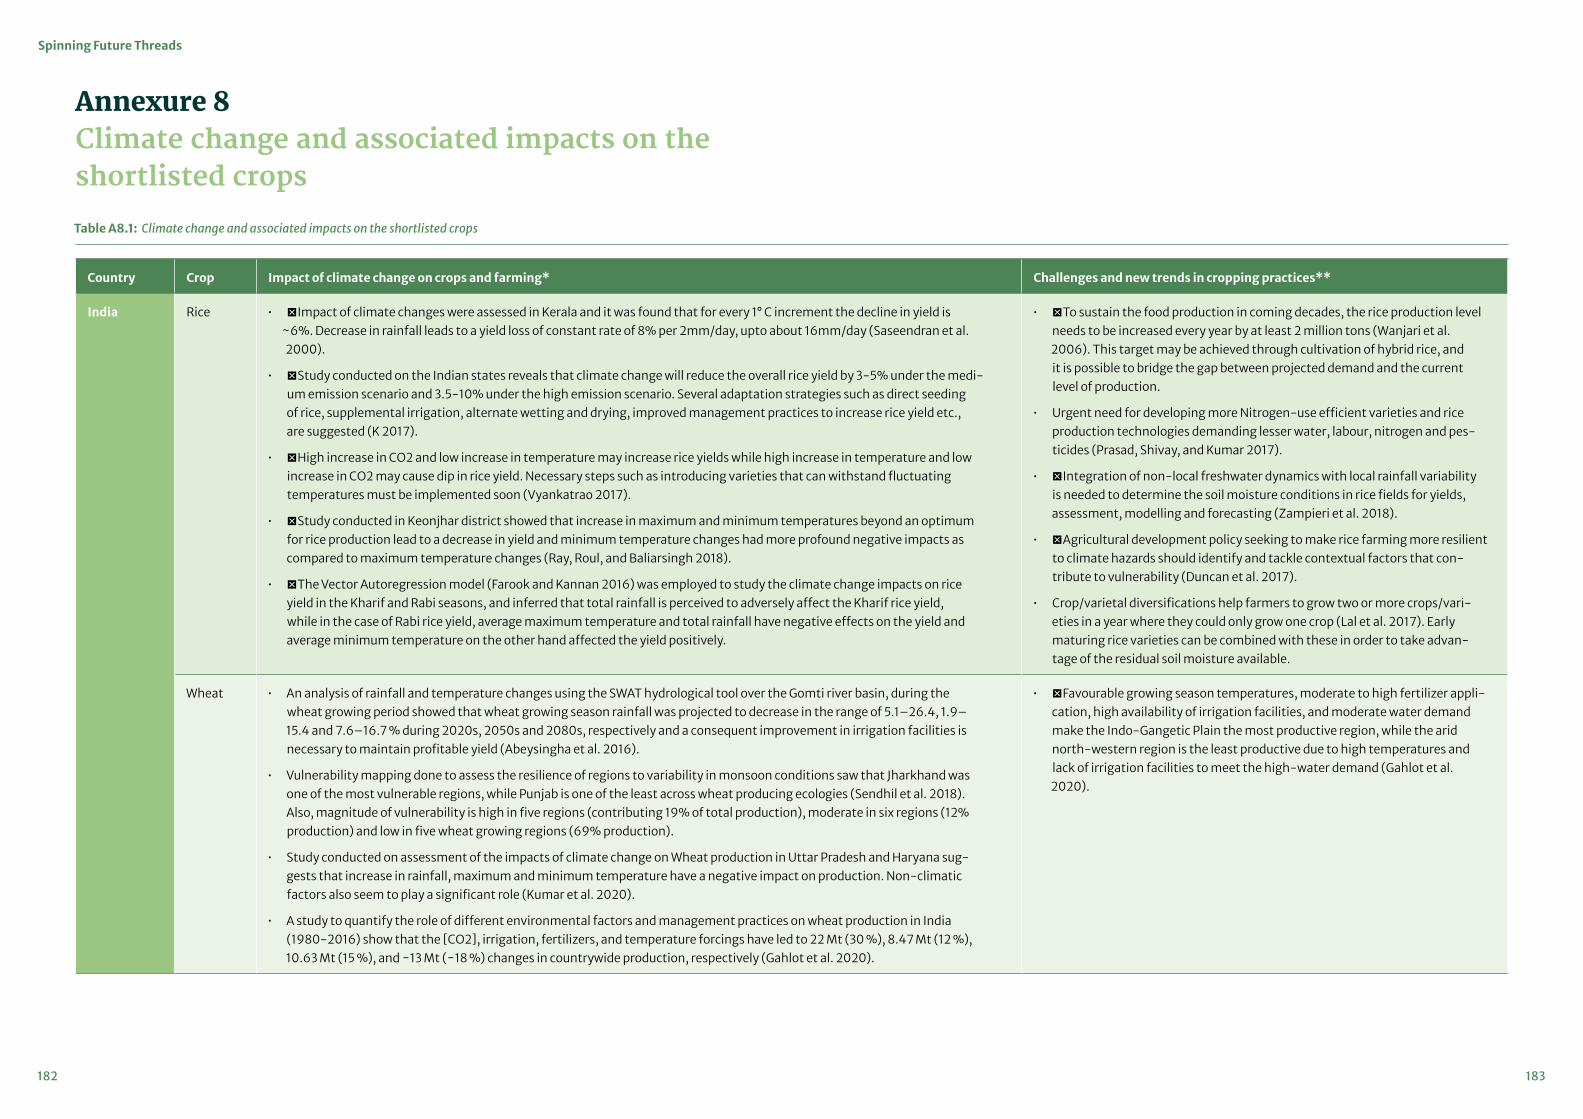
183182
Spinning Future Threads
Annexure 8Climate change and associated impacts on the shortlisted crops
Table A8.1: Climate change and associated impacts on the shortlisted crops
Country Crop Impact of climate change on crops and farming* Challenges and new trends in cropping practices**
India Rice • ▪Impact of climate changes were assessed in Kerala and it was found that for every 1° C increment the decline in yield is ~6%. Decrease in rainfall leads to a yield loss of constant rate of 8% per 2mm/day, upto about 16mm/day (Saseendran et al. 2000).
• ▪Study conducted on the Indian states reveals that climate change will reduce the overall rice yield by 3-5% under the medi-um emission scenario and 3.5-10% under the high emission scenario. Several adaptation strategies such as direct seeding of rice, supplemental irrigation, alternate wetting and drying, improved management practices to increase rice yield etc., are suggested (K 2017).
• ▪High increase in CO2 and low increase in temperature may increase rice yields while high increase in temperature and low increase in CO2 may cause dip in rice yield. Necessary steps such as introducing varieties that can withstand fluctuating temperatures must be implemented soon (Vyankatrao 2017).
• ▪Study conducted in Keonjhar district showed that increase in maximum and minimum temperatures beyond an optimum for rice production lead to a decrease in yield and minimum temperature changes had more profound negative impacts as compared to maximum temperature changes (Ray, Roul, and Baliarsingh 2018).
• ▪The Vector Autoregression model (Farook and Kannan 2016) was employed to study the climate change impacts on rice yield in the Kharif and Rabi seasons, and inferred that total rainfall is perceived to adversely affect the Kharif rice yield, while in the case of Rabi rice yield, average maximum temperature and total rainfall have negative effects on the yield and average minimum temperature on the other hand affected the yield positively.
• ▪To sustain the food production in coming decades, the rice production level needs to be increased every year by at least 2 million tons (Wanjari et al. 2006). This target may be achieved through cultivation of hybrid rice, and it is possible to bridge the gap between projected demand and the current level of production.
• Urgent need for developing more Nitrogen-use efficient varieties and rice production technologies demanding lesser water, labour, nitrogen and pes-ticides (Prasad, Shivay, and Kumar 2017).
• ▪Integration of non-local freshwater dynamics with local rainfall variability is needed to determine the soil moisture conditions in rice fields for yields, assessment, modelling and forecasting (Zampieri et al. 2018).
• ▪Agricultural development policy seeking to make rice farming more resilient to climate hazards should identify and tackle contextual factors that con-tribute to vulnerability (Duncan et al. 2017).
• Crop/varietal diversifications help farmers to grow two or more crops/vari-eties in a year where they could only grow one crop (Lal et al. 2017). Early maturing rice varieties can be combined with these in order to take advan-tage of the residual soil moisture available.
Wheat • An analysis of rainfall and temperature changes using the SWAT hydrological tool over the Gomti river basin, during the wheat growing period showed that wheat growing season rainfall was projected to decrease in the range of 5.1–26.4, 1.9–15.4 and 7.6–16.7 % during 2020s, 2050s and 2080s, respectively and a consequent improvement in irrigation facilities is necessary to maintain profitable yield (Abeysingha et al. 2016).
• Vulnerability mapping done to assess the resilience of regions to variability in monsoon conditions saw that Jharkhand was one of the most vulnerable regions, while Punjab is one of the least across wheat producing ecologies (Sendhil et al. 2018). Also, magnitude of vulnerability is high in five regions (contributing 19% of total production), moderate in six regions (12% production) and low in five wheat growing regions (69% production).
• Study conducted on assessment of the impacts of climate change on Wheat production in Uttar Pradesh and Haryana sug-gests that increase in rainfall, maximum and minimum temperature have a negative impact on production. Non-climatic factors also seem to play a significant role (Kumar et al. 2020).
• A study to quantify the role of different environmental factors and management practices on wheat production in India (1980-2016) show that the [CO2], irrigation, fertilizers, and temperature forcings have led to 22 Mt (30 %), 8.47 Mt (12 %), 10.63 Mt (15 %), and −13 Mt (−18 %) changes in countrywide production, respectively (Gahlot et al. 2020).
• ▪Favourable growing season temperatures, moderate to high fertilizer appli-cation, high availability of irrigation facilities, and moderate water demand make the Indo-Gangetic Plain the most productive region, while the arid north-western region is the least productive due to high temperatures and lack of irrigation facilities to meet the high-water demand (Gahlot et al. 2020).

185184
Spinning Future Threads
Country Crop Impact of climate change on crops and farming* Challenges and new trends in cropping practices**
India
Banana & Plantain
• Higher temperatures (31-32°C) increase the rate of plant maturity in banana thus shortening the bunch development peri-od (Malhotra 2017).
• For 27 countries accounting for 86% of global dessert banana production, a changing climate since 1961 has overall increased annual yields but these could dampen to 0.59t/Ha and 0.19t/Ha by 2050 under the climate scenarios for RCP 4.5 & 8.5 respectively, driven by declining yields in the largest producers and pathways (Varma and Bebber 2019). Securing future supply to non-producing countries, where banana consumption is an important contributor to dietary diversity, is likely to require a reorganization of the export market.
• Investments targeted at yield growth appear to be more effective than marketing improvements in alleviating production constraints and in strengthening the role of Banana crops in future food systems (Petsakos et al. 2019).
• Leaf spot disease in banana crops in Jalgaon region of Maharashtra has started appearing and can be attributed to climate change (Ravi and Mustaffa 2013).
• Novel technologies such as microwave, vacuum, infrared, high pressure, pulse electric, irradiation etc. have resulted in better quality products in terms of nutrient retention, enzymatic and microbial inactivation as well as in replacing thermal operations like blanching, pasteurization, sterilization and dehydration (Mohapatra et al. 2011).
• Study conducted on assessment of post-harvest losses showed that over-all losses in banana comprised of (6.81%) loss at field level, (3.90%) loss during transport (Jadhav et al. 2020). The minimum (1.56%) post-harvest losses in banana were recorded during assembly market/wholesale market. The losses to were recorded during storage and ripening was (3.40%). The highest loss (14.12%) was observed at retailer level.
Coconut • Negative impacts on yield of coconut are projected for Andhra Pradesh, Orissa, West Bengal, Gujarat and parts of Karnataka and Tamil Nadu, while overall productivity in India is projected to increase in future climate scenarios (Naresh Kumar and Aggarwal 2013).
• Natural calamities like droughts and cyclones have affected the productivity of coconut by about 3500nuts/Ha/yr in India for four years (Hirpo 2019).
• Rainfall, evapotranspiration, solar radiation, sunshine hours, relative humidity and wind velocity are the major climatic vari-ables that influence the yield when other external factors such as fertility, management, pests and diseases are non-limit-ing (Peiris, Thattil, and Mahindapala 1995).
• Climate change in the Western Ghats, coastal districts and NE regions is projected to significantly affect crop production. The impacts are crop specific and simple adaptation strategies such as change in variety and altered agronomy, high input delivery and use efficiency can offset the negative impacts of climate change (Naresh Kumar et al. 2011).
• To increase the shelf-life of the coconuts the nuts have to be harvested carefully with intact perianth and without any breakage of nuts (Hasee-na, Bai, and Padmanabhan 2010). The quality of minimally processed nuts deteriorates earlier than non-dehusked nuts during storage.
Maize • Empirical results of a study carried out in Telangana show that average minimum temperature has a significant unfavour-able impact on Maize yield (Guntukula and Goyari 2020). Furthermore, rainfall and minimum temperature are risk-shrink-ing factors, but the maximum temperature is a risk-enhancing factor for the maize yields during the study period.
• Maize yields in monsoon are projected to be adversely affected due to the rise in atmospheric temperature (Byjesh, Kumar, and Aggarwal 2010); but increased rainfall can partially offset those loses. Developing new cultivars in changed climate scenarios similar to that of current varieties in present conditions could be an advantageous adaptation strategy for mini-mizing the vulnerability of maize production in India.
• Comparing data from different models suggests that future yield losses are projected for Maize and unless plant breed-ers are able to produce new hybrids with improved traits, the forecasted yield losses for Maize will only be mitigated by agro-management adaptations (Fodor et al. 2017).
• According to a study conducted, Maize yield will decline by 29% in the mid-century, but this can be offset through improved management as adaptation strategies (Ahmad et al. 2020).
• Double mulching technology involving maize stover mulch and fresh biomass of ragweed is a viable option for improving soil, crop and water productivity under rainfed hill ecosystems of eastern Indian Himalayas (Ngangom et al. 2020).

187186
Spinning Future Threads
Country Crop Impact of climate change on crops and farming* Challenges and new trends in cropping practices**
India
Okra • Study reveals that increase in temperature leads to a subsequent drought and increase in salinity, that may negatively impact the cultivation (Ayyogari, Sidhya, and Pandit 2014). Increase in CO2 may increase crop yields due to increased CO2 fertilization, but decreases after some extent.
• Climate change conditions can facilitate the spread of plant viruses and other diseases (Krishnareddy 2013). A less pre-dictable climate condition will cause uncertainty in decision making over the timing of control measures, particularly crops grown in the regions where climate is too warm or under drought stress may tend to become physiologically weaker to withstand infection.
• Increased temperature and humidity facilitate growth of pest insect population that can cause severe damage resulting in lowering the yield of crop (Rawat, Karnatak, and Srivastava 2020).
• Plant-based stress detection based on leaf photosynthetic attributes could be utilized for enhancing water use efficiency at specific growth stage and to help in for devising agricultural water management options with the incorporation of spectral reflectance-based indicators in different crops (Chaturvedi et al. 2019).
• Organic source of nutrients could be a better option in terms of optimum growth, yield and profitability of the crop (Dutta, Kalita, and Maibangsa 2020).
Pineapple • Changes in climate have significant impacts on pineapple cultivation, price fluctuation and diseases during flowering stage in Kerala (Thomas and Dinesh 2020). Around 50% of the crop was affected by various diseases post flooding that lead to degradation of the fruit.
• Production of pineapple has been affected negatively in Meghalaya during the time periods of low rainfall or droughts in the state, hence appropriate adaptation strategies are required to cope with these impacts (Sheikh et al. 2018).
• Malpractices such as colouring, oiling, sweeteners and hormone injections followed by retailers are mainly profit targeted. The involvement of farmers, retailers, consumers, scientists, policy makers and government agencies is required to address this issue (Panghal et al. 2018).
Seed Cotton
• Cotton productivity in Northern India is projected to marginally decline owing to decrease in rainfall (Hebbar et al. 2013). Adaptive measures such as changes in planting time and more responsive cultivars may further boost cotton production in India.
• Study shows that higher temperatures in already hot areas may hinder cotton development and fruit formation (Ton 2011). Rain-fed cotton production may suffer from higher climate variability, leading to periods of drought or flooding. Irrigated cotton, particularly in northern India, may suffer from lower water availability due to upstream reduction of snow and ice from Himalayan and Tibetan plateau glaciers and snowfields.
• Relay planting increased seed cotton yield by 12% in comparison to the conventional method (Singh et al. 2017).
• Effective disease and pest control measures need to be developed to check the perennial pest infestation of cotton in the state of Haryana (Seidu 2018).
Sorghum • Study on assessment of vulnerability of sorghum cultivation to climate change impacts shows that the yield loss may be huge for locations where the current temperatures are already high and the rainfall is low, whereas for places where the current temperatures are relatively low with moderate rainfall, the yield loss is likely to be lesser (Srivastava, Naresh Kumar, and Aggarwal 2010). Adaptation strategies suggested are the implementation of more resilient varieties and shifting of planting times.
• Simulations suggest that Sorghum is more sensitive to availability of nutrients and soil water under rainfed conditions (Rao et al. 1995).
• Increase in temperature and rainfall beyond a threshold level can negatively affect the sorghum yield in the future (Sarava-nakumar 2015).
• Hybridization with a wild species of sorghum may improve stress tolerance of the species. However, this is a challenging process because of the lack of genetic information on the wild sorghum species and the complexity involved in the process of introgression (Ananda et al. 2020).
Sugar-cane
• The most significant challenges to sugarcane are increases in frequency and intensity of extreme weather events, especially drought during climate change (Zhao and Li 2015). Improving resilience of sugarcane production systems to climate change requires the protection of the natural resource for sustainability.
• Simulations using the CANEGRO- sugarcane model to assess the impacts of climate change on sugarcane in different com-binations of elevated temperature and CO2 concentrations revealed that sugarcane fresh stalk mass mostly increased but sucrose mass decreased. In general, water stress conditions combined with the projected increase in temperature adversely affected the sugarcane (Sonkar et al. 2020).
• Average maximum temperature in summer and average minimum temperature in rainy season have a negative and statis-tically significant effect on sugarcane productivity (Kumar 2014).
• Significant effect on sugarcane yield is expected in the future owing to its sensitivity to temperature, rainfall, solar radiation etc. Advanced agronomic measure including development of varieties of sugarcane more immune to climatic conditions is necessary (A. K. Srivastava 2012).
• Study conducted reveals that there could be variability in cultivars of sugar-cane with respect to deterioration during long harvest-to-crush periods at both high and low temperatures. Losses in stalk weight and sucrose con-tent can also simply be reduced by spraying with water and covering with organic trash if there is a delay in supply and processing (P. Singh, Singh, and Singh 2020).

189188
Spinning Future Threads
Country Crop Impact of climate change on crops and farming* Challenges and new trends in cropping practices**
Bangladesh Rice • Sea level rise and salt water intrusion could reduce yield by 15.6% in nine coastal sub-districts (Dasgupta, et al. 2017)
• Impact of temperature rice varies seasonally and regionally. Between 1981-2010 on an average, for 1°C rise in temperature the yield of Boro rice in projected to increase by 1.49%, while that of Aman and Aus rice are to decline by 6.85% and 0.18% respectively. The net impact being a decline in productivity and production (Lewis and Ostendorf 2017)
• Rainfall during monsoon months has an increasing trend and dry months (November to March) has a slight decrease. This would increase the moisture stress on Boro rice cultivation. (Md Abiar Rahman 2017)
• Adoption of irradiation seeds to significantly improve time to breed new and improved plant varieties (Jawerth 2017)
• SRI being adopted in the state country since 1999-2001 (SRI International Network and Resources Center (SRI-Rice) 2015)
• Bangladesh Agricultural University has also developed new method- Boro paddy cultivation technique for direct dry seeding (Similar to SRI) (Siddique 2016)
• Studies suggest the need to reschedule crop calendar and cropping pattern along with introduction of temperature and moisture stress tolerant rice varieties. (Md Abiar Rahman 2017)
Sri Lanka Rice • Simulation of climatic conditions over different varieties of rice revealed that both wet zone and dry zone rice produce decreased, thus imposing the need for adaptation measures to be implemented in the future (Amarasingha et al. 2018).
• Increase in temperatures of more than 2-4° C can have upto a 30% decrease in yield. Variations in precipitation can be reduced in impact by increased use of irrigation (Ratnasiri et al. 2019).
• The increase in average temperature for 2040–2070 from that of 1980–2010 ranged from 1.1–2.4 °C for Maha and 1.5–2.8 °C for Yala seasons, in a projection made over Northwestern Sri Lanka (Zubair et al. 2015). Respective projected yields of rice were lower for both the seasons.
• Subtle increases in July maximum and minimum temperatures have a negative impact on the “Yala” paddy yields in most of the divisions namely, Anudhapura, Batticaloa, Hambantota, Jaffna, Kandy and Mannar (Shanmuganathan 2013).
• Recent study on pesticide use by farmers showed that most were using them as an adaptive measure to counter any possible loss to high yield-ing rice varieties, and not due to prior knowledge about them (Horgan and Kudavidanage 2020).
Pakistan* Rice • Increase in MMXT negatively impacts rice production while increase in MMNT impacts positively. (Usman Shakoor 2015) In net the rising temperatures is likely to cause drop in rice production by 15-20% towards the end of century (due to drop in crop yield) (Muhammad Mohsin Iqbal 2009)
• 80% of the Pakistani rivers derive water from Hind-Kush Himalayan glaciers. Rising temperatures would cause increased river flows and flooding in next 2-3 decades, followed by a decreased flow. The large variability of Himalayan river flows will make irrigated areas more vulnerable to production losses. (Muhammad Mohsin Iqbal 2009)
• Variability in frequency and intensity of rainfall will adversely affect rainfed areas. (Muhammad Mohsin Iqbal 2009)
• Direct seeded rice cultivation is being promoted in the country to reduce water and labour use by 50%. (S Marasini 2018)
• Studies are being undertaken in Gilgit-Baltistan region to assess snowmelt runoff and glacial resource potential under climate change scenarios (Paki-stan Agriculture Research Council (PARC) 2019)
• It has been importing HYV seeds from India for quite some time (AgroBusi-ness Times 2018). The government has set target yeild for various crops and has plans for importing Climate resilient high yielding varities of seeds to increase productivity and profitability of farmers (Talpur, et al. 2018).
Wheat • The rise in temperatures is likely to cause drop in wheat production by 6-8% towards the end of century (due to drop in crop yield) (Muhammad Mohsin Iqbal 2009)
• Northern mountainous region will have an increase in yield of 40-50 %, improving local food self-sufficiency. But the region accounts for only ~2% of the national production. (Muhammad Mohsin Iqbal 2009)
• Rising temperatures would cause increased river flows and flooding in next 2-3 decades, followed by a decreased flow. The large variability of Himalayan river flows will make irrigated areas more vulnerable to production losses. (Muhammad Mohsin Iqbal 2009)
• Variability in frequency and intensity of rainfall will adversely affect rainfed areas. (Muhammad Mohsin Iqbal 2009)
• Studies are being undertaken in Gilgit-Baltistan region to assess snowmelt runoff and glacial resource potential under climate change scenarios (Paki-stan Agriculture Research Council (PARC) 2019)
Seed Cotton
• Studies in southern Punjab indicate an increase in the number of days for maturity of cotton. While there is an increase in cotton yield due to projected increase in precipitation and CO2 concentrations. (Asad Amin 2018)
• Changes in temperature and precipitation would have negative impact on cotton production but there are significant dis-trict wise variations in crop productivity. (Rehana Siddiqui 2015)
• It has been importing HYV seeds from India for quite some time (AgroBusi-ness Times 2018). The government has set target yeild for various crops and has plans for importing Climate resilient high yielding varities of seeds to increase productivity and profitability of farmers (Talpur, et al. 2018).
• Inadequate access to timely weather forecasts is increasing losses for farm-ers. In 2016, a text message service- Telecotton , was launched to address this gap. But its adoption among farmers remains poor (Reuters 2019).

191190
Spinning Future Threads
Country Crop Impact of climate change on crops and farming* Challenges and new trends in cropping practices**
Indonesia* Rice • For every 1° C rise in temperature rainfed paddy yields to decline by 14.4% and that of irrigated paddy field by 11.1% (Yuli-awan and Handokob 2016)
• For every 1°C rise in temperature there is lower quality of rice and 10-25% decline in production (Ministry of Foreign Affairs of the Netherlands 2018)
• In some coastal districts of Java, inundation due to sea level rise is expected to reduce rice production by 95% (Ministry of Foreign Affairs of the Netherlands 2018)
• A 30-day delay in monsoon predicted. Which may prolong the “hunger season” and prevent farmers from planting two consecutive rice crops (Ministry of Foreign Affairs of the Netherlands 2018)
• 55% of the rice in Indonesia is produced in islands of Java and Bali. Thus, climate change impacts and adaptation strategies in them have the largest bearing on food security in the nation (Ministry of Foreign Affairs of the Netherlands 2018)
• In El Nino years rice harvest area decrease while in La Nina the harvest area increased. The changes are much higher for wet paddy fields than dry paddy fields. (Aldrian, et al. 2012) This indicates increased crop losses during El-nino years and vice-versa for La-nina.
• Studies in Indonesia indicate that female farmers have a higher climate change resilience and ability to withstand climate shocks (Rondhi, et al. 2019)
• The continued diversion of eco-sensitive peatlands for paddy cultivation, as a part of rice estate project, is a major issue that the national government is yet to change its trajectory on it (Budiman 2020)
• Terrace farming of rice in Bali is one of the successful traditional farming practices by farmer organisations called Subaks (Resilience Alliance n.d.). Since 2012 it forms part of the UNESCO World Cultural Heritage cite, and it has lot of potential for sustainable climate resilient agriculture (UNESCO 2012).
• The traditional methods of Rice- Fish farming is being emphasised in the country to diversify farmers income, ensure better water management, reduce GHG emissions and shift to organic farming methods. FAO is an active participant in such initiatives. (Cruz 2001, Beau Damen 2018)
Maize • Increase in yield of corn in projected with 25% increase in the value of crop (Hecht 2016)
• Areas of maize cultivation with increased rainfall will have positive effect in yield, while those with higher temperatures are to have reduced yields. The net result being positive (Hecht 2016)
• In El Nino years maize harvest area decrease while in La Nina the harvest area increases. (Aldrian, et al. 2012)
• Some studies suggest shifting to maize cultivation in areas projected to have increased rainfall like Lampung and Gorontalo province (Hecht 2016)
Pine-apple*
• Though no studies were found on the impact of climate change on pineapple in Indonesia, there are some examples from other countries. Studies on smallholder pineapple farmers in Ghana indicate a steep drop in net revenues per hectare for a 1°C increase in temperature, and substantial increase in it for a 1mm increase in rainfall. The studies in rainfed areas indi-cate the susceptibility of the crop to climate change. (Portia Adade Williams 2017)
Oil Palm • Increased temperatures may lead to inability of Oil palms to grow in some areas. (R. Russell M. Paterson 2015)
• Oil Palm growth could be severely impacted by climate change. A gradual decline in suitability of regions for palm cultiva-tion (like islands of Papua and Kalimantan) is projected by 2030 which is to become more pronounced by 2100 (R. Russell M. Paterson 2015)
• Increased heat stress on oil palm is projected on islands of Sumatra, Java and Borneo. While increased moisture stress is projected on islands of Java, Lombok, Sumbawa, Sumba and East Timor, among others. (R. Russell M. Paterson 2015)
• Water requirements are estimated to increase by 10% for every 1°C rise in temperature. (Suresh 2013)
• Diversion of tropical forest areas (deforestation) and peat land for palm oil cultivation, among other crops, is a major cause of GHG emission in Indo-nesia. (R. Russell M. Paterson 2015)
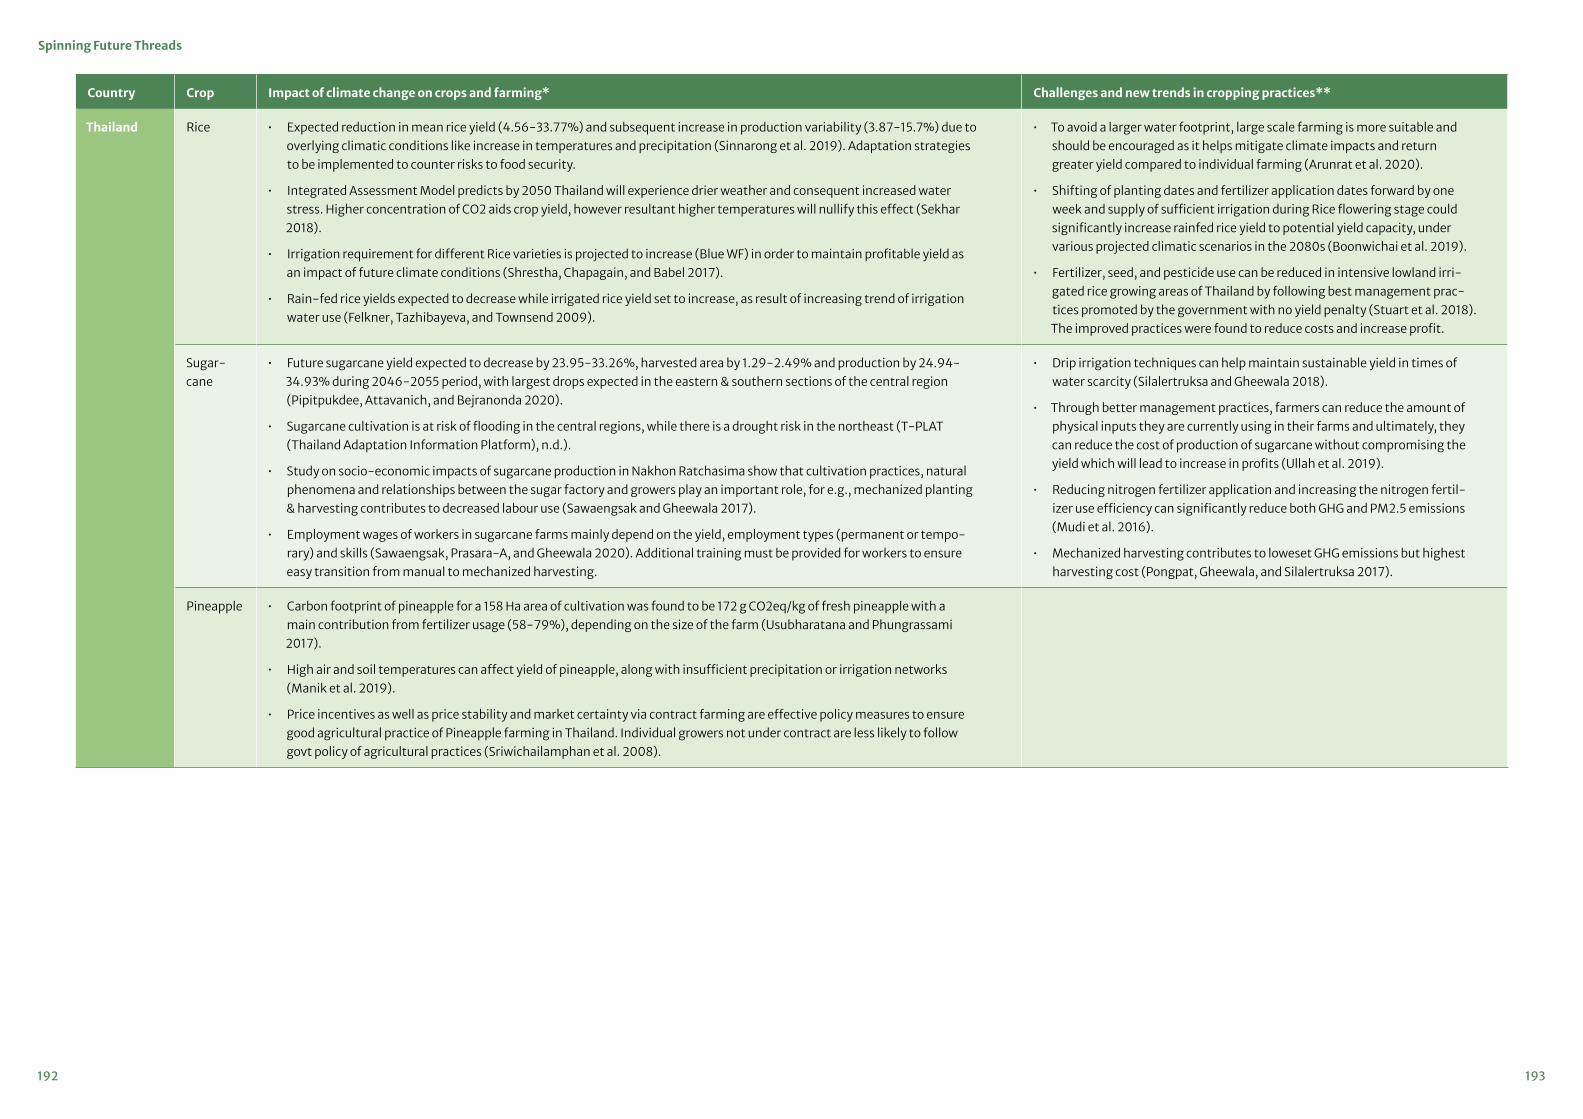
193192
Spinning Future Threads
Country Crop Impact of climate change on crops and farming* Challenges and new trends in cropping practices**
Thailand Rice • Expected reduction in mean rice yield (4.56-33.77%) and subsequent increase in production variability (3.87-15.7%) due to overlying climatic conditions like increase in temperatures and precipitation (Sinnarong et al. 2019). Adaptation strategies to be implemented to counter risks to food security.
• Integrated Assessment Model predicts by 2050 Thailand will experience drier weather and consequent increased water stress. Higher concentration of CO2 aids crop yield, however resultant higher temperatures will nullify this effect (Sekhar 2018).
• Irrigation requirement for different Rice varieties is projected to increase (Blue WF) in order to maintain profitable yield as an impact of future climate conditions (Shrestha, Chapagain, and Babel 2017).
• Rain-fed rice yields expected to decrease while irrigated rice yield set to increase, as result of increasing trend of irrigation water use (Felkner, Tazhibayeva, and Townsend 2009).
• To avoid a larger water footprint, large scale farming is more suitable and should be encouraged as it helps mitigate climate impacts and return greater yield compared to individual farming (Arunrat et al. 2020).
• Shifting of planting dates and fertilizer application dates forward by one week and supply of sufficient irrigation during Rice flowering stage could significantly increase rainfed rice yield to potential yield capacity, under various projected climatic scenarios in the 2080s (Boonwichai et al. 2019).
• Fertilizer, seed, and pesticide use can be reduced in intensive lowland irri-gated rice growing areas of Thailand by following best management prac-tices promoted by the government with no yield penalty (Stuart et al. 2018). The improved practices were found to reduce costs and increase profit.
Sugar-cane
• Future sugarcane yield expected to decrease by 23.95-33.26%, harvested area by 1.29-2.49% and production by 24.94-34.93% during 2046-2055 period, with largest drops expected in the eastern & southern sections of the central region (Pipitpukdee, Attavanich, and Bejranonda 2020).
• Sugarcane cultivation is at risk of flooding in the central regions, while there is a drought risk in the northeast (T-PLAT (Thailand Adaptation Information Platform), n.d.).
• Study on socio-economic impacts of sugarcane production in Nakhon Ratchasima show that cultivation practices, natural phenomena and relationships between the sugar factory and growers play an important role, for e.g., mechanized planting & harvesting contributes to decreased labour use (Sawaengsak and Gheewala 2017).
• Employment wages of workers in sugarcane farms mainly depend on the yield, employment types (permanent or tempo-rary) and skills (Sawaengsak, Prasara-A, and Gheewala 2020). Additional training must be provided for workers to ensure easy transition from manual to mechanized harvesting.
• Drip irrigation techniques can help maintain sustainable yield in times of water scarcity (Silalertruksa and Gheewala 2018).
• Through better management practices, farmers can reduce the amount of physical inputs they are currently using in their farms and ultimately, they can reduce the cost of production of sugarcane without compromising the yield which will lead to increase in profits (Ullah et al. 2019).
• Reducing nitrogen fertilizer application and increasing the nitrogen fertil-izer use efficiency can significantly reduce both GHG and PM2.5 emissions (Mudi et al. 2016).
• Mechanized harvesting contributes to loweset GHG emissions but highest harvesting cost (Pongpat, Gheewala, and Silalertruksa 2017).
Pine apple • Carbon footprint of pineapple for a 158 Ha area of cultivation was found to be 172 g CO2eq/kg of fresh pineapple with a main contribution from fertilizer usage (58-79%), depending on the size of the farm (Usubharatana and Phungrassami 2017).
• High air and soil temperatures can affect yield of pineapple, along with insufficient precipitation or irrigation networks (Manik et al. 2019).
• Price incentives as well as price stability and market certainty via contract farming are effective policy measures to ensure good agricultural practice of Pineapple farming in Thailand. Individual growers not under contract are less likely to follow govt policy of agricultural practices (Sriwichailamphan et al. 2008).

195194
Spinning Future Threads
Country Crop Impact of climate change on crops and farming* Challenges and new trends in cropping practices**
Vietnam Rice • Sea level rise threatens the low-lying rice cultivating regions in Mekong river basin (United Nations 2015)
• Increased salinity due to salt water intrusion caused by droughts in river floodplains (particularly on tributaries of Mekong river) (Corben 2016)
• Without appropriate interventions rice production could drop by 18% by 2030 (Le 2016)
• Reduction in yield of winter season rice and increase in summer season rice is projected (Deb and Shrestha 2014)
• 1° C increase in temperature would shorten growth cycle of rice by 5-8 days (FAO 2011)
• Potential of increased reproduction of pests such as rice-feeding ear-cutting caterpillars, black cutworms, bark-boring beetles, etc. (FAO 2011)
• Studies indicate that shifting transplantation dates could increase yields by 20-27%
• Awareness programmes through media platforms have been successful in educating and motivating farmers for restoration of rice landscape bio-diversity. Climate smart approaches for sustainable management of rice landscape in Vietnam is also one of the projects under consideration by FAO. (K.L. Heong 2014, Beau Damen 2018)
Pineapple • Salinity intrusion in Mekong river delta due to sea level rise is a major threat to pineapple cultivation in the river basin (Hung and Thoai 2017)
• Breeding and selection of salinity, drought and pest tolerant varieties of trees is being prioritised (Hung and Thoai 2017)
• Range of structural and other methods to reduce damage due to salt water intrusion in Mekong river delta is being undertaken (Hung and Thoai 2017)
Cambodia Rice • Non-climate factors such as fertilizers, water, cultivars and soil fertility cause 40% variation to rice yields whereas climate variability influences the remaining 60% (Dek, Xuan, and Khanh 2017).
• High temperatures have reduced paddy yield and forced farmers to increasingly use fertilizers, some have had to sell lands or live with debt (Yap 2017).
• Increase in temperature reduces the rice yield, a supplementary increase in CO2 levels does not aid in the yield (Phetkham-pheng and Ko 2020).
• Drought and flooding are common in the region which negatively affects the livelihood of farmers, thus forcing them to adapt by using seasonal varieties of rice to increase productivity (Kong et al. 2012).
• Various climate models indicate that Cambodia will be severely affected by climate change, the changes in rice yield under the RCP 8.5 and RCP 4.5 baseline scenarios reduced the GDP by 8.16% and 10.57%, respectively (Kim et al. 2018).
• Increase in pest infestations was one of the major perceptions of smallholder farmers as an impact of climate change, along with greater frequency of droughts and floods (Thangrak et al. 2020).
• Recent study found out that forward shifting planting dates and fertilizer application rates could be used as an effective adaptation strategy to cli-mate variability (Wang et al. 2017).
• Development of irrigation systems and good water management are rec-ommended to improve production (Kea, Li, and Pich 2016).
• Adaptation strategies involving deployment of short duration rice varieties, in conjunction with direct seeding and better N management, indicate com-parable and improved production can be achieved (Poulton et al. 2016).
* No published research found on the impacts of climate change on cultivation of Okra (Pakistan), Coconut (Indonesia) and Pineapple (Indonesia)
** The list is non-exhaustive

197196
Spinning Future Threads
Bibliography and References
2020 Preferred Fiber and Materials Market Report. 2020. Textile Exchange. https://textileexchange.org/wp-content/uploads/2020/06/Textile-Exchange_Preferred-Fiber-Material-Market-Report_2020.pdf
A. Tonapi, Dr. Vilas. 2016. “Best practices for sor-ghum cultivation and importance of value-addition.” ICAR-Indian Institute of Millets Research.
Adhikari, Sushil, Hyungseok Nam, and Jyoti P. Chakraborty. 2018. “Conversion of Solid Wastes to Fuels and Chemicals Through Pyrolysis.” In Waste Biorefinery, Elselvier. pp. 239-263.
Agamuthu, P. 2009. “Challenges and opportunities in agro-waste management: An Asian perspective.” In Inaugural meeting of first regional 3R forum in Asia, pp. 11-12.
AgroBusiness Times . 2018. Imported seeds fast replacing local varieties in Pakistan. 9 October. https://www.agrobusinessngr.com/imported-seeds-fast-replacing-local-variet-ies-in-pakistan/?__cf_chl_captcha_tk__=12c-8c5e8f371a9235fe35c2667f80b35a0736d68-1607585131-0-AUVfwxaKxJDggKcdYLz0jLP79Zyga-KXbQ5EHuBfOy2gRbs51Se5xY4efCj1zuIWqoz9z-rLqe0MgJ4-bPlPvdmdPw.
Ahmad Choudhary, Manzoor; Ashfaq, Sidrah & Ghafoor, A. 2015. “Performance evaluation of sug-arcane stripper for trash recovery”. https://www.researchgate.net/publication/281944068_Perfor-mance_evaluation_of_sugarcane_stripper_for_trash_recovery.
Ahmad, Roman. 2016. “Bagasse based high pressure co-generation in Pakistan”. Ijesi.org. http://www.ijesi.org/papers/Vol(5)3/H0503062067.pdf.
Aldrian, Dr. Edvin, Dr. Takeshi Takama, Alifi Maria Ulfa, Pudji Setyani, Risya Okta, and Mamenun. 2012.
“Vulnerability of Paddy and Maize to Climate Vari-ability in Indonesia and Vulnerability Map of paddy to Climate Change in Bali.” The First International Workshop of Climatic Changes and their Effects on Agriculture in Asian Monsoon Region. Bang-kok: International Agro Informatics Laboratory, The
University of Tokyo. 19. http://www.iai.ga.a.u-tokyo.ac.jp/mizo/grene/WS120303-05/3-3_EdvinAldri-an_120303.pdf.
Altendorf, Sabine. 2017. GLOBAL PROSPECTS FOR MAJOR TROPICAL FRUITS. Rome: FAO. http://www.fao.org/fileadmin/templates/est/COMM_MAR-KETS_MONITORING/Tropical_Fruits/Documents/Tropical_Fruits_Special_Feature.pdf.
Ananda, Rima Restu, and Tri Wododo. 2019. A Gen-eral Assessment of Climate Change - Loss of Agri-cultural Productivity in Indonesia. RePEc (Research Papers in Economics), München: Munich University. https://mpra.ub.uni-muenchen.de/91316/1/MPRA_paper_91316.pdf.
Asad Amin, et al. 2018. “Simulated CSM-CROP-GRO-cotton yield under projected future climate by SimCLIM for southern Punjab, Pakistan.” Sci-ence Direct. November. https://reader.elsevier.com/reader/sd/pii/S0308521X17302615?token=CF2D-CFC01DD89885BDBB3CED13E2A81CFDC5FB3966F-3D98706337E08893B7156165C71F145C9D281E56C-D10C16DC480C.
Ahsan, S., Ali, M. S., Hoque, M. R., Osman, M. S., Rahman, M., Babar, M. J., … Islam, K. R. 2010. Agri-cultural and Environmental Changes in Bangladesh in Response to Global Warming. Climate Change and Food Security in South Asia, 119–134.
Amos, Claudia. “Biomaterials: Fashion’s Future or Passing Fad?”, Antithesis Group, August 15, 2019. anthesisgroup.com/us/biomaterials-fashions-fu-ture-or-passing-fad
Annamalai, S.J.K., Ravindra Naik, D. Jaganathan, and A.C. Mathew. 2017. “By-product Utilization of Coconut, Arecanut and Cocoa Processing.” Product Diversification in Plantation Crops, 149-203.
Ashrafi, R., Saiem, R., Kamruzzaman, M., Mamun, M., & Begum, H. (2020). Utilization of rice straw compost for strawberry and tomato production. Progressive Agriculture, 30(4), 335-343. https://doi.org/10.3329/pa.v30i4.46887
Astari, A.J., and J. C. Lovett. 2019. “Does the rise of transnational governance ‘hollow-out’ the state? Dis-course analysis of the mandatory Indonesian sustain-able palm oil policy.” World Development 117:1-12.
Azhar, B., N. Saadun, M. Prideaux, and D. B. Lin-denmayer. 2017. “The global palm oil sector must change to save biodiversity and improve food secu-rity in the tropics.” Journal of Environmental Man-agement 203 (1):457–466.
Baron, V., A. Rival, and R. Marichal. 2018. “No, palm oil is not responsible for 40% of global deforesta-tion.” The Conversation. https://theconversation.com/no-palm-oil-is-not-responsible-for-40-of-global-deforestation-78482.
Beau Damen, Srijita Dasgupta, Tristan Rousset, Yim Yu. 2018. Rice Landscapes and climate change. Workshop Report, Bangkok: FAO. http://www.fao.org/3/CA3269EN/ca3269en.pdf.
Bhutto, Abdul, Yasin Muhammad, Sadia Karim, and A. A. Bazmi. 2010. “Efficient Utilization of Rice-wheat Straw to Produce Value –added Composite Products.” International Journal of Chemical and Environmental Engineering Vol.1 (No. 2): 136-143.
Bimbraw, Avtar Singh. 2019. “Generation and Impact of Crop Residue and Its Management.” Current Agri-culture Research Journal. doi:10.12944/carj.7.3.05.
Bio-based products, European Committee for Stan-dardization. https://www.cen.eu/work/areas/chemi-cal/biobased/Pages/default.aspx
Biofabricate and Fashion for Good. 2020. “Under-standing ‘Bio’ Material Innovation: a primer for the fashion industry”. https://fashionforgood.com/wp-content/uploads/2020/12/Understand-ing-Bio-Material-Innovations-Report.pdf
Brancato, Adam A. n.d. Effect of progressive recy-cling on cellulose fiber surface properties. 2008th ed. N.p.: Georgia Institute of Technology. https://core.ac.uk/download/pdf/4719527.pdf.
Budidarsono, Suseno, Annelies Zoomers, and Ari Susanti. 2013. “Oil Palm Plantations in Indonesia: The Implications for Migration, Settlement/Reset-tlement and Local Economic Development.” Inte-chOpen.
Budiman, Ibnu. 2020. Indonesia’s new rice culti-vation plan will undermine peatland restoration efforts. 5 June. Accessed December 10, 2020. https://www.eco-business.com/opinion/indo-nesias-new-rice-cultivation-plan-will-under-mine-peatland-restoration-efforts/.
Cahyono, P & Astuti, N & Purwito, & Rahmat, Ali. 2018. Mapping the rainfall distribution for irriga-tion planning in dry season at pineapple plantation, Lampung Province, Indonesia (Study case at Great Giant Pineapple Co. Ltd.). IOP Conference Series: Earth and Environmental Science.
Canopy. 2020. “Hot Button Ranking and Report.” Detailed Matrix of Viscose Producer Performance. https://hotbutton.canopyplanet.org/.
Carlson, K. M., Heilmayr, R., Gibbs, H. K., Noojipady, P., Burns, D. N., Morton, D. C., et al. 2018. Effect of oil palm sustainability certification on deforestation and fire in Indonesia. Proceedings of the National Academy of Sciences of the United States of America, 115(1), 121–126
Casabar, Jennifer T., Yuwalee Unpaprom, and Rameshprabu Ramaraj. 2019. “Fermentation of Pineapple Fruit Peel Wastes for Bioethanol Pro-duction.” Biomass Conversion and Biorefinery. doi:10.1007/s13399-019-00436-y.
Changing Markets Foundation, 2019. “Dirty Fashion Disrupted Leaders And Laggards Revealed.” Chang-ing Markets Foundation. http://changingmarkets.org/wp-content/uploads/2019/11/CM_DIRTY-FASH-ION-DISRUPTED-LEADERS-AND-LAGGARDS-RE-VEALED.pdf
Chunhawong, Kitti, Sombat Khotavivattana, Sarawut Rungmekarat,, and Tanapon Chaisan. 2018. Sugar Industry and Utilization of Its By-products in Thai-land: An Overview.
Chunhawong, Kitti, Sombat Khotavivattana, Sarawut Rungmekarat,, and Tanapon Chaisan. 2018. Sugar Industry and Utilization of Its By-products in Thai-land: An Overview.
CIAT; World Bank. 2017. Climate-Smart Agricul-ture in Bangladesh. CSA Country Profiles for Asia Series, Washington, D.C.: International Center for Tropical Agriculture (CIAT); World Bank. https://cli-
199198
Spinning Future Threads
mateknowledgeportal.worldbank.org/sites/default/files/2019-06/CSA-in-Bangladesh.pdf.
CIAT; World Bank. 2017. Climate-Smart Agricul-ture in Pakistan. CSA Country Profiles for Asia Series, Washington, D.C.: International Center for Tropical Agriculture (CIAT); World Bank. https://cli-mateknowledgeportal.worldbank.org/sites/default/files/2019-06/CSA-in-Pakistan.pdf.
Cohen, Stephen P, and Jan E Leach. 2020. High temperature-induced plant disease susceptibility: more than the sum of its parts. August. Accessed December 10, 2020. https://www.sciencedirect.com/science/article/pii/S1369526620300285.
Corben, Ron. 2016. Vietnam Rice Industry Faces Threat From Climate Change, Mekong Dams. 1 November. Accessed December 10, 2020. https://www.voanews.com/east-asia-pacific/vietnam-rice-industry-faces-threat-climate-change-mekong-dams.
Cruz, Catalino dela. 2001. Rice-fish systems in Indo-nesia. Accessed November 24, 2020. http://www.fao.org/3/Y1187E/y1187e19.htm.
Dasgupta, Susmita, Md. Moqbul Hossain, Mainul Huq, and David Wheeler. 2017. Cli-mate Change, Salinization and High-Yield Rice Production in Coastal Bangladesh. 23 Novem-ber. https://www.cambridge.org/core/journals/agricultural-and-resource-economics-review/article/climate-change-salinization-and-high-yield-rice-production-in-coastal-bangladesh/D118AAC97F779EB26F97DE207A5803CE.
David Eckstein, Marie-Lena Hutfils, and Maik Wing-es. 2018. Global Climate Risk Index 2019. Bonn: Germanwatch.https://www.germanwatch.org/sites/germanwatch.org/files/Global%20Climate%20Risk%20Index%202019_2.pdf.
Deb, Proloy, and Sangam Shrestha. 2014. Adapta-tion Strategies for Rice Cultivation Under Climate Change in Central Vietnam. April. https://www.researchgate.net/publication/263860475_Adapta-tion_Strategies_for_Rice_Cultivation_Under_Cli-mate_Change_in_Central_Vietnam.
Dek, Vimean Pheakdey & Dang Xuan, Tran & Khanh, Tran. 2017. Influence of Climate Factors on Rice
Yields in Cambodia. AIMS Geosciences. 3:561-575.
Devedee, Anoop, Ritesh Parihar, and Institute of Agricultural Sciences, Banaras Hindu University. 2018. “Agricultural Waste / Stubble Management (Waste to Wealth), Alternative to Burning.” AGRI-CULTURE WASTE MANAGEMENT XVI (10): 43-45.
Devi, Saroj, Charu Gupta, Shankar Lal Jat, and M. S. Parmar. 2017. “Crop Residue Recycling for Economic and Environmental Sustainability: The Case of India.” Open Agriculture. doi:10.1515/opag-2017-0053.
Dharmawan, Arya Hadi, Dyah Ita Mardiyaningsih, Heru Komarudin, Jaboury Ghazoul, Pablo Pache-co, and Faris Rahmadian. 2020. “Dynamics of Rural Economy: A Socio-Economic Understanding of Oil Palm Expansion and Landscape Changes in East Kalimantan, Indonesia.” Land 9, no. 7. https://doi.org/10.3390/land9070213.
Diep, Nhu Quynh, Shinji Fujimoto, Tomoaki Minowa, Kinya Sakanishi, and Nobukazu Nakagoshi. 2012.
“Estimation of the Potential of Rice Straw for Eth-anol Production and the Optimum Facility Size for Different Regions in Vietnam.” Applied Energy. doi:10.1016/j.apenergy.2011.12.074.
doi: 10.4209/aaqr.2013.01.0031
Dunne, R, Desai, D, Sadiku, R et al.2016. A review of natural fibres, their sustainability and automo-tive applications. Journal of Reinforced Plastics and Composites, 35: 1041–1050
Ellen MacArthur Foundation. 2017. “A new textiles economy: Redesigning fashion’s future”. https://www.ellenmacarthurfoundation.org/assets/down-loads/publications/A-New-Textiles-Economy_Full-Report.pdf
European Environment Agency. 2020. Soil and cli-mate change. 23 November. https://www.eea.europa.eu/signals/signals-2015/articles/soil-and-cli-mate-change#:~:text=Climate%20change%20puts%20soil%20under%20pressure&text=If%20such%20areas%20dry%20out,and%20changes%20in%20precipitation%20patterns.
FAO Asia Pacific Sugar Conference. 1997 a. “Theo-retical Outlook, Framework Analysis and Background Documentation - Pakistan.” http://www.fao.org/3/
X0513E/x0513e00.htm.
FAO Asia Pacific Sugar Conference. 1997b. “Theo-retical Outlook, Framework Analysis and Background Documentation - Thailand.” http://www.fao.org/3/X0513E/x0513e24.htm.
FAO Asia Pacific Sugar Conference. 1997c. “Theo-retical Outlook, Framework Analysis and Background Documentation - India.” http://www.fao.org/3/y4347e/y4347e0d.htm.
FAO. 2011. Climate Change Impacts on Agricul-ture in Vietnam. Hanoi: FAO. http://www.fao.org/climatechange/34068-0d42acdf5fb7c4d80f-3013c038ab92ce6.pdf.
FAO. 2020. “World Food and Agriculture - Statistical Yearbook 2020.” Rome.
https://doi.org/10.4060/cb1329en
Fashion For Good. 2020. “Coming Full Circle: Inno-vating Towards Sustainable Man-Made Cellulosic Fibres”. https://fashionforgood.com/wp-content/uploads/2020/09/Coming-Full-Circle-Innovat-ing-Towards-More-Sustainable-MMCFs.pdf
Fashion For Good and Boston Consulting Group. 2020. “Financing the Transformation in the Fash-ion Industry: Unlocking Investment to Scale Inno-vation” https://fashionforgood.com/wp-content/uploads/2020/01/FinancingTheTransformation_Report_FINAL_Digital-1.pdf
Fones, Dr. Helen. 2020. Guest post: How climate change could accelerate the threat of crop diseases. 8 June. https://www.carbonbrief.org/guest-post-how-climate-change-could-accelerate-the-threat-of-crop-diseases#:~:text=Many%20of%20these%20crops%20are,which%20are%20emerg-ing%20fungal%20diseases.
Gheewala, Shabbir H., Thapat Silalertruksa, Patcharaporn Pongpat, and Sébastien Bonnet. 2019.
“Biofuel Production from Sugarcane in Thailand.” In Sugarcane Biofuels. doi:10.1007/978-3-030-18597-8_8.
Good Agricultural Practices for Sugarcane (GAP). 2010. National Bureau of Agricultural Commodi-ty and Food Standards Ministry of Agriculture and
Cooperatives. https://www.acfs.go.th.
Grant, Amy. 2019. “Edible Okra Leaves – Can You Eat The Leaves Of Okra.” Gardeningknowhow.Com. https://www.gardeningknowhow.com/edible/vegeta-bles/okra/can-you-eat-leaves-of-okra.htm#:~:tex-t=The flavor of the leaves,%2C calcium%2C protein and iron.
Grimble, Robin, and Kate Wellard. 1997. “Stakehold-er methodologies in natural resource management: a review of principles, contexts, experiences and opportunities.” Agricultural systems 55(2):173-193.
Hakim, M. A., Hossain, A., Silva, J. A. T. da, Zvolinsky, V. P., & Khan, M. M. 2012. Protein and Starch Con-tent of 20 Wheat (Triticum aestivum L.) Genotypes Exposed to High Temperature Under Late Sowing Conditions. Journal of Scientific Research, 4(2), 477.
Harmsen, P. F. H., S. J. J. Lips, and R. R. C. Bakker. 2013. “Pretreatment of lignocellulose for biotech-nological production of lactic acid”. No. 1384, pub-lic version. Wageningen UR-Food and Biobased Research.
Harmsen, P.F., M.M. Hackmann, and H.L. Bos. 2014. “Green building blocks for bio‐based plastics” Biofuels,
Bioproducts and Biorefining 8(3): p. 306-324.
Harmsen, P.F.H. and H.L. Bos. 2020. Textile for circular fashion. Part 1: Fibre resources and recycling options. Groene Grondstoffen. Wageningen: Wagen-ingen University & Research.
Hazarika, Dipshika, Nabaneeta Gogoi, Seiko Jose, Robin Das, and Gautam Basu. 2017. “Exploration of Future Prospects of Indian Pineapple Leaf, an Agro Waste for Textile Application.” Journal of Cleaner Production. doi:10.1016/j.jclepro.2016.09.092.
Hecht, Dr. Joy E. 2016. Indonesia: Cost of climate change 2050. Washington D.C.: United States Agen-cy for International Development; Climate Change Adaptation Thought Leadership, and Assessments (ATLAS). https://www.climatelinks.org/sites/default/files/asset/document/Indonesia%20Costs%20of%20CC%202050%20Policy%20Brief.pdf.
Hoornweg, Daniel; and Perinaz Bhada-Tata. 2012. “What a Waste: A Global Review of Solid Waste Man-
agement.” Urban development series; knowledge

201200
Spinning Future Threads
papers no. 15. World Bank. https://openknowledge.worldbank.org/handle/10986/17388
Hossain, Emran. 2019. Bangladesh invaded by invasive alien pests, plant diseases. 9 April. https://www.newagebd.net/article/69551/bangladesh-in-vaded-by-invasive-alien-pests-plant-diseases-#:~:text=The%20first%20ever%20research%20quantifying,2018%20by%20US%2Dbased%20sci-entists.&text=First%20detected%20in%20Novem-ber%20last,the%20corn%20crop%2C%20h.
Hossain, Farid. 2016. World pineapple production: An overview. African Journal of Food, Agriculture, Nutri-tion and Development. School of Agriculture and Rural Development, Bangladesh.16:11443-11456.
Huijnen, V., Martin J. Wooster, Johannes W. Kaiser, David LA Gaveau, Johannes Flemming, Mark Par-rington, Antje Inness, Daniel Murdiyarso, B. Main, and M. Van Weele. 2016. “Fire carbon emissions over maritime southeast Asia in 2015 largest since 1997.” Scientific reports 6, 26886. https://doi.org/10.1038/srep26886
Hung, Nguyen Quoc, and Vo Huu Thoai. 2017. ENSURING A SUSTAINABLE TROPICAL FRUIT INDUS-TRY IN THE MIDST OF CLIMATE CHANGE: THE VIETNAM STORY. Fiji: International Symposium on Tropical Fruits. ENSURING A SUSTAINABLE TROPICAL FRUIT INDUSTRY IN THE MIDST OF.
ICRISAT. 2016. SCALING UP CLIMATE SMART AGRICULTURE FOR TELANGANA, INDIA. 16 December. https://www.icrisat.org/scaling-up-cli-mate-smart-agriculture-for-telangana-india/.
INDONESIA: Rice Production Prospects Reduced by El Nino. 2016. International Production Assessment Division (IPAD). https://ipad.fas.usda.gov/.
Jain*, Niveta; Bhatia, Arti; Pathak Himanshu (2014). Emission of Air Pollutants from Crop Residue Burn-ing in India. Aerosol and Air Quality Research, 14: 422–430, 2014. ISSN: 1680-8584 print / 2071-1409 online
Jain, N., Bhatia, A., and Pathak, H. 2014. Emission of air pollutants from crop residue burning in India. Aerosol and Air Quality Research, 14:422–430.
Jawerth, Nicole. 2017. Bangladesh Triples Rice
Production with Help of Nuclear Science. 3 March. https://www.iaea.org/newscenter/news/bangla-desh-triples-rice-production-with-help-of-nucle-ar-science.
Jitendra, Shreeshan Venkatesh, Ishan Kukreti, Kun-dan Pandey, Deepanwita Gita Niyogi, and Polash Mukerjee. “India’s burning issue of crop burning takes a new turn”. Down to Earth. June 02, 2017. https://www.downtoearth.org.in/coverage/india/riv-er-of-fire-57924
K.L. Heong, M.M. Escalada, H.V. Chien, L.Q. Cuong, Gaëll Mainguy. 2014. Restoration of rice landscape biodiversity by farmers in Vietnam through educa-tion and motivation using media. https://journals.openedition.org/sapiens/1578.
Khan, Rina S. 2020. Record Locust Swarms Hint at What’s to Come with Climate Change. 14 July. https://eos.org/articles/record-locust-swarms-hint-at-whats-to-come-with-climate-change#:~:-text=Warming%20oceans%20that%20feed%20cyclones,more%20widespread%20with%20clima-te%20change.&text=This%20year’s%20locust%20attacks%2C%20which,in%20the%20past%2030%20.
Khokhar, Khalid. 2015. Prospects of growing okra in Pakistan, current national problems and future strategies. 10.13140/RG.2.1.1875.7603.
Kishore, Avinash, Barun PalBarun, PalKuhu Joshi, Kuhu Joshi, P.K. Aggarwal, and P.K. Aggarw-al. 2018. Unfolding government policies towards the development of climate smart agriculture in India. January. https://www.researchgate.net/publication/329419715_Unfolding_government_policies_towards_the_development_of_climate_smart_agriculture_in_India.
Kleigh, Ulrich, Ravi S Bala, B Dayakar Rao, and B Yoganand. 2018. “Industrial Utilization of Sorghum in India.” International Crops Research Institute for the Semi-Arid Tropics.
Koopmans, Auke, and Jaap Koppejan. 1997. “Agri-cultural and forest residues-generation, utilization and availability.” Regional consultation on modern applications of biomass energy 6 (1997): 10.
Kumar, Anil & Choudhary, Anil. 2014. Scientific cul-
tivation of Okra: 45-51.
Kumar, Ipsita, Varaprasad Bandaru, Sukunya Yam-pracha, Laixiang Sun, and Bundit Fungtammasan. 2020. “Limiting Rice and Sugarcane Residue Burn-ing in Thailand: Current Status, Challenges and Strategies.” Journal of Environmental Management. doi:10.1016/j.jenvman.2020.111228.
Kumar, Sumit; Kumar, Harish; Kumar, Ravi (2017). Analysis for Possibilities of Energy Resources from Sugarcane Trash. International Journal of Engineer-ing Research & Technology (IJERT). Vol. 6 Issue 04, April-2017. http://www.ijert.org ISSN: 2278-0181. IJERTV6IS040228
Kumara, Ipsita, Varaprasad Bandarua, Sukunya Yam-prachab, Laixiang Suna, and Bundit Fungtammasanc. 2020. Limiting rice and sugarcane residue burning in Thailand: Current status, challenges and strategies. 24 January. https://www.sciencedirect.com/science/article/pii/S030147972031152X.
Kunimitsu, Yoji, and Tatsuki Ueda. n.d. “Economic and environmental effects of rice-straw bioethanol production in Vietnam.” Paddy and Water Environ-ment 11:411-421.
Le, Trang T. H. 2016. Effects of climate change on rice yield and rice market in Vietnam. 21 November. https://www.cambridge.org/core/journals/jour-nal-of-agricultural-and-applied-economics/article/effects-of-climate-change-on-rice-yield-and-rice
-market-in-vietnam/29B07620084D3B8F262C2B-0C428CA096#:~:text=We%20evaluate%20the%20effects%20of,to%20the%201980%E2.
Lewis, Megan, and Bertram Ostendorf. 2017. Under-standing the Spatially Variable Effects of Climate Change on Rice Yield for Three Ecotypes in Bangla-desh, 1981–2010. 8 October. https://www.hindawi.com/journals/aag/2017/6287156/.
Luu T.P., Do N.H.N., Chau N.D.Q., Lai D.Q., Nguyen S.T., Le D.K., Thai Q.B., Le P.T.K., Duong H.M. 2020
“Morphology Control and Advanced Properties of Bio-Aerogels from Pineapple Leaf Waste.” Chemical Engineering Transactions, 78:433-438.
M, Yogesh, and Hari Rao A.N. 2015. “Study on Pine-apple Leaves Fibre and its Polymer based Compos-ite.” International Journal of Science and Research
(IJSR) 6 (1): 799-807.
Manik, Tumiar Katarina, Purba Sanjaya, Onny Chrisna Pandu Perdana, and Dudy Arfian. 2019.
“Investigating Local Climatic Factors That Affected Pineapple Production, in Lampung Indonesia.” Inter-national Journal of Environment, Agriculture and Biotechnology. doi:10.22161/ijeab.45.8.
Matana, Y., Miftahorrachman, M R Romadhon, and M. Nur. 2020. “Stability of fruit and bunch of mapanget tall and Indonesia coconut hybrid with several planting distance using AMMI model and GGE biplot analysis.” IOP Conference Series: Earth and Environmental Science 418.
Mather, R.R., and R.H. Wardman. 2015. “The chem-istry of textile fibres”. Royal Society of Chemistry.
Matthews, Gregory, and Muzafar Hussain. 2015. “Pre-Crisis Market Mapping and Analysis: The
wheat straw market system in the context of severe flooding ‘Badin, Ghotki and Sanghar Districts, Sindh Province, Pakistan.’” ALNAP.
Md Abiar Rahman, SuChul Kang, Nidhi Nagabhatla, Robert Macnee. 2017. Agriculture and Food Security. 21 April. https://agricultureandfoodsecurity.biomed-central.com/articles/10.1186/s40066-017-0089-5.
Ministry of Agriculture & Farmers Welfare, GOI. 2016. “Department of Agriculture.” Directorate of Millets
Development. http://millets.dacfw.nic.in/POP%20Sorghum.html.
Ministry of Foreign Affairs of the Netherlands. 2018. Climate Change Profile Indonesia. The Hague: Minis-try of Foreign Affairs of the Netherlands. https://reliefweb.int/sites/reliefweb.int/files/resources/Indo-nesia_2.pdf.
Mohammad Jawaid; Mohammad Asim; Paridah Tahir; Mohammed Nasir. 2020, Pineapple leaf fibers : processing, properties and applications, Singapore, Springer
Monfreda, C., N. Ramankutty, and J. A. Foley. 2008. Farming the planet: 2. Geograph-ic distribution of crop areas, yields, physiologi-cal types, and net primary production in the year 2000, Global Biogeochem. Cycles, 22, GB1022, doi:10.1029/2007GB002947.

203202
Spinning Future Threads
Mubeen, Umarah, and Tehmina Khan. 2012. “Wheat Straw: A pragmatic overview.” Current Research Journal of Biological Sciences 6:673−675.
Muhammad Mohsin Iqbal, M. Arif Goheer, A.M. Khan. 2009. Climate-Change Aspersion on Food Security of Pakistan. January. https://www.researchgate.net/publication/304533898_Climate-Change_Asper-sion_on_Food_Security_of_Pakistan.
Munir, Ahmad, Nawaz Muhammad, Iqbal Muham-mad, and Javed Sajid. 2016. “Analysing the Impact of Climate Change on Rice Productivity in Pakistan.” Pakistan Institute of Development Economics (PIDE). https://mpra.ub.uni-muenchen.de/72861/.
Murray, T.D., and G.W. Bruehl. 1983. “Composition of wheat straw infested with Cephalosporium gramine-um and implications for its decomposition in soil.” Phytopathology 73 (7): 1046-1048.
Nagendran, R. 2011. “Agricultural waste and pollu-tion.” In Waste, pp. 341-355. Academic Press.
Nair Anand, Shilpa. 2019. “The Alchemy of Pineapple Waste.” The Hindu, February. https://www.thehindu.com/life-and-style/agro-residue-from-pineap-ple-poses-a-challenge-in-kerala-biotechnolo-gist-sajesh-pk-extracts-bromelain-from-pineap-ple-waste/article26339436.ece.
Nguyen, H.V., C.D. Nguyen, T.V. Tran, Hoa. D. Hau, N.T. Nguyen, and M. , Gummert. 2016. “Energy effi-ciency, greenhouse gas emissions, and cost of rice straw collection in the mekong river delta of viet-nam.” Field Crops Research 198:16-22.
Nguyen, V.N., and D.V. Tran. 2002. “Rice in pro-ducing countries- Thailand.” FAO Rice Information. http://www.fao.org/3/y4347e/y4347e00.htm#Con-tents.
Ninh, Nguyen Tam, Felicitas Roehrig, Godefroy Grosjean, Tran Dai Nghia, and Vu Thi Mai. 2017. Climate-Smart Agriculture in Vietnam. CSA Country, Hanoi: International Center for Tropical Agricul-ture (CIAT); The Food and Agriculture Organization. https://climateknowledgeportal.worldbank.org/sites/default/files/2019-06/CSA_Profile_Vietnam2.2.pdf.
Nolan, Anthony and Mcdonnell, Kevin & Devlin, Ger & Carroll, John & Finnan, John. 2010. Economic
Analysis of Manufacturing Costs of Pellet Production in the Republic of Ireland Using Non-Woody Bio-mass. The Open Renewable Energy Journal, 3.
Obi, F. O., B. O. Ugwuishiwu, and J. N. Nwakaire. 2016. “Agricultural waste concept, generation, utilization and management.” Nigerian Journal of Technology 35, no. 4. pp. 957-964.
Olsson, Carina, and Gunnar Westman. 2013. “Direct dissolution of cellulose: background, means and applications.” Cellulose-fundamental aspects 10: 52144.
OECD. 2011. https://stats.oecd.org/glossary/detail.asp?ID=77
OECD/FAO (2020), “Cotton”, in OECD-FAO Agri-cultural Outlook 2020-2029, OECD Publishing, Paris, https://doi.org/10.1787/630a9f76-en. https://read.oecd-ilibrary.org/agriculture-and-food/oecd-fao-agricultural-outlook-2020-2029_630a9f76-en#page1
Pakistan Agriculture Research Council (PARC). 2019. PARC Annual Report 2018-19. Islamabad: PARC. http://mnfsr.gov.pk/userfiles1/file/YearBook2017-18.pdf.
Pandiselvam, R., M. R. Manikantan, Anjineyulu Kothakota, G. K. Rajesh, Shameena Beegum, S. V. Ramesh, V. Niral, and K. B. Hebbar. 2020. “Engi-neering Properties of Five Varieties of Coconuts (Cocos Nucifera L.) for Efficient Husk Separation.” Journal of Natural Fibers. doi:10.1080/15440478.2018.1507863.
Panthapulakkal, S., and M. Sain. 2015. “The use of wheat straw fibres as reinforcements in composites.” In Biofiber reinforcements in composite materials, pp. 423-453. Woodhead Publishing.
Papademetriou, Minas K., Frank J. Dent, and Edward M. Herath. 2000. Bridging the Rice Yield Gap in the Asia-Pacific Region. N.p.: FAO/RAP Publication.
Parihar, C.M., D.K. Singh., S. L. Jat, Chikkappa G.K., and K.S. , Hooda. 2011. “Maize Production Technolo-gies in India.” Directorate of Maize Research (Indian Council of Agricultural Research).
Phitthayaphinant1, Purawich, Theera Eksomtramage,
Buncha Somboonsuke1, and Ayut Nissapa. 2012. “An Equation of Oil Palm Plantation Areas in Thailand.” Prince of Songkla University, Thailand. resjournal.kku.ac.th.
Phongpan, S., and A. R. Mosier. 2003. “Effect of Crop Residue Management on Nitrogen Dynam-ics and Balance in a Lowland Rice Cropping System.” Nutrient Cycling in Agroecosystems. doi:10.1023/A:1023915015259.
Portia Adade Williams, Olivier Crespo, George Owusu Essegbey. 2017. “Economic Implications of a Chang-ing Climate on Smallholder.” Journal of Economics and Sustainable Development 1-10. https://core.ac.uk/download/pdf/234647998.pdf.
Poulton, P. L., N. P. Dalgliesh, S. Vang, and C. H. Roth. 2016. “Resilience of Cambodian Lowland Rice Farming Systems to Future Climate Uncertainty.” Field Crops Research. doi:10.1016/j.fcr.2016.09.008.
Pulse of the Fashion Industry. 2017. Global Fashion Agenda and Boston Consulting Group.
Pulse of the Fashion Industry. 2019. Global Fashion Agenda, Boston Consulting Group and Sustainable Apparel Coalition. https://image-src.bcg.com/Imag-es/Pulse-of-the-Fashion-Industry2019_tcm9-237791.pdf
Qureshi, M. A., and Shahid Afghan. 2005. “Sug-arcane cultivation in Pakistan.” Shakarganj Sugar Research Institute, Jhang.
R. Russell M. Paterson, Lalit Kumar, Subhashni Tay-lor, Nelson Lima. 2015. “Future climate effects on suitability for growth of oil palms in Malaysia and Indonesia.” Scientific reports. 24 September. https://www.nature.com/articles/srep14457.
Rame, and Center of Industrial Pollution Prevention Technology, Semarang - Indonesia. 2018. “Oil Palm Empty Fruit Bunches (OPEFB): Existing Utilization and Current Trends Bio Refinery in Indonesia.” E3S Web of Conferences 31 (03014). EDP Sciences, 2018.
Raymundo, Rubí, Senthold Asseng, Richard Rob-ertson, Athanasios Petsakos, Gerrit Hoogenboom, Roberto Quiroz, Guy Hareau, and Joost Wolf. 2018.
“Climate change impact on global potato production.” European Journal of Agronomy: 100.
Reed, Mark S., et al. “Who’s in and why? A typology of stakeholder analysis methods for natural resource management.” Journal of environmental manage-ment 90.5 (2009): 1933-1949.
Rehana Siddiqui, Ghulam Samad, Muhammad Nasir, Hafiz Hanzla Jalil. 2015. “The Impact of Climate Change on Major Agricultural Crops: Evidence from Punjab, Pakistan.” Pakistan Instittue of Develop-ment Economics. 14 December. https://www.pide.org.pk/psde/pdf/AGM28/Rehana%20Siddiqui%20Ghulam%20Samad%20Muhammad%20Nasir%20and%20Hafiz%20Hanzla%20Jalil.pdf.
Rengel, Angela. 2017. “Recycled Textile Fibres and Textile Recycling: An Overview of the Market and Its Possibilities.” Federal Office for the Environment, Bern, Switzerland.
Resilience Alliance. n.d. Resilience of a cultural land-scape: Rice terraces of Bali, Indonesia. https://www.resalliance.org/assessment-projects/3.
Reuters. 2019. Climate Damage to Pakistan’s Cotton Crop Ripples Through Economy. 19 Decem-ber. https://www.irrawaddy.com/news/asia/climate-damage-pakistans-cotton-crop-rip-ples-economy.html.
Rice Rebounds - Grain and Feed Annual 2019. 2019. Global Agricultural Information Network (GAIN). http://agriexchange.apeda.gov.in/MarketReport/Reports/Rice_Rebounds_Grain_and_Feed_Annu-al_2019_Colombo_Sri_Lanka_9-16-2019.pdf.
Riga, Anggarendra, Riga, Guritno Cometta, and Singh Mrinila. 2016. “Use of Climate Information for Rice Farming in Indonesia.” Climate Change Policies and Challenges in Indonesia, 295-304.
Rondhi, Mohammad, Ahmad Fatikhul Khasan, Yasuhiro Mori, and Takumi Kondo. 2019. Assessing the Role of the Perceived Impact of Climate Change on National Adaptation Policy: The Case of Rice Farming in Indonesia. 10 May. https://www.mdpi.com/2073-445X/8/5/81/htm.
S, Kalpana & Shivashankar, S. & Nachane, & Kalpa-na,. 2006. Composition and Properties of Fibre Extracted from Pseudostem of Banana (Musa Sp.). Journal of Horticultural Sciences. 1. 95 - 96.

205204
Spinning Future Threads
S Marasini, Toyanath Joshi, Lp Amgain. 2018. Direct seeded rice cultivation method: a new technology for climate change and food security. May. https://www.researchgate.net/publication/324993311_Direct_seeded_rice_cultivation_method_a_new_technol-ogy_for_climate_change_and_food_security.
Samaddar Arindam; Mohibbe Azam, Mohammed; Singaravadivel, Kunjithapatham; Venkatachalapathy, Natarajan; Bandhu Swain, Braja; Mishra Purnanan-da (2017). Postharvest Management and
Samant, Indrajeet A., and D. K. Gaikwad. 2020. “Optimization of Natural Dye Extraction from Coco-
nut Husk.” Journal of Experimental Biology and Agricultural Sciences. doi:10.18006/2020.8(1).54.62.
Sarker LR, Khan MRI, Rahman MM (2018) Ensiling of Wet Rice Straw using Biogas Slurry and Molasses in Monsoon of Bangladesh. Crit Care Obst&Gyne. Vol.2 No.1:2.
Sawaengsak, Wanchat, and Shabbir H. Gheewa-la. 2017. “Analysis of Social and Socio-Economic Impacts of Sugarcane Production: A Case Study in Nakhon Ratchasima Province of Thailand.” Jour-nal of Cleaner Production. doi:10.1016/j.jcle-pro.2016.08.148.
Shelley I, Takahashi-Nosaka M, Kano-Nakata M, Haque M, Inukai Y. 2016. Rice cultivation in Ban-gladesh: present scenario, problems, and prospects. Journal of International Cooperation for Agricultural Development. 14:20–29
Siddique, Abu Bakar. 2016. New rice cultivation method that uses less water sows hope in Ban-gladesh. 16 July. https://scroll.in/article/811794/new-rice-cultivation-method-that-uses-less-water-sows-hope-in-bangladesh#:~:text=A%20new%20method,by%20the%20traditional%20clay%20method.
Simpala MM, Kusuma A. 2015 Save the tree of life: Potensi sektor kelapa Indonesia (The potential of the Indonesian coconut sector). Bogor: Bypass, 29–50.
Snijder, M. H. B. et al. 2006. “Coir based building and packaging materials : final report of project CFC/FIGHF/11.”
Srivastava, Manjesh, and Vikas Kumar. 2018. “The Methods of Using Low Cost Housing Techniques in India.” Journal of Building Engineering. doi:10.1016/j.jobe.2017.11.001.
SRI International Network and Resources Center (SRI-Rice) . 2015. Bangladesh. http://sri.ciifad.cor-nell.edu/countries/bangladesh/index.html.
Suma R, Savitha CM. 2015. Integrated Sugarcane Trash Management: A Novel Technology for Sus-taining Soil Health and Sugarcane Yield. Adv Crop Sci Tech, 3(1):160
Suresh, Kancherla. 2013. Adaptation and Miti-gation Strategies for Climate-Resilient Oil Palm. December. https://www.researchgate.net/publi-cation/286225151_Adaptation_and_Mitigation_Strategies_for_Climate-Resilient_Oil_Palm.
“Sustainable Agriculture: Cotton”. WWF, https://www.worldwildlife.org/industries/cotton
Swastika, Dewa & Kasim, Firdaus & Sudana, Wayan & Hendayana, Rachmat & Suhariyanto, Kecuk & Gerpacio, Roberta & Pingali, Prabhu. 2004. Maize in Indone-sia: Production Systems, Constraints, and Research Priorities, CIMMYT: International Maize and Wheat Improvement Center.
Talpur, Dr. Muhammad Ali, Hafeezullah, Abdul Samad Sheikh, and Samiera Amin. 2018. Year Book 2017-18. Islamabad: Ministry of National Food Secu-rity and Research, Government of Pakistan. http://mnfsr.gov.pk/userfiles1/file/YearBook2017-18.pdf.
Textile Exchange, 2020. “Preferred Fiber & Materials Market Report 2020.” [online] Textile Exchange, p.5. Available at: <https://textileexchange.org/wp-con-tent/uploads/2020/06/Textile-Exchange_Pre-ferred-Fiber-Material-Market-Report_2020.pdf> [Accessed 11 December 2020].
Textile Exchange. 2019. “Preferred Fiber and Materi-als Market Report 2019”, Textile Exchange.
Textiles: Material-Specific Data | US EPA. 2021. US EPA. https://www.epa.gov/facts-and-figures-about-materials-waste-and-recycling/textiles-ma-terial-specific-data.
The European Market Potential For Recycled Fashion. 2021. CBI | Ministry of Foreign Affairs. https://www.cbi.eu/market-information/apparel/recycled-fashion/market-potential.
The State of Fashion. 2020. The Business of Fashion and McKinsey & Co.
Tivet, Florent, Stéphane Boulakia, and Agroecology and Sustainable Intensification of Annual Crop. 2017.
“Climate smart rice cropping systems in Vietnam.” CIRAD Research Unit AIDA.
Trach, Nguyen X. 1998. “The need for improved utilisation of rice straw as feed for ruminants in Vietnam: An overview.” The Food and Agriculture Organization (FAO). http://www.fao.org/ag/aga/agap/frg/lrrd/lrrd10/2/trach102.htm.
2019. The World Bank. 23 September. https://www.worldbank.org/en/news/feature/2019/09/23/cos-to-moda-medio-ambiente.
U.S. Department of State. 2020. Trafficking in Humans Report. 20th Edition. June 2020. https://www.state.gov/wp-content/uploads/2020/06/2020-TIP-Re-port-Complete-062420-FINAL.pdf
UNESCO. 2012. Twenty-six new sites inscribed on UNESCO World Heritage List this year. 2 July. https://whc.unesco.org/en/news/903/.
United Nations. 1997. “Glossary of environment statistics.”
United Nations. 2015. Vietnam: Climate change threatens rice production. 16 January. https://www.un.org/sustainabledevelopment/blog/2015/01/viet-nam-climate-change-threatens-rice-production/.
Usman Shakoor, Abdul Saboor. 2015. CLIMATE VARIABILITY IMPACTS ON RICE CROP PRODUCTION IN PAKISTAN. March. https://www.researchgate.net/publication/323945924_CLIMATE_VARIABILI-TY_IMPACTS_ON_RICE_CROP_PRODUCTION_IN_PAKISTAN.
UNOG, UNECE/FAO Forests and Timber Section, and Cittadellarte - Fondazione Pistoletto. 2017. Forests for Fashion - Fashion for Forests. https://unece.org/fileadmin/DAM/timber/docs/publications-other/For-estforFashion-Booklet2017.pdf.
Valley Irrigation Pakistan (Private) Limited and Ghulam N. Arain. n.d. “Sugarcane Cultivate in Pakistan.” http://www.valleyirrigationpakistan.com/wp-content/uploads/2012/09/Sugar-cane-Cultiva-tion-in-Pakistan.pdf.
Value Addition of Rice and Its By-Products. In: Mohanty, P. Samarendu; Mruthunjaya Hedge, Chengappa,J.K.; Ladha, Baruah, Sampriti; Elum-alai Kannan, A. V. Manjunatha (eds.) (2017). The Future Rice Strategy for India 1st Edition. ISBN: 9780128139363
Vasugi, S.Amsamani and R.Sunitha. 2019. “Extraction and Evaluation of OKRA Fibres” SSRG
International Journal of Polymer and Textile Engi-neering 6.1 pp. 24-30.
Vibol, S., and S. Towprayoon. 2009. Estimation of methane and nitrous oxide emissions from rice field with rice straw management in Cambodia. 4 March. https://link.springer.com/article/10.1007/s10661-009-0747-6.
Visvanathan, C. & Chiemchaisri, Chart. 2004. “Man-agement of Agricultural Wastes and Residues in Thailand: Wastes to Energy Approach”. Faculty.ait.ac.th. http://faculty.ait.ac.th/visu/wp-content/uploads/sites/7/2019/01/Agri-waste2energy-Thai.pdf.
—. 2020. Climate Smart Irrigated Agriculture Project. https://projects.worldbank.org/en/projects-opera-tions/project-detail/P163742.
Wada, H., 2005. Managing sandy soils in Northeast Thailand. In Proceedings of Conference on Manage-ment of Tropical Sandy Soils for Sustainable Agricul-ture, Khon Kaen, Thailand.
White, P. F., Oberthur, T., and Pheav, S., 1997. Soils Used for Rice Production in Cambodia: A Manual for their Recognition and Management. Manila: Inter-national Rice Research Institute.
“Why Source Sustainable Cotton?”. CottonUP, http://cottonupguide.org/why-source-sustainable-cotton/challenges-for-cotton/#1518784832966-88da-d5a9-3507.
Wigenasantana, M.S., and T. Waluyo. 1988. “Prospects of Nature Farming for Rice Production in Indonesia.”

207206
Spinning Future Threads
International Nature Farming Research Center. https://www.infrc.or.jp/knf/PDF%20KNF%20Conf%20Data/C1-3-004.pdf.
Wolter Elbersen and Edwin Keijsers. 2019. Alternatives to straw burning in Punjab and Haryana, India.
World Bank. 2019. Climate Smart Agriculture Invest-ment Plans: Bringing CSA to Life. 4 December. https://www.worldbank.org/en/topic/agriculture/publication/climate-smart-agriculture-investment-plans-bring-ing-climate-smart-agriculture-to-life.
World Bank; CIAT. 2015. Climate-Smart Agricul-ture in Sri Lanka. CSA country profiles for Africa, Asia, and Latin America and the Caribbean series, Washington D.C.: The World Bank Group. https://climateknowledgeportal.worldbank.org/sites/default/files/2019-06/CSA%20in%20Sri%20Lanka.pdf.
World Bioenergy Association. 2020. “Global Bioen-ergy Statistics 2020.” https://worldbioenergy.org/uploads/201210%20WBA%20GBS%202020.pdf
You, L., S. Wood, U. Wood-Sichra, W. Wu. 2014. Gen-erating global crop distribution maps: From census to grid. Agricultural Systems 127. pp. 53–60
You, L., Wood-Sichra, U., Ru, Y., Joglekar, A. K. B., Fritz, S., Xiong, W., Lu, M., Wu, W., and Yang, P.:
.2020. A cultivated planet in 2010: 2. The global gridded agricultural production maps. Earth System Science Data. https://doi.org/10.5194/essd-2020-11
Yulianti, Astrina, Enti Sirnawati, and Amalia Ulpah. 2016. “Introduction Technology of Cropping Calen-dar-Information System (CC-IS) for Rice Farming as A Climate Change Adaptation in Indonesia.” Interna-tional Journal on Advanced Science, Engineering and Information Technology (IJASEIT). https://core.ac.uk/download/pdf/325990513.pdf.
Yuliawan, Taufiq, and I. Handokob. 2016. “The Effect of Temperature Rise to Rice Crop Yield in Indonesia uses Shierary Rice Model with Geographical Infor-mation System (GIS) Feature.” Procedia Environ-mental Sciences 214-220. https://www.sciencedirect.com/science/article/pii/S1878029616002371.
Yusri, Yusof, Ahmad Mohd, Wahab Md Saidin, Mus-tapa Mohammad Sukri, Tahar Mohd, and Universiti Tun Hussein Onn Malaysia (UTHM). 2012. “Producing
Paper Using Pineapple Leaf Fiber.” Advanced Materials Research 383-390:3382-3386.
Zhai, Fan, and Juzhong Zhuang. 2009. Agricultural Impact of Climate Change: A General Equilibrium Anal-ysis with Special Reference to Southeast Asia. ADBI Working Paper 131, Tokyo: Asian Development Bank Institute. https://www.adb.org/sites/default/files/publication/155986/adbi-wp131.pdf.