Embed Size (px)
Citation preview
ORNL/TM-2003/19
Spinning Reserve From Responsive Loads
March 2003
Prepared by B. J. Kirby Oak Ridge National Laboratory
This report was prepared as an account of work sponsored by an agency of the United States Government. Neither the United States government nor any agency thereof, nor any of their employees, makes any warranty, express or implied, or assumes any legal liability or responsibility for the accuracy, completeness, or usefulness of any information, apparatus, product, or process disclosed, or represents that its use would not infringe privately owned rights. Reference herein to any specific commercial product, process, or service by trade name, trademark, manufacturer, or otherwise, does not necessarily constitute or imply its endorsement, recommendation, or favoring by the United States Government or any agency thereof. The views and opinions of authors expressed herein do not necessarily state or reflect those of the United States Government or any agency thereof.
DOCUMENT AVAILABILITY Reports produced after January 1, 1996, are generally available free via the U.S. Department of Energy (DOE) Information Bridge:
Web site: http://www.osti.gov/bridge Reports produced before January 1, 1996, may be purchased by members of the public from the following source:
National Technical Information Service 5285 Port Royal Road Springfield, VA 22161 Telephone: 703-605-6000 (1-800-553-6847) TDD: 703-487-4639 Fax: 703-605-6900 E-mail: [email protected] Web site: http://www.ntis.gov/support/ordernowabout.htm
Reports are available to DOE employees, DOE contractors, Energy Technology Data Exchange (ETDE) representatives, and International Nuclear Information System (INIS) representatives from the following source:
Office of Scientific and Technical Information P.O. Box 62 Oak Ridge, TN 37831 Telephone: 865-576-8401 Fax: 865-576-5728 E-mail: [email protected] Web site: http://www.osti.gov/contact.html
ORNL/TM-2003/19
SPINNING RESERVE FROM RESPONSIVE LOADS
Prepared for the Transmission Reliability Program
Office of Power Technologies Assistant Secretary for Energy Efficiency and Renewable Energy
U.S. Department of Energy Principal Author Brendan Kirby
Oak Ridge National Laboratory January 2003
CERTS—Real-Time Grid Monitoring and Management
Prepared by
OAK RIDGE NATIONAL LABORATORY Oak Ridge, Tennessee 37831-6070
managed by UT-BATTELLE, LLC
for the U.S. DEPARTMENT OF ENERGY
under contract DE-AC05-00OR22725
iii
CONTENTS
Page
1. INTRODUCTION.................................................................................................................... 1 2. RESERVE REQUIREMENTS................................................................................................. 3
2.1 TECHNICAL REQUIREMENTS.................................................................................. 3 2.2 REGULATIONS AND POLICIES ................................................................................ 4
2.2.1 Federal Energy Regulatory Commission........................................................... 4 2.2.2 North American Electric Reliability Council .................................................... 5 2.2.3 Northeast Power Coordinating Council ............................................................. 6 2.2.4 New York State Reliability Council .................................................................. 8 2.2.5 New York Independent System Operator.......................................................... 9
3. RESPONSIVE LOAD AS A SPINNING RESERVE PROVIDER........................................ 13 3.1 DESIRABLE CHARACTERISTICS ............................................................................ 13
3.1.1 Storage .............................................................................................................. 13 3.1.2 Control Capability ............................................................................................ 14 3.1.3 Notification Requirement ................................................................................. 14 3.1.4 Response Speed ................................................................................................ 14 3.1.5 Restoration........................................................................................................ 14 3.1.6 Size ................................................................................................................... 15 3.1.7 Minimal Cost .................................................................................................... 15
3.2 MOTIVATION.............................................................................................................. 15 3.3 RESPONSIVE LOADS ARE DIFFERENT FROM GENERATORS.......................... 16
3.3.1 Load’s Control of Its Own Destiny................................................................... 16 3.3.2 Statistical Response .......................................................................................... 17 3.3.3 Real-Time Event Response Monitoring ........................................................... 18 3.3.4 Resource Availability ....................................................................................... 18 3.3.5 Performance Monitoring................................................................................... 19
3.4 COMMUNICATION REQUIREMENTS..................................................................... 19 3.4.1 Resource Selection............................................................................................ 19 3.4.2 Deployment....................................................................................................... 19 3.4.3 Real-Time Monitoring ...................................................................................... 20 3.4.4 Performance Monitoring................................................................................... 20 3.4.5 Aggregation and Communication..................................................................... 20
3.5 COSTS........................................................................................................................... 20 4. LIPAedge RESPONSIVE LOAD ........................................................................................... 21
4.1 ComfortChoice TECHNOLOGY .................................................................................... 21 4.2 EXPERIENCE FROM THE SUMMER of 2002 ............................................................ 23
4.2.1 Spinning Reserve Availability .......................................................................... 23 4.2.2 Load Response.................................................................................................. 24 4.2.3 Manual Override............................................................................................... 28 4.2.4 Cost and Value.................................................................................................. 39
5. ISSUES, CONCERNS, AND QUESTIONS........................................................................... 33 5.1 FORECASTING RESPONSE......................................................................................... 33 5.2 SPINNING RESERVE COMPENSATION.................................................................... 33 5.3 FREQUENCY RESPONSE ............................................................................................ 34
6. CONCLUSIONS AND RECOMENDATIONS...................................................................... 35 ACKNOWLEDGMENT................................................................................................................ 37 REFERENCES............................................................................................................................... 39
v
LIST OF FIGURES Figure Page
1 Governor response and contingency reserves successfully restored the generation/load balance after the loss of 2600 MW of generation ..................................... 4
2 Contingency reserves provide a coordinated response to a sudden loss of supply ............. 4 3 The New York Independent System Operator deployed reserves 239 times
in 2002 for an average of just over 10 minutes each time................................................. 10 4 Most of the New York Independent System Operator reserve deployments were
12 minutes or less in 2002................................................................................................. 10 5 The New York Independent System Operator deployed 10-minute reserves
eight times on July 29, 2002 ............................................................................................. 11 6 Larger numbers of individually less reliable responsive loads can provide
greater aggregate reliability than fewer large generators .................................................. 17 7 Carrier ComfortChoice thermostats appear to be ideal for supplying spinning
reserves ............................................................................................................................. 22 8 Available spinning reserve averaged only 21 MW, but it peaked at 82 MW, at
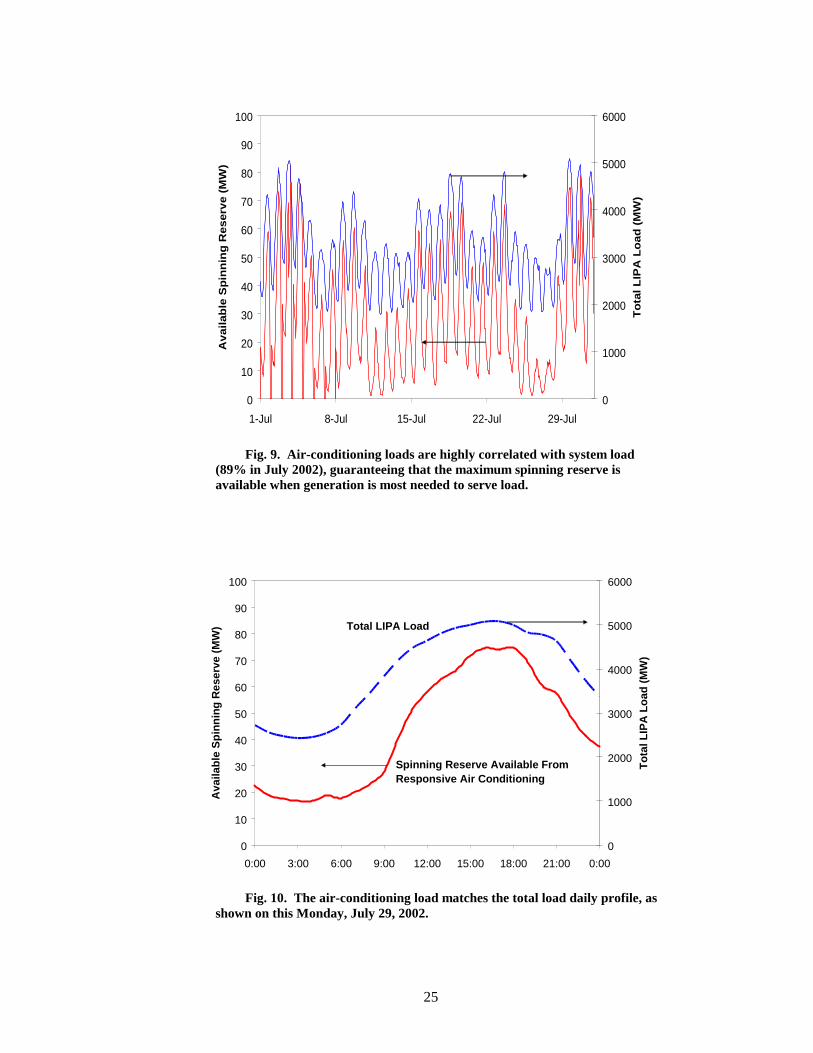
the same time the overall load peak and capacity were most dear.................................... 24 9 Air-conditioning loads are highly correlated with total system load, guaranteeing
that the maximum spinning reserve is available when generation is most needed to serve load ...................................................................................................................... 25
10 The air-conditioning load matches the total load daily profile, as shown on this Monday, July 29, 2002.......................................................................................... 25
11 Significant spinning reserve capability remains even when demand reduction is in effect, as shown in this 8/14/2002 curtailment ............................................................. 26
12 The conditioned space temperature rise limits curtailment duration and depth................ 27 13 Temperature will rise faster during a spinning reserve curtailment than during
a demand reduction curtailment but the shorter duration limits the customer impact .......................................................................................................... 27
14 Manual override is not a problem during the spinning reserve time frame ...................... 29 15 Ancillary service prices, and spinning reserve prices in particular, tend
to be volatile, as shown here for 2002............................................................................... 30
vii
LIST OF TABLES Table Page
1 NPCC contingency reserve definitions............................................................................ 7 2 NPCC contingency reserve requirements ........................................................................ 7 3 Spinning reserve hourly prices were twice as high as non-synchronized 10-minute
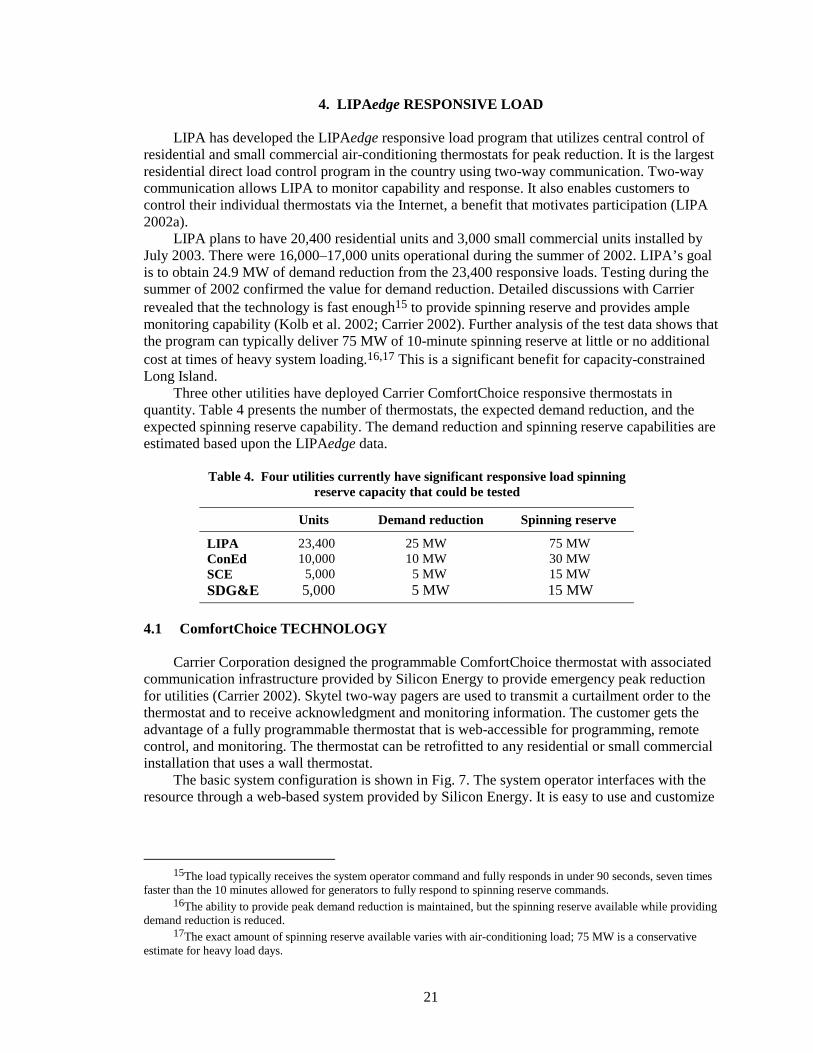
reserve prices in both California and New York in 2002 .............................................. 16 4 Four utilities currently have significant responsive load spinning reserve capacity
that could be tested ........................................................................................................ 21 5 Carrier ComfortChoice thermostats provide significant monitoring capability ............ 22
ix
ACRONYMS ACE area control error AGC automatic generation control ConEd Consolidated Edison CPS Control Performance Standard DCS Disturbance Control Standard FERC Federal Energy Regulatory Commission ICAP installed capacity market or payment ISO Independent System Operator LIPA Long Island Power Authority MW megawatt MWh megawatt-hour of energy MW-H megawatt of ancillary service capacity for 1 hour NERC North American Electric Reliability Council NPCC Northeast Power Coordinating Council NYISO New York Independent System Operator NYSRC New York State Reliability Council SDG&E San Diego Gas and Electric SMD Standard Market Design
1
1. INTRODUCTION
Responsive load is the most underutilized reliability resource available to the power system today. It is currently not used at all to provide spinning reserve.1 Historically there were good reasons for this, but recent technological advances in communications and controls have provided new capabilities and eliminated many of the old obstacles. North American Electric Reliability Council (NERC), Federal Energy Regulatory Commission (FERC), Northeast Power Coordinating Council (NPCC), New York State Reliability Council (NYSRC), and New York Independent System Operator (NYISO) rules are beginning to recognize these changes and are starting to encourage responsive load provision of reliability services.
The Carrier ComfortChoice responsive thermostats provide an example of these technological advances. This is a technology aimed at reducing summer peak demand through central control of residential and small commercial air-conditioning loads. It is being utilized by Long Island Power Authority (LIPA), Consolidated Edison (ConEd), Southern California Edison (SCE), and San Diego Gas and Electric (SDG&E). The technology is capable of delivering even greater response in the faster spinning reserve time frame (while still providing peak reduction). Analysis of demand reduction testing results from LIPA during the summer of 2002 provides evidence to back up this claim. It also demonstrates that loads are different from generators and that the conventional wisdom, which advocates for starting with large loads as better ancillary service providers, is flawed. The tempting approach of incrementally adapting ancillary service requirements, which were established when generators were the only available resources, will not work. While it is easier for most generators to provide replacement power and non-spinning reserve (the slower response services) than it is to supply spinning reserve (the fastest service), the opposite is true for many loads.2 Also, there is more financial reward for supplying spinning reserve than for supplying the other reserve services as a result of the higher spinning reserve prices.
The LIPAedge program (LIPA’s demand reduction program using Carrier ComfortChoice thermostats) provides an opportunity to test the use of responsive load for spinning reserve. With potentially 75 MW of spinning reserve capability already installed, this test program can also make an important contribution to the capacity needs of Long Island during the summer of 2003. Testing could also be done at ConEd (~30 MW), SCE (~15 MW), and/or SDG&E (~15 MW). It is important to note that this report is solely an Oak Ridge National Laboratory product and the views expressed are those of the author. While LIPA data were used, LIPA has not, at this time, agreed to participate in any testing.
This paper is divided into six chapters. Chapter 2 discusses the contingency reserve ancillary services, their functions in supporting power system reliability, and their technical requirements. It also discusses the policy and tariff requirements and attempts to distinguish between ones that are genuinely necessary and ones that are artifacts of the technologies that were historically used to provide the services. Chapter 3 discusses how responsive load could provide contingency reserves (especially spinning reserve) for the power system. Chapter 4 specifically discusses the Carrier ComfortChoice responsive thermostat technology, the LIPAedge experience with that technology, and how the technology could be used to supply spinning reserve. Chapter 5 discusses a number of unresolved issues and suggests areas for further research. Chapter 6 offers conclusions and recommendations.
1Pumped-storage facilities are sometimes used as spinning reserve while in the pumping mode, but these are
more like generators than loads. They are large individual facilities with full utility instrumentation and control. Most important, they are primarily in the energy business.
2The limited amount of storage available to most loads limits the response duration.
3
2. RESERVE REQUIREMENTS
The electric power system is unique in that it must match aggregate production and con-sumption instantaneously and continuously. Several types of controllable reserves are maintained to help the system operator achieve this required generation/load balance. The continuous random minute-to-minute fluctuations in load and uncontrolled generation are compensated for with regulating reserves. Frequency deviations are compensated for with frequency-responsive reserves, and the daily cycling of load through load following and generator dispatch. Sudden failures of generation and transmission are compensated for with three additional reserves: 10-minute spinning reserve, 10-minute non-synchronized reserve, and 30-minute operating reserve.3
Conceptually the generation/load balance can be maintained by controlling generation, load, or both. Historically, system operators have tended to control generation almost exclusively. Generators are typically in the business of providing their services to the power system, so their business model (whether they are owned by an integrated utility or are independent) accommo-dates following system operator directives. Communication and control technology also made it easier to monitor and control a few large resources than numerous smaller resources. Conse-quently, the rules governing how the power system is operated were developed at a time when large generators were essentially the only resources available to support system reliability. Rules were prescriptive as to the actions to be taken and the technologies to be used, rather than being results oriented (i.e., performance based).
Restructuring has changed the business relationships between generators and the system operator. Technology has advanced to allow loads to be responsive. Energy costs have risen (in some regions) and become more volatile (almost everywhere) from hour to hour, providing incentives for loads to respond. Rules established by regulators and technical organizations are being changed to accommodate this new set of circumstances.
2.1 TECHNICAL REQUIREMENTS
While responsive load can theoretically provide almost any service the power system
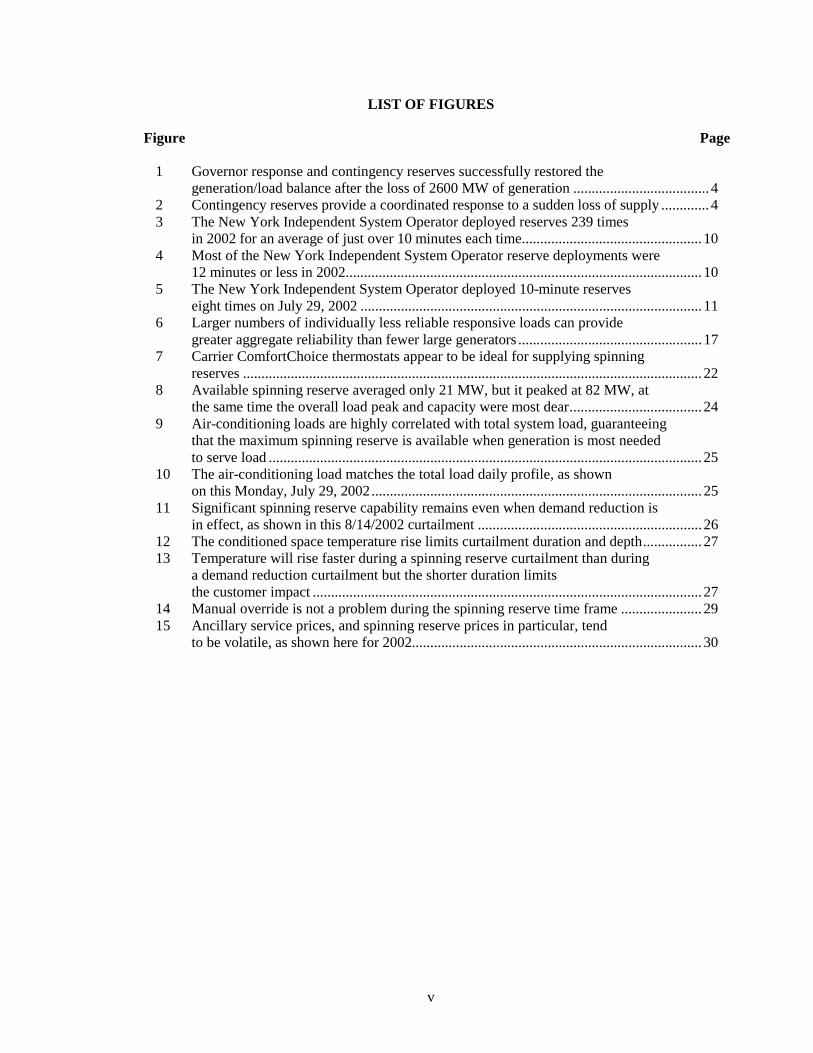
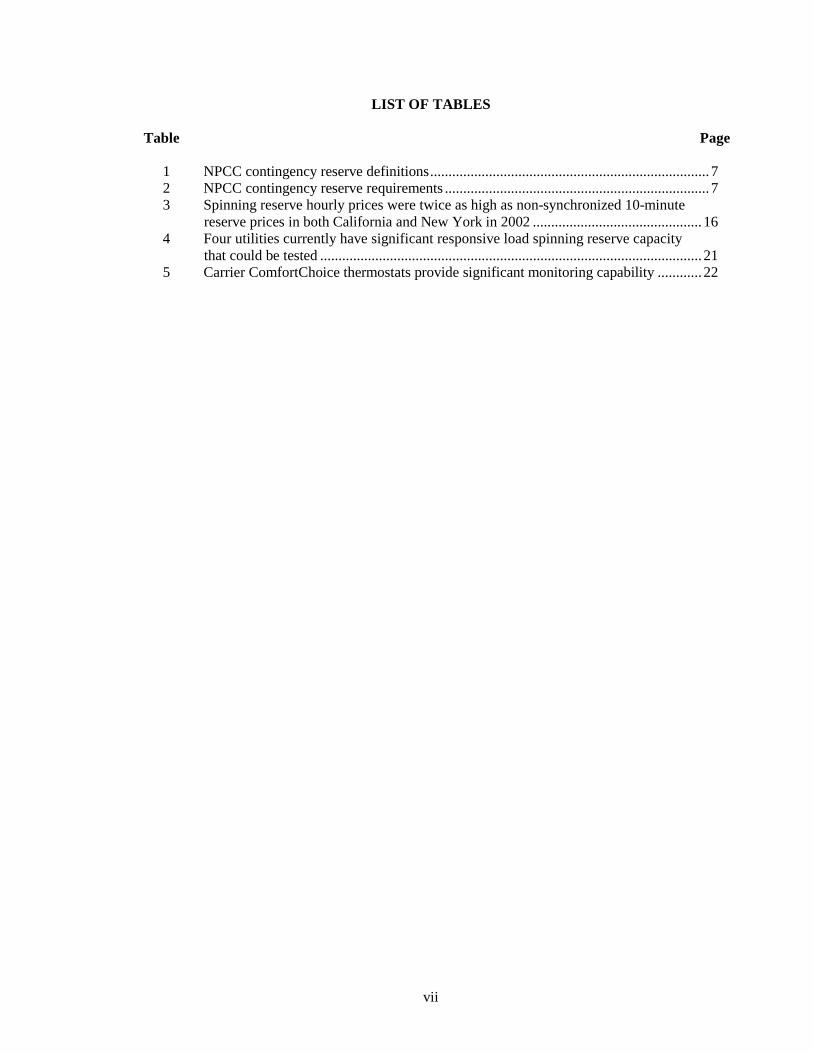
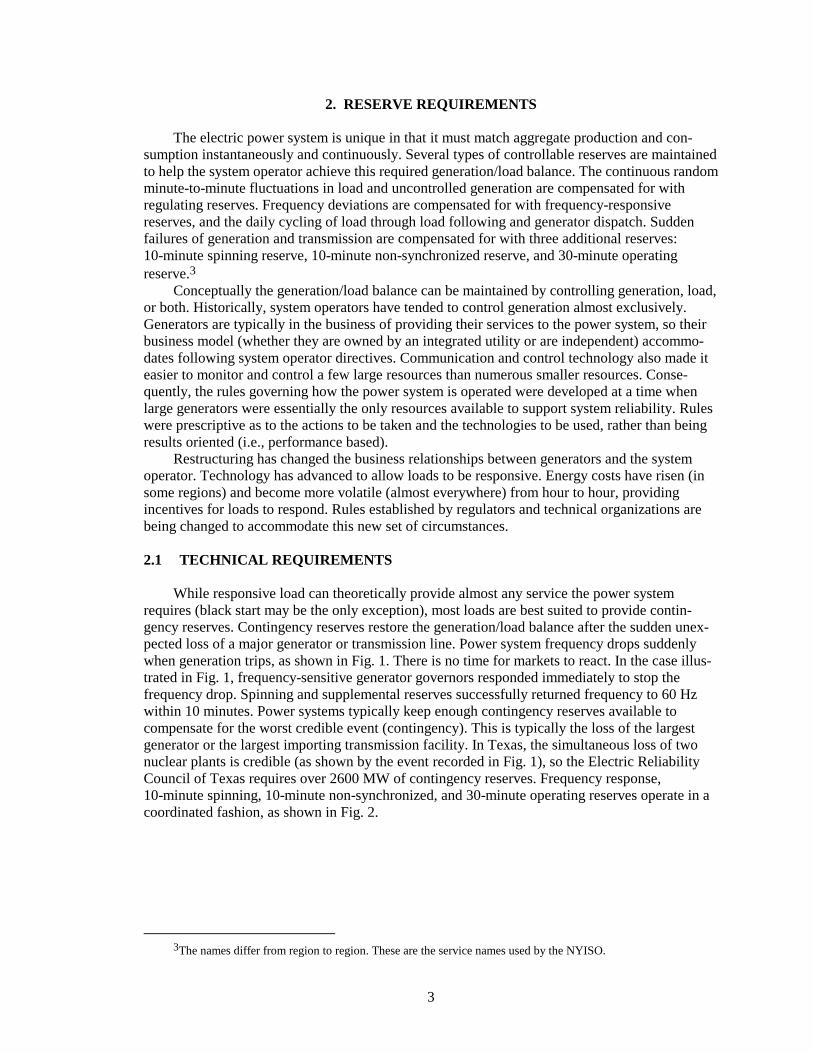
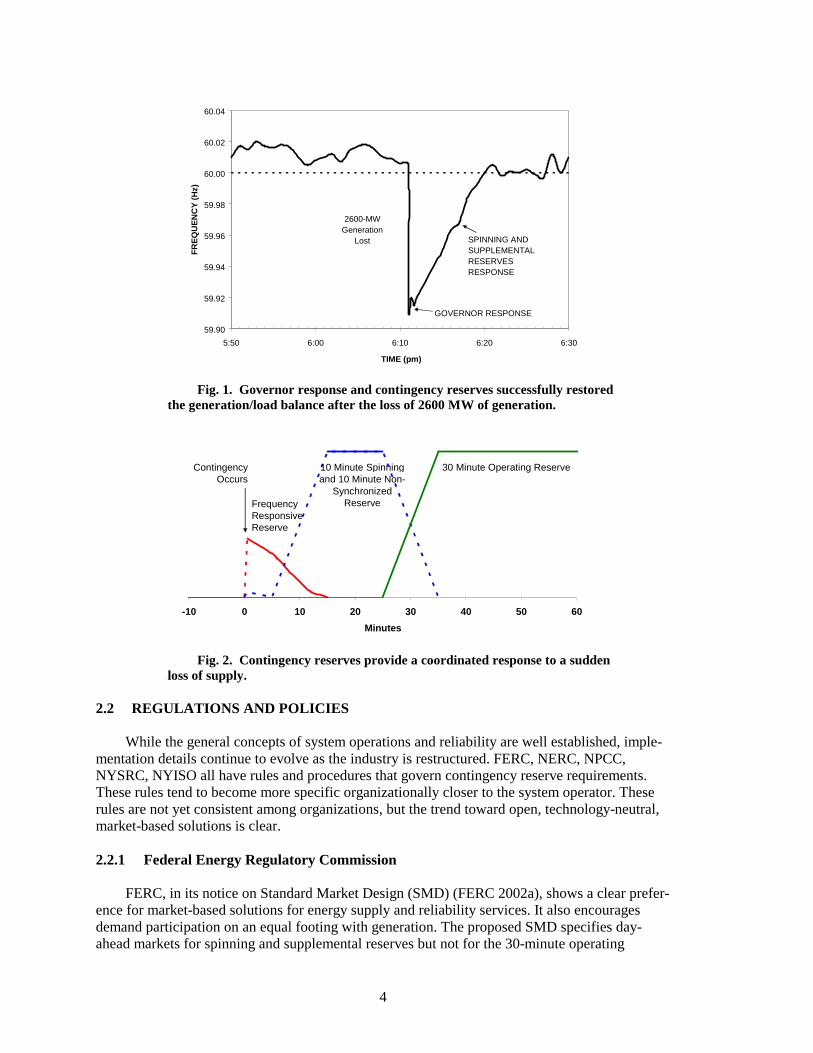
requires (black start may be the only exception), most loads are best suited to provide contin-gency reserves. Contingency reserves restore the generation/load balance after the sudden unex-pected loss of a major generator or transmission line. Power system frequency drops suddenly when generation trips, as shown in Fig. 1. There is no time for markets to react. In the case illus-trated in Fig. 1, frequency-sensitive generator governors responded immediately to stop the frequency drop. Spinning and supplemental reserves successfully returned frequency to 60 Hz within 10 minutes. Power systems typically keep enough contingency reserves available to compensate for the worst credible event (contingency). This is typically the loss of the largest generator or the largest importing transmission facility. In Texas, the simultaneous loss of two nuclear plants is credible (as shown by the event recorded in Fig. 1), so the Electric Reliability Council of Texas requires over 2600 MW of contingency reserves. Frequency response, 10-minute spinning, 10-minute non-synchronized, and 30-minute operating reserves operate in a coordinated fashion, as shown in Fig. 2.
3The names differ from region to region. These are the service names used by the NYISO.
4
59.90
59.92
59.94
59.96
59.98
60.00
60.02
60.04
5:50 6:00 6:10 6:20 6:30
TIME (pm)
FR
EQ
UE
NC
Y (
Hz)
2600-MWGeneration
Lost SPINNING AND SUPPLEMENTAL RESERVES RESPONSE
GOVERNOR RESPONSE
Fig. 1. Governor response and contingency reserves successfully restored
the generation/load balance after the loss of 2600 MW of generation.
-10 0 10 20 30 40 50 60
Minutes
30 Minute Operating ReserveContingencyOccurs
10 Minute Spinning and 10 Minute Non-
Synchronized ReserveFrequency
ResponsiveReserve
Fig. 2. Contingency reserves provide a coordinated response to a sudden
loss of supply. 2.2 REGULATIONS AND POLICIES
While the general concepts of system operations and reliability are well established, imple-mentation details continue to evolve as the industry is restructured. FERC, NERC, NPCC, NYSRC, NYISO all have rules and procedures that govern contingency reserve requirements. These rules tend to become more specific organizationally closer to the system operator. These rules are not yet consistent among organizations, but the trend toward open, technology-neutral, market-based solutions is clear.
2.2.1 Federal Energy Regulatory Commission
FERC, in its notice on Standard Market Design (SMD) (FERC 2002a), shows a clear prefer-ence for market-based solutions for energy supply and reliability services. It also encourages demand participation on an equal footing with generation. The proposed SMD specifies day-ahead markets for spinning and supplemental reserves but not for the 30-minute operating
5
reserve. These markets are to be integrated with the energy market, much as New York does. FERC also proposes operation of real-time markets for ancillary services, again, much as New York proposes in its Real-Time Scheduling system.
2.2.2 North American Electric Reliability Council
In its most recent operating manual (NERC 2002), NERC has continued its move away from prescriptive requirements for operational practices and toward relying more on performance standards. Policy 1 on “Generation Control and Performance” specifies two standards that control areas must meet to maintain reliability in real time: The Control Performance Standard (CPS) covers normal operation and the Disturbance Control Standard (DCS) deals with recovery from major generator or transmission outages. 4
Policy 1 nonetheless discusses the resources that control areas will need to meet the per-formance standards. Each control area is required to have sufficient operating reserves to “account for frequency support, errors in load forecasting, generation loss, transmission unavail-ability, and regulating requirements.” It defines “sufficient operating reserves” as “the capacity required to meet the CPS (Section A), DCS (Section B), and Frequency Response Standard (Section C) of this Policy.5
NERC’s DCS is a performance measure; it specifies that the control area must recover the generation/load balance within 15 minutes of the start of a contingency. To provide resources to meet the DCS, Policy 1 defines contingency reserves as a subset of operating reserves:
Each CONTROL AREA shall have access to and/or operate CONTINGENCY RESERVES to respond to DISTURBANCES. This CONTINGENCY RESERVE is that part of the OPERATING RESERVES that is available, following loss of resources by the CONTROL AREA, to meet the Disturbance Control Standard (DCS). CONTINGENCY RESERVE may be supplied from generation, controllable load resources, or coordinated adjustments to INTERCHANGE SCHEDULES.6
Policy 1 goes on to state that each regional reliability council will establish contingency
reserve policies covering the minimum reserve requirements, the mix of spinning and supple-mental reserves, and “the limitations, if any, upon the amount of interruptible load that may be included” (emphasis added). There is a further requirement that each control area or reserve sharing group carry at least enough contingency reserves to cover the most severe single contingency.
There are two important points here. First, the composition of the reserves is not specified. NERC no longer requires spinning reserves to come from generation (though regional councils are not prohibited from setting that requirement).7 Second, contingency reserves are to be used to meet the DCS. That is, they are to respond to contingencies. If they are used to respond to fore-cast errors, generation or transmission maintenance, or other such problems, they are not avail-able to respond to contingencies. This latter distinction is important to responsive loads because it
4Policy 1 contains five additional standards: Frequency Response and Bias, Time Control, Automatic Generation
Control, Inadvertent Interchange, and Surveys. 5The frequency response standard will likely evolve into a performance standard similar to CPS and DCS, but it
is currently still only a specification of how to set the frequency bias. 6NERC capitalizes terms in their policies with NERC defined meanings. 7The “Terms and Definitions” in the NERC Operating Manual have not yet been updated, and spinning reserve
is still defined as “unloaded generation that is synchronized and ready to serve additional demand.”
6
has a large impact on the response duration. Oddly, as we will discuss in greater detail, responsive loads, unlike most generators, care about what the response is to be used for.
There are two other issues relevant to NERC policy. First, meeting the CPS requirements (balancing generation and load under normal conditions on a minute-to-minute basis) uses the regulation ancillary service. In principle, customer loads could provide the service as well as gen-erators. Because provision of this service requires a change in output (or consumption) on a minute-to-minute basis, and therefore requires special automatic-control equipment at the gen-erator (or customer facility), it seems unlikely that many retail loads will be able to or want to provide this service.
Second, frequency response requirements are evolving within NERC policy. Clearly, system frequency is important under both normal and contingency conditions. Frequency is the most ubiquitously available measurement of system health (it can be observed at any household 110-V outlet). The automatic generation control system (AGC) uses regulating resources to precisely control system frequency under normal conditions. Generators larger than 10 MW are required to have active governors that respond to frequency deviations. A frequency control standard similar to CPS and DCS will likely be included in Policy 1 in the future, but it is not there yet.
Some responsive loads (including the Carrier ComfortChoice responsive thermostat system) have the potential to be excellent providers of frequency responsive reserve under contingency conditions.8 As will be discussed later, they can provider faster and greater response than most generators. The cost of providing that response can also be quite low if the requirement is designed into the load control system. However, frequency response is not a function that comes naturally to most loads. While there are many reasons to control loads remotely, and those remote control systems can be readily converted to provide spinning reserve, there are no similar reasons for loads to have frequency response capability built in. Hence there is no pool of frequency responsive loads immediately available with which to run a major test or to start a responsive load program. Load equipment designers would have to see a long-term market for frequency response before they started to design the capability into either the loads or load control systems. In addi-tion to specifying the response details, designers would have to see a stable set of requirements before frequency response was built into equipment designs.9
2.2.3 Northeast Power Coordinating Council
NERC’s DCS is a performance measure; it specifies what must be accomplished (recovery within 15 minutes) without specifying how that goal must be reached. NPCC has about six reportable DCS events per month and only two DCS violations in the past 2 years. NPCC requirements are prescriptive concerning how much reserve is required. The reserve definitions are slightly different from those used by NERC as well. Table 1 provides the NPCC reserve definitions (NPCC 2002a).
NPCC’s current definition of synchronized reserves is technology-specific (restricted to generation with an exception for pumped hydro) rather than being performance-based. Other than the requirement that synchronized reserve come from generation, the performance requirement is identical to that for non-synchronized reserve.
8This discussion is of intentional/deliberate frequency control action. Many motor loads and most synchronous
generators also have a natural frequency response that aids in maintaining system stability. 9What the requirements are (respond in 20 cycles vs. 1 second or respond at 59.96 Hz vs. 59.94 Hz, for example)
will likely have little impact on the cost of new equipment, but retrofitting existing equipment to accommodate changing requirements may be prohibitive. Adding frequency response capability after the fact will also be more expensive than designing the capability into the equipment in the first place.
7
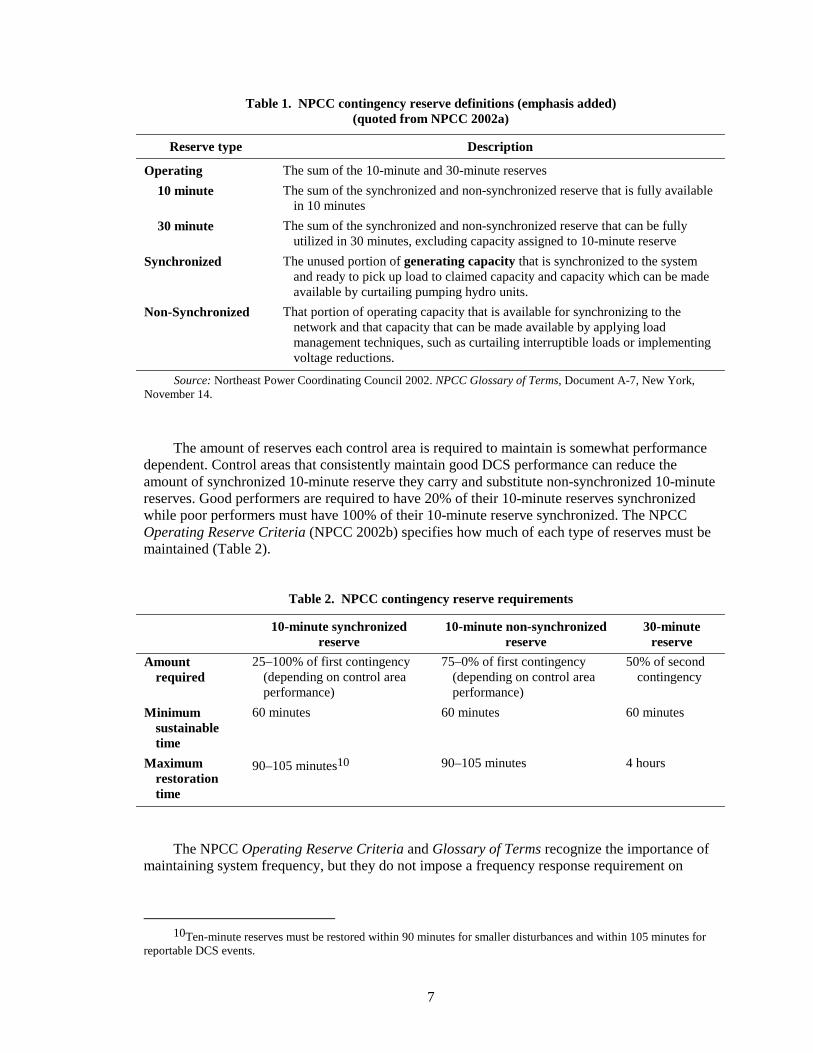
Table 1. NPCC contingency reserve definitions (emphasis added) (quoted from NPCC 2002a)
Reserve type Description
Operating The sum of the 10-minute and 30-minute reserves
10 minute The sum of the synchronized and non-synchronized reserve that is fully available in 10 minutes
30 minute The sum of the synchronized and non-synchronized reserve that can be fully utilized in 30 minutes, excluding capacity assigned to 10-minute reserve
Synchronized The unused portion of generating capacity that is synchronized to the system and ready to pick up load to claimed capacity and capacity which can be made available by curtailing pumping hydro units.
Non-Synchronized That portion of operating capacity that is available for synchronizing to the network and that capacity that can be made available by applying load management techniques, such as curtailing interruptible loads or implementing voltage reductions.
Source: Northeast Power Coordinating Council 2002. NPCC Glossary of Terms, Document A-7, New York, November 14.
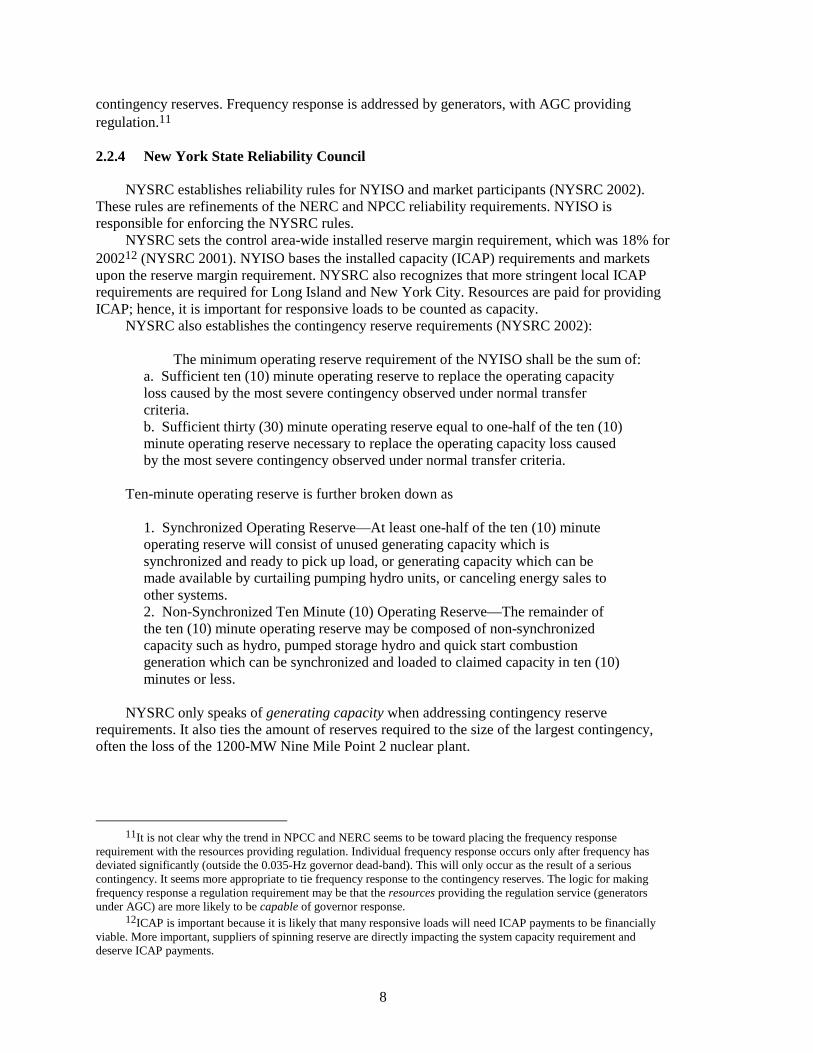
The amount of reserves each control area is required to maintain is somewhat performance dependent. Control areas that consistently maintain good DCS performance can reduce the amount of synchronized 10-minute reserve they carry and substitute non-synchronized 10-minute reserves. Good performers are required to have 20% of their 10-minute reserves synchronized while poor performers must have 100% of their 10-minute reserve synchronized. The NPCC Operating Reserve Criteria (NPCC 2002b) specifies how much of each type of reserves must be maintained (Table 2).
Table 2. NPCC contingency reserve requirements
10-minute synchronized reserve
10-minute non-synchronized reserve
30-minute reserve
Amount required
25–100% of first contingency (depending on control area performance)
75–0% of first contingency (depending on control area performance)
50% of second contingency
Minimum sustainable time
60 minutes 60 minutes 60 minutes
Maximum restoration time
90–105 minutes10 90–105 minutes 4 hours
The NPCC Operating Reserve Criteria and Glossary of Terms recognize the importance of maintaining system frequency, but they do not impose a frequency response requirement on
10Ten-minute reserves must be restored within 90 minutes for smaller disturbances and within 105 minutes for
reportable DCS events.
8
contingency reserves. Frequency response is addressed by generators, with AGC providing regulation.11 2.2.4 New York State Reliability Council
NYSRC establishes reliability rules for NYISO and market participants (NYSRC 2002). These rules are refinements of the NERC and NPCC reliability requirements. NYISO is responsible for enforcing the NYSRC rules.
NYSRC sets the control area-wide installed reserve margin requirement, which was 18% for 200212 (NYSRC 2001). NYISO bases the installed capacity (ICAP) requirements and markets upon the reserve margin requirement. NYSRC also recognizes that more stringent local ICAP requirements are required for Long Island and New York City. Resources are paid for providing ICAP; hence, it is important for responsive loads to be counted as capacity.
NYSRC also establishes the contingency reserve requirements (NYSRC 2002):
The minimum operating reserve requirement of the NYISO shall be the sum of: a. Sufficient ten (10) minute operating reserve to replace the operating capacity loss caused by the most severe contingency observed under normal transfer criteria. b. Sufficient thirty (30) minute operating reserve equal to one-half of the ten (10) minute operating reserve necessary to replace the operating capacity loss caused by the most severe contingency observed under normal transfer criteria.
Ten-minute operating reserve is further broken down as
1. Synchronized Operating Reserve—At least one-half of the ten (10) minute operating reserve will consist of unused generating capacity which is synchronized and ready to pick up load, or generating capacity which can be made available by curtailing pumping hydro units, or canceling energy sales to other systems. 2. Non-Synchronized Ten Minute (10) Operating Reserve—The remainder of the ten (10) minute operating reserve may be composed of non-synchronized capacity such as hydro, pumped storage hydro and quick start combustion generation which can be synchronized and loaded to claimed capacity in ten (10) minutes or less.
NYSRC only speaks of generating capacity when addressing contingency reserve
requirements. It also ties the amount of reserves required to the size of the largest contingency, often the loss of the 1200-MW Nine Mile Point 2 nuclear plant.
11It is not clear why the trend in NPCC and NERC seems to be toward placing the frequency response
requirement with the resources providing regulation. Individual frequency response occurs only after frequency has deviated significantly (outside the 0.035-Hz governor dead-band). This will only occur as the result of a serious contingency. It seems more appropriate to tie frequency response to the contingency reserves. The logic for making frequency response a regulation requirement may be that the resources providing the regulation service (generators under AGC) are more likely to be capable of governor response.
12ICAP is important because it is likely that many responsive loads will need ICAP payments to be financially viable. More important, suppliers of spinning reserve are directly impacting the system capacity requirement and deserve ICAP payments.
9
Reserve restoration is also addressed:
Following a contingency, the ten (10) minute operating reserve shall be restored within thirty (30) minutes of the time that the contingency occurred, or sooner if possible.
NYSRC does provide for exceptions to the reliability rules. NYISO or any member of the
NYSRC Executive Committee can submit an exception request.
2.2.5 New York Independent System Operator
NYISO takes the NERC, NPCC, and NYSRC requirements and establishes markets and rules for operating the 31,000-MW New York power system. The NYISO Ancillary Services Manual (NYISO 1999) includes responsive load in the possible resource mix for the contingency reserves:
• 10-Minute Spinning Reserve—Operating Reserves provided by Generators and Interruptible/Dispatchable Load Resources located within the NYCA that are already synchronized to the NYS Power System and can respond to instructions to change output level within 10 minutes.
• 10-Minute Non-Synchronized Reserve (10-Minute NSR)—Operating Reserves provided by Generators that can be started, synchronized and loaded within 10 minutes. These reserves are carried on quick-start units, such as jet engine type gas turbines.
• 30-Minute Spinning Reserve—30-Minute Spinning Reserve provided by Generators and Interruptible/Dispatchable Load resources located within the NYCA that are already synchronized to the NYS Power System.
NYISO also ties the amount of the required reserves to the size of the largest contingency:
“At all times sufficient total 10-minute reserve is maintained to cover the energy loss due to the most severe Normal Transfer Criteria contingency within the NYCA or the energy loss caused by the cancellation of an interruptible export transaction (NYCA to neighboring control area) whichever is greater.” Both generation and load resources that supply 10-minute reserves must be able to sustain the response for 30 minutes.
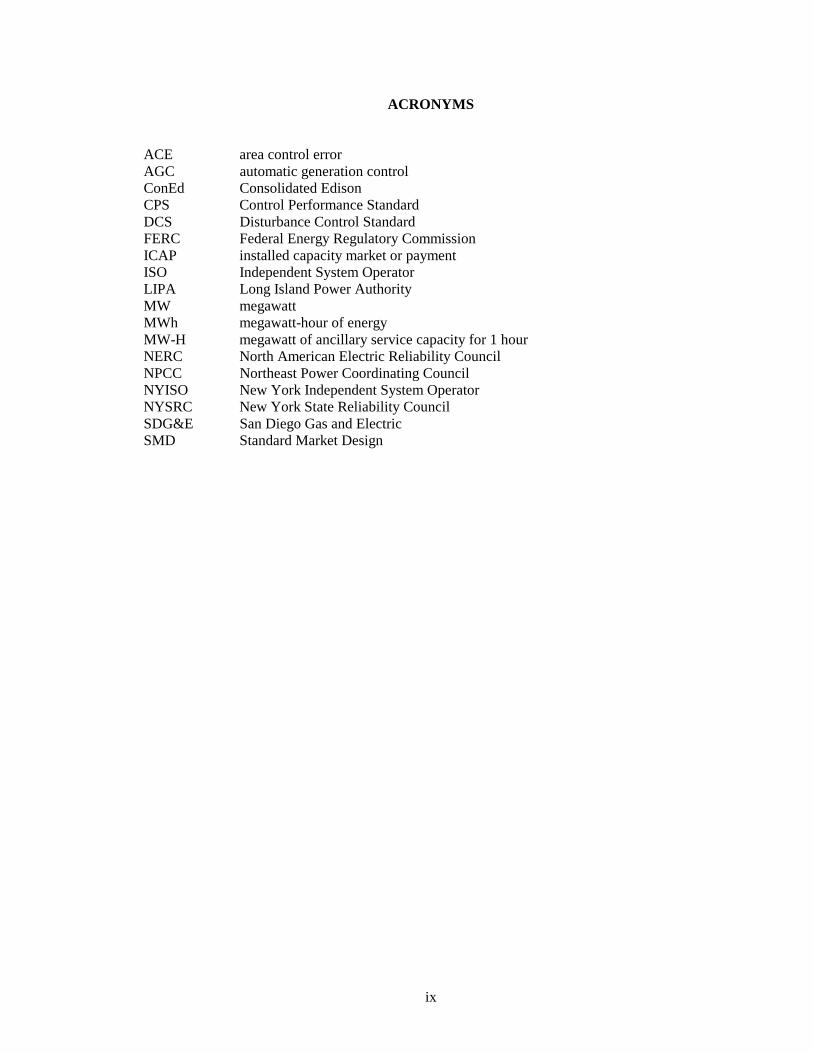
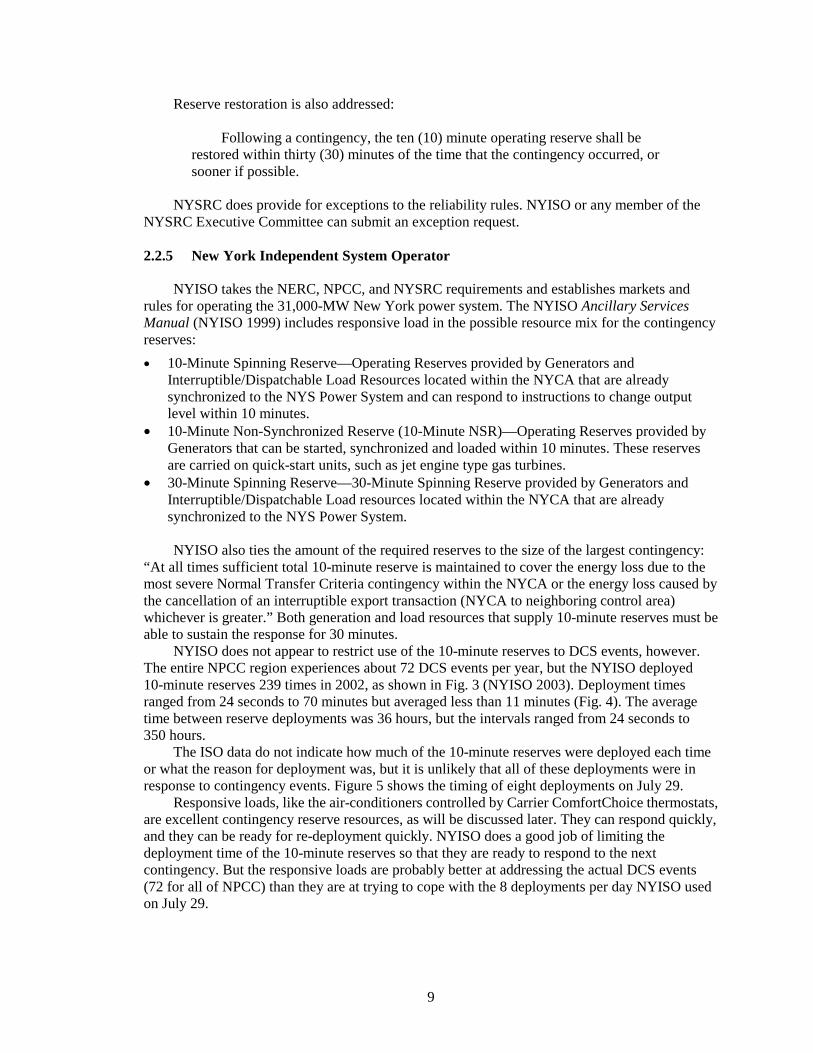
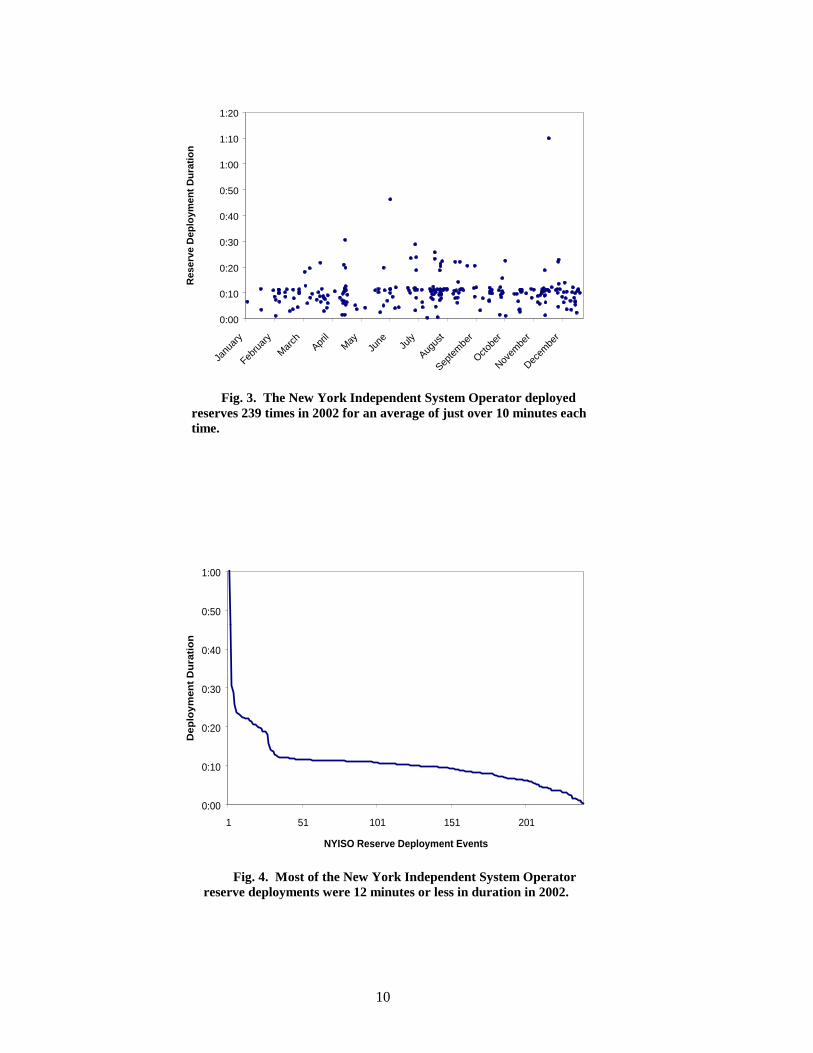
NYISO does not appear to restrict use of the 10-minute reserves to DCS events, however. The entire NPCC region experiences about 72 DCS events per year, but the NYISO deployed 10-minute reserves 239 times in 2002, as shown in Fig. 3 (NYISO 2003). Deployment times ranged from 24 seconds to 70 minutes but averaged less than 11 minutes (Fig. 4). The average time between reserve deployments was 36 hours, but the intervals ranged from 24 seconds to 350 hours.
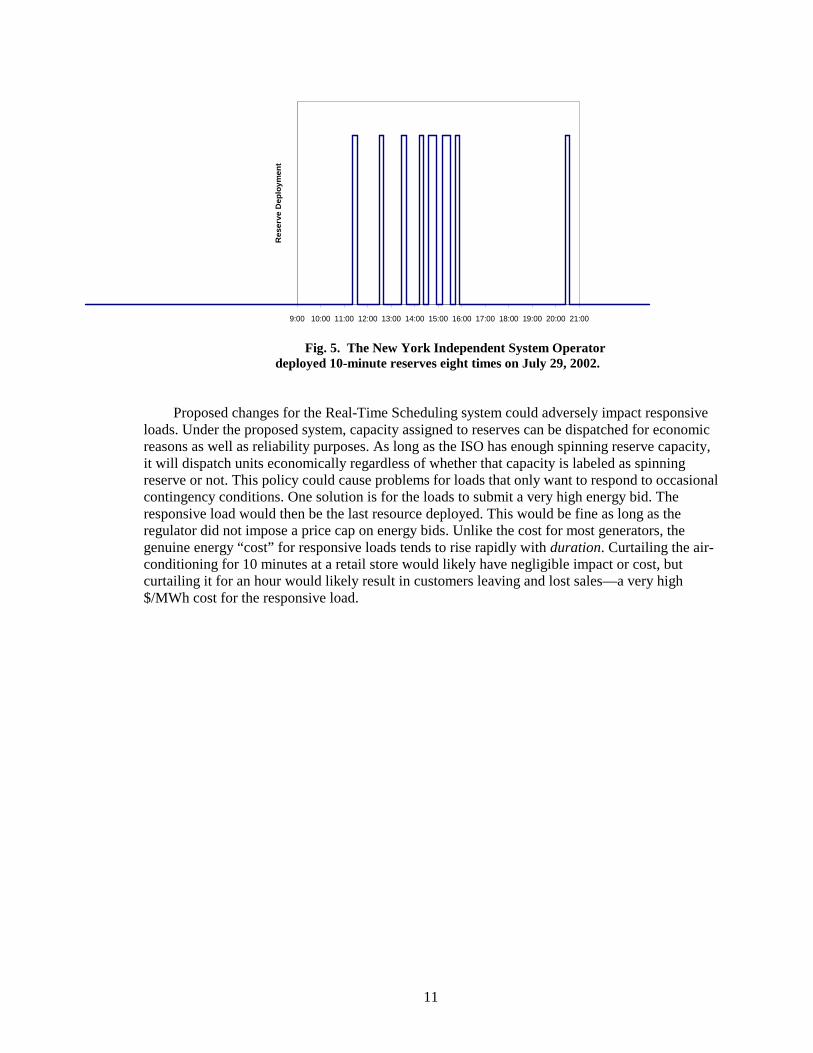
The ISO data do not indicate how much of the 10-minute reserves were deployed each time or what the reason for deployment was, but it is unlikely that all of these deployments were in response to contingency events. Figure 5 shows the timing of eight deployments on July 29.
Responsive loads, like the air-conditioners controlled by Carrier ComfortChoice thermostats, are excellent contingency reserve resources, as will be discussed later. They can respond quickly, and they can be ready for re-deployment quickly. NYISO does a good job of limiting the deployment time of the 10-minute reserves so that they are ready to respond to the next contingency. But the responsive loads are probably better at addressing the actual DCS events (72 for all of NPCC) than they are at trying to cope with the 8 deployments per day NYISO used on July 29.
10
0:00
0:10
0:20
0:30
0:40
0:50
1:00
1:10
1:20
Janu
ary
Febru
ary
Mar
chApr
ilM
ayJu
ne July
Augus
t
Septe
mbe
r
Octobe
r
Novem
ber
Decem
ber
Res
erve
Dep
loym
ent
Du
rati
on
Fig. 3. The New York Independent System Operator deployed
reserves 239 times in 2002 for an average of just over 10 minutes each time.
0:00
0:10
0:20
0:30
0:40
0:50
1:00
1 51 101 151 201
NYISO Reserve Deployment Events
De
plo
ym
ent
Du
rati
on
Fig. 4. Most of the New York Independent System Operator
reserve deployments were 12 minutes or less in duration in 2002.
11
9:00 10:00 11:00 12:00 13:00 14:00 15:00 16:00 17:00 18:00 19:00 20:00 21:00
Res
erve
Dep
loy
men
t
Fig. 5. The New York Independent System Operator
deployed 10-minute reserves eight times on July 29, 2002. Proposed changes for the Real-Time Scheduling system could adversely impact responsive
loads. Under the proposed system, capacity assigned to reserves can be dispatched for economic reasons as well as reliability purposes. As long as the ISO has enough spinning reserve capacity, it will dispatch units economically regardless of whether that capacity is labeled as spinning reserve or not. This policy could cause problems for loads that only want to respond to occasional contingency conditions. One solution is for the loads to submit a very high energy bid. The responsive load would then be the last resource deployed. This would be fine as long as the regulator did not impose a price cap on energy bids. Unlike the cost for most generators, the genuine energy “cost” for responsive loads tends to rise rapidly with duration. Curtailing the air-conditioning for 10 minutes at a retail store would likely have negligible impact or cost, but curtailing it for an hour would likely result in customers leaving and lost sales—a very high $/MWh cost for the responsive load.
13
3. RESPONSIVE LOAD AS A SPINNING RESERVE PROVIDER
Spinning reserve has traditionally been supplied from generators. It can be thought of as providing insurance. You get paid for having it available whether or not it is called upon to address a system emergency. It should be called upon only in the event of a genuine system emergency such as a lost transmission line or failed generator. Also, it should be called upon infrequently, perhaps a few times per month. It should be restored to service rapidly (within 30 to 60 minutes) so that the power system is protected against the next contingency. Having the option to use load to supply spinning reserve would provide another source of revenue for responsive loads, increase the reliability of the electricity supply by increasing reserves, and decrease all customers’ energy bills because reserve generation would be freed up to supply energy.
The basic idea of providing spinning reserve (or any contingency reserve) from load is simple (Kirby and Kueck 2000):
• Rapidly curtail load in response to a DCS event • Maintain the curtailment until the next category of reserves (10-minute non-synchronized
followed by 30-minute operating reserve) are deployed • Restore the reserve (and load) to service as rapidly thereafter as possible to be ready for the
next contingency
This option requires loads with both storage and control capability, a communication system that tells the loads when to respond, and monitoring to ensure that the load response was obtained. It also requires a system of rules and tariffs that encourage and accommodate load response. It is important to bear in mind that only a small percentage of loads need respond. NYISO only requires spinning reserve equal to about 2% of the peak load.
3.1 DESIRABLE CHARACTERISTICS
Many different types of loads can potentially supply contingency reserves to the power system. Good candidates (including the Carrier ComfortChoice system) share common characteristics:
3.1.1 Storage
Any load that inherently has some storage in its process, or any process to which storage can be readily added, is a good candidate to supply contingency reserves. This will not be direct storage of electricity—60 Hz power cannot be stored directly. The storage will typically be in the form of the productive effort in which the load is normally engaged. Candidates include thermal storage (e.g., building heating/cooling, water heating, refrigeration and freezing), process inventory, compressed air, water pumping, and probably dozens of other such uses. Residential air-conditioning provides excellent storage in the cooled building space.
A common characteristic for many loads is that storage is limited. A homeowner may be willing to completely curtail air-conditioning (or heating) for 15–30 minutes, but would be unwilling to sustain that total curtailment for hours at a time (especially on hot, humid days during which electricity systems tend to peak). Similarly, municipal water pumping systems may have 24 hours of storage available but be unable to curtail for more than an hour in response to power prices or demand reduction requests. The bulk of the stored water must be reserved in case of a large fire or prolonged power outage to address the load’s primary mission.
14
3.1.2 Control Capability
To be useful as a contingency reserve, the load must have the capability to respond to curtailment requests. The rapid response requirements require automatic response. The best loads are those that already have control systems that can be adapted to respond to spinning reserve commands.
3.1.3 Notification Requirement
Contingency events are rapid; full response is required within 10 minute. Immediate response is better. Processes that require no notification time are best suited to providing spinning reserves. Thermal loads, water pumping, air compression, and other loads with storage inherently built into the process generally do not require advance notification of curtailment.
Time can be allotted to allow the power system and the load to negotiate participation in the provision of spinning reserves for a specific time. Day-ahead and hour-ahead markets for contingency reserves generally provide this type of notification of resource selection, giving the load ample time to arm the control system. But notification of deployment in case of a DCS event must be as rapid as possible.
3.1.4 Response Speed
Faster is better. Once a load with control capability has been notified to deploy in response to a DCS event, the actual response must be accomplished rapidly. Here, load response typically exceeds generator response. Many responsive loads (thermal loads, for example) provide full response essentially instantaneously. Some responsive loads may require time for valves to operate and processes to go through shutdown procedures. These loads must be able to meet NERC and ISO requirements for full response within 10 minutes (including communication time, which might be slower for small loads than it is for large generators).
3.1.5 Restoration
Once a contingency event has been successfully dealt with, the power system needs to have the contingency reserves restored as quickly as possible to protect against the next potential generation or transmission failure. NERC, NPCC, NYSRC, and ISO rules covering reserve restoration are vague and the restoration times excessively long13 because they were designed to accommodate the only resources available at the time: large thermal generators. These generators have minimum run times and minimum off times to avoid damage to the units from excessive thermal stress. Most responsive loads inherently have much better restoration characteristics. Typically, loads need to return to service as quickly as possible after the contingency event and are immediately available in case of another contingency event; reserves are restored immediately.
This last point concerning immediate reserve restoration demonstrates why the reason for the curtailment is important to the responsive loads. A responsive load with limited storage needs to return its processes to their normal operation (building temperature, for example) after a contingency event. Hence the load will be running and potentially available for re-curtailment. The power system needs to be protected in the unlikely event that another contingency occurs quickly. A responsive load might be willing to assume this risk given its very low probability of
13Multiple-hour response duration requirements are excessive in the sense that DCS requires rebalancing the
system within 15 minutes and NPCC 30-minute reserves are to be available within 30 minutes. The 10-minute synchronized and non-synchronized reserves should be relieved by 30-minute reserves within 30 minutes.

15
occurrence and given an understanding that it is in everyone’s interest to prevent this next contingency event from cascading into a major blackout of a power system that is in a weakened state. The same load might be entirely unwilling to respond to a simple shortage of supply. The load might fear that its limited contingency response capability would be turned into an energy source for a prolonged time.
Unlike costs for generation, which typically can run for as long as required after it is deployed at essentially constant cost, costs for responsive load typically start low but rise rapidly after the inherent storage capability is exhausted. A freezer, for example, can curtail at low cost until the temperature rises to the point where the contents start to spoil. Costs rise dramatically after that point. Different loads will have different cost consequences resulting from extended outages. Even residential air-conditioning loads tend to have nonlinear “costs” when the threshold of inconvenience or discomfort is exceeded and the customer opts out of the program.
A solution that might work well for both the power system and the responsive loads (though probably not for residential loads) would be to price subsequent responses within a limited time frame at progressively higher (perhaps even dramatically higher) prices. Both the power system and the load would be protected from these low-probability/high-consequence events.
3.1.6 Size
Aggregate size is important. The size of the aggregate resource needs to be large enough to be useful. NYISO requires up to 600 MW each of 10-minute synchronized, 10-minute non-synchronized, and 30-minute reserves. The sizes of individual resources are different, and both large and small resources have advantages. Large resources are easier to monitor; small resources behave statistically and potentially have higher reliability as a group (i.e., the failure of any one resource has little impact on the electric system).
3.1.7 Minimal Cost
Both standby and deployment costs need to be considered. Since loads are not primarily in the energy business, they are not specifically designed to respond to power system needs. Selecting loads with inherent control and response capabilities reduces the cost of adding spinning reserve capacity. Utilizing responsive load technology that was installed for peak reduction to provide spinning reserve is such an example. If, for example, responsive thermostats are installed and paid for to provide demand reduction, they are able to provide additional spinning reserve at minimal extra cost, as discussed in detail later.
3.2 MOTIVATION
Power system operators and power market designers should be motivated to encourage responsive loads to participate in contingency reserve markets because their participation will increase reliability and reduce costs to all power system customers. When loads provide contingency reserves, generation is freed up to provide energy. This increases generation supply, which reduces the energy-clearing price for everyone. Similarly, increasing the resource pool for contingency reserves necessarily reduces their costs to the system. The faster response offered by some loads further increases reliability. Finally, encouraging retail loads to provide reserves reduces the market power, in both energy and ancillary service markets, that some generators might otherwise have.
Providing spinning reserve is a better match to the natural capabilities of many loads than is responding to hourly energy prices. There may be enough storage to allow one hour of response but not six or ten. However, providing contingency reserves and peak reduction or responding to hourly energy markets are not mutually exclusive. Some responsive loads can respond to
16
multi-hour adjustments and still have additional capacity available for spinning reserve; 60–70% of the response capacity remains available for spinning reserve even when Carrier’s ComfortChoice thermostats are providing peak load reduction, as is explained later. Costs are reduced in this case because much of the communication and control equipment is used for both functions.
Ancillary service market prices are also a motivator. In 2002, both New York and California experienced hourly prices for 10-minute spinning reserve that were double the price for 10-minute non-synchronous reserve (Table 3).
Table 3. Spinning reserve hourly prices were twice as high as non-
synchronized 10-minute reserve prices in both California and New York in 2002
NY East $/MW-h
NY West $/MW-h
CA $/MW-h
Spinning reserve 3.04 2.82 3.89
Non-synchronized reserve 1.51 1.37 1.57
Small customers can often be motivated by means other than direct access to real-time ancillary service market prices and the associated hourly payments. LIPAedge curtailable load program customer incentives include a $25 one-time payment to residential customers and a $50 one-time payment to small commercial customers. The customer also received the Internet-accessible, fully programmable, Energy Star thermostat. Some customers are also likely motivated by the opportunity to help reduce power prices and alleviate the summer power crisis on Long Island.
3.3 RESPONSIVE LOADS ARE DIFFERENT FROM GENERATORS
There are three major differences between loads and generators (other than the direction of power flow). First, loads are not primarily in the energy business; they have other obligations. Second, individual loads are typically smaller than individual generators; they provide a statistical rather than a deterministic resource. Third, many loads are better matched to fast, short, infrequent events.
3.3.1 Load’s Control of Its Own Destiny
While automatic deployment is necessary when selling reserves, it is often important to allow the customer to decide when it will participate and when it will not. Amazingly, this is true for a 2000-MW industrial plant, for a residential customer, and for most loads in between. Just as the prices of hourly energy and each of the ancillary services vary, so do customer economics. For many customers, there are times when less flexibility exists and the load cannot be interrupted without high costs being incurred. These times are often independent of anything happening on the power system and are therefore unrelated to the price and value of the service. A residential customer might be willing to automatically curtail air-conditioning use for 30 or 60 minutes to supply contingency reserves on most days, for example, simply as a good citizen helping out in an emergency or for very little compensation. This same customer would probably be unwilling to curtail use at any price on the evening when s/he was holding a dinner party, however. Similar restrictions might apply for an industrial customer, such as a continuous chemical processing plant that is taking a monthly inventory and needs a stable process. In both cases, the customer choice not to participate is unrelated to the bulk-power operations and
17
wholesale electricity markets; neither load is trying to avoid providing the service when it is highest in value. In fact, the chemical plant may intentionally select times for its inventory when the power system is not stressed, such as at night or on weekends. It would do this not because of a concern for the power system but because that may be a time when the chemical process is stable because of reduced activity at the chemical plant.14
3.3.2 Statistical Response
Fundamentally, load is a statistical resource while generation is a deterministic resource. Some loads are large and deterministic while some generators are small and statistical; but as a general rule, loads are small, are important in aggregate, and behave statistically, while generators are large, are important individually, and behave deterministically. There are advantages to both resources and both should be used. The important thing to note is that there are differences.
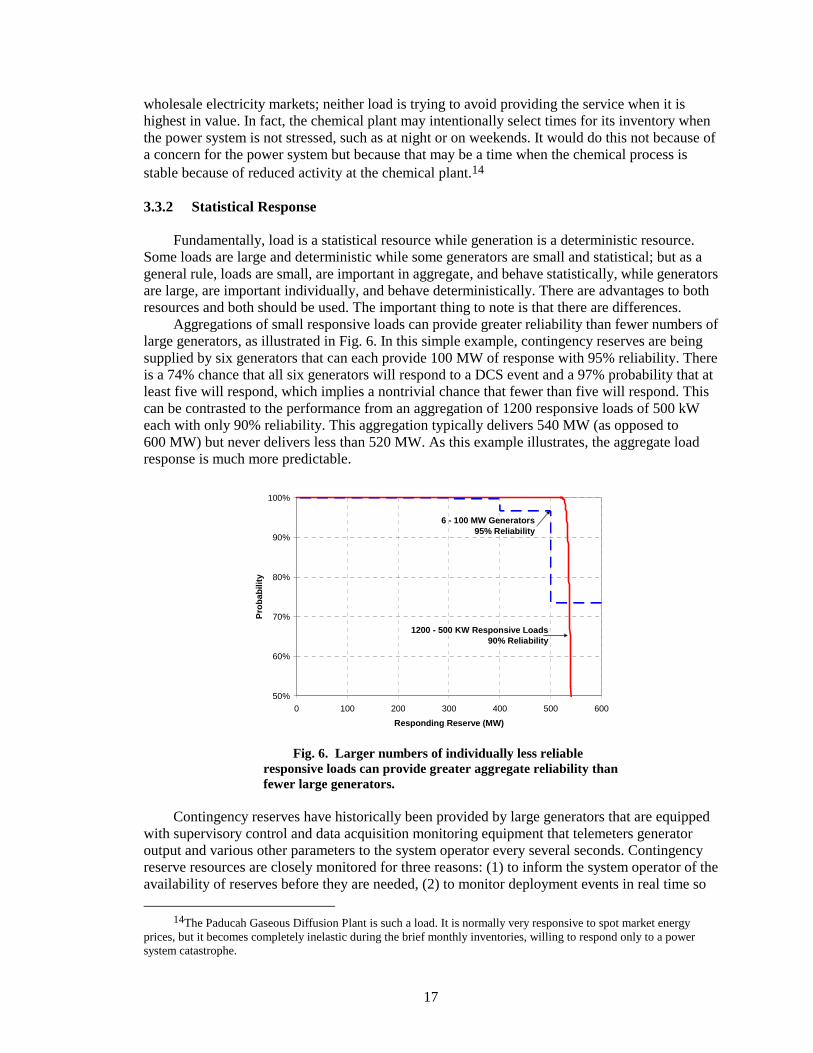
Aggregations of small responsive loads can provide greater reliability than fewer numbers of large generators, as illustrated in Fig. 6. In this simple example, contingency reserves are being supplied by six generators that can each provide 100 MW of response with 95% reliability. There is a 74% chance that all six generators will respond to a DCS event and a 97% probability that at least five will respond, which implies a nontrivial chance that fewer than five will respond. This can be contrasted to the performance from an aggregation of 1200 responsive loads of 500 kW each with only 90% reliability. This aggregation typically delivers 540 MW (as opposed to 600 MW) but never delivers less than 520 MW. As this example illustrates, the aggregate load response is much more predictable.
50%
60%
70%
80%
90%
100%
0 100 200 300 400 500 600
Responding Reserve (MW)
Pro
bab
ility
6 - 100 MW Generators95% Reliability
1200 - 500 KW Responsive Loads90% Reliability
Fig. 6. Larger numbers of individually less reliable
responsive loads can provide greater aggregate reliability than fewer large generators.
Contingency reserves have historically been provided by large generators that are equipped
with supervisory control and data acquisition monitoring equipment that telemeters generator output and various other parameters to the system operator every several seconds. Contingency reserve resources are closely monitored for three reasons: (1) to inform the system operator of the availability of reserves before they are needed, (2) to monitor deployment events in real time so
14The Paducah Gaseous Diffusion Plant is such a load. It is normally very responsive to spot market energy
prices, but it becomes completely inelastic during the brief monthly inventories, willing to respond only to a power system catastrophe.
18
that the system operator can take corrective action in case of a massive reserve failure, and 3) to monitor individual performance so that compensation motivates future performance. Because the same monitoring system provides all three functions, we often fail to distinguish between these functions. For small loads, it may be better to look at each function separately. We will examine the requirements in the order of monitoring speed.
3.3.3 Real-Time Event Response Monitoring
Individual generators are typically large enough that a failure to respond to a call for reserves is a serious event for the system operator. The failure must be addressed immediately. Other resources must be called upon. Hence it is necessary for the system operator to observe the real-time response of the generator supplying contingency reserves. Even if the failure rate of generator response is very low, the consequences of the failure are great enough to warrant real-time monitoring.
Individual loads are typically small. Failure of any individual load to respond is inconsequential to bulk system reliability. It is only the aggregated response that is important. Real-time observability of individual loads adds little to ensuring bulk system reliability and may not be required. This issue is important because response monitoring, which can be financially supported by large resources, is impractical for small resources. Insistence on real-time monitoring will exclude many small loads from supplying contingency reserves, reduce the reliability reserves available to the system operator, and increase costs. Testing and verification can be used to establish the reliability of the resource. Individual responsive loads can be tested under controlled conditions, both before being allowed to provide contingency response and periodically while in service, to ensure that they are capable of providing the required response. Response to actual deployment events can also be verified after the fact. Operator confidence in small loads as a spinning reserve resource will grow as experience is gained. A coordinated program to characterize responsive load performance should be conducted.
3.3.4 Resource Availability
Some responsive loads can support a monitoring system that informs the system operator of the resource availability. Carrier’s ComfortChoice responsive thermostats used in the LIPAedge program (discussed later) can report current status, but it can take 90 minutes to hear back from all thermostats in a 20,000-unit fleet. Alternatively, forecasting may help provide a highly accurate assessment of available spinning reserve from responsive load. Such forecasts of load response could be based on expected temperature and humidity, day type, and time of day, for example. Reliance on forecasts of aggregated load response is not new. In fact, it is aggregated load forecasts that drive the establishment of capacity and reserve requirements. None of the plans, contracts, or commitments for reserve capacity is any more certain than the underlying load forecasts used to design reserve margins. These forecasts are based on expected load response to weather and economic conditions. They are not based on long-term contracts or commitments.
Loads typically cannot guarantee the continuous availability of the contingency reserve resource. The load must be running in order to be available to shut down. So loads cannot make a long-term flat commitment to supply reserves, though some loads can participate in day-ahead markets for reserve services. Contingency reserves are typically of highest value when overall load is high and generation is scarce. Thus the overall statistical load pattern of responsive load combined with the unavailability of contingency reserves from generators increases the relative value of responsive load. Happily, air-conditioning loads are at the maximum usage when system load is highest for LIPA.
19
3.3.5 Performance Monitoring
Performance monitoring is required. Without some form of performance monitoring, it is likely that loads will eventually stop responding because there will not be an incentive to perform maintenance or incur the inconvenience of response. Performance monitoring does not require second-to-second real-time communication, however.
Several options are available. Performance can be monitored at each responsive load and reported back through a slow, cheap, communication system such as a two-way pager. Alternatively, responsive loads can be tested and certified when they are placed in service and tested periodically and/or randomly thereafter. Alternatively, a small sample of loads can be monitored using interval meters. If the sample is selected properly, results can be scaled up to accurately represent the entire population.
3.4 COMMUNICATION REQUIREMENTS
Communication between the power system operator and the responsive load is required for
several reasons:
• Resource selection • Deployment • Real-time monitoring (to ensure the system operator of the availability of the resource and to
assist in real-time operation) • Performance monitoring (to assess performance after the fact, set payments, and motivate
future performance)
The type of communication, its speed, and the amount of data transferred are different for each alternative. Fortunately, the highest speed requirements are associated with a function (deployment) that has the minimal amount of information and that can be broadcast to all responsive loads (or to a large group) rather than having to be sent to each load specifically.
3.4.1 Resource Selection
Selecting which resources will participate and when is a negotiation process between the power system and each responsive load (and generator). The communication speed required to facilitate this negotiation is fairly slow, but the amount of information may be large. In its most general sense, this process starts with collecting enough information about potential responsive loads to design the market structure or to design a program such as LIPAedge. For larger responsive loads that participate in hourly markets, and once stable markets are in place, this process will typically be reduced to the system operator announcing its needs for the day or hour ahead, collecting bid information on price and quantity from potential resources, and responding to the selected individuals. Communication requirements are resource-specific. Communication time is typically not critical, although providing individual notification to tens of thousands of individual loads via individual phone calls would not be practical. The smallest responsive loads will likely opt in and out of a supply program seasonally rather than hourly.
3.4.2 Deployment
The system operator’s command to deploy in the event of a contingency is at the opposite end of the spectrum. It must be very rapid. Fortunately it contains very little information, simply an order to respond now. The command can be broadcast to the entire resource pool or to an appropriate subgroup. Individual messages are not required. Hence, communication technologies
20
such as radio or pagers that support group notification are better than technologies that exclusively support individual communication, such as telephones. A requirement for individual communication may make sense only for the largest resources, which might also state how much response is desired.
3.4.3 Real-Time Monitoring
As discussed earlier, high-speed real-time monitoring of individual resources is necessary for large resources such as generators and very large loads but is probably not necessary for aggregations of smaller loads that behave statistically.
3.4.4 Performance Monitoring
Monitoring the performance of individual loads is necessary to motivate future performance (through payments, penalties, or removal from the program). It is individual communication with a modest amount of information (how quickly the load responded, for example, or availability during all hours that the load was “on call”), but it need not be extremely fast. Such information is needed only within each billing cycle.
3.4.5 Aggregation and Communication
The major objection voiced to customer supply of ancillary services is that the system operator cannot deal with the large number of individual resources and that the communication requirements would be overwhelming. These are valid concerns but ones that can be addressed. Technology can help by handling the communication with a large number of distributed facilities and presenting the system operator with a single contact for a reasonable amount of capacity, similar to the system operator’s interface with large, central generating resources.
3.5 COSTS
Though markets determine prices for spinning reserve and the other ancillary services in New York, it also makes sense to briefly examine the costs of generation that is providing spinning reserve to see if load supply makes any sense. There are several cost components involved when generators supply spinning reserve: capital cost, operating cost (both for standing by and during deployment), and lost-opportunity cost (Hirst and Kirby 1997). Contingency reserves are required continuously, even at the time of system peak load. The amount of capacity needed exceeds the amount required to serve the highest load. While there is excess capacity from idle generation most hours, capacity beyond the highest energy requirement must be built to supply contingency reserves for peak hours. Once energy and ancillary services markets reach equilibrium, ancillary service and ICAP market prices will have to recover the capital cost of the capacity associated with providing reserves at the time of system peak. The cost for adding contingency reserve response capability to an energy management system can be very low ($0–100/kW). This cost is especially favorable when compared with cost of new generation ($500/kW).
21
4. LIPAedge RESPONSIVE LOAD LIPA has developed the LIPAedge responsive load program that utilizes central control of
residential and small commercial air-conditioning thermostats for peak reduction. It is the largest residential direct load control program in the country using two-way communication. Two-way communication allows LIPA to monitor capability and response. It also enables customers to control their individual thermostats via the Internet, a benefit that motivates participation (LIPA 2002a).
LIPA plans to have 20,400 residential units and 3,000 small commercial units installed by July 2003. There were 16,000–17,000 units operational during the summer of 2002. LIPA’s goal is to obtain 24.9 MW of demand reduction from the 23,400 responsive loads. Testing during the summer of 2002 confirmed the value for demand reduction. Detailed discussions with Carrier revealed that the technology is fast enough15 to provide spinning reserve and provides ample monitoring capability (Kolb et al. 2002; Carrier 2002). Further analysis of the test data shows that the program can typically deliver 75 MW of 10-minute spinning reserve at little or no additional cost at times of heavy system loading.16,17 This is a significant benefit for capacity-constrained Long Island.
Three other utilities have deployed Carrier ComfortChoice responsive thermostats in quantity. Table 4 presents the number of thermostats, the expected demand reduction, and the expected spinning reserve capability. The demand reduction and spinning reserve capabilities are estimated based upon the LIPAedge data.
Table 4. Four utilities currently have significant responsive load spinning
reserve capacity that could be tested
Units Demand reduction Spinning reserve
LIPA 23,400 25 MW 75 MW ConEd 10,000 10 MW 30 MW SCE 5,000 5 MW 15 MW SDG&E 5,000 5 MW 15 MW
4.1 ComfortChoice TECHNOLOGY
Carrier Corporation designed the programmable ComfortChoice thermostat with associated communication infrastructure provided by Silicon Energy to provide emergency peak reduction for utilities (Carrier 2002). Skytel two-way pagers are used to transmit a curtailment order to the thermostat and to receive acknowledgment and monitoring information. The customer gets the advantage of a fully programmable thermostat that is web-accessible for programming, remote control, and monitoring. The thermostat can be retrofitted to any residential or small commercial installation that uses a wall thermostat.
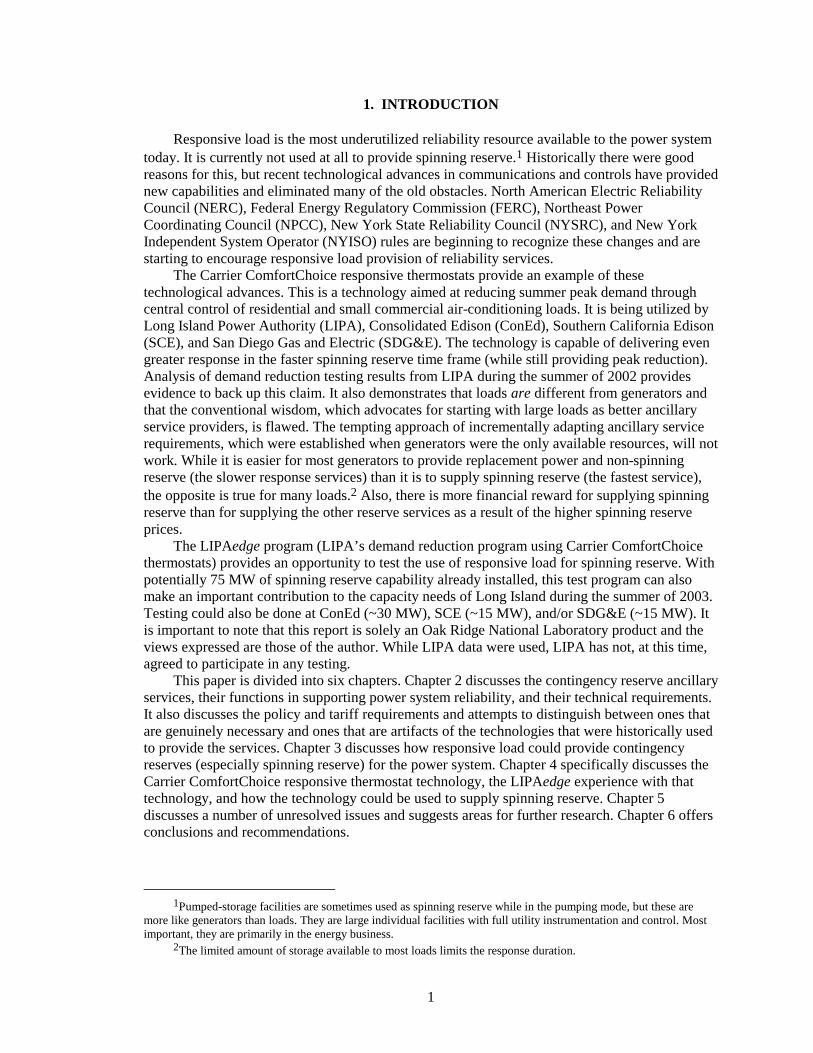
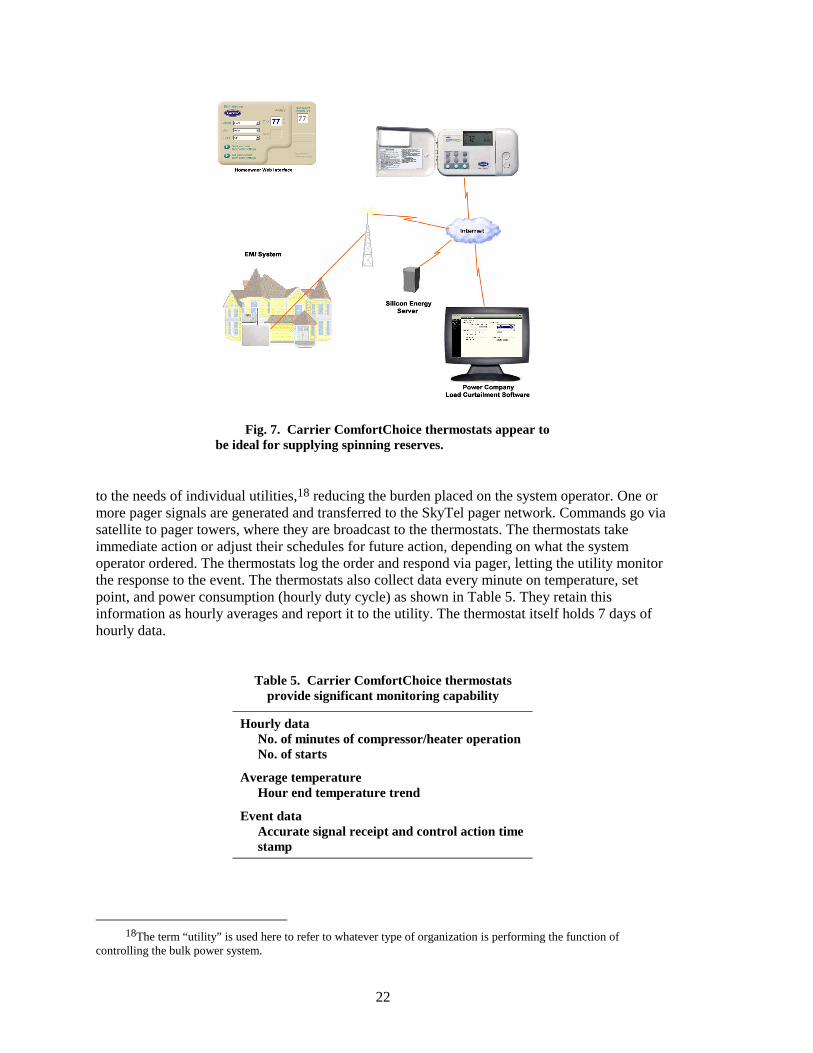
The basic system configuration is shown in Fig. 7. The system operator interfaces with the resource through a web-based system provided by Silicon Energy. It is easy to use and customize
15The load typically receives the system operator command and fully responds in under 90 seconds, seven times
faster than the 10 minutes allowed for generators to fully respond to spinning reserve commands. 16The ability to provide peak demand reduction is maintained, but the spinning reserve available while providing
demand reduction is reduced. 17The exact amount of spinning reserve available varies with air-conditioning load; 75 MW is a conservative
estimate for heavy load days.
22
Fig. 7. Carrier ComfortChoice thermostats appear to
be ideal for supplying spinning reserves. to the needs of individual utilities,18 reducing the burden placed on the system operator. One or more pager signals are generated and transferred to the SkyTel pager network. Commands go via satellite to pager towers, where they are broadcast to the thermostats. The thermostats take immediate action or adjust their schedules for future action, depending on what the system operator ordered. The thermostats log the order and respond via pager, letting the utility monitor the response to the event. The thermostats also collect data every minute on temperature, set point, and power consumption (hourly duty cycle) as shown in Table 5. They retain this information as hourly averages and report it to the utility. The thermostat itself holds 7 days of hourly data.
Table 5. Carrier ComfortChoice thermostats provide significant monitoring capability
Hourly data No. of minutes of compressor/heater operation No. of starts
Average temperature Hour end temperature trend
Event data Accurate signal receipt and control action time stamp
18The term “utility” is used here to refer to whatever type of organization is performing the function of
controlling the bulk power system.
23
For a summer load curtailment, the system operator might send a command at 9:00 A.M. directing all thermostats to move their set points up 4°, starting at 14:00 and ending at 18:00. But the system operator could send a command directing all thermostats to completely curtail immediately. The command would be received and acted upon by all loads, providing full response within about 90 seconds.19 This is far faster than generator response, which typically requires a 10-minute ramp time.
Thermostats can be addressed individually, in groups, or in total. This important advantage provides both flexibility and speed. System operator commands that are addressed to the entire resource are implemented through a single page that all thermostats receive. Similarly, 15 subgroups can be addressed if response is required in a specific area to alleviate a transmission constraint. Thermostats can be addressed individually as well. This capability is useful for monitoring the performance of the system (each thermostat is checked weekly for a “heartbeat”).
The customer receives advantages as well. The thermostat is fully programmable and remotely accessible, with all of the associated energy savings and convenience benefits. A web-based remote interface is provided for customer interaction. Customers can also override curtailment events. (The system operator can block overrides if necessary; this is not typically done for demand curtailment events, but it may be useful for spinning reserve events.) This feature appears to be important to gain customer acceptance and it probably increased the reliability benefit, as will be discussed later.
Two-way paging communication enables the utility to monitor load performance both during response events and under normal conditions. Response from each thermostat is staggered over a user-defined interval (where the user is the utility and not load) to avoid overwhelming the paging system. It typically requires 90 minutes for 20,000 thermostats to respond. Thus the system provides for performance monitoring but not in the 2–8-second intervals typical for large generators.
Communication is more reliable from the system operator to the thermostat than from the thermostat to the system operator. The pager tower has a 500-W transmitter, while the pager’s transmitter is only 1 W. The thermostat makes four attempts to report back if the pager tower fails to receive any of its signals. The thermostat continues to take control actions and respond to new commands even if return communication is lost. Hence the system is more reliable than would be indicated by the list of “failed” units generated by the “heartbeat” report. Experience to date has found 4–5% of the thermostats fail to report back.
4.2 EXPERIENCE FROM THE SUMMER OF 2002
LIPA collected name-plate power consumption information on the air-conditioning equipment being controlled when it installed the ComfortChoice thermostats for the LIPAedge program. It also directly measured the power consumption of a subset of those loads to estimate the actual load of the aggregation. LIPA determined that the average residential air-conditioning unit being controlled consumes 3.84 kW, while the average small commercial unit consumes 6.38 kW. The total 23,400 individual loads then have a peak power consumption of 97.4 MW if all the units are on at 100% duty cycle.
4.2.1 Spinning Reserve Availability
When air-conditioning loads are being curtailed for several hours for peak reduction, the loads cannot be turned completely off because the residences or commercial establishments
19Timing needs to be verified with a large sample set. Messages to individual thermostats are faster
(~40 seconds) than broadcast messages to large groups (~90 seconds). Time estimate is based on a few anecdotal tests. Newer thermostats are to have the capability to precisely time-stamp the incoming signal and report this information.
24
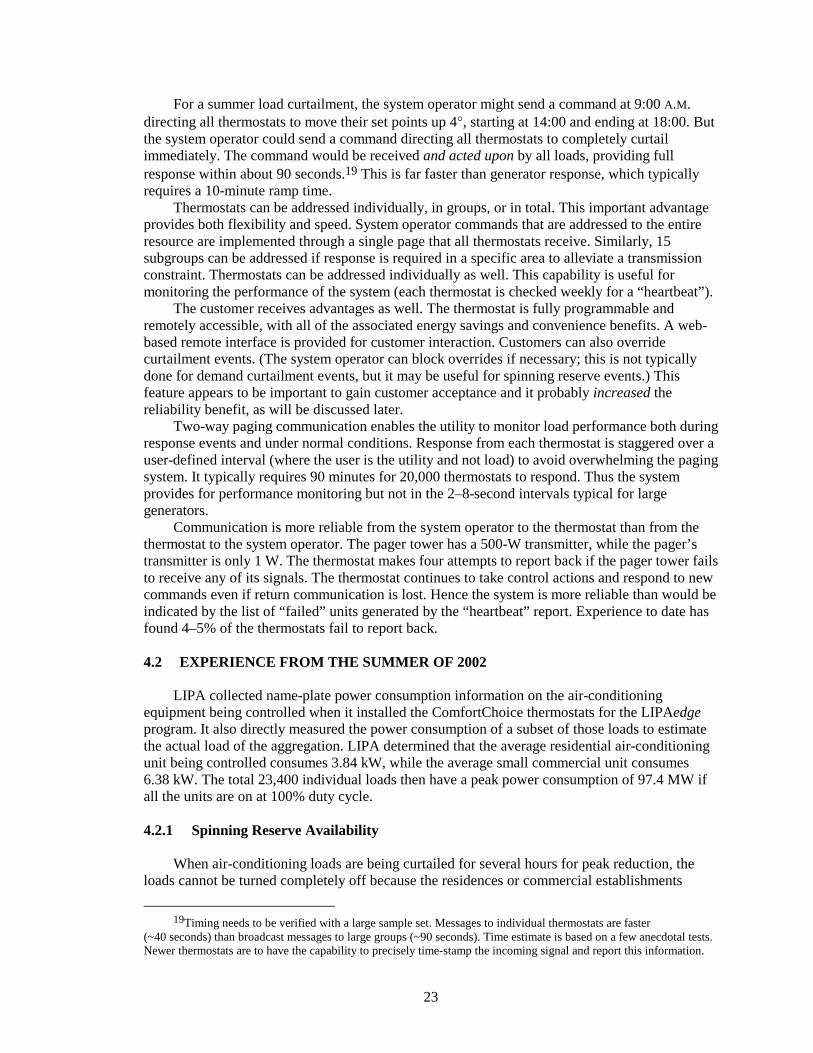
would get too hot. The temperature set point can be raised or the duty cycle can be limited (Carrier supports both types of control). But the loads can be shut completely off when they are supplying spinning reserve. The NYISO curtailment duration averages less than 11 minutes; the resource is required to have only a 30-minute response capability. Also, if the reserve is used only for contingency response, there are only a limited number of DCS events (six per month for all of NPCC). LIPA monitored the performance of 400 units from 5/1/2002 through 9/29/2002. Hourly data were collected from each unit for duty cycle and facility temperature (LIPA 2002b). Those data were used to estimate the performance of all 23,400 responsive loads. Figure 8 shows the hourly load and therefore the spinning reserve capacity available from the 23,400 responsive air-conditioning loads.
0
10
20
30
40
50
60
70
80
90
May-02 Jun-02 Jul-02 Aug-02 Sep-02
Ava
ilab
le S
pin
nin
g R
eser
ve (
MW
)
Fig. 8. Available spinning reserve averaged only 21 MW, but it
peaked at 82 MW at the same time that the overall load peak and capacity were most dear.
The average available spinning reserve was only 21 MW in all hours of June through
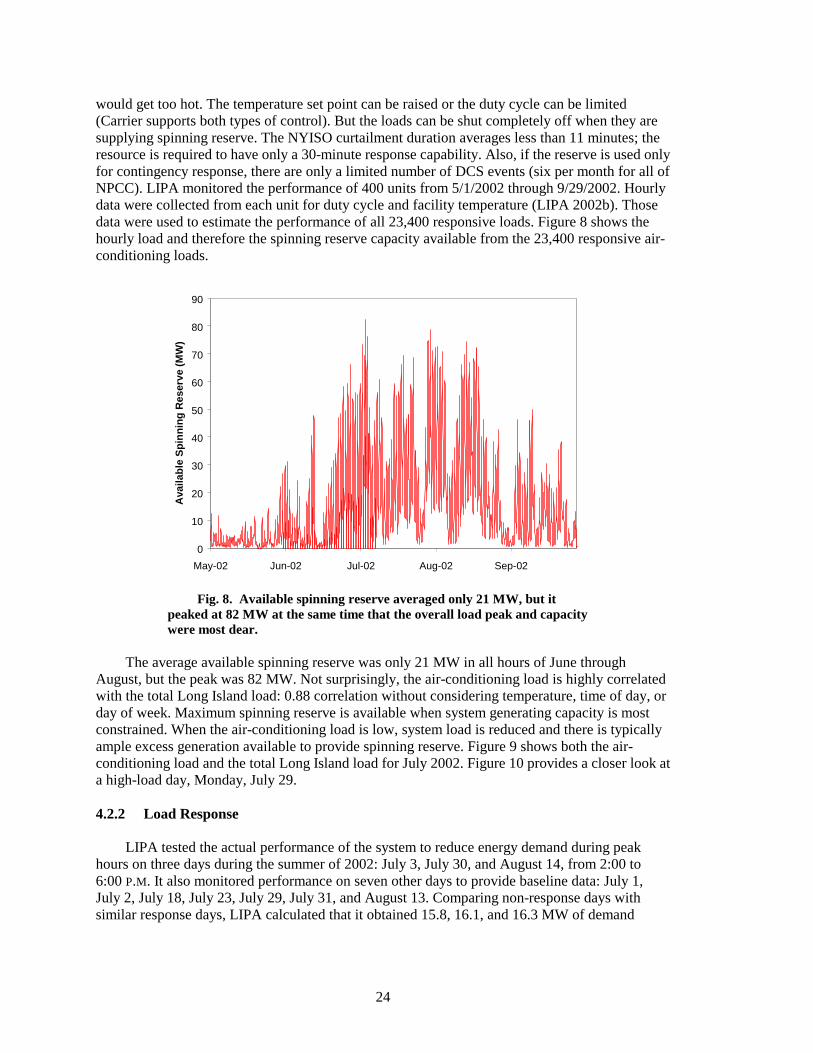
August, but the peak was 82 MW. Not surprisingly, the air-conditioning load is highly correlated with the total Long Island load: 0.88 correlation without considering temperature, time of day, or day of week. Maximum spinning reserve is available when system generating capacity is most constrained. When the air-conditioning load is low, system load is reduced and there is typically ample excess generation available to provide spinning reserve. Figure 9 shows both the air-conditioning load and the total Long Island load for July 2002. Figure 10 provides a closer look at a high-load day, Monday, July 29.
4.2.2 Load Response
LIPA tested the actual performance of the system to reduce energy demand during peak hours on three days during the summer of 2002: July 3, July 30, and August 14, from 2:00 to 6:00 P.M. It also monitored performance on seven other days to provide baseline data: July 1, July 2, July 18, July 23, July 29, July 31, and August 13. Comparing non-response days with similar response days, LIPA calculated that it obtained 15.8, 16.1, and 16.3 MW of demand
25
0
10
20
30
40
50
60
70
80
90
100
1-Jul 8-Jul 15-Jul 22-Jul 29-Jul
Av
ail
ab
le S
pin
nin
g R
es
erv
e (
MW
)
0
1000
2000
3000
4000
5000
6000
To
tal
LIP
A L
oa
d (
MW
)
Fig. 9. Air-conditioning loads are highly correlated with system load
(89% in July 2002), guaranteeing that the maximum spinning reserve is available when generation is most needed to serve load.
0
10
20
30
40
50
60
70
80
90
100
0:00 3:00 6:00 9:00 12:00 15:00 18:00 21:00 0:00
Ava
ilab
le S
pin
nin
g R
eser
ve (
MW
)
0
1000
2000
3000
4000
5000
6000
To
tal L
IPA
Lo
ad (
MW
)
Spinning Reserve Available From Responsive Air Conditioning
Total LIPA Load
Fig. 10. The air-conditioning load matches the total load daily profile, as
shown on this Monday, July 29, 2002.
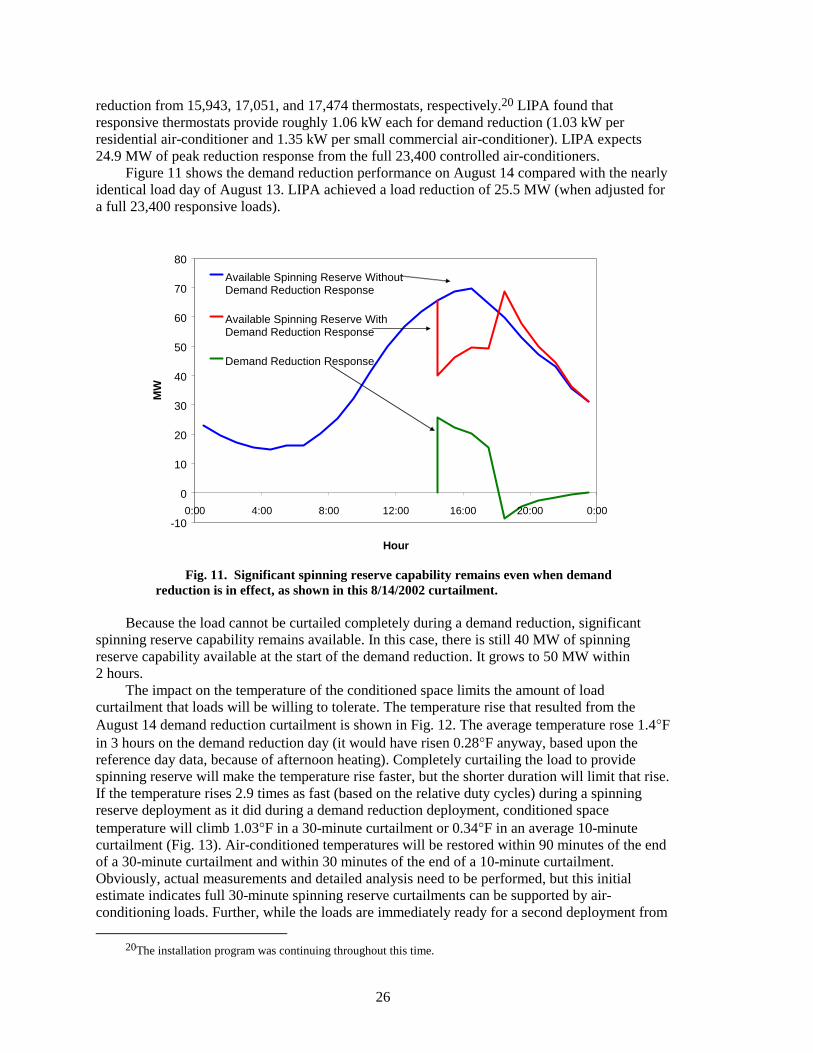
26
reduction from 15,943, 17,051, and 17,474 thermostats, respectively.20 LIPA found that responsive thermostats provide roughly 1.06 kW each for demand reduction (1.03 kW per residential air-conditioner and 1.35 kW per small commercial air-conditioner). LIPA expects 24.9 MW of peak reduction response from the full 23,400 controlled air-conditioners.
Figure 11 shows the demand reduction performance on August 14 compared with the nearly identical load day of August 13. LIPA achieved a load reduction of 25.5 MW (when adjusted for a full 23,400 responsive loads).
-10
0
10
20
30
40
50
60
70
80
0:00 4:00 8:00 12:00 16:00 20:00 0:00
Hour
MW
Available Spinning Reserve WithoutDemand Reduction Response
Available Spinning Reserve WithDemand Reduction Response
Demand Reduction Response
Fig. 11. Significant spinning reserve capability remains even when demand
reduction is in effect, as shown in this 8/14/2002 curtailment.
Because the load cannot be curtailed completely during a demand reduction, significant spinning reserve capability remains available. In this case, there is still 40 MW of spinning reserve capability available at the start of the demand reduction. It grows to 50 MW within 2 hours.
The impact on the temperature of the conditioned space limits the amount of load curtailment that loads will be willing to tolerate. The temperature rise that resulted from the August 14 demand reduction curtailment is shown in Fig. 12. The average temperature rose 1.4°F in 3 hours on the demand reduction day (it would have risen 0.28°F anyway, based upon the reference day data, because of afternoon heating). Completely curtailing the load to provide spinning reserve will make the temperature rise faster, but the shorter duration will limit that rise. If the temperature rises 2.9 times as fast (based on the relative duty cycles) during a spinning reserve deployment as it did during a demand reduction deployment, conditioned space temperature will climb 1.03°F in a 30-minute curtailment or 0.34°F in an average 10-minute curtailment (Fig. 13). Air-conditioned temperatures will be restored within 90 minutes of the end of a 30-minute curtailment and within 30 minutes of the end of a 10-minute curtailment. Obviously, actual measurements and detailed analysis need to be performed, but this initial estimate indicates full 30-minute spinning reserve curtailments can be supported by air-conditioning loads. Further, while the loads are immediately ready for a second deployment from
20The installation program was continuing throughout this time.
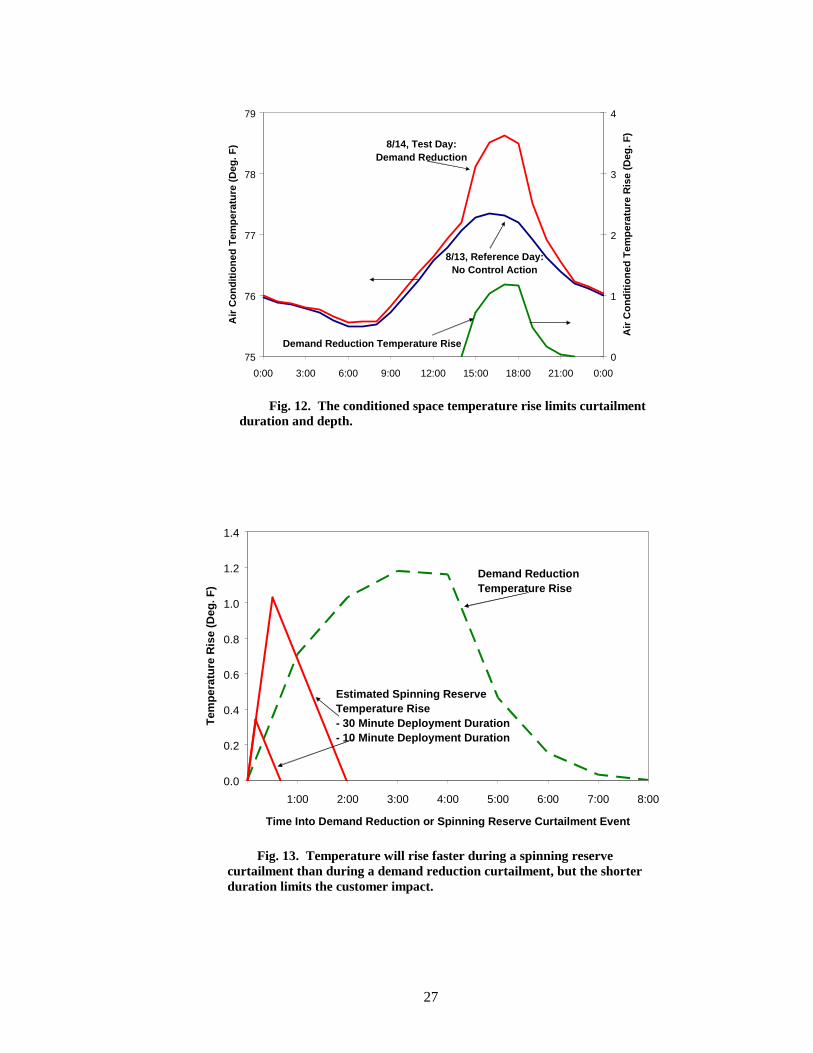
27
75
76
77
78
79
0:00 3:00 6:00 9:00 12:00 15:00 18:00 21:00 0:00
Air
Co
nd
itio
ned
Tem
per
atu
re (
Deg
. F)
0
1
2
3
4
Air
Co
nd
itio
ned
Tem
per
atu
re R
ise
(Deg
. F)
8/13, Reference Day:No Control Action
8/14, Test Day:Demand Reduction
Demand Reduction Temperature Rise
Fig. 12. The conditioned space temperature rise limits curtailment
duration and depth.
0.0
0.2
0.4
0.6
0.8
1.0
1.2
1.4
1:00 2:00 3:00 4:00 5:00 6:00 7:00 8:00
Time Into Demand Reduction or Spinning Reserve Curtailment Event
Tem
per
atu
re R
ise
(Deg
. F)
Demand Reduction Temperature Rise
Estimated Spinning Reserve Temperature Rise- 30 Minute Deployment Duration- 10 Minute Deployment Duration
Fig. 13. Temperature will rise faster during a spinning reserve
curtailment than during a demand reduction curtailment, but the shorter duration limits the customer impact.
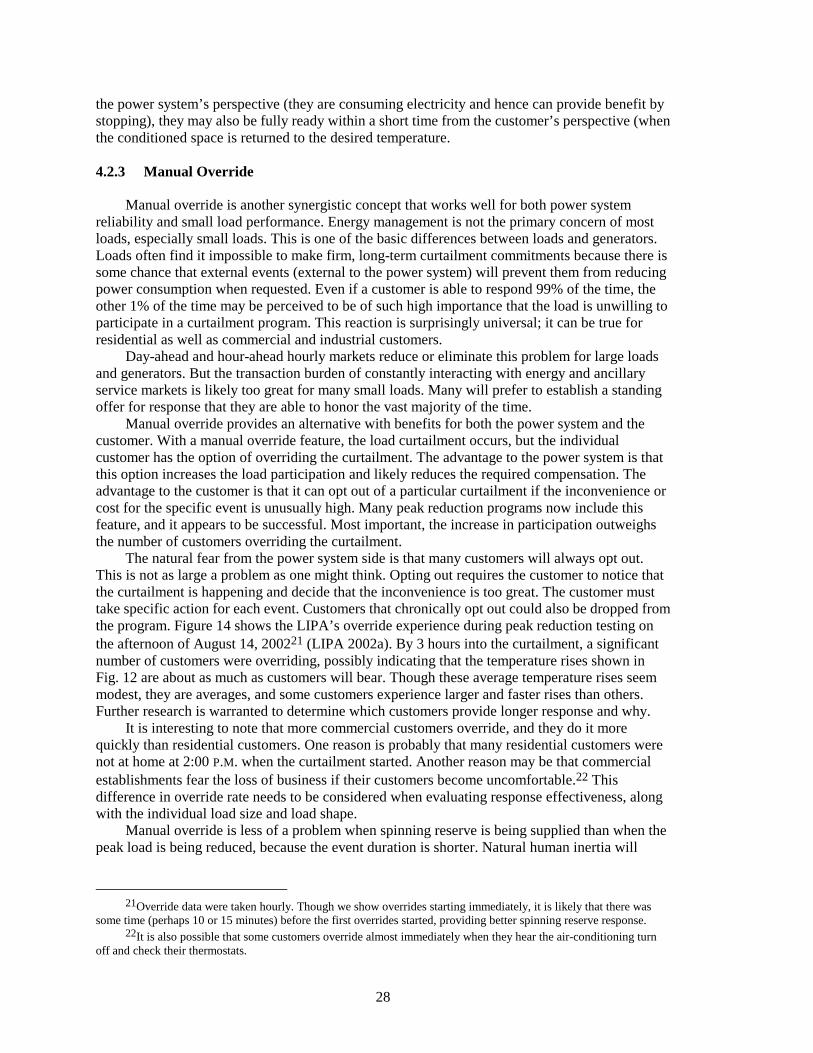
28
the power system’s perspective (they are consuming electricity and hence can provide benefit by stopping), they may also be fully ready within a short time from the customer’s perspective (when the conditioned space is returned to the desired temperature.
4.2.3 Manual Override
Manual override is another synergistic concept that works well for both power system reliability and small load performance. Energy management is not the primary concern of most loads, especially small loads. This is one of the basic differences between loads and generators. Loads often find it impossible to make firm, long-term curtailment commitments because there is some chance that external events (external to the power system) will prevent them from reducing power consumption when requested. Even if a customer is able to respond 99% of the time, the other 1% of the time may be perceived to be of such high importance that the load is unwilling to participate in a curtailment program. This reaction is surprisingly universal; it can be true for residential as well as commercial and industrial customers.
Day-ahead and hour-ahead hourly markets reduce or eliminate this problem for large loads and generators. But the transaction burden of constantly interacting with energy and ancillary service markets is likely too great for many small loads. Many will prefer to establish a standing offer for response that they are able to honor the vast majority of the time.
Manual override provides an alternative with benefits for both the power system and the customer. With a manual override feature, the load curtailment occurs, but the individual customer has the option of overriding the curtailment. The advantage to the power system is that this option increases the load participation and likely reduces the required compensation. The advantage to the customer is that it can opt out of a particular curtailment if the inconvenience or cost for the specific event is unusually high. Many peak reduction programs now include this feature, and it appears to be successful. Most important, the increase in participation outweighs the number of customers overriding the curtailment.
The natural fear from the power system side is that many customers will always opt out. This is not as large a problem as one might think. Opting out requires the customer to notice that the curtailment is happening and decide that the inconvenience is too great. The customer must take specific action for each event. Customers that chronically opt out could also be dropped from the program. Figure 14 shows the LIPA’s override experience during peak reduction testing on the afternoon of August 14, 200221 (LIPA 2002a). By 3 hours into the curtailment, a significant number of customers were overriding, possibly indicating that the temperature rises shown in Fig. 12 are about as much as customers will bear. Though these average temperature rises seem modest, they are averages, and some customers experience larger and faster rises than others. Further research is warranted to determine which customers provide longer response and why.
It is interesting to note that more commercial customers override, and they do it more quickly than residential customers. One reason is probably that many residential customers were not at home at 2:00 P.M. when the curtailment started. Another reason may be that commercial establishments fear the loss of business if their customers become uncomfortable.22 This difference in override rate needs to be considered when evaluating response effectiveness, along with the individual load size and load shape.
Manual override is less of a problem when spinning reserve is being supplied than when the peak load is being reduced, because the event duration is shorter. Natural human inertia will
21Override data were taken hourly. Though we show overrides starting immediately, it is likely that there was
some time (perhaps 10 or 15 minutes) before the first overrides started, providing better spinning reserve response. 22It is also possible that some customers override almost immediately when they hear the air-conditioning turn
off and check their thermostats.
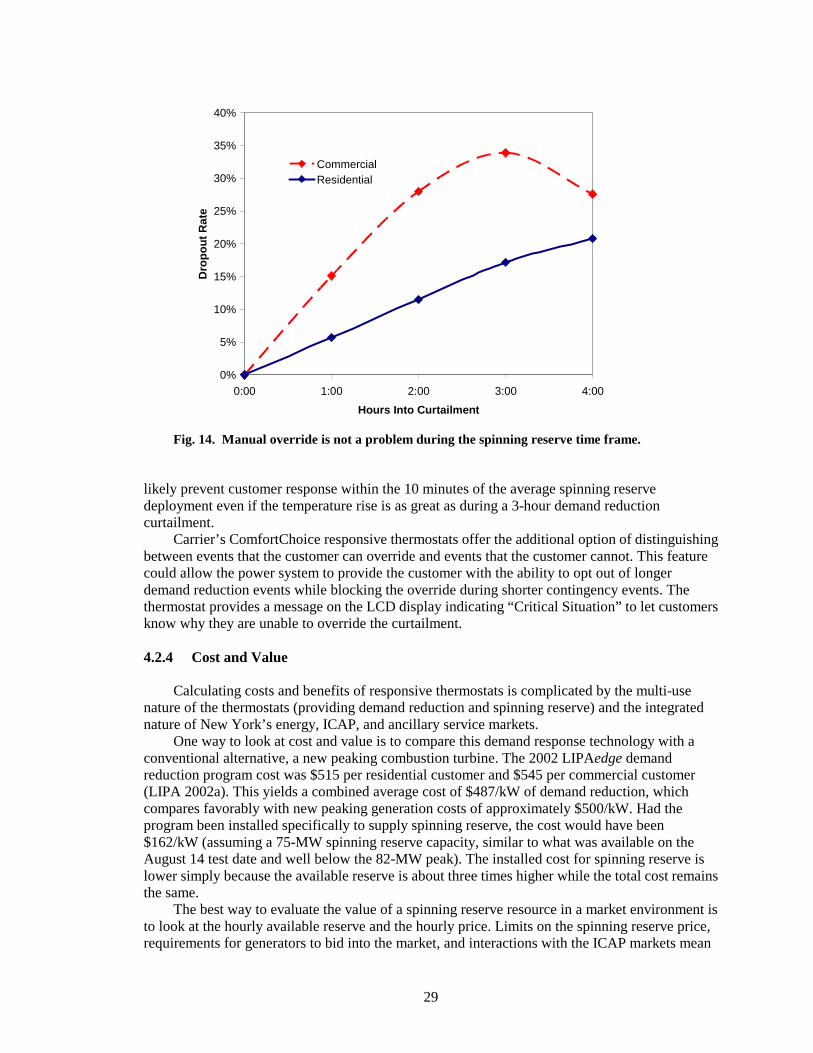
29
0%
5%
10%
15%
20%
25%
30%
35%
40%
0:00 1:00 2:00 3:00 4:00
Hours Into Curtailment
Dro
po
ut
Rat
e
CommercialResidential
Fig. 14. Manual override is not a problem during the spinning reserve time frame.
likely prevent customer response within the 10 minutes of the average spinning reserve deployment even if the temperature rise is as great as during a 3-hour demand reduction curtailment.
Carrier’s ComfortChoice responsive thermostats offer the additional option of distinguishing between events that the customer can override and events that the customer cannot. This feature could allow the power system to provide the customer with the ability to opt out of longer demand reduction events while blocking the override during shorter contingency events. The thermostat provides a message on the LCD display indicating “Critical Situation” to let customers know why they are unable to override the curtailment.
4.2.4 Cost and Value
Calculating costs and benefits of responsive thermostats is complicated by the multi-use nature of the thermostats (providing demand reduction and spinning reserve) and the integrated nature of New York’s energy, ICAP, and ancillary service markets.
One way to look at cost and value is to compare this demand response technology with a conventional alternative, a new peaking combustion turbine. The 2002 LIPAedge demand reduction program cost was $515 per residential customer and $545 per commercial customer (LIPA 2002a). This yields a combined average cost of $487/kW of demand reduction, which compares favorably with new peaking generation costs of approximately $500/kW. Had the program been installed specifically to supply spinning reserve, the cost would have been $162/kW (assuming a 75-MW spinning reserve capacity, similar to what was available on the August 14 test date and well below the 82-MW peak). The installed cost for spinning reserve is lower simply because the available reserve is about three times higher while the total cost remains the same.
The best way to evaluate the value of a spinning reserve resource in a market environment is to look at the hourly available reserve and the hourly price. Limits on the spinning reserve price, requirements for generators to bid into the market, and interactions with the ICAP markets mean
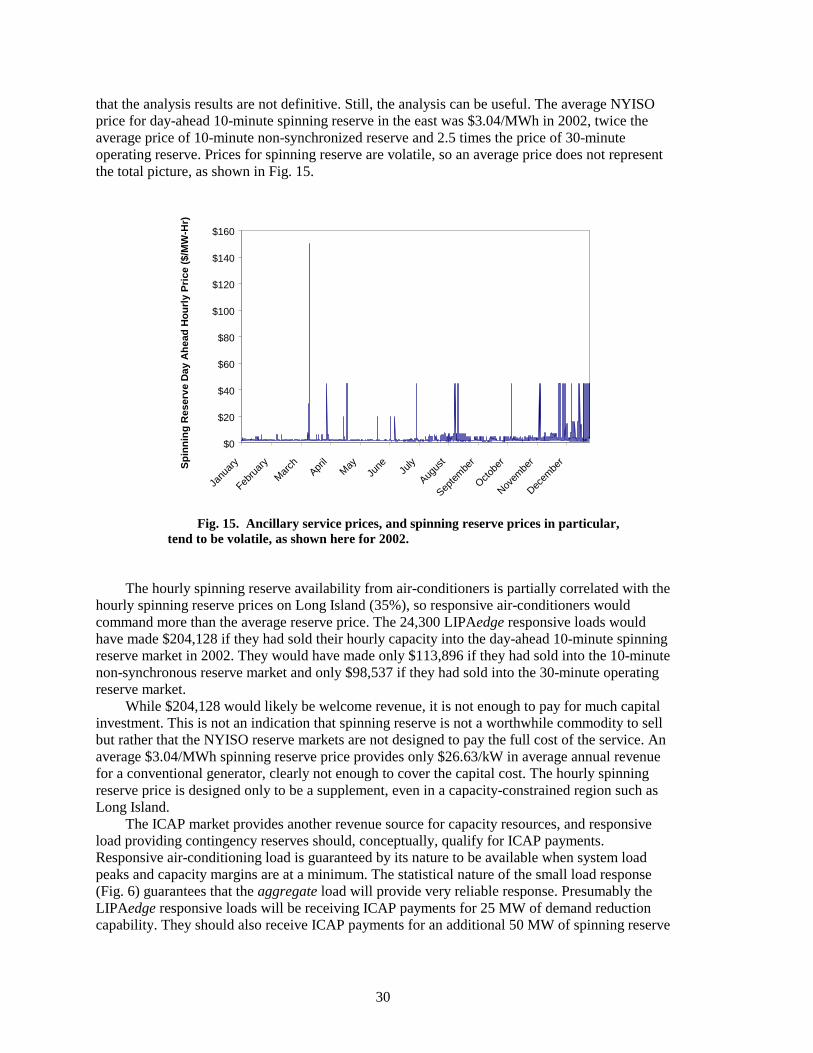
30
that the analysis results are not definitive. Still, the analysis can be useful. The average NYISO price for day-ahead 10-minute spinning reserve in the east was $3.04/MWh in 2002, twice the average price of 10-minute non-synchronized reserve and 2.5 times the price of 30-minute operating reserve. Prices for spinning reserve are volatile, so an average price does not represent the total picture, as shown in Fig. 15.
$0
$20
$40
$60
$80
$100
$120
$140
$160
Janu
ary
Febru
ary
Mar
chApr
ilM
ayJu
ne July
Augus
t
Septe
mbe
r
Octobe
r
Novem
ber
Decem
berS
pin
nin
g R
eser
ve D
ay A
hea
d H
ou
rly
Pri
ce (
$/M
W-H
r)
Fig. 15. Ancillary service prices, and spinning reserve prices in particular,
tend to be volatile, as shown here for 2002.
The hourly spinning reserve availability from air-conditioners is partially correlated with the hourly spinning reserve prices on Long Island (35%), so responsive air-conditioners would command more than the average reserve price. The 24,300 LIPAedge responsive loads would have made $204,128 if they had sold their hourly capacity into the day-ahead 10-minute spinning reserve market in 2002. They would have made only $113,896 if they had sold into the 10-minute non-synchronous reserve market and only $98,537 if they had sold into the 30-minute operating reserve market.
While $204,128 would likely be welcome revenue, it is not enough to pay for much capital investment. This is not an indication that spinning reserve is not a worthwhile commodity to sell but rather that the NYISO reserve markets are not designed to pay the full cost of the service. An average $3.04/MWh spinning reserve price provides only $26.63/kW in average annual revenue for a conventional generator, clearly not enough to cover the capital cost. The hourly spinning reserve price is designed only to be a supplement, even in a capacity-constrained region such as Long Island.
The ICAP market provides another revenue source for capacity resources, and responsive load providing contingency reserves should, conceptually, qualify for ICAP payments. Responsive air-conditioning load is guaranteed by its nature to be available when system load peaks and capacity margins are at a minimum. The statistical nature of the small load response (Fig. 6) guarantees that the aggregate load will provide very reliable response. Presumably the LIPAedge responsive loads will be receiving ICAP payments for 25 MW of demand reduction capability. They should also receive ICAP payments for an additional 50 MW of spinning reserve

31
capability.23 In 2001 the auction price for ICAP/special case resource load reduction was $10,833/MW for the 6-month summer period. Prices were lower in 2002 at $6000/MW for the 6-month summer period. ICAP payments could add $300,000 per year to the $204,128 for sale of spinning reserve for a total of $504,128 annual revenue.
23The exact amount of capacity credit depends on exactly when the capacity is assessed. The 50 MW quoted here
was the additional spinning reserve capacity available when the load peaked during the 8/14 demand reduction deployment.
33
5. ISSUES, CONCERNS, AND QUESTIONS
A number of issues remain. These generally require a combination of technical, regulatory, and business solutions. Three that were not previously discussed are briefly mentioned here. 5.1 FORECASTING RESPONSE
Unlike conventional generation, the availability of responsive load is generally not flat or
schedulable. There is reason to believe that it can be accurately forecast, however. Forecasting reserve availability from responsive loads is similar to conventional load forecasting. It is both easier and more difficult to forecast responsive loads compared with forecasting total load. It is easier because the responsive loads are more uniform (thousands of air-conditioners). All of the individuals in an aggregation are driven by the same weather, time, and day-of-the-week factors. While it is hoped that there will eventually be many types and sizes of responsive loads, there will still be less diversity in this group compared with total load. Forecasting responsive load is also easier because it does not have to be as accurate. A 10% error in a conventional load forecast is a problem because the error may be larger than the entire reserve.24 A 10% error in a load response forecast is not as large a problem because this is less than 10% of the entire reserve.25 Also, with continuous performance monitoring, responsive load forecasts will get better with time. Finally, responsive load forecast errors are likely to trend in a beneficial direction. The actual reserve will tend to be greater than the forecast reserve at times when the overall load is also higher than expected and greater amounts of reserve are required (hotter than expected summer afternoons, for example). Similarly, when available responsive load is less than forecast, it is likely that overall load is also lower than expected (and more excess generation is available) and reserve requirements are reduced (cooler than expected summer afternoons, for example). The accuracy and/or importance of these speculations are not yet known, but they could be investigated as responsive loads are monitored over time.
5.2 SPINNING RESERVE REVENUE
Spinning reserve markets do not currently provide adequate price signals to motivate
appropriate investment. For most hours of the year, this may be understandable; when excess generation is available, the capital cost is sunk and the reasonable bid price is very low. But at times of system peak loading, contingency reserve requirements are just as important as the actual load because they contribute equally to the overall capacity requirement. Similarly, spinning reserve capacity contributes equally to meeting the system capacity requirements. Even if a resource is only capable of delivering spinning reserves, its capacity value should be appropriately compensated.
Long Island and metropolitan New York are capacity-constrained regions. William Museler, president and chief executive officer of NYISO, was quoted in the March 3, 2003, Energy Daily as saying, “Despite the forecast for this summer, New York still needs to focus on getting new generators sited and built on an expedited basis. New York’s electric demand continues to rise
24The average absolute hour-ahead forecast error for the California ISO load was 1.3% in 2002. The average
day-ahead forecast error was 1.9%. 25A 10% forecast error for a 25,000-MW load is a 2,500-MW problem for the ISO. If responsive load is
providing half of the 700-MW spinning reserve requirement and the forecast is in error by 10%, the result is a 35-MW problem for the ISO. That is not a trivial amount, but much less than the problem created by the overall load forecast error. The system operator could easily call for 110% response from responsive load if a 10% error were found to be typical.
34
and shows little sign of abating. Unless significant generating capacity is added to the system—and soon—demand is going to overwhelm supply and reliability will be at risk.”
Each 1 MW of spinning reserve provided by responsive air-conditioning load reduces the capacity requirements by 1 MW, because the response is inherently guaranteed to be available when the system load peaks. Contingency reserve market payments, ICAP payments, opportunity cost payments, and the full range of compensation available to generators should be examined to determine how responsive loads should be compensated to ensure equitable treatment. This should not be done just because it would be fair to the responsive loads (though that is a legitimate reason). It should be done to maximize the resources available to the power system and to reduce overall costs for all users of the power system.
5.3 FREQUENCY RESPONSE
NERC policies and industry requirements concerning contingency reserves and frequency
response are in a state of flux. Clearly, the power system requires frequency-responsive reserves. System frequency deviates whenever there is a mismatch between generation and load. A severe transmission or generation contingency will result in a large generation/load mismatch. The consequent shift in frequency is observable anywhere in the power system. Communication between the system operator and the generator or responsive load is not needed—the system frequency change can be detected locally. This is fortunate because response must be very rapid to be useful—within cycles and seconds rather than minutes. This is the immediate response that prevents the power system from collapsing.26 Loads can be an excellent frequency-responsive resource, in some ways better than generators.
Generators are required to have frequency-responsive governors, typically with a 0.036-Hz dead band and a 5% droop. This means that generator controls ignore frequency deviations between 59.964 and 60.036 Hz. For frequency deviations beyond that, the generator governor is to call for an increase (or decrease) of 100% of rated output for a 3-Hz (5%) shift in frequency. Several factors are important here. First, a 3-Hz shift in system frequency is unthinkable. Total collapse of the system is probably unstoppable if system frequency reaches 57 or 63 Hz. Second, the governor response speed requirements are not clear. The California ISO requires governors to detect frequency within 1 second, while NERC uses 20 cycles in some references and one minute in others. Third, generators are only required to provide full spinning reserve response in 10 minutes. So while the governor may respond quickly, the generator’s full response will lag.
Loads are better and worse at providing frequency response: better because they can provide full response and provide it essentially instantaneously, limited only by the response speed of the detection relay: worse because they do not, individually, provide continuous and reversible response. Having different individual loads respond at different frequencies can simulate continuous droop response.
The real concern is that the rules governing which resources (spinning reserve resources, generators under AGC, or some other designation) must supply frequency response are not clear and appear to be changing. Loads typically do not have a reason to respond to system frequency deviations in the governor range, though the capacity could be added, often for only $1–$10 per load. So while loads could be a valuable frequency response resource, that capability will not be included in load controllers until there are clear requirements and specifications.
26The “natural” frequency response of synchronous generators and motor loads that couples the energy stored in
the inertia of rotating equipment to the power system also helps in the very short stability time frame.
35
6. CONCLUSIONS AND RECOMMENDATIONS Responsive load has the potential to be a more reliable and lower-cost supplier of
contingency reserves, especially spinning reserve. This report provides detailed results from one example technology, the Carrier ComfortChoice responsive thermostats deployed in the LIPAedge program to provide peak demand reduction through central control of residential and small commercial air-conditioners. Preliminary analysis indicates that these responsive loads could be excellent providers of spinning reserve. Roughly three times the load reduction capacity is available for contingency events (75 MW) as is available for peak reduction (25 MW); two-thirds of the capacity (50 MW) is still available to supply spinning reserve when the loads are already curtailed for peak reduction. This added spinning reserve capability is currently available and should be utilized (tested) during the summer of 2003. Large numbers of these responsive thermostats have also been deployed by ConEd, SCE, and SDG&E and are similarly good candidates for immediate use and testing.
The preliminary analysis shows that load response is likely to be faster and more effective than generation response for providing spinning reserve. Commands are received and response typically completed in 90 seconds as compared with 10 minutes for generation. Extensive testing and monitoring should be conducted before and throughout the summer.
There are two areas where this technology does not currently meet strict interpretations of spinning reserve requirements: monitoring speed and frequency response. Frequency response capability could be added relatively cheaply, for perhaps $1–$10/device for equipment not yet installed. All of the signals and expensive control equipment are already there. But this capability will not be added unless manufacturers see that there is a real demand and that response specifications are established and stable. NERC, NPCC, NYSRC, and the NYISO need to decide if frequency response is a spinning reserve requirement or an AGC requirement.
Real-time supervisory control and data acquisition monitoring (2–8 seconds) is the only requirement that is fundamentally difficult to meet. To avoid overwhelming the paging network, responses from individual units must be staggered when the entire system is being polled. It can take 90 minutes for 20,000 units to respond. But unlike large generators that can completely fail to respond because of an equipment problem at the generator, it is unlikely that 20,000 individual air-conditioners will fail simultaneously. The communication backbone could fail, but that can be monitored separately at any rate desired. Monitoring requirements that are appropriate for an aggregation of small resources need to be established.
LIPA should begin discussions with NYISO immediately to determine what additional research and analysis is needed to allow this responsive load to supply 10-minute spinning reserve and obtain ICAP and hourly spinning reserve payments for the service. If necessary, an exception to NYSRC rules should be requested to allow LIPAedge response to be tested as spinning reserve during the summer of 2003.

37
ACKNOWLEDGEMENT
The author gratefully acknowledges the funding for this project provided by the Assistant Secretary for Energy Efficiency and Renewable Energy, Office of Power Technologies, Transmission Reliability Program, of the U. S. Department of Energy. I also thank Alex Nyilas and LIPA for access to LIPAedge data; Joseph Lopes and Michael Marks of Applied Energy Group for supplying data from the LIPAedge program and for discussions on how the program works; and Ray Archacki, Lauren Kolb, and Pete Pierret of Carrier Corporation for extensive discussion on the details of the ComfortChoice Thermostat, the communication infrastructure that supports it, and ways to expand the capabilities to support spinning reserve. Particular thanks go to Henry Yoshimura of ISO New England, Eric Hirst of Consulting in Electric-Industry Restructuring, Peter Douglas of New York State Energy Research and Development Authority, Joe Eto of Lawrence Berkeley National Laboratory, and Mark Kinter-Meyre of Pacific Northwest National Laboratory for extensive technical and editorial comments. I would also like to thank Susan Johnsen, Brenda Smith, and Deborah Counce for their assistance in editing and preparing this report.

39
REFERENCES
1. Carrier 2002. www.carrier.com, www.mytstat.com, Carrier Corporation, Farmington, Connecticut.
2. FERC (U.S. Federal Energy Regulatory Commission) 2002a. Notice of Proposed Rulemaking: Remedying Undue Discrimination through Open Access Transmission Service and Standard Electricity Market Design, Docket No. RM01-12-000, Washington, D.C., July 31.
3. Hirst, E., and B. Kirby 1997. Ancillary-Service Details: Operating Reserves, ORNL/CON-452, Oak Ridge National Laboratory, November.
4. Kirby, B., and J. Kueck 2000. How Buildings Can Prosper by Interacting with Restructured Electricity Markets, American Council for an Energy-Efficient Economy, Washington, D.C., August.
5. Kolb, L., R. Archacki, and P. Pierret 2002. Private discussions with Carrier personnel. 6. LIPA (Long Island Power Authority) 2002a. LIPAedge, presentation to the New York
Independent System Operator Price-Responsive Load Working Group, November 21. 7. LIPA (Long Island Power Authority) 2002b. Data supplied through Applied Energy
Group. 8. NYISO (New York Independent System Operator) 1999. NYISO Ancillary Services
Manual, New York Power Pool/New York Independent System Operator, Schenectady, New York, July 15.
9. NYISO (New York Independent System Operator) 2003. www.nyiso.org, New York Independent System Operator, Albany, New York.
10. NYSRC (New York State Reliability Council) 2001. New York Control Area Installed Capacity Requirement for the Period May 2002–April 2003, Binghamton, New York, December 14.
11. NYSRC (New York State Reliability Council) 2002. NYSRC Reliability Rules for Planning and Operating the New York State Power System Revision 5, Binghamton, New York, November 12.
12. NERC (North American Electric Reliability Council) 2002. NERC Operating Manual, Princeton, New Jersey, November 21.
13. NPCC (Northeast Power Coordinating Council) 2002a. NPCC Glossary of Terms, Document A-7, New York, November 14.
14. NPCC (Northeast Power Coordinating Council) 2002b. Operating Reserve Criteria, Document A-06, New York, November 14.