Embed Size (px)
Citation preview
Acre mefall. Vol. 33, No. 4, pp. 539-543, 1985 COOl-6160 85 53.00 + 0.00 Printed in Great Britain. All rights reserved Copyright g 1985 Pergamon Press Ltd
SPINODAL ORDERING IN Ni,Mo
J. MAYER and K. URBAN Max-Planck-lnstitut fiir Metallforschung, Institut fib Physik, Postfach 800 665, 7000 Stuttgart 80, F.R.G.
and Universitiit Stuttgart, Institut fIir Theoretische und Angewandte Physik. Pfaffenwaldring 57, 7000 Stuttgart 80, F.R.G.
(Received 24 November 1984)
AbWract-The evolution of the {I i O} order structure in Ni,Mo is studied in a high-voltage electron microscope by means of electron- diffraction. In material disordered by low-temperature electron irradiation this structure forms. at 200 K Q T C 1020 K. directly out of the disordered state. At very high temperatures, where the alloy is in the z-phase, { 1 f 0) order fluctuations are observed. These observations confirm the assumption of the spinodal ordering theory that the { 1 f 0) structure is related to a minimum of the free energy of mixing for very small degrees of order. From the increase in {I f 0) reflection intensity during stenwise coolina from 1230 K the sninodal temperature of the : I 4 0) structure can be determined to (1 ij0 i 30) K. -
RCmuaCNous avons CtudiP par diffraction tlectronique dans un microscope a haute tension I’tvolution des structures ordonnees { 1 f 0) dans Ni,Mo. Dans le mat&au desordonne par irradiation ilectronique B basse temp&rature, cette structure se forme directement a partir de I’etat desordonne pour 200 K < T d 1020 K. Aux tres hautes temptratures, od I’alliage est en phase z. on observe des fluctuations d’ordre { I i O}. Ces observations confirmem I’hypothese de la theorie de la mise en ordre spinodale selon iaquelle la structure { 1 f 0) est Ii&e P un minimum de l’energie libre de melange pour les tres faibles degres d’ordre. A partir de I’augmentation de I’intensite de la reflexion (1 i 0) au tours d’un refroidissement par etapes depuis I230 K, on montre que la temperature spinodale de la structure { 1 4 0) est 1150 + 30 K.
--Die Ausbildung der {I f O}-Ordnungsstruktur in Ni,Mo wird in einem Hochspan- nungselektronenmikroskop mit Hilfe der Elektronenbeugung untersucht. In Material, das durch Tieftemperatur-Elektronenbestrahlung entordnet wurde, bildet sich diese Struktur im ganzen Bereich von 200 K C T G 1020 K unmittelbar aus dem ungeordneten Zustand. Bei sehr hohen Temperaturen, bei denen sich die Legierung in der z-Phase befindet, werden { 1 4 O}-Ordnungsfluktuationen beobachtet. Diese Beobachtungen bestitigen die Annahme der Theorie d& spinodalen Ordnungseinstellung. dass die (1 f O}-Stntktur einem Minimum der freien Mischungsenergie bei sehr kleinen Ordnungsgraden entspricht. Aus dem Anstieg der lntensitiit der { 1 f O}-Reflexe beim schrittweisen Abkiihlen von 1230 K hisst sich die Spinodaltemperatur der { 1 f O}-Struktur zu (1150 + 30) K bestimmen.
1. INTRODUCTION
The development of structural order in Ni,Mo has been the subject of numerous investigations [e.g. l-51. At high temperatures the structure of this alloy is disordered f.c.c. Below the critical temperature, T,, of 1140 K it develops, in a phase transition of the first kind, the Dl, structure. In a diffraction pattern, this gives rise to superstructure reflections of the type f{4 2 0). It was first reported by Spruiell and Stans- bury [1] that by rapid cooling the transition to Dl, can be suppressed and that instead diffraction in- tensity is observed at { 1 f 0) positions?. This indicates that a structure has formed which is different from that of the equilibrium ordered phase. This obser- vation was explained by de Fontaine [6] as a result of spinodal ordering.
In a phase diagram a spinodal line marks the limit between the region where an alloy is stable or metas-
tBy the notation { 1 i 0} and i {4 2 O} we mean all equivalent positions obtained by shtft operations according to the translational and rotational symmetry of the reciprocal lattice.
table and the region where it is unstable with respect to a phase transition. Well known is the spinodal decomposition in alloys with clustering tendency [7]. Starting from earlier work by Cook er al. [8] de Fontaine [6] applied the concept of a spinodal change of state to ordering alloys. Accordingly, at tem- peratures lower than the spinodal temperature T,,, the disordered state is unstable and, without nucleation, a transition occurs to a certain ordered phase. This is called spinodal ordering.
According to Khachaturyan [9] structural order can be described by means of static concentration waves whose wave vectors, k, are located close to the Brillouin zone boundary of the disordered crystal. These waves describe the local variation of the proba- bility to find a lattice site occupied by a certain atom species. In order to apply the spinodal ordering theory to Ni,Mo a basic assumption is made. This is that, or loa degrees of order, the free energy of the { 1 f 0) waves is lower than that of any other type of concentration waves (including those waves which describe the Dl, structure). Adopting a mean-field free energy model de Fontaine [6] could show that in this case the spinodal temperature of the { 1 i 0) waves
539 A.M 33,4-A

540 MAYER and URBAN: SPINGDAL ORDERING IN Ni,Mo
is higher than that of all other concentration waves. Therefore, if by fast cooling the nucleation of the Dl, ordered phase is suppressed. the { 1 f 0} waves form and are amplified as soon as the temperature falls below their spinodal temperature.
Experimental scrutiny of the spinodal-ordering model proved to be problematic since the non- equilibrium states involved are difficult of access. Recently Banerjee ef al. (lo] succeeded in demonstra- ting that the { 1 i 0) concentration waves form out of the entirely disordered state and that the driving force for the formation of this structure is, at low degrees of order, higher than that of the Dl, structure. In these experiments the non-equilibrium states were produced by means of electron irradiation damage in a high-voltage electron microscope (HVEM) and studied in situ by electron diffraction. Also in this work the spinodal temperature of the !, {4 2 0) waves could be determined. A value of about 800K was found. However, the { 1 f 0) spinodal turned out not to be accessible. This was due to specimen oxidation at the high temperatures required for such an in- vestigation.
In the meantime we have equipped the specimen chamber of our HVEM with an ultra-high vacuum system, It allows heat treatments in situ at tem- peratures up to 1300 K without changes in specimen quality resulting from rest-gas reactions. This makes it possible to observe order fluctuations above the critical temperature and to study the evolution of concentration’waves during cooling. Thereby it be- comes feasible to determine the position of the { 1 f 0) ordering spinodal.
2. EXPERIMENTAL
The Ni-20 at.% MO alloy was produced from 99.99% nominally pure starting materials in an evac- uated arc furnace backfilled with argon. The resulting ingot was homogenized at 1400 K for 200 h in argon- filled silica capsules. Foils 180 pm thick were then produced by rolling. They were recrystallized at 1600 K in ultra-high vacuum and then rapidly cooled to room temperature by switching off the heating current. Samples for electron microscopy were elec- tropohshed in a solution of 50ml HClO, in 950ml CHJOOH.
We are reporting here on two kinds of experiments. In the first the samples were irradiated at 140 K in the HVEM with 1 MeV electrons in order to produce the completely disordered state [IO]. Subsequently they were heat treated in siru at temperatures up to 12OOK. The resulting structure changes were ob- served simultaneously by means of electron diffraction. At absolute temperatures, T, lower than 800 K thermal atom transport is virtually frozen out since the vacancy concentration becomes very low. In order to obtain also at lower temperatures a sufficient atom mobility the samples were (at all temperatures but 1200 K) irradiated with 1 MeV electrons (current
density about 1.5 x 1024es-’ me*). The atomic de- fects created by the irradiation render possible radiation-enhanced atom transport down to about 200K.
For the observations during the second type of experiment an electron energy of 400 keV was chosen. It is lower than the threshold energy for the pro- duction of atomic defects. To begin with, the samples were transferred to the z-phase by heating to 1230 K. Subsequently they were cooled in steps down to 860 K. At each step the electron diffraction pattern was, after a holding time of about 90 s, recorded on photographic film. Then the samples were heat treated at 1100 K until well developed Dl, super- structure reflections were visible. Finally, the samples were slowly heated up and the nominal temperature was determined at which these reflections disap- peared. This allowed us to calibrate our temperature measurements (carried out by means of a thermo- couple located in the specimen holder) to better than &- 10 K using the Dl, critical temperature as a reference.
For the diffraction patterns the incident electron beam was chosen to be parallel to a (1 0 0] crystal axis. The photographs were taken at constant total intensity and exposure time. They were evaluated by means of a densitometer. Measured was the { I{ 0) peak intensity. Afterwards the inelastic background intensity was subtracted.
3. EXPERIMENTAL RESULTS
Figure l(a) shows the diffraction pattern after electron irradiation at 14OK. Only the fundamental reflections are visible (compare Fig. 2) i.e. the sample is completely disordered. Figure lb shows the diffraction pattern after 60 s at 870 K. { 1 4 01 concen- tration’ waves have formed. Figure l(c) shows the pattern after additional 240s at the same tem- perature. The { 1 f 0) waves have disappeared almost completely and the Dl, structure was formed. Figure l(d) shows the diffraction pattern after heating to 12OOK. Passing the critical temperature of 1140 K the Dl, structure has disappeared. The resulting a-phase shows order fluctuations of { 1 $0) type.
The formation and amplification of { 1 f 0) concen- tration waves in disordered samples was observed from 200K on and up to 1020 K. This was the highest temperature which could be reached sufficiently rapidly to avoid Dl, nucleation already during heating up. It then depends on temperature to what extent the { 1 f 0) structure can survive during further heat treatment. At T < 550 K the { 1 f0, structure persists. At 550 K f T Q 850 K j{4 2 0) waves evolve at a later stage and eventually an intermediate state is formed which is characterized by diffraction intensity at { 1 f 0) and i {4 2 0) positions as well as in between. At T 2 850 K the transition to Dl, is complete.
Figure 3 shows in arbitrary units the {l f 0) in-

MAYER and URBAN: SPINODAL ORDERING IN N&MO 541
Fig. 1. Electron diffraction pattern along [ 1 0 0] zone axis. The different types of reflections are explained in Fig. 2. (a) Disordered state after I MeV electron irradiation at 140 K. Only fundamental reflections are visible. (b) After heat treatment at 870 K for 60 s. The (I ! 0) structure has formed. (c) After 300 s at 870 K. The {I f 01 structure has disappeared almost completely and the Dl, structure has evolved. (d) After warming up to 1200 K. Diffuse intensity at (I i 0) positions indicates order fluctuations. Pictures (a) to
(c) were taken at an electron energy of I MeV. (d) was taken at 400 keV.
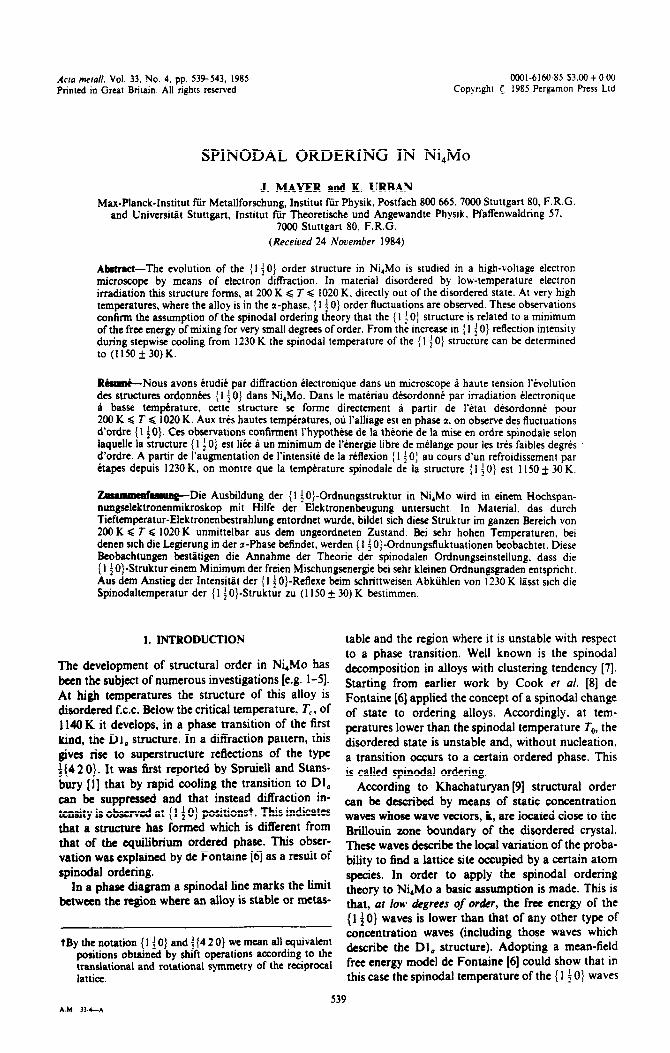
ten&y as a function of temperature during cooling from the z-phase region. The different symbols refer to four experiments using different samples. The plotted data were obtained in the following way. A third-order polynomial was fitted to each individual set of experimental data by the least squares method. Subsequently the measured values were multiplied by a scaling factor in such a way that all four poly- nomials yielded the same result at 1000 K. This allows to compensate for systematic intensity differ- ences among the four sets of diffraction patterns.
We see that (1 40) intensity can be detected up to 1230 K, the highest temperature studied. As the temperature decreases the intensity increases, slowly at first but at T < 1100 K quite rapidly.
4. DISCUSSION
At the beginning of this section we give a brief summary of those results of the spinodal ordering
0 0 00°
0
O0 OIfi o”o
0 0 OOO
0
O0 0 000
0 0 Fig. 2. Schematic representation of diffraction pattern along [IOO] zone axis. Large circles indicate fundamental f.c.c. reflections. Small circles refer to Dl, superstructure reflections of the type ! (4 2 0;. Small squares denote
reflections of type {I ;I 0;.
theory [6] which are required in the discussion of the reported observations.
Close to the critical temperature the order- dependent part of the configurational free energy of mixing can be written as a Landau expansion in powers of the generalized order parameter q
AF=Ar$+Br/‘+Crf+ (1)
q is proportional to the concentration wave ampli- tude. The coefficients A, B and C depend on wave vector. temperature and alloy composition. Further- more, B is identically zero fork = { 1 i 0) but non-zero and negative for k = 4{4 2 0). Independent of wave vector. C is positive.
150 NI -200t % MO
50
0
Temperature ( K)
Fig. 3. (1 4 0) intensity in arbitrary units as function of temperature during cooling from 1230K. The different symbols denote data obtained in four experiments using different samples. Drawn is the extrapolation curve accord- ing to equation (5). The broken curve results from a least-squares fit of a third-order polynomial to the entirety of the data points. At T < 1020K the values of this polynomial deviate by less than 5”, from the full curve.

542 MAYER and URBAN: SPINODAL ORDERING IN Ni,Mo
For small concentration wave amplitudes, i.e. close to the disordered state (‘1 = 0), terms of higher than second order in q can be neglected. Then AF is minimized by that wave vector for which A takes its minimum value. A is given by
A(k) = N,.[21/@ + k,T/C,JJ2. (2)
Here N,, denotes the number of atoms per unit volume, k, is Boltzmann’s constant, and C, and Cnr are the atom fractions of the two alloy constituents N and M. Y(k) is N, times the Fourier transform of the pair interaction function given by
0 (r) = [u&r) + uMM (r) - 2u,, @)I/2 (3)
where uii is the energy of an (ij) atom pair with the members of the pair separated by the lattice vector r.
By symmetry requirements the extrema of V(k) are located at the Wyckoff special points of the reciprocal lattice [I 11. Among the four special points in the f.c.c. Brillouin zone is { 1 f 0) but not f(4 2 0). It was postulated by de Fontaine [6] that { 1 5 0} provides the absolute minimum of VT. This means that, at low degrees of order or small concentration wave ampli- tudes, the free energy of the { 1 f 0} waves is lower than that of any other type of wave including ff420).
The spinodal temperature, T,, is that temperature below which AF takes negative values for infinitesimally small values of q. At T,, we have d*AF/dtr* = 0 or A(k) = 0. Thus equation (2) yields
T,(k) = -2V00(C,C,lk,). (4)
For each wave vector k this equation describes a spinodal line in the temperature-composition dia- gram. Supposing that V takes its minimumj for k = { 14 0) the spinodal for this wave vector must lie at temperatures higher than those belonging to all other wave vectors. At a temperature T < T,-, the driving force for amplification of the concentration wave amplitude is proportional to the supercooling (T,, - T). Since the { 1 f 0} waves possess the highest value of T,, the driving force for their formation surpasses that of all other waves. Therefore it is expected that they are preferentially formed and amplified even under conditions where the tem- perature is lower than the spinodal temperature of other waves.
We produced the disordered state by irradiation with high-energy electrons at 140K [Fig. l(a)]. At this temperature all kinds of atom transport are frozen out. Warming up to the temperatures where radiation-induced and/or thermal atomic defects are
tThe function V(k) possesses the symmetry of the reciprocal lattice. Thus equivalent minima exist at all points be- longing to the star of the vector k. This star consists of all those vectors which transform into one another by the symmetry operations of the space group of the reciprocal lattice.
$Since there V is negative this means that it takes the largest negative value.
mobile we observed the formation of { 1 f 0) concen- tration waves in the initially disordered material [Fig. l(b)]. This confirms the assumption [6] that, for low degrees of order, this structure corresponds to a minimum in the free energy. We observed its evo- lution (at the higher temperatures at least in the initial stage of ordering) up to 1020 K. From this it can be concluded that the appropriate spinodal temperature lies above this value.
At higher degrees of order, in equation (1) terms of higher order in 9 can no longer be neglected. Since the cubic term is zero for k = { 1 f 0) but non-zero and negative for f{4 2 0) the Dl, structure becomes ener- getically more favourable. Therefore, the alloy adopts eventually the equilibrium structure [Fig. I(c)].
Another case where r) is small is found at very high temperatures, i.e. above the critical temperatures r, and To. Under these conditions AF is always positive but this does not exclude order fluctuations. Accord- ing to Clapp and Moss [ 121 the fluctuation amplitude and the diffuse scattering intensity take their max- imum for that value of k for which V adopts its absolute minimum. Figure l(d) shows the diffraction pattern after warming up to T > T,. Corresponding to the V(k)-minimum diffuse intensity is observed at { 1 4 0) positions.
On account of the Clapp-Moss fluctuations the { 1 f 0) spinodal temperature can only be extracted from the intensity data in Fig. 3 by extrapolation from low temperatures. A suitable relation can be derived from equations (1) and (2) introducing E = 0 and C cc T [6]. In order to find the equilibrium values of r~ as function of temperature we look for the position, Q, of the AF-minima. For these we obtain the relation
~2 = const[(T,/T) - I], for T < T,,. (5)
Under kinematical diffraction conditions the in- tensity of superstructure reflections, I(k), is propor- tional to ~2 [9]. In electron diffraction this holds if Z(k) is much lower than the intensity of the neigh- bouring fundamental reflections [13]. In our experi- ments this prerequisite is fulfilled [see Fig. l(b) and
WI. The broken curve in Fig. 3 results from a least
squares fit of a single third-order polynomial to the entirety of the data points (860 K d T < 1230 K). Below 1020 K the values of this polynomial deviate by less than 5% from the full curve. This curve depicts the intensity according to equation (5) assuming I(k) a qf. The constant and the value of To were chosen in such a way that the deviations from the mentioned polynomial took a minimum. The extra- polation yields a temperature of 1150 K. On account of the scatter in the data points we have to allow for an error margin of +20 K. To this the error margin of the temperature measurement of + 10 K has to be added. Thus we obtain for the spinodal temperature
T0{1f0}=(1150+_30)K. (6)

MAYER and URBAN: SPINODAL ORDERING IN N&MO 543
The spinodal temperature of the {I !O) concen- tration waves is very close to the critical temperature T, = 1140 h of the Dl, structure. Up until now there has been no quantitative theoretical prediction con- cerning the position of the { 1 f 0} spinodal with respect to T,. In any case equation (1) does not exclude a close proximity of these temperatures. We note that r, is solely determined by the term quad- ratic in q while T, depends on all three terms in equation (1). So far our discussion was based on the generalized ~ragg-Wiliiams model adopted in [6]. This model yields a parabolic locus for the spinodal in a temperature-composition diagram. Sanchez and de Fontaine f14] have calculated a cohereut phase diagram for alloys with f.c.c. matrix by means of the tetrahedron-octahedron approximation of the cluster-variation method. This yields a more realistic position of the f 1 f 01 spinodal. However. since only atom interactions up to second-nearest neighbours were included it was not possible to treat the Dl, structure whose stability relies on fourth-nearest neighbout interactions [I 51.
The nature and evolution of the { 1 f 0) structure in quenched Ni,Mo has been the subject of considerable debate. Our results indicate that the view adopted first by Spruieh and Stansbury [I] and later supported by Okamoto and Thomas [3] that { 1 i 0) fluctuations exist at T > T, is justified. Also this explains that even the fastest quenching techniques could never produce the disordered state. On the other hand. our results provide clear evidence for spinodal { 1 i 0; ordering at T -c To. The cooling rates required to suppress Dl, nucleation are quite low. This can be deduced from the fact that the experiments whose results are com- piled in Fig. 3 could be carried out and a large number of data points be measured before Dl,
nucleation occured. In quenched material the 11 :O} concentration wave amplitude depends on how long. at T < To, the temperature was su~ciently high for thermal atom transport. This is corroborated by the observation of de Ridder er 01. [16] that the intensity of the f I 4 01 reflections increases with decreasing quenching rate.
Acknowledgements-The authors are grateful to Dr M. Wilkens. Dr S. Banerjee and Dr U. Essmann for interesting and stimulating discussions and comments on the manuscript.
REFERENCES
1. J. E. Spruiell and E. E. Stansbury, .I. Ph_rs. C/rem. SC&& 26, 811 (1965).
2. E. Ruedl. P. Delavignette and S. Amelinckx. Ph.wieu SIIIIW solidi 28, 305 (1968).
3. P. R. Okamoto and G. Thomas, Am merall. 19, 825 (1971).
4. B. Chakravarti. E. A. Starke. C. J. Sparks and R. 0. Williams. J. Ph.rs. Chem. Solids 35, 13 17 (1974).
5. J. P. Chevalier and W. M. Stobbs, Acra merall. 27, 1197 (1979).
6, D. de Fontaine. Am reruns. 23, 553 (1975). 7. J. W. Cahn. Am metal/. 9, 705 (1961). 8. H. E. Cook, D. de Fontaine and J. F. Hilliard. Acra
metal/. 17, 765 (1968). 9. A. G. Khachaturyan. Prog. Muter. Sci. 22, 1 (1978).
10. S. Banerjee. K. Urban and M. Wilkens, Acto metall. 32, 299 (1984).
11. Inrernarional Tables ,for X-Ray Crystallograph_v (edited by N. F. M. Henry and K. Lonsdale), Vol. 1. Kynoch Press. Birmingham (1952).
12. P. C. Clapp and S. C. Moss, Phys. Rer. 142,418 (1966). 13. K. Urban, Physica snafus solidi (a) 87, 581 (1985). 14. J. M. Sanchez and D. de Fontaine. Phvs. Rm. B 21.216
(1980). 15. 1. Kanamori and Y. Kakehashi. f. Physique 3S,C7,274
(19f7). 16. R. de Ridder, G. van Tendeloo and S. Amelinckx, Acra
cryrmllogr. A 32, 216 (1976).