Embed Size (px)
Citation preview
SPLASH Monitoring
15B Saturn Place, Albany. Auckland
New Zealand P. +64 9 442 0996
E. [email protected] W.www.splashmonitoring.com
Version 19102013
SPLASH Monitoring
Dashboard and Online
Configuration
Guide
SPLASH Monitoring Dashboard and Online Configuration Guide
SPLASH Monitoring
15B Saturn Place, Albany. Auckland
New Zealand P. +64 9 442 0996
E. [email protected] W.www.splashmonitoring.com
Version 19102013
2
SPLASH Monitoring
Dashboard and Online
Configuration
Guide
SPLASH Monitoring Dashboard and Online Configuration Guide
SPLASH Monitoring
15B Saturn Place, Albany. Auckland
New Zealand P. +64 9 442 0996
E. [email protected] W.www.splashmonitoring.com
Version 19102013
3
Contents
1.0 Overview ...................................................................................................................................................... 5
2.0 Getting Started – Quick Start ................................................................................................... 6
2.1 Registering with SPLASH Monitoring ........................................................................... 6
2.2 To start Monitoring a system using SPLASH Monitoring ........................... 8
2.3 Combining Systems .................................................................................................................... 10
3.0 Systems ..................................................................................................................................................... 12
3.1 Subscribe ............................................................................................................................................. 13
3.1 Settings ................................................................................................................................................. 14
3.2 PhotoVoltaic Arrays ................................................................................................................... 15
3.3 Labels ...................................................................................................................................................... 16
3.4 Animate ................................................................................................................................................. 18
3.5 Graphs .................................................................................................................................................... 21
3.6 Content .................................................................................................................................................. 30
3.7 Private / Publicly viewable system .............................................................................. 31
3.8 Users ........................................................................................................................................................ 32
3.9 Alerts ....................................................................................................................................................... 34
3.10 Reports .............................................................................................................................................. 37
4.0 Status .......................................................................................................................................................... 39
5.0 Account ...................................................................................................................................................... 41
6.0 Contacts .................................................................................................................................................... 42
7.0 Fingerprints ............................................................................................................................................ 44
8.0 Features of SPLASH Monitoring ......................................................................................... 45
8.1 Lobby Displays ................................................................................................................................ 45
8.2 Animation ............................................................................................................................................ 45
8.3 Graphing and Reporting ......................................................................................................... 46
8.4 Mobile View ....................................................................................................................................... 47
8.5 Information Screen ..................................................................................................................... 48
8.6 Galleries ................................................................................................................................................ 49
9.0 OEM Equipment Manufacturers........................................................................................... 50
9.1 Flexible data source .......................................................................................................................... 50
9.2 OEM Service ........................................................................................................................................... 50
SPLASH Monitoring Dashboard and Online Configuration Guide
SPLASH Monitoring
15B Saturn Place, Albany. Auckland
New Zealand P. +64 9 442 0996
E. [email protected] W.www.splashmonitoring.com
Version 19102013
4
10.0 Branding ................................................................................................................................................ 51
11.0 Features specific to particular hardware or types of system ............ 52
12.0 Additional HELP ............................................................................................................................. 52
SPLASH Monitoring Dashboard and Online Configuration Guide
SPLASH Monitoring
15B Saturn Place, Albany. Auckland
New Zealand P. +64 9 442 0996
E. [email protected] W.www.splashmonitoring.com
Version 19102013
5
1.0 OVERVIEW This document is intended to get you started and guide you through the online configuration
process. Some of the features within SPLASH Monitoring can only be used with specific hardware
or types of installations. When we refer to the word “hardware” we mean, inverters, solar
controllers or power data loggers that are supported by SPLASH Monitoring.
In addition to this Guide you should also refer to any other documentation specific to your
particular hardware.
There are five steps to installing your SPLASH Monitoring
system
STEP 1 Installing your hardware that is to be monitored and configuring it to be monitored by
SPLASH Monitoring (refer to the SPLASH Monitoring “Setting up your hardware guide” specific to
your solar inverter or hardware to be monitored)
STEP 2 Installing your SPLASH Streambox and connecting it to the internet. When the internet
connection for the SPLASH Streambox is through a domestic router i.e. your LAN network is
unmanaged, as in most domestic and small business situations, our default configuration will
almost certainly work without any modifications to the LAN network or Splash Monitoring
equipment. If your LAN is actively managed, as in many medium to large scale organisations, you
will need to consult the Network Administrator (usually a member of the Computer Department)
and provide them with a copy of the SPLASH Monitoring document titled, “SPLASH Monitoring
LAN Configuration Requirements”.
STEP 3 Registering with SPLASH Monitoring, refer to the “Quick Start” Section 2.1 of this Guide.
STEP 4 Entering details about the system and configuring your SPLASH Monitoring DASHBOARD
using a “Preset” refer to the “Quick Start” Sections 2.2 and 2.3 of this Guide
STEP 5 This STEP is optional. If you wish, you can customise your DASHBOARD and animation
refer to Sections 3, 4, 5 and 6 of this Guide.
SPLASH Monitoring Dashboard and Online Configuration Guide
SPLASH Monitoring
15B Saturn Place, Albany. Auckland
New Zealand P. +64 9 442 0996
E. [email protected] W.www.splashmonitoring.com
Version 19102013
6
There are three methods of setting up a system to be monitored by SPLASH Monitoring.
1. Applying a “Preset” online configuration – some hardware and types of systems have
already had a similar system setup. If you have the same or similar hardware you can select one
of these preset templates from the “Settings” tab and this will populate the remaining
configuration for you.
2. Custom Configuration – If you are setting up a system for which there is no “Preset” template
then once you have progressed through setting up the system in accordance with Section 2,
you will need to setup the remaining configuration as described through the DASHBOARD in
Section 3 of this document.
3. Customising a Preset – If your system is similar to a preset, you can select the closest Preset
template and then go through the DASHBOARD to customise your system.
2.1 Registering with SPLASH Monitoring
To start using SPLASH Monitoring you must first register with us as a User. Registration is free and
easy. To register with SPLASH Monitoring:
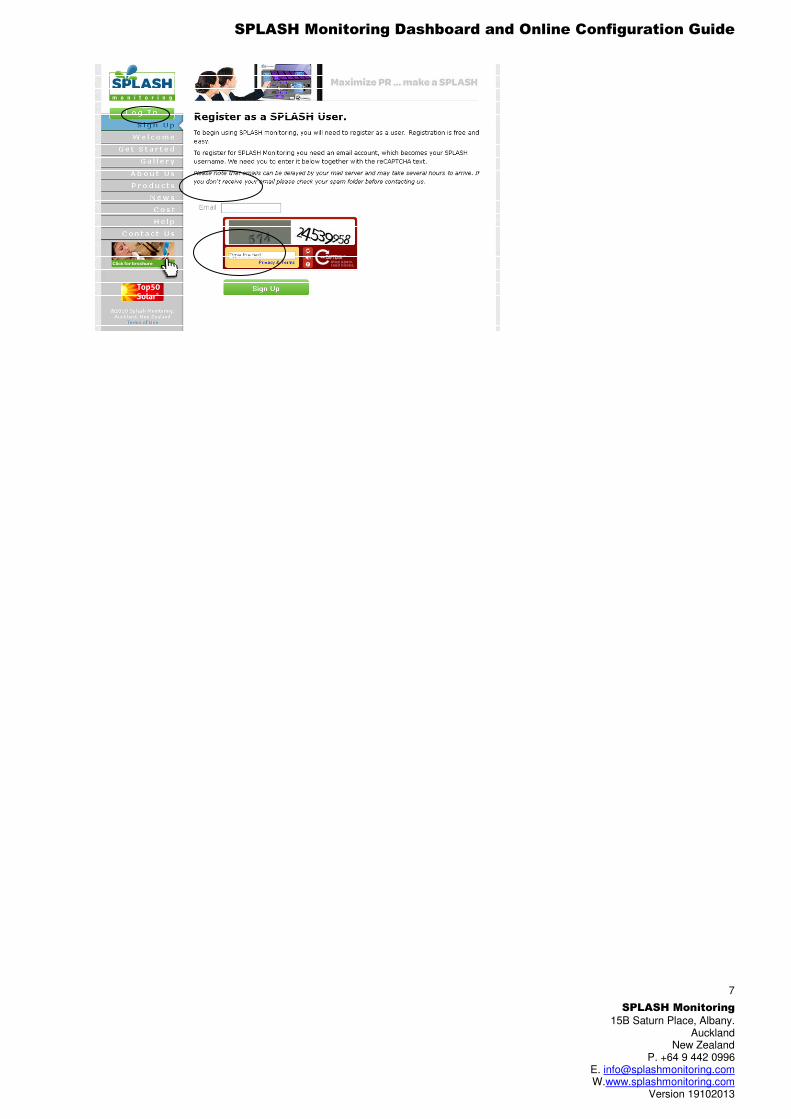
1. Go to www.splashmonitoring.com and click on “Signup”. Enter your email address and the
Captcha text. Then click “Signup”. Please note your email address becomes your SPLASH
username.
2. You will be emailed a confirmation, to which you must respond to activate your Splash
Monitoring Account. Please note that due to “grey-listing” on some mail servers this email can
take some time to arrive in your inbox. If you don't receive your email please check your spam
folder before contacting us.
2.0 GETTING STARTED – QUICK START
SPLASH Monitoring Dashboard and Online Configuration Guide
SPLASH Monitoring
15B Saturn Place, Albany. Auckland
New Zealand P. +64 9 442 0996
E. [email protected] W.www.splashmonitoring.com
Version 19102013
7
SPLASH Monitoring Dashboard and Online Configuration Guide
SPLASH Monitoring
15B Saturn Place, Albany. Auckland
New Zealand P. +64 9 442 0996
E. [email protected] W.www.splashmonitoring.com
Version 19102013
8
2.2 To start Monitoring a system using SPLASH Monitoring
1. First you will need to install and setup your hardware, please refer to any relevant hardware
specific instructions which will guide you through to your hardware starting to push data to
our web-based Servers.
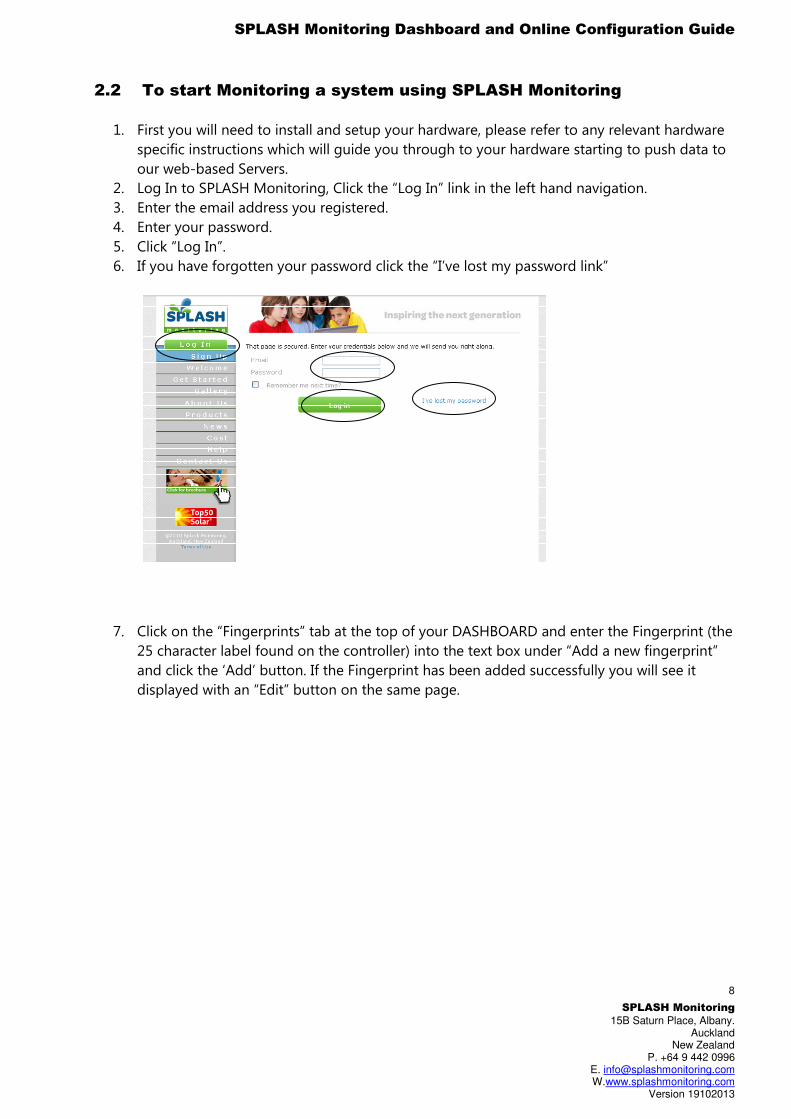
2. Log In to SPLASH Monitoring, Click the “Log In” link in the left hand navigation.
3. Enter the email address you registered.
4. Enter your password.
5. Click “Log In”.
6. If you have forgotten your password click the “I’ve lost my password link”
7. Click on the “Fingerprints” tab at the top of your DASHBOARD and enter the Fingerprint (the
25 character label found on the controller) into the text box under “Add a new fingerprint”
and click the ‘Add’ button. If the Fingerprint has been added successfully you will see it
displayed with an “Edit” button on the same page.
SPLASH Monitoring Dashboard and Online Configuration Guide
SPLASH Monitoring
15B Saturn Place, Albany. Auckland
New Zealand P. +64 9 442 0996
E. [email protected] W.www.splashmonitoring.com
Version 19102013
9
8. Click “Edit” and enter an optional nickname which will help you identify the Fingerprint this
is usually associated with the location and/or function of the system. Enter the site’s location
and click “Find Location”, then confirm the location by checking the box towards the bottom
of the page. Lastly on this page, choose the scan frequency, (how often the data is updated
and sent to SPLASH Monitoring, this must be 10, 20 30 or 60 seconds. NOTE Some devices
need the data sent at a specific frequency, refer to your specific hardware instructions for
more details. Click “Save” to complete this page.
9. Click the “Systems” tab and select your fingerprint in the drop-down menu under “Start
monitoring a new system”. Click the “Scan” button.
10. If the controller is successfully ‘pushing’ data to the Splash Monitoring web site you will see
a “Stream Found” message together with the values from your controller displayed as
“System 1”. If you see ‘No Stream Found’ refer to the ‘Trouble Shooting’ guide.
11. If valid data is displayed for your system, click the “Monitor This System” button.
12. Click on the “Systems” tab where you should see a “New System” displayed as a set of
buttons across the screen.
13. Click on the “Subscribe” button and either purchase the appropriate subscription by clicking
one of the “Pay Now” buttons. When you’ve completed the Paypal session you will need to
navigate back to the SPLASH Monitoring Dashboard. If your subscription has been pre-paid,
click on the “Free” button to claim it.
14. Click the “Settings” button and customise your site details. If you intend using a Preset click
the “Save” button before choosing a Preset. To select a preset at the bottom of the page
check the box next to “Tick this box to confirm that you understand Presets”, then select the
Preset from the drop-down menu and click the “Use Preset” button. This will populate the
remaining configuration parameters (Labels, Animation, Triggers, Graphs, Alarms etc.) with
pre-defined values.
15. You may tailor your system by going back to the “Systems” tab, select the appropriate
button and alter any values appropriate to your system. Alerts in particular are not always
exactly what the user requires so you should review these if nothing else.
16. This is the basic configuration of your site complete and it should be viewable with current
data in the Dashboard and Gallery by clicking on either the “Mobile” or “Animation” buttons.
SPLASH Monitoring Dashboard and Online Configuration Guide
SPLASH Monitoring
15B Saturn Place, Albany. Auckland
New Zealand P. +64 9 442 0996
E. [email protected] W.www.splashmonitoring.com
Version 19102013
10
17. Select the “Public” button to allow your system to be viewed by visitors to the SPLASH
Monitoring website.
2.3 Combining Systems
1. The values from individual systems on a single Fingerprint can be collated into a single
combined system. For example multiple PV inverters serving a single building can be
combined so that the data from each inverter is collated into a single system depicting the
building as a whole. For this to be successful the individual sensors from each system must
be identical. (ie if sensor 1 on system 1 is PV output voltage, then sensor 1 on system 2 must
also be PV output voltage if these systems are to be combined and their combined data be
meaningful).
2. Individual sensors can be combined using one of five methods: Sum, Average, Minimum,
Maximum and Mode. For example, adding the voltages from individual inverters doesn’t
make sense, so you would probably take either the Average or the Mode of all combined
voltages, whereas you would Sum the power output of each inverter to give a total power
output for the building in this case.
3. It is possible to display a single sensor from an individual system on a combined system by
having the sensor in a slot that is not used by any other system in the combination. For
example, system 1 has a solar radiation sensor attached to slot 20 of the system, whereas
systems 2 and 3 have nothing attached to this slot and therefore always produce a value of
zero in slot 20. Therefore the Sum (or Maximum) of all slot 20s will reflect the value of the
solar radiation sensor on the combined system.
4. To combine systems, enter your Fingerprint* into the box under ‘Start monitoring a new
system’ on the Splash Monitoring Dashboard, select a Fingerprint to scan from the drop-
down menu and click the ‘Scan’ button:
5. Click the “Include device…” check-box against each device you want to combine into a single
system.
6. Click the “Make Combined Systems” button. This will create a new system called “New
System”.
7. Go back to the Dashboard and click the “Settings” button on the “New System” shown.
8. Give this new combined system a unique System Name and URI and click Save.
9. Go back to the Dashboard and click the “Upgrade” button for the new combined system and
give it a subscription.
10. Go back to the Dashboard and click the “Settings” button and select a “preset” if required.
11. Go back to the Dashboard and click the “Labels” button, and select the most appropriate
calculation method (AVG, SUM, MIN, MAX, MODE) for each sensor by clicking the drop-
down menu next to its label.
12. Click the “Save” button when done.
13. Return to the Dashboard and check that the remaining settings are what you expect
(Graphs, Content, Alerts etc.)
14. If you want to set up more combined systems you’ll need to return to the dashboard and re-
scan your Fingerprint* and repeat these steps for each one.
15. Individual systems do not have to be set up and monitored for live data to populate
combined systems. For large installations with multiple devices (eg. inverters), it may be best
to leave them un-monitored to keep subscription costs down. If you only need to view the
SPLASH Monitoring Dashboard and Online Configuration Guide
SPLASH Monitoring
15B Saturn Place, Albany. Auckland
New Zealand P. +64 9 442 0996
E. [email protected] W.www.splashmonitoring.com
Version 19102013
11
real time data for individual systems very occasionally you can scan your fingerprint in the
Dashboard and view the data for each un-monitored system there.
NOTE Once you’ve manually entered a fingerprint it will usually pop up automatically in the
fingerprint box after typing the first couple of characters. Otherwise you can save it to your
clipboard by highlighting it the first time you enter it and press <Ctrl>c, then on subsequent
scans paste it into the box using <Ctrl>v.
SPLASH Monitoring Dashboard and Online Configuration Guide
SPLASH Monitoring
15B Saturn Place, Albany. Auckland
New Zealand P. +64 9 442 0996
E. [email protected] W.www.splashmonitoring.com
Version 19102013
12
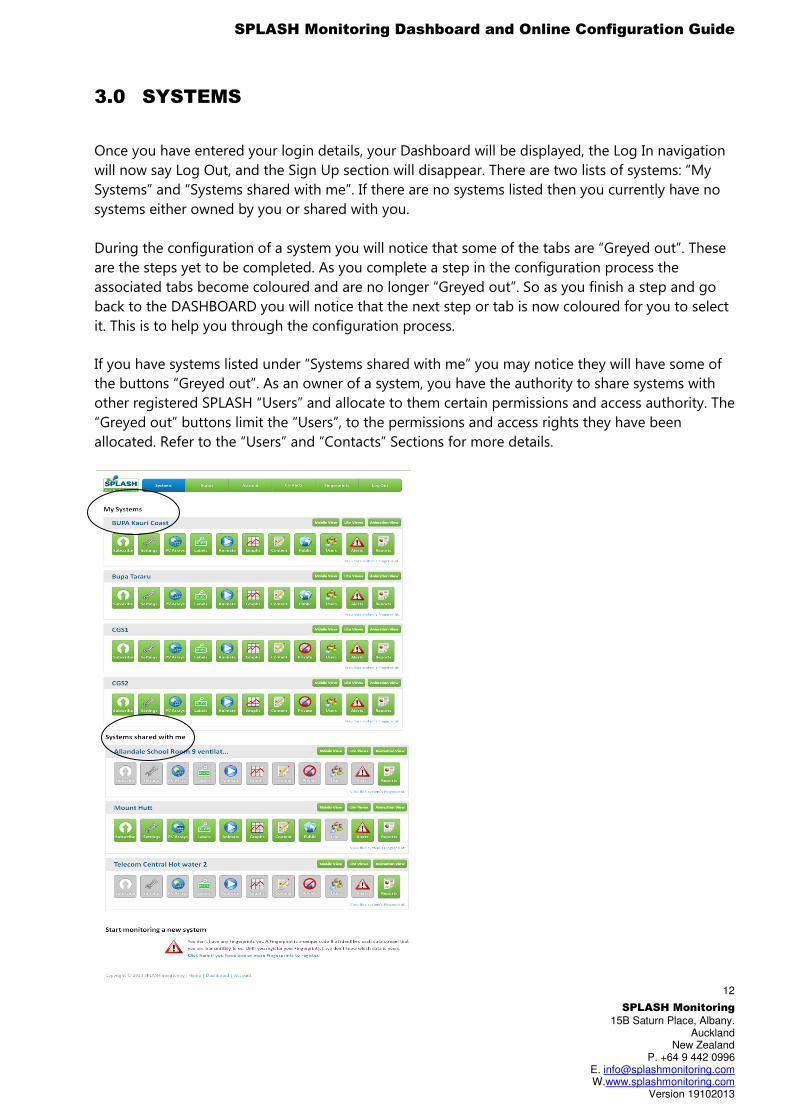
Once you have entered your login details, your Dashboard will be displayed, the Log In navigation
will now say Log Out, and the Sign Up section will disappear. There are two lists of systems: “My
Systems” and “Systems shared with me”. If there are no systems listed then you currently have no
systems either owned by you or shared with you.
During the configuration of a system you will notice that some of the tabs are “Greyed out”. These
are the steps yet to be completed. As you complete a step in the configuration process the
associated tabs become coloured and are no longer “Greyed out”. So as you finish a step and go
back to the DASHBOARD you will notice that the next step or tab is now coloured for you to select
it. This is to help you through the configuration process.
If you have systems listed under “Systems shared with me” you may notice they will have some of
the buttons “Greyed out”. As an owner of a system, you have the authority to share systems with
other registered SPLASH “Users” and allocate to them certain permissions and access authority. The
“Greyed out” buttons limit the “Users”, to the permissions and access rights they have been
allocated. Refer to the “Users” and “Contacts” Sections for more details.
3.0 SYSTEMS
SPLASH Monitoring Dashboard and Online Configuration Guide
SPLASH Monitoring
15B Saturn Place, Albany. Auckland
New Zealand P. +64 9 442 0996
E. [email protected] W.www.splashmonitoring.com
Version 19102013
13
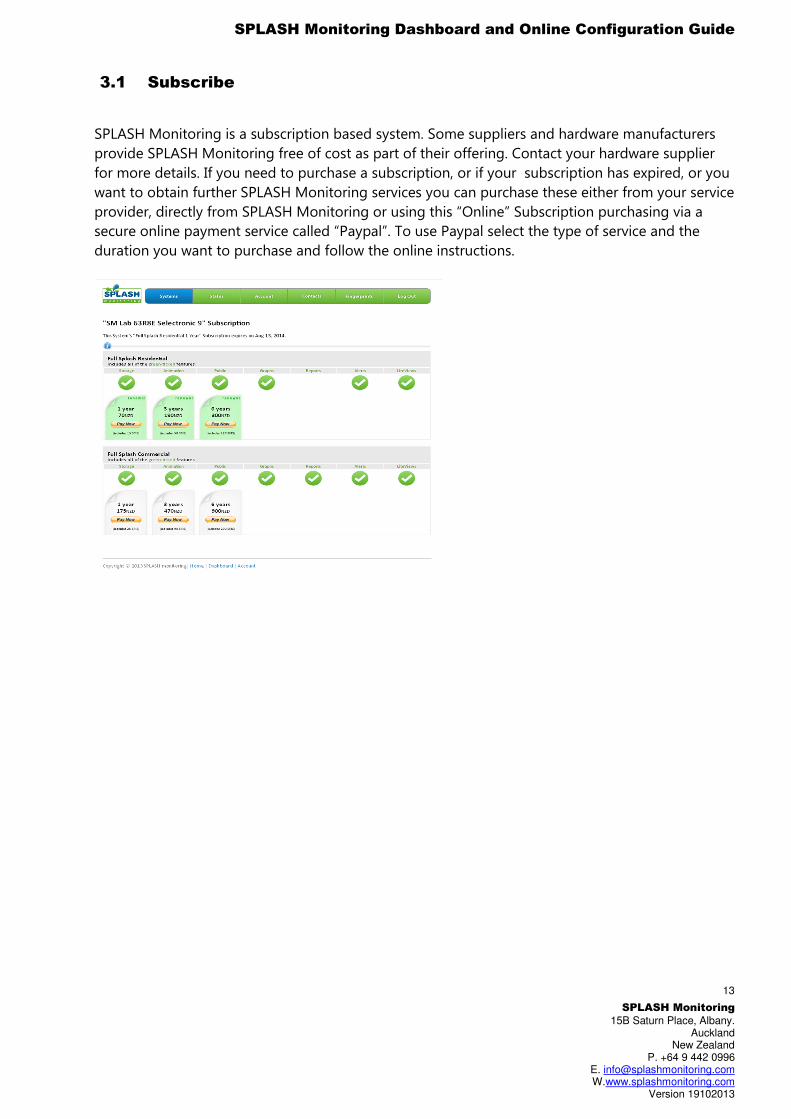
SPLASH Monitoring is a subscription based system. Some suppliers and hardware manufacturers
provide SPLASH Monitoring free of cost as part of their offering. Contact your hardware supplier
for more details. If you need to purchase a subscription, or if your subscription has expired, or you
want to obtain further SPLASH Monitoring services you can purchase these either from your service
provider, directly from SPLASH Monitoring or using this “Online” Subscription purchasing via a
secure online payment service called “Paypal”. To use Paypal select the type of service and the
duration you want to purchase and follow the online instructions.
3.1 Subscribe
SPLASH Monitoring Dashboard and Online Configuration Guide
SPLASH Monitoring
15B Saturn Place, Albany. Auckland
New Zealand P. +64 9 442 0996
E. [email protected] W.www.splashmonitoring.com
Version 19102013
14
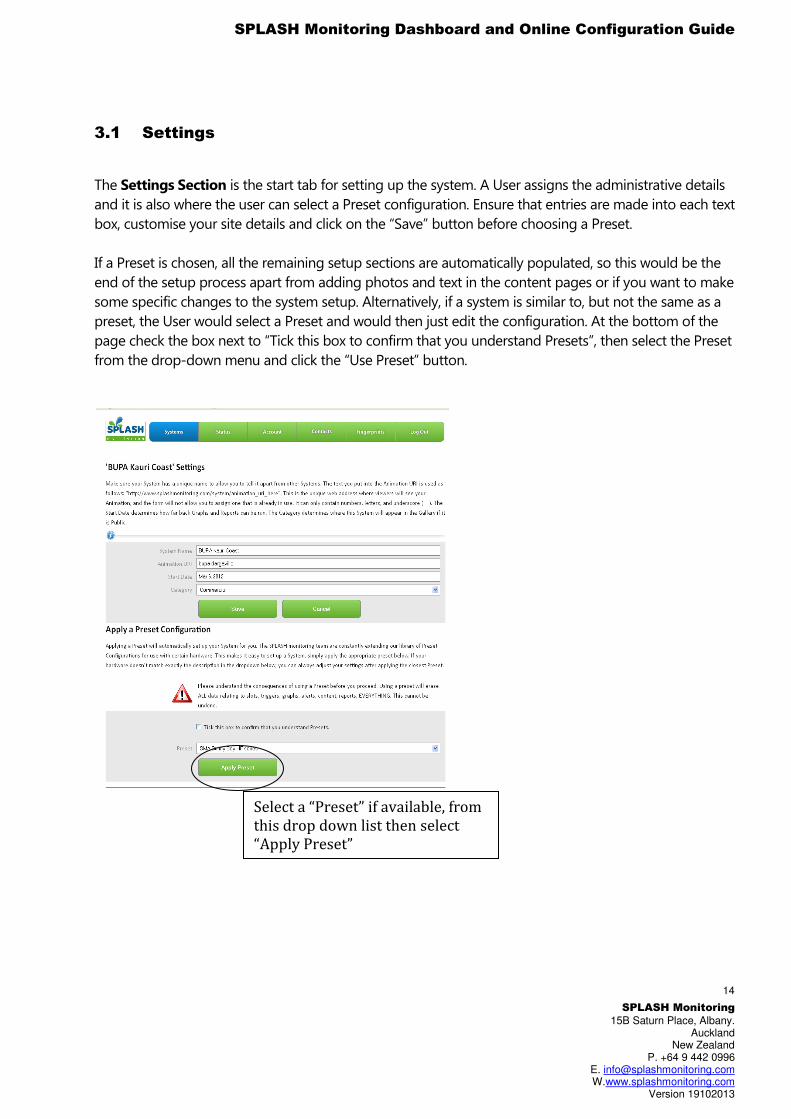
The Settings Section is the start tab for setting up the system. A User assigns the administrative details
and it is also where the user can select a Preset configuration. Ensure that entries are made into each text
box, customise your site details and click on the “Save” button before choosing a Preset.
If a Preset is chosen, all the remaining setup sections are automatically populated, so this would be the
end of the setup process apart from adding photos and text in the content pages or if you want to make
some specific changes to the system setup. Alternatively, if a system is similar to, but not the same as a
preset, the User would select a Preset and would then just edit the configuration. At the bottom of the
page check the box next to “Tick this box to confirm that you understand Presets”, then select the Preset
from the drop-down menu and click the “Use Preset” button.
3.1 Settings
Select a “Preset” if available, from
this drop down list then select
“Apply Preset”
SPLASH Monitoring Dashboard and Online Configuration Guide
SPLASH Monitoring
15B Saturn Place, Albany. Auckland
New Zealand P. +64 9 442 0996
E. [email protected] W.www.splashmonitoring.com
Version 19102013
15
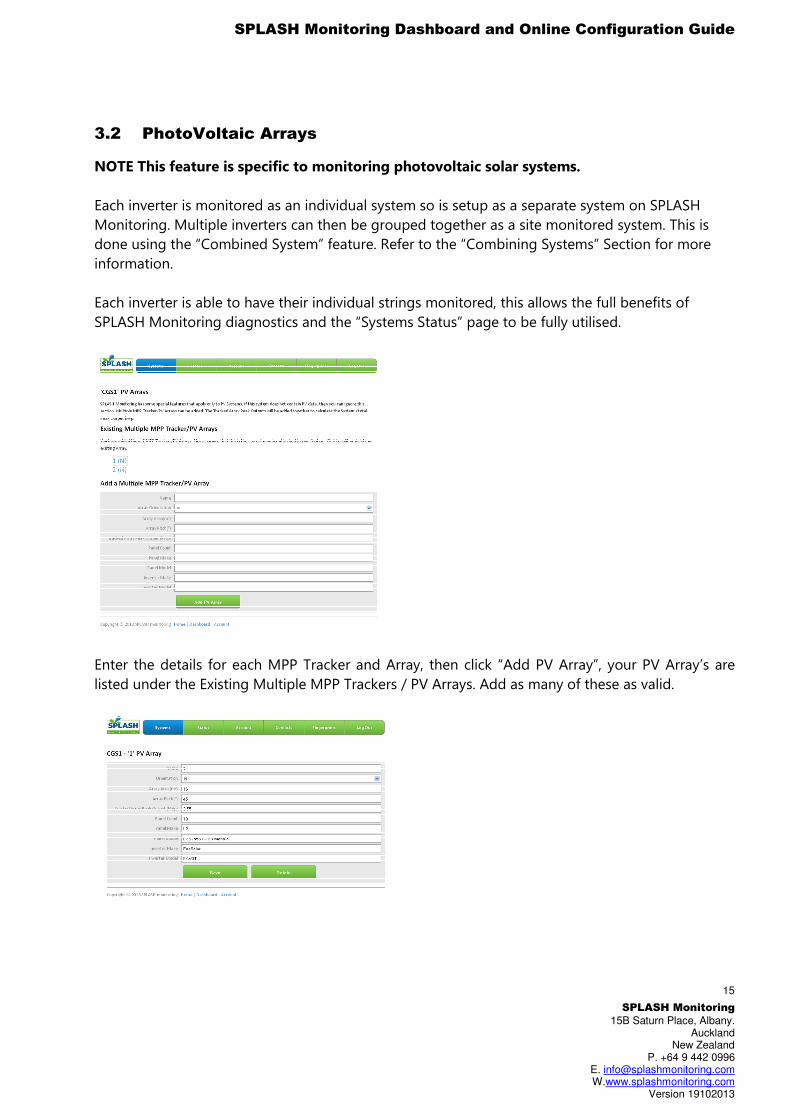
NOTE This feature is specific to monitoring photovoltaic solar systems.
Each inverter is monitored as an individual system so is setup as a separate system on SPLASH
Monitoring. Multiple inverters can then be grouped together as a site monitored system. This is
done using the “Combined System” feature. Refer to the “Combining Systems” Section for more
information.
Each inverter is able to have their individual strings monitored, this allows the full benefits of
SPLASH Monitoring diagnostics and the “Systems Status” page to be fully utilised.
Enter the details for each MPP Tracker and Array, then click “Add PV Array”, your PV Array’s are
listed under the Existing Multiple MPP Trackers / PV Arrays. Add as many of these as valid.
3.2 PhotoVoltaic Arrays
SPLASH Monitoring Dashboard and Online Configuration Guide
SPLASH Monitoring
15B Saturn Place, Albany. Auckland
New Zealand P. +64 9 442 0996
E. [email protected] W.www.splashmonitoring.com
Version 19102013
16
NOTE The Labelling, Graphing and Reporting sections will be updated by the end of 2013. These
updates will provide many new features. If you are a registered “User” we will be emailing you with
these new features.
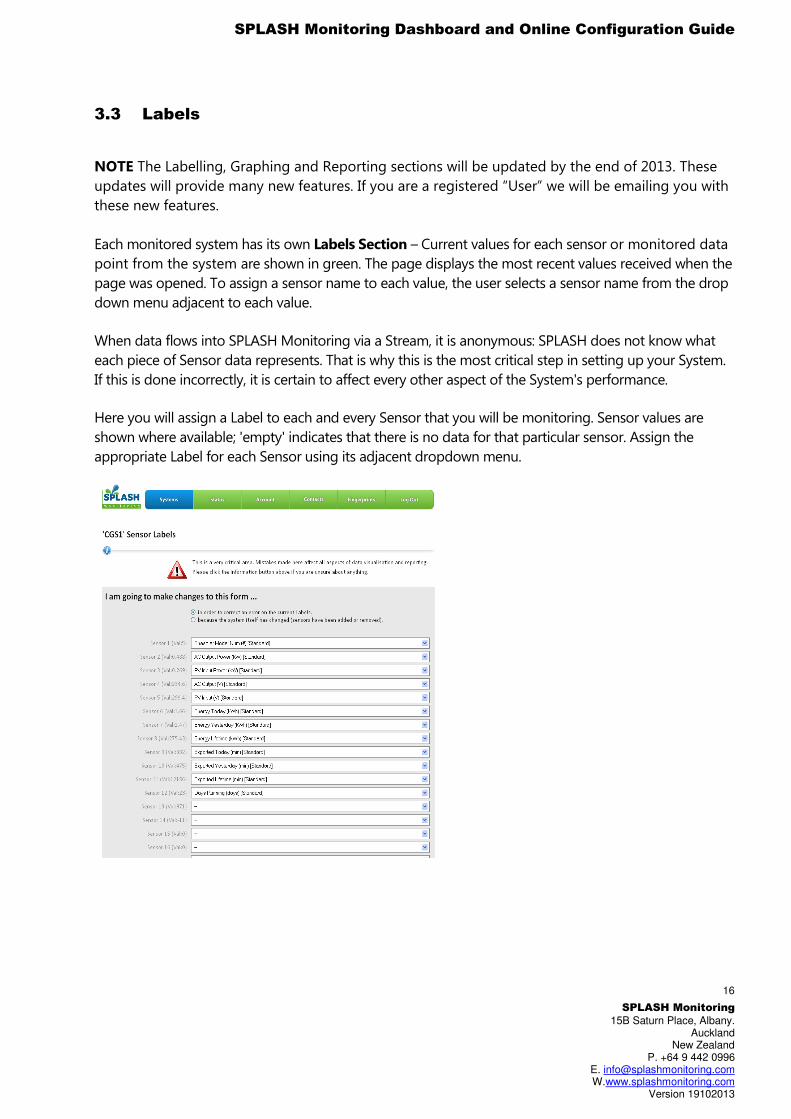
Each monitored system has its own Labels Section – Current values for each sensor or monitored data
point from the system are shown in green. The page displays the most recent values received when the
page was opened. To assign a sensor name to each value, the user selects a sensor name from the drop
down menu adjacent to each value.
When data flows into SPLASH Monitoring via a Stream, it is anonymous: SPLASH does not know what
each piece of Sensor data represents. That is why this is the most critical step in setting up your System.
If this is done incorrectly, it is certain to affect every other aspect of the System's performance.
Here you will assign a Label to each and every Sensor that you will be monitoring. Sensor values are
shown where available; 'empty' indicates that there is no data for that particular sensor. Assign the
appropriate Label for each Sensor using its adjacent dropdown menu.
3.3 Labels
SPLASH Monitoring Dashboard and Online Configuration Guide
SPLASH Monitoring
15B Saturn Place, Albany. Auckland
New Zealand P. +64 9 442 0996
E. [email protected] W.www.splashmonitoring.com
Version 19102013
17
It's important to correctly indicate the reason that you are editing Labels by using the selection at the
very top of the form. (If this is your first visit, don't worry, there is only one choice.
Otherwise the options will be
1. “...in order to correct an error on the current Labels" - use this when you realise that a Label
needs to be changed because it was not set correctly. This option doesn't make a new
"Mapping."
2. "because the system itself has changed (sensors have been added or removed)" - saving
changes to Labels with this option selected will create a new "Mapping" with the current
timestamp. This keeps your Sensor Data associated with the correct Labels regardless of how
many changes the System goes through, which allows SPLASH Reports and Graphs to work
throughout the life of your System.
A Label is made up of a Name, a Unit of Measurement, and a Type. There are 3 Types of Sensor:
1. A Standard Sensor's value is shown in Graphs, Reports, and the Viewer without being changed.
2. A Switch Sensor's value is treated as a binary state: a Zero Value is treated as "Off", and any other
value is treated as "On". Graphs, Reports, and the Viewer show the numeric "On" or "Off" values
set by the user. If you are changing a Sensor Label to a 'Switch', you must first press Save to see
the On and Off values.
3. A Virtual Sensor is a single user-defined value. It does not change regardless of whether it is
applied to a Sensor or a Constant.
SPLASH Monitoring Dashboard and Online Configuration Guide
SPLASH Monitoring
15B Saturn Place, Albany. Auckland
New Zealand P. +64 9 442 0996
E. [email protected] W.www.splashmonitoring.com
Version 19102013
18
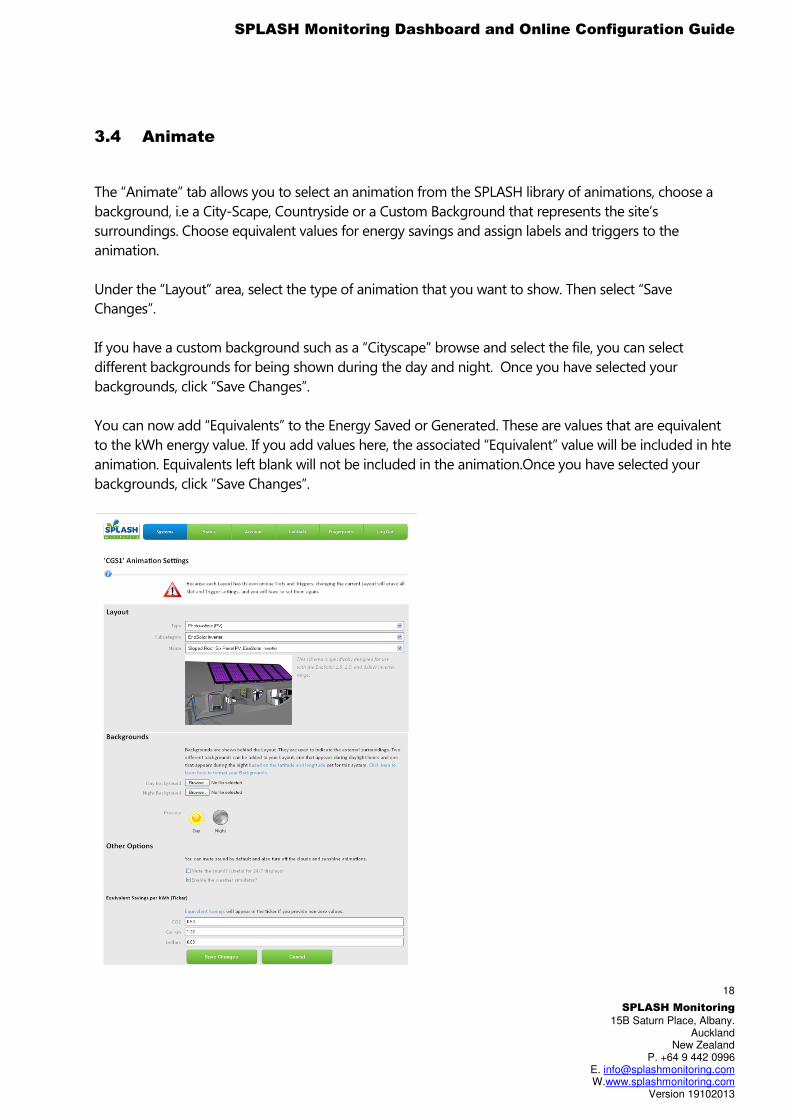
The “Animate” tab allows you to select an animation from the SPLASH library of animations, choose a
background, i.e a City-Scape, Countryside or a Custom Background that represents the site’s
surroundings. Choose equivalent values for energy savings and assign labels and triggers to the
animation.
Under the “Layout” area, select the type of animation that you want to show. Then select “Save
Changes”.
If you have a custom background such as a “Cityscape” browse and select the file, you can select
different backgrounds for being shown during the day and night. Once you have selected your
backgrounds, click “Save Changes”.
You can now add “Equivalents” to the Energy Saved or Generated. These are values that are equivalent
to the kWh energy value. If you add values here, the associated “Equivalent” value will be included in hte
animation. Equivalents left blank will not be included in the animation.Once you have selected your
backgrounds, click “Save Changes”.
3.4 Animate
SPLASH Monitoring Dashboard and Online Configuration Guide
SPLASH Monitoring
15B Saturn Place, Albany. Auckland
New Zealand P. +64 9 442 0996
E. [email protected] W.www.splashmonitoring.com
Version 19102013
19
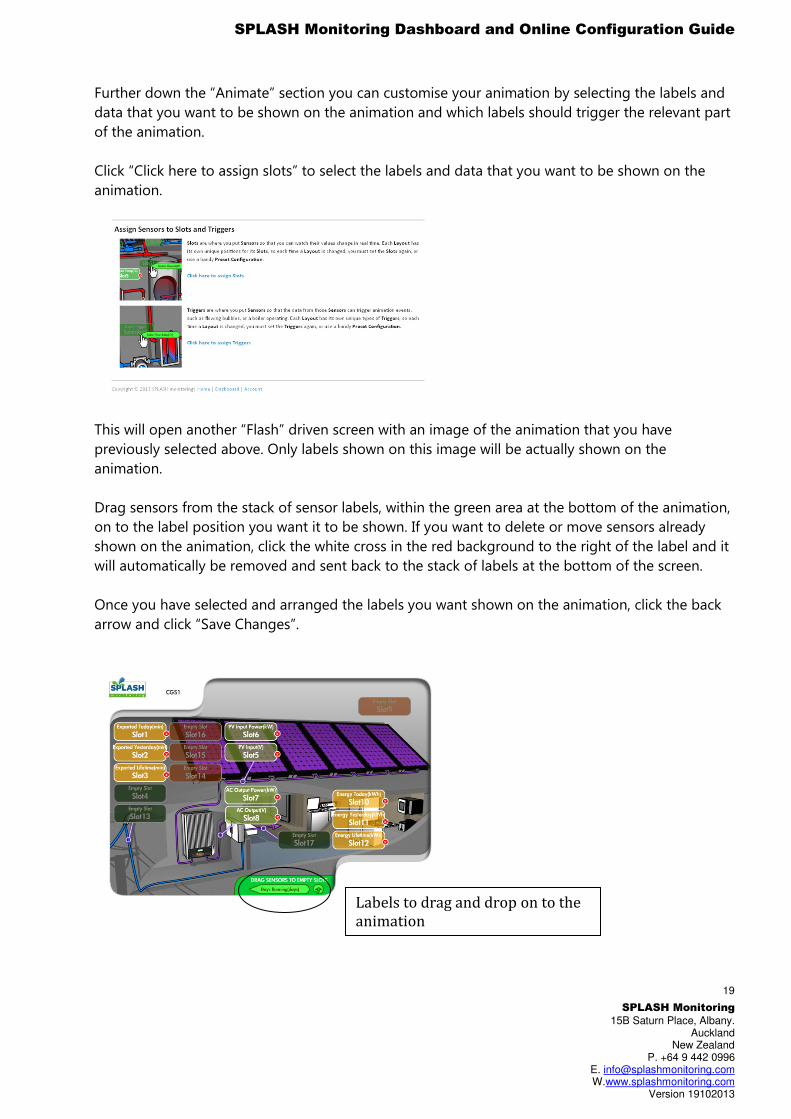
Further down the “Animate” section you can customise your animation by selecting the labels and
data that you want to be shown on the animation and which labels should trigger the relevant part
of the animation.
Click “Click here to assign slots” to select the labels and data that you want to be shown on the
animation.
This will open another “Flash” driven screen with an image of the animation that you have
previously selected above. Only labels shown on this image will be actually shown on the
animation.
Drag sensors from the stack of sensor labels, within the green area at the bottom of the animation,
on to the label position you want it to be shown. If you want to delete or move sensors already
shown on the animation, click the white cross in the red background to the right of the label and it
will automatically be removed and sent back to the stack of labels at the bottom of the screen.
Once you have selected and arranged the labels you want shown on the animation, click the back
arrow and click “Save Changes”.
Labels to drag and drop on to the
animation
SPLASH Monitoring Dashboard and Online Configuration Guide
SPLASH Monitoring
15B Saturn Place, Albany. Auckland
New Zealand P. +64 9 442 0996
E. [email protected] W.www.splashmonitoring.com
Version 19102013
20
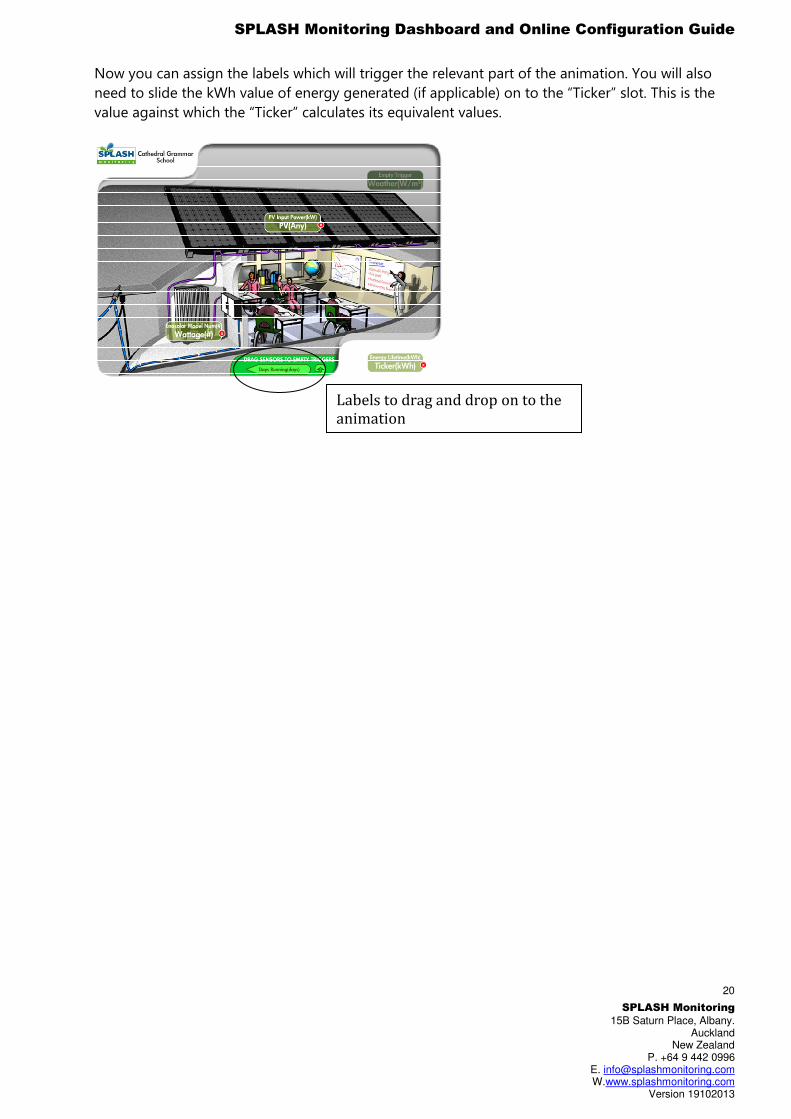
Now you can assign the labels which will trigger the relevant part of the animation. You will also
need to slide the kWh value of energy generated (if applicable) on to the “Ticker” slot. This is the
value against which the “Ticker” calculates its equivalent values.
Labels to drag and drop on to the
animation
SPLASH Monitoring Dashboard and Online Configuration Guide
SPLASH Monitoring
15B Saturn Place, Albany. Auckland
New Zealand P. +64 9 442 0996
E. [email protected] W.www.splashmonitoring.com
Version 19102013
21
All Graphs setup here will be available to Users of your monitored system and able to be selected
within the Graphing interface of the User Display, usually accessed via the animation. Some
systems that have been setup as “Preset systems will already have Graphs setup. If you wish to edit
a Graph type go to the Graph tab on your DASHBoard.
There are three General Types of graphs
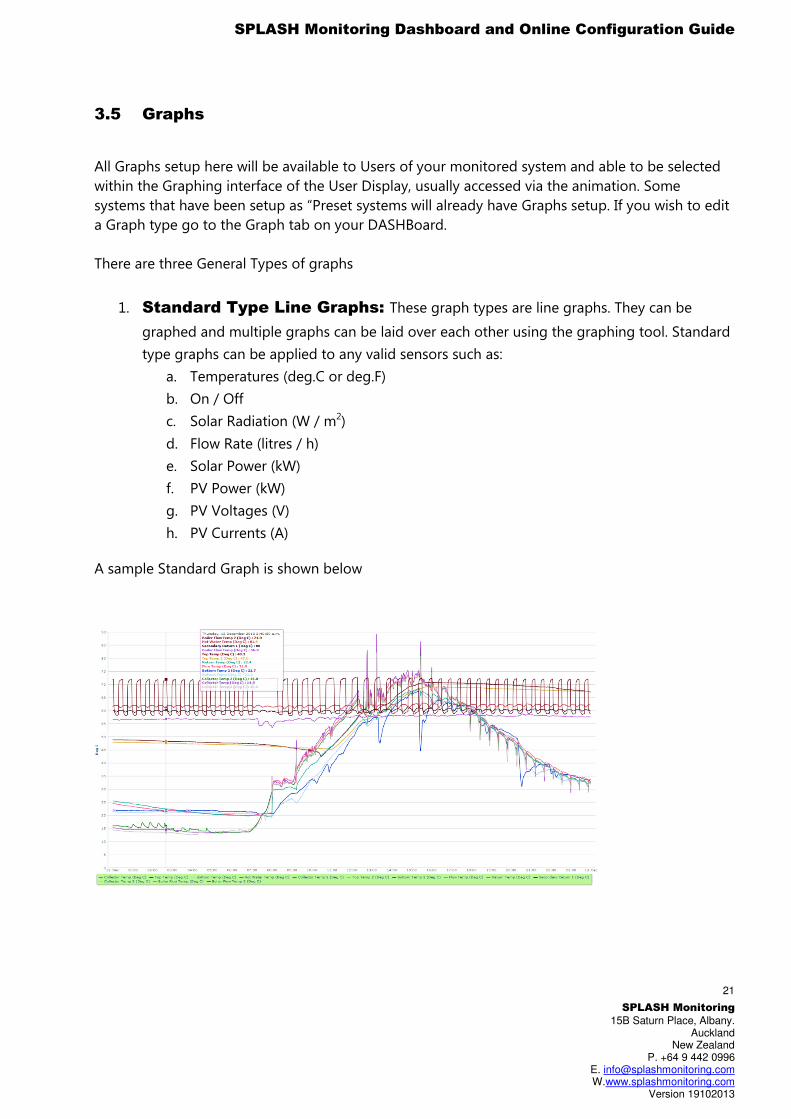
1. Standard Type Line Graphs: These graph types are line graphs. They can be
graphed and multiple graphs can be laid over each other using the graphing tool. Standard
type graphs can be applied to any valid sensors such as:
a. Temperatures (deg.C or deg.F)
b. On / Off
c. Solar Radiation (W / m2)
d. Flow Rate (litres / h)
e. Solar Power (kW)
f. PV Power (kW)
g. PV Voltages (V)
h. PV Currents (A)
A sample Standard Graph is shown below
3.5 Graphs
SPLASH Monitoring Dashboard and Online Configuration Guide
SPLASH Monitoring
15B Saturn Place, Albany. Auckland
New Zealand P. +64 9 442 0996
E. [email protected] W.www.splashmonitoring.com
Version 19102013
22
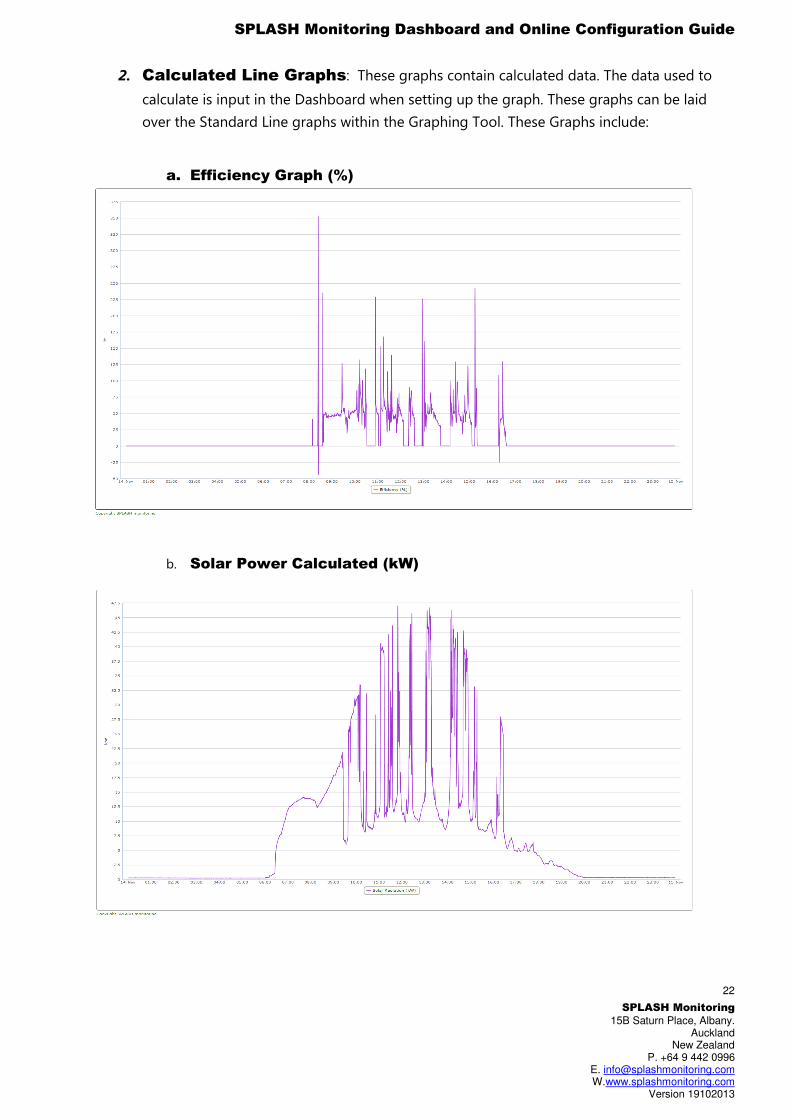
2. Calculated Line Graphs: These graphs contain calculated data. The data used to
calculate is input in the Dashboard when setting up the graph. These graphs can be laid
over the Standard Line graphs within the Graphing Tool. These Graphs include:
a. Efficiency Graph (%)
b. Solar Power Calculated (kW)
SPLASH Monitoring Dashboard and Online Configuration Guide
SPLASH Monitoring
15B Saturn Place, Albany. Auckland
New Zealand P. +64 9 442 0996
E. [email protected] W.www.splashmonitoring.com
Version 19102013
23
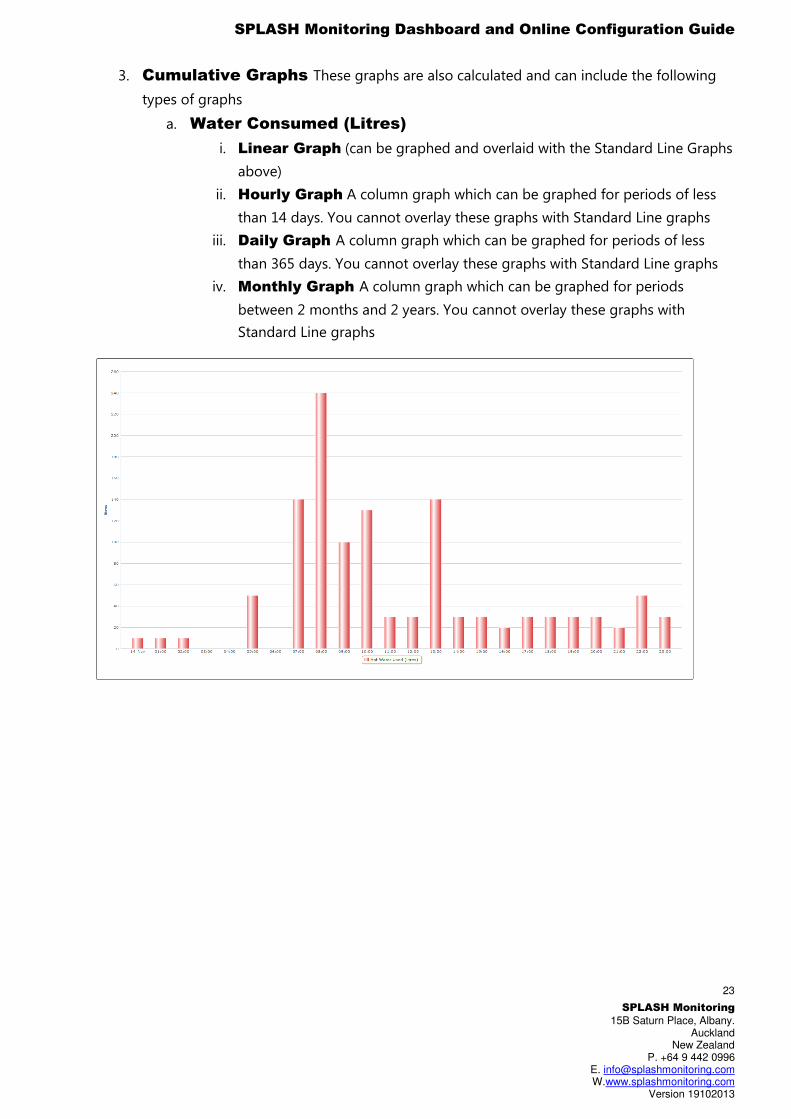
3. Cumulative Graphs These graphs are also calculated and can include the following
types of graphs
a. Water Consumed (Litres)
i. Linear Graph (can be graphed and overlaid with the Standard Line Graphs
above)
ii. Hourly Graph A column graph which can be graphed for periods of less
than 14 days. You cannot overlay these graphs with Standard Line graphs
iii. Daily Graph A column graph which can be graphed for periods of less
than 365 days. You cannot overlay these graphs with Standard Line graphs
iv. Monthly Graph A column graph which can be graphed for periods
between 2 months and 2 years. You cannot overlay these graphs with
Standard Line graphs
SPLASH Monitoring Dashboard and Online Configuration Guide
SPLASH Monitoring
15B Saturn Place, Albany. Auckland
New Zealand P. +64 9 442 0996
E. [email protected] W.www.splashmonitoring.com
Version 19102013
24
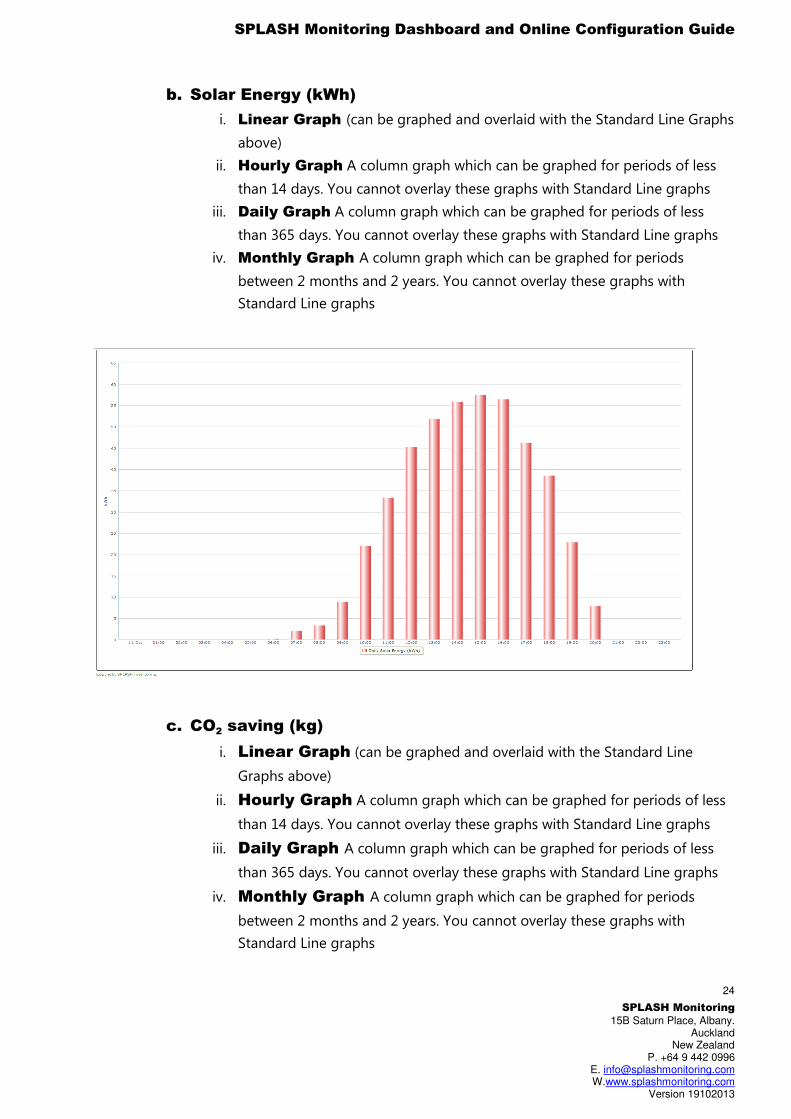
b. Solar Energy (kWh)
i. Linear Graph (can be graphed and overlaid with the Standard Line Graphs
above)
ii. Hourly Graph A column graph which can be graphed for periods of less
than 14 days. You cannot overlay these graphs with Standard Line graphs
iii. Daily Graph A column graph which can be graphed for periods of less
than 365 days. You cannot overlay these graphs with Standard Line graphs
iv. Monthly Graph A column graph which can be graphed for periods
between 2 months and 2 years. You cannot overlay these graphs with
Standard Line graphs
c. CO2 saving (kg)
i. Linear Graph (can be graphed and overlaid with the Standard Line
Graphs above)
ii. Hourly Graph A column graph which can be graphed for periods of less
than 14 days. You cannot overlay these graphs with Standard Line graphs
iii. Daily Graph A column graph which can be graphed for periods of less
than 365 days. You cannot overlay these graphs with Standard Line graphs
iv. Monthly Graph A column graph which can be graphed for periods
between 2 months and 2 years. You cannot overlay these graphs with
Standard Line graphs
SPLASH Monitoring Dashboard and Online Configuration Guide
SPLASH Monitoring
15B Saturn Place, Albany. Auckland
New Zealand P. +64 9 442 0996
E. [email protected] W.www.splashmonitoring.com
Version 19102013
25
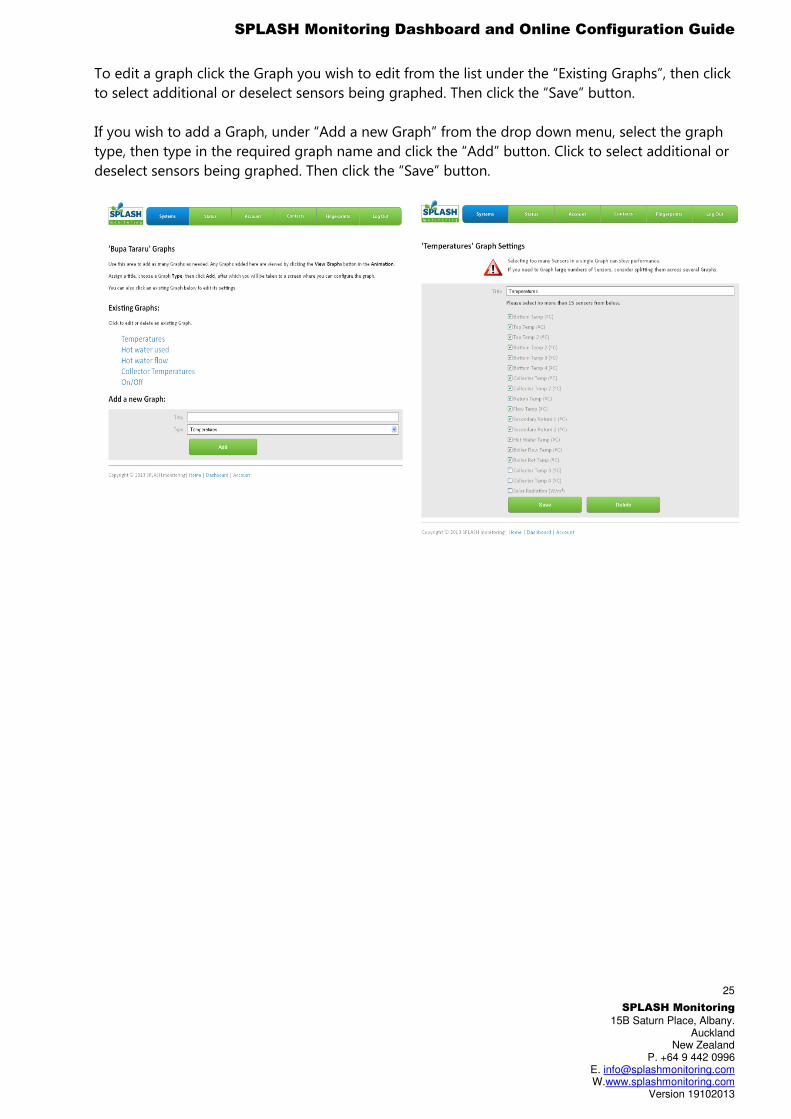
To edit a graph click the Graph you wish to edit from the list under the “Existing Graphs”, then click
to select additional or deselect sensors being graphed. Then click the “Save” button.
If you wish to add a Graph, under “Add a new Graph” from the drop down menu, select the graph
type, then type in the required graph name and click the “Add” button. Click to select additional or
deselect sensors being graphed. Then click the “Save” button.
SPLASH Monitoring Dashboard and Online Configuration Guide
SPLASH Monitoring
15B Saturn Place, Albany. Auckland
New Zealand P. +64 9 442 0996
E. [email protected] W.www.splashmonitoring.com
Version 19102013
26
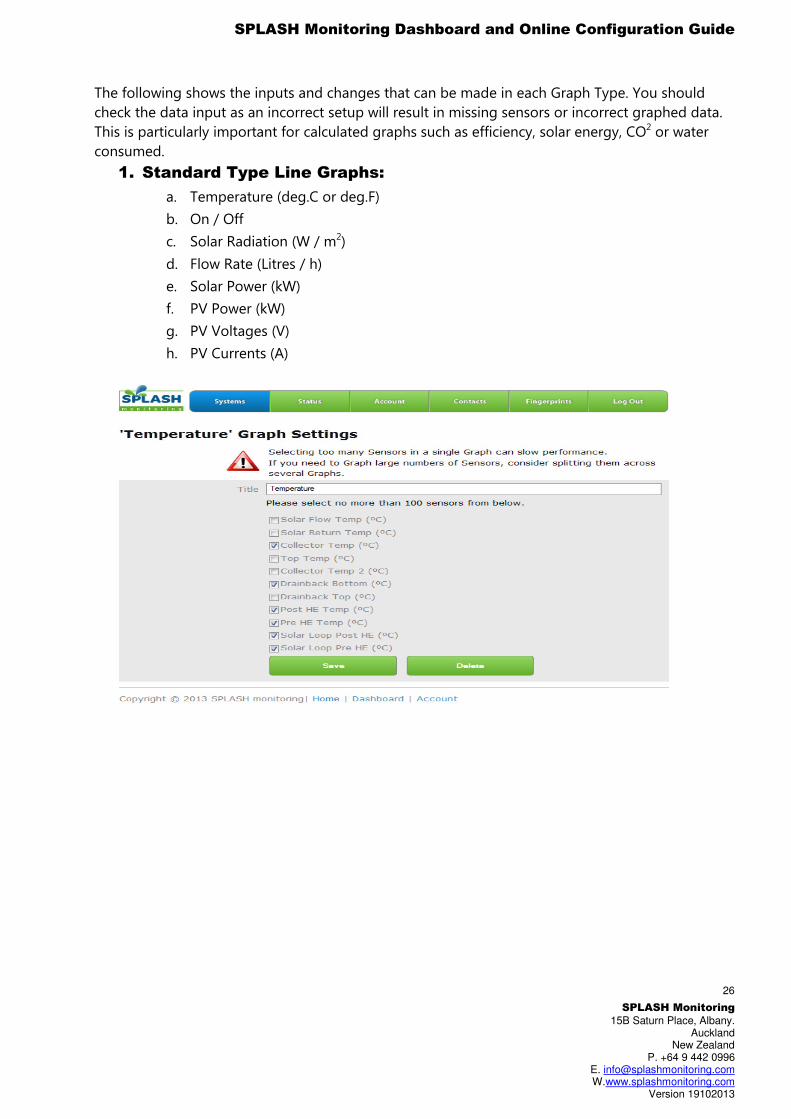
The following shows the inputs and changes that can be made in each Graph Type. You should
check the data input as an incorrect setup will result in missing sensors or incorrect graphed data.
This is particularly important for calculated graphs such as efficiency, solar energy, CO2 or water
consumed.
1. Standard Type Line Graphs:
a. Temperature (deg.C or deg.F)
b. On / Off
c. Solar Radiation (W / m2)
d. Flow Rate (Litres / h)
e. Solar Power (kW)
f. PV Power (kW)
g. PV Voltages (V)
h. PV Currents (A)
SPLASH Monitoring Dashboard and Online Configuration Guide
SPLASH Monitoring
15B Saturn Place, Albany. Auckland
New Zealand P. +64 9 442 0996
E. [email protected] W.www.splashmonitoring.com
Version 19102013
27
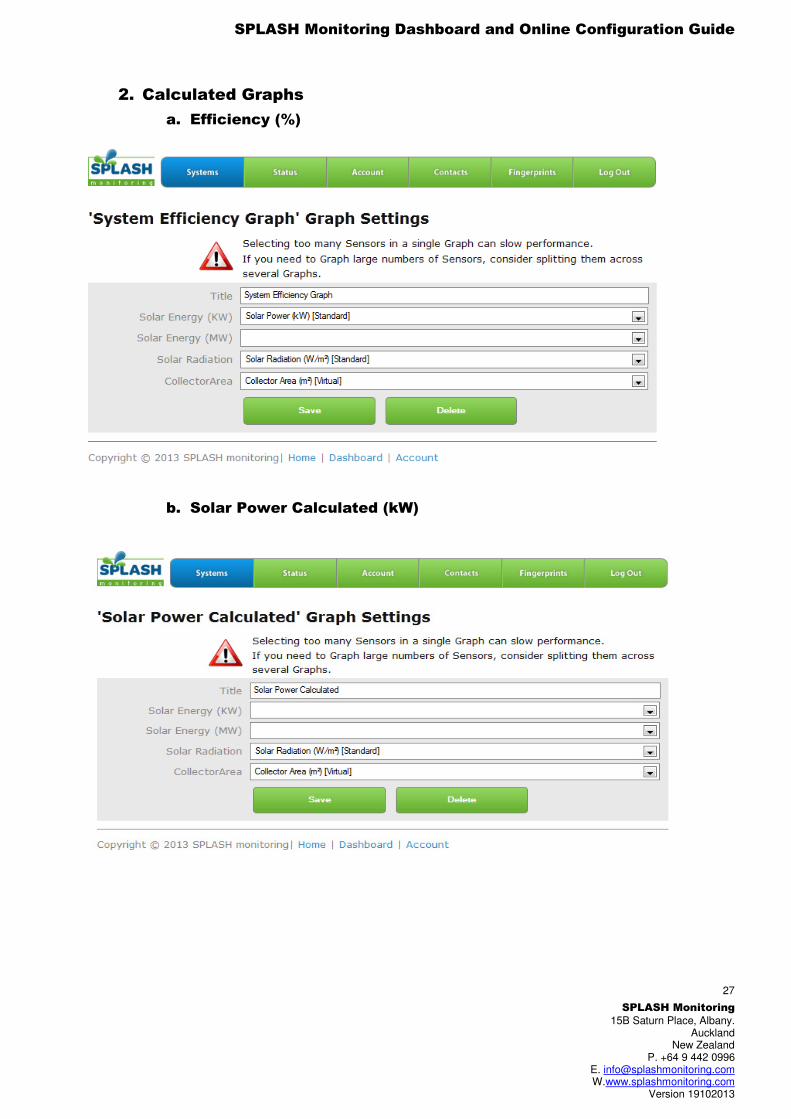
2. Calculated Graphs
a. Efficiency (%)
b. Solar Power Calculated (kW)
SPLASH Monitoring Dashboard and Online Configuration Guide
SPLASH Monitoring
15B Saturn Place, Albany. Auckland
New Zealand P. +64 9 442 0996
E. [email protected] W.www.splashmonitoring.com
Version 19102013
28
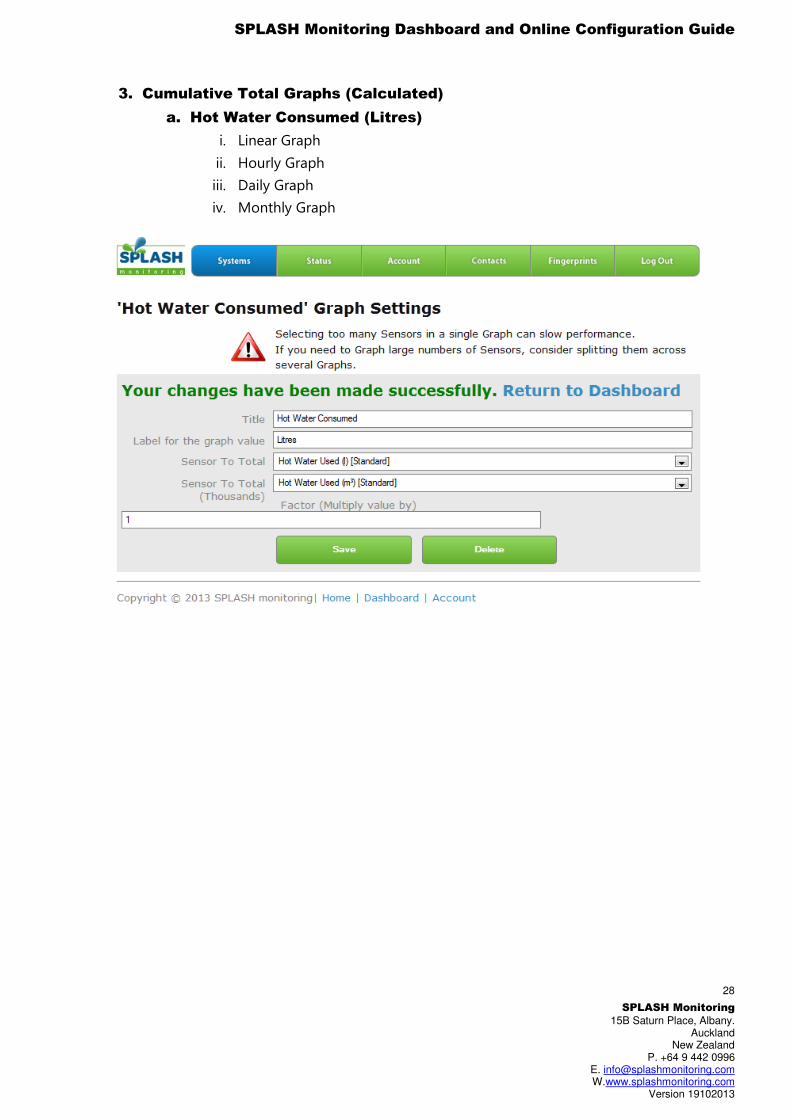
3. Cumulative Total Graphs (Calculated)
a. Hot Water Consumed (Litres)
i. Linear Graph
ii. Hourly Graph
iii. Daily Graph
iv. Monthly Graph
SPLASH Monitoring Dashboard and Online Configuration Guide
SPLASH Monitoring
15B Saturn Place, Albany. Auckland
New Zealand P. +64 9 442 0996
E. [email protected] W.www.splashmonitoring.com
Version 19102013
29
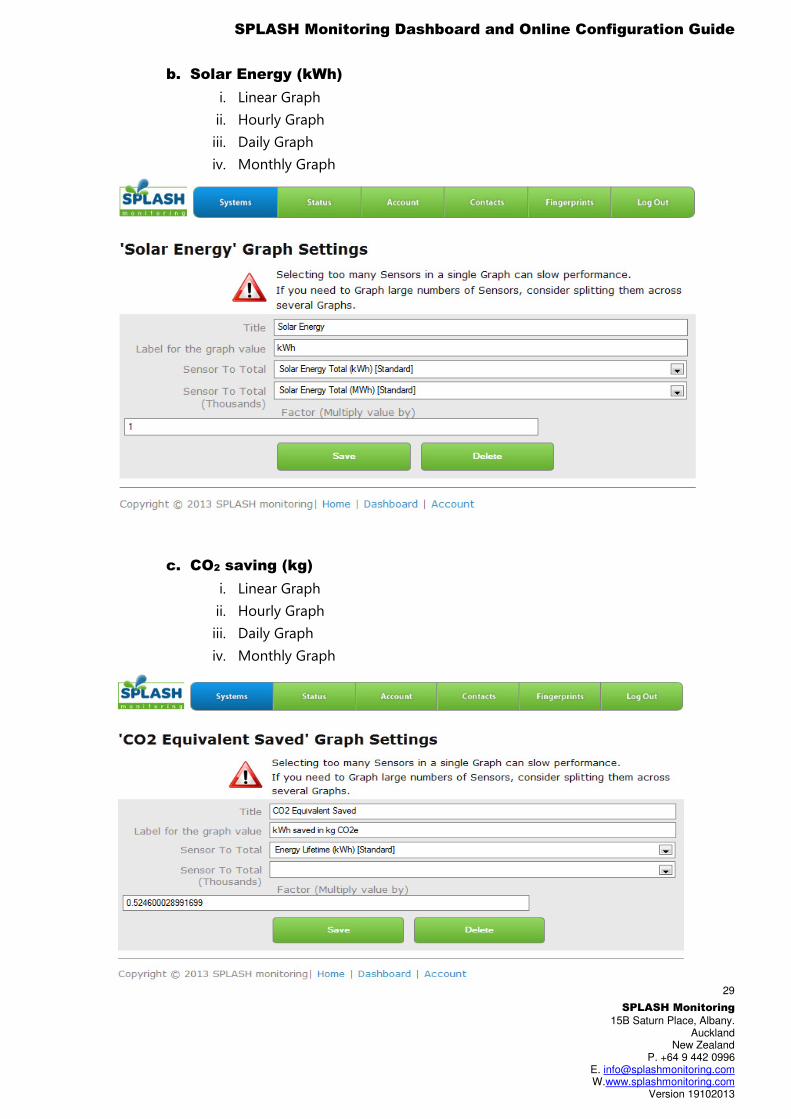
b. Solar Energy (kWh)
i. Linear Graph
ii. Hourly Graph
iii. Daily Graph
iv. Monthly Graph
c. CO2 saving (kg)
i. Linear Graph
ii. Hourly Graph
iii. Daily Graph
iv. Monthly Graph
SPLASH Monitoring Dashboard and Online Configuration Guide
SPLASH Monitoring
15B Saturn Place, Albany. Auckland
New Zealand P. +64 9 442 0996
E. [email protected] W.www.splashmonitoring.com
Version 19102013
30
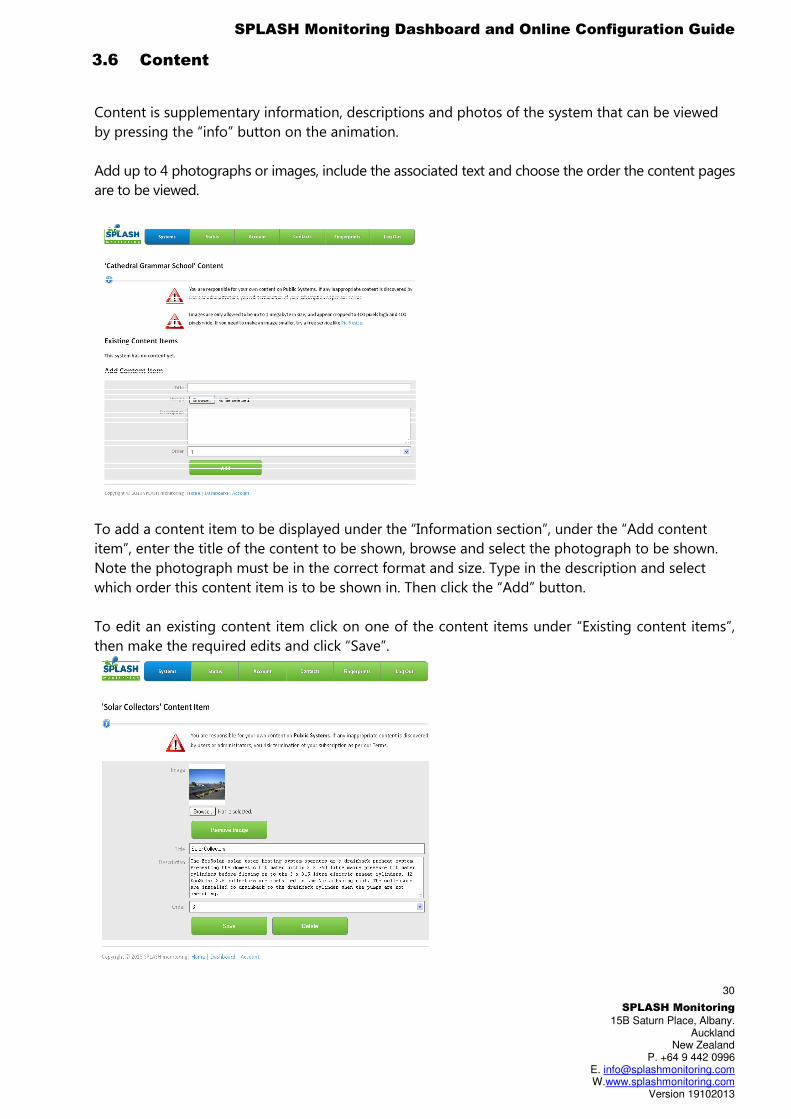
Content is supplementary information, descriptions and photos of the system that can be viewed
by pressing the “info” button on the animation.
Add up to 4 photographs or images, include the associated text and choose the order the content pages
are to be viewed.
To add a content item to be displayed under the “Information section”, under the “Add content
item”, enter the title of the content to be shown, browse and select the photograph to be shown.
Note the photograph must be in the correct format and size. Type in the description and select
which order this content item is to be shown in. Then click the “Add” button.
To edit an existing content item click on one of the content items under “Existing content items”,
then make the required edits and click “Save”.
3.6 Content
SPLASH Monitoring Dashboard and Online Configuration Guide
SPLASH Monitoring
15B Saturn Place, Albany. Auckland
New Zealand P. +64 9 442 0996
E. [email protected] W.www.splashmonitoring.com
Version 19102013
31
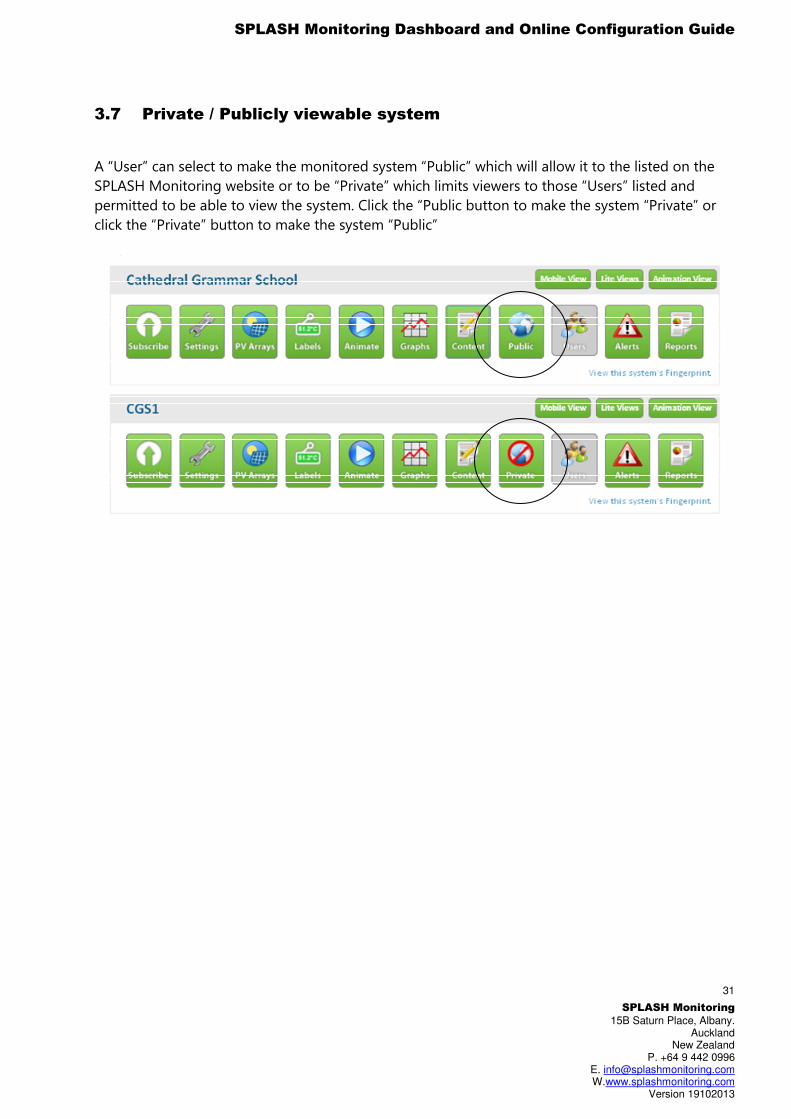
A “User” can select to make the monitored system “Public” which will allow it to the listed on the
SPLASH Monitoring website or to be “Private” which limits viewers to those “Users” listed and
permitted to be able to view the system. Click the “Public button to make the system “Private” or
click the “Private” button to make the system “Public”
3.7 Private / Publicly viewable system
SPLASH Monitoring Dashboard and Online Configuration Guide
SPLASH Monitoring
15B Saturn Place, Albany. Auckland
New Zealand P. +64 9 442 0996
E. [email protected] W.www.splashmonitoring.com
Version 19102013
32
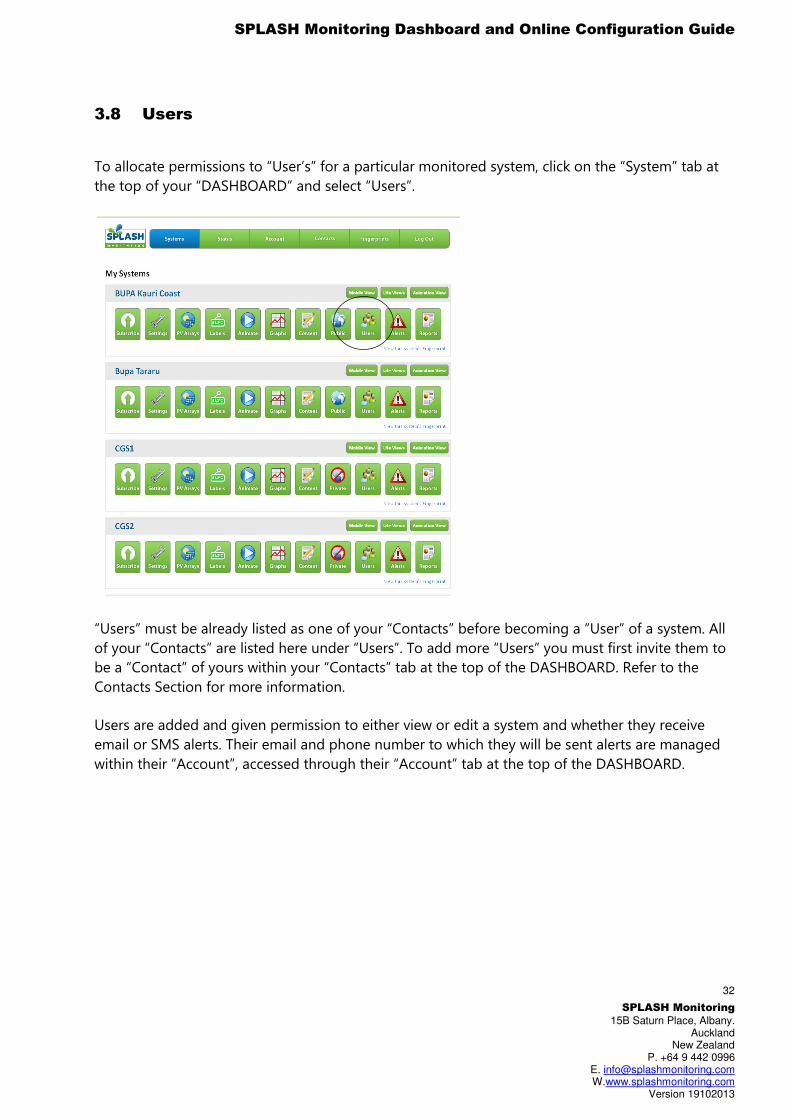
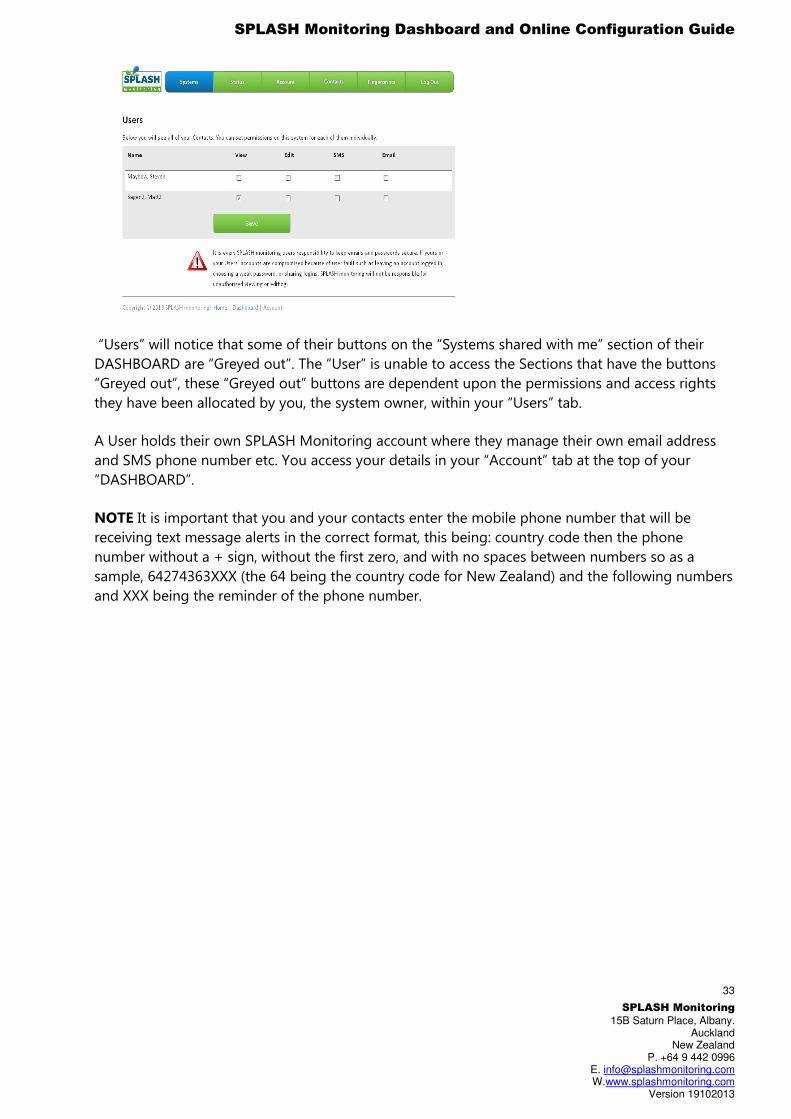
To allocate permissions to “User’s” for a particular monitored system, click on the “System” tab at
the top of your “DASHBOARD” and select “Users”.
“Users” must be already listed as one of your “Contacts” before becoming a “User” of a system. All
of your “Contacts” are listed here under “Users”. To add more “Users” you must first invite them to
be a “Contact” of yours within your “Contacts” tab at the top of the DASHBOARD. Refer to the
Contacts Section for more information.
Users are added and given permission to either view or edit a system and whether they receive
email or SMS alerts. Their email and phone number to which they will be sent alerts are managed
within their “Account”, accessed through their “Account” tab at the top of the DASHBOARD.
3.8 Users
SPLASH Monitoring Dashboard and Online Configuration Guide
SPLASH Monitoring
15B Saturn Place, Albany. Auckland
New Zealand P. +64 9 442 0996
E. [email protected] W.www.splashmonitoring.com
Version 19102013
33
“Users” will notice that some of their buttons on the “Systems shared with me” section of their
DASHBOARD are “Greyed out”. The “User” is unable to access the Sections that have the buttons
“Greyed out”, these “Greyed out” buttons are dependent upon the permissions and access rights
they have been allocated by you, the system owner, within your “Users” tab.
A User holds their own SPLASH Monitoring account where they manage their own email address
and SMS phone number etc. You access your details in your “Account” tab at the top of your
“DASHBOARD”.
NOTE It is important that you and your contacts enter the mobile phone number that will be
receiving text message alerts in the correct format, this being: country code then the phone
number without a + sign, without the first zero, and with no spaces between numbers so as a
sample, 64274363XXX (the 64 being the country code for New Zealand) and the following numbers
and XXX being the reminder of the phone number.
SPLASH Monitoring Dashboard and Online Configuration Guide
SPLASH Monitoring
15B Saturn Place, Albany. Auckland
New Zealand P. +64 9 442 0996
E. [email protected] W.www.splashmonitoring.com
Version 19102013
34
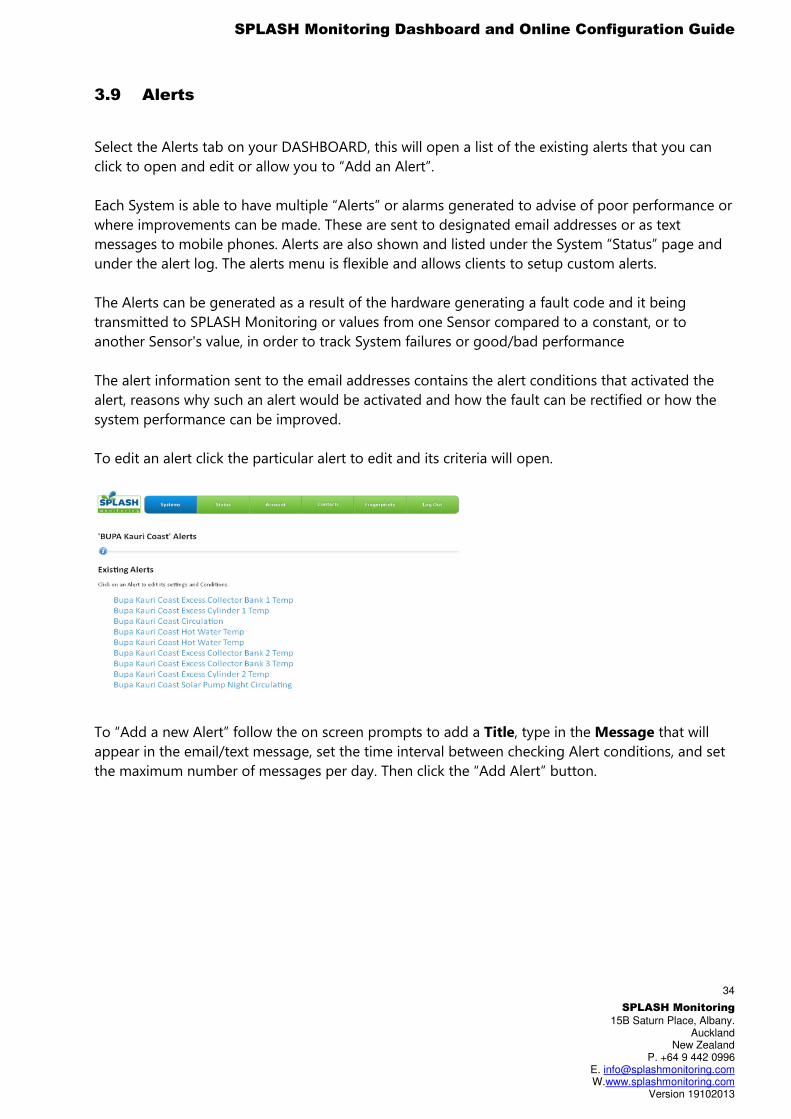
Select the Alerts tab on your DASHBOARD, this will open a list of the existing alerts that you can
click to open and edit or allow you to “Add an Alert”.
Each System is able to have multiple “Alerts” or alarms generated to advise of poor performance or
where improvements can be made. These are sent to designated email addresses or as text
messages to mobile phones. Alerts are also shown and listed under the System “Status” page and
under the alert log. The alerts menu is flexible and allows clients to setup custom alerts.
The Alerts can be generated as a result of the hardware generating a fault code and it being
transmitted to SPLASH Monitoring or values from one Sensor compared to a constant, or to
another Sensor's value, in order to track System failures or good/bad performance
The alert information sent to the email addresses contains the alert conditions that activated the
alert, reasons why such an alert would be activated and how the fault can be rectified or how the
system performance can be improved.
To edit an alert click the particular alert to edit and its criteria will open.
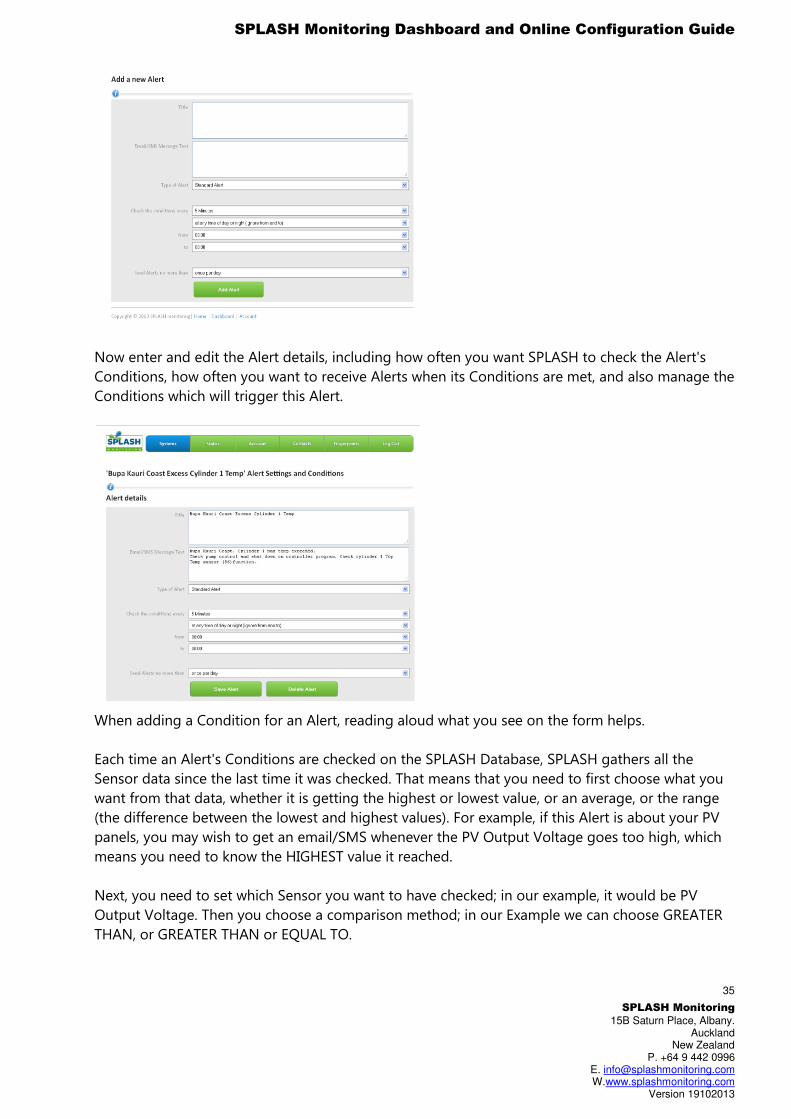
To “Add a new Alert” follow the on screen prompts to add a Title, type in the Message that will
appear in the email/text message, set the time interval between checking Alert conditions, and set
the maximum number of messages per day. Then click the “Add Alert” button.
3.9 Alerts
SPLASH Monitoring Dashboard and Online Configuration Guide
SPLASH Monitoring
15B Saturn Place, Albany. Auckland
New Zealand P. +64 9 442 0996
E. [email protected] W.www.splashmonitoring.com
Version 19102013
35
Now enter and edit the Alert details, including how often you want SPLASH to check the Alert's
Conditions, how often you want to receive Alerts when its Conditions are met, and also manage the
Conditions which will trigger this Alert.
When adding a Condition for an Alert, reading aloud what you see on the form helps.
Each time an Alert's Conditions are checked on the SPLASH Database, SPLASH gathers all the
Sensor data since the last time it was checked. That means that you need to first choose what you
want from that data, whether it is getting the highest or lowest value, or an average, or the range
(the difference between the lowest and highest values). For example, if this Alert is about your PV
panels, you may wish to get an email/SMS whenever the PV Output Voltage goes too high, which
means you need to know the HIGHEST value it reached.
Next, you need to set which Sensor you want to have checked; in our example, it would be PV
Output Voltage. Then you choose a comparison method; in our Example we can choose GREATER
THAN, or GREATER THAN or EQUAL TO.
SPLASH Monitoring Dashboard and Online Configuration Guide
SPLASH Monitoring
15B Saturn Place, Albany. Auckland
New Zealand P. +64 9 442 0996
E. [email protected] W.www.splashmonitoring.com
Version 19102013
36
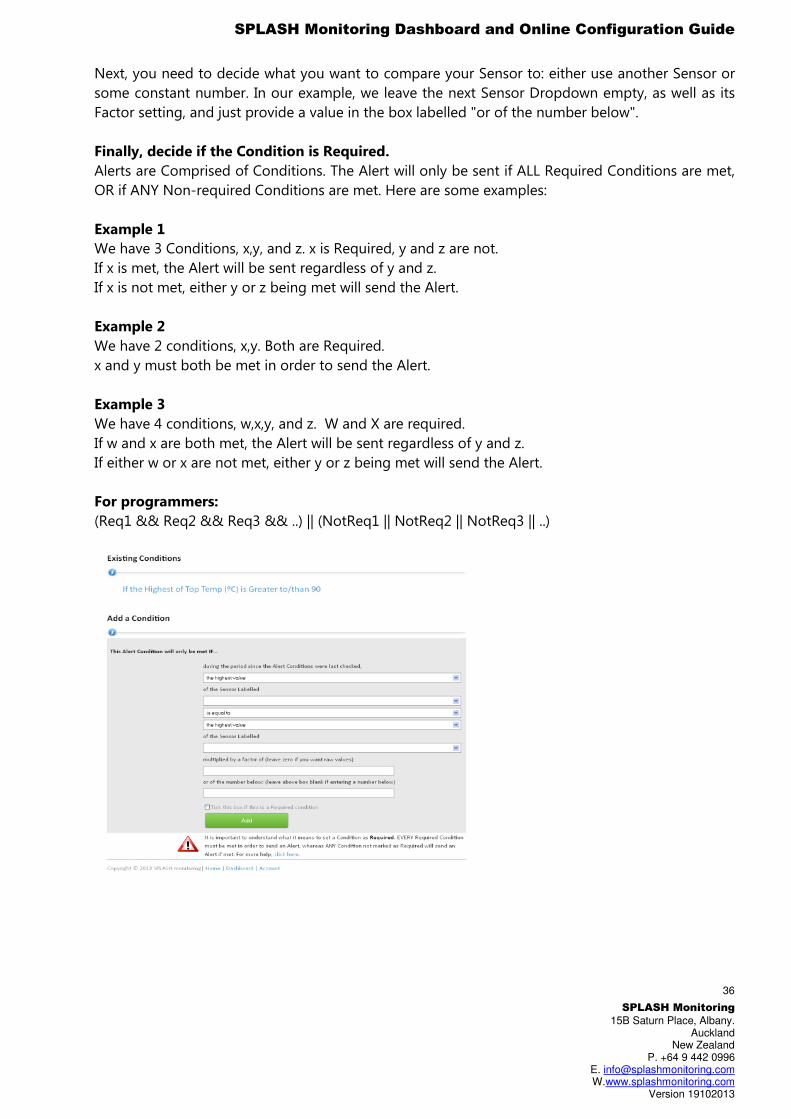
Next, you need to decide what you want to compare your Sensor to: either use another Sensor or
some constant number. In our example, we leave the next Sensor Dropdown empty, as well as its
Factor setting, and just provide a value in the box labelled "or of the number below".
Finally, decide if the Condition is Required.
Alerts are Comprised of Conditions. The Alert will only be sent if ALL Required Conditions are met,
OR if ANY Non-required Conditions are met. Here are some examples:
Example 1
We have 3 Conditions, x,y, and z. x is Required, y and z are not.
If x is met, the Alert will be sent regardless of y and z.
If x is not met, either y or z being met will send the Alert.
Example 2
We have 2 conditions, x,y. Both are Required.
x and y must both be met in order to send the Alert.
Example 3
We have 4 conditions, w,x,y, and z. W and X are required.
If w and x are both met, the Alert will be sent regardless of y and z.
If either w or x are not met, either y or z being met will send the Alert.
For programmers:
(Req1 && Req2 && Req3 && ..) || (NotReq1 || NotReq2 || NotReq3 || ..)
SPLASH Monitoring Dashboard and Online Configuration Guide
SPLASH Monitoring
15B Saturn Place, Albany. Auckland
New Zealand P. +64 9 442 0996
E. [email protected] W.www.splashmonitoring.com
Version 19102013
37
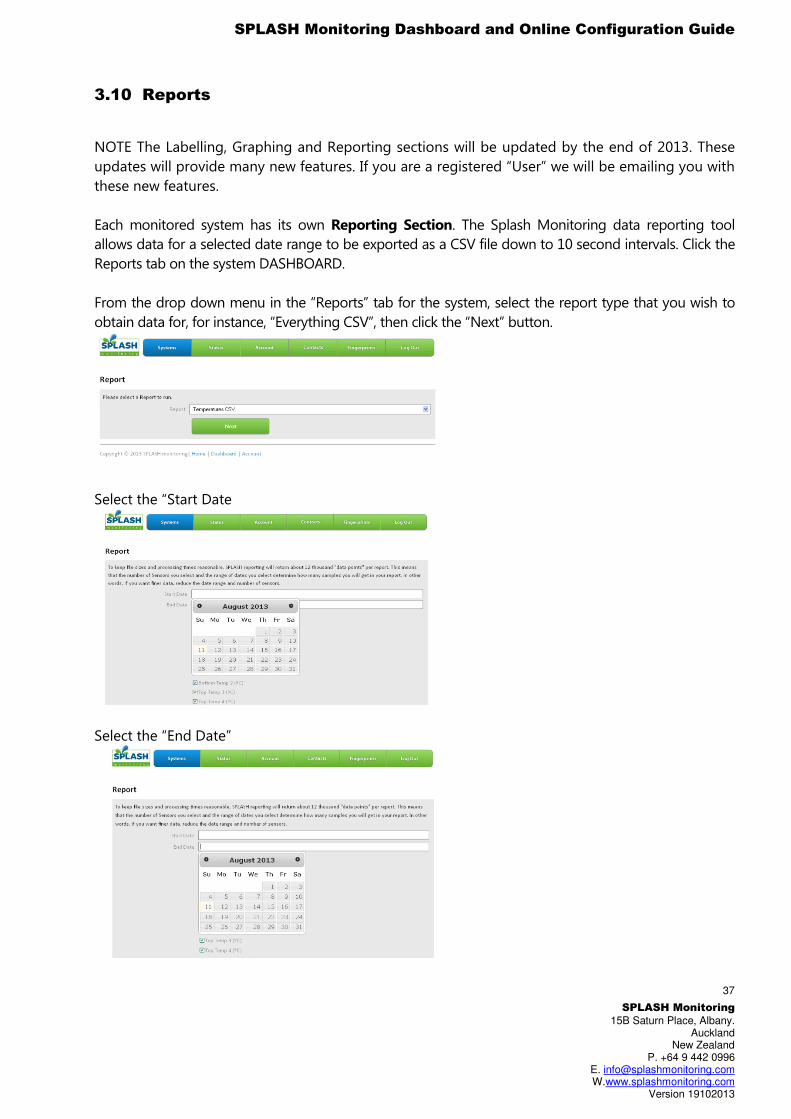
NOTE The Labelling, Graphing and Reporting sections will be updated by the end of 2013. These
updates will provide many new features. If you are a registered “User” we will be emailing you with
these new features.
Each monitored system has its own Reporting Section. The Splash Monitoring data reporting tool
allows data for a selected date range to be exported as a CSV file down to 10 second intervals. Click the
Reports tab on the system DASHBOARD.
From the drop down menu in the “Reports” tab for the system, select the report type that you wish to
obtain data for, for instance, “Everything CSV”, then click the “Next” button.
Select the “Start Date
Select the “End Date”
3.10 Reports
SPLASH Monitoring Dashboard and Online Configuration Guide
SPLASH Monitoring
15B Saturn Place, Albany. Auckland
New Zealand P. +64 9 442 0996
E. [email protected] W.www.splashmonitoring.com
Version 19102013
38
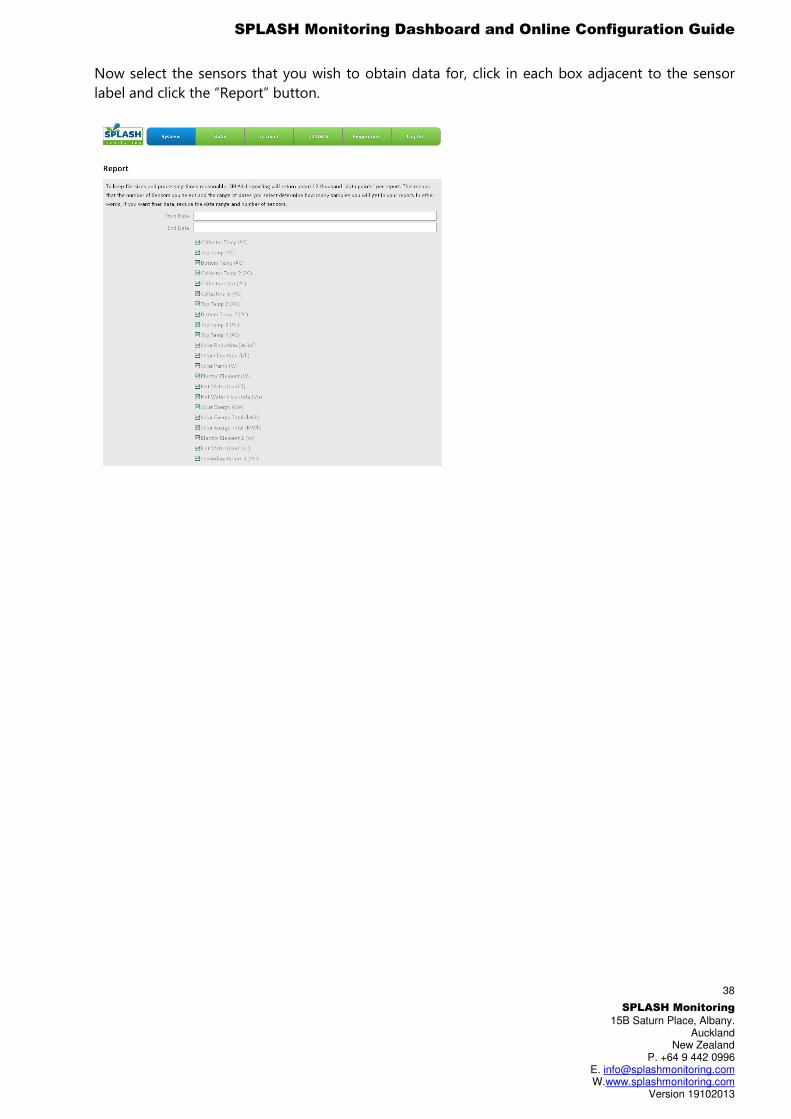
Now select the sensors that you wish to obtain data for, click in each box adjacent to the sensor
label and click the “Report” button.
SPLASH Monitoring Dashboard and Online Configuration Guide
SPLASH Monitoring
15B Saturn Place, Albany. Auckland
New Zealand P. +64 9 442 0996
E. [email protected] W.www.splashmonitoring.com
Version 19102013
39
4.0 Status
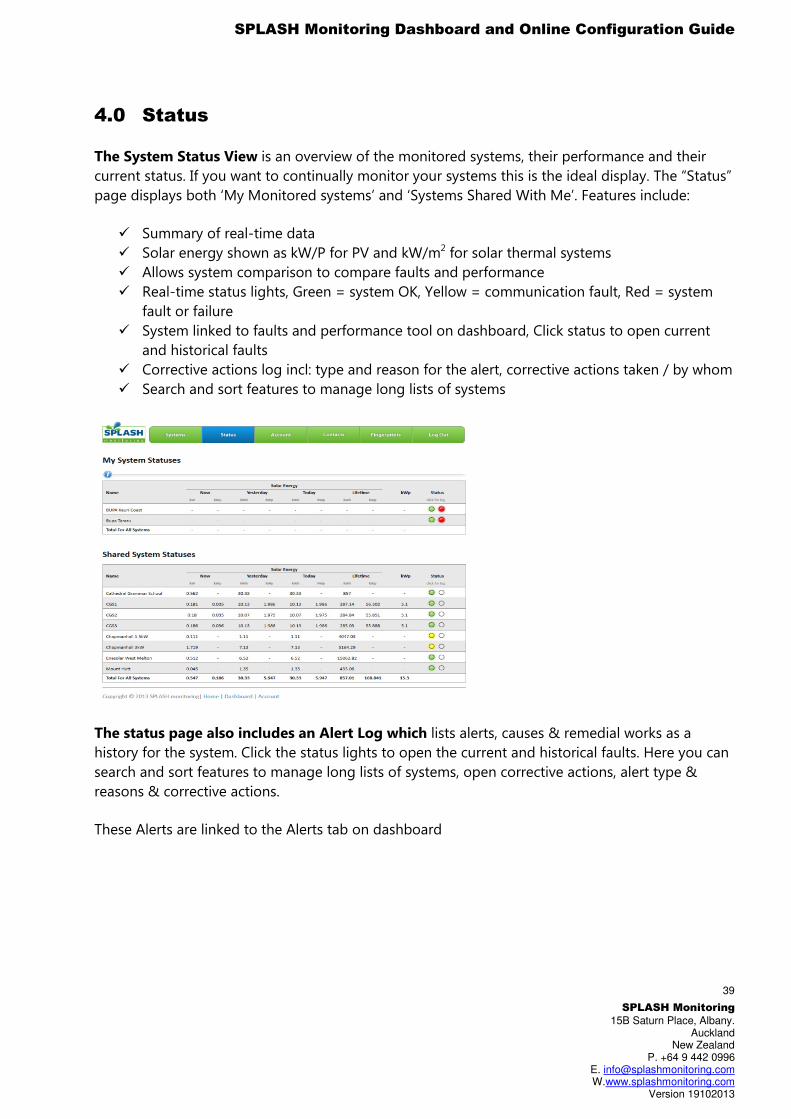
The System Status View is an overview of the monitored systems, their performance and their
current status. If you want to continually monitor your systems this is the ideal display. The “Status”
page displays both ‘My Monitored systems’ and ‘Systems Shared With Me’. Features include:
� Summary of real-time data
� Solar energy shown as kW/P for PV and kW/m2 for solar thermal systems
� Allows system comparison to compare faults and performance
� Real-time status lights, Green = system OK, Yellow = communication fault, Red = system
fault or failure
� System linked to faults and performance tool on dashboard, Click status to open current
and historical faults
� Corrective actions log incl: type and reason for the alert, corrective actions taken / by whom
� Search and sort features to manage long lists of systems
The status page also includes an Alert Log which lists alerts, causes & remedial works as a
history for the system. Click the status lights to open the current and historical faults. Here you can
search and sort features to manage long lists of systems, open corrective actions, alert type &
reasons & corrective actions.
These Alerts are linked to the Alerts tab on dashboard
SPLASH Monitoring Dashboard and Online Configuration Guide
SPLASH Monitoring
15B Saturn Place, Albany. Auckland
New Zealand P. +64 9 442 0996
E. [email protected] W.www.splashmonitoring.com
Version 19102013
40
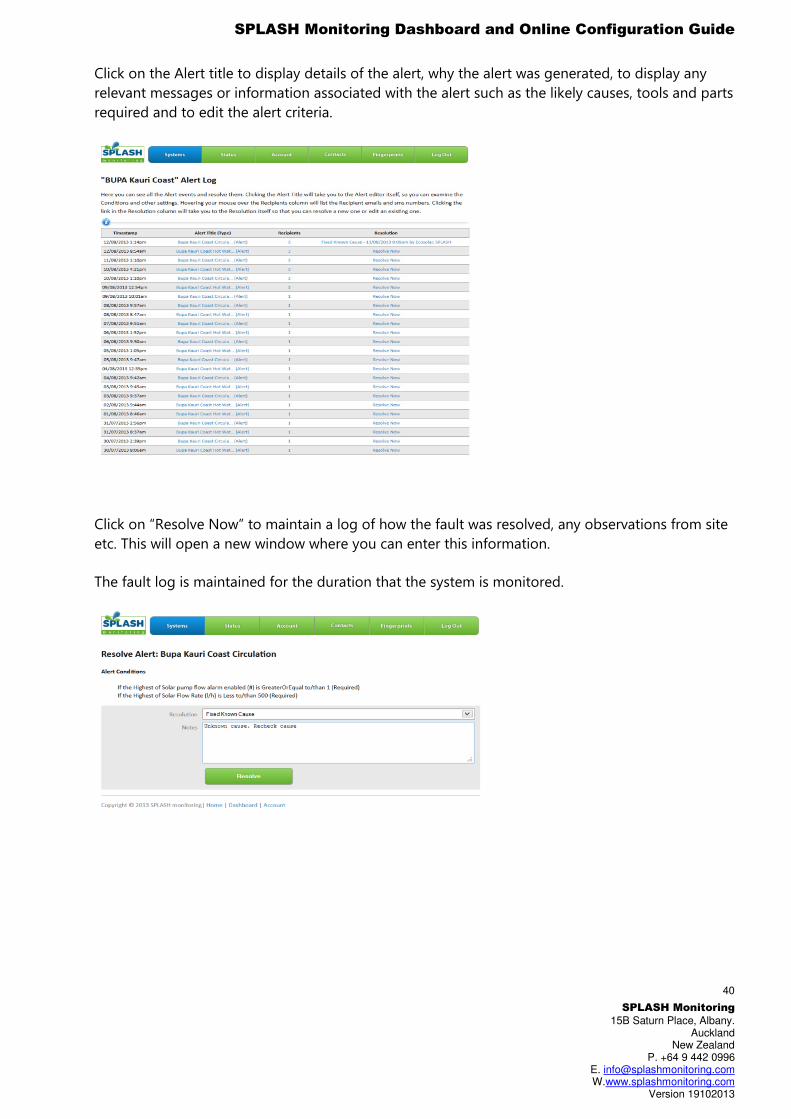
Click on the Alert title to display details of the alert, why the alert was generated, to display any
relevant messages or information associated with the alert such as the likely causes, tools and parts
required and to edit the alert criteria.
Click on “Resolve Now” to maintain a log of how the fault was resolved, any observations from site
etc. This will open a new window where you can enter this information.
The fault log is maintained for the duration that the system is monitored.
SPLASH Monitoring Dashboard and Online Configuration Guide
SPLASH Monitoring
15B Saturn Place, Albany. Auckland
New Zealand P. +64 9 442 0996
E. [email protected] W.www.splashmonitoring.com
Version 19102013
41
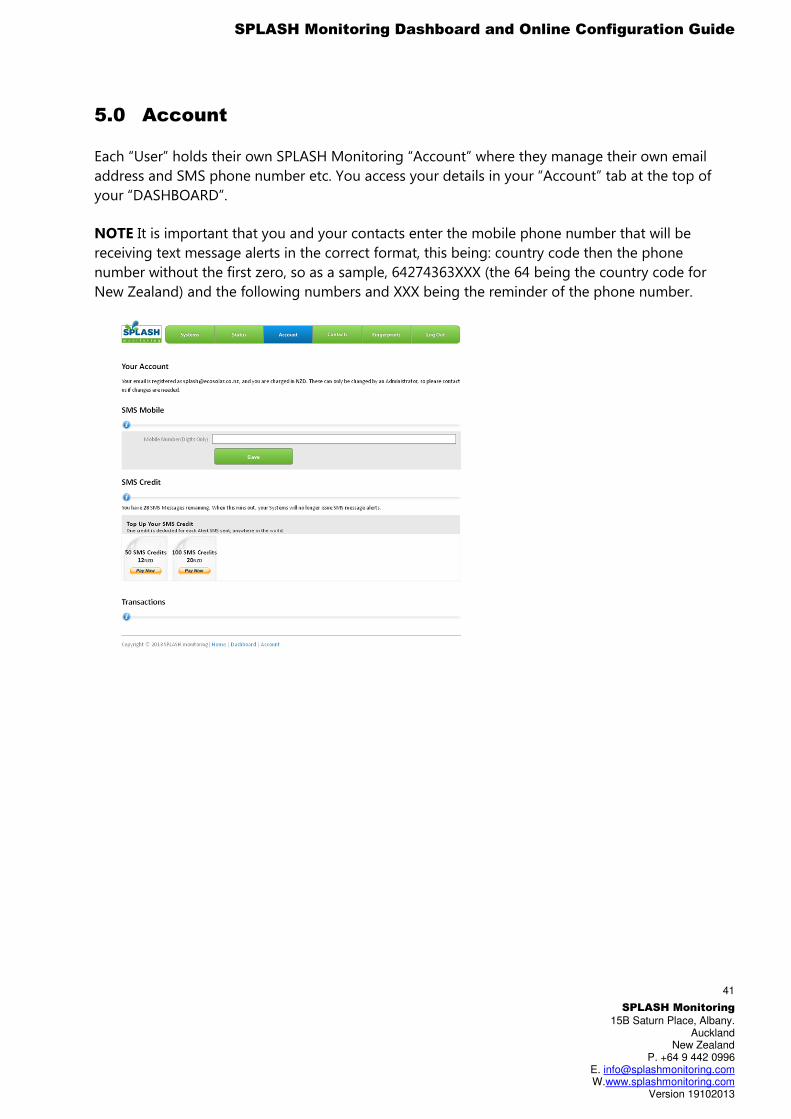
5.0 Account
Each “User” holds their own SPLASH Monitoring “Account” where they manage their own email
address and SMS phone number etc. You access your details in your “Account” tab at the top of
your “DASHBOARD”.
NOTE It is important that you and your contacts enter the mobile phone number that will be
receiving text message alerts in the correct format, this being: country code then the phone
number without the first zero, so as a sample, 64274363XXX (the 64 being the country code for
New Zealand) and the following numbers and XXX being the reminder of the phone number.
SPLASH Monitoring Dashboard and Online Configuration Guide
SPLASH Monitoring
15B Saturn Place, Albany. Auckland
New Zealand P. +64 9 442 0996
E. [email protected] W.www.splashmonitoring.com
Version 19102013
42
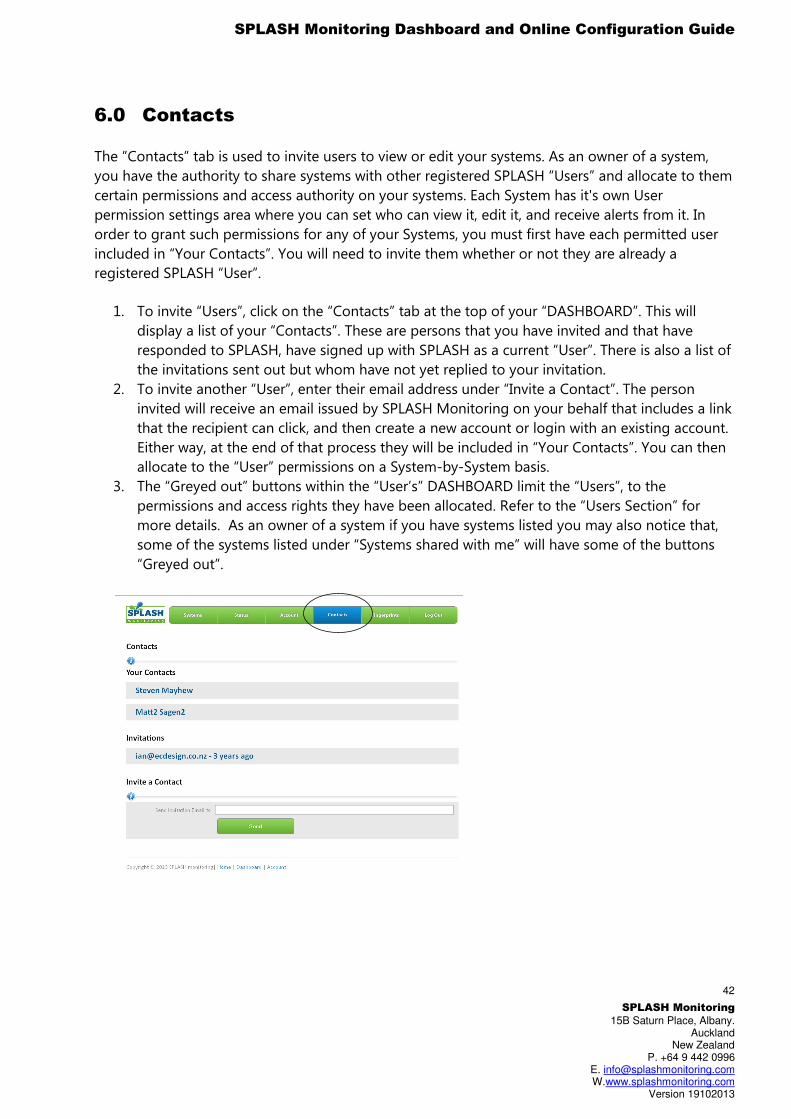
6.0 Contacts
The ”Contacts” tab is used to invite users to view or edit your systems. As an owner of a system,
you have the authority to share systems with other registered SPLASH “Users” and allocate to them
certain permissions and access authority on your systems. Each System has it's own User
permission settings area where you can set who can view it, edit it, and receive alerts from it. In
order to grant such permissions for any of your Systems, you must first have each permitted user
included in “Your Contacts”. You will need to invite them whether or not they are already a
registered SPLASH “User”.
1. To invite “Users”, click on the “Contacts” tab at the top of your “DASHBOARD”. This will
display a list of your “Contacts”. These are persons that you have invited and that have
responded to SPLASH, have signed up with SPLASH as a current “User”. There is also a list of
the invitations sent out but whom have not yet replied to your invitation.
2. To invite another “User”, enter their email address under “Invite a Contact”. The person
invited will receive an email issued by SPLASH Monitoring on your behalf that includes a link
that the recipient can click, and then create a new account or login with an existing account.
Either way, at the end of that process they will be included in “Your Contacts”. You can then
allocate to the “User” permissions on a System-by-System basis.
3. The “Greyed out” buttons within the “User’s” DASHBOARD limit the “Users”, to the
permissions and access rights they have been allocated. Refer to the “Users Section” for
more details. As an owner of a system if you have systems listed you may also notice that,
some of the systems listed under “Systems shared with me” will have some of the buttons
“Greyed out”.

SPLASH Monitoring Dashboard and Online Configuration Guide
SPLASH Monitoring
15B Saturn Place, Albany. Auckland
New Zealand P. +64 9 442 0996
E. [email protected] W.www.splashmonitoring.com
Version 19102013
43
4. To allocate permissions for a particular monitored system, click on the “System” tab at the
top of your “DASHBOARD” and select “Users”. Refer to the “User Section for more details.”
SPLASH Monitoring Dashboard and Online Configuration Guide
SPLASH Monitoring
15B Saturn Place, Albany. Auckland
New Zealand P. +64 9 442 0996
E. [email protected] W.www.splashmonitoring.com
Version 19102013
44
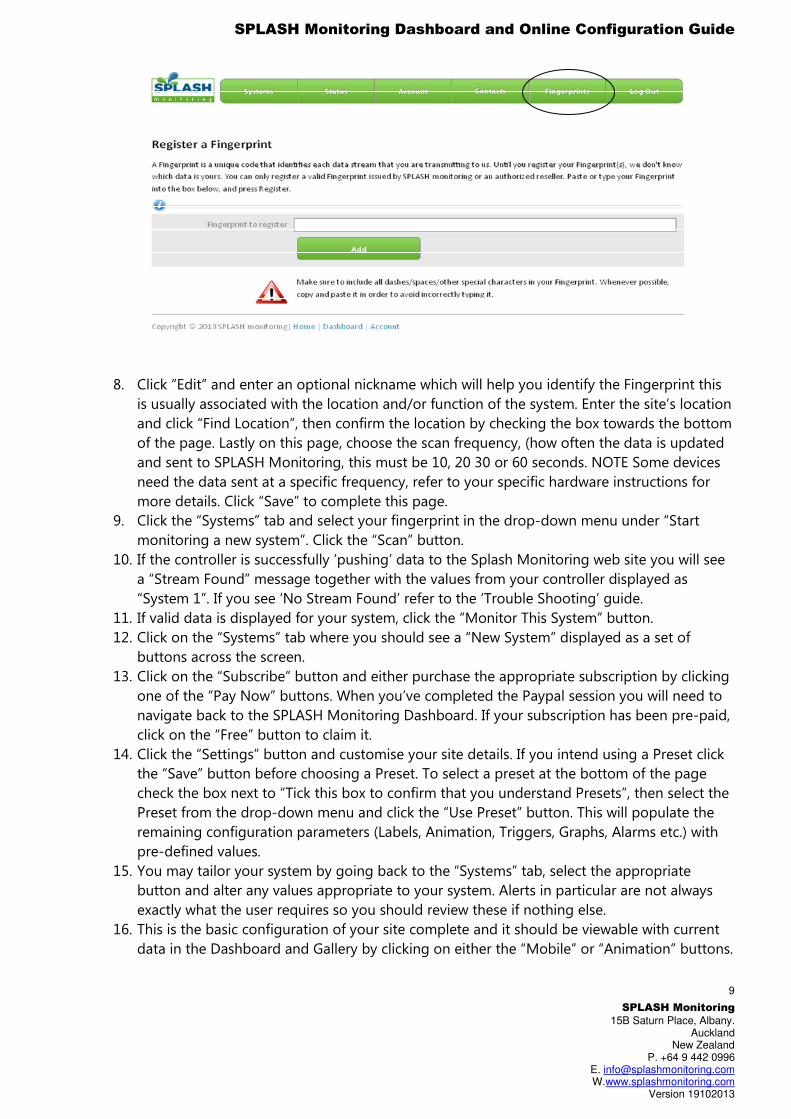
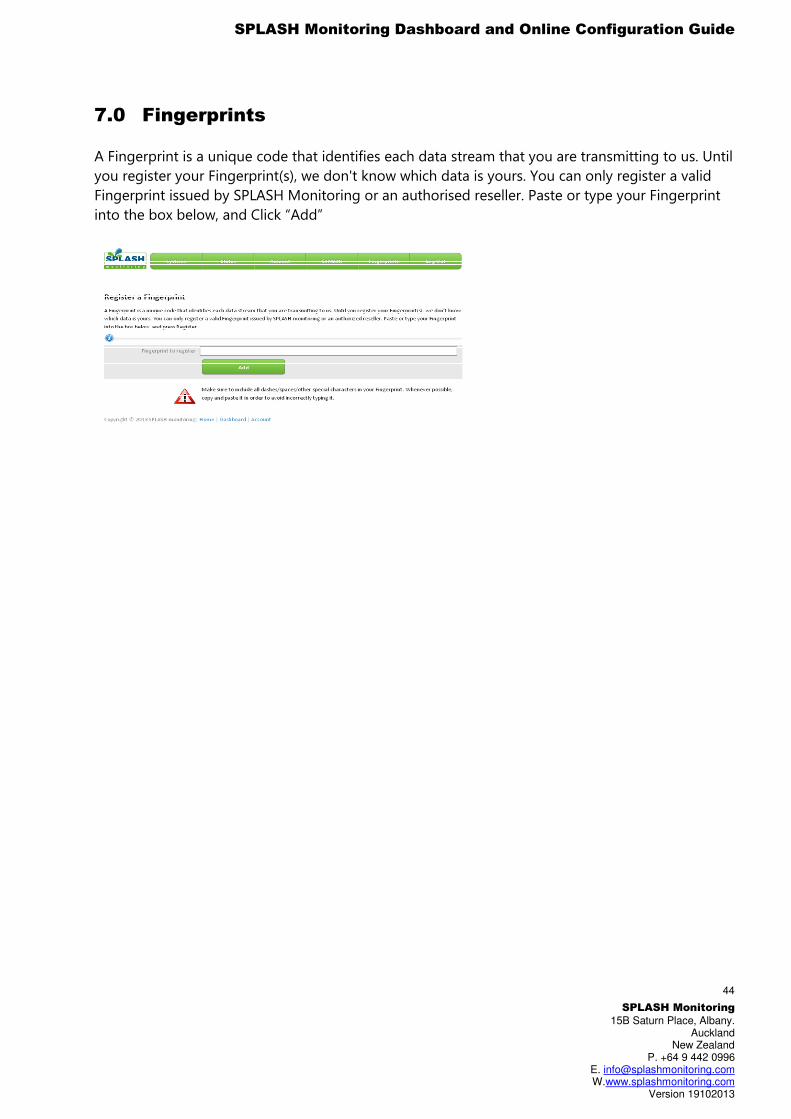
7.0 Fingerprints
A Fingerprint is a unique code that identifies each data stream that you are transmitting to us. Until
you register your Fingerprint(s), we don't know which data is yours. You can only register a valid
Fingerprint issued by SPLASH Monitoring or an authorised reseller. Paste or type your Fingerprint
into the box below, and Click “Add”
SPLASH Monitoring Dashboard and Online Configuration Guide
SPLASH Monitoring
15B Saturn Place, Albany. Auckland
New Zealand P. +64 9 442 0996
E. [email protected] W.www.splashmonitoring.com
Version 19102013
45
8.0 Features of SPLASH Monitoring
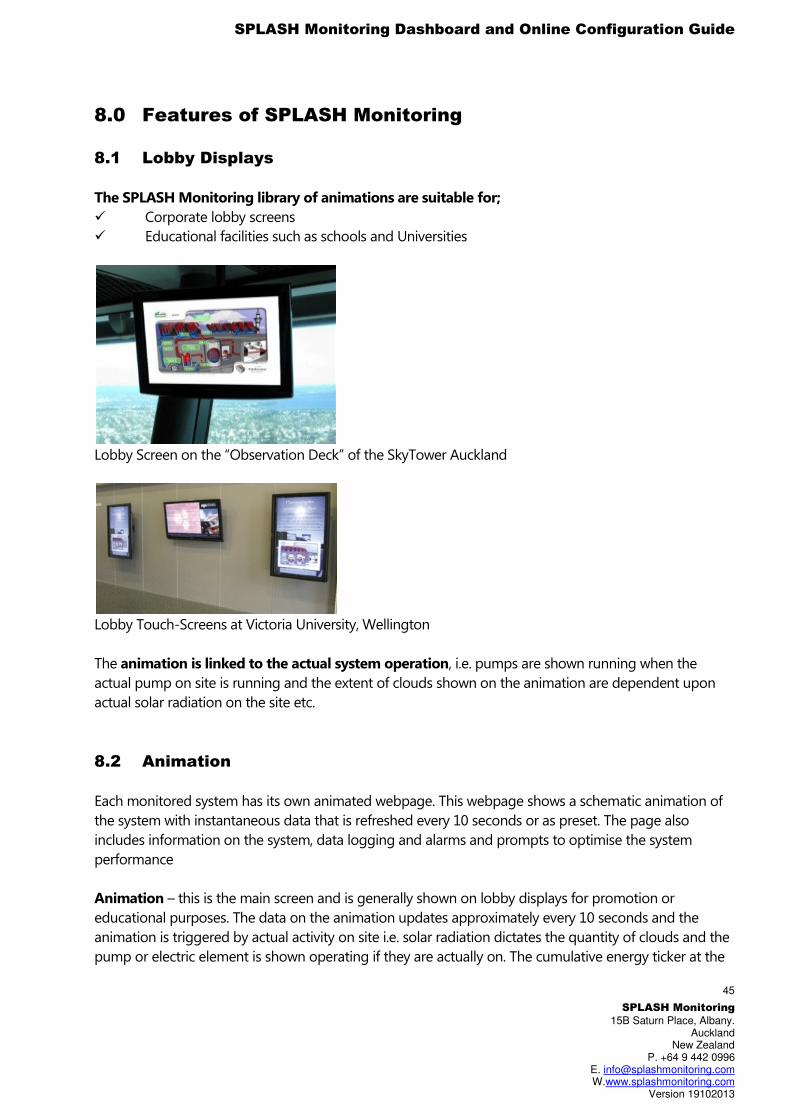
8.1 Lobby Displays
The SPLASH Monitoring library of animations are suitable for;
� Corporate lobby screens
� Educational facilities such as schools and Universities
Lobby Screen on the “Observation Deck” of the SkyTower Auckland
Lobby Touch-Screens at Victoria University, Wellington
The animation is linked to the actual system operation, i.e. pumps are shown running when the
actual pump on site is running and the extent of clouds shown on the animation are dependent upon
actual solar radiation on the site etc.
8.2 Animation
Each monitored system has its own animated webpage. This webpage shows a schematic animation of
the system with instantaneous data that is refreshed every 10 seconds or as preset. The page also
includes information on the system, data logging and alarms and prompts to optimise the system
performance
Animation – this is the main screen and is generally shown on lobby displays for promotion or
educational purposes. The data on the animation updates approximately every 10 seconds and the
animation is triggered by actual activity on site i.e. solar radiation dictates the quantity of clouds and the
pump or electric element is shown operating if they are actually on. The cumulative energy ticker at the
SPLASH Monitoring Dashboard and Online Configuration Guide
SPLASH Monitoring
15B Saturn Place, Albany. Auckland
New Zealand P. +64 9 442 0996
E. [email protected] W.www.splashmonitoring.com
Version 19102013
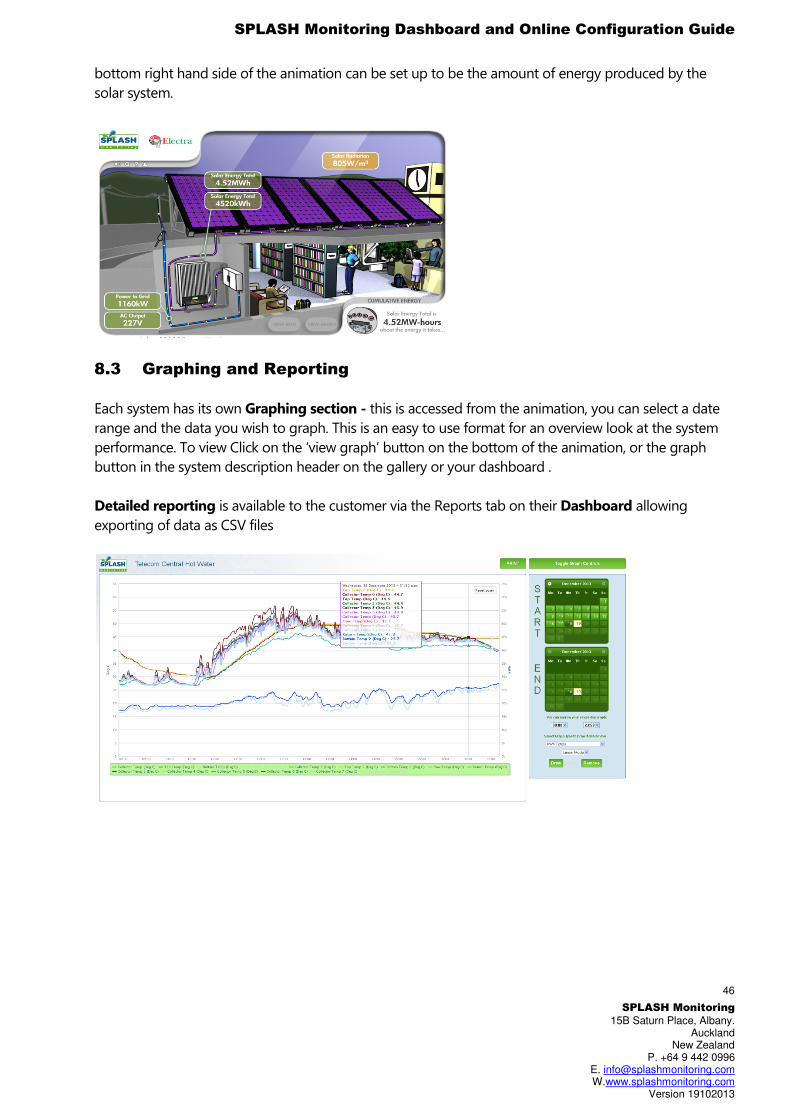
46
bottom right hand side of the animation can be set up to be the amount of energy produced by the
solar system.
8.3 Graphing and Reporting
Each system has its own Graphing section - this is accessed from the animation, you can select a date
range and the data you wish to graph. This is an easy to use format for an overview look at the system
performance. To view Click on the ‘view graph’ button on the bottom of the animation, or the graph
button in the system description header on the gallery or your dashboard .
Detailed reporting is available to the customer via the Reports tab on their Dashboard allowing
exporting of data as CSV files
SPLASH Monitoring Dashboard and Online Configuration Guide
SPLASH Monitoring
15B Saturn Place, Albany. Auckland
New Zealand P. +64 9 442 0996
E. [email protected] W.www.splashmonitoring.com
Version 19102013
47
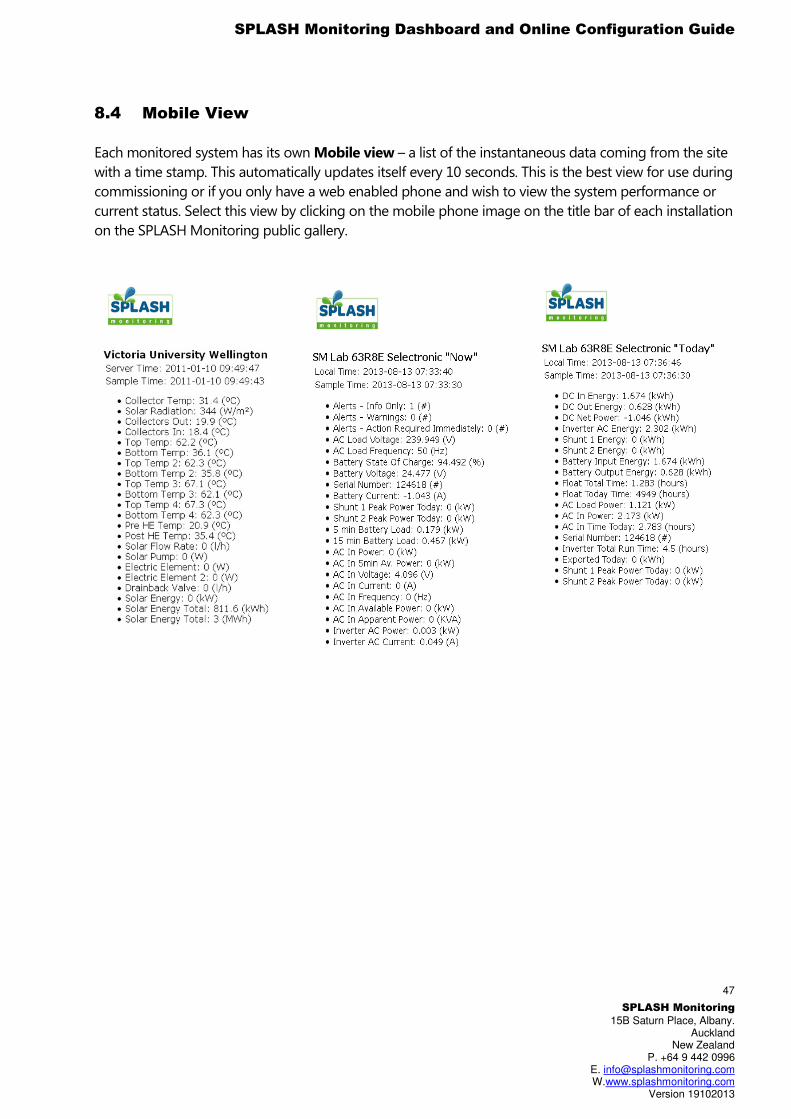
8.4 Mobile View
Each monitored system has its own Mobile view – a list of the instantaneous data coming from the site
with a time stamp. This automatically updates itself every 10 seconds. This is the best view for use during
commissioning or if you only have a web enabled phone and wish to view the system performance or
current status. Select this view by clicking on the mobile phone image on the title bar of each installation
on the SPLASH Monitoring public gallery.
SPLASH Monitoring Dashboard and Online Configuration Guide
SPLASH Monitoring
15B Saturn Place, Albany. Auckland
New Zealand P. +64 9 442 0996
E. [email protected] W.www.splashmonitoring.com
Version 19102013
48
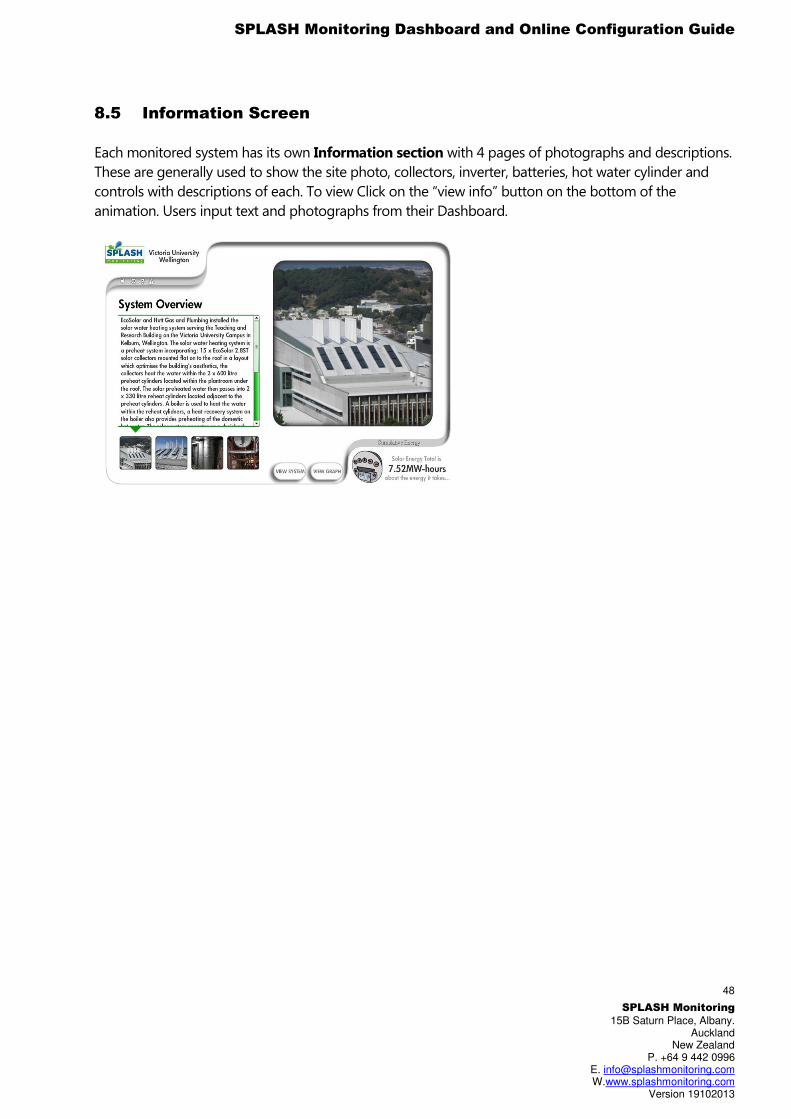
8.5 Information Screen
Each monitored system has its own Information section with 4 pages of photographs and descriptions.
These are generally used to show the site photo, collectors, inverter, batteries, hot water cylinder and
controls with descriptions of each. To view Click on the “view info” button on the bottom of the
animation. Users input text and photographs from their Dashboard.
SPLASH Monitoring Dashboard and Online Configuration Guide
SPLASH Monitoring
15B Saturn Place, Albany. Auckland
New Zealand P. +64 9 442 0996
E. [email protected] W.www.splashmonitoring.com
Version 19102013
49
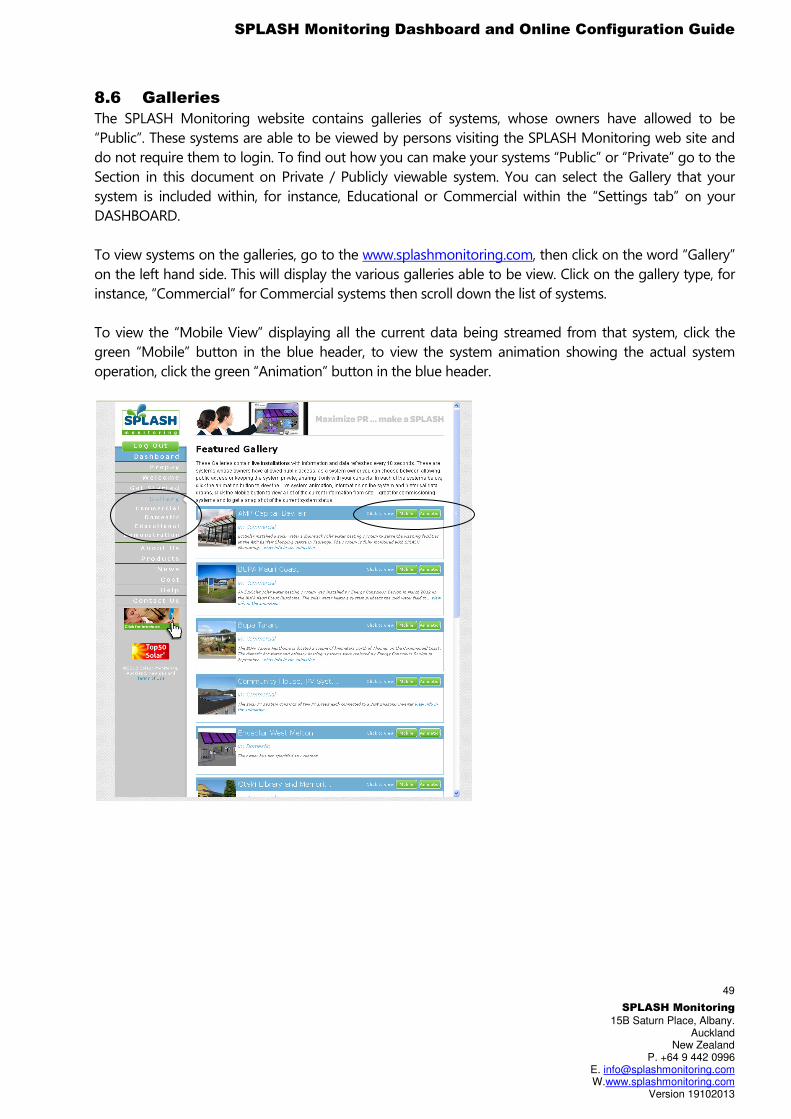
8.6 Galleries
The SPLASH Monitoring website contains galleries of systems, whose owners have allowed to be
“Public”. These systems are able to be viewed by persons visiting the SPLASH Monitoring web site and
do not require them to login. To find out how you can make your systems “Public” or “Private” go to the
Section in this document on Private / Publicly viewable system. You can select the Gallery that your
system is included within, for instance, Educational or Commercial within the “Settings tab” on your
DASHBOARD.
To view systems on the galleries, go to the www.splashmonitoring.com, then click on the word “Gallery”
on the left hand side. This will display the various galleries able to be view. Click on the gallery type, for
instance, “Commercial” for Commercial systems then scroll down the list of systems.
To view the “Mobile View” displaying all the current data being streamed from that system, click the
green “Mobile” button in the blue header, to view the system animation showing the actual system
operation, click the green “Animation” button in the blue header.

SPLASH Monitoring Dashboard and Online Configuration Guide
SPLASH Monitoring
15B Saturn Place, Albany. Auckland
New Zealand P. +64 9 442 0996
E. [email protected] W.www.splashmonitoring.com
Version 19102013
50
9.0 OEM Equipment Manufacturers
9.1 Flexible data source
The number of hardware, controllers and inverters supported continues to grow with a strong emphasis
on supporting the most common solar controllers and PV inverters.
9.2 OEM Service
SPLASH Monitoring have a team of Engineers and Technicians to work with Original Equipment
Manufacturers and service providers to deliver customised solutions. SPLASH is flexible, allowing it to be
applied to many different industries and markets. The animations can be branded with the supplier or
client’s logos and custom animations can be generated cost effectively to suit many applications.
SPLASH Monitoring continues to grow; with more manufacturers, suppliers and renewable energy
installers choosing to install and promote SPLASH Monitoring to their customers. Consultants and
Energy Managers are specifying SPLASH Monitoring for their projects and we are partnering with
companies to deliver OEM solutions for various industries and markets.
SPLASH Monitoring Dashboard and Online Configuration Guide
SPLASH Monitoring
15B Saturn Place, Albany. Auckland
New Zealand P. +64 9 442 0996
E. [email protected] W.www.splashmonitoring.com
Version 19102013
51
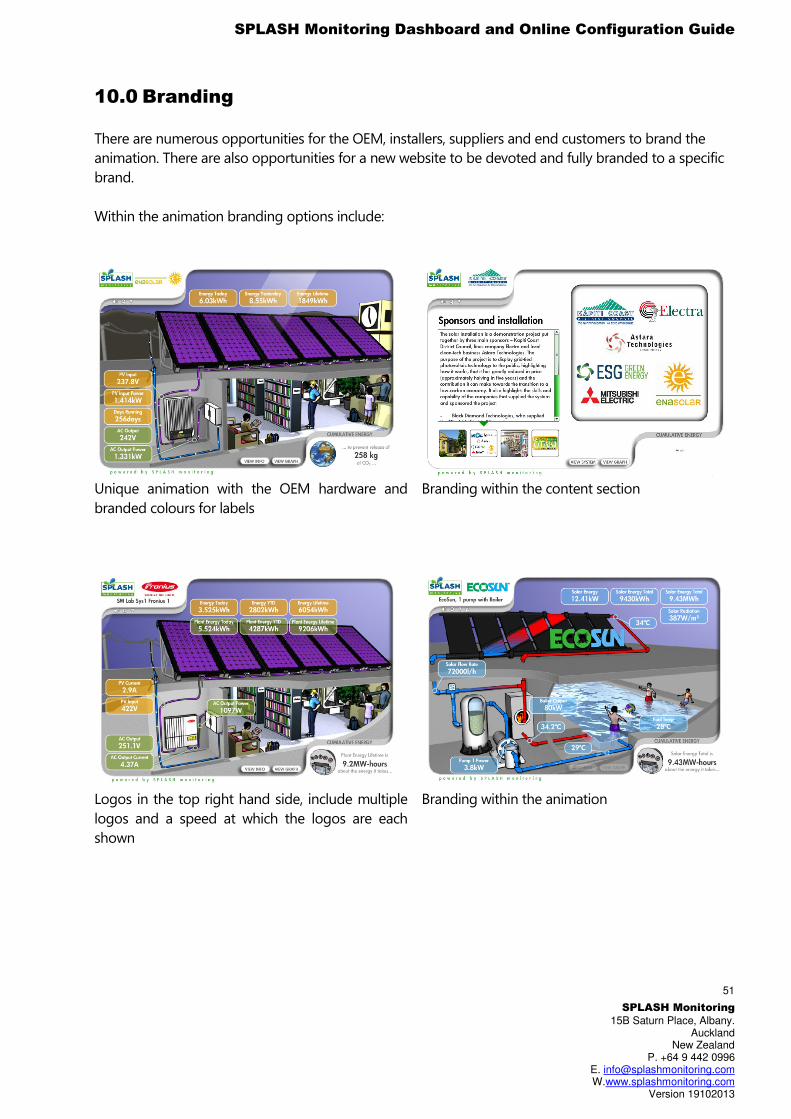
10.0 Branding
There are numerous opportunities for the OEM, installers, suppliers and end customers to brand the
animation. There are also opportunities for a new website to be devoted and fully branded to a specific
brand.
Within the animation branding options include:
Unique animation with the OEM hardware and
branded colours for labels
Branding within the content section
Logos in the top right hand side, include multiple
logos and a speed at which the logos are each
shown
Branding within the animation
SPLASH Monitoring Dashboard and Online Configuration Guide
SPLASH Monitoring
15B Saturn Place, Albany. Auckland
New Zealand P. +64 9 442 0996
E. [email protected] W.www.splashmonitoring.com
Version 19102013
52
Some hardware devices have specific features within SPLASH Monitoring that are unavailable to
users of other hardware. For instance some hardware manufacturers allow two-way communication
between their hardware and SPLASH Monitoring. Please refer to the hardware “User Guides” for
more information.
There are also some features within SPLASH that are specific to the types of systems being
monitored, such as some of the features within the “Status” tab.
Additional Help is available on the SPLASH Monitoring website. Also refer to:
• Documentation specific to your hardware device
• Frequently asked questions
• Trouble shooting guide
11.0 FEATURES SPECIFIC TO PARTICULAR HARDWARE OR
TYPES OF SYSTEM
12.0 ADDITIONAL HELP

SPLASH Monitoring Dashboard and Online Configuration Guide
SPLASH Monitoring
15B Saturn Place, Albany. Auckland
New Zealand P. +64 9 442 0996
E. [email protected] W.www.splashmonitoring.com
Version 19102013
53