Embed Size (px)
Citation preview
You represented relationships among quantities using equations. (Lesson 2–1)
• Graph linear equations.
• Identify linear equations, intercepts, and zeros.
• linear equation
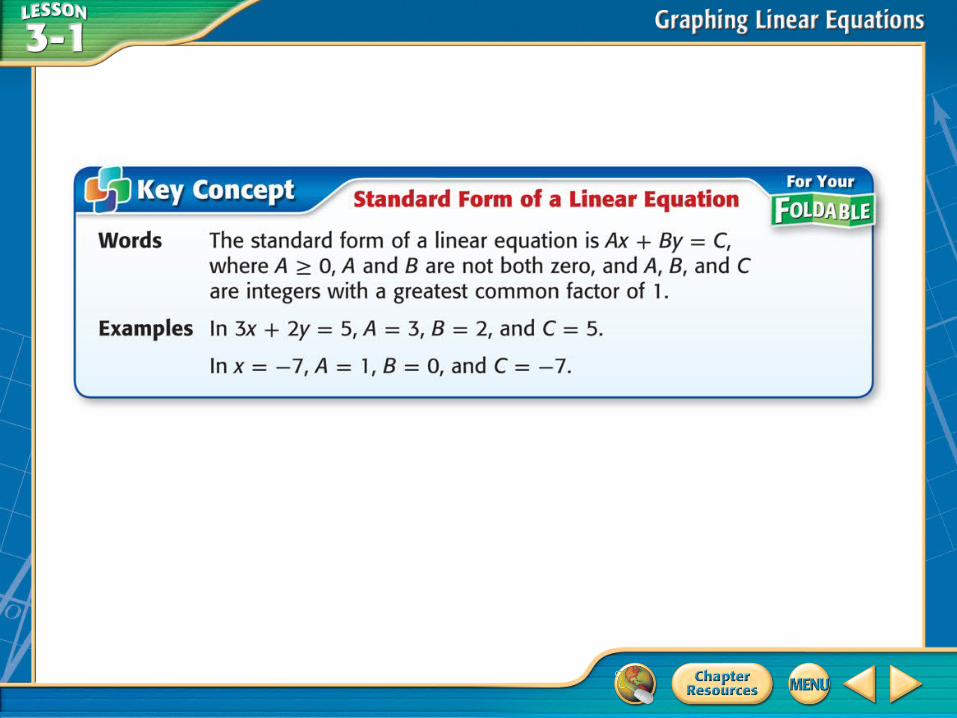
• standard form
• constant
• x-intercept
• y-intercept
B.
Write the equation in standard form.
Identify Linear Equations
» ACTIVITY
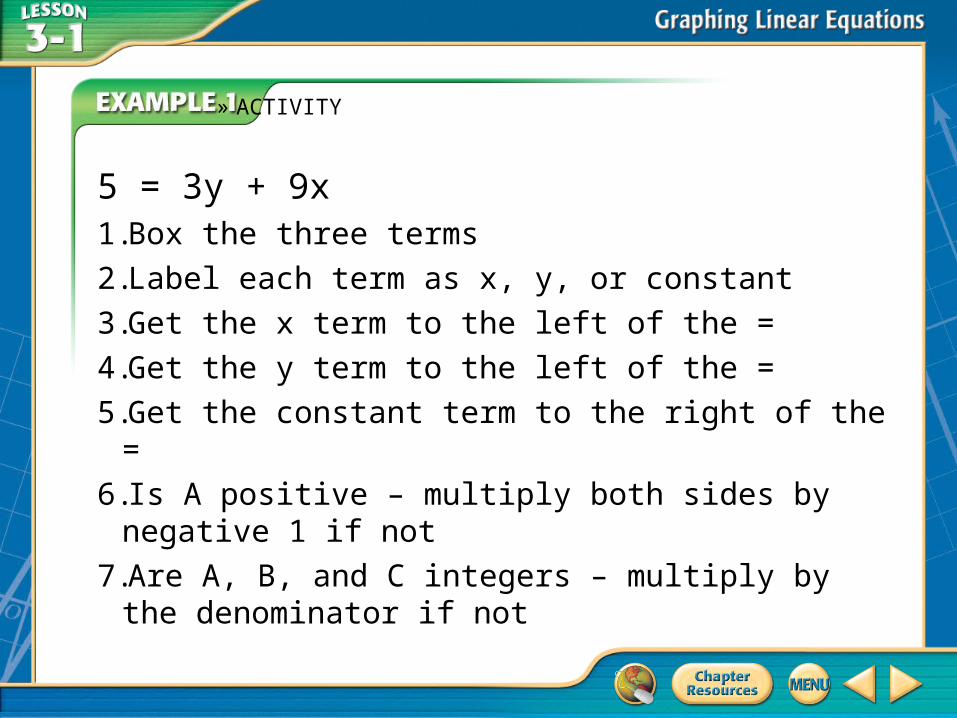
5 = 3y + 9x1.Box the three terms
2.Label each term as x, y, or constant
3.Get the x term to the left of the =
4.Get the y term to the left of the =
5.Get the constant term to the right of the =
6.Is A positive – multiply both sides by negative 1 if not
7.Are A, B, and C integers – multiply by the denominator if not
» ACTIVITY
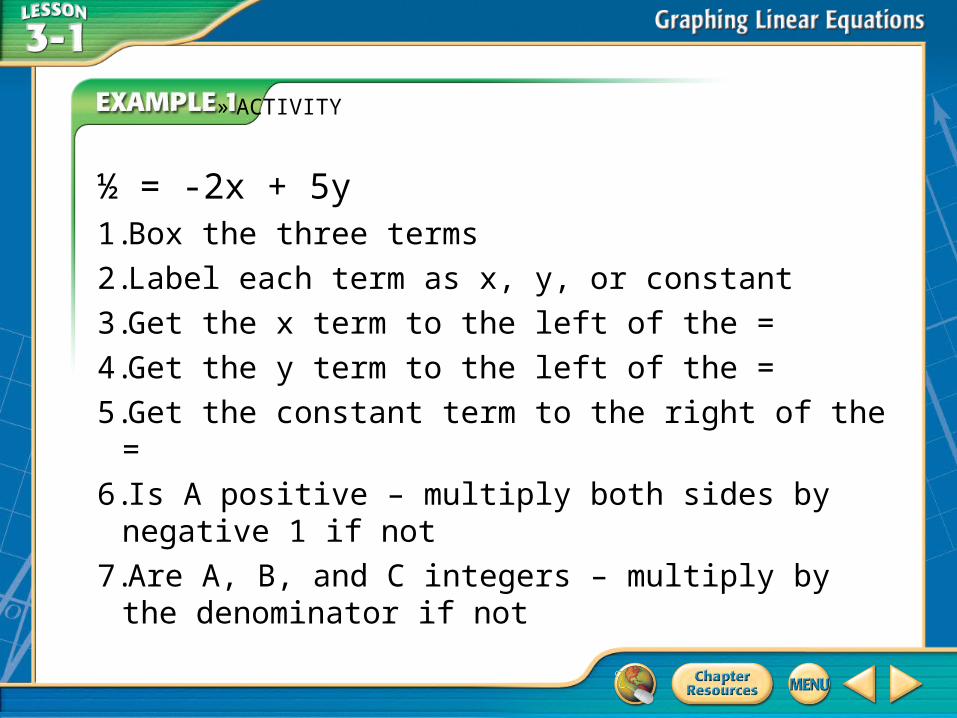
½ = -2x + 5y1.Box the three terms
2.Label each term as x, y, or constant
3.Get the x term to the left of the =
4.Get the y term to the left of the =
5.Get the constant term to the right of the =
6.Is A positive – multiply both sides by negative 1 if not
7.Are A, B, and C integers – multiply by the denominator if not
A. A
B. B
C. C
D. D A B C D
0% 0%0%0%
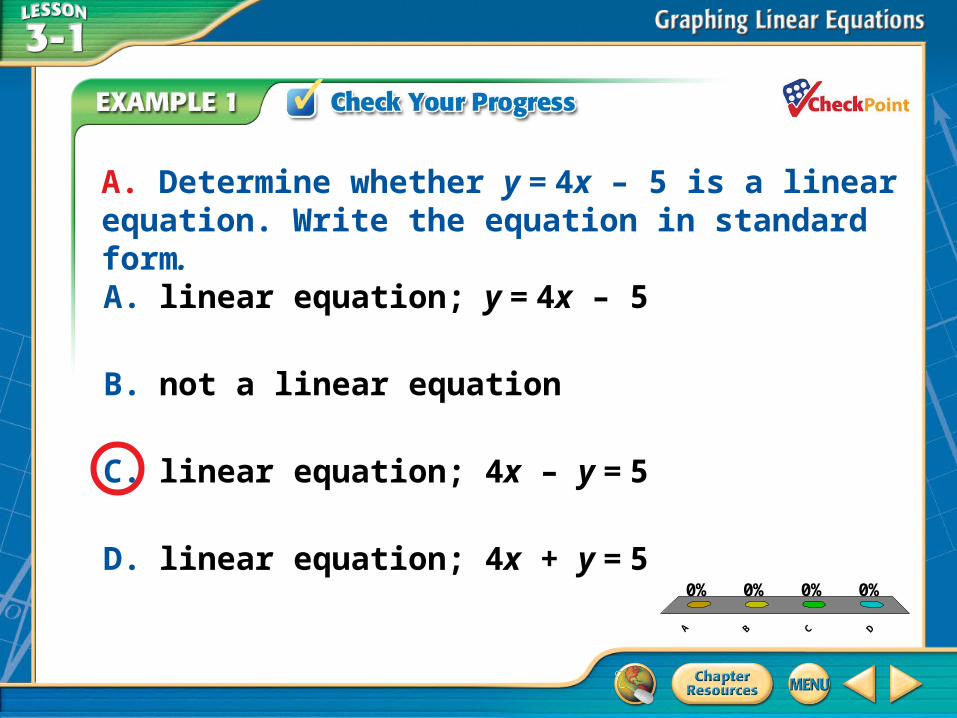
A. Determine whether y = 4x – 5 is a linear equation. Write the equation in standard form.
A. linear equation; y = 4x – 5
B. not a linear equation
C. linear equation; 4x – y = 5
D. linear equation; 4x + y = 5
A. A
B. B
C. C
D. D A B C D
0% 0%0%0%
B. Determine whether 8y –xy = 7 is a linear equation. Write the equation in standard form.
A. not a linear equation
B. linear equation; 8y – xy = 7
C. linear equation; 8y = 7 + xy
D. linear equation; 8y – 7 = xy
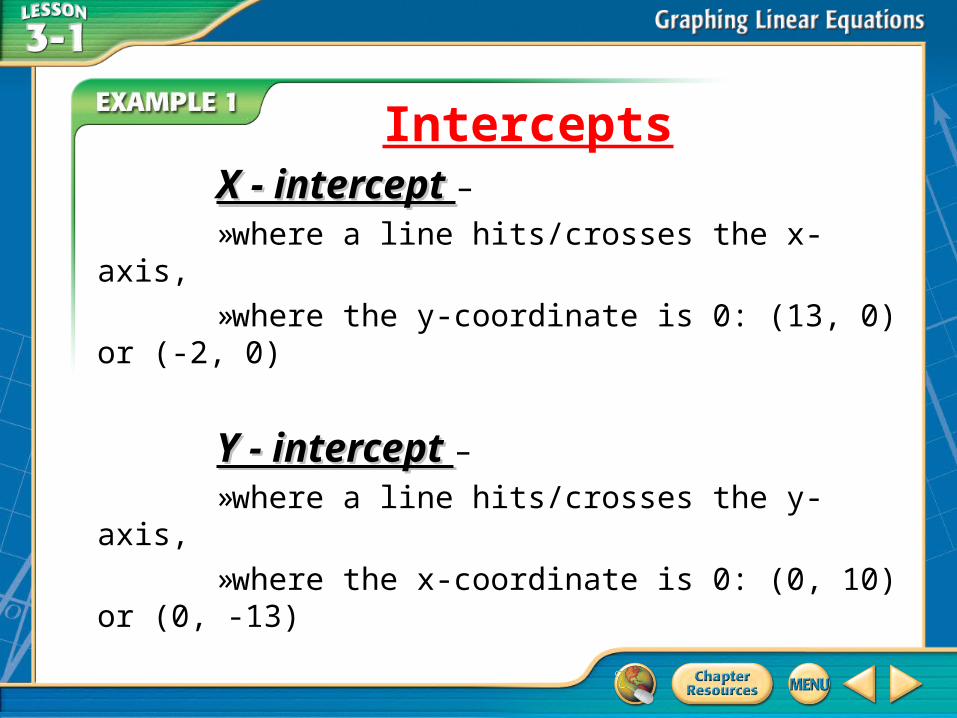
InterceptsX - intercept X - intercept –
»where a line hits/crosses the x-axis, »where the y-coordinate is 0: (13, 0) or
(-2, 0)
Y - intercept Y - intercept –
»where a line hits/crosses the y-axis, »where the x-coordinate is 0: (0, 10) or
(0, -13)
• Graph 5x – 1y = 10 using intercepts.
• x-intercept y-intercept
A. A
B. B
C. C
D. D A B C D
0% 0%0%0%
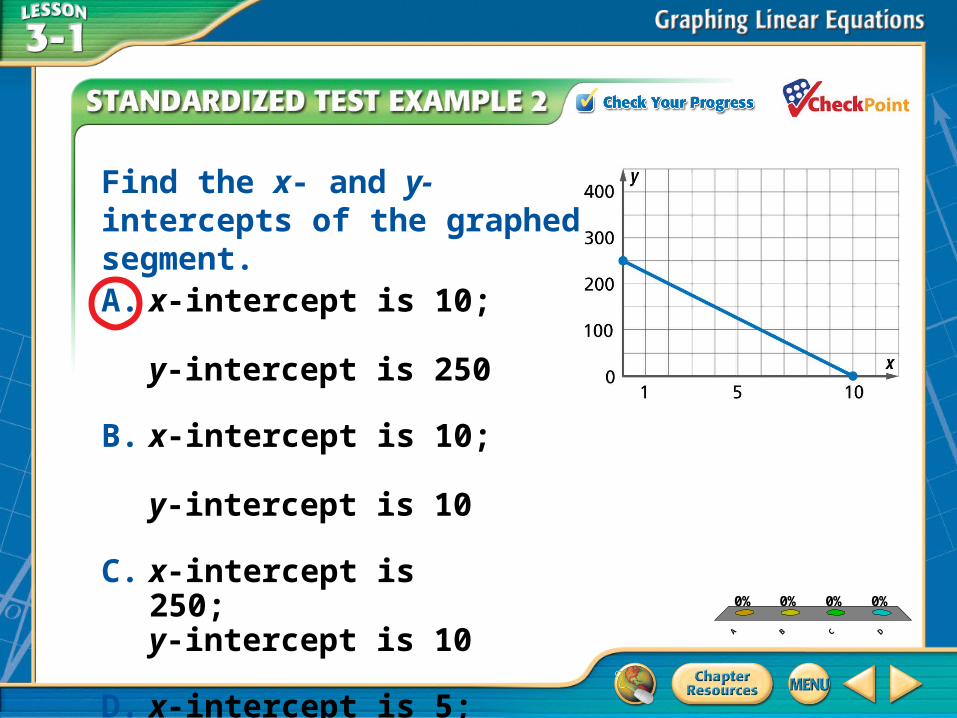
Find the x- and y-intercepts of the graphed segment.
A. x-intercept is 10; y-intercept is 250
B. x-intercept is 10; y-intercept is 10
C. x-intercept is 250; y-intercept is 10
D. x-intercept is 5; y-intercept is 10
A. A
B. B
C. C
D. D A B C D
0% 0%0%0%
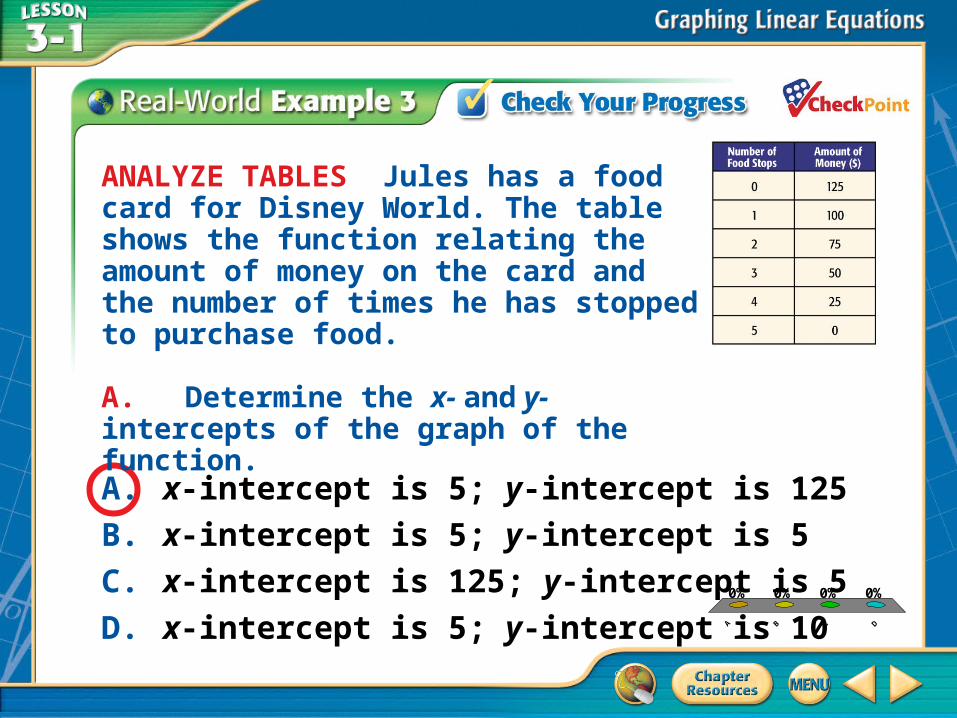
ANALYZE TABLES Jules has a food card for Disney World. The table shows the function relating the amount of money on the card and the number of times he has stopped to purchase food.
A. Determine the x- and y-intercepts of the graph of the function.
A. x-intercept is 5; y-intercept is 125
B. x-intercept is 5; y-intercept is 5
C. x-intercept is 125; y-intercept is 5
D. x-intercept is 5; y-intercept is 10
Graph by Using Intercepts
Graph 4x – y = 4 using the x-intercept and the y-intercept.
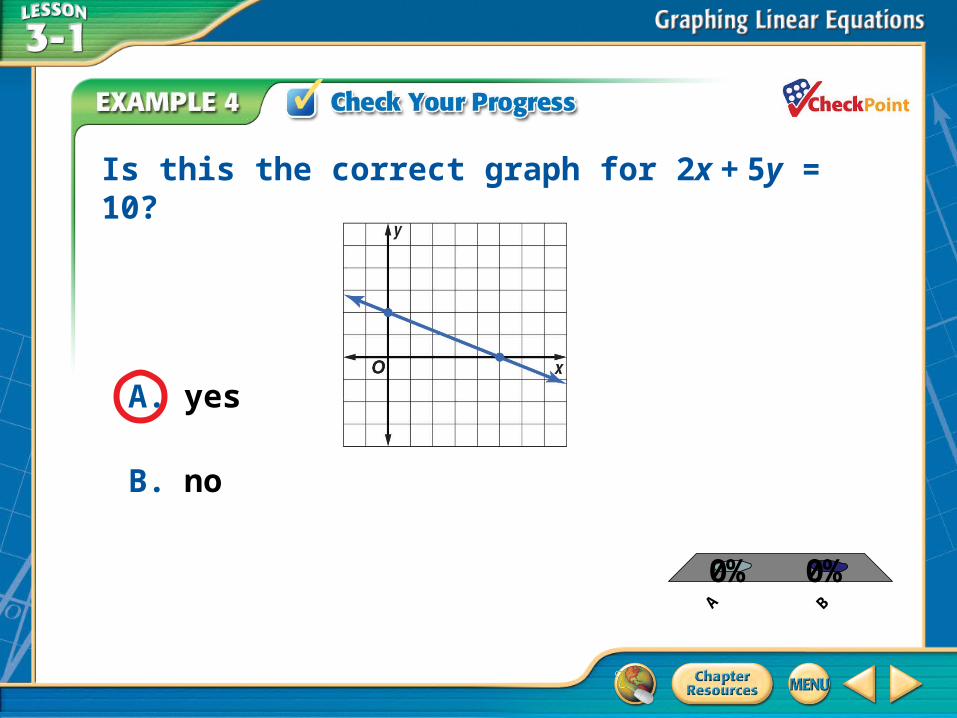
Is this the correct graph for 2x + 5y = 10?
A. A
B. B
A B
0%0%
A. yes
B. no
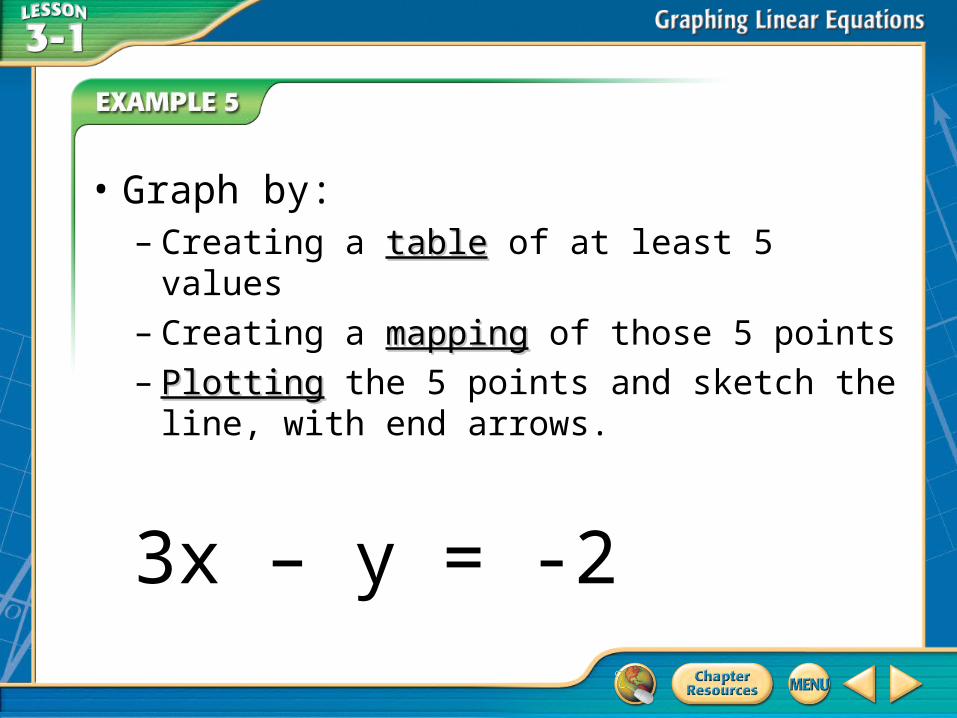
• Graph by:– Creating a tabletable of at least 5 values– Creating a mappingmapping of those 5 points– PlottingPlotting the 5 points and sketch the line,
with end arrows.
3x – y = -2