Embed Size (px)
Citation preview

Spokane River Urban Waters Source Investigation and Data Analysis Progress Report (2009-2011)
Source Tracing for PCB, PBDE, Dioxin/Furan, Lead, Cadmium, and Zinc
September 2012
Publication No. 12-04-025
Publication and Contact Information
This report is available on the Department of Ecology’s Web site at
https://fortress.wa.gov/ecy/publications/SummaryPages/1204025.html
For more information contact:
Publications Coordinator
Hazardous Waste and Toxics Reduction Program
PO Box 47600
Olympia WA 98504-7600
Phone: (360) 407-6745
Washington State Department of Ecology - www.ecy.wa.gov/
o Headquarters, Olympia (360) 407-6000
o Northwest Regional Office, Bellevue (425) 649-7000
o Southwest Regional Office, Olympia (360) 407-6300
o Central Regional Office, Yakima (509) 575-2490
o Eastern Regional Office, Spokane (509) 329-3400
Any use of product or firm names in this publication is for descriptive purposes only and
does not imply endorsement by the author or the Department of Ecology.
To ask about the availability of this document in a format for the visually impaired,
call the Hazardous Waste and Toxics Reduction Program at 360-407-6700.
Persons with hearing loss can call 711 for Washington Relay Service.
Persons with a speech disability can call 877-833-6341.
Appendix D provides definitions for all data flags used in this project. Page | i
Spokane River Urban Waters Source Investigation and Data Analysis
Progress Report (2009-2011)
Source Tracing for PCB, PBDE, Dioxin/Furan, Lead, Cadmium, and Zinc
by
Arianne Fernandez
Urban Waters Initiative
Washington State Department of Ecology
Spokane, Washington 99205-7710
Waterbody Number(s):
WRIA 54
WRIA 55
WRIA 56
WRIA 57

Page | ii
This page is purposely left blank
Appendix D provides definitions for all data flags used in this project. Page | iii
Table of Contents
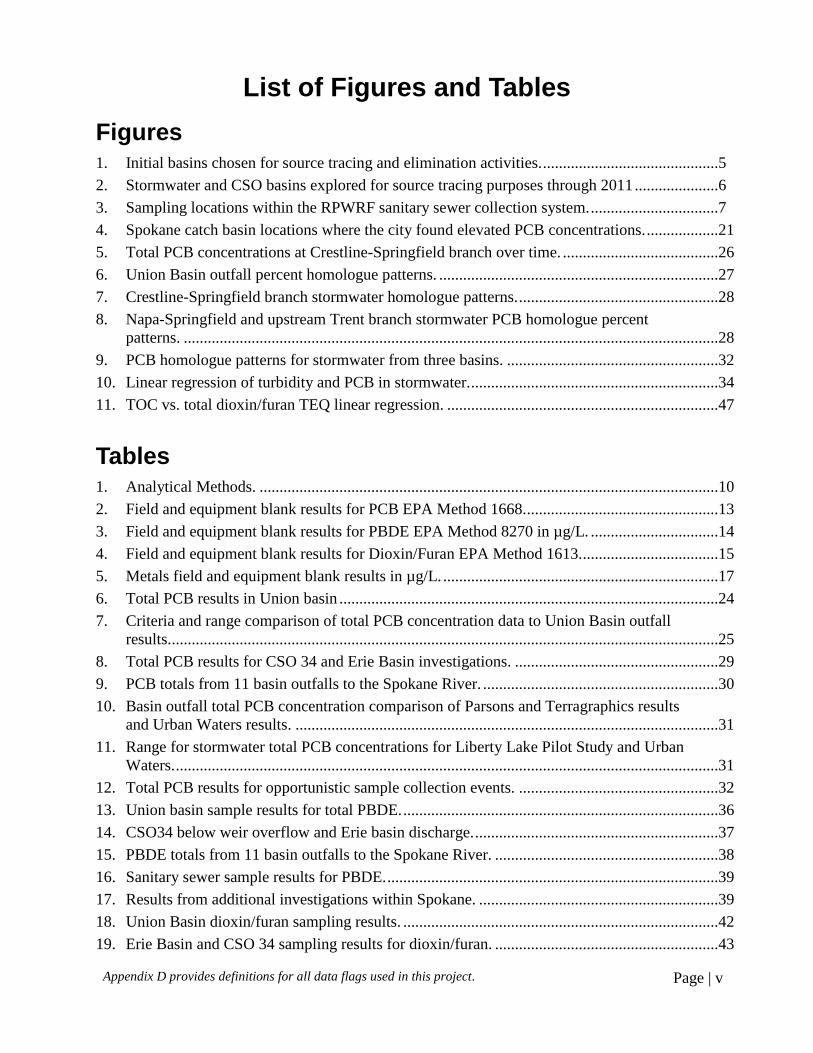
List of Figures and Tables................................................................................................................v
Acronyms and Abbreviations ........................................................................................................ vi
Acknowledgements ....................................................................................................................... vii
Introduction ......................................................................................................................................1 Contaminants of Concern ..........................................................................................................2 Study Area .................................................................................................................................4
Sampling Methods ...........................................................................................................................8 Water Collection ........................................................................................................................8
Sediment and Soil Collection.....................................................................................................8
Analytical Methods and Detection Limits .....................................................................................10
Data Quality ...................................................................................................................................12 PCB Data Quality ....................................................................................................................12
PBDE Data Quality ..................................................................................................................13 Dioxin and Furan Data Quality ................................................................................................15
Metals Data Quality .................................................................................................................16
Pattern Tracing ...............................................................................................................................18
Source Tracing Prioritization .........................................................................................................19
PCB Section ...................................................................................................................................20 Overview ..................................................................................................................................20
Results/Discussion ...................................................................................................................22
Union Basin .....................................................................................................................22
Erie Basin/CSO 34 ..........................................................................................................28 Additional Sampling ........................................................................................................30
Samples of Opportunity ...................................................................................................32 Statistical Analysis ...................................................................................................................34
PBDE Section ................................................................................................................................35
Overview ..................................................................................................................................35 Results/Discussion ...................................................................................................................35
Union Basin .....................................................................................................................35 Erie Basin/CSO 34 ..........................................................................................................37 Other Basins ....................................................................................................................38 Sewer Sampling ...............................................................................................................38 Samples of Opportunity ...................................................................................................39
Statistical Analysis ...................................................................................................................40
Chlorinated Dioxins and Furans Section .......................................................................................41
Overview ..................................................................................................................................41 Results/Discussion ...................................................................................................................41
Union Basin .....................................................................................................................41 Erie Basin/CSO34 ...........................................................................................................43 Other Basins ....................................................................................................................44
Page | iv
Sewer Sampling ...............................................................................................................45 Samples of Opportunity ...................................................................................................46
Statistical Analysis ...................................................................................................................47
Metals Section ................................................................................................................................48
Overview ..................................................................................................................................48 Results/Discussion ...................................................................................................................49
Union Basin .....................................................................................................................49 Erie Basin/CSO34 ...........................................................................................................51 Other Basins ....................................................................................................................53
Samples of Opportunity ...................................................................................................55
General Progress ............................................................................................................................56 Source Reductions ...................................................................................................................58
Conclusions ....................................................................................................................................59
Monitoring and Research .........................................................................................................59 PCB ..................................................................................................................................59
PBDE ...............................................................................................................................59 Dioxin/Furan ....................................................................................................................59
Metals ..............................................................................................................................60 Inspections ...............................................................................................................................60 Education .................................................................................................................................60
Recommendations ..........................................................................................................................61 Sampling and Analysis ............................................................................................................61
PCB ..................................................................................................................................61 PBDE ...............................................................................................................................62 Dioxin/Furan ....................................................................................................................62
Lead, Cadmium, Zinc ......................................................................................................62
Process Improvements .............................................................................................................62 PCB ..................................................................................................................................62 PBDE ...............................................................................................................................62
Dioxin/Furan ....................................................................................................................63 Lead, Cadmium, Zinc ......................................................................................................63
References ......................................................................................................................................64
Appendices .....................................................................................................................................68
Appendix A. Glossary .............................................................................................................68 Appendix B. Figures and Tables .............................................................................................70 Appendix C. Metals data .........................................................................................................79 Appendix D. Laboratory Data Flag Definitions ......................................................................82
Appendix D provides definitions for all data flags used in this project. Page | v
List of Figures and Tables
Figures 1. Initial basins chosen for source tracing and elimination activities. ............................................5
2. Stormwater and CSO basins explored for source tracing purposes through 2011 .....................6
3. Sampling locations within the RPWRF sanitary sewer collection system. ................................7
4. Spokane catch basin locations where the city found elevated PCB concentrations. ..................21
5. Total PCB concentrations at Crestline-Springfield branch over time. .......................................26
6. Union Basin outfall percent homologue patterns. ......................................................................27
7. Crestline-Springfield branch stormwater homologue patterns. ..................................................28
8. Napa-Springfield and upstream Trent branch stormwater PCB homologue percent
patterns. ......................................................................................................................................28
9. PCB homologue patterns for stormwater from three basins. .....................................................32
10. Linear regression of turbidity and PCB in stormwater. ..............................................................34
11. TOC vs. total dioxin/furan TEQ linear regression. ....................................................................47
Tables 1. Analytical Methods. ...................................................................................................................10
2. Field and equipment blank results for PCB EPA Method 1668. ................................................13
3. Field and equipment blank results for PBDE EPA Method 8270 in µg/L. ................................14
4. Field and equipment blank results for Dioxin/Furan EPA Method 1613. ..................................15
5. Metals field and equipment blank results in µg/L. .....................................................................17
6. Total PCB results in Union basin ...............................................................................................24
7. Criteria and range comparison of total PCB concentration data to Union Basin outfall
results. .........................................................................................................................................25
8. Total PCB results for CSO 34 and Erie Basin investigations. ...................................................29
9. PCB totals from 11 basin outfalls to the Spokane River. ...........................................................30
10. Basin outfall total PCB concentration comparison of Parsons and Terragraphics results
and Urban Waters results. ..........................................................................................................31
11. Range for stormwater total PCB concentrations for Liberty Lake Pilot Study and Urban
Waters. ........................................................................................................................................31
12. Total PCB results for opportunistic sample collection events. ..................................................32
13. Union basin sample results for total PBDE. ...............................................................................36
14. CSO34 below weir overflow and Erie basin discharge. .............................................................37
15. PBDE totals from 11 basin outfalls to the Spokane River. ........................................................38
16. Sanitary sewer sample results for PBDE. ...................................................................................39
17. Results from additional investigations within Spokane. ............................................................39
18. Union Basin dioxin/furan sampling results. ...............................................................................42
19. Erie Basin and CSO 34 sampling results for dioxin/furan. ........................................................43
Page | vi
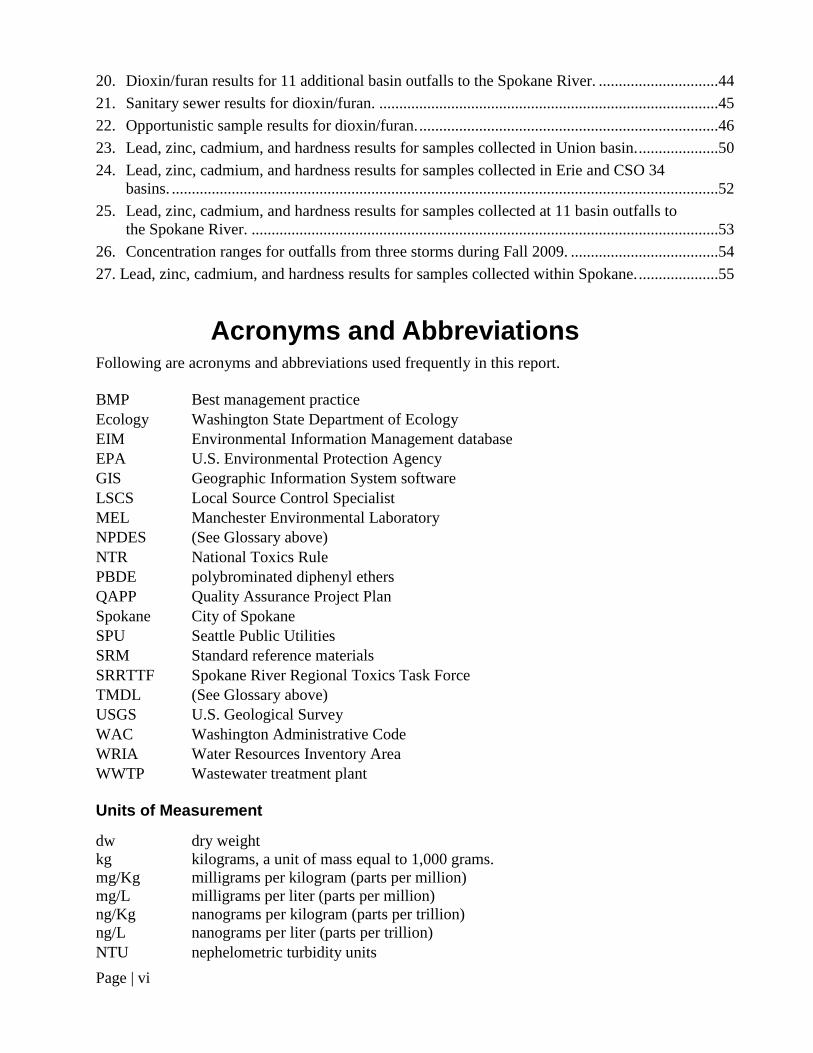
20. Dioxin/furan results for 11 additional basin outfalls to the Spokane River. ..............................44
21. Sanitary sewer results for dioxin/furan. .....................................................................................45
22. Opportunistic sample results for dioxin/furan. ...........................................................................46
23. Lead, zinc, cadmium, and hardness results for samples collected in Union basin. ....................50
24. Lead, zinc, cadmium, and hardness results for samples collected in Erie and CSO 34
basins. .........................................................................................................................................52
25. Lead, zinc, cadmium, and hardness results for samples collected at 11 basin outfalls to
the Spokane River. .....................................................................................................................53
26. Concentration ranges for outfalls from three storms during Fall 2009. .....................................54
27. Lead, zinc, cadmium, and hardness results for samples collected within Spokane. ....................55
Acronyms and Abbreviations Following are acronyms and abbreviations used frequently in this report.
BMP Best management practice
Ecology Washington State Department of Ecology
EIM Environmental Information Management database
EPA U.S. Environmental Protection Agency
GIS Geographic Information System software
LSCS Local Source Control Specialist
MEL Manchester Environmental Laboratory
NPDES (See Glossary above)
NTR National Toxics Rule
PBDE polybrominated diphenyl ethers
QAPP Quality Assurance Project Plan
Spokane City of Spokane
SPU Seattle Public Utilities
SRM Standard reference materials
SRRTTF Spokane River Regional Toxics Task Force
TMDL (See Glossary above)
USGS U.S. Geological Survey
WAC Washington Administrative Code
WRIA Water Resources Inventory Area
WWTP Wastewater treatment plant
Units of Measurement
dw dry weight
kg kilograms, a unit of mass equal to 1,000 grams.
mg/Kg milligrams per kilogram (parts per million)
mg/L milligrams per liter (parts per million)
ng/Kg nanograms per kilogram (parts per trillion)
ng/L nanograms per liter (parts per trillion)
NTU nephelometric turbidity units
Appendix D provides definitions for all data flags used in this project. Page | vii
pg/L picograms per liter (parts per quadrillion)
ug/Kg micrograms per kilogram (parts per billion)
µg/L micrograms per liter (parts per billion)
umhos/cm micromhos per centimeter
S/cm microsiemens per centimeter, a unit of conductivity
Acknowledgements
The authors of this report thank the following people for their contribution to this project:
City of Spokane:
o Lynn Schmidt, Gary Kaesemeyer, Raylene Gennett, Lars Hendron
Washington State Department of Ecology staff:
o Ted Hamlin, Dave George, Richard Koch, Jeremy Ryf, Mike Hepp, Dave Duncan
o Dale Norton, Brandee Era-Miller, Brandi Lubliner, Jim Ross
o Lisa Brown, Dave Moore, Diana Washington, Jim Bellatty
o Lori Rodriguez

Appendix D provides definitions for all data flags used in this project. Page | 1
Introduction
The Urban Waters Initiative was passed in 2007 to provide researchers with additional resources
to identify and eliminate contaminants of concern (CoC) in three important watersheds. The
three watersheds included the Spokane River, Duwamish, and Commencement Bay. This report
describes progress in the Spokane River from 2009 through the end of 2011.
Spokane is the largest contributor of stormwater and wastewater treatment plant discharge to the
Spokane River. The City discharges were identified as a main contributor of CoC to the
Spokane River (Serdar et al. 2006, Serdar et al., 2011). The Urban Waters Program determined
the City of Spokane (Spokane) would be the main focus of our efforts.
Urban Waters conducted a pilot study in the Liberty Lake area to evaluate sewer and storm
system sampling and business visit methods, and begin to understand local CoC concentrations
in an area with minimal to no direct sources. We completed a report in 2010 that described our
efforts, what we needed to do next and how we might be successful in approaching source
tracing in Spokane (Fernandez and Hamlin, 2010).
The initial focus was up-the-pipe source tracing to gain the best results with limited resources. The
results from the Parsons and Terragraphics (2007) stormwater report were used to identify priority
stormwater and combined sewer overflow basins to trace. Upstream tracing would find sources of
contamination to eliminate. Contaminants of Concern include polychlorinated biphenyls (PCB),
Polybrominated diphenyl ethers (PBDE), dioxin/furan, lead, cadmium, and zinc.
Urban Waters would then conduct a series of small studies to identify additional sources to pursue
after completion of the work in the first three drainage basins: Union, Erie, and CSO 34 (See study
area). The first study would gather information on additional drainage basins discharging to the
section of the river where PCB concentrations were highest as identified in Ecology’s 2005 fish
survey (Serdar and Johnson, 2006). An in-river sediment study for PBDE would help narrow
down sections of the river and their piped system basins that may contribute to elevated levels of
PBDE. Urban Waters also created a placeholder for groundwater sampling if efforts found the
need to source trace in the Spokane Valley-Rathdrum Prairie Aquifer. The Aquifer runs
underneath parts of Idaho and several communities in Spokane County including Spokane.
Urban Waters would use a combination of business visits and sampling to find sources.
Investigators would then use the appropriate regulation from the Resource Conservation and
Recovery Act, Clean Water Act, and the Model Toxics Control Act to eliminate the sources of
contamination. We partnered with the Spokane Regional Health District (SRHD) and provided
funding through the Local Source Control Partnership. The SRHD hired a business visit
consultant called a Local Source Control Specialist (LSCS) to provide voluntary checklist visits
at businesses in the basins of concern. These visits would attempt to determine if the business
may be contributing to contamination to the Spokane River. The SRHD consultant would then
provide guidance or refer them to the proper Ecology Program to provide the business with best
management practices, or other actions they should implement to eliminate the source.
Our tracing efforts include historical analysis of land use and geographic information system
(GIS) mapping to help trace up pipes and keep track of our progress.
Page | 2
Our final approach included an adaptive management component, including continual process
checks, to address data gaps and necessary process changes quickly to insure continued
aggressive progress.
Urban Waters worked with Ecology’s Water Quality, Toxics Cleanup, and Environmental
Assessment Programs to broaden and combine resources for the following additional source
characterization and river monitoring projects:
Air Deposition Literature Review (EAP)
Spokane River monitoring plan (EAP)
NE Washington Lake Background Study (TCP, EAP, UW)
Urban Waters developed a sampling plan and quality assurance project plan describing where to
begin work and how to find new sources outside the initial identified drainage basins (Fernandez
and Hamlin, 2009).
Contaminants of Concern Polychlorinated Biphenyls (PCB) PCB enters the Spokane River from industrial discharges, wastewater treatment plants, stormwater,
local urban air deposition, and long-range air deposition to the Coeur d’ Alene Basin where the
Spokane River begins. PCB releases may come from mishandling transformers, caulking leachate,
soap, motor oil, and other still unknown sources.
The Kaiser Trentwood aluminum plant is a well-known historic source in the Spokane Valley. Since
1995, Kaiser has taken major steps to reduce PCB concentrations in its wastewater. Kaiser and Inland
Empire Paper each have a National Pollutant Discharge Elimination System (NPDES) permit to
manage their PCB-contaminated wastewater. Ecology’s Water Quality Program oversees these
permits. The General Electric site was contaminated with PCB, impacting the aquifer near the river
(Serdar et al. 2006). Ecology’s Toxic Cleanup Program oversaw a 1999 cleanup of this site.
The Washington State Department of Health (WDOH) and the Spokane Regional Health District
(SRHD) currently have an advisory to avoid or limit consumption of fish in parts of the Spokane
River due to elevated PCB levels. The largest concentrations of PCB in fish or sediment have been
found between the Idaho border and Upriver Dam.
The ecological implications of PCB contamination in the Spokane River have been assessed by Art
Johnson (2001) from Ecology’s Environmental Assessment Program. Johnson concluded there may
be adverse effects on the salmonid populations, fish-eating mammals, and benthic invertebrates
residing in the river reaches downstream of Kaiser. He did not find evidence of risk to fish-eating
birds. Johnson points out elevated concentrations of PCB in the fine-grained sediments between
Kaiser and Monroe Street Dam as one of the factors influencing his risk calculation for benthic
invertebrates. This includes the area behind Upriver Dam. In 2001, Ecology’s Toxics Cleanup
Program placed a cap on the PCB-contaminated sediments behind Upriver Dam. This may have
abated some of the risk to benthic invertebrates.
Appendix D provides definitions for all data flags used in this project. Page | 3
Polybrominated Diphenyl Ether (PBDE) Studies indicate PBDE are building up in people’s bodies, animals, and the environment (Serdar and
Johnson 2006b; Peele et al. 2004, Johnson and Olson 2001, Johnson et al. 2006). There are no water
quality or fish tissue standards for PBDE. Washington State had concerns about increasing levels in the
environment, bio-accumulative potential, and effects on neurologic development and reproduction
effects in laboratory animals. This prompted the State to develop a plan to reduce PBDE inputs to the
environment (Peele, 2004). Ecology recently published data from ten rivers and ten lakes indicating
that Spokane River fish tissue contains the highest levels of PBDE of the 20 sites tested (Serdar and
Johnson, 2006).
Dioxin and Furan As with the PBDE, we do not yet know the full extent of contamination or the sources of dioxin/furan in
the Spokane River. Recent screening-level data suggested dioxin/furan needed further investigation in
the Spokane watershed. Ecology conducted fish sampling in the Spokane River in 2003. A single
rainbow trout fillet sample from the Nine Mile reach had a tetrachlorodibenzo-p-dioxin (2,3,7,8-TCDD)
toxic equivalents of 0.36 ng/Kg (Seiders et al., 2006, Seiders et al. 2007). The EPA National Toxics
Rule human health criterion for dioxin/furan in fish tissue is 0.065 ng/Kg. Although this criterion is
based on human health risks – one in a million excess lifetime cancer risk – it is used to assess water
quality violations. It is not a threshold for issuing public-health fish consumption advisories.
The 303(d) lists three sections within the Spokane River as impaired for 2,3,7,8 TCDD TEQ. All
three sections are listed as Category 2 based on fish tissue data. This was lowered from a
Category 3 in 2004 to a Category 2 in 2008 and 2010. Three sections of the Spokane River are
listed as category 5 for total 2,3,7,8 TCDD.
Metals High levels of arsenic, zinc, lead, and cadmium contaminate much of the bottom sediments in the
Spokane River (Johnson and Norton, 2001). Ecology developed a total maximum daily load
(TMDL) in 1999 that limits zinc, lead, and cadmium discharges to the river (Pelletier, 1998).
The current 303(d) listings along the Spokane River for metals include:
Lead: 12 segments along the Spokane River are listed as Category 4A.
Zinc: 12 segments along the Spokane River are listed as Category 4A.
Cadmium: One segment along the Spokane River is listed as Category 4A which is located at
the Washington-Idaho border.
The arsenic and lead concentrations prompted WDOH and SRHD to issue an advisory urging
people to reduce contact with shoreline sediments along parts of the river. In 2003, SRHD issued
a sediment advisory for lead and arsenic.
The primary source of dissolved and particulate metals loading to the Spokane River is from the
Coeur d’Alene Basin Superfund Site in Idaho, a basin-wide legacy mining site. The Basin was
designated a Superfund site in 1983. EPA, with support from the Basin Commission, is
conducting cleanup actions under a Record of Decision (ROD). TCP provides technical support
and document review in the cleanup planning process as a member of the Basin Commission.
Staff involvement focuses on addressing those areas in the Basin identified as most directly
affecting water quality in the Spokane River.
Page | 4
Although cleanup is occurring, recent river sampling at the Idaho-Washington border show that
dissolved zinc and particulate lead concentrations continue to exceed water quality standards. Fish
tissue analysis also showed high levels of lead, zinc, and cadmium from fish collected between the
Idaho-Washington border and Lake Spokane (Serdar and Johnson, 2006). TCP has been pursuing
state led/funded cleanup actions at nine recreational shoreline sites identified in the ROD along
this stretch of the river.
Study Area
Our initial study area for all CoC included two drainage basins (Figure 1):
Union Basin
CSO 34
CSO 34 was later broken into two basins for tracing, separated by the CSO weir. The area above
the weir will be referred to as CSO 34 while the area below the weir will be referred to as Erie
Basin. CSO 34’s overflow weir outflows into a long pipe that receives stormwater before it
discharges into the river. It was a natural separation point for the contributions from above and
below the weir since CSO 34 may not overflow during a storm event.
Source tracing efforts were initiated in Union basin because of its smaller size and because it was
stormwater only.
Appendix D provides definitions for all data flags used in this project. Page | 5
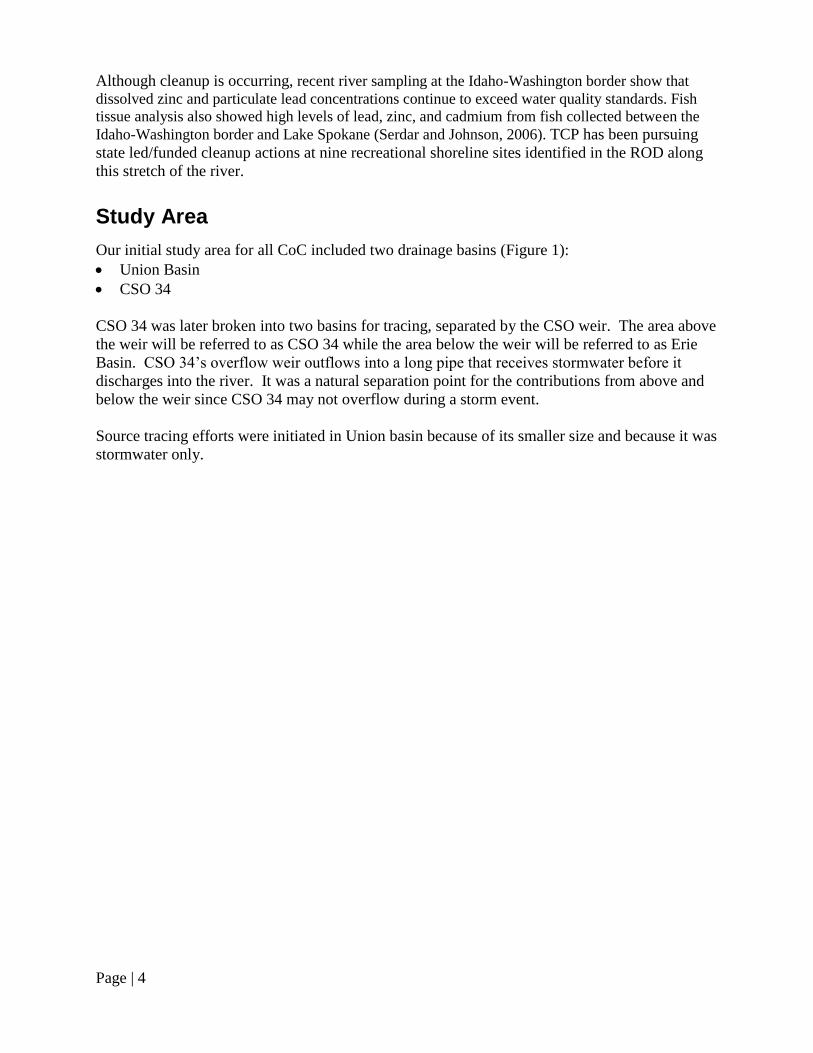
Figure 1. Initial basins chosen for source tracing and elimination activities.
It was initially believed Union basin discharged at a separate point from CSO 34 and Erie basin.
Exploration of the system with the cooperation of Spokane revealed all basins converged and
discharged at one point into the river. The concentration originally attributed to CSO 34 and Erie
basins in the 2007 stormwater report is a comingled sample of all three basins. This is important to
note because this report directed our tracing investigation. This knowledge prompted a
modification in the stormwater study and will help with future stormwater loading work.
Basin polygons were provided by Parsons and Terragraphics, Inc. and Spokane. Field recon
showed basin polygons were not accurate in relation to the piped collection system. Future work
should include a refined GIS basin polygon layer. However, the basins are adequate for
representing the general area covered by the piped collection systems.
Page | 6
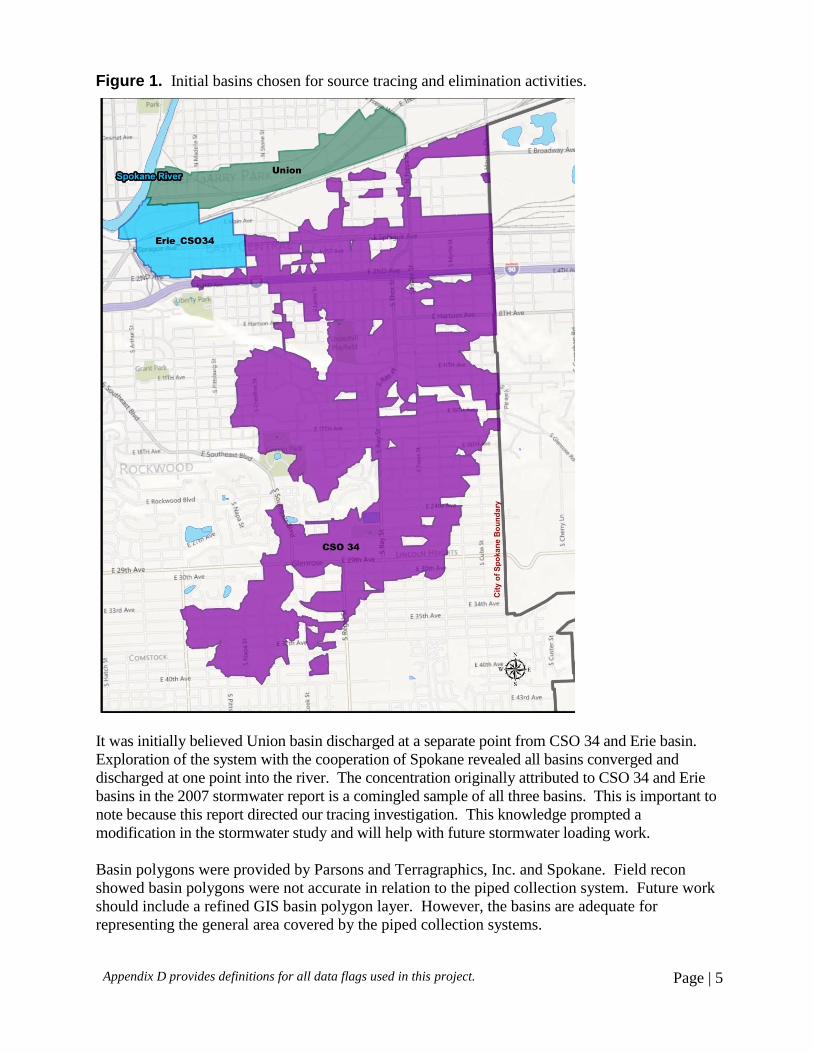
Figure 2 shows all basins where Urban Waters attempted to sample for all CoC through 2011.
Green discharge points indicate a sample was collected. This includes the additional basins
chosen for river discharge characterization in our QAPP addendum (Table B-1). The discharges
are located in the river section where PCB fish tissue results were the highest (Serdar and
Johnson, 2006).
Figure 2. Stormwater and CSO basins explored for source tracing purposes through 2011.
Sample locations are in green.
Urban Waters collected at least one sample from all locations except CSO 41 and Cuba. CSO 41
did not overflow during our sampling events and Cuba did not have sufficient flow for a sample.
GUBP replaced the TrentBridge-WN basin due to inaccurate mapping and verification of a
possible zinc source. GUBP basin’s sample location is included as indicated but does not have a
basin polygon in GIS.
GUBP basin
sample location
in place of
TrentBridge-WN
Appendix D provides definitions for all data flags used in this project. Page | 7
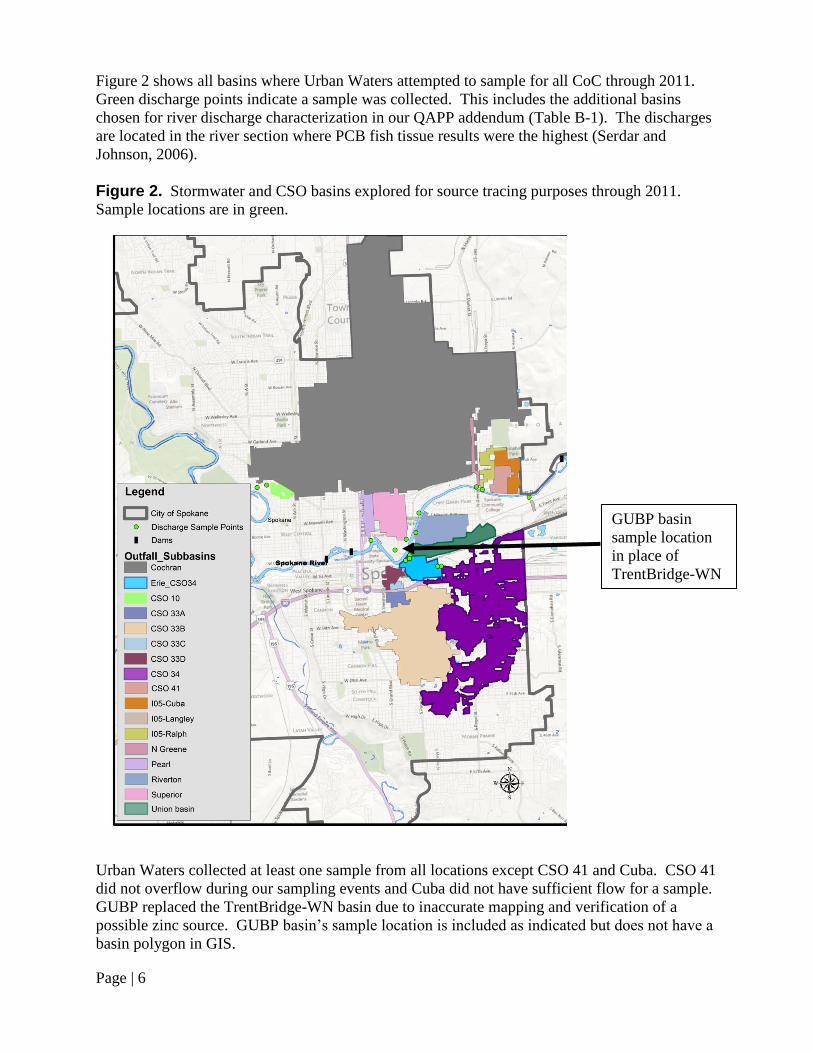
In addition, two locations were chosen further downstream where Cochran basin discharged near
TJ Meenach bridge. This was a combination CSO and stormwater discharge similar to Erie and
CSO 34. Parsons and Terragraphics (2007) study showed this basin as a high PCB loading
catchment so it was included (Parsons and Terragraphics, 2007).
The study area also includes the influent to Spokane’s wastewater treatment plant (SpWWTP),
the Riverside Park Water Reclamation Facility (RPWRF), and four upstream interceptors (Figure
3). Locations were chosen to characterize the concentrations entering the treatment plant and
those entering the City’s system from outside the City boundaries. This sectioned off the sewer
system to identify system branches that may benefit from source tracing. The interceptors
include wastewater from two Spokane Valley locations, Spokane County, and Fairchild Air
Force Base. Only two parameters were collected at these locations, PBDE and dioxin/furan,
because Spokane already monitors for PCB and metals.
Figure 3. Sampling locations within the RPWRF sanitary sewer collection system.
*Road data provided by Bing Maps
Page | 8
Sampling Methods
Water Collection
Stormwater grab samples were taken from manholes using a pole and clean-certified glass bottle.
Some surface flow and flow into catch basin samples were collected by hand using a clean-
certified bottle. Temperature, pH, and dissolved oxygen were collected in the field using an
Oakton “PC10” Meter with an Oakton “GX-2” Probe and recorded on a field sheet. Samples
were homogenized and poured into their respective analytic containers per the QAPP. We no
longer homogenize our water samples with decontaminated equipment due to equipment
contamination issues.
We were unable to collect flow rate manually. Flow depth, depth to water, and flow rate were all
limiting factors for flow collection. In turn, measuring flow depth is required to calculate
volume. Without confined space entry necessary to manually measure, or permanent flow
devices with this capability, it was not possible to determine depth.
Storm events are difficult to sample. Storms in Spokane are often short and intense and rainfall
occurs in the late afternoon, overnight, or early morning. Storms tend to be isolated and fall
within pockets of the city, so following weather predictions does not indicate it will rain in the
particular area of concern. Time to mobilize and reach manholes for sampling often forced
sampling as the storm event was near the end so only one grab could be collected before flow
stopped or was too shallow to collect. This was not the case in the Liberty Lake pilot.
Flow-triggered composite samplers would help resolve these issues. However, limitations include:
Cost
Placement options
High-flow system blow out of flow meter and sample tube
Low-flow system measurement accuracy and sample tube partial submergence
Urban Waters purchased two flow-triggered samplers in 2011 but were unable to make them
operational. Spokane will assist our efforts through the purchase, installation, and maintenance
of two flow-triggered composite samplers in 2012.
In cases where we have limitations, a sediment sampler may be a better alternative.
Sediment and Soil Collection
Sediment samples were taken with a stainless steel, decontaminated auger or a clean-certified
glass bottle. The sampling method chosen depended on:
Depth of sediment
Sediment consistency
Water retention
Appendix D provides definitions for all data flags used in this project. Page | 9
If water was present, Spokane provided a vactor truck to remove as much water as possible
without contacting the sediment. We were unable to use a box sampler successfully because the
larger particulates prevented closure.
Soil samples were collected at the surface using a decontaminated, stainless steel scoop.
Page | 10
Analytical Methods and Detection Limits
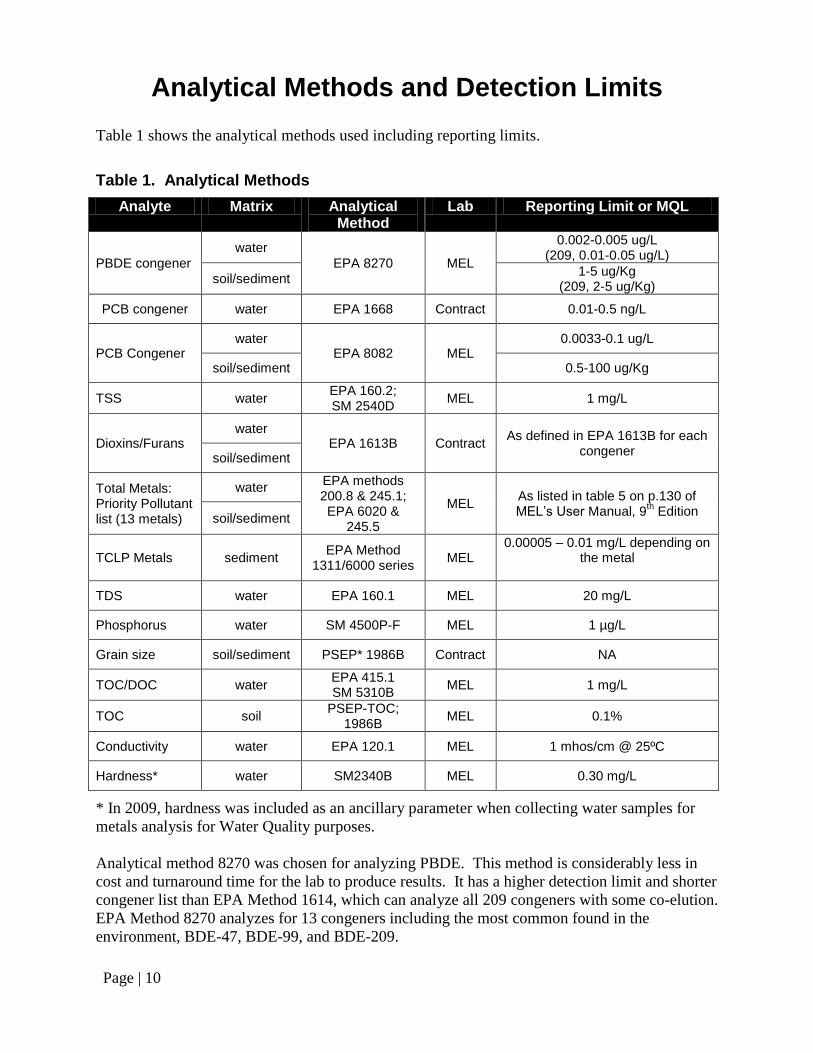
Table 1 shows the analytical methods used including reporting limits.
Table 1. Analytical Methods
Analyte Matrix Analytical Method
Lab Reporting Limit or MQL
PBDE congener
water
EPA 8270 MEL
0.002-0.005 ug/L (209, 0.01-0.05 ug/L)
soil/sediment 1-5 ug/Kg
(209, 2-5 ug/Kg)
PCB congener water EPA 1668 Contract 0.01-0.5 ng/L
PCB Congener water
EPA 8082 MEL 0.0033-0.1 ug/L
soil/sediment 0.5-100 ug/Kg
TSS water EPA 160.2; SM 2540D
MEL 1 mg/L
Dioxins/Furans water
EPA 1613B Contract As defined in EPA 1613B for each
congener soil/sediment
Total Metals: Priority Pollutant list (13 metals)
water EPA methods 200.8 & 245.1; EPA 6020 &
245.5
MEL As listed in table 5 on p.130 of MEL’s User Manual, 9
th Edition
soil/sediment
TCLP Metals sediment EPA Method
1311/6000 series MEL
0.00005 – 0.01 mg/L depending on the metal
TDS water EPA 160.1 MEL 20 mg/L
Phosphorus water SM 4500P-F MEL 1 µg/L
Grain size soil/sediment PSEP* 1986B Contract NA
TOC/DOC water EPA 415.1 SM 5310B
MEL 1 mg/L
TOC soil PSEP-TOC;
1986B MEL 0.1%
Conductivity water EPA 120.1 MEL 1 mhos/cm @ 25ºC
Hardness* water SM2340B MEL 0.30 mg/L
* In 2009, hardness was included as an ancillary parameter when collecting water samples for
metals analysis for Water Quality purposes.
Analytical method 8270 was chosen for analyzing PBDE. This method is considerably less in
cost and turnaround time for the lab to produce results. It has a higher detection limit and shorter
congener list than EPA Method 1614, which can analyze all 209 congeners with some co-elution.
EPA Method 8270 analyzes for 13 congeners including the most common found in the
environment, BDE-47, BDE-99, and BDE-209.
Appendix D provides definitions for all data flags used in this project. Page | 11
The Parsons and Terragraphics (2007) Spokane River stormwater study showed PBDE
concentrations in stormwater were detectable in Spokane’s outfalls at the detection limits
described in Table 1. However, their results and Urban Water’s results for BDE-209 hovered
near the detection limit. This congener is the only one still in use, so including EPA Method
1614 in the QAPP for future use when BDE-209 is near the detection limit will prevent improper
source characterization.
We used the lower resolution analytical methods for most sediment analyses due to the lower
cost per analysis. Lower resolution methods are practical for sediment analysis because most of
our CoC accumulate in sediment, effectively raising the reporting limit. The higher resolution
analytical methods may be used when a congener pattern would enhance our tracing ability.
High resolution methods analyze for all congeners and can provide a congener pattern that may
create a unique fingerprint for a source.
EPA Method 608 was also added to our list in 2011 for the purposes of Water Quality
compliance. Choice of PCB EPA method (1668-209 congeners, 8082-22 congeners, or 608-
aroclor) depends on:
Detection limit needs
Available funds
Previous data collection method for comparability and trend identification
Appendix D provides definitions for all data flags used in this project.
Page | 12
Data Quality
PCB Data Quality
We are currently using two methods for PCB analysis, EPA Method 8082 and 1668. Method 8082
is useful for a higher concentration analysis. It is comparable to Water Quality’s EPA Method 608
for compliance. There is discussion on whether we should use method 608 for sources with Clean
Water Act violations. This may need to be included in our QAPP for future work.
EPA Method 1668 is used for low level concentrations. It requires much cleaner sampling
techniques than 8082 and requires more time for analysis, quality assurance and quality control
both at the lab and for this program, and is higher cost. We are currently working on gaining
permission from EPA for using this method for Clean Water Act violations because of our
Spokane River water quality standard of 170 pg/L.
The QAPP originally called for use of EPA Method 1668A for PCB low level analyses. During
our work version 1668B was released in draft. We used 1668B for a short time; however,
QA/QC criteria issues required us to revert to a modified 1668A analysis. EPA Method 1668C
has recently been released as draft. The difference is mostly in regards to acceptance criteria and
is considered better overall than the previous versions (personal correspondence: Karin
Feddersen, EAP). We are now using method 1668C for all future low level analyses.
We had continual difficulty with clean lab blanks and field blanks. They were typically impacted
with lower chlorinated congeners, including PCB-11, commonly found in inks and dyes. It was
not a concern for sediment samples since concentrations in sediment are usually much higher. To
reduce further contamination problems in the field, we now collect the sample directly into the
bottle when possible or collect samples in a clean-certified glass container that is disposed of after
each use. We no longer homogenize our water samples with decontaminated equipment.
The initial use of N and NJ-flagged data was deemed acceptable because of the usefulness in
using this data for source tracing using congener patterns. N and NJ flags are essentially
“tentative identification” with the NJ having an approximate concentration. However, because
of the need to compare homologue sums and totals to previous data and future compliance data,
N-flagged data will not be included in totals. NJ-flagged data is still under consideration and
may be removed in the future for compliance purposes.
Lab blank contamination was assessed by congener and all data above five times the blank
concentration was accepted. Anything between five and 10 times the blank was accepted as an
estimate and qualified with a J. There is a possibility that future use of Method 1668 for
compliance will require different acceptance criteria for congener data. Urban Waters is
discussing options with Water Quality and EPA.
We analyzed a total of two field blanks and two rinsate blanks to monitor for ambient and cross
contamination respectively (Table 2). The rinsate blank included lab-provided water poured into
our stainless steel container used for homogenizing samples and then collected in a clean
certified amber 1-liter bottle using our stainless steel funnel. We also collected one equipment
blank and two water blanks.

Appendix D provides definitions for all data flags used in this project. Page | 13
Table 2. Field and equipment blank results for PCB EPA Method 1668
Sample ID Collection Date Total PCB (pg/L) Congeners detected Purpose
T2 6/8/2009 165 J Mono (1) Di (4,5/8) Tri (18,31) Penta (110) Hexa (139/149)
Transfer blank
SW Blank 10/27/2009 194 J Di (5/8,7,11,15) Tri (18,31) Tetra (47,48)
Transfer blank
ISCO 1/20/2010 Waiting on QA/QC
Waiting on QA/QC Cross-contamination from tubing
ANAT 1/20/2010 Waiting on QA/QC
Waiting on QA/QC Transfer blank suitability and final rinse for decontamination suitability
ECOL 1/20/2010 Waiting on QA/QC
Waiting on QA/QC Transfer blank suitability and final rinse for decontamination suitability
PR Rinsate blank Avg.
3/28/2011 260 J Mono (2) Di (4,6) Tri (17,20,22,24,28,33,39) Tetra (60, 71) Penta (86/97/117,105,124) Hexa (142,153,161)
Rinsate blank
BLANK 7/20/2011 667 J Mono (1) Tri (18,20/33,28,31) Tetra (54,62,67) Penta (100,116/125) Hexa (135,138,148)
Rinsate blank
Bold = detected concentration
Individual congener results were compared to sample data. Any sample data results less than
five times the blank were qualified with a B and not included in the total. Anything between five
and ten times the blank were qualified with a J. All data more than ten times the blank were not
qualified. The full congener results are available from Ecology by request.
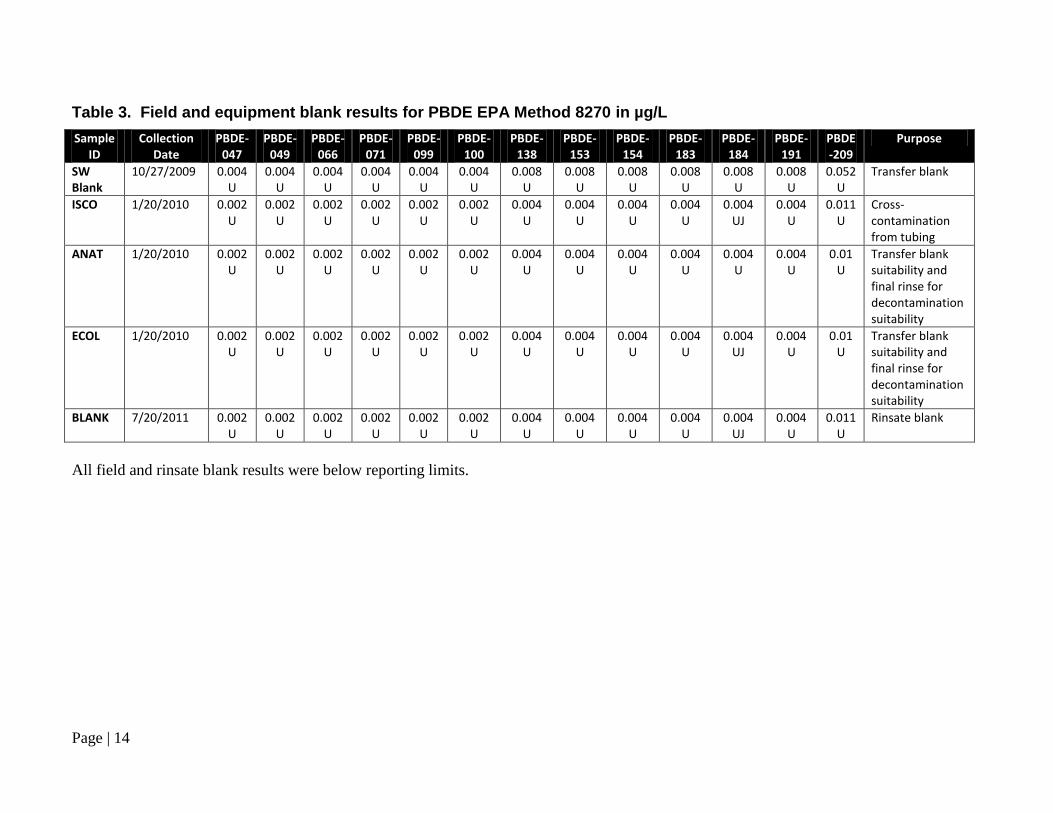
PBDE Data Quality
In most cases data quality objectives were met with a few exceptions as qualified. Matrix
interference increased the reporting limits significantly for one sample. Data reports are
available from Ecology by request.
We analyzed one transfer blank and one rinsate blank to monitor for ambient and cross
contamination respectively (Table 3). The rinsate blank included lab-provided water poured into
our stainless steel container used for homogenizing samples and then collected in a clean certified
amber 1-liter bottle using our stainless steel funnel. To determine clean equipment cross-
contamination from the composite sampler, lab water was run through the composite sampler using
Tygon tubing from a clean-certified glass container to a clean-certified glass container (Sample ID =
ISCO). The ANAT sample and ECOL samples contained laboratory clean water from Anatek and
Ecology’s ERO lab prep room respectively.
Page | 14
Table 3. Field and equipment blank results for PBDE EPA Method 8270 in µg/L
Sample ID
Collection Date
PBDE-047
PBDE-049
PBDE-066
PBDE-071
PBDE-099
PBDE-100
PBDE-138
PBDE-153
PBDE-154
PBDE-183
PBDE-184
PBDE-191
PBDE-209
Purpose
SW Blank
10/27/2009 0.004U
0.004U
0.004U
0.004U
0.004U
0.004U
0.008U
0.008U
0.008U
0.008U
0.008U
0.008U
0.052U
Transfer blank
ISCO 1/20/2010 0.002U
0.002U
0.002U
0.002U
0.002U
0.002U
0.004U
0.004U
0.004U
0.004U
0.004UJ
0.004U
0.011U
Cross-contamination from tubing
ANAT 1/20/2010 0.002U
0.002U
0.002U
0.002U
0.002U
0.002U
0.004U
0.004U
0.004U
0.004U
0.004U
0.004U
0.01U
Transfer blank suitability and final rinse for decontamination suitability
ECOL 1/20/2010 0.002U
0.002U
0.002U
0.002U
0.002U
0.002U
0.004U
0.004U
0.004U
0.004U
0.004UJ
0.004U
0.01U
Transfer blank suitability and final rinse for decontamination suitability
BLANK 7/20/2011 0.002U
0.002U
0.002U
0.002U
0.002U
0.002U
0.004U
0.004U
0.004U
0.004U
0.004UJ
0.004U
0.011U
Rinsate blank
All field and rinsate blank results were below reporting limits.
Appendix D provides definitions for all data flags used in this project. Page | 15
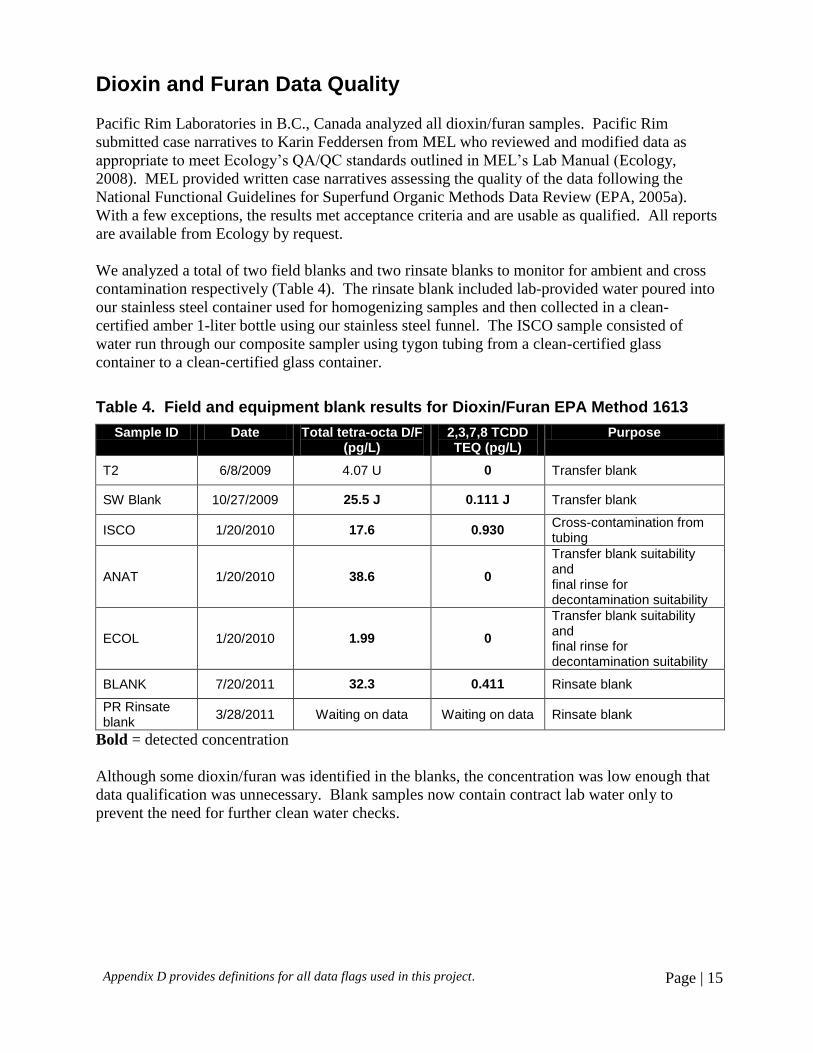
Dioxin and Furan Data Quality
Pacific Rim Laboratories in B.C., Canada analyzed all dioxin/furan samples. Pacific Rim
submitted case narratives to Karin Feddersen from MEL who reviewed and modified data as
appropriate to meet Ecology’s QA/QC standards outlined in MEL’s Lab Manual (Ecology,
2008). MEL provided written case narratives assessing the quality of the data following the
National Functional Guidelines for Superfund Organic Methods Data Review (EPA, 2005a).
With a few exceptions, the results met acceptance criteria and are usable as qualified. All reports
are available from Ecology by request.
We analyzed a total of two field blanks and two rinsate blanks to monitor for ambient and cross
contamination respectively (Table 4). The rinsate blank included lab-provided water poured into
our stainless steel container used for homogenizing samples and then collected in a clean-
certified amber 1-liter bottle using our stainless steel funnel. The ISCO sample consisted of
water run through our composite sampler using tygon tubing from a clean-certified glass
container to a clean-certified glass container.
Table 4. Field and equipment blank results for Dioxin/Furan EPA Method 1613
Sample ID Date Total tetra-octa D/F (pg/L)
2,3,7,8 TCDD TEQ (pg/L)
Purpose
T2 6/8/2009 4.07 U 0 Transfer blank
SW Blank 10/27/2009 25.5 J 0.111 J Transfer blank
ISCO 1/20/2010 17.6 0.930 Cross-contamination from tubing
ANAT 1/20/2010 38.6 0
Transfer blank suitability and final rinse for decontamination suitability
ECOL 1/20/2010 1.99 0
Transfer blank suitability and final rinse for decontamination suitability
BLANK 7/20/2011 32.3 0.411 Rinsate blank
PR Rinsate blank
3/28/2011 Waiting on data Waiting on data Rinsate blank
Bold = detected concentration
Although some dioxin/furan was identified in the blanks, the concentration was low enough that
data qualification was unnecessary. Blank samples now contain contract lab water only to
prevent the need for further clean water checks.
Page | 16
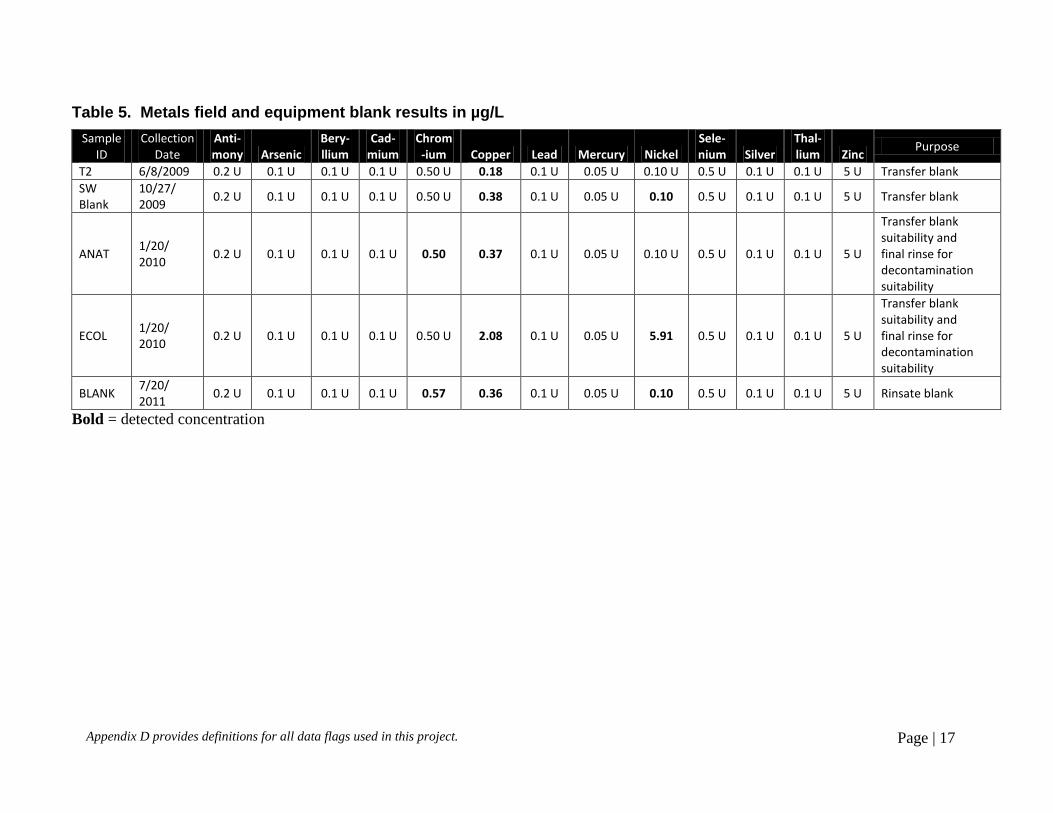
Metals Data Quality
We analyzed a total of two transfer blanks and one rinsate blank to monitor for ambient and
cross contamination respectively (Table 5). The rinsate blank included lab-provided water
poured into our stainless steel container used for homogenizing samples and then collected in a
clean-certified amber 1-liter bottle using our stainless steel funnel. The ANAT sample and
ECOL samples contained laboratory clean water from Anatek and Ecology’s ERO lab prep room
respectively.
Blank concentrations for metals were less than five times the sample data. No data qualifications
were necessary. Laboratory water provided by Anatek contained chromium and copper so
should not be used for metals transfer blanks. Laboratory water provided by Ecology’s Eastern
Regional Office laboratory contained nickel and copper so should not be used for metals transfer
blanks. All blanks had some concentration of copper, three blanks contained nickel and two
contained chromium. Our rinsate blank contained all three metals. Blank samples now contain
MEL water only to eliminate the need for additional blank analysis.
Appendix D provides definitions for all data flags used in this project. Page | 17
Table 5. Metals field and equipment blank results in µg/L
Sample ID
Collection Date
Anti-mony Arsenic
Bery-llium
Cad-mium
Chrom-ium Copper Lead Mercury Nickel
Sele-nium Silver
Thal-lium Zinc
Purpose
T2 6/8/2009 0.2 U 0.1 U 0.1 U 0.1 U 0.50 U 0.18 0.1 U 0.05 U 0.10 U 0.5 U 0.1 U 0.1 U 5 U Transfer blank
SW Blank
10/27/ 2009
0.2 U 0.1 U 0.1 U 0.1 U 0.50 U 0.38 0.1 U 0.05 U 0.10 0.5 U 0.1 U 0.1 U 5 U Transfer blank
ANAT 1/20/ 2010
0.2 U 0.1 U 0.1 U 0.1 U 0.50 0.37 0.1 U 0.05 U 0.10 U 0.5 U 0.1 U 0.1 U 5 U
Transfer blank suitability and final rinse for decontamination suitability
ECOL 1/20/ 2010
0.2 U 0.1 U 0.1 U 0.1 U 0.50 U 2.08 0.1 U 0.05 U 5.91 0.5 U 0.1 U 0.1 U 5 U
Transfer blank suitability and final rinse for decontamination suitability
BLANK 7/20/ 2011
0.2 U 0.1 U 0.1 U 0.1 U 0.57 0.36 0.1 U 0.05 U 0.10 0.5 U 0.1 U 0.1 U 5 U Rinsate blank
Bold = detected concentration
Page | 18
Pattern Tracing
Pattern identification is a useful technique for source tracing (Garvey et al., 2002), especially for
contaminants such as PCB where there are 209 different forms. The different forms, or congeners,
differ in concentration within a sample creating a “fingerprint.” This “fingerprint” can be used to
help identify the source. Pattern recognition techniques can range from a gross visual comparison
of homologues to more sophisticated pattern analysis software. Software can decipher multiple
patterns within a sample, and identify particular source types by looking at all 209 congeners.
Urban Waters currently uses the visual homologue comparison technique to determine the
number of sources, but it is difficult to determine the actual source without more detailed
individual congener comparisons.
Another method of pattern recognition includes mathematical software such as principle
component analysis (PCA) or positive matrix factorization (PMF). Both of these methods have
been used in PCB source tracing in other areas as well as locally. The Parsons and Terragraphics
(2007) study used PCA to identify groupings of basins with similar congener patterns. In turn,
Delaware River source tracing efforts used PMF analysis to assist with source apportionment. The
PMF program identified six congener patterns associated with various sources (Du et al., 2008).
The PMF software in particular is capable of assisting researchers with identifying particular
sources quickly and with less sample points. Future use of this software may be warranted to
increase source tracing efficiency.
Appendix D provides definitions for all data flags used in this project. Page | 19
Source Tracing Prioritization
Basin prioritization for source tracing relies on many factors. For example, basin size, outfall
concentrations, basin loading to the river, historical and current land use, etc. Some of these factors
are more difficult to obtain than others. In particular, determining a concentration or loading-based
trigger point for a heterogeneous stormwater and CSO basin system has its challenges.
Concentration comparison between the Liberty Lake pilot project and work in Spokane will be
used to help determine basin priority for source tracing until we gain better information on
stormwater background concentrations from air deposition.
Loading was not calculated for current basin work because flow velocity data collection was not
possible with Urban Waters’ current equipment. Consideration of basin loading may modify
basin priority. Using loading for prioritizing source tracing must be done with caution. Basin
size must be taken into account if loading is used as a form of prioritizing source tracing activity,
especially with ubiquitous chemicals in combination with low-level analysis.
For example, PCB is ubiquitous and has been detectable in most stormwater samples where cross or
ambient contamination is not an issue. Cochran Basin is several times larger than any other basin
and will always discharge a substantial load to the river even at urban “background” concentrations.
The dilution factor due to the volume of the basin makes it difficult to identify a single source,
particularly when dealing with such low contaminant concentrations. In this case, source tracing in
a large basin would be equivalent to trying to find a needle in a haystack. Further, while the Parsons
and Terragraphics (2007) study showed Cochran Basin as the second highest load via stormwater,
fish tissue concentrations in the Spokane River where Cochran discharges are well below those
around the Mission Park area where PCB fish tissue concentrations are the highest.
System diversion, low impact development, and other forms of volume reduction may be more
useful than source tracing and expensive monitoring.
There are many factors that influence concentration, flow, and loading. Storm intensity and
duration, basin topography, and percent of impervious surface are just a few. These factors make
comparison of data difficult spatially and temporally. Using the sediment sampler where
possible to collect CoC associated with turbidity or TSS may help to eliminate some of the issues
with stormwater grab concentrations, flow, and loading in relation to prioritizing source tracing
efforts. Sediment sampling that captures a full storm event will make factors like flow-based
loading less critical for source tracing.
Page | 20
PCB Section
Overview
This section summarizes PCB results within the Spokane Basin that include WRIA’s 54-57.
PCB source tracing focused on Union Basin and CSO 34/Erie Basin stormwater and combined
sewer overflow basins due to recommendations from the 2007 Spokane River stormwater
analysis report (Parsons and Terragraphics, 2007). The ten additional basins were selected for
characterization because of their location between Upriver and Monroe St. dams. A 2005
Ecology report showed the highest fish tissue concentrations along the stretch of river between
Upriver and Monroe St. dams (Serdar and Johnson, 2005). Investigation within Spokane
expanded our focus area where necessary.
General progress for PCB source tracing and elimination included:
Collected 57 samples between 2009 and September 2011.
Collected data on a total of eleven stormwater and three CSO basins within Spokane.
Identified two sources of PCB to the river.
Requested and received an EAP literature review on current air deposition.
Participated in a general area background concentration study in fish and sediments for
northeast Washington waterbodies.
Identified homologue patterns for various media.
Provided guidance and training to local government and internal staff on method 1668 and
sampling techniques.
Continue to participate in Technical Track workgroup for the Spokane Regional Toxics Task
Force.
Continue to investigate four sources of PCB to the City’s storm system from data collected
by Spokane (Figure 4).
Spokane conducted source tracing and elimination work for PCB within their storm system.
Because Union basin was one of the known contaminated discharges, they began their work in this
basin approximately one year after we started. They collected sediment from catch basins and their
connected drywells while Urban Waters worked with businesses on compliance. The City also
completed several system modifications to reduce turbidity, which should also reduce any river
PCB contamination due to air deposition and any unknown sources discharging to the system.
Page | 21
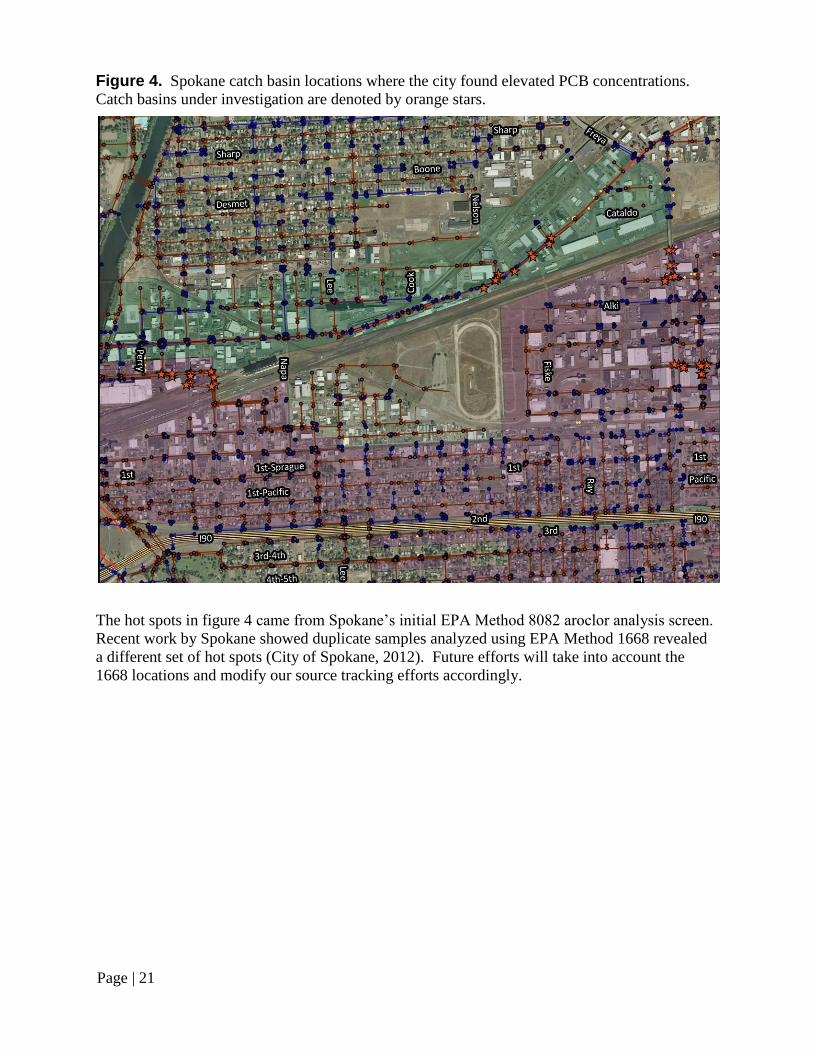
Figure 4. Spokane catch basin locations where the city found elevated PCB concentrations.
Catch basins under investigation are denoted by orange stars.
The hot spots in figure 4 came from Spokane’s initial EPA Method 8082 aroclor analysis screen.
Recent work by Spokane showed duplicate samples analyzed using EPA Method 1668 revealed
a different set of hot spots (City of Spokane, 2012). Future efforts will take into account the
1668 locations and modify our source tracking efforts accordingly.
Page | 22
Identified the following data and procedural gaps:
o Clear decision points to determine when a basin needs upstream tracing and when a basin
is considered “clean.” Reasons include:
All basin outfalls sampled contained PCB that exceeded the 3.37 pg/L water quality
standard.
Reliably detecting a concentration at 3.37 pg/L is not currently possible with the on-
going blank contamination and matrix interference issues.
Although Spokane and Urban Waters took measures to remediate a source in Union
Basin, concentrations at the outfall did not decrease after the cleanout.
o Understanding and separating local and long range air deposition from other sources.
o Interactive tool to assist with tracking all local data gathered on PCB to better understand
sources.
o Product list, concentrations, and congener patterns for inadvertently produced PCB.
o Positive Matrix Factorization software to help identify different sources from collected
data.
o Determine if chiral signature analysis would be useful for any of our work as they have
done elsewhere (C.S. Wong et al., 2001; B.J. Asher et al., 2007).
o A document or webpage that reviews and makes available the body of literature on PCB
source tracing and elimination collected over the past three years with source lists.
Results/Discussion
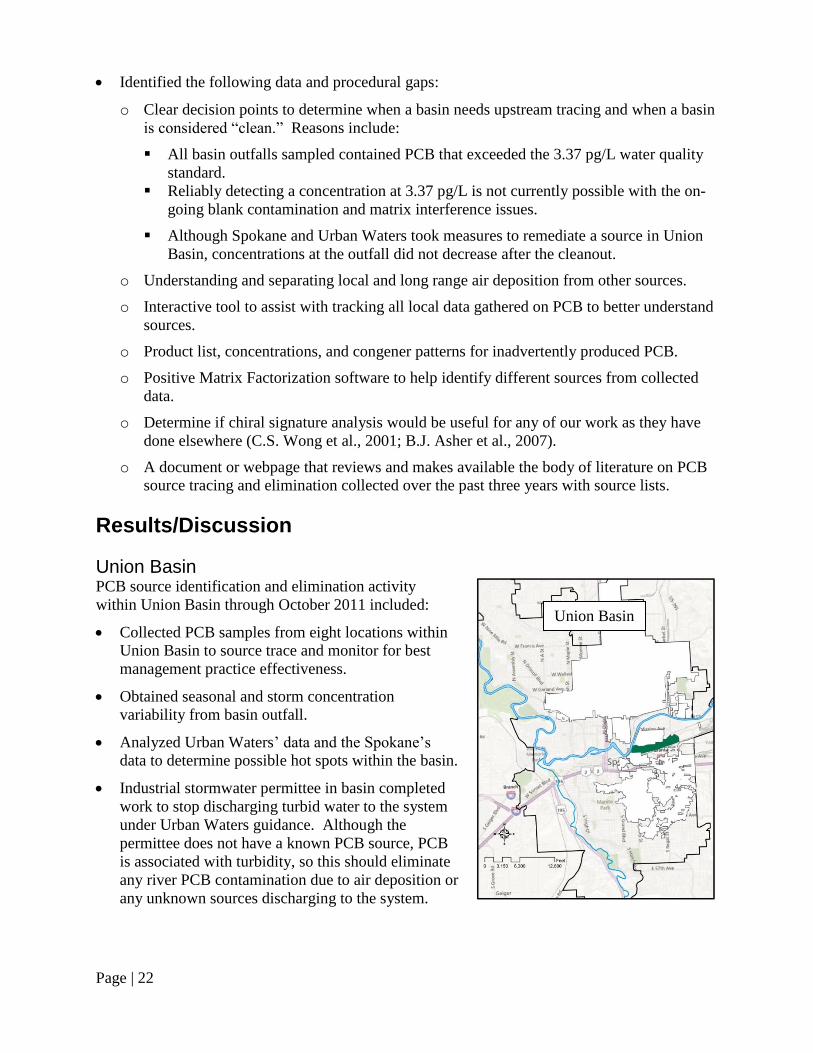
Union Basin PCB source identification and elimination activity
within Union Basin through October 2011 included:
Collected PCB samples from eight locations within
Union Basin to source trace and monitor for best
management practice effectiveness.
Obtained seasonal and storm concentration
variability from basin outfall.
Analyzed Urban Waters’ data and the Spokane’s
data to determine possible hot spots within the basin.
Industrial stormwater permittee in basin completed
work to stop discharging turbid water to the system
under Urban Waters guidance. Although the
permittee does not have a known PCB source, PCB
is associated with turbidity, so this should eliminate
any river PCB contamination due to air deposition or
any unknown sources discharging to the system.
Union Basin
Appendix D provides definitions for all data flags used in this project. Page | 23
Required a recycling facility to obtain an Industrial Stormwater Discharge Permit for lead
and turbidity under Urban Waters guidance. The facility discharged to a catch basin with
elevated PCB concentrations and other CoC. Data analysis is underway for PCB source
determination. Facility stormwater discharge elimination activities are on-going.
Performed sampling training and sampling plan review for Spokane for source tracing and
sampling PCB in their catch basin and drywells within Union basin.
Found PCB soil contamination on Spokane property surrounding the City Parcel site; this
prompted cleanout and eventual disconnection of the system from the river. City Parcel went
through TCP cleanup for PCB transformer oil contamination.
Conducted historical research of an area just north of the Trent Ave. Bridge along the east
bank based on a past complaint. A river bank soil and groundwater investigation is
recommended to determine if it is a source.
Currently working with Spokane to pinpoint a potential source along Trent Avenue. This
was identified from their composite catch basin sampling and confirmed with our Trent
(1384910ST) stormwater sample.
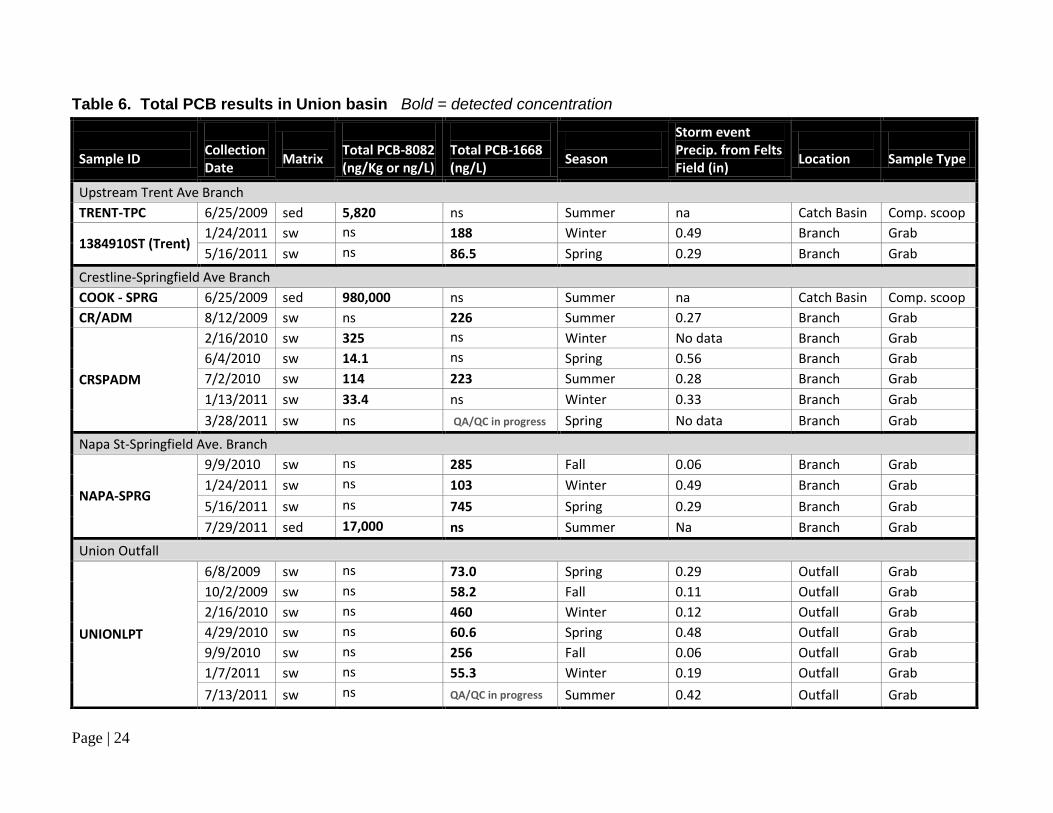
Results/Discussion Urban Waters attempted to sample five branches within Union Basin’s piped stormwater system.
Figure B-2 displays the sample locations within Union Basin. All results are shown in Table 6.
Page | 24
Table 6. Total PCB results in Union basin Bold = detected concentration
Sample ID
Collection Date
Matrix
Total PCB-8082 (ng/Kg or ng/L)
Total PCB-1668 (ng/L)
Season
Storm event Precip. from Felts Field (in)
Location
Sample Type
Upstream Trent Ave Branch
TRENT-TPC 6/25/2009 sed 5,820 ns Summer na Catch Basin Comp. scoop
1384910ST (Trent) 1/24/2011 sw ns 188 Winter 0.49 Branch Grab
5/16/2011 sw ns 86.5 Spring 0.29 Branch Grab
Crestline-Springfield Ave Branch
COOK - SPRG 6/25/2009 sed 980,000 ns Summer na Catch Basin Comp. scoop
CR/ADM 8/12/2009 sw ns 226 Summer 0.27 Branch Grab
CRSPADM
2/16/2010 sw 325 ns Winter No data Branch Grab
6/4/2010 sw 14.1 ns Spring 0.56 Branch Grab
7/2/2010 sw 114 223 Summer 0.28 Branch Grab
1/13/2011 sw 33.4 ns Winter 0.33 Branch Grab
3/28/2011 sw ns QA/QC in progress Spring No data Branch Grab
Napa St-Springfield Ave. Branch
NAPA-SPRG
9/9/2010 sw ns 285 Fall 0.06 Branch Grab
1/24/2011 sw ns 103 Winter 0.49 Branch Grab
5/16/2011 sw ns 745 Spring 0.29 Branch Grab
7/29/2011 sed 17,000 ns Summer Na Branch Grab
Union Outfall
UNIONLPT
6/8/2009 sw ns 73.0 Spring 0.29 Outfall Grab
10/2/2009 sw ns 58.2 Fall 0.11 Outfall Grab
2/16/2010 sw ns 460 Winter 0.12 Outfall Grab
4/29/2010 sw ns 60.6 Spring 0.48 Outfall Grab
9/9/2010 sw ns 256 Fall 0.06 Outfall Grab
1/7/2011 sw ns 55.3 Winter 0.19 Outfall Grab
7/13/2011 sw ns QA/QC in progress Summer 0.42 Outfall Grab
Appendix D provides definitions for all data flags used in this project. Page | 25
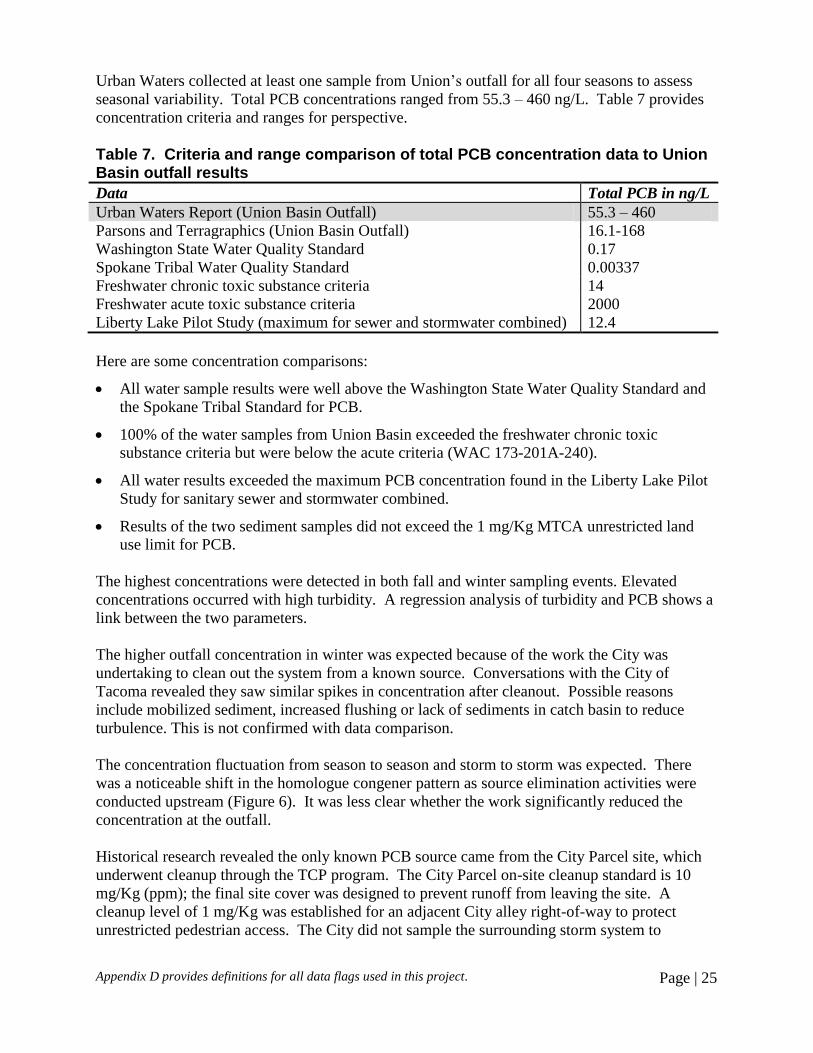
Urban Waters collected at least one sample from Union’s outfall for all four seasons to assess
seasonal variability. Total PCB concentrations ranged from 55.3 – 460 ng/L. Table 7 provides
concentration criteria and ranges for perspective.
Table 7. Criteria and range comparison of total PCB concentration data to Union Basin outfall results
Data Total PCB in ng/L
Urban Waters Report (Union Basin Outfall) 55.3 – 460
Parsons and Terragraphics (Union Basin Outfall) 16.1-168
Washington State Water Quality Standard 0.17
Spokane Tribal Water Quality Standard 0.00337
Freshwater chronic toxic substance criteria 14
Freshwater acute toxic substance criteria 2000
Liberty Lake Pilot Study (maximum for sewer and stormwater combined) 12.4
Here are some concentration comparisons:
All water sample results were well above the Washington State Water Quality Standard and
the Spokane Tribal Standard for PCB.
100% of the water samples from Union Basin exceeded the freshwater chronic toxic
substance criteria but were below the acute criteria (WAC 173-201A-240).
All water results exceeded the maximum PCB concentration found in the Liberty Lake Pilot
Study for sanitary sewer and stormwater combined.
Results of the two sediment samples did not exceed the 1 mg/Kg MTCA unrestricted land
use limit for PCB.
The highest concentrations were detected in both fall and winter sampling events. Elevated
concentrations occurred with high turbidity. A regression analysis of turbidity and PCB shows a
link between the two parameters.
The higher outfall concentration in winter was expected because of the work the City was
undertaking to clean out the system from a known source. Conversations with the City of
Tacoma revealed they saw similar spikes in concentration after cleanout. Possible reasons
include mobilized sediment, increased flushing or lack of sediments in catch basin to reduce
turbulence. This is not confirmed with data comparison.
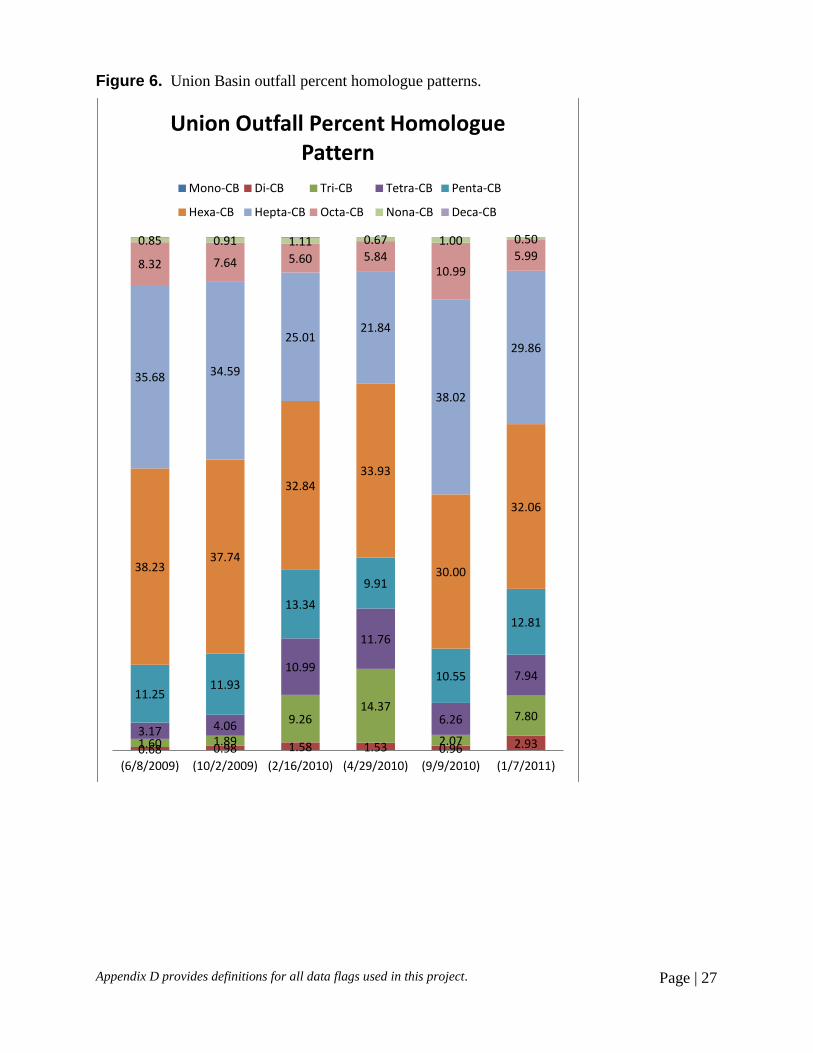
The concentration fluctuation from season to season and storm to storm was expected. There
was a noticeable shift in the homologue congener pattern as source elimination activities were
conducted upstream (Figure 6). It was less clear whether the work significantly reduced the
concentration at the outfall.
Historical research revealed the only known PCB source came from the City Parcel site, which
underwent cleanup through the TCP program. The City Parcel on-site cleanup standard is 10
mg/Kg (ppm); the final site cover was designed to prevent runoff from leaving the site. A
cleanup level of 1 mg/Kg was established for an adjacent City alley right-of-way to protect
unrestricted pedestrian access. The City did not sample the surrounding storm system to
Page | 26
determine if contaminated sediment was present. The remedial action did not consider possible
sediment removal from the system for protection of the Water Quality Standard in the river.
The LSCS identified a City street drywell with overflow to Union basin near the southwest
corner of the City Parcel property as a possible conduit of PCB to the river. A sediment sample
from the connected drywell at the corner of Cook St. and Springfield Ave. (Cook-Sprg) showed
a concentration of 980,000 ng/Kg total PCB. The stormwater in-pipe concentration (CRSPADM
and CR/ADM) was 226 ng/L. The City cleaned out the system. Subsequent stormwater
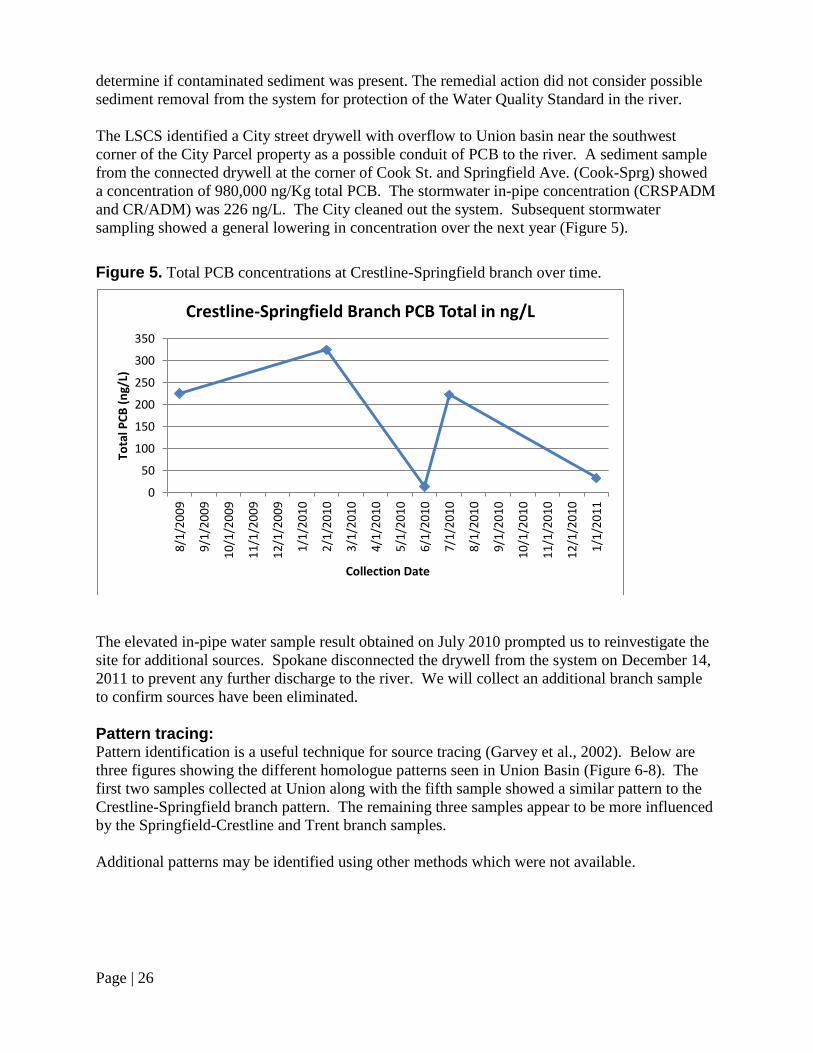
sampling showed a general lowering in concentration over the next year (Figure 5).
Figure 5. Total PCB concentrations at Crestline-Springfield branch over time.
The elevated in-pipe water sample result obtained on July 2010 prompted us to reinvestigate the
site for additional sources. Spokane disconnected the drywell from the system on December 14,
2011 to prevent any further discharge to the river. We will collect an additional branch sample
to confirm sources have been eliminated.
Pattern tracing: Pattern identification is a useful technique for source tracing (Garvey et al., 2002). Below are
three figures showing the different homologue patterns seen in Union Basin (Figure 6-8). The
first two samples collected at Union along with the fifth sample showed a similar pattern to the
Crestline-Springfield branch pattern. The remaining three samples appear to be more influenced
by the Springfield-Crestline and Trent branch samples.
Additional patterns may be identified using other methods which were not available.
0
50
100
150
200
250
300
350
8/1
/20
09
9/1
/20
09
10
/1/2
00
9
11
/1/2
00
9
12
/1/2
00
9
1/1
/20
10
2/1
/20
10
3/1
/20
10
4/1
/20
10
5/1
/20
10
6/1
/20
10
7/1
/20
10
8/1
/20
10
9/1
/20
10
10
/1/2
01
0
11
/1/2
01
0
12
/1/2
01
0
1/1
/20
11
Tota
l PC
B (
ng/
L)
Collection Date
Crestline-Springfield Branch PCB Total in ng/L
Appendix D provides definitions for all data flags used in this project. Page | 27
Figure 6. Union Basin outfall percent homologue patterns.
0.68 0.98 1.58 1.53 0.96 2.93 1.60 1.89
9.26 14.37
2.07
7.80 3.17 4.06
10.99
11.76
6.26
7.94
11.25 11.93
13.34
9.91
10.55
12.81
38.23 37.74
32.84 33.93
30.00
32.06
35.68 34.59
25.01 21.84
38.02
29.86
8.32 7.64 5.60 5.84 10.99
5.99 0.85 0.91 1.11 0.67 1.00 0.50
(6/8/2009) (10/2/2009) (2/16/2010) (4/29/2010) (9/9/2010) (1/7/2011)
Union Outfall Percent Homologue Pattern
Mono-CB Di-CB Tri-CB Tetra-CB Penta-CB
Hexa-CB Hepta-CB Octa-CB Nona-CB Deca-CB

Page | 28
Figure 7. Crestline-Springfield branch
stormwater homologue patterns.
Figure 8. Napa-Springfield and upstream
Trent branch stormwater PCB homologue
percent patterns.
Erie Basin/CSO 34 Basin outfall monitoring began in 2009. Basin
investigations began in 2010 after Union Basin
sources were mostly identified.
Table 8 shows results for CSO 34 and Erie
Basin investigations.
7.99 10.54
34.79 41.61
44.99 35.19
9.97 7.55
8/12/2009 7/2/2010
PC
B P
erc
en
t H
om
olo
gue
Sample Collection Date
Crestline-Springfield Branch homologue
pattern
Mono-CB Di-CB Tri-CB
Tetra-CB Penta-CB Hexa-CB
Hepta-CB Octa-CB Nona-CB
Deca-CB
3.17 5.66 2.21 10.91
14.31 7.24
14.07 13.86
8.49
20.91 13.71
8.60
25.53 27.22
33.45
17.71 18.92 32.96
5.70 4.80 6.21
Napa-Springfield 9/9/2010
Napa-Springfield 1/24/2011
1384910ST (Trent)
1/24/2011
PCB Homologue Percent Pattern
Mono-CB Di-CB Tri-CB Tetra-CB
Penta-CB Hexa-CB Hepta-CB Octa-CB
Nona-CB Deca-CB
Erie Basin (blue)
CSO 34 (purple)
Appendix D provides definitions for all data flags used in this project. Page | 29
Table 8. Total PCB results for CSO 34 and Erie Basin investigations
Sample ID Collection
Date Matrix
Total PCB
(ng/L) Basin Season Location Method
Storm event Precip. from
Felts Field (in)
CSO 34 Above Weir
CSO34A 7/15/2010 sa 8.91 CSO 34 Summer Above Weir 1668A na
CSO 34 Overflow Below Weir
CSO34B
6/8/2009 cso 24.7 CSO 34 Spring Weir
Overflow 1668A 0.29
10/23/2009 cso 11.9 CSO 34 Fall Weir
Overflow 1668A 0.75
4/22/2010 cso 39.0 CSO 34 Spring Weir
Overflow 1668A 0.27
1/13/2011 cso 7.18 CSO 34 Winter Weir
Overflow 1668A 0.33
BNSF/ENX Facility
FLYASH 2/3/2010 Waste Solid
120 U Erie Winter Facility ground
8082 0.01
Napa St and Riverside Ave Intersection
BECK 11/5/2010 sed 4630 J Erie FALL Drywell 8082 na
Erie Basin Outfall
ErieLPt/ CSO34B
6/8/2009 cso 23.9 Erie Spring Outfall 1668A 0.29
1/13/2011 sw 8.11 Erie Winter Outfall 1668A 0.33
ERIELPt 10/2/2009 sw 58.3 Erie Fall Outfall 1668A 0.11
2/16/2010 sw 62.6 Erie Winter Outfall 1668A 0.12
sed = sediment; sa = sanitary sewer water; sw = stormwater; cso = combined sewer and
stormwater overflow; na = not applicable; Bold = detected concentration
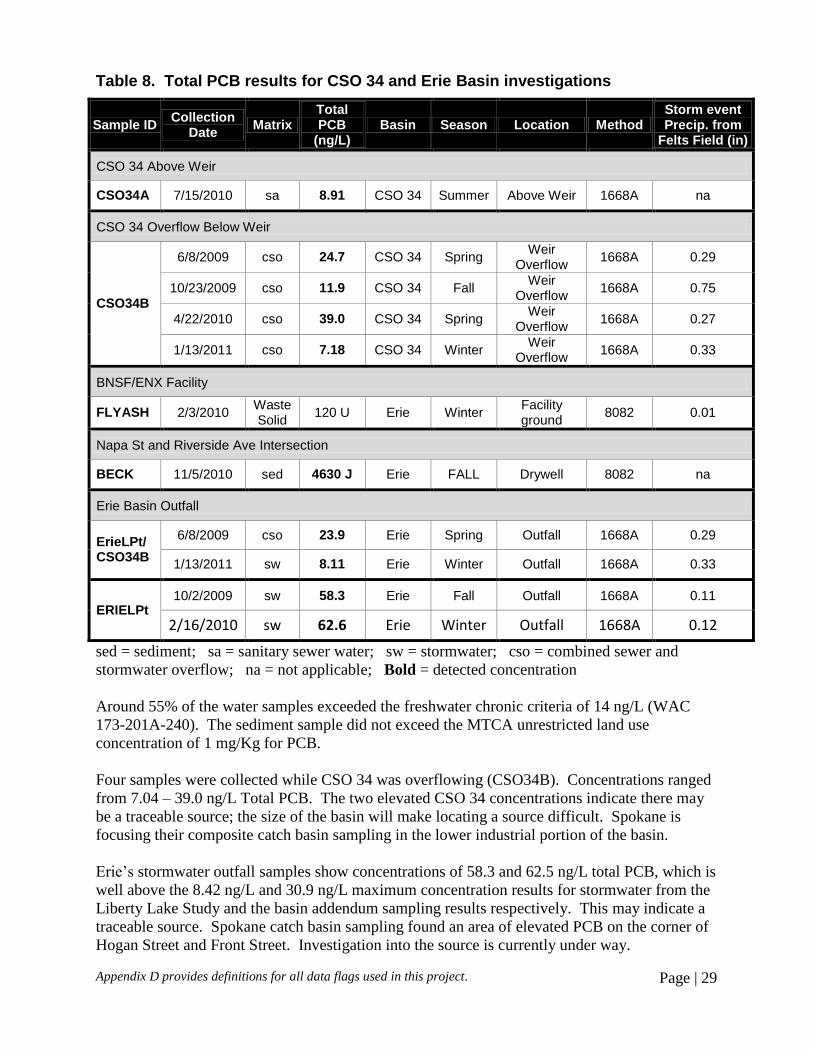
Around 55% of the water samples exceeded the freshwater chronic criteria of 14 ng/L (WAC
173-201A-240). The sediment sample did not exceed the MTCA unrestricted land use
concentration of 1 mg/Kg for PCB.
Four samples were collected while CSO 34 was overflowing (CSO34B). Concentrations ranged
from 7.04 – 39.0 ng/L Total PCB. The two elevated CSO 34 concentrations indicate there may
be a traceable source; the size of the basin will make locating a source difficult. Spokane is
focusing their composite catch basin sampling in the lower industrial portion of the basin.
Erie’s stormwater outfall samples show concentrations of 58.3 and 62.5 ng/L total PCB, which is
well above the 8.42 ng/L and 30.9 ng/L maximum concentration results for stormwater from the
Liberty Lake Study and the basin addendum sampling results respectively. This may indicate a
traceable source. Spokane catch basin sampling found an area of elevated PCB on the corner of
Hogan Street and Front Street. Investigation into the source is currently under way.

Page | 30
Two samples were collected at Erie’s outfall while CSO 34 was overflowing. Concentrations at
CSO 34’s weir and at Erie’s outfall are similar, 24.6 vs. 23.9 and 7.04 vs. 8.05 ng/L total PCB,
indicating CSO 34 dilutes any sources within Erie basin when overflowing.
The BECK sample was collected due to nearby radiator shop activity. Results did not show
elevated PCB in the drywell, so no further action in that branch was taken. The FLYASH catch
basin was collected near a railroad and a flyash transfer facility. The results were below
detection limits and will not be pursued.
Additional Sampling
Other Basins Ten additional basins to Union, Erie, and CSO 34 were added to the sampling analysis plan
(Table B-1, Figure B-1). All basin outfalls were located within the area between Upriver Dam
and Monroe St. Dam where the highest fish tissue PCB concentration was found in the 2005
Ecology monitoring report (Johnson et al., 2006). The final list of basins sampled with PCB
results are displayed in Table 9.
Table 9. PCB totals from 11 basin outfalls to the Spokane River
Sample ID Collection
Date Matrix
Total PCB Method 1668
(ng/L) Basin Season Location
Storm event Precip. from
Felts Field (in)
AvistaP 5/10/2011 Pond Water
0.091 Avista Spring Outfall NA
Cochran 10/14/2009 SW 10.6 Cochran Fall Outfall 0.35
Cochran 10/23/2009 SW 6.89 Cochran Fall Outfall 0.75
Cochran 10/26/2009 SW 4.63 Cochran Fall Outfall 0.62
CSO 10 10/23/2009 SW/SA 6.33 CSO 10 Fall Weir
Overflow 0.75
CSO33 7/13/2011 SA 5.85 CSO33 Summer Weir
Overflow 0.42
GUBP 4/22/2010 SW 19.6 GUBP Spring Outfall 0.27
Langley 7/19/2011 SW QA/QC in progress
Langley Summer Outfall 0.08
NWGreen 10/14/2009 SW 22.3 NWGreen Fall Outfall 0.35
NWGreen 10/23/2009 SW 31.1 NWGreen Fall Outfall 0.75
NWGreen 10/26/2009 SW 15.8 NWGreen Fall Outfall 0.62
Pearl 10/14/2009 SW 10.3 Pearl Fall Outfall 0.35
Pearl 10/23/2009 SW 16.5 Pearl Fall Outfall 0.75
Pearl 10/26/2009 SW 5.67 Pearl Fall Outfall 0.62
Ralph 4/21/2011 SW 7.36 Ralph Spring Outfall 0.01
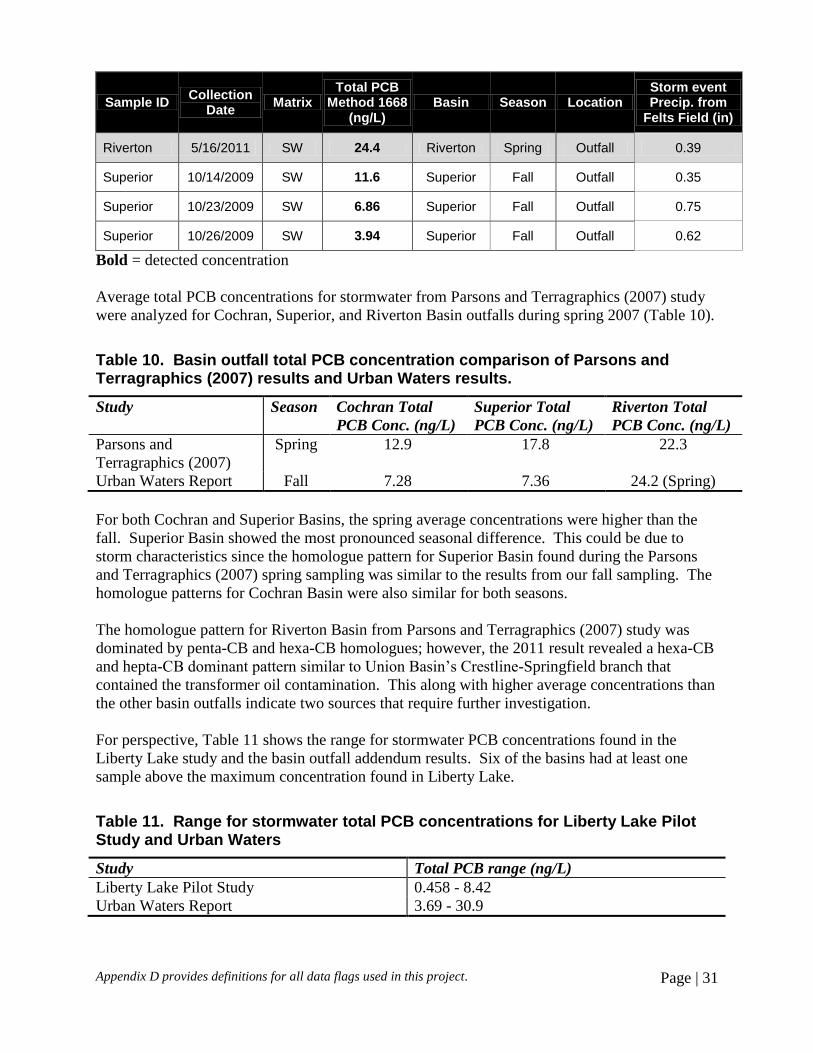
Appendix D provides definitions for all data flags used in this project. Page | 31
Sample ID Collection
Date Matrix
Total PCB Method 1668
(ng/L) Basin Season Location
Storm event Precip. from
Felts Field (in)
Riverton 5/16/2011 SW 24.4 Riverton Spring Outfall 0.39
Superior 10/14/2009 SW 11.6 Superior Fall Outfall 0.35
Superior 10/23/2009 SW 6.86 Superior Fall Outfall 0.75
Superior 10/26/2009 SW 3.94 Superior Fall Outfall 0.62
Bold = detected concentration
Average total PCB concentrations for stormwater from Parsons and Terragraphics (2007) study
were analyzed for Cochran, Superior, and Riverton Basin outfalls during spring 2007 (Table 10).
Table 10. Basin outfall total PCB concentration comparison of Parsons and Terragraphics (2007) results and Urban Waters results.
Study Season Cochran Total
PCB Conc. (ng/L)
Superior Total
PCB Conc. (ng/L)
Riverton Total
PCB Conc. (ng/L)
Parsons and
Terragraphics (2007)
Spring 12.9 17.8 22.3
Urban Waters Report Fall 7.28 7.36 24.2 (Spring)
For both Cochran and Superior Basins, the spring average concentrations were higher than the
fall. Superior Basin showed the most pronounced seasonal difference. This could be due to
storm characteristics since the homologue pattern for Superior Basin found during the Parsons
and Terragraphics (2007) spring sampling was similar to the results from our fall sampling. The
homologue patterns for Cochran Basin were also similar for both seasons.
The homologue pattern for Riverton Basin from Parsons and Terragraphics (2007) study was
dominated by penta-CB and hexa-CB homologues; however, the 2011 result revealed a hexa-CB
and hepta-CB dominant pattern similar to Union Basin’s Crestline-Springfield branch that
contained the transformer oil contamination. This along with higher average concentrations than
the other basin outfalls indicate two sources that require further investigation.
For perspective, Table 11 shows the range for stormwater PCB concentrations found in the
Liberty Lake study and the basin outfall addendum results. Six of the basins had at least one
sample above the maximum concentration found in Liberty Lake.
Table 11. Range for stormwater total PCB concentrations for Liberty Lake Pilot Study and Urban Waters
Study Total PCB range (ng/L)
Liberty Lake Pilot Study 0.458 - 8.42
Urban Waters Report 3.69 - 30.9
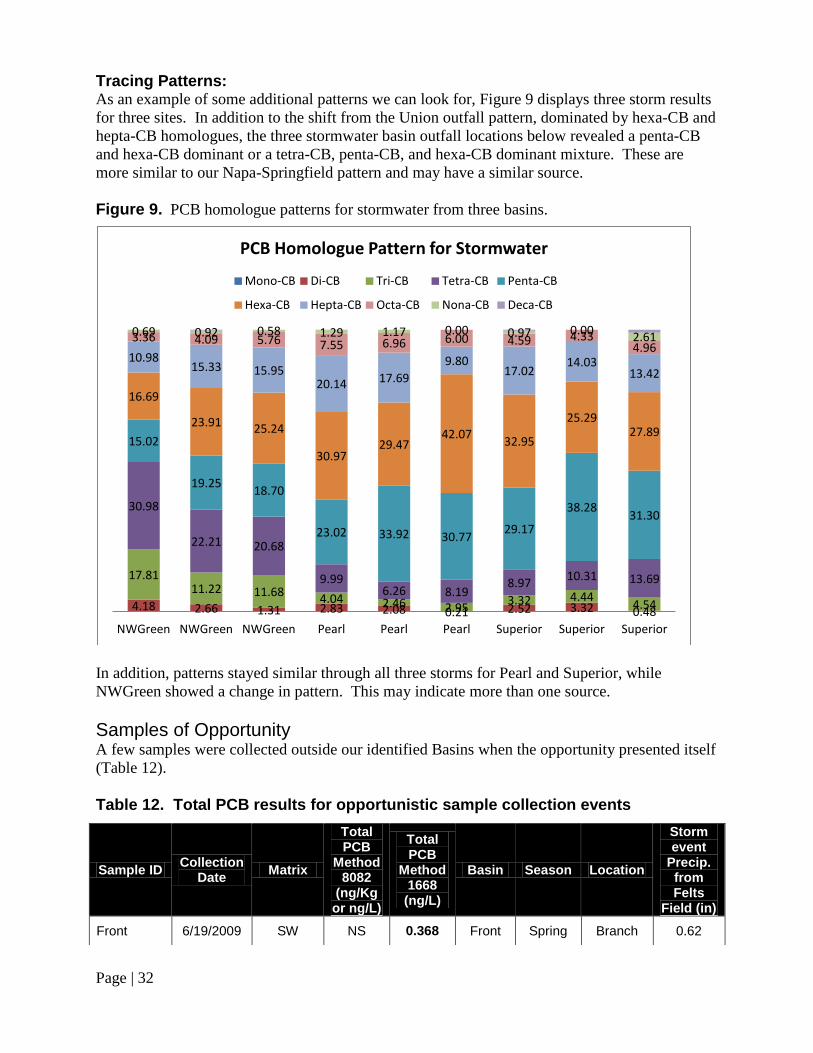
Page | 32
Tracing Patterns: As an example of some additional patterns we can look for, Figure 9 displays three storm results
for three sites. In addition to the shift from the Union outfall pattern, dominated by hexa-CB and
hepta-CB homologues, the three stormwater basin outfall locations below revealed a penta-CB
and hexa-CB dominant or a tetra-CB, penta-CB, and hexa-CB dominant mixture. These are
more similar to our Napa-Springfield pattern and may have a similar source.
Figure 9. PCB homologue patterns for stormwater from three basins.
In addition, patterns stayed similar through all three storms for Pearl and Superior, while
NWGreen showed a change in pattern. This may indicate more than one source.
Samples of Opportunity A few samples were collected outside our identified Basins when the opportunity presented itself
(Table 12).
Table 12. Total PCB results for opportunistic sample collection events
4.18 2.66 1.31 2.83 2.08 0.21 2.52 3.32 0.48
17.81 11.22 11.68
4.04 2.46 2.95 3.32 4.44
4.54
30.98
22.21 20.68
9.99 6.26 8.19
8.97 10.31 13.69
15.02
19.25 18.70
23.02 33.92 30.77 29.17
38.28 31.30
16.69
23.91 25.24
30.97 29.47
42.07 32.95
25.29 27.89
10.98 15.33 15.95
20.14 17.69
9.80 17.02
14.03 13.42
3.36 4.09 5.76 7.55 6.96 6.00 4.59 4.33 4.96
0.69 0.92 0.58 1.29 1.17 0.00 0.97 0.00 2.61
NWGreen NWGreen NWGreen Pearl Pearl Pearl Superior Superior Superior
PCB Homologue Pattern for Stormwater
Mono-CB Di-CB Tri-CB Tetra-CB Penta-CB
Hexa-CB Hepta-CB Octa-CB Nona-CB Deca-CB
Sample ID Collection
Date Matrix
Total PCB
Method 8082
(ng/Kg or ng/L)
Total PCB
Method 1668 (ng/L)
Basin Season Location
Storm event
Precip. from Felts
Field (in)
Front 6/19/2009 SW NS 0.368 Front Spring Branch 0.62
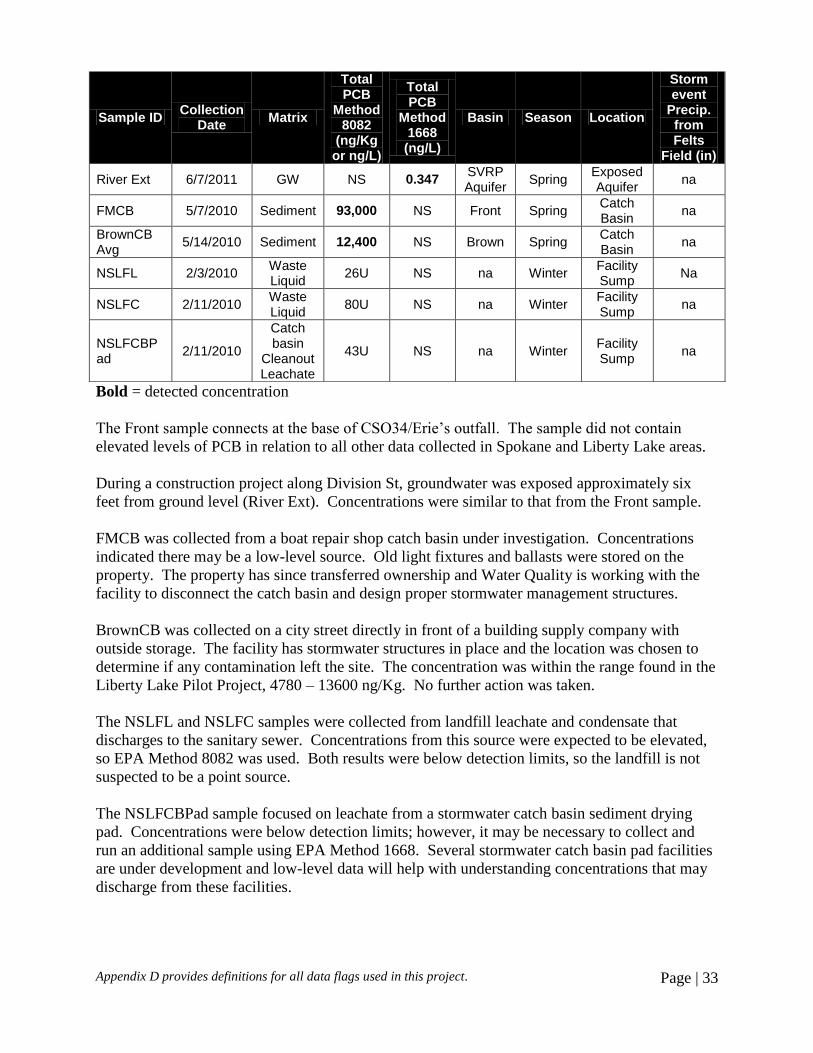
Appendix D provides definitions for all data flags used in this project. Page | 33
Bold = detected concentration
The Front sample connects at the base of CSO34/Erie’s outfall. The sample did not contain
elevated levels of PCB in relation to all other data collected in Spokane and Liberty Lake areas.
During a construction project along Division St, groundwater was exposed approximately six
feet from ground level (River Ext). Concentrations were similar to that from the Front sample.
FMCB was collected from a boat repair shop catch basin under investigation. Concentrations
indicated there may be a low-level source. Old light fixtures and ballasts were stored on the
property. The property has since transferred ownership and Water Quality is working with the
facility to disconnect the catch basin and design proper stormwater management structures.
BrownCB was collected on a city street directly in front of a building supply company with
outside storage. The facility has stormwater structures in place and the location was chosen to
determine if any contamination left the site. The concentration was within the range found in the
Liberty Lake Pilot Project, 4780 – 13600 ng/Kg. No further action was taken.
The NSLFL and NSLFC samples were collected from landfill leachate and condensate that
discharges to the sanitary sewer. Concentrations from this source were expected to be elevated,
so EPA Method 8082 was used. Both results were below detection limits, so the landfill is not
suspected to be a point source.
The NSLFCBPad sample focused on leachate from a stormwater catch basin sediment drying
pad. Concentrations were below detection limits; however, it may be necessary to collect and
run an additional sample using EPA Method 1668. Several stormwater catch basin pad facilities
are under development and low-level data will help with understanding concentrations that may
discharge from these facilities.
Sample ID Collection
Date Matrix
Total PCB
Method 8082
(ng/Kg or ng/L)
Total PCB
Method 1668 (ng/L)
Basin Season Location
Storm event
Precip. from Felts
Field (in)
River Ext 6/7/2011 GW NS 0.347 SVRP Aquifer
Spring Exposed Aquifer
na
FMCB 5/7/2010 Sediment 93,000 NS Front Spring Catch Basin
na
BrownCB Avg
5/14/2010 Sediment 12,400 NS Brown Spring Catch Basin
na
NSLFL 2/3/2010 Waste Liquid
26U NS na Winter Facility Sump
Na
NSLFC 2/11/2010 Waste Liquid
80U NS na Winter Facility Sump
na
NSLFCBPad
2/11/2010
Catch basin
Cleanout Leachate
43U NS na Winter Facility Sump
na

Page | 34
An Urban Waters dangerous waste investigation at a hydraulic equipment company in Spokane
Industrial Park revealed a large hydraulic oil spill. The facility conducted a PCB aroclor analysis
which was below reporting limits. The spill was ruled out as a PCB source.
Statistical Analysis
Although initially TDS and DOC samples were analyzed, linear regression did not reveal any
significant correlations. Collection of these parameters was eliminated. We continue to collect
TOC. Carbon is used in modeling calculations and may be useful if we choose to model fate and
transport in the future.
A simple linear regression was calculated for total PCB in stormwater against the following
general parameters: DOC, TOC, TSS, TDS, and turbidity. PCB had the strongest association
with turbidity (Figure 10). Turbidity measures the opacity of the water, which is influenced by
the amount and type of suspended particulate. PCB tend to adsorb to fine particulate. This
association may indicate a higher concentration of fine particulate since the association with total
suspended particulate was not as strong.
Because the regression appears strongly influenced by two data points, additional data points
should be collected to confirm this association.
Figure 10. Linear regression of turbidity and PCB in stormwater.
y = 2.8975x + 161.67 R² = 0.7338
0
200
400
600
800
1000
0 50 100 150 200 250 300
Turb
idit
y (n
tu)
PCB Total (ng/L)
Turbidity and PCB Total Regression
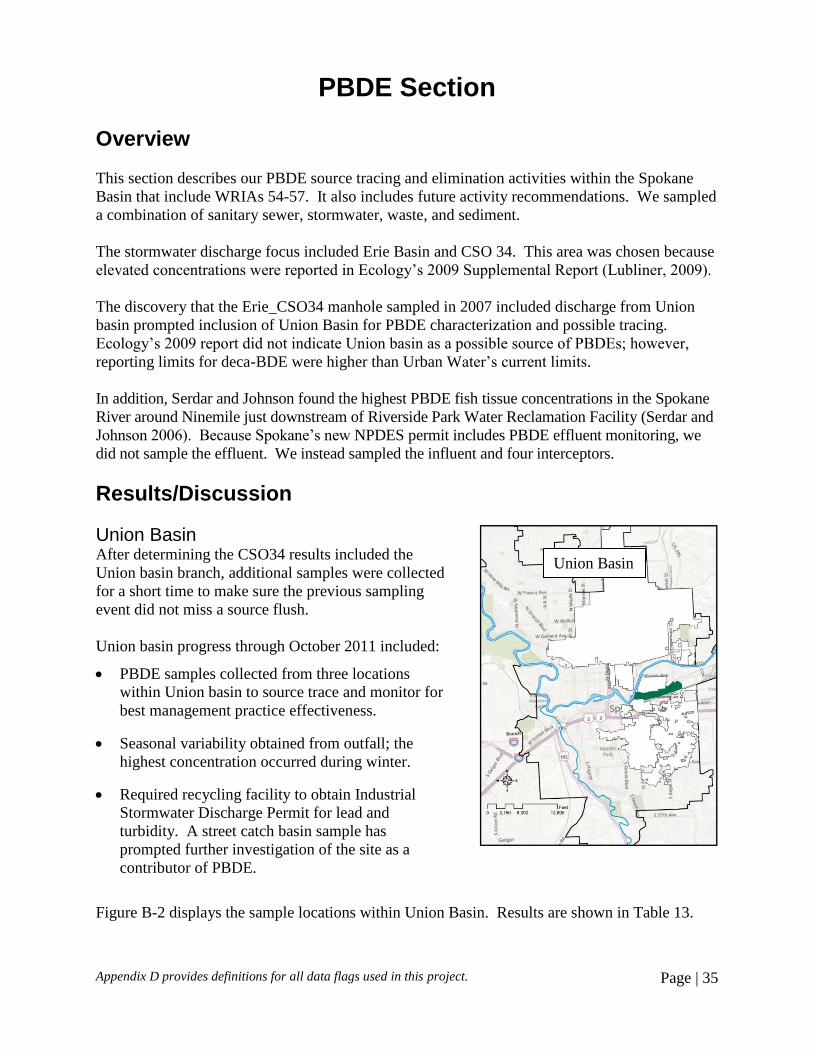
Appendix D provides definitions for all data flags used in this project. Page | 35
PBDE Section
Overview
This section describes our PBDE source tracing and elimination activities within the Spokane
Basin that include WRIAs 54-57. It also includes future activity recommendations. We sampled
a combination of sanitary sewer, stormwater, waste, and sediment.
The stormwater discharge focus included Erie Basin and CSO 34. This area was chosen because
elevated concentrations were reported in Ecology’s 2009 Supplemental Report (Lubliner, 2009).
The discovery that the Erie_CSO34 manhole sampled in 2007 included discharge from Union
basin prompted inclusion of Union Basin for PBDE characterization and possible tracing.
Ecology’s 2009 report did not indicate Union basin as a possible source of PBDEs; however,
reporting limits for deca-BDE were higher than Urban Water’s current limits.
In addition, Serdar and Johnson found the highest PBDE fish tissue concentrations in the Spokane
River around Ninemile just downstream of Riverside Park Water Reclamation Facility (Serdar and
Johnson 2006). Because Spokane’s new NPDES permit includes PBDE effluent monitoring, we
did not sample the effluent. We instead sampled the influent and four interceptors.
Results/Discussion
Union Basin After determining the CSO34 results included the
Union basin branch, additional samples were collected
for a short time to make sure the previous sampling
event did not miss a source flush.
Union basin progress through October 2011 included:
PBDE samples collected from three locations
within Union basin to source trace and monitor for
best management practice effectiveness.
Seasonal variability obtained from outfall; the
highest concentration occurred during winter.
Required recycling facility to obtain Industrial
Stormwater Discharge Permit for lead and
turbidity. A street catch basin sample has
prompted further investigation of the site as a
contributor of PBDE.
Figure B-2 displays the sample locations within Union Basin. Results are shown in Table 13.
Union Basin
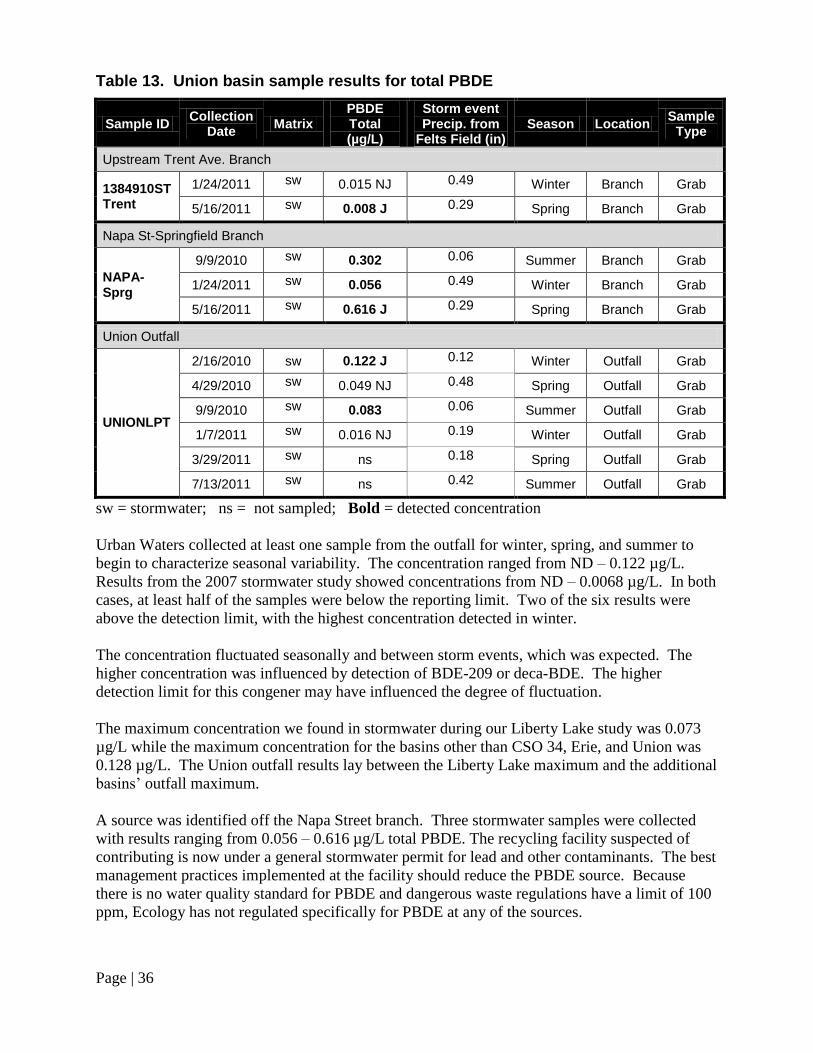
Page | 36
Table 13. Union basin sample results for total PBDE
Sample ID Collection
Date Matrix
PBDE Total (µg/L)
Storm event Precip. from
Felts Field (in) Season Location
Sample Type
Upstream Trent Ave. Branch
1384910ST Trent
1/24/2011 sw 0.015 NJ 0.49 Winter Branch Grab
5/16/2011 sw 0.008 J 0.29 Spring Branch Grab
Napa St-Springfield Branch
NAPA-Sprg
9/9/2010 sw 0.302 0.06 Summer Branch Grab
1/24/2011 sw 0.056 0.49 Winter Branch Grab
5/16/2011 sw 0.616 J 0.29 Spring Branch Grab
Union Outfall
UNIONLPT
2/16/2010 sw 0.122 J 0.12 Winter Outfall Grab
4/29/2010 sw 0.049 NJ 0.48 Spring Outfall Grab
9/9/2010 sw 0.083 0.06 Summer Outfall Grab
1/7/2011 sw 0.016 NJ 0.19 Winter Outfall Grab
3/29/2011 sw ns 0.18 Spring Outfall Grab
7/13/2011 sw ns 0.42 Summer Outfall Grab
sw = stormwater; ns = not sampled; Bold = detected concentration
Urban Waters collected at least one sample from the outfall for winter, spring, and summer to
begin to characterize seasonal variability. The concentration ranged from ND – 0.122 µg/L.
Results from the 2007 stormwater study showed concentrations from ND – 0.0068 µg/L. In both
cases, at least half of the samples were below the reporting limit. Two of the six results were
above the detection limit, with the highest concentration detected in winter.
The concentration fluctuated seasonally and between storm events, which was expected. The
higher concentration was influenced by detection of BDE-209 or deca-BDE. The higher
detection limit for this congener may have influenced the degree of fluctuation.
The maximum concentration we found in stormwater during our Liberty Lake study was 0.073
µg/L while the maximum concentration for the basins other than CSO 34, Erie, and Union was
0.128 µg/L. The Union outfall results lay between the Liberty Lake maximum and the additional
basins’ outfall maximum.
A source was identified off the Napa Street branch. Three stormwater samples were collected
with results ranging from 0.056 – 0.616 µg/L total PBDE. The recycling facility suspected of
contributing is now under a general stormwater permit for lead and other contaminants. The best
management practices implemented at the facility should reduce the PBDE source. Because
there is no water quality standard for PBDE and dangerous waste regulations have a limit of 100
ppm, Ecology has not regulated specifically for PBDE at any of the sources.
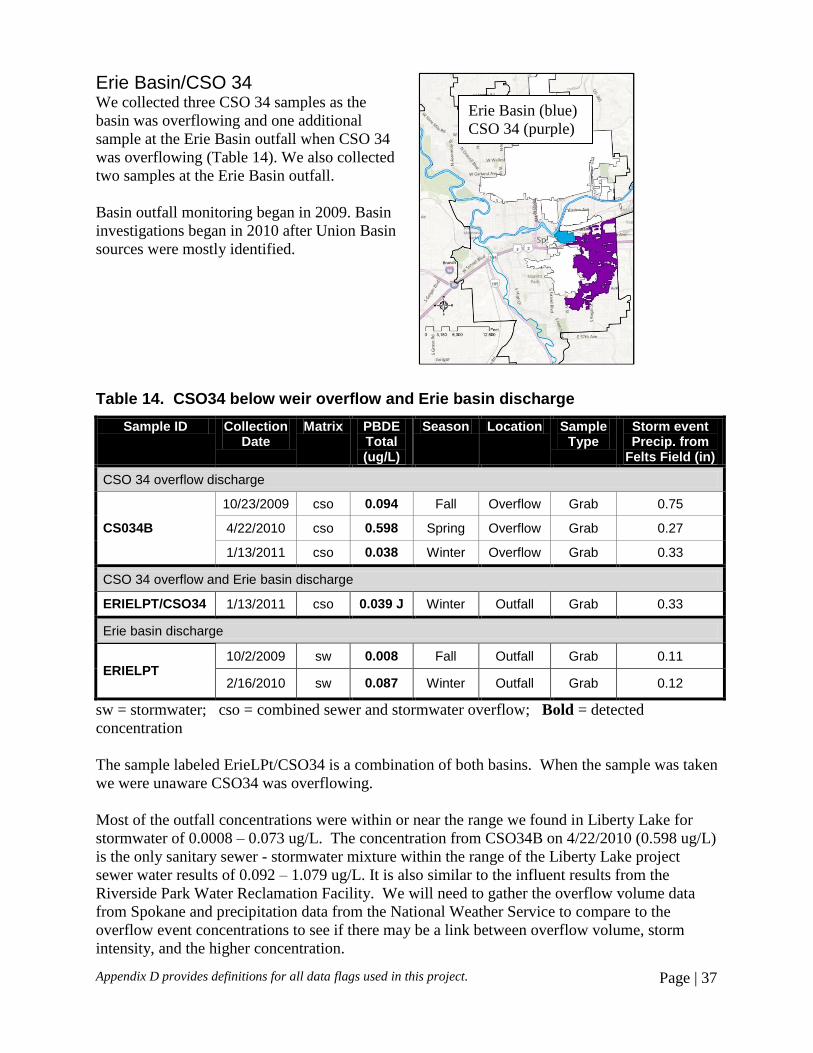
Appendix D provides definitions for all data flags used in this project. Page | 37
Erie Basin/CSO 34 We collected three CSO 34 samples as the
basin was overflowing and one additional
sample at the Erie Basin outfall when CSO 34
was overflowing (Table 14). We also collected
two samples at the Erie Basin outfall.
Basin outfall monitoring began in 2009. Basin
investigations began in 2010 after Union Basin
sources were mostly identified.
Table 14. CSO34 below weir overflow and Erie basin discharge
Sample ID Collection Date
Matrix PBDE Total (ug/L)
Season Location Sample Type
Storm event Precip. from
Felts Field (in)
CSO 34 overflow discharge
CS034B
10/23/2009 cso 0.094 Fall Overflow Grab 0.75
4/22/2010 cso 0.598 Spring Overflow Grab 0.27
1/13/2011 cso 0.038 Winter Overflow Grab 0.33
CSO 34 overflow and Erie basin discharge
ERIELPT/CSO34 1/13/2011 cso 0.039 J Winter Outfall Grab 0.33
Erie basin discharge
ERIELPT 10/2/2009 sw 0.008 Fall Outfall Grab 0.11
2/16/2010 sw 0.087 Winter Outfall Grab 0.12
sw = stormwater; cso = combined sewer and stormwater overflow; Bold = detected
concentration
The sample labeled ErieLPt/CSO34 is a combination of both basins. When the sample was taken
we were unaware CSO34 was overflowing.
Most of the outfall concentrations were within or near the range we found in Liberty Lake for
stormwater of 0.0008 – 0.073 ug/L. The concentration from CSO34B on 4/22/2010 (0.598 ug/L)
is the only sanitary sewer - stormwater mixture within the range of the Liberty Lake project
sewer water results of 0.092 – 1.079 ug/L. It is also similar to the influent results from the
Riverside Park Water Reclamation Facility. We will need to gather the overflow volume data
from Spokane and precipitation data from the National Weather Service to compare to the
overflow event concentrations to see if there may be a link between overflow volume, storm
intensity, and the higher concentration.
Erie Basin (blue)
CSO 34 (purple)
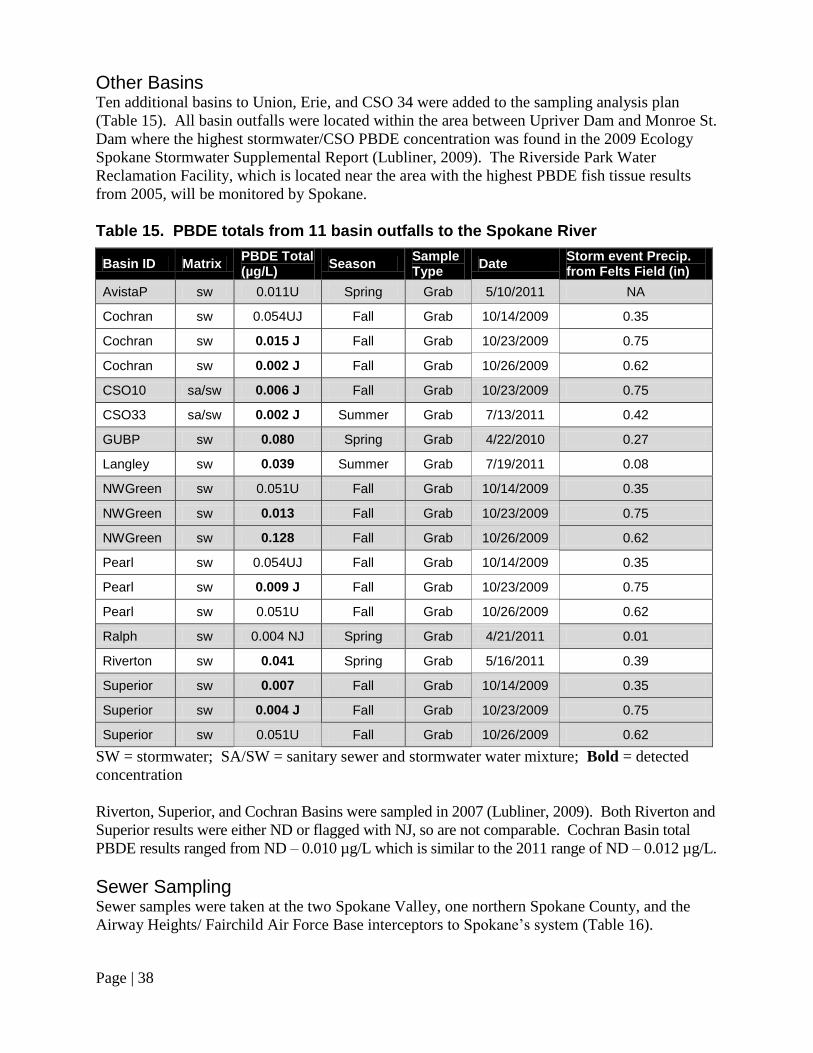
Page | 38
Other Basins Ten additional basins to Union, Erie, and CSO 34 were added to the sampling analysis plan
(Table 15). All basin outfalls were located within the area between Upriver Dam and Monroe St.
Dam where the highest stormwater/CSO PBDE concentration was found in the 2009 Ecology
Spokane Stormwater Supplemental Report (Lubliner, 2009). The Riverside Park Water
Reclamation Facility, which is located near the area with the highest PBDE fish tissue results
from 2005, will be monitored by Spokane.
Table 15. PBDE totals from 11 basin outfalls to the Spokane River
Basin ID Matrix PBDE Total (µg/L)
Season Sample Type
Date Storm event Precip. from Felts Field (in)
AvistaP sw 0.011U Spring Grab 5/10/2011 NA
Cochran sw 0.054UJ Fall Grab 10/14/2009 0.35
Cochran sw 0.015 J Fall Grab 10/23/2009 0.75
Cochran sw 0.002 J Fall Grab 10/26/2009 0.62
CSO10 sa/sw 0.006 J Fall Grab 10/23/2009 0.75
CSO33 sa/sw 0.002 J Summer Grab 7/13/2011 0.42
GUBP sw 0.080 Spring Grab 4/22/2010 0.27
Langley sw 0.039 Summer Grab 7/19/2011 0.08
NWGreen sw 0.051U Fall Grab 10/14/2009 0.35
NWGreen sw 0.013 Fall Grab 10/23/2009 0.75
NWGreen sw 0.128 Fall Grab 10/26/2009 0.62
Pearl sw 0.054UJ Fall Grab 10/14/2009 0.35
Pearl sw 0.009 J Fall Grab 10/23/2009 0.75
Pearl sw 0.051U Fall Grab 10/26/2009 0.62
Ralph sw 0.004 NJ Spring Grab 4/21/2011 0.01
Riverton sw 0.041 Spring Grab 5/16/2011 0.39
Superior sw 0.007 Fall Grab 10/14/2009 0.35
Superior sw 0.004 J Fall Grab 10/23/2009 0.75
Superior sw 0.051U Fall Grab 10/26/2009 0.62
SW = stormwater; SA/SW = sanitary sewer and stormwater water mixture; Bold = detected
concentration
Riverton, Superior, and Cochran Basins were sampled in 2007 (Lubliner, 2009). Both Riverton and
Superior results were either ND or flagged with NJ, so are not comparable. Cochran Basin total
PBDE results ranged from ND – 0.010 µg/L which is similar to the 2011 range of ND – 0.012 µg/L.
Sewer Sampling Sewer samples were taken at the two Spokane Valley, one northern Spokane County, and the
Airway Heights/ Fairchild Air Force Base interceptors to Spokane’s system (Table 16).
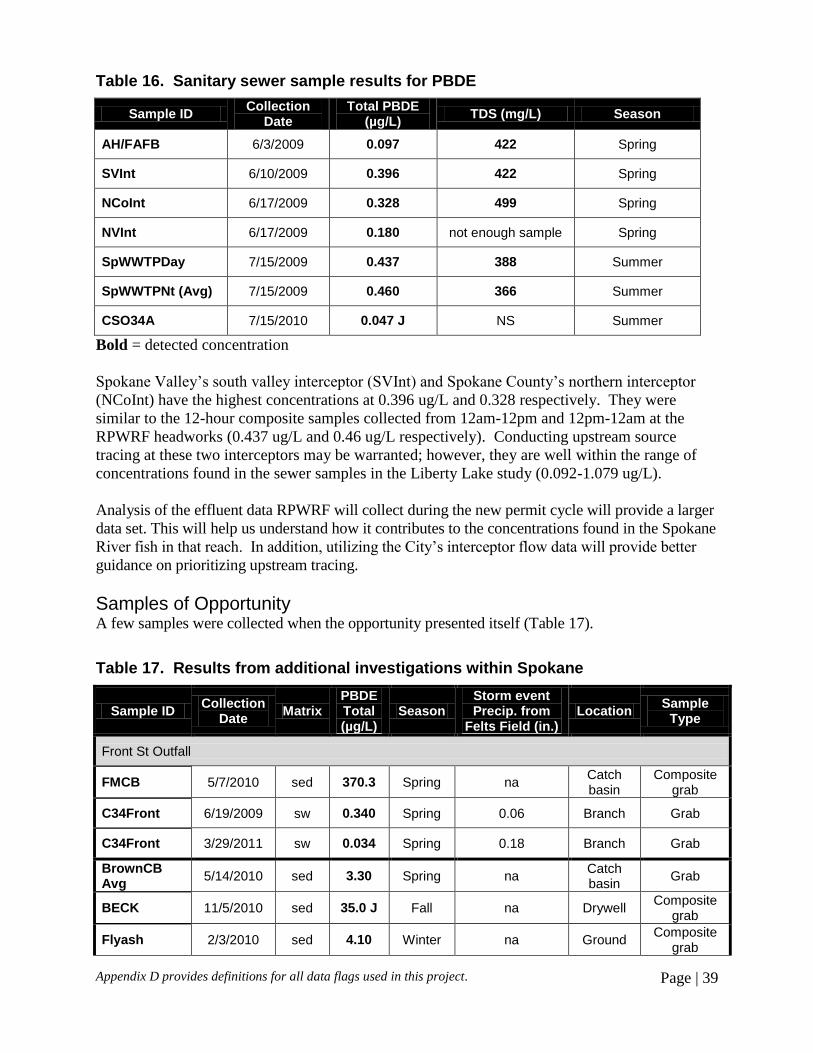
Appendix D provides definitions for all data flags used in this project. Page | 39
Table 16. Sanitary sewer sample results for PBDE
Sample ID Collection
Date Total PBDE
(µg/L) TDS (mg/L) Season
AH/FAFB 6/3/2009 0.097 422 Spring
SVInt 6/10/2009 0.396 422 Spring
NCoInt 6/17/2009 0.328 499 Spring
NVInt 6/17/2009 0.180 not enough sample Spring
SpWWTPDay 7/15/2009 0.437 388 Summer
SpWWTPNt (Avg) 7/15/2009 0.460 366 Summer
CSO34A 7/15/2010 0.047 J NS Summer
Bold = detected concentration
Spokane Valley’s south valley interceptor (SVInt) and Spokane County’s northern interceptor
(NCoInt) have the highest concentrations at 0.396 ug/L and 0.328 respectively. They were
similar to the 12-hour composite samples collected from 12am-12pm and 12pm-12am at the
RPWRF headworks (0.437 ug/L and 0.46 ug/L respectively). Conducting upstream source
tracing at these two interceptors may be warranted; however, they are well within the range of
concentrations found in the sewer samples in the Liberty Lake study (0.092-1.079 ug/L).
Analysis of the effluent data RPWRF will collect during the new permit cycle will provide a larger
data set. This will help us understand how it contributes to the concentrations found in the Spokane
River fish in that reach. In addition, utilizing the City’s interceptor flow data will provide better
guidance on prioritizing upstream tracing.
Samples of Opportunity A few samples were collected when the opportunity presented itself (Table 17).
Table 17. Results from additional investigations within Spokane
Sample ID Collection
Date Matrix
PBDE Total (µg/L)
Season Storm event Precip. from
Felts Field (in.) Location
Sample Type
Front St Outfall
FMCB 5/7/2010 sed 370.3 Spring na Catch basin
Composite grab
C34Front 6/19/2009 sw 0.340 Spring 0.06 Branch Grab
C34Front 3/29/2011 sw 0.034 Spring 0.18 Branch Grab
BrownCB Avg
5/14/2010 sed 3.30 Spring na Catch basin
Grab
BECK 11/5/2010 sed 35.0 J Fall na Drywell Composite
grab
Flyash 2/3/2010 sed 4.10 Winter na Ground Composite
grab
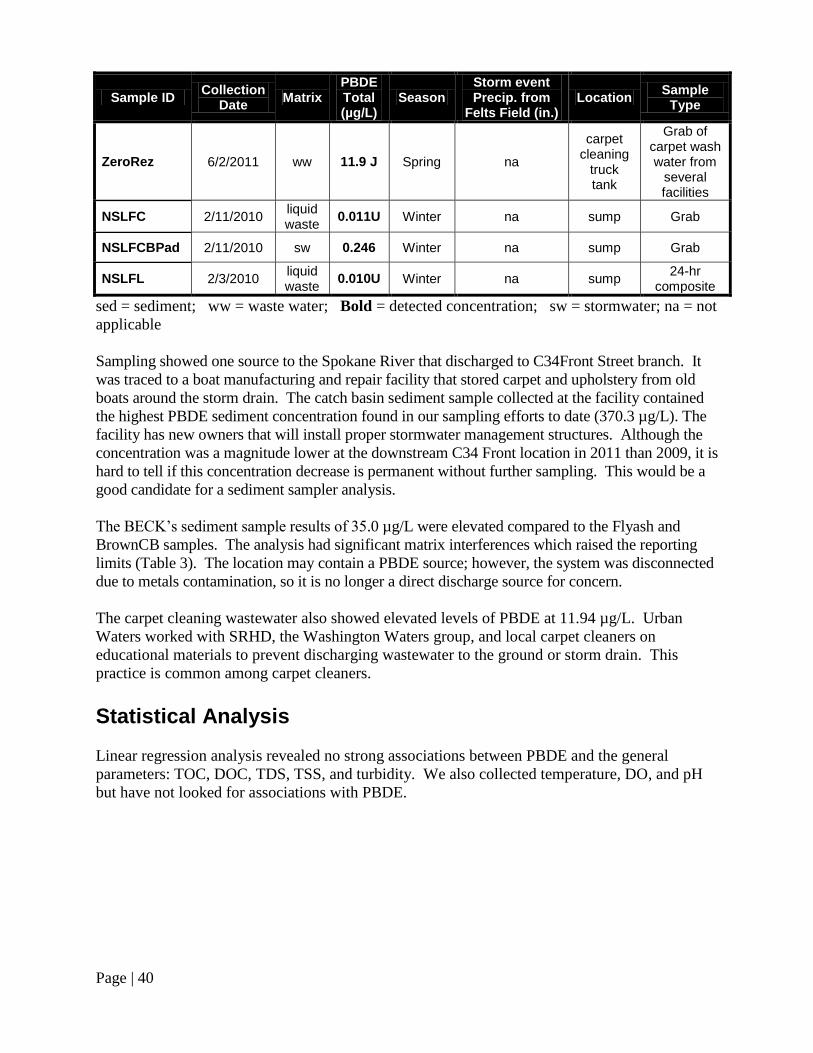
Page | 40
Sample ID Collection
Date Matrix
PBDE Total (µg/L)
Season Storm event Precip. from
Felts Field (in.) Location
Sample Type
ZeroRez 6/2/2011 ww 11.9 J Spring na
carpet cleaning
truck tank
Grab of carpet wash water from
several facilities
NSLFC 2/11/2010 liquid waste
0.011U Winter na sump Grab
NSLFCBPad 2/11/2010 sw 0.246 Winter na sump Grab
NSLFL 2/3/2010 liquid waste
0.010U Winter na sump 24-hr
composite
sed = sediment; ww = waste water; Bold = detected concentration; sw = stormwater; na = not
applicable
Sampling showed one source to the Spokane River that discharged to C34Front Street branch. It
was traced to a boat manufacturing and repair facility that stored carpet and upholstery from old
boats around the storm drain. The catch basin sediment sample collected at the facility contained
the highest PBDE sediment concentration found in our sampling efforts to date (370.3 µg/L). The
facility has new owners that will install proper stormwater management structures. Although the
concentration was a magnitude lower at the downstream C34 Front location in 2011 than 2009, it is
hard to tell if this concentration decrease is permanent without further sampling. This would be a
good candidate for a sediment sampler analysis.
The BECK’s sediment sample results of 35.0 µg/L were elevated compared to the Flyash and
BrownCB samples. The analysis had significant matrix interferences which raised the reporting
limits (Table 3). The location may contain a PBDE source; however, the system was disconnected
due to metals contamination, so it is no longer a direct discharge source for concern.
The carpet cleaning wastewater also showed elevated levels of PBDE at 11.94 µg/L. Urban
Waters worked with SRHD, the Washington Waters group, and local carpet cleaners on
educational materials to prevent discharging wastewater to the ground or storm drain. This
practice is common among carpet cleaners.
Statistical Analysis
Linear regression analysis revealed no strong associations between PBDE and the general
parameters: TOC, DOC, TDS, TSS, and turbidity. We also collected temperature, DO, and pH
but have not looked for associations with PBDE.
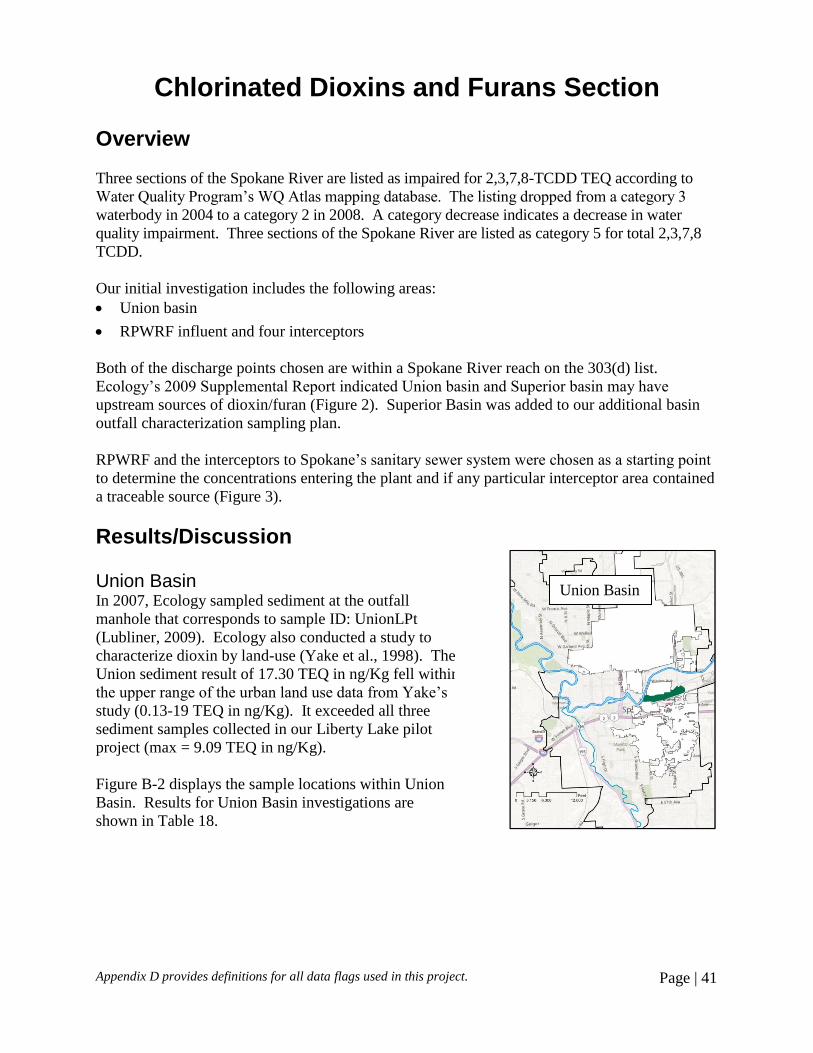
Appendix D provides definitions for all data flags used in this project. Page | 41
Chlorinated Dioxins and Furans Section
Overview
Three sections of the Spokane River are listed as impaired for 2,3,7,8-TCDD TEQ according to
Water Quality Program’s WQ Atlas mapping database. The listing dropped from a category 3
waterbody in 2004 to a category 2 in 2008. A category decrease indicates a decrease in water
quality impairment. Three sections of the Spokane River are listed as category 5 for total 2,3,7,8
TCDD.
Our initial investigation includes the following areas:
Union basin
RPWRF influent and four interceptors
Both of the discharge points chosen are within a Spokane River reach on the 303(d) list.
Ecology’s 2009 Supplemental Report indicated Union basin and Superior basin may have
upstream sources of dioxin/furan (Figure 2). Superior Basin was added to our additional basin
outfall characterization sampling plan.
RPWRF and the interceptors to Spokane’s sanitary sewer system were chosen as a starting point
to determine the concentrations entering the plant and if any particular interceptor area contained
a traceable source (Figure 3).
Results/Discussion Union Basin In 2007, Ecology sampled sediment at the outfall
manhole that corresponds to sample ID: UnionLPt
(Lubliner, 2009). Ecology also conducted a study to
characterize dioxin by land-use (Yake et al., 1998). The
Union sediment result of 17.30 TEQ in ng/Kg fell within
the upper range of the urban land use data from Yake’s
study (0.13-19 TEQ in ng/Kg). It exceeded all three
sediment samples collected in our Liberty Lake pilot
project (max = 9.09 TEQ in ng/Kg).
Figure B-2 displays the sample locations within Union
Basin. Results for Union Basin investigations are
shown in Table 18.
Union Basin
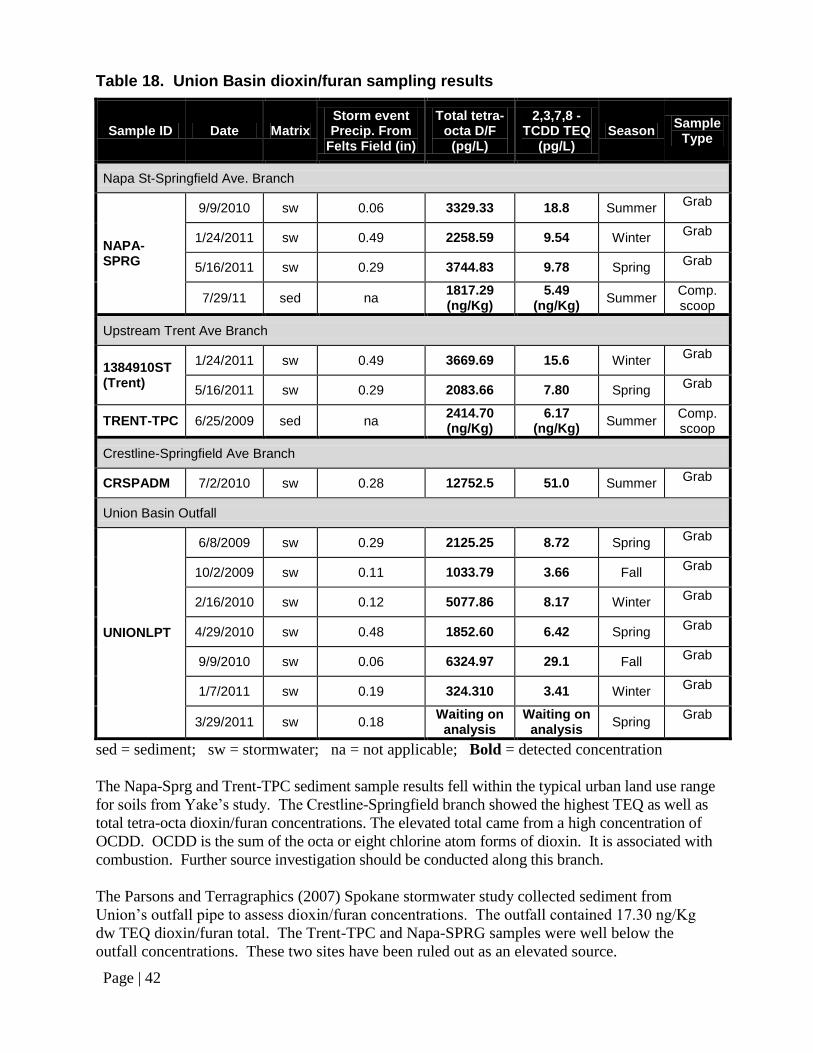
Page | 42
Table 18. Union Basin dioxin/furan sampling results
Sample ID Date Matrix Storm event Precip. From
Felts Field (in)
Total tetra-octa D/F
(pg/L)
2,3,7,8 -TCDD TEQ
(pg/L) Season
Sample Type
Napa St-Springfield Ave. Branch
NAPA-SPRG
9/9/2010 sw 0.06 3329.33 18.8 Summer Grab
1/24/2011 sw 0.49 2258.59 9.54 Winter Grab
5/16/2011 sw 0.29 3744.83 9.78 Spring Grab
7/29/11 sed na 1817.29 (ng/Kg)
5.49 (ng/Kg)
Summer Comp. scoop
Upstream Trent Ave Branch
1384910ST (Trent)
1/24/2011 sw 0.49 3669.69 15.6 Winter Grab
5/16/2011 sw 0.29 2083.66 7.80 Spring Grab
TRENT-TPC 6/25/2009 sed na 2414.70 (ng/Kg)
6.17 (ng/Kg)
Summer Comp. scoop
Crestline-Springfield Ave Branch
CRSPADM 7/2/2010 sw 0.28 12752.5 51.0 Summer Grab
Union Basin Outfall
UNIONLPT
6/8/2009 sw 0.29 2125.25 8.72 Spring Grab
10/2/2009 sw 0.11 1033.79 3.66 Fall Grab
2/16/2010 sw 0.12 5077.86 8.17 Winter Grab
4/29/2010 sw 0.48 1852.60 6.42 Spring Grab
9/9/2010 sw 0.06 6324.97 29.1 Fall Grab
1/7/2011 sw 0.19 324.310 3.41 Winter Grab
3/29/2011 sw 0.18 Waiting on
analysis Waiting on
analysis Spring
Grab
sed = sediment; sw = stormwater; na = not applicable; Bold = detected concentration
The Napa-Sprg and Trent-TPC sediment sample results fell within the typical urban land use range
for soils from Yake’s study. The Crestline-Springfield branch showed the highest TEQ as well as
total tetra-octa dioxin/furan concentrations. The elevated total came from a high concentration of
OCDD. OCDD is the sum of the octa or eight chlorine atom forms of dioxin. It is associated with
combustion. Further source investigation should be conducted along this branch.
The Parsons and Terragraphics (2007) Spokane stormwater study collected sediment from
Union’s outfall pipe to assess dioxin/furan concentrations. The outfall contained 17.30 ng/Kg
dw TEQ dioxin/furan total. The Trent-TPC and Napa-SPRG samples were well below the
outfall concentrations. These two sites have been ruled out as an elevated source.
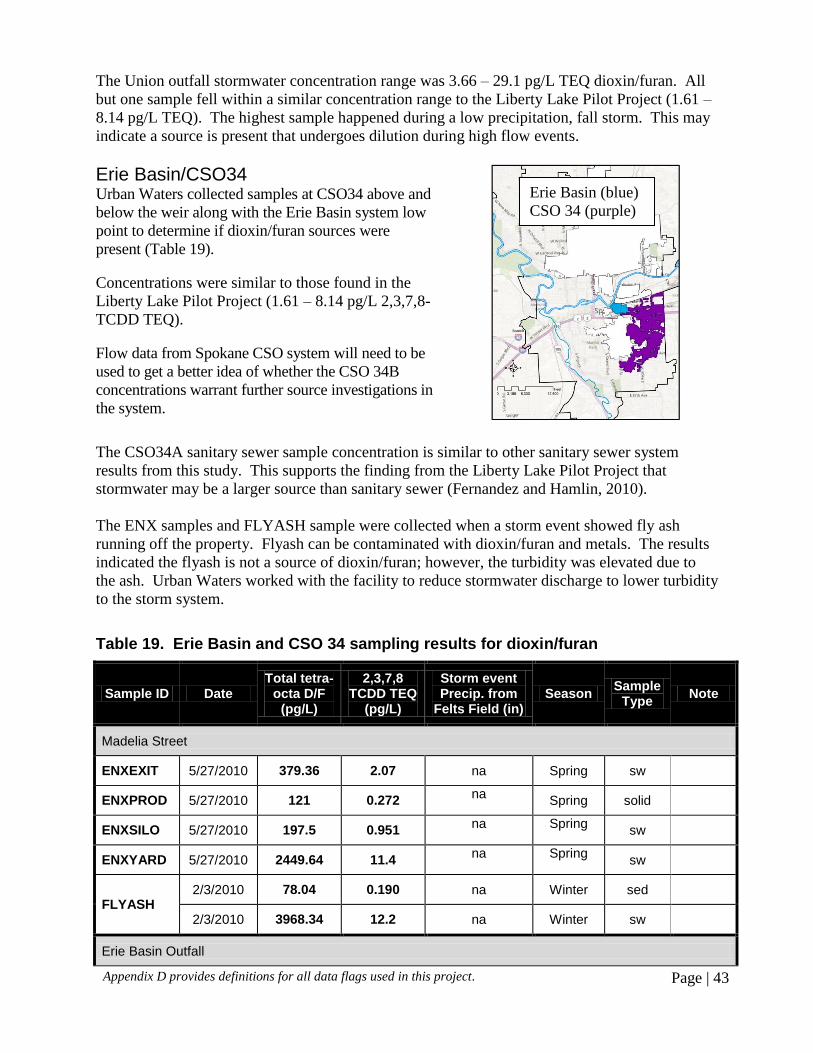
Appendix D provides definitions for all data flags used in this project. Page | 43
The Union outfall stormwater concentration range was 3.66 – 29.1 pg/L TEQ dioxin/furan. All
but one sample fell within a similar concentration range to the Liberty Lake Pilot Project (1.61 –
8.14 pg/L TEQ). The highest sample happened during a low precipitation, fall storm. This may
indicate a source is present that undergoes dilution during high flow events.
Erie Basin/CSO34 Urban Waters collected samples at CSO34 above and
below the weir along with the Erie Basin system low
point to determine if dioxin/furan sources were
present (Table 19).
Concentrations were similar to those found in the
Liberty Lake Pilot Project (1.61 – 8.14 pg/L 2,3,7,8-
TCDD TEQ).
Flow data from Spokane CSO system will need to be
used to get a better idea of whether the CSO 34B
concentrations warrant further source investigations in
the system.
The CSO34A sanitary sewer sample concentration is similar to other sanitary sewer system
results from this study. This supports the finding from the Liberty Lake Pilot Project that
stormwater may be a larger source than sanitary sewer (Fernandez and Hamlin, 2010).
The ENX samples and FLYASH sample were collected when a storm event showed fly ash
running off the property. Flyash can be contaminated with dioxin/furan and metals. The results
indicated the flyash is not a source of dioxin/furan; however, the turbidity was elevated due to
the ash. Urban Waters worked with the facility to reduce stormwater discharge to lower turbidity
to the storm system.
Table 19. Erie Basin and CSO 34 sampling results for dioxin/furan
Sample ID Date Total tetra-
octa D/F (pg/L)
2,3,7,8 TCDD TEQ
(pg/L)
Storm event Precip. from
Felts Field (in) Season
Sample Type
Note
Madelia Street
ENXEXIT 5/27/2010 379.36 2.07 na Spring sw
ENXPROD 5/27/2010 121 0.272 na
Spring solid
ENXSILO 5/27/2010 197.5 0.951 na Spring
sw
ENXYARD 5/27/2010 2449.64 11.4 na Spring
sw
FLYASH 2/3/2010 78.04 0.190 na Winter sed
2/3/2010 3968.34 12.2 na Winter sw
Erie Basin Outfall
Erie Basin (blue)
CSO 34 (purple)
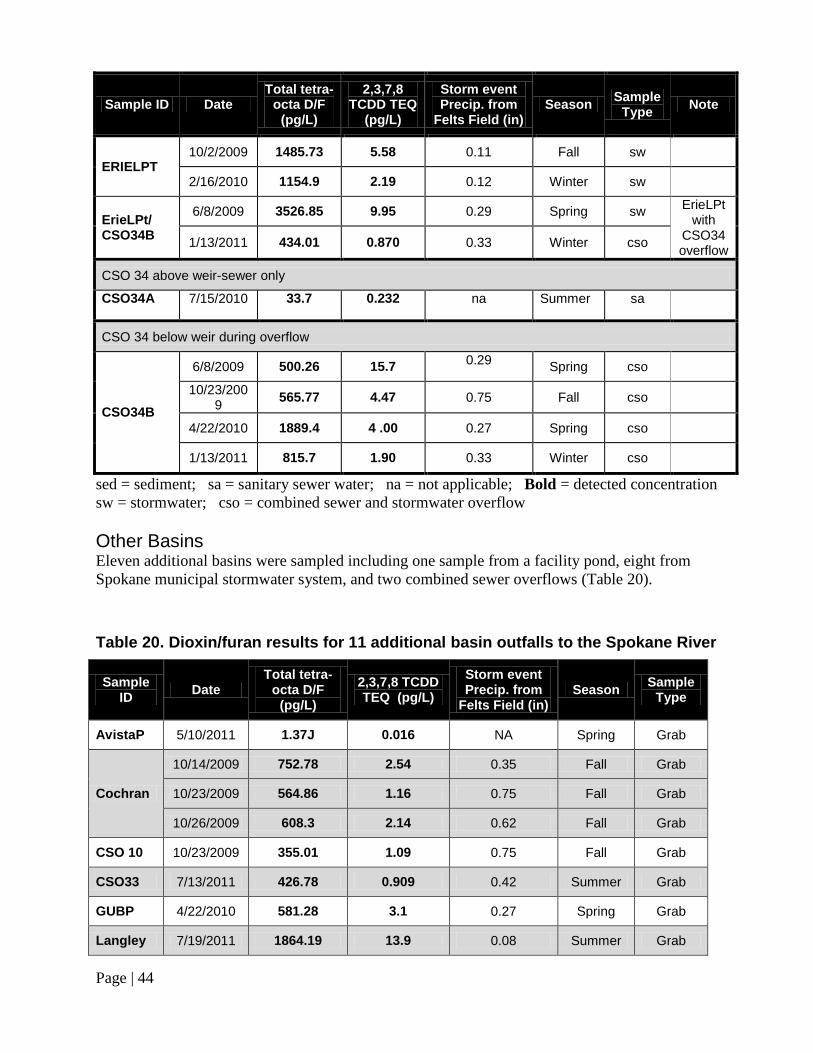
Page | 44
Sample ID Date Total tetra-
octa D/F (pg/L)
2,3,7,8 TCDD TEQ
(pg/L)
Storm event Precip. from
Felts Field (in) Season
Sample Type
Note
ERIELPT 10/2/2009 1485.73 5.58 0.11 Fall sw
2/16/2010 1154.9 2.19 0.12 Winter sw
ErieLPt/ CSO34B
6/8/2009 3526.85 9.95 0.29 Spring sw ErieLPt
with CSO34 overflow
1/13/2011 434.01 0.870 0.33 Winter cso
CSO 34 above weir-sewer only
CSO34A 7/15/2010 33.7 0.232 na Summer sa
CSO 34 below weir during overflow
CSO34B
6/8/2009 500.26 15.7 0.29
Spring cso
10/23/2009
565.77 4.47 0.75 Fall cso
4/22/2010 1889.4 4 .00 0.27 Spring cso
1/13/2011 815.7 1.90 0.33 Winter cso
sed = sediment; sa = sanitary sewer water; na = not applicable; Bold = detected concentration
sw = stormwater; cso = combined sewer and stormwater overflow
Other Basins Eleven additional basins were sampled including one sample from a facility pond, eight from
Spokane municipal stormwater system, and two combined sewer overflows (Table 20).
Table 20. Dioxin/furan results for 11 additional basin outfalls to the Spokane River
Sample ID
Date Total tetra-
octa D/F (pg/L)
2,3,7,8 TCDD TEQ (pg/L)
Storm event Precip. from
Felts Field (in) Season
Sample Type
AvistaP 5/10/2011 1.37J 0.016 NA Spring Grab
Cochran
10/14/2009 752.78 2.54 0.35 Fall Grab
10/23/2009 564.86 1.16 0.75 Fall Grab
10/26/2009 608.3 2.14 0.62 Fall Grab
CSO 10 10/23/2009 355.01 1.09 0.75 Fall Grab
CSO33 7/13/2011 426.78 0.909 0.42 Summer Grab
GUBP 4/22/2010 581.28 3.1 0.27 Spring Grab
Langley 7/19/2011 1864.19 13.9 0.08 Summer Grab
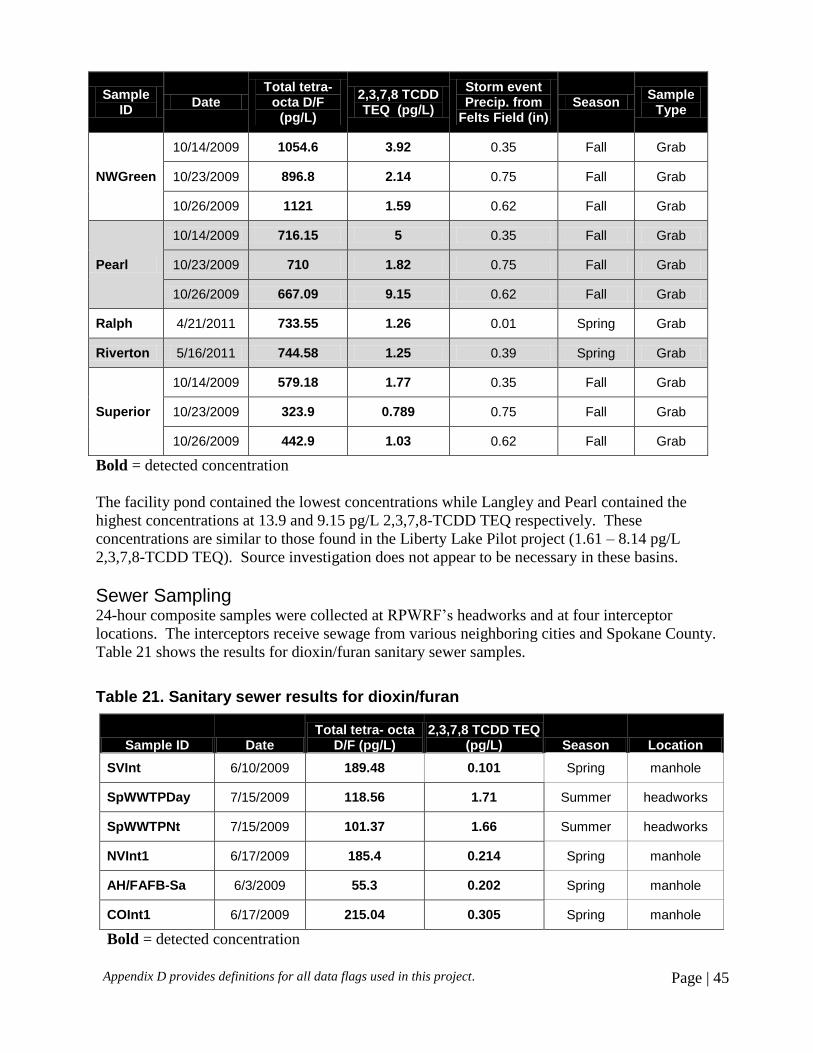
Appendix D provides definitions for all data flags used in this project. Page | 45
Sample ID
Date Total tetra-
octa D/F (pg/L)
2,3,7,8 TCDD TEQ (pg/L)
Storm event Precip. from
Felts Field (in) Season
Sample Type
NWGreen
10/14/2009 1054.6 3.92 0.35 Fall Grab
10/23/2009 896.8 2.14 0.75 Fall Grab
10/26/2009 1121 1.59 0.62 Fall Grab
Pearl
10/14/2009 716.15 5 0.35 Fall Grab
10/23/2009 710 1.82 0.75 Fall Grab
10/26/2009 667.09 9.15 0.62 Fall Grab
Ralph 4/21/2011 733.55 1.26 0.01 Spring Grab
Riverton 5/16/2011 744.58 1.25 0.39 Spring Grab
Superior
10/14/2009 579.18 1.77 0.35 Fall Grab
10/23/2009 323.9 0.789 0.75 Fall Grab
10/26/2009 442.9 1.03 0.62 Fall Grab
Bold = detected concentration
The facility pond contained the lowest concentrations while Langley and Pearl contained the
highest concentrations at 13.9 and 9.15 pg/L 2,3,7,8-TCDD TEQ respectively. These
concentrations are similar to those found in the Liberty Lake Pilot project (1.61 – 8.14 pg/L
2,3,7,8-TCDD TEQ). Source investigation does not appear to be necessary in these basins.
Sewer Sampling 24-hour composite samples were collected at RPWRF’s headworks and at four interceptor
locations. The interceptors receive sewage from various neighboring cities and Spokane County.
Table 21 shows the results for dioxin/furan sanitary sewer samples.
Table 21. Sanitary sewer results for dioxin/furan
Sample ID Date Total tetra- octa
D/F (pg/L) 2,3,7,8 TCDD TEQ
(pg/L) Season Location
SVInt 6/10/2009 189.48 0.101 Spring manhole
SpWWTPDay 7/15/2009 118.56 1.71 Summer headworks
SpWWTPNt 7/15/2009 101.37 1.66 Summer headworks
NVInt1 6/17/2009 185.4 0.214 Spring manhole
AH/FAFB-Sa 6/3/2009 55.3 0.202 Spring manhole
COInt1 6/17/2009 215.04 0.305 Spring manhole
Bold = detected concentration
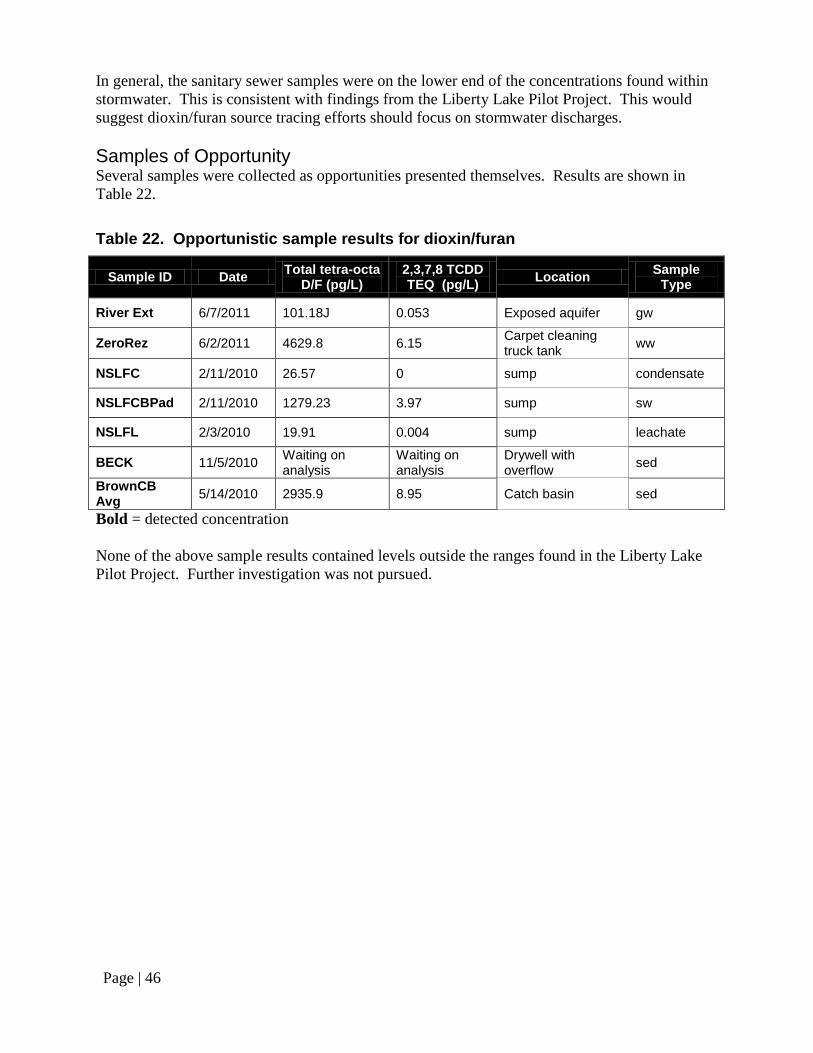
Page | 46
In general, the sanitary sewer samples were on the lower end of the concentrations found within
stormwater. This is consistent with findings from the Liberty Lake Pilot Project. This would
suggest dioxin/furan source tracing efforts should focus on stormwater discharges.
Samples of Opportunity Several samples were collected as opportunities presented themselves. Results are shown in
Table 22.
Table 22. Opportunistic sample results for dioxin/furan
Sample ID Date Total tetra-octa
D/F (pg/L) 2,3,7,8 TCDD TEQ (pg/L)
Location Sample
Type
River Ext 6/7/2011 101.18J 0.053 Exposed aquifer gw
ZeroRez 6/2/2011 4629.8 6.15 Carpet cleaning truck tank
ww
NSLFC 2/11/2010 26.57 0 sump condensate
NSLFCBPad 2/11/2010 1279.23 3.97 sump sw
NSLFL 2/3/2010 19.91 0.004 sump leachate
BECK 11/5/2010 Waiting on analysis
Waiting on analysis
Drywell with overflow
sed
BrownCB Avg
5/14/2010 2935.9 8.95 Catch basin sed
Bold = detected concentration
None of the above sample results contained levels outside the ranges found in the Liberty Lake
Pilot Project. Further investigation was not pursued.
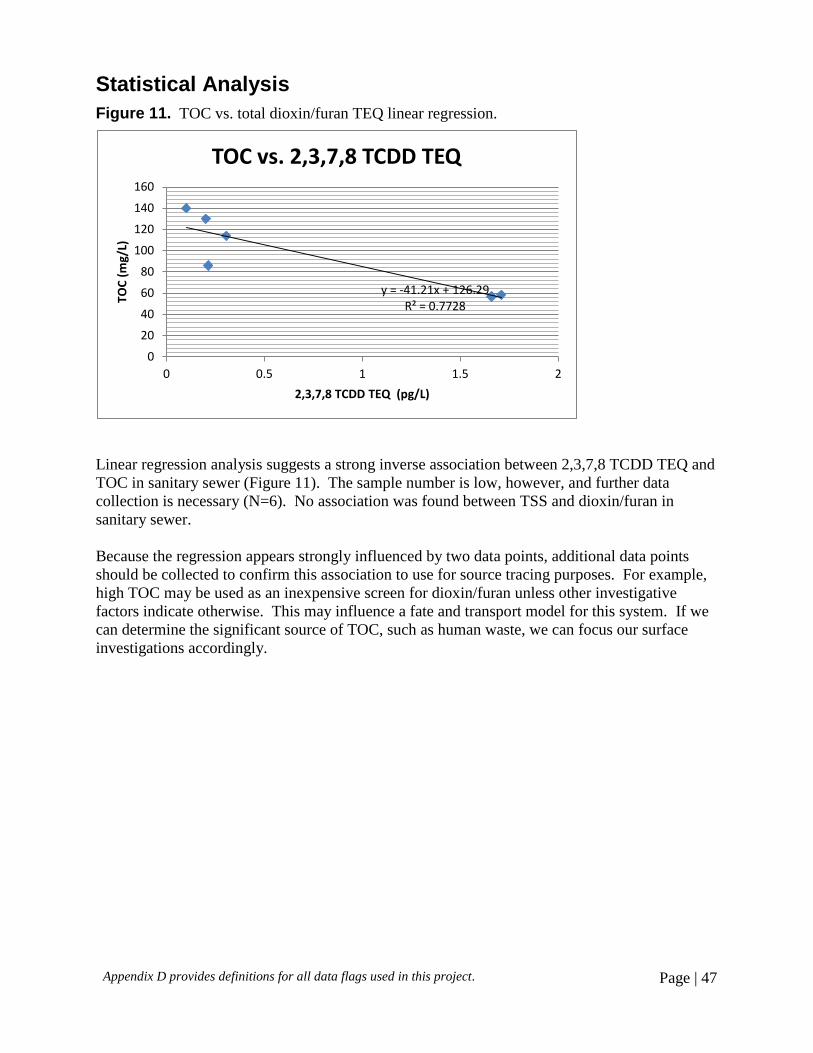
Appendix D provides definitions for all data flags used in this project. Page | 47
Statistical Analysis
Figure 11. TOC vs. total dioxin/furan TEQ linear regression.
Linear regression analysis suggests a strong inverse association between 2,3,7,8 TCDD TEQ and
TOC in sanitary sewer (Figure 11). The sample number is low, however, and further data
collection is necessary (N=6). No association was found between TSS and dioxin/furan in
sanitary sewer.
Because the regression appears strongly influenced by two data points, additional data points
should be collected to confirm this association to use for source tracing purposes. For example,
high TOC may be used as an inexpensive screen for dioxin/furan unless other investigative
factors indicate otherwise. This may influence a fate and transport model for this system. If we
can determine the significant source of TOC, such as human waste, we can focus our surface
investigations accordingly.
y = -41.21x + 126.29 R² = 0.7728
0
20
40
60
80
100
120
140
160
0 0.5 1 1.5 2
TOC
(m
g/L)
2,3,7,8 TCDD TEQ (pg/L)
TOC vs. 2,3,7,8 TCDD TEQ
Page | 48
Metals Section
Overview
Stormwater sampling had not been conducted for metals prior to our pilot project in the Liberty
Lake area (Fernandez and Hamlin, 2009). Sample results from the Liberty Lake Pilot Project
showed lead, cadmium, and zinc are present in stormwater discharges well above reporting
limits. This makes metals tracing in storm systems possible. Metals analysis was included when
appropriate as we investigated our other CoC sources. This was done to help focus future source
investigations and best management practice options for controlling metals to the Spokane River.
We have had little extra capacity to assess or use our metals data for source tracing. PCB work
took priority due to permit schedules and community interest. We provided a limited amount of
metals data to the Water Quality Program to determine criteria exceedances. We have focused
Urban Waters metals efforts on business regulation until time allows us to analyze our data set.
Progress included the following:
Collected a total of 49 metals samples from various matrices between 2009 and September
2011.
12 additional basins sampled to begin concentration characterization of stormwater,
industrial and combined sewer overflow discharges for TMDL and NPDES permit
management.
Union, Erie, and CSO 34 basin seasonal characterization for metals.
Eight Ecology multi-media checklist visits through 2011.
General Stormwater Permit for lead at a recycler connected to Union basin.
Radiator shop investigation in Erie basin:
o Spokane drywell cleanout and disconnection due to lead and zinc contaminations.
o Initial investigation and ranking of site for future cleanup based on lead soil
concentrations.
One Ecology dangerous waste inspection and cleanup for suspected lead-contaminated paint
debris.
Technical assistance visit to general stormwater permittee to assist with zinc source tracing.
Joint visit to chrome facility for LSCS training that resulted in cleanup of metals and oil from
metals on the ground exposed to the environment.
Ecology inspection and BMP implementation at steel recycler that led to:
o Cleanup of sludges on the ground.
o Redirection of stormwater through proper treatment and swales.
o Covers for metal scrap containers provided to customers to prevent stormwater
contamination.
o Cover for operations that may contaminate stormwater.
155 Local Source Control visits in Union and Erie basins through 2011.
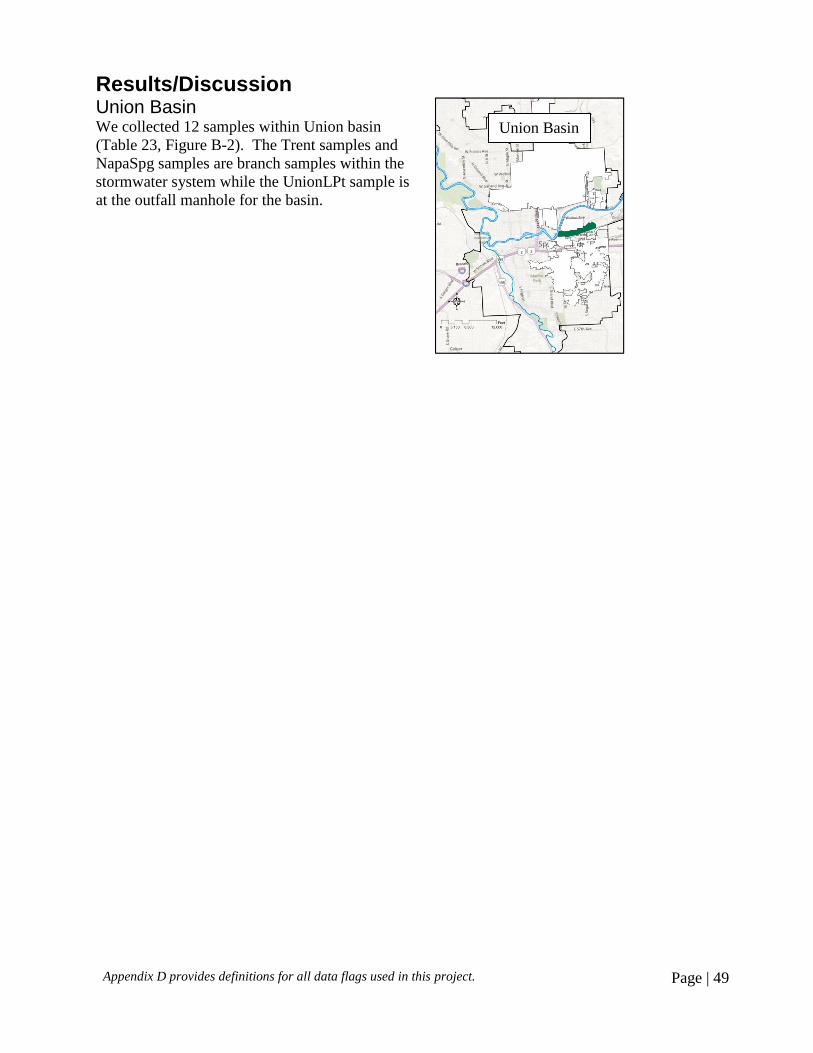
Appendix D provides definitions for all data flags used in this project. Page | 49
Results/Discussion Union Basin We collected 12 samples within Union basin
(Table 23, Figure B-2). The Trent samples and
NapaSpg samples are branch samples within the
stormwater system while the UnionLPt sample is
at the outfall manhole for the basin.
Union Basin
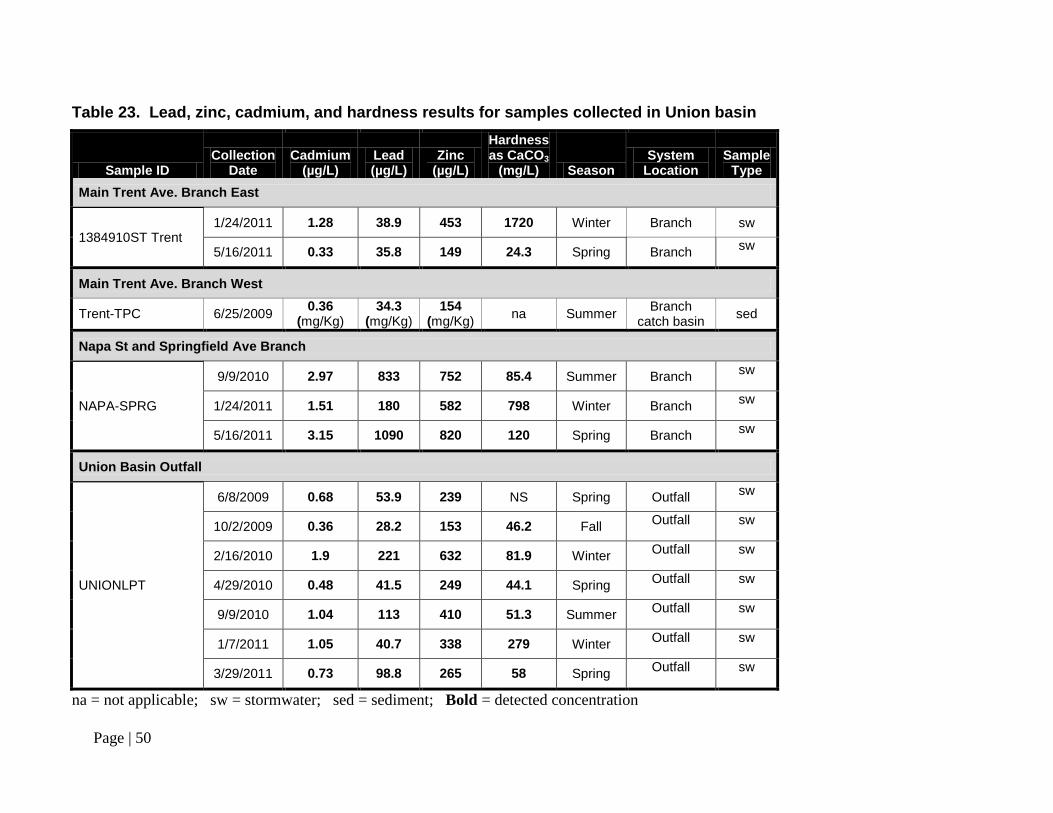
Page | 50
Table 23. Lead, zinc, cadmium, and hardness results for samples collected in Union basin
Sample ID Collection
Date Cadmium
(µg/L) Lead (µg/L)
Zinc (µg/L)
Hardness as CaCO3
(mg/L) Season System
Location Sample
Type
Main Trent Ave. Branch East
1384910ST Trent 1/24/2011 1.28 38.9 453 1720 Winter Branch sw
5/16/2011 0.33 35.8 149 24.3 Spring Branch sw
Main Trent Ave. Branch West
Trent-TPC 6/25/2009 0.36
(mg/Kg) 34.3
(mg/Kg) 154
(mg/Kg) na Summer
Branch catch basin
sed
Napa St and Springfield Ave Branch
NAPA-SPRG
9/9/2010 2.97 833 752 85.4 Summer Branch sw
1/24/2011 1.51 180 582 798 Winter Branch sw
5/16/2011 3.15 1090 820 120 Spring Branch sw
Union Basin Outfall
UNIONLPT
6/8/2009 0.68 53.9 239 NS Spring Outfall sw
10/2/2009 0.36 28.2 153 46.2 Fall Outfall sw
2/16/2010 1.9 221 632 81.9 Winter Outfall sw
4/29/2010 0.48 41.5 249 44.1 Spring Outfall sw
9/9/2010 1.04 113 410 51.3 Summer Outfall sw
1/7/2011 1.05 40.7 338 279 Winter Outfall sw
3/29/2011 0.73 98.8 265 58 Spring Outfall sw
na = not applicable; sw = stormwater; sed = sediment; Bold = detected concentration
Appendix D provides definitions for all data flags used in this project. Page | 51
For purposes of comparison, the general stormwater permit limits for facility discharge is 117
µg/L for zinc and 81.6 µg/L for lead. All zinc samples exceeded the benchmark for facilities.
Three of the seven samples collected at Union outfall exceeded the benchmark for lead. None of
the samples were collected from a facility prior to mixing. For perspective, the Liberty Lake
pilot study showed residential neighborhood runoff could exceed the facility 117 µg/L
benchmark.
The NapaSpg location that accepts discharge from a recycler exceeded lead benchmarks for all
three samples. They are now under a general stormwater permit for lead and zinc. Urban
Waters’ Water Quality staff is managing their permit and currently working with the facility.
Erie Basin/CSO34
Nine samples were collected in Erie basin and
three samples in CSO 34. Investigations into
CSO 34 have not begun. Table 24 shows the
results for our CoC metals and hardness.
Dissolved metals concentrations have not been
calculated.
Erie Basin (blue)
CSO 34 (purple)
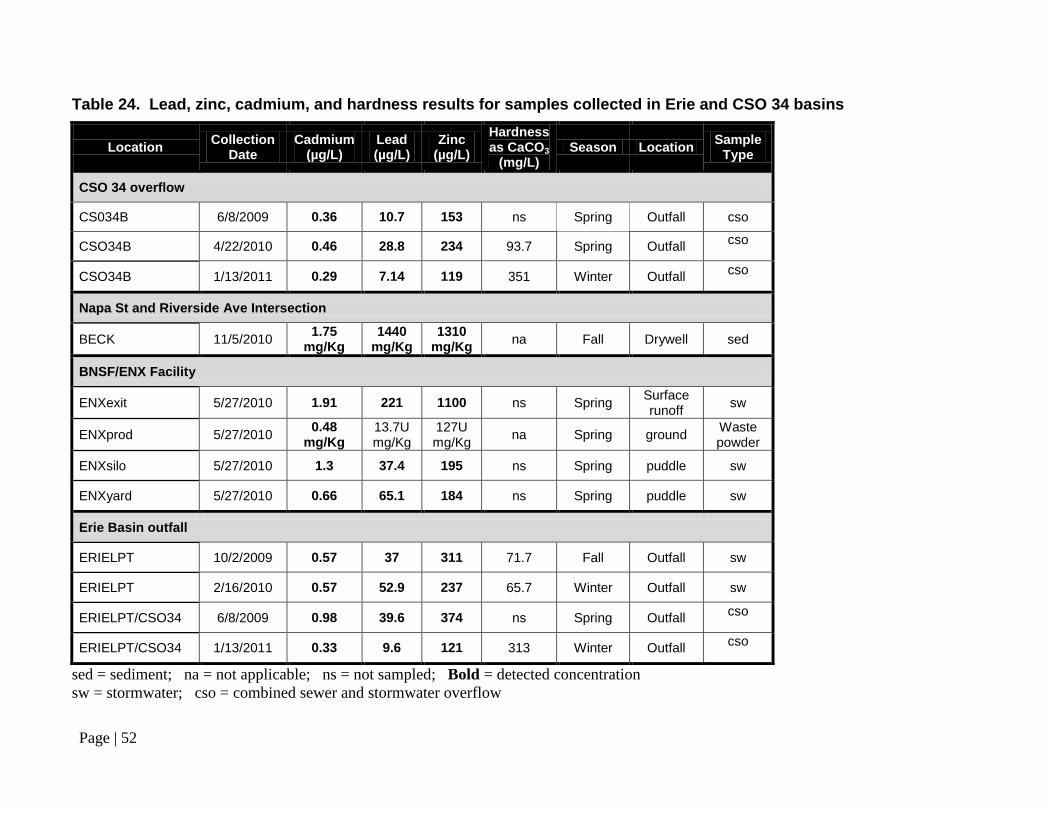
Page | 52
Table 24. Lead, zinc, cadmium, and hardness results for samples collected in Erie and CSO 34 basins
Location Collection
Date Cadmium
(µg/L) Lead (µg/L)
Zinc (µg/L)
Hardness as CaCO3
(mg/L) Season Location
Sample Type
CSO 34 overflow
CS034B 6/8/2009 0.36 10.7 153 ns Spring Outfall cso
CSO34B 4/22/2010 0.46 28.8 234 93.7 Spring Outfall cso
CSO34B 1/13/2011 0.29 7.14 119 351 Winter Outfall cso
Napa St and Riverside Ave Intersection
BECK 11/5/2010 1.75
mg/Kg 1440
mg/Kg 1310
mg/Kg na Fall Drywell sed
BNSF/ENX Facility
ENXexit 5/27/2010 1.91 221 1100 ns Spring Surface runoff
sw
ENXprod 5/27/2010 0.48
mg/Kg 13.7U mg/Kg
127U mg/Kg
na Spring ground Waste powder
ENXsilo 5/27/2010 1.3 37.4 195 ns Spring puddle sw
ENXyard 5/27/2010 0.66 65.1 184 ns Spring puddle sw
Erie Basin outfall
ERIELPT 10/2/2009 0.57 37 311 71.7 Fall Outfall sw
ERIELPT 2/16/2010 0.57 52.9 237 65.7 Winter Outfall sw
ERIELPT/CSO34 6/8/2009 0.98 39.6 374 ns Spring Outfall cso
ERIELPT/CSO34 1/13/2011 0.33 9.6 121 313 Winter Outfall cso
sed = sediment; na = not applicable; ns = not sampled; Bold = detected concentration
sw = stormwater; cso = combined sewer and stormwater overflow
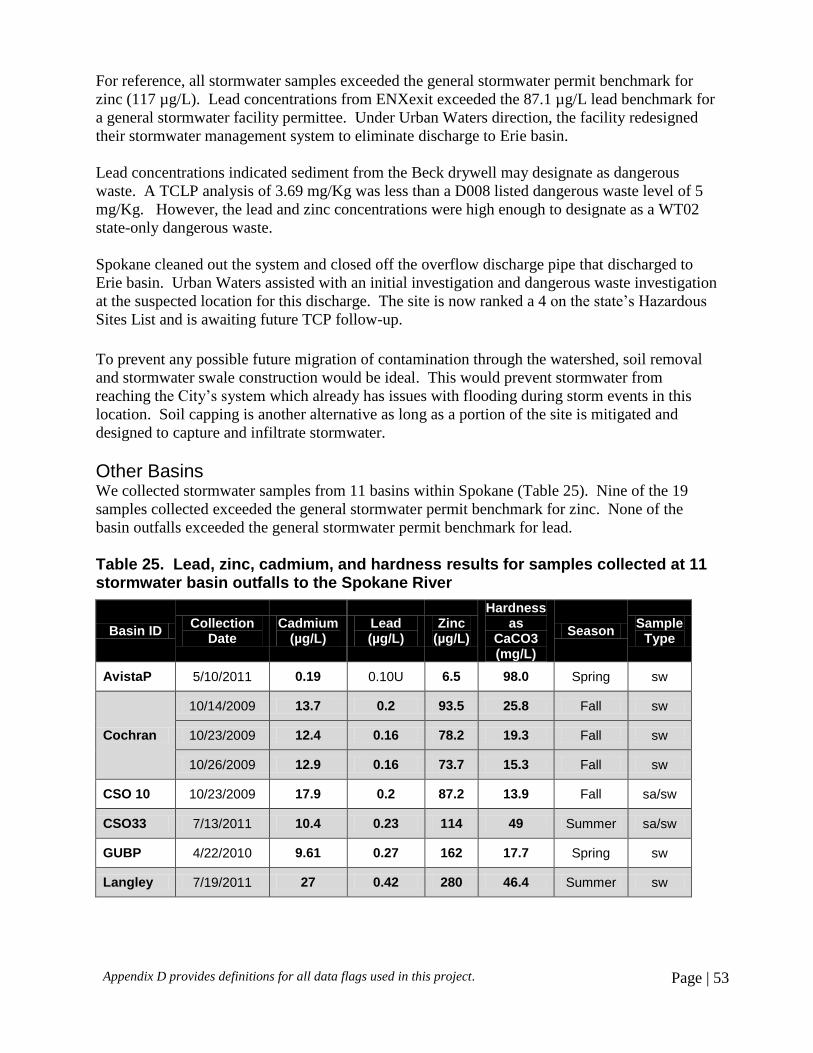
Appendix D provides definitions for all data flags used in this project. Page | 53
For reference, all stormwater samples exceeded the general stormwater permit benchmark for
zinc (117 µg/L). Lead concentrations from ENXexit exceeded the 87.1 µg/L lead benchmark for
a general stormwater facility permittee. Under Urban Waters direction, the facility redesigned
their stormwater management system to eliminate discharge to Erie basin.
Lead concentrations indicated sediment from the Beck drywell may designate as dangerous
waste. A TCLP analysis of 3.69 mg/Kg was less than a D008 listed dangerous waste level of 5
mg/Kg. However, the lead and zinc concentrations were high enough to designate as a WT02
state-only dangerous waste.
Spokane cleaned out the system and closed off the overflow discharge pipe that discharged to
Erie basin. Urban Waters assisted with an initial investigation and dangerous waste investigation
at the suspected location for this discharge. The site is now ranked a 4 on the state’s Hazardous
Sites List and is awaiting future TCP follow-up.
To prevent any possible future migration of contamination through the watershed, soil removal
and stormwater swale construction would be ideal. This would prevent stormwater from
reaching the City’s system which already has issues with flooding during storm events in this
location. Soil capping is another alternative as long as a portion of the site is mitigated and
designed to capture and infiltrate stormwater.
Other Basins We collected stormwater samples from 11 basins within Spokane (Table 25). Nine of the 19
samples collected exceeded the general stormwater permit benchmark for zinc. None of the
basin outfalls exceeded the general stormwater permit benchmark for lead.
Table 25. Lead, zinc, cadmium, and hardness results for samples collected at 11 stormwater basin outfalls to the Spokane River
Basin ID Collection
Date Cadmium
(µg/L) Lead (µg/L)
Zinc (µg/L)
Hardness as
CaCO3 (mg/L)
Season Sample
Type
AvistaP 5/10/2011 0.19 0.10U 6.5 98.0 Spring sw
Cochran
10/14/2009 13.7 0.2 93.5 25.8 Fall sw
10/23/2009 12.4 0.16 78.2 19.3 Fall sw
10/26/2009 12.9 0.16 73.7 15.3 Fall sw
CSO 10 10/23/2009 17.9 0.2 87.2 13.9 Fall sa/sw
CSO33 7/13/2011 10.4 0.23 114 49 Summer sa/sw
GUBP 4/22/2010 9.61 0.27 162 17.7 Spring sw
Langley 7/19/2011 27 0.42 280 46.4 Summer sw
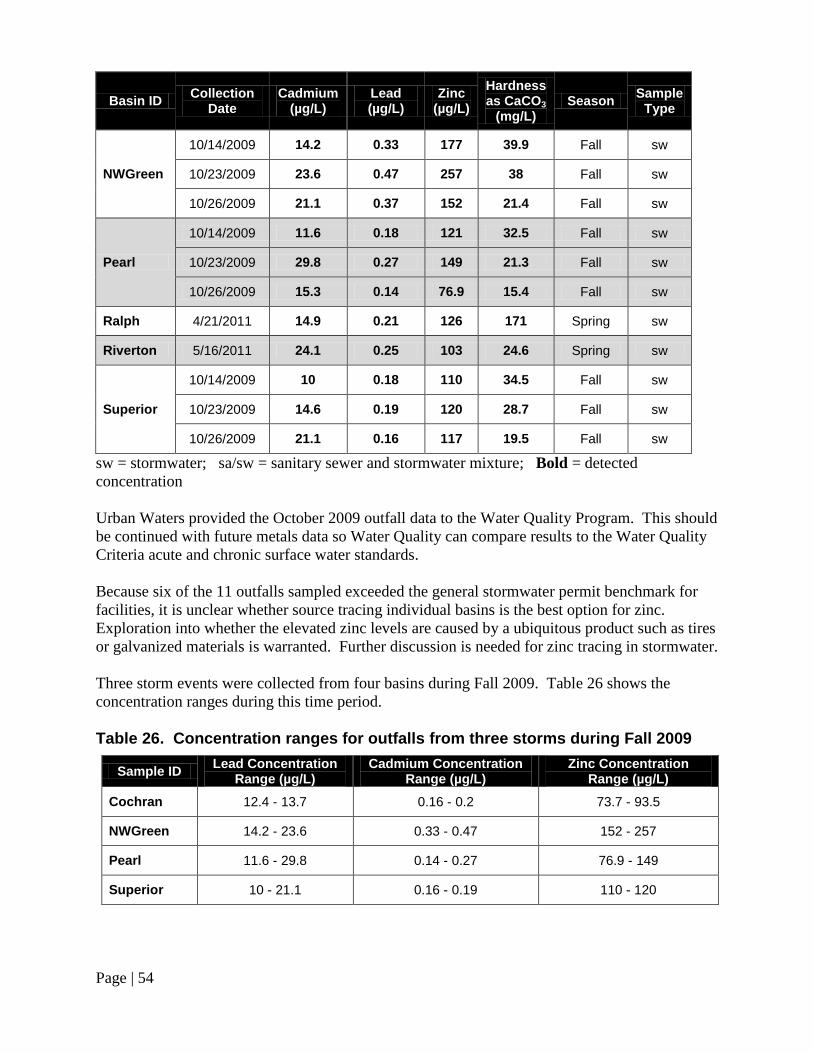
Page | 54
Basin ID Collection
Date Cadmium
(µg/L) Lead (µg/L)
Zinc (µg/L)
Hardness as CaCO3
(mg/L) Season
Sample Type
NWGreen
10/14/2009 14.2 0.33 177 39.9 Fall sw
10/23/2009 23.6 0.47 257 38 Fall sw
10/26/2009 21.1 0.37 152 21.4 Fall sw
Pearl
10/14/2009 11.6 0.18 121 32.5 Fall sw
10/23/2009 29.8 0.27 149 21.3 Fall sw
10/26/2009 15.3 0.14 76.9 15.4 Fall sw
Ralph 4/21/2011 14.9 0.21 126 171 Spring sw
Riverton 5/16/2011 24.1 0.25 103 24.6 Spring sw
Superior
10/14/2009 10 0.18 110 34.5 Fall sw
10/23/2009 14.6 0.19 120 28.7 Fall sw
10/26/2009 21.1 0.16 117 19.5 Fall sw
sw = stormwater; sa/sw = sanitary sewer and stormwater mixture; Bold = detected
concentration
Urban Waters provided the October 2009 outfall data to the Water Quality Program. This should
be continued with future metals data so Water Quality can compare results to the Water Quality
Criteria acute and chronic surface water standards.
Because six of the 11 outfalls sampled exceeded the general stormwater permit benchmark for
facilities, it is unclear whether source tracing individual basins is the best option for zinc.
Exploration into whether the elevated zinc levels are caused by a ubiquitous product such as tires
or galvanized materials is warranted. Further discussion is needed for zinc tracing in stormwater.
Three storm events were collected from four basins during Fall 2009. Table 26 shows the
concentration ranges during this time period.
Table 26. Concentration ranges for outfalls from three storms during Fall 2009
Sample ID Lead Concentration
Range (µg/L) Cadmium Concentration
Range (µg/L) Zinc Concentration
Range (µg/L)
Cochran 12.4 - 13.7 0.16 - 0.2 73.7 - 93.5
NWGreen 14.2 - 23.6 0.33 - 0.47 152 - 257
Pearl 11.6 - 29.8 0.14 - 0.27 76.9 - 149
Superior 10 - 21.1 0.16 - 0.19 110 - 120
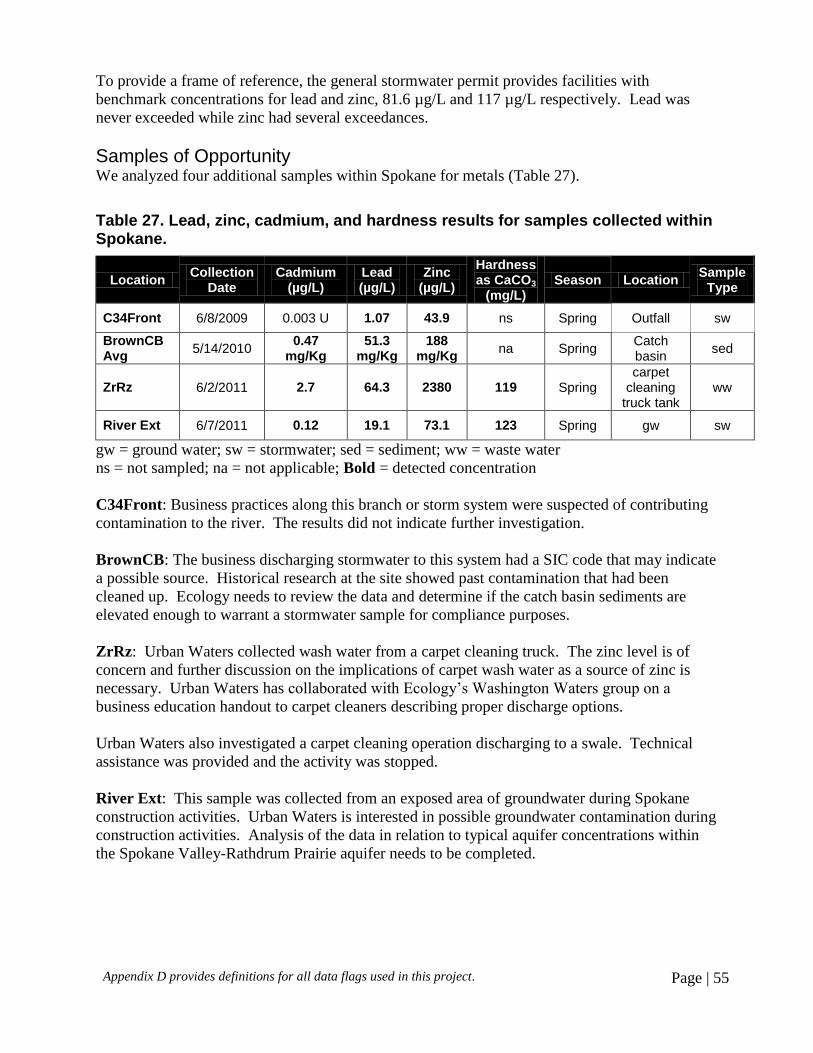
Appendix D provides definitions for all data flags used in this project. Page | 55
To provide a frame of reference, the general stormwater permit provides facilities with
benchmark concentrations for lead and zinc, 81.6 µg/L and 117 µg/L respectively. Lead was
never exceeded while zinc had several exceedances.
Samples of Opportunity We analyzed four additional samples within Spokane for metals (Table 27).
Table 27. Lead, zinc, cadmium, and hardness results for samples collected within Spokane.
Location Collection
Date Cadmium
(µg/L) Lead (µg/L)
Zinc (µg/L)
Hardness as CaCO3
(mg/L) Season Location
Sample Type
C34Front 6/8/2009 0.003 U 1.07 43.9 ns Spring Outfall sw
BrownCB Avg
5/14/2010 0.47
mg/Kg 51.3
mg/Kg 188
mg/Kg na Spring
Catch basin
sed
ZrRz 6/2/2011 2.7 64.3 2380 119 Spring
carpet cleaning
truck tank ww
River Ext 6/7/2011 0.12 19.1 73.1 123 Spring gw sw
gw = ground water; sw = stormwater; sed = sediment; ww = waste water
ns = not sampled; na = not applicable; Bold = detected concentration
C34Front: Business practices along this branch or storm system were suspected of contributing
contamination to the river. The results did not indicate further investigation.
BrownCB: The business discharging stormwater to this system had a SIC code that may indicate
a possible source. Historical research at the site showed past contamination that had been
cleaned up. Ecology needs to review the data and determine if the catch basin sediments are
elevated enough to warrant a stormwater sample for compliance purposes.
ZrRz: Urban Waters collected wash water from a carpet cleaning truck. The zinc level is of
concern and further discussion on the implications of carpet wash water as a source of zinc is
necessary. Urban Waters has collaborated with Ecology’s Washington Waters group on a
business education handout to carpet cleaners describing proper discharge options.
Urban Waters also investigated a carpet cleaning operation discharging to a swale. Technical
assistance was provided and the activity was stopped.
River Ext: This sample was collected from an exposed area of groundwater during Spokane
construction activities. Urban Waters is interested in possible groundwater contamination during
construction activities. Analysis of the data in relation to typical aquifer concentrations within
the Spokane Valley-Rathdrum Prairie aquifer needs to be completed.
Page | 56
General Progress
Here is an abbreviated list of accomplishments to date:
TCP conducted follow-up investigation of a PCB voluntary cleanup site within Union Basin
to determine its potential for impact to city storm drain systems. Stormwater was found to
discharge direct to ground from a drainage swale to dry well.
LSCS has completed all initial visits for the Union Basin catchment and is completing
follow-up.
o Several businesses with potential, significant or unresolved problems were referred to
Ecology for compliance inspections and follow-up monitoring. A total of eight
businesses have been referred to Ecology for follow-up. General issues include:
Metals recycler bins distributed without lids causing ground contamination.
Oils from recycling operations causing ground contamination.
Old, tar-like paint mismanagement causing ground contamination.
Car fluid ground contamination.
Stormwater system metals, PCB, and PBDE contamination.
Carpet wash water illicit disposal.
LSCS is currently working in CSO 34/Erie Basin. Combined total for businesses visited in
Erie, and Union basins through 2011 is 155.
Ecology completed eight multi-media checklist visits through 2011.
Identified sources for several CoCs which are in various stages of cleanup.
Completed a design for a low cost storm-drain sediment sampler.
Developed a business brochure and general brochure for Urban Waters Initiative.
Assisted with the development of a carpet wash water brochure produced by Washington
Waters.
Engaged with local governments and public by participating in presentations, advisory
committees, media events, etc.
Monthly or bi-monthly data-sharing meeting between Spokane, UW, and Ecology’s
Municipal Stormwater Permit Writer regarding stormwater source tracing and
implementation of their Municipal Stormwater Permit.
Appendix D provides definitions for all data flags used in this project. Page | 57
Provided technical assistance and training to ERO Ecology and the regulated community for
source tracing and analytical techniques.
o With municipalities and industries looking at treatment options for capturing toxics.
o With Spokane involved with pilot project for testing treatment technologies. Having
them include some toxicants of concern in pilot testing.
Created interactive GIS mapping database for assistance with source tracing spatially.
Designed a GIS pilot project that should provide enhanced features for data analysis, tracing,
and monitoring of sources to the Spokane basin.
Developed sampling protocols for storm drain sediments and water.
Analyzed stormwater and CSO samples for total phosphorus for use by other programs.
The Local Source Control Specialist from SRHD succeeded in getting outside storage and work
areas cleaned up and contaminants out of contact with stormwater. We did not see a drop in
concentration of our contaminants over time however, which may indicate that a portion of our
contamination is historic or unrelated to the current business practices in the area. Without flow
data it is difficult to compare storm events beyond looking for a general concentration decrease
over time.
Air Deposition Literature Review: Urban Waters requested EAP conduct a literature review in
an effort to identify past studies of airborne pollutants of CoC in areas similar to Spokane River.
Minimal information was found. Any data available was used to help determine the significance
of the long-range and short-range air deposition contribution to Spokane River contamination.
The report concluded we should investigate air deposition as a significant source to stormwater
(Era-Miller, 2011).
Spokane River Monitoring Plan: A comprehensive multimedia (water, sediment and tissue)
toxics monitoring effort has been underway by the Toxics Studies unit in our Environmental
Assessment Program. Urban Waters requested additional sampling locations and more research
regarding the best form of sample collection to better monitor for CoC in our unique system. It
will help determine if our efforts have made a difference over the long-term and keep track of the
congener trends in the river. We will continue working with EAP to help form the monitoring
plan including area tours, information sharing, and plan review (Era-Miller, 2012).
NE Washington Lakes Background Study: In a cooperative effort, Headquarters EAP, ERO
TCP and the Urban Waters Initiative pooled funds for a study of northeastern Washington lakes.
This was an attempt to characterize background concentrations of CoC in sediments and fish
tissue. This information allows us to take into account concentrations of pollutants that would be
considered ubiquitous in the general environment.
Page | 58
Urban Waters can use the data (uploaded to Ecology’s EIM database) in conjunction with the air
deposition literature review for eastern Washington by Era-Miller in 2012 to help understand the
effect air deposition has on our sources. This will include a look at congener and spatial
patterns. It will also help us determine at what concentration we end our upstream investigation
of a basin and begin to focus on other forms of source control (Johnson et al., 2011).
Spokane River Regional Toxics Task Force: The task force was included as a requirement in
the latest rounds of NPDES discharge permitting along the Spokane River. This will allow the
dischargers and Ecology to work together and develop a comprehensive plan for the
identification and elimination of Category 5, 303(d) listed contaminants to the Spokane River.
Urban Waters is providing technical assistance to the task force on an as-needed basis. Our
current work is focused on source tracing and quality assurance project plan development and
review, and participating as a presenter and panel participant at their PCB technical workshop.
Source Reductions
TCP Cleanup Sites: Spokane River metals sites (five completed, four in progress—which
includes one previously completed site undergoing repair); PCB-impacted sediment removal
action and capping action completed at two sites; and Remedial Investigation/Feasibility
Studies are in progress for three additional sites (PCBs & metals) located adjacent to the River.
A PBDE source was traced to a boat manufacturing and repair facility that stored carpet and
upholstery from old boats around the storm drain. All waste has been removed from the
facility and new owners will install proper stormwater management structures. Sample
results show a magnitude decrease in stormwater concentrations.
Metals contamination in a storm system was traced to radiator shop activity. The system was
disconnected to eliminate the source.
PCB contamination in a storm system was connected to a transformer facility. The system
was disconnected to eliminate the source.
Appendix D provides definitions for all data flags used in this project. Page | 59
Conclusions
Monitoring and Research
The Spokane River watershed is unique and may be compounding the issue of elevated CoC in
fish tissue. Unique characteristics include 1) low TSS and TOC in the River which may affect
partitioning by increasing the dissolved fraction, 2) many outfalls with concentrations typical of
other urban cities discharging to a relatively small waterbody, 3) ready aquifer exchange with the
river that potentially affects CoC behavior, etc. Our major findings include the following:
PCB
PCB sources to the Spokane River are more diffuse than originally suspected.
Basin field observation, historical research of past activity, and homologue pattern work can
be useful for PCB source tracing.
PBDE
Air deposition may be a large source for PBDE.
Sanitary sewer influent PBDE results were generally higher than stormwater outfall results.
Upstream investigation by the wastewater treatment plant permittees may be useful for
source identification.
Carpet cleaning washwater is a source of PBDE and should not be disposed on the ground.
Dioxin/Furan
There is a dioxin/furan source along the Crestline-Springfield branch within Union Basin that
needs further investigation.
More focus on dioxin/furan source tracing will be necessary to determine accurate source
contributions and implement effective cleanup and prevention measures. Other CoC have
taken priority due to current regulatory and community needs. Data suggests dioxin/furan
source tracing efforts should focus on stormwater discharges.
Limited data on carpet cleaning wash water and landfill leachate and condensate within
Spokane suggest these types of waste are not sources of dioxin/furan above typical urban
concentrations. An assessment of local typical urban concentrations will assist with
clarifying this assumption.
An association was found between 2,3,7,8 TCDD TEQ and TOC in sanitary sewer
wastewater. Further investigation needs to be conducted into the significance of this finding
with respect to source identification needs.
Additional data collection and source characterization of dioxin/furan within the basin is
necessary. Air deposition is often the dominant source pathway for dioxin and furan. OCDD
was the highest concentration found of the 17 compounds analyzed. OCDD is a dominant
form of dioxin by-product formed during incomplete combustion.
Page | 60
Metals
Elevated concentrations of zinc are found in carpet wash water.
We found elevated levels of zinc and lead from a recycler and radiator shop.
Concentrations of lead and zinc in stormwater often exceed the general stormwater
benchmarks for industrial facilities.
Additional analysis of lead, cadmium, and zinc concentrations in relation to Water Quality
standards should be completed by the Water Quality Program to determine how to handle
what appear to be ubiquitous sources.
Inspections
In general, the local business visits are not as successful at finding the CoC as expected. This
may indicate: 1) a significant portion of our contamination is historic and unrelated to the current
business practices, or 2) there are other practices yet to be determined in the area that may
contribute to the contamination.
Typical checklist visits without contaminant specific investigation goals make identifying
sources difficult. Developing an additional contaminant specific list of possible sources and
practices to investigate may be necessary for Ecology inspectors to fill the LSCS visit gap. The
LSCS visits have been useful for removing any materials that may contain a variety of CoC from
stormwater or sanitary sewer contact.
Business visits have limited effectiveness for finding PCB sources.
Ecology business visits were effective for finding PBDE sources.
PBDE sources must be managed by regulation of other contaminants in the same waste
stream. There are no current regulations for doing so directly.
Current regulations from various Ecology programs do not recognize the low-level PCB
analytical method for compliance purposes at the facility level. The only regulatory
application is setting the 303d listing of a waterbody.
Education
Source tracing contamination at low concentrations presented unforeseen challenges for
regulators and the regulated community. There was a general lack of knowledge regarding low-
level analytical methods, data validation, and data interpretation.
Source tracing and elimination activities required various education activities for the local
government, environmental groups, and business sectors. These included waste-specific
brochures as well as training in analytical methodology, sampling and source tracing plan
development, data validation, and data interpretation.

Appendix D provides definitions for all data flags used in this project. Page | 61
Recommendations
Sampling and Analysis
Complete source investigations and elimination activities in the three basins of concern—
Union, Erie, and CSO 34—to remove an active discharge of CoC to the Spokane River.
Expand our research to include characterizing diffuse sources that contribute to stormwater
contamination. This will provide an understanding of the local effect of air deposition and
help direct elimination activities where appropriate.
Put together a hydrologic, fish bioaccumulation, and congener pattern fate and transport
model for PCB, PBDE, and Dioxin/Furan through partnership with the Environmental
Assessment Program, university researchers, and the technical contractor chosen to write the
Toxics Task Force Comprehensive Plan. This will help us better characterize and identify
significant sources, so source investigation and elimination activity prioritization is
optimized. It will also narrow down those sources suspected of affecting fish tissue
concentrations.
Assess the information from the Northeast Washington Lakes Reports and Air Deposition
Literature Review for incorporation into the source tracing process.
Complete work with the Environmental Assessment Program (EAP) to develop a long-term
monitoring strategy for the Spokane River to help monitor for measurable progress towards
CoC reduction in the river.
Within the next fiscal year, complete a GIS pilot project that will allow Urban Waters to
more easily incorporate data for spatial analysis and source tracing. It should also assist with
monitoring progress and, if successful, can be expanded to include data from other entities
conducting similar efforts in the watershed.
Develop more accurate basin polygons using the piped system and contour GIS layers for
basins of concern to prevent missing possible sources during business visits. Due to
inaccurate basin polygons, the recycling facility source in Union Basin was identified
through sampling and reconnaissance because the basin polygon did not include that parcel
when the LSCS put together the business visit list.
PCB Conduct river sampling in the section between Upriver Dam and Monroe Street Dam and
compare data congener patterns to largescale sucker whole fish data to assist with source
identification in this section of elevated fish tissue concentrations.
Put resources towards congener pattern analysis both spatially and within a basin using
methods such as principal component analysis and positive matrix factorization to assist with
source tracing.
Determine whether looking at chiral signatures would be beneficial for source tracing in our
area.
Page | 62
PBDE Look into low-level congener method for analysis to decrease the reporting limit for deca-
BDE. This will eliminate any bias on total PBDE concentrations that the deca-BDE
concentrations observed near the reporting limit have on total concentrations.
Dioxin/Furan Continue collecting dioxin/furan samples from various media during investigations of any
CoC to increase the data set for future analysis.
Investigate the significance of the association between 2,3,7,8 TCDD TEQ and TOC in
sanitary sewer water for source identification.
Focus source tracing efforts along the Crestline-Springfield branch within Union basin.
Lead, Cadmium, Zinc It may be useful to look at zinc sources in tires and galvanized materials to determine their
contribution to stormwater.
Process Improvements
Continue to explore the various options for upstream monitoring work to determine when a
basin no longer contains a local source.
Identify clear decision points to determine when a basin needs upstream tracing and when a
basin is considered “clean.”
Update QAPP to reflect any analytical and sampling technique method changes.
PCB Combine resources with the Spokane River Regional Toxics Task Force to assist with
gaining a comprehensive understanding of PCB sources to the Spokane River. We can work
together on determining the best course of action for source elimination as sources are
uncovered.
Build product list with concentrations and congener patterns for inadvertently-produced
PCB.
Put together a separate document incorporating the body of literature on PCB source tracing
and elimination collected over the past three years with source lists. This should include
literature on chiral signature analysis used throughout the country for source identification
(C.S. Wong et al., 2001; B.J. Asher et al., 2007).
PBDE Ecology should consider regulatory limits and/or BMPs for PBDEs in order for Urban
Waters to effectively eliminate sources once identified. In the interim, general BMP
guidance and outreach may be a timely and effective way to reduce PBDEs to the river.
Appendix D provides definitions for all data flags used in this project. Page | 63
Put together a short handout describing which products may still contain PBDE after ban
implementation, along with a list of products containing penta, octa, and deca-BDE that have
been in use over the last few decades. This information will help separate current long-term
sources from those that are being phased out.
Focus source control efforts on business type visits, such as carpet cleaners, as well as basin-
focused source tracing.
Dioxin/Furan Due to current local focus on PCB, in-depth analysis of sources beyond selected stormwater
and CSO basin work will need to be delayed until next biennium when priorities are
reassessed.
Develop a CoC specific list for Ecology Urban Waters inspectors to assist with source
investigations.
Lead, Cadmium, Zinc Although other CoC take priority for data analysis, we should place high priority on
establishing timeframes for QA/QC completion, and develop an internal process for metal
results distribution between Ecology Programs and source elimination.
Consider a focus on carpet cleaners and companies for zinc control measures.
Consider a focus on recyclers and radiator shops that process older radiators for lead and zinc
control measures.
Because these metals are ubiquitous and often above benchmark values, conducting general
activity category visits in addition to source tracing will be useful until priorities change.
Urban Waters should utilize current research that identifies those activity categories that
provided the best results with least resources to direct business visits.
Page | 64
References
Agency for Toxic Substances and Diesease Registry (ATSDR). 2000. Toxicological Profile for
Polychlorinated Biphenyls (PCBs). U.S. Department of Health and Human Services, Public
Health Service, Atlanta, GA.
Anderson. 2006. Standard Operating Procedures for Sampling of Pesticides in Surface Waters.
Washington Department of Ecology, Environmental Assessment Program, Olympia, WA.
EAP003.
Asher, B.J., C.S. Wong, and L.A. Rodenburg. 2007. Chiral Source Apportionment of
Polychlorinated Biphenyls to the Hudson River Estuary Atmosphere and Food Web.
Environmental Science and Technology, 41, 6163-6169.
Butkus, S. and K. Merrill. 1999. Spokane River Dissolved Metals Total Maximum Daily Load --
Submittal Report. Washington Department of Ecology, Olympia, WA. Publication No 99-49.
City of Spokane. 2012. 2012 Annual Report: Adaptive Management Plan for Reducing PCBs in
Stormwater Discharges. City of Spokane Wastewater Management Department, Spokane, WA.
Du, S., Belton, T.J, and L.A. Rodenburg. 2008. Source Apportionment of polychlorinated
biphenyls in the tidal Delaware River. Environmental Science Technology. Vol. 42:11, pp. 4044-
4051.
Ecology. 1995. Department of Ecology 1993-94 Investigation of PCBs in the Spokane River.
Washington Department of Ecology, Olympia, WA. Publication No. 95-310.
Ecology. 2008. Manchester Laboratory Users Manual. Ninth Edition. Washington State
Department of Ecology, Manchester, Washington.
Era-Miller, B. 2011. Memo: Toxics Atmospheric Deposition in Eastern Washington State –
Literature Review. Washington State Department of Ecology, Olympia, WA. EA Project Code:
10-124.
Era-Miller, B. 2012. Recommendations for the Design of a Long-term Toxics Monitoring
Program in the Mainstem of the Spokane River. Washington State Department of Ecology,
Olympia, WA. DRAFT.
Fernandez, A. and T. Hamlin. 2009. Spokane Basin Sampling and Analysis (SAP) and Quality
Assurance Project Plan (QAPP) for the Spokane River Source Trace Study Regarding PCB,
PBDE, Metal, and Dioxins/Furan Contamination. Washington Department of Ecology, Spokane,
WA.
Fernandez, A. and T. Hamlin. 2010. Liberty Lake Source Trace Study Regarding PCB, PBDE,
Metals, and Dioxin/Furan: A Pilot Project for Spokane Basin Source Tracing. Washington
Department of Ecology, Olympia, WA. Publication No. 10-04-027.
Appendix D provides definitions for all data flags used in this project. Page | 65
Garvey,E.A, J. Atmadja, and J.B. Butcher. 2002. PCBs in the Hudson River: Role of Sediments.
Clearwaters, Vol. 32, No. 1.
Glenn, N. and S. Golding. 2005. How to do Stormwater Sampling – A Guide for Industrial
Facilities. Washington Department of Ecology, Olympia, WA. Publication No. 02-10-071.
Golding, S. 1996. Spokane River PCB Source Monitoring Follow-up Study November and
December 1995. Environmental Investigations and Laboratory Services Program. Olympia, WA.
Hopkins, B.S., D.K. Clark, M. Schlender, and M. Stinson. 1985. Basic Water Monitoring
Program: Fish Tissue and Sediment Sampling for 1984. Washington Department of Ecology,
Olympia, WA. Publication No. 85-7.
Jack, R. and M. Roose. 2002. Analysis of Fish Tissue from Long Lake (Spokane River) for
PCBs and Selected Metals. Washington Department of Ecology, Olympia, WA. Publication No.
02-03-049.
Johnson, A. 1994. “PCB and Lead Results for 1994 Spokane River Fish Samples.”
Memorandum to G. Patrick. Washington Department of Ecology, Olympia, WA.
Johnson, A. 2001. An Ecological Hazard Assessment for PCBs in the Spokane River.
Washington State Department of Ecology, Olympia, WA. Publication No. 01-03-015.
Johnson, A. and D. Norton. 2001. Chemical Analysis and Toxicity Testing of Spokane River
Sediments Collected in October 2000. Washington Department of Ecology, Olympia, WA.
Publication No. 01-03-019.
Johnson, A, M. Friese, J. Roland, C. Gruenenfelder, B. Dowling, A. Fernandez, and T. Hamlin.
2011. Background Characterization for Metals and Organic Compounds in Northeast
Washington Lakes, Part 1: Bottom Sediments. Washington Department of Ecology, Olympia,
WA. Publication No. 11-03-035.
Johnson, A, M. Friese, J. Roland, C. Gruenenfelder, B. Dowling, A. Fernandez, and T. Hamlin.
2011. Background Characterization for Metals and Organic Compounds in Northeast
Washington Lakes, Part 2: Fish Tissue. Washington Department of Ecology, Olympia, WA.
Publication No. 11-03-054.
Johnson, A., K. Seiders, C. Deligeannis, K. Kinney, P. Sandvik, B. Era-Miller, and D. Alkire.
2006. PBDEs Flame Retardants in Washington Rivers and Lakes: Concentrations in Fish and
Water, 2005-06. Washington State Department of Ecology, Olympia, WA. Publication No. 06-
03-027.
Joy, J. 2008. Quality Assurance Project Plan: Hangman Creek Watershed Dissolved Oxygen and
pH Total Maximum Daily Load Water Quality Study Design. Washington State Department of
Ecology, Olympia, WA. Publication No. 08-03-117.
Page | 66
Lubliner, B., 2009. PBDE and Dioxin/Furans in Spokane Stormwater. Washington State
Department of Ecology, Olympia, WA. Publication
No. 09-03-010. http://www.ecy.wa.gov/biblio/0903010.html
Lubliner, B., J. Ross, and J. Ryf, 2006. Pullman Stormwater Pilot Study for Pesticides, PCBs,
and Fecal Coliform Bacteria, 2005-2006. Washington State Department of Ecology, Olympia,
WA. Publication No. 06-03-034. http://www.ecy.wa.gov/biblio/0603034.html
MEL, 2006. Manchester Environmental Laboratory Quality Assurance Manual. Manchester
Environmental Laboratory, Washington State Department of Ecology, Manchester, WA.
MEL, 2008. Manchester Environmental Laboratory Lab Users Manual, Ninth Edition.
Manchester Environmental Laboratory, Washington State Department of Ecology, Manchester,
WA.
Panero, M., S. Boehme, and G. Munoz. 2005. Pollution Prevention and Management Strategies
for Polychlorinated Biphenyls in the New York/New Jersey Harbor. New York Academy of
Sciences, New York, NY.
Parsons and Terragraphics Inc., 2007. Spokane River PCB TMDL Stormwater Loading
Analysis: Final Technical Report. Washington State Department of Ecology, Olympia, WA.
Publication No. 07-03-055. http://www.ecy.wa.gov/biblio/0703055.html
Peele, C. et al. 2004. Washington State Polybrominated Diphenyl Ethers (PBDE) Chemical
Action Plan: Final Plan. Washington Department of Ecology, Olympia, WA. Publication No. 05-
07-048.
Pelletier, G. 1998. Cadmium, Lead, and Zinc in the Spokane River Recommendations for TMDL
and Waste Load Allocations. Washington Department of Ecology, Olympia, WA. Publication
No. 98-329.
Seiders, K., C. Deligeannis, and K. Kinney. 2006. Washington State Toxics Monitoring
Program: Toxic Contaminants in Fish Tissue and Surface Water in Freshwater Environments,
2003. Washington Department of Ecology, Olympia, WA. Publication No. 06-03-019.
Seiders, K., C. Deligeannis, P. Sandvik. 2007. Washington State Toxics Monitoring Program:
Contaminants in Fish Tissue from Freshwater Environments in 2004 and 2005. Washington
Department of Ecology, Olympia, WA. Publication No. 07-03-024.
Serdar, D. and A. Johnson. 2006. PCBs, PBDEs, and Selected Metals in Spokane River Fish,
2005. Washington Department of Ecology, Olympia, WA. Publication No. 06-03-025.
Serdar, D., K. Kinney, and P. Hallinan. 2006. Spokane River PCBs Total Maximum Daily Load
Study (DRAFT report). Washington Department of Ecology, Olympia, WA. Publication No. 06-
03-024.
Appendix D provides definitions for all data flags used in this project. Page | 67
Serdar, D., B. Lubliner, A. Johnson, and D. Norton. 2011. Spokane River PCB Source
Assessment, 2003-2007. Washington Department of Ecology, Olympia, WA. Publication No.
11-03-013.
Toxics Investigations Section. 1995. Department of Ecology 1993-94 Investigation of PCBs in
the Spokane River. Environmental Investigations and Laboratory Services Program, Olympia,
WA.
USEPA. 2008. Method 1668B: Chlorinated Biphenyl Congeners in Water, Soil, Sediment,
Biosolids, and Tissue by HRGC/HRMS. U.S. Environmental Protection Agency, Office of
Water, Office of Science and Technology, Engineering and Analysis Division (4303T),
Washington, DC. Publication No. EPA-821-R-08-020.
USGS. 2003. Surface-Water/Ground-Water Interaction of the Spokane River and Spokane
Valley/Rathdrum Prairie Aquifer, Idaho and Washington. U.S. Geological Survey and U.S.
Department of the Interior, Reston, VA. Water Resources Investigations Report 03-4239.
USGS. 2007. Ground-water Flow Model for the Spokane Valley-Rathdrum Prairie Aquifer,
Spokane County, Washington, and Bonner and Kootenai Counties, Idaho. U.S. Geological
Survey and U.S. Department of the Interior, Reston, VA. Scientific Investigations Report 2007-
5044.
Wilson, C. and D. Norton. 1996. Stormwater sediment trap pilot study. Washington
Department of Ecology, Olympia, WA. Publication No. 96-347.
Wong, C.S., A.W. Garrison, and W.T. Foreman. 2001. Enantiomeric Composition of Chiral
Polychlorinated Biphenyl Atropisomers in Aquatic Bed Sediment. Environmental Science and
Technology, V. 35, No. 1, 33-39.
Yake, B., S. Singleton, and K. Erickson. 2000. Washington State Dioxin Source Assessment.
Washington State Department of Ecology, Olympia, WA. Publication No. 00-03-044.
Page | 68
Appendices
Appendix A. Glossary
Clean Water Act: A federal act passed in 1972 that contains provisions to restore and maintain
the quality of the nation’s waters. Section 303(d) of the Clean Water Act establishes the TMDL
program.
Conductivity: A measure of water’s ability to conduct an electrical current. Conductivity is
related to the concentration and charge of dissolved ions in water.
Dissolved oxygen (DO): A measure of the amount of oxygen dissolved in water.
National Pollutant Discharge Elimination System (NPDES): National program for issuing,
modifying, revoking and reissuing, terminating, monitoring, and enforcing permits, and
imposing and enforcing pretreatment requirements under the Clean Water Act. The NPDES
program regulates discharges from wastewater treatment plants, large factories, and other
facilities that use, process, and discharge water back into lakes, streams, rivers, bays, and oceans.
Nonpoint source: Pollution that enters any waters of the state from any dispersed land-based or
water-based activities, including but not limited to atmospheric deposition, surface-water runoff
from agricultural lands, urban areas, or forest lands, subsurface or underground sources, or
discharges from boats or marine vessels not otherwise regulated under the NPDES program.
Generally, any unconfined and diffuse source of contamination. Legally, any source of water
pollution that does not meet the legal definition of “point source” in section 502(14) of the Clean
Water Act.
Parameter: Water quality constituent being measured (analyte). A physical, chemical, or
biological property whose values determine environmental characteristics or behavior.
pH: A measure of the acidity or alkalinity of water. A low pH value (0 to 7) indicates that an
acidic condition is present, while a high pH (7 to 14) indicates a basic or alkaline condition. A
pH of 7 is considered to be neutral. Since the pH scale is logarithmic, a water sample with a pH
of 8 is ten times more basic than one with a pH of 7.
Point source: Sources of pollution that discharge at a specific location from pipes, outfalls, and
conveyance channels to a surface water. Examples of point source discharges include municipal
wastewater treatment plants, municipal stormwater systems, industrial waste treatment facilities,
and construction sites that clear more than 5 acres of land.
Stormwater: The portion of precipitation that does not naturally percolate into the ground or
evaporate but instead runs off roads, pavement, and roofs during rainfall or snow melt.
Stormwater can also come from hard or saturated grass surfaces such as lawns, pastures,
playfields, and from gravel roads and parking lots.
Total Maximum Daily Load (TMDL): Water cleanup plan. A distribution of a substance in a
waterbody designed to protect it from not meeting (exceeding) water quality standards. A
TMDL is equal to the sum of all of the following: (1) individual wasteload allocations for point
sources, (2) the load allocations for nonpoint sources, (3) the contribution of natural sources, and

Appendix D provides definitions for all data flags used in this project. Page | 69
(4) a Margin of Safety to allow for uncertainty in the wasteload determination. A reserve for
future growth is also generally provided.
Watershed: A drainage area or basin in which all land and water areas drain or flow toward a
central collector such as a stream, river, or lake at a lower elevation.
303(d) list: Section 303(d) of the federal Clean Water Act requires Washington State to
periodically prepare a list of all surface waters in the state for which beneficial uses of the
water—such as for drinking, recreation, aquatic habitat, and industrial use—are impaired by
pollutants. These are water quality-limited estuaries, lakes, and streams that fall short of state
surface water quality standards and are not expected to improve within the next two years.
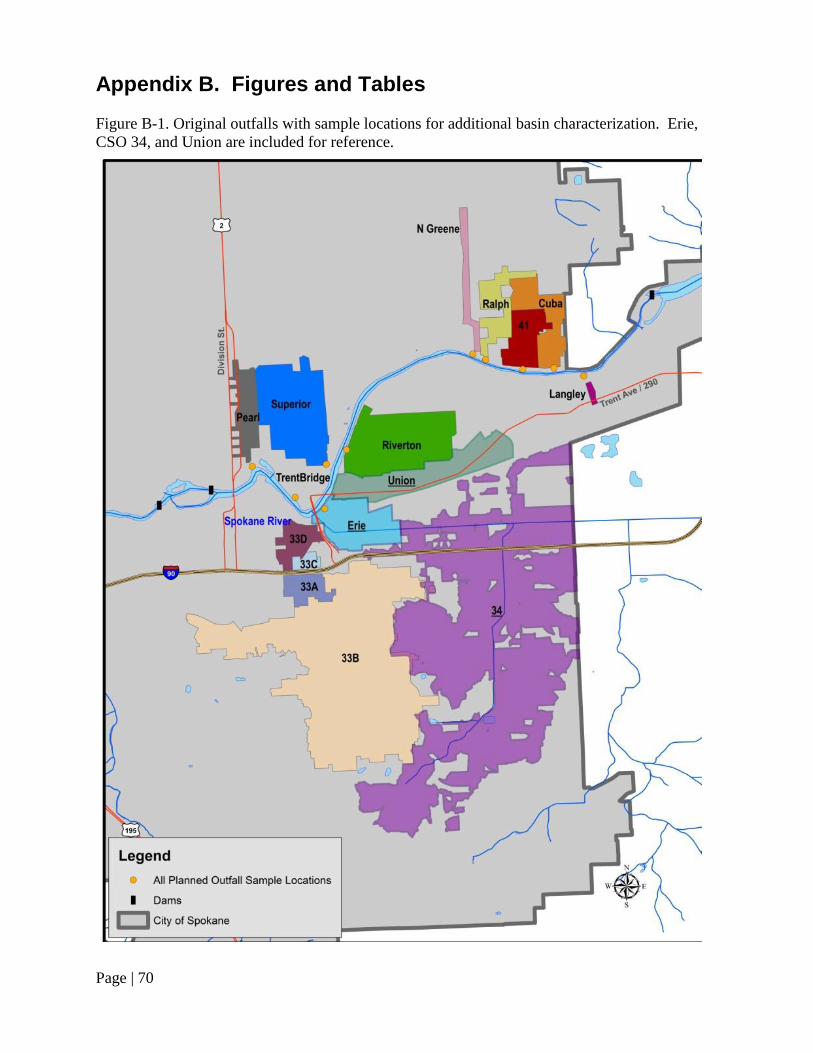
Page | 70
Appendix B. Figures and Tables
Figure B-1. Original outfalls with sample locations for additional basin characterization. Erie,
CSO 34, and Union are included for reference.
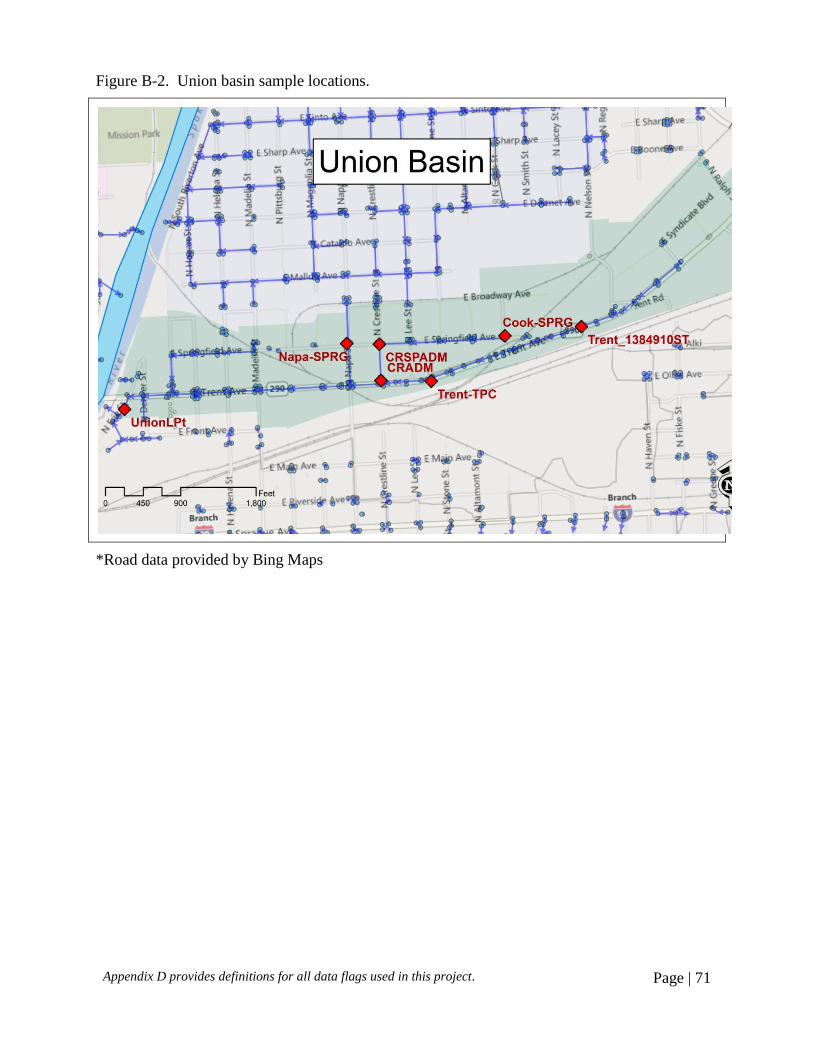
Appendix D provides definitions for all data flags used in this project. Page | 71
Figure B-2. Union basin sample locations.
*Road data provided by Bing Maps
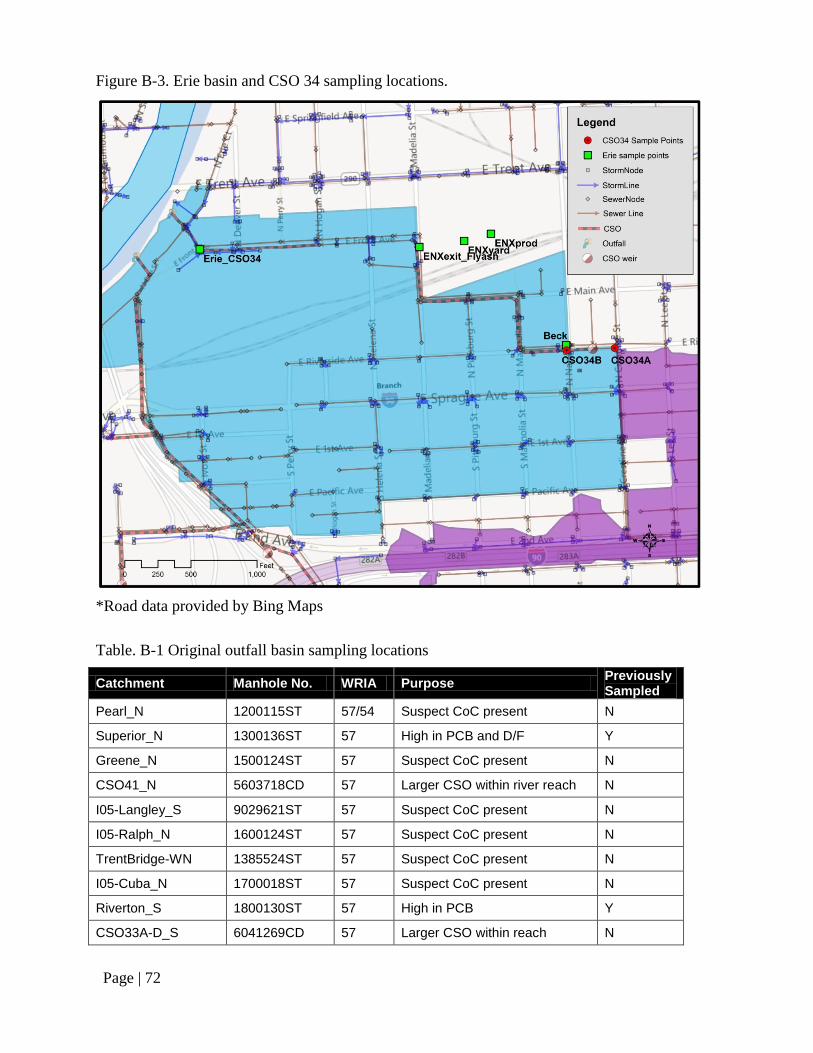
Page | 72
Figure B-3. Erie basin and CSO 34 sampling locations.
*Road data provided by Bing Maps
Table. B-1 Original outfall basin sampling locations
Catchment Manhole No. WRIA Purpose Previously Sampled
Pearl_N 1200115ST 57/54 Suspect CoC present N
Superior_N 1300136ST 57 High in PCB and D/F Y
Greene_N 1500124ST 57 Suspect CoC present N
CSO41_N 5603718CD 57 Larger CSO within river reach N
I05-Langley_S 9029621ST 57 Suspect CoC present N
I05-Ralph_N 1600124ST 57 Suspect CoC present N
TrentBridge-WN 1385524ST 57 Suspect CoC present N
I05-Cuba_N 1700018ST 57 Suspect CoC present N
Riverton_S 1800130ST 57 High in PCB Y
CSO33A-D_S 6041269CD 57 Larger CSO within reach N
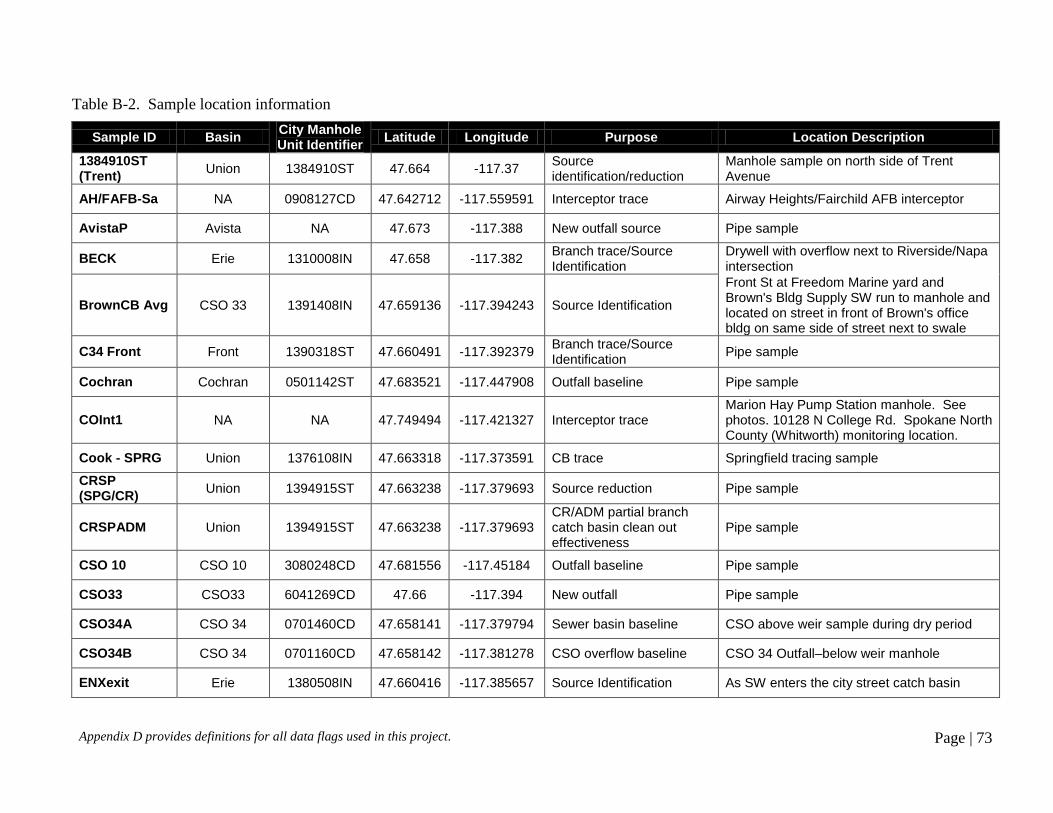
Appendix D provides definitions for all data flags used in this project. Page | 73
Table B-2. Sample location information
Sample ID Basin City Manhole Unit Identifier
Latitude Longitude Purpose Location Description
1384910ST (Trent)
Union 1384910ST 47.664 -117.37 Source identification/reduction
Manhole sample on north side of Trent Avenue
AH/FAFB-Sa NA 0908127CD 47.642712 -117.559591 Interceptor trace Airway Heights/Fairchild AFB interceptor
AvistaP Avista NA 47.673 -117.388 New outfall source Pipe sample
BECK Erie 1310008IN 47.658 -117.382 Branch trace/Source Identification
Drywell with overflow next to Riverside/Napa intersection
BrownCB Avg CSO 33 1391408IN 47.659136 -117.394243 Source Identification
Front St at Freedom Marine yard and Brown's Bldg Supply SW run to manhole and located on street in front of Brown's office bldg on same side of street next to swale
C34 Front Front 1390318ST 47.660491 -117.392379 Branch trace/Source Identification
Pipe sample
Cochran Cochran 0501142ST 47.683521 -117.447908 Outfall baseline Pipe sample
COInt1 NA NA 47.749494 -117.421327 Interceptor trace Marion Hay Pump Station manhole. See photos. 10128 N College Rd. Spokane North County (Whitworth) monitoring location.
Cook - SPRG Union 1376108IN 47.663318 -117.373591 CB trace Springfield tracing sample
CRSP (SPG/CR)
Union 1394915ST 47.663238 -117.379693 Source reduction Pipe sample
CRSPADM Union 1394915ST 47.663238 -117.379693 CR/ADM partial branch catch basin clean out effectiveness
Pipe sample
CSO 10 CSO 10 3080248CD 47.681556 -117.45184 Outfall baseline Pipe sample
CSO33 CSO33 6041269CD 47.66 -117.394 New outfall Pipe sample
CSO34A CSO 34 0701460CD 47.658141 -117.379794 Sewer basin baseline CSO above weir sample during dry period
CSO34B CSO 34 0701160CD 47.658142 -117.381278 CSO overflow baseline CSO 34 Outfall–below weir manhole
ENXexit Erie 1380508IN 47.660416 -117.385657 Source Identification As SW enters the city street catch basin
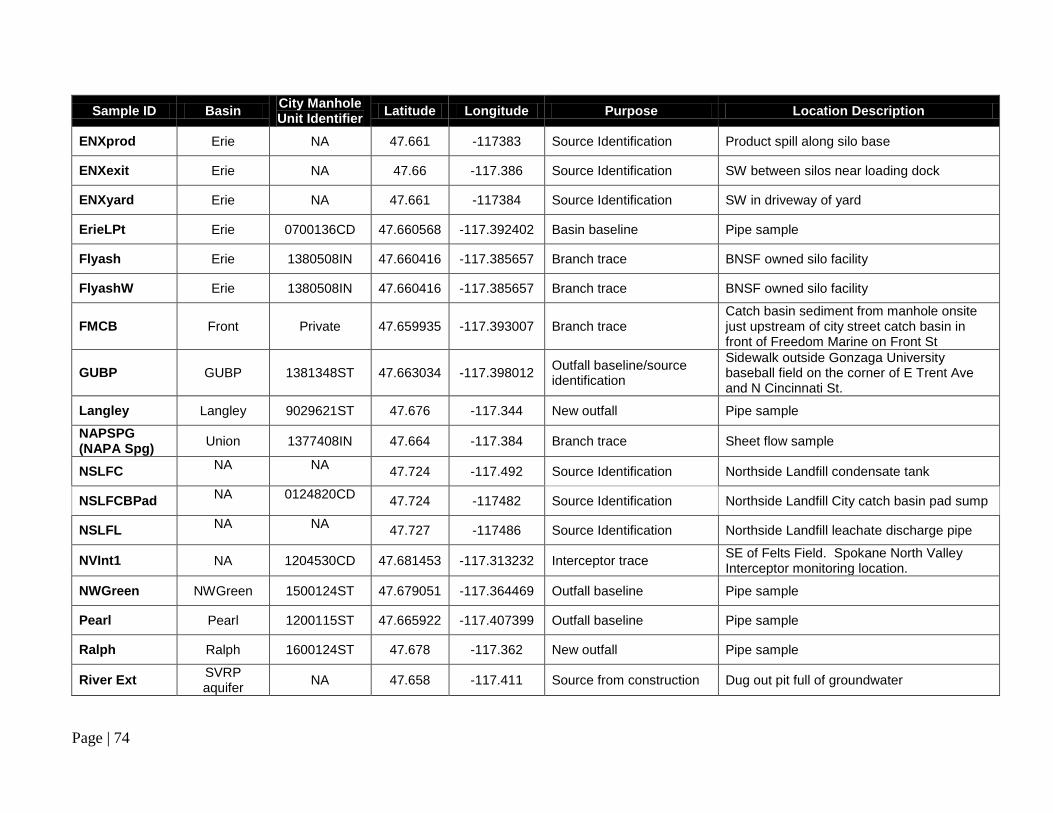
Page | 74
Sample ID Basin City Manhole Unit Identifier
Latitude Longitude Purpose Location Description
ENXprod Erie NA 47.661 -117383 Source Identification Product spill along silo base
ENXexit Erie NA 47.66 -117.386 Source Identification SW between silos near loading dock
ENXyard Erie NA 47.661 -117384 Source Identification SW in driveway of yard
ErieLPt Erie 0700136CD 47.660568 -117.392402 Basin baseline Pipe sample
Flyash Erie 1380508IN 47.660416 -117.385657 Branch trace BNSF owned silo facility
FlyashW Erie 1380508IN 47.660416 -117.385657 Branch trace BNSF owned silo facility
FMCB Front Private 47.659935 -117.393007 Branch trace Catch basin sediment from manhole onsite just upstream of city street catch basin in front of Freedom Marine on Front St
GUBP GUBP 1381348ST 47.663034 -117.398012 Outfall baseline/source identification
Sidewalk outside Gonzaga University baseball field on the corner of E Trent Ave and N Cincinnati St.
Langley Langley 9029621ST 47.676 -117.344 New outfall Pipe sample
NAPSPG (NAPA Spg)
Union 1377408IN 47.664 -117.384 Branch trace Sheet flow sample
NSLFC NA NA
47.724 -117.492 Source Identification Northside Landfill condensate tank
NSLFCBPad NA 0124820CD
47.724 -117482 Source Identification Northside Landfill City catch basin pad sump
NSLFL NA NA
47.727 -117486 Source Identification Northside Landfill leachate discharge pipe
NVInt1 NA 1204530CD 47.681453 -117.313232 Interceptor trace SE of Felts Field. Spokane North Valley Interceptor monitoring location.
NWGreen NWGreen 1500124ST 47.679051 -117.364469 Outfall baseline Pipe sample
Pearl Pearl 1200115ST 47.665922 -117.407399 Outfall baseline Pipe sample
Ralph Ralph 1600124ST 47.678 -117.362 New outfall Pipe sample
River Ext SVRP aquifer
NA 47.658 -117.411 Source from construction Dug out pit full of groundwater
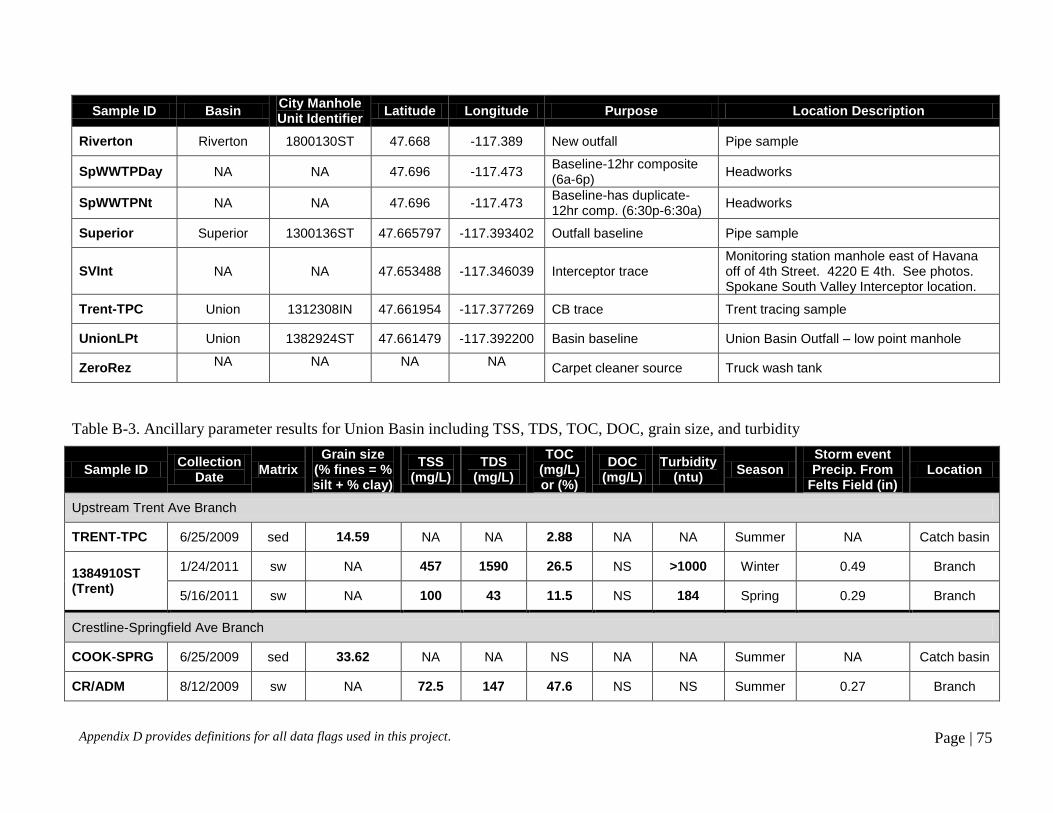
Appendix D provides definitions for all data flags used in this project. Page | 75
Sample ID Basin City Manhole Unit Identifier
Latitude Longitude Purpose Location Description
Riverton Riverton 1800130ST 47.668 -117.389 New outfall Pipe sample
SpWWTPDay NA NA 47.696 -117.473 Baseline-12hr composite (6a-6p)
Headworks
SpWWTPNt NA NA 47.696 -117.473 Baseline-has duplicate-12hr comp. (6:30p-6:30a)
Headworks
Superior Superior 1300136ST 47.665797 -117.393402 Outfall baseline Pipe sample
SVInt NA NA 47.653488 -117.346039 Interceptor trace Monitoring station manhole east of Havana off of 4th Street. 4220 E 4th. See photos. Spokane South Valley Interceptor location.
Trent-TPC Union 1312308IN 47.661954 -117.377269 CB trace Trent tracing sample
UnionLPt Union 1382924ST 47.661479 -117.392200 Basin baseline Union Basin Outfall – low point manhole
ZeroRez NA NA NA NA
Carpet cleaner source Truck wash tank
Table B-3. Ancillary parameter results for Union Basin including TSS, TDS, TOC, DOC, grain size, and turbidity
Sample ID Collection
Date Matrix
Grain size (% fines = % silt + % clay)
TSS (mg/L)
TDS (mg/L)
TOC (mg/L) or (%)
DOC (mg/L)
Turbidity (ntu)
Season Storm event Precip. From
Felts Field (in) Location
Upstream Trent Ave Branch
TRENT-TPC 6/25/2009 sed 14.59 NA NA 2.88 NA NA Summer NA Catch basin
1384910ST (Trent)
1/24/2011 sw NA 457 1590 26.5 NS >1000 Winter 0.49 Branch
5/16/2011 sw NA 100 43 11.5 NS 184 Spring 0.29 Branch
Crestline-Springfield Ave Branch
COOK-SPRG 6/25/2009 sed 33.62 NA NA NS NA NA Summer NA Catch basin
CR/ADM 8/12/2009 sw NA 72.5 147 47.6 NS NS Summer 0.27 Branch
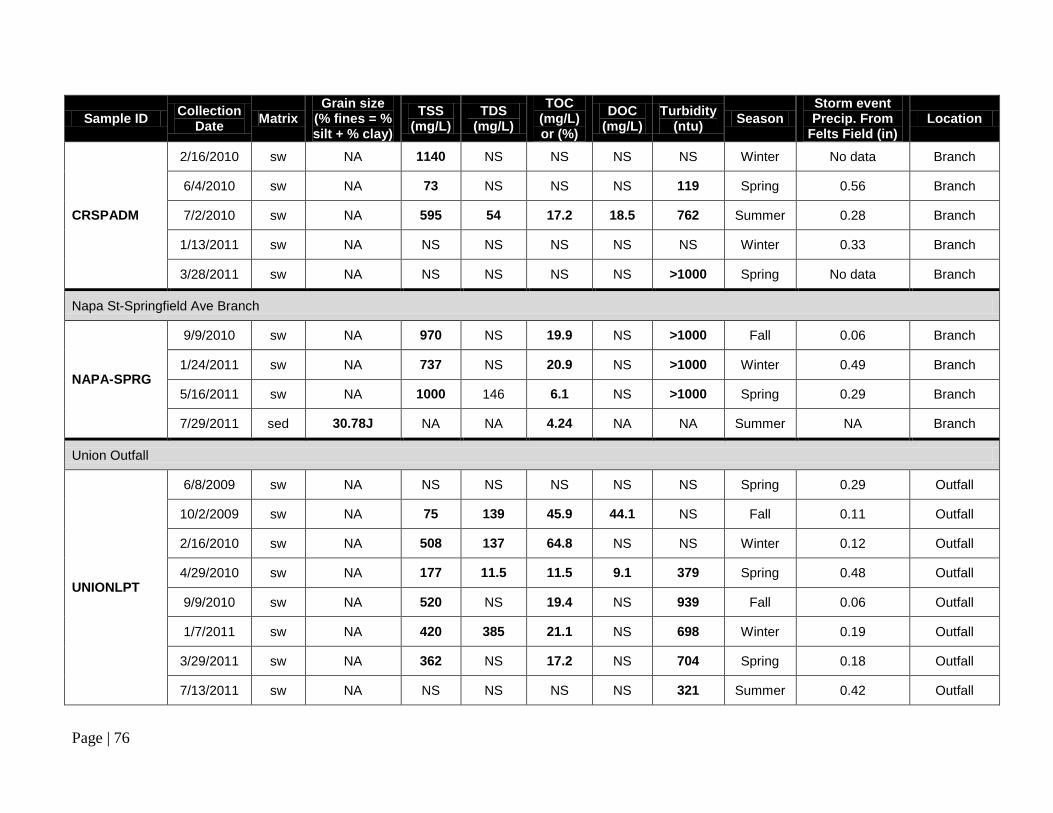
Page | 76
Sample ID Collection
Date Matrix
Grain size (% fines = % silt + % clay)
TSS (mg/L)
TDS (mg/L)
TOC (mg/L) or (%)
DOC (mg/L)
Turbidity (ntu)
Season Storm event Precip. From
Felts Field (in) Location
CRSPADM
2/16/2010 sw NA 1140 NS NS NS NS Winter No data Branch
6/4/2010 sw NA 73 NS NS NS 119 Spring 0.56 Branch
7/2/2010 sw NA 595 54 17.2 18.5 762 Summer 0.28 Branch
1/13/2011 sw NA NS NS NS NS NS Winter 0.33 Branch
3/28/2011 sw NA NS NS NS NS >1000 Spring No data Branch
Napa St-Springfield Ave Branch
NAPA-SPRG
9/9/2010 sw NA 970 NS 19.9 NS >1000 Fall 0.06 Branch
1/24/2011 sw NA 737 NS 20.9 NS >1000 Winter 0.49 Branch
5/16/2011 sw NA 1000 146 6.1 NS >1000 Spring 0.29 Branch
7/29/2011 sed 30.78J NA NA 4.24 NA NA Summer NA Branch
Union Outfall
UNIONLPT
6/8/2009 sw NA NS NS NS NS NS Spring 0.29 Outfall
10/2/2009 sw NA 75 139 45.9 44.1 NS Fall 0.11 Outfall
2/16/2010 sw NA 508 137 64.8 NS NS Winter 0.12 Outfall
4/29/2010 sw NA 177 11.5 11.5 9.1 379 Spring 0.48 Outfall
9/9/2010 sw NA 520 NS 19.4 NS 939 Fall 0.06 Outfall
1/7/2011 sw NA 420 385 21.1 NS 698 Winter 0.19 Outfall
3/29/2011 sw NA 362 NS 17.2 NS 704 Spring 0.18 Outfall
7/13/2011 sw NA NS NS NS NS 321 Summer 0.42 Outfall
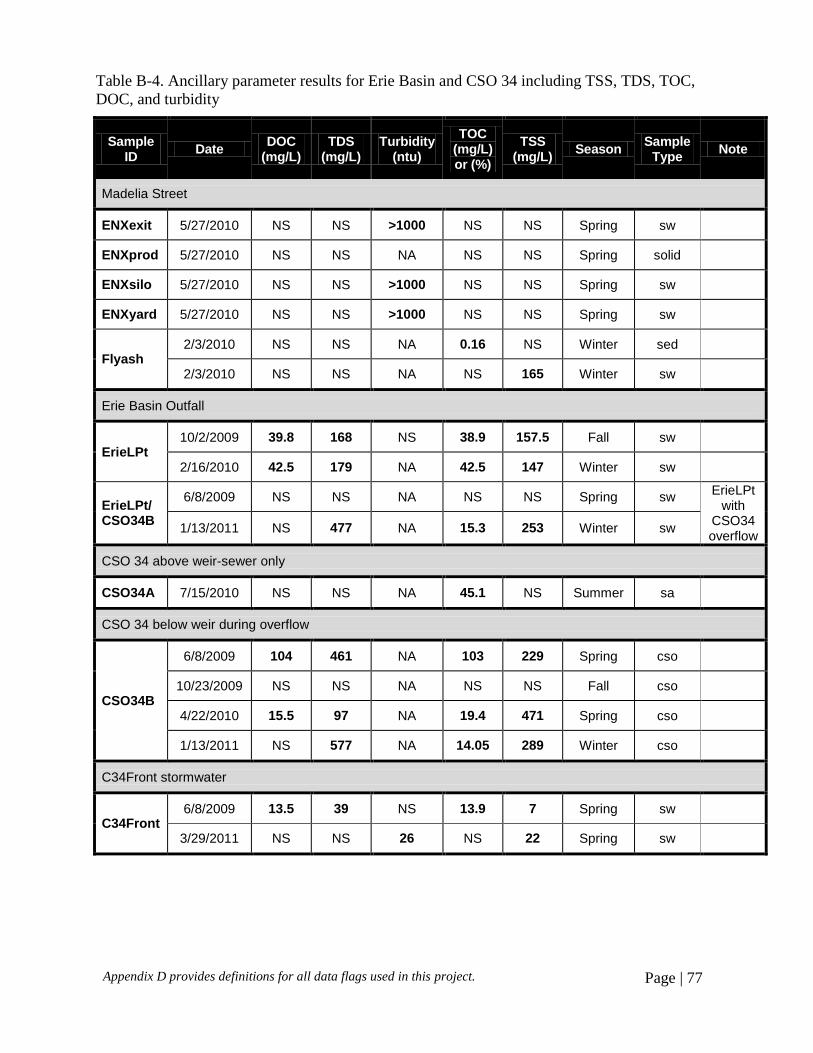
Appendix D provides definitions for all data flags used in this project. Page | 77
Table B-4. Ancillary parameter results for Erie Basin and CSO 34 including TSS, TDS, TOC,
DOC, and turbidity
Sample ID
Date DOC
(mg/L) TDS
(mg/L) Turbidity
(ntu)
TOC (mg/L) or (%)
TSS (mg/L)
Season Sample
Type Note
Madelia Street
ENXexit 5/27/2010 NS NS >1000 NS NS Spring sw
ENXprod 5/27/2010 NS NS NA NS NS Spring solid
ENXsilo 5/27/2010 NS NS >1000 NS NS Spring sw
ENXyard 5/27/2010 NS NS >1000 NS NS Spring sw
Flyash 2/3/2010 NS NS NA 0.16 NS Winter sed
2/3/2010 NS NS NA NS 165 Winter sw
Erie Basin Outfall
ErieLPt 10/2/2009 39.8 168 NS 38.9 157.5 Fall sw
2/16/2010 42.5 179 NA 42.5 147 Winter sw
ErieLPt/ CSO34B
6/8/2009 NS NS NA NS NS Spring sw ErieLPt
with CSO34 overflow
1/13/2011 NS 477 NA 15.3 253 Winter sw
CSO 34 above weir-sewer only
CSO34A 7/15/2010 NS NS NA 45.1 NS Summer sa
CSO 34 below weir during overflow
CSO34B
6/8/2009 104 461 NA 103 229 Spring cso
10/23/2009 NS NS NA NS NS Fall cso
4/22/2010 15.5 97 NA 19.4 471 Spring cso
1/13/2011 NS 577 NA 14.05 289 Winter cso
C34Front stormwater
C34Front 6/8/2009 13.5 39 NS 13.9 7 Spring sw
3/29/2011 NS NS 26 NS 22 Spring sw
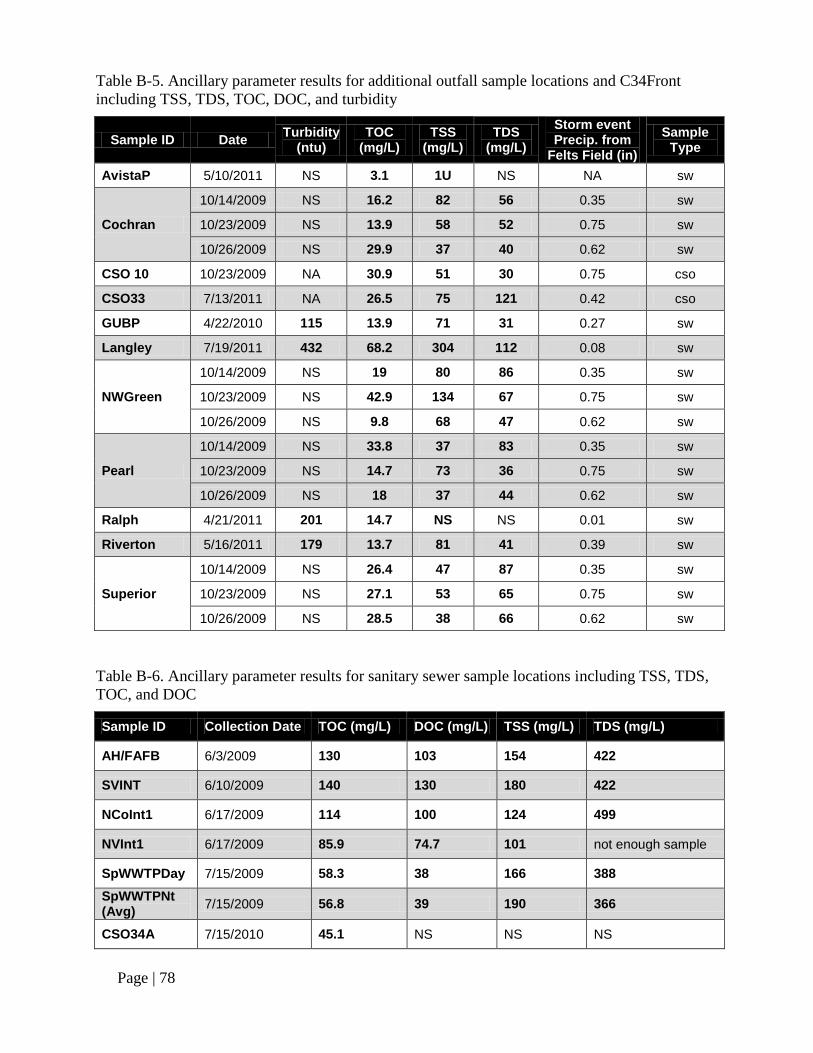
Page | 78
Table B-5. Ancillary parameter results for additional outfall sample locations and C34Front
including TSS, TDS, TOC, DOC, and turbidity
Sample ID Date Turbidity
(ntu) TOC
(mg/L) TSS
(mg/L) TDS
(mg/L)
Storm event Precip. from
Felts Field (in)
Sample Type
AvistaP 5/10/2011 NS 3.1 1U NS NA sw
Cochran
10/14/2009 NS 16.2 82 56 0.35 sw
10/23/2009 NS 13.9 58 52 0.75 sw
10/26/2009 NS 29.9 37 40 0.62 sw
CSO 10 10/23/2009 NA 30.9 51 30 0.75 cso
CSO33 7/13/2011 NA 26.5 75 121 0.42 cso
GUBP 4/22/2010 115 13.9 71 31 0.27 sw
Langley 7/19/2011 432 68.2 304 112 0.08 sw
NWGreen
10/14/2009 NS 19 80 86 0.35 sw
10/23/2009 NS 42.9 134 67 0.75 sw
10/26/2009 NS 9.8 68 47 0.62 sw
Pearl
10/14/2009 NS 33.8 37 83 0.35 sw
10/23/2009 NS 14.7 73 36 0.75 sw
10/26/2009 NS 18 37 44 0.62 sw
Ralph 4/21/2011 201 14.7 NS NS 0.01 sw
Riverton 5/16/2011 179 13.7 81 41 0.39 sw
Superior
10/14/2009 NS 26.4 47 87 0.35 sw
10/23/2009 NS 27.1 53 65 0.75 sw
10/26/2009 NS 28.5 38 66 0.62 sw
Table B-6. Ancillary parameter results for sanitary sewer sample locations including TSS, TDS,
TOC, and DOC
Sample ID Collection Date TOC (mg/L) DOC (mg/L) TSS (mg/L) TDS (mg/L)
AH/FAFB 6/3/2009 130 103 154 422
SVINT 6/10/2009 140 130 180 422
NCoInt1 6/17/2009 114 100 124 499
NVInt1 6/17/2009 85.9 74.7 101 not enough sample
SpWWTPDay 7/15/2009 58.3 38 166 388
SpWWTPNt (Avg)
7/15/2009 56.8 39 190 366
CSO34A 7/15/2010 45.1 NS NS NS

Appendix D provides definitions for all data flags used in this project. Page | 79
Appendix C. Metals data
Table C-1. Erie basin and CSO 34 metals data in µg/L with hardness
Location Collection
Date Anti-mony
Ar-senic
Bery-llium
Cad-mium
Chro-mium
Cop-per Lead
Mer-cury
Nic-kel
Sele-nium Silver
Thal-lium Zinc
Hardness (mg/L)
CSO 34 below weir during overflow
CS034B
6/8/2009 0.88 6.93 0.18 0.36 8.26 61.0 10.7 0.006 U 7.37 0.84 0.79 0.002
U 153 NS
10/23/2009 NS NS NS NS NS NS NS NS NS NS NS NS NS 68.3
4/22/2010 2.80 4.99 0.28 0.46 17.0 42.4 28.8 0.050 U 8.04 0.54 0.42 0.16 234 93.7
1/13/2011 1.44 4.27 10 U 0.29 7.9 26.2 7.14 0.054 5.02 2.83 0.24 0.1 U 119 351
Erie Basin Outfall
ERIELPT 10/2/2009 3.67 3.95 0.18 0.57 14.6 47.5 37 0.050 U 16.9
0.50 U
0.11 0.10
U 311 71.7
2/16/2010 2.54 5 0.24 0.57 12.3 38 52.9 0.059 9.19 0.5 U 0.16 0.1 U 237 65.7
ERIELPT/ CSO34B
6/8/2009 3.33 6.75 0.29 0.98 21.4 74.3 39.6 0.969 11.9 1.05 2.75 0.002
U 374 NS
1/13/2011 1.44 4 10 U 0.33 7.85 24.1 9.6 0.05 U 4.93 2.39 0.2 0.1 U 121 313
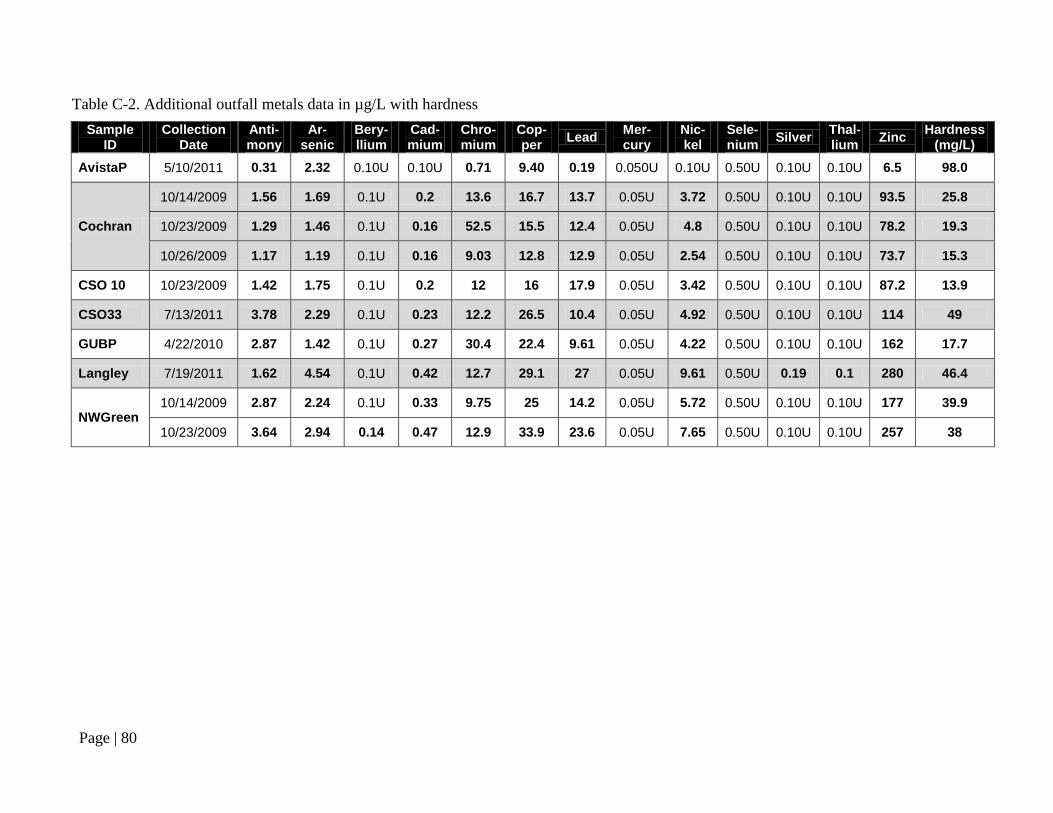
Page | 80
Table C-2. Additional outfall metals data in µg/L with hardness
Sample ID
Collection Date
Anti-mony
Ar-senic
Bery-llium
Cad-mium
Chro-mium
Cop-per
Lead Mer-cury
Nic-kel
Sele-nium
Silver Thal-lium
Zinc Hardness
(mg/L)
AvistaP 5/10/2011 0.31 2.32 0.10U 0.10U 0.71 9.40 0.19 0.050U 0.10U 0.50U 0.10U 0.10U 6.5 98.0
Cochran
10/14/2009 1.56 1.69 0.1U 0.2 13.6 16.7 13.7 0.05U 3.72 0.50U 0.10U 0.10U 93.5 25.8
10/23/2009 1.29 1.46 0.1U 0.16 52.5 15.5 12.4 0.05U 4.8 0.50U 0.10U 0.10U 78.2 19.3
10/26/2009 1.17 1.19 0.1U 0.16 9.03 12.8 12.9 0.05U 2.54 0.50U 0.10U 0.10U 73.7 15.3
CSO 10 10/23/2009 1.42 1.75 0.1U 0.2 12 16 17.9 0.05U 3.42 0.50U 0.10U 0.10U 87.2 13.9
CSO33 7/13/2011 3.78 2.29 0.1U 0.23 12.2 26.5 10.4 0.05U 4.92 0.50U 0.10U 0.10U 114 49
GUBP 4/22/2010 2.87 1.42 0.1U 0.27 30.4 22.4 9.61 0.05U 4.22 0.50U 0.10U 0.10U 162 17.7
Langley 7/19/2011 1.62 4.54 0.1U 0.42 12.7 29.1 27 0.05U 9.61 0.50U 0.19 0.1 280 46.4
NWGreen 10/14/2009 2.87 2.24 0.1U 0.33 9.75 25 14.2 0.05U 5.72 0.50U 0.10U 0.10U 177 39.9
10/23/2009 3.64 2.94 0.14 0.47 12.9 33.9 23.6 0.05U 7.65 0.50U 0.10U 0.10U 257 38
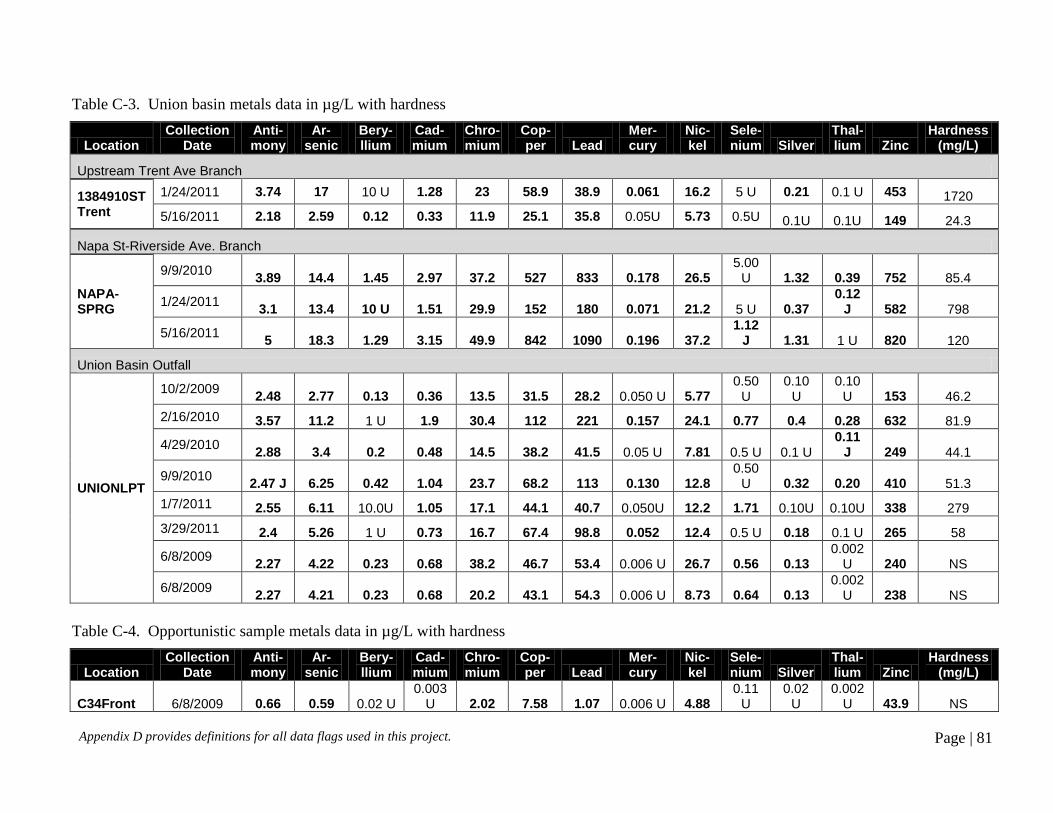
Appendix D provides definitions for all data flags used in this project. Page | 81
Table C-3. Union basin metals data in µg/L with hardness
Location Collection
Date Anti-mony
Ar-senic
Bery-llium
Cad-mium
Chro-mium
Cop-per Lead
Mer-cury
Nic-kel
Sele-nium Silver
Thal-lium Zinc
Hardness (mg/L)
Upstream Trent Ave Branch
1384910ST Trent
1/24/2011 3.74 17 10 U 1.28 23 58.9 38.9 0.061 16.2 5 U 0.21 0.1 U 453 1720
5/16/2011 2.18 2.59 0.12 0.33 11.9 25.1 35.8 0.05U 5.73 0.5U 0.1U 0.1U 149 24.3
Napa St-Riverside Ave. Branch
NAPA-SPRG
9/9/2010 3.89 14.4 1.45 2.97 37.2 527 833 0.178 26.5
5.00 U 1.32 0.39 752 85.4
1/24/2011 3.1 13.4 10 U 1.51 29.9 152 180 0.071 21.2 5 U 0.37
0.12 J 582 798
5/16/2011 5 18.3 1.29 3.15 49.9 842 1090 0.196 37.2
1.12 J 1.31 1 U 820 120
Union Basin Outfall
UNIONLPT
10/2/2009 2.48 2.77 0.13 0.36 13.5 31.5 28.2 0.050 U 5.77
0.50 U
0.10 U
0.10 U 153 46.2
2/16/2010 3.57 11.2 1 U 1.9 30.4 112 221 0.157 24.1 0.77 0.4 0.28 632 81.9
4/29/2010 2.88 3.4 0.2 0.48 14.5 38.2 41.5 0.05 U 7.81 0.5 U 0.1 U
0.11 J 249 44.1
9/9/2010 2.47 J 6.25 0.42 1.04 23.7 68.2 113 0.130 12.8
0.50 U 0.32 0.20 410 51.3
1/7/2011 2.55 6.11 10.0U 1.05 17.1 44.1 40.7 0.050U 12.2 1.71 0.10U 0.10U 338 279
3/29/2011 2.4 5.26 1 U 0.73 16.7 67.4 98.8 0.052 12.4 0.5 U 0.18 0.1 U 265 58
6/8/2009 2.27 4.22 0.23 0.68 38.2 46.7 53.4 0.006 U 26.7 0.56 0.13
0.002 U 240 NS
6/8/2009 2.27 4.21 0.23 0.68 20.2 43.1 54.3 0.006 U 8.73 0.64 0.13
0.002 U 238 NS
Table C-4. Opportunistic sample metals data in µg/L with hardness
Location Collection
Date Anti-mony
Ar-senic
Bery-llium
Cad-mium
Chro-mium
Cop-per Lead
Mer-cury
Nic-kel
Sele-nium Silver
Thal-lium Zinc
Hardness (mg/L)
C34Front 6/8/2009 0.66 0.59 0.02 U 0.003
U 2.02 7.58 1.07 0.006 U 4.88 0.11
U 0.02
U 0.002
U 43.9 NS

Page | 82
Appendix D. Laboratory Data Flag Definitions
U - The analyte was analyzed for, but was not detected above the reported sample
quantitation limit.
J - The analyte was positively identified; the associated numerical value is the
approximate concentration of the analyte in the sample.
UJ - The analyte was not detected above the reported sample quantitation limit.
However, the reported quantitation limit is approximate and may or may not
represent the actual limit of quantitation necessary to accurately and precisely
measure the analyte in the sample.
NJ - The analysis indicates the presence of an analyte that has been “tentatively
identified” and the associated numerical value represents its approximate
concentration.
N - The analysis indicates the presence of an analyte for which there is presumptive
evidence to make a “tentative identification”.
B - Certain target compounds were detected in the laboratory blank. These congeners
were also detected in some of the samples. Where the sample concentration was
less than five times the blank concentration, the sample result was flagged with a
“B” by the contract laboratory.