Embed Size (px)
Citation preview

Spokane Valley-Rathdrum Prairie Aquifer Augmentation Study Results
Mr. Colt Shelton1, Mr. Matt McDonald1, Dr. Michael Barber2, Dr. Akram Hossain3,
Dr. Cara Poor1
1Civil and Environmental Engineering, WSU2State of Washington Water Research Center, WSU
3Environmental Engineering, WSU-Tri Cities
May 23, 2011 1
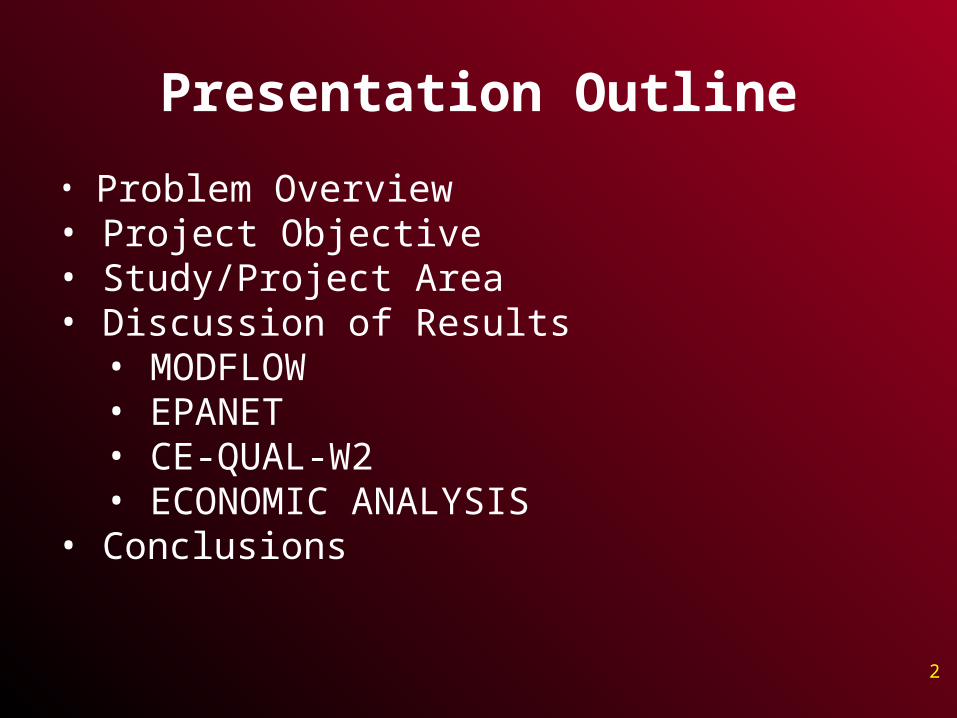
Presentation Outline
• Problem Overview• Project Objective• Study/Project Area• Discussion of Results
• MODFLOW• EPANET• CE-QUAL-W2• ECONOMIC ANALYSIS
• Conclusions
2
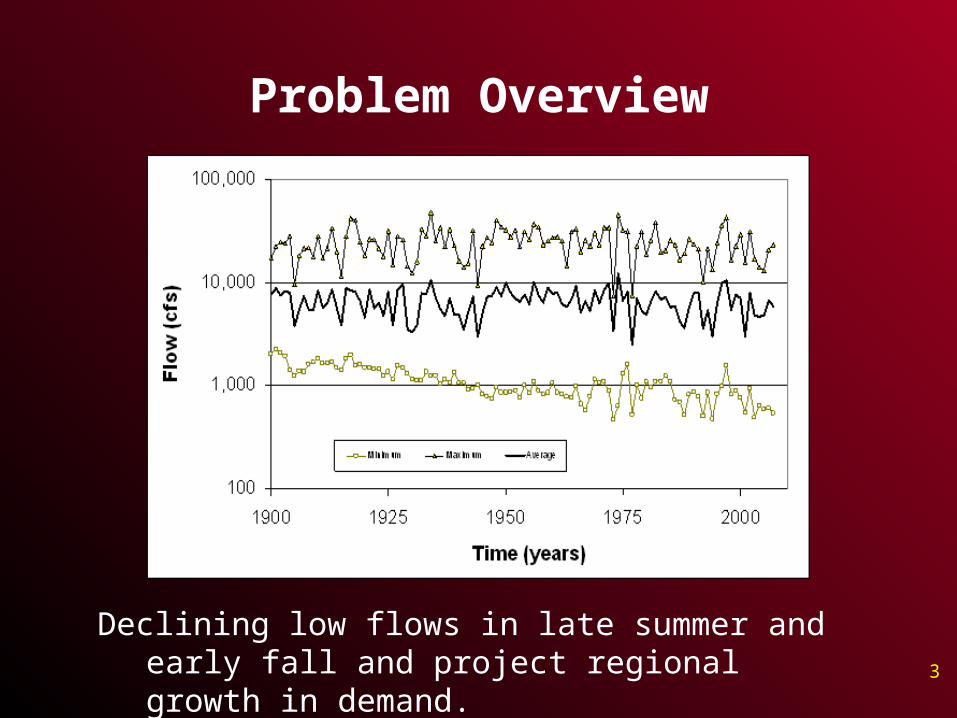
Problem Overview
Declining low flows in late summer and early fall and project regional growth in demand. 3
Use bi-state MODFLOW model to investigate alternatives associated with aquifer storage and natural recovery in the SVRP including examining:
1) raw water source,
2) location of extraction and injection points,
3) pipeline routes, and
4) costs
with ultimate goal of increasing low flow river conditions.
.
Project Objective
4
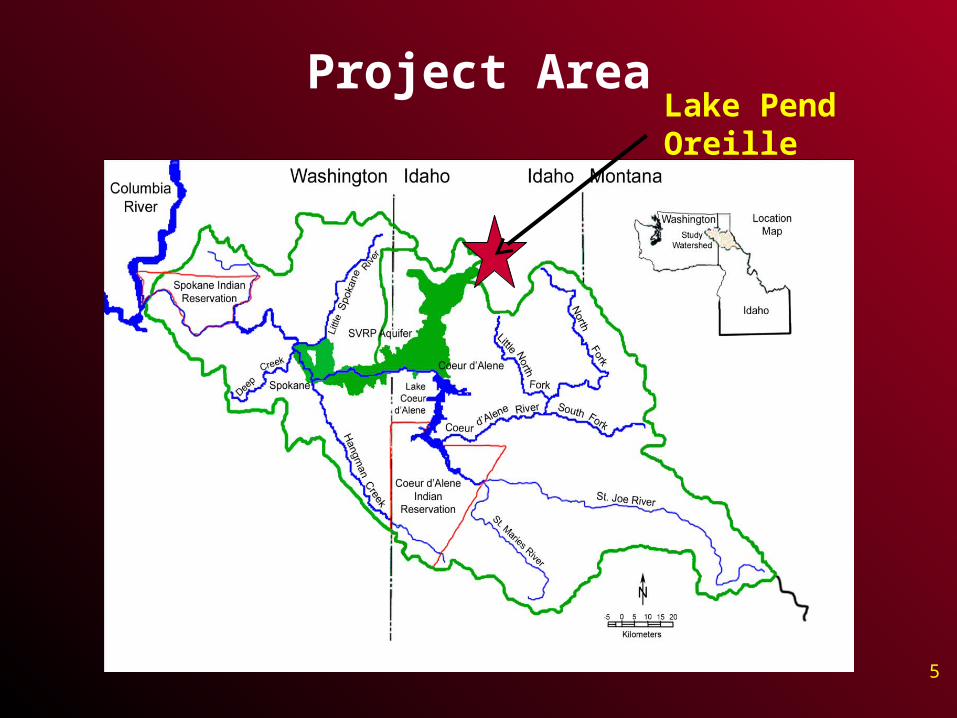
Project Area
5
Lake Pend Oreille
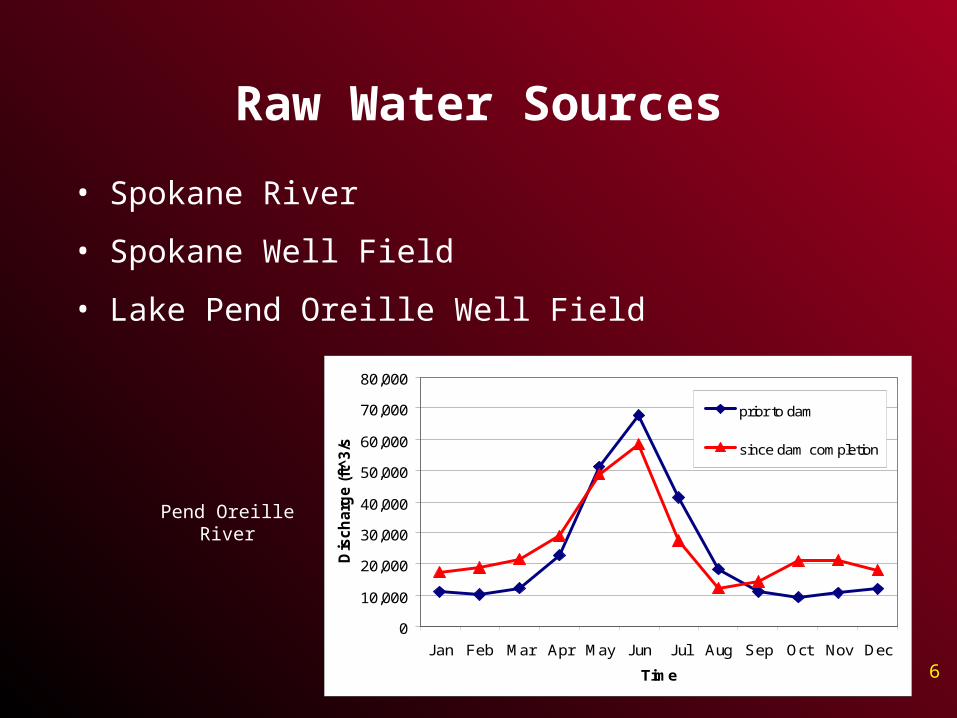
Raw Water Sources
• Spokane River
• Spokane Well Field
• Lake Pend Oreille Well Field
0
10,000
20,000
30,000
40,000
50,000
60,000
70,000
80,000
Jan Feb Mar Apr May Jun Jul Aug Sep Oct Nov Dec
Time
Dis
ch
arg
e (ft
^3/s
)
prior to dam
since dam completion
Pend Oreille River
6
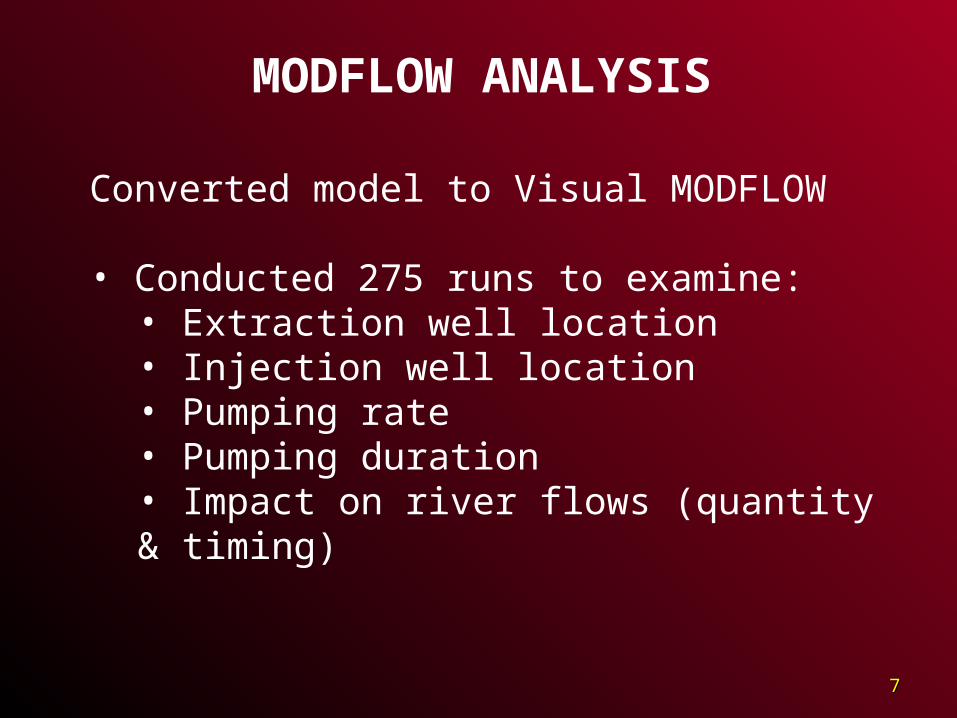
MODFLOW ANALYSIS
Converted model to Visual MODFLOW
• Conducted 275 runs to examine:• Extraction well location• Injection well location• Pumping rate• Pumping duration• Impact on river flows (quantity & timing)
77
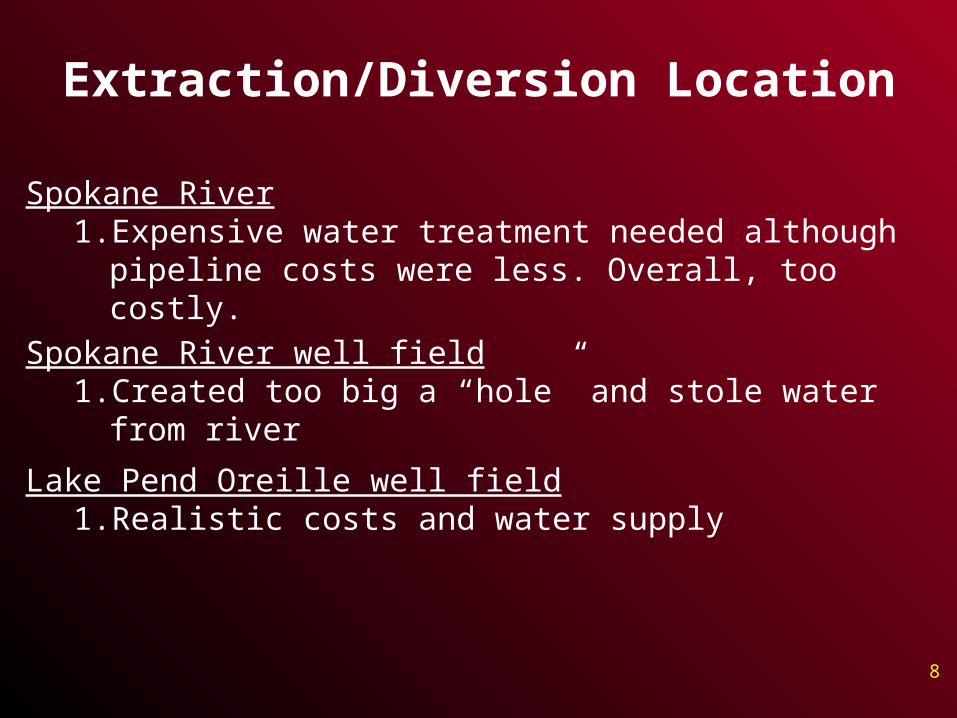
Extraction/Diversion Location
Spokane River1. Expensive water treatment needed although pipeline costs
were less. Overall, too costly.
Lake Pend Oreille well field1. Realistic costs and water supply
Spokane River well field1. Created too big a “hole” and stole water from river
8
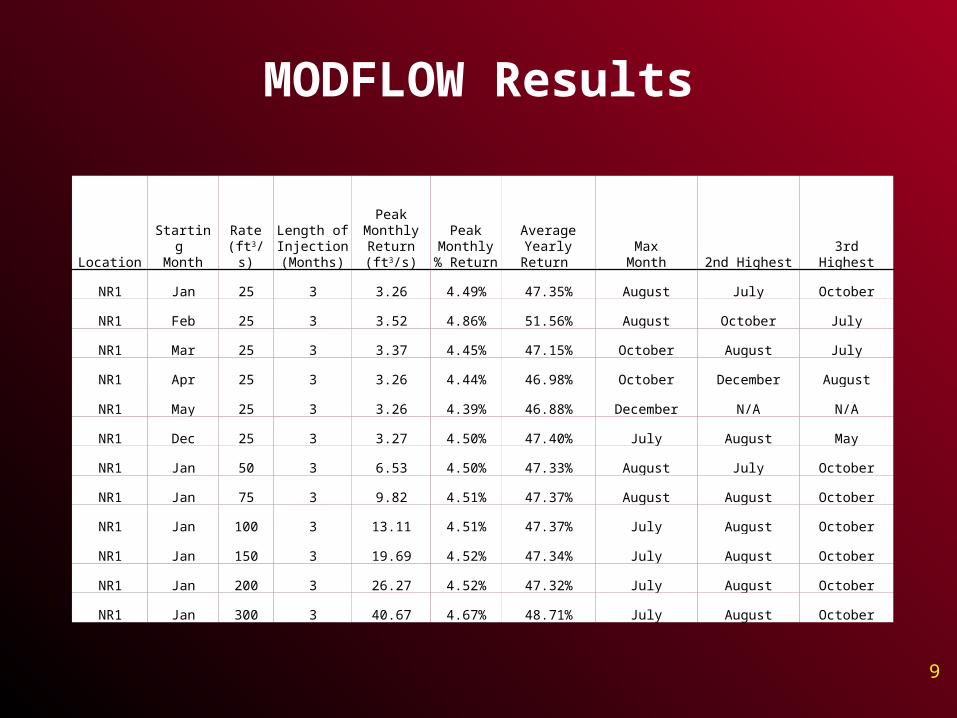
MODFLOW Results
9
LocationStarting Month
Rate(ft3/s)
Length of Injection (Months)
Peak Monthly Return (ft3/s)
Peak Monthly %
ReturnAverage
Yearly Return Max
Month 2nd Highest 3rd Highest
NR1 Jan 25 3 3.26 4.49% 47.35% August July October
NR1 Feb 25 3 3.52 4.86% 51.56% August October July
NR1 Mar 25 3 3.37 4.45% 47.15% October August July
NR1 Apr 25 3 3.26 4.44% 46.98% October December August
NR1 May 25 3 3.26 4.39% 46.88% December N/A N/A
NR1 Dec 25 3 3.27 4.50% 47.40% July August May
NR1 Jan 50 3 6.53 4.50% 47.33% August July October
NR1 Jan 75 3 9.82 4.51% 47.37% August August October
NR1 Jan 100 3 13.11 4.51% 47.37% July August October
NR1 Jan 150 3 19.69 4.52% 47.34% July August October
NR1 Jan 200 3 26.27 4.52% 47.32% July August October
NR1 Jan 300 3 40.67 4.67% 48.71% July August October
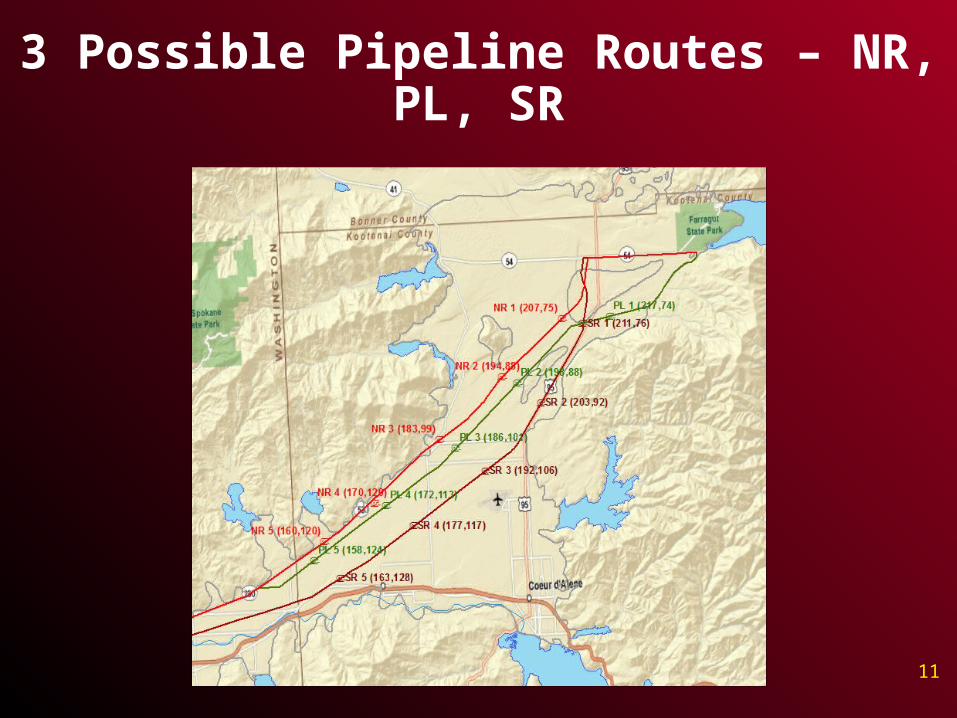
3 Possible Pipeline Routes – NR, PL, SR
11
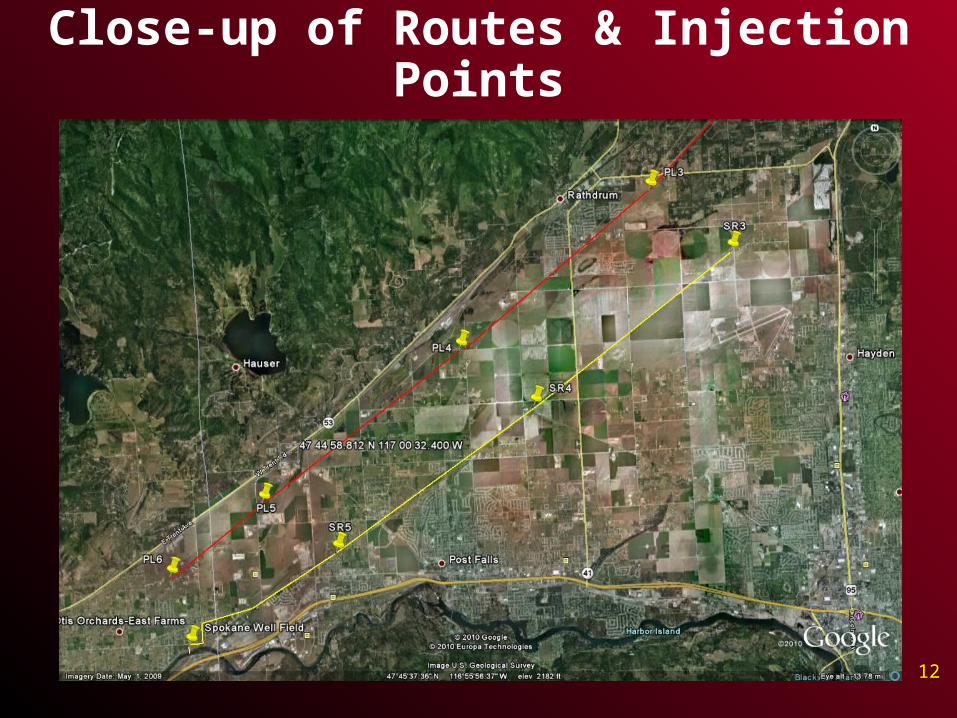
Close-up of Routes & Injection Points
12
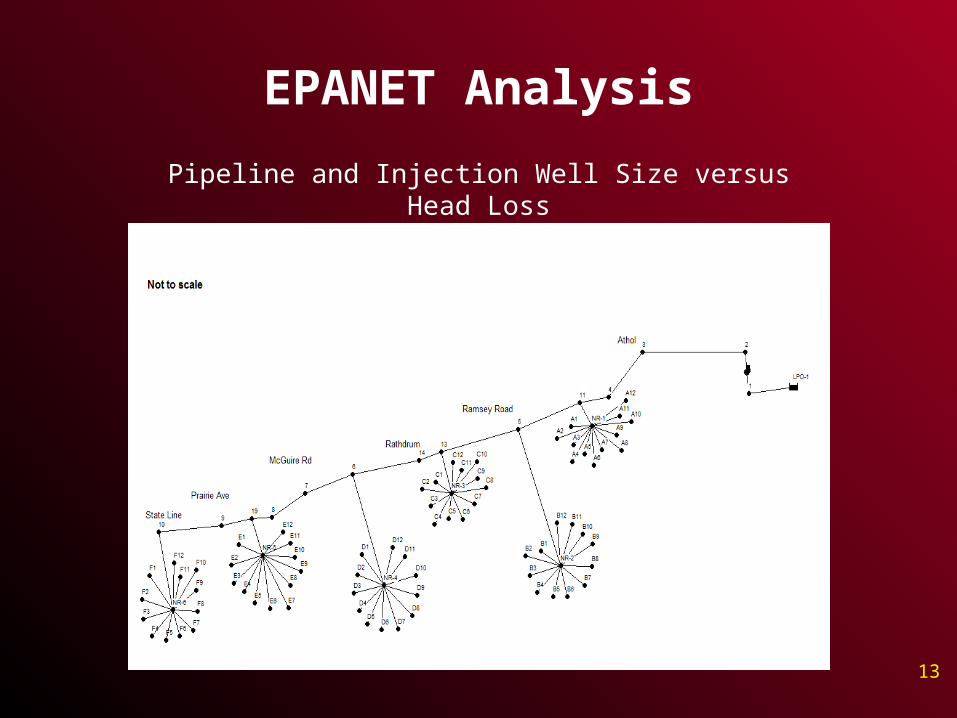
EPANET Analysis
Pipeline and Injection Well Size versus Head Loss
13
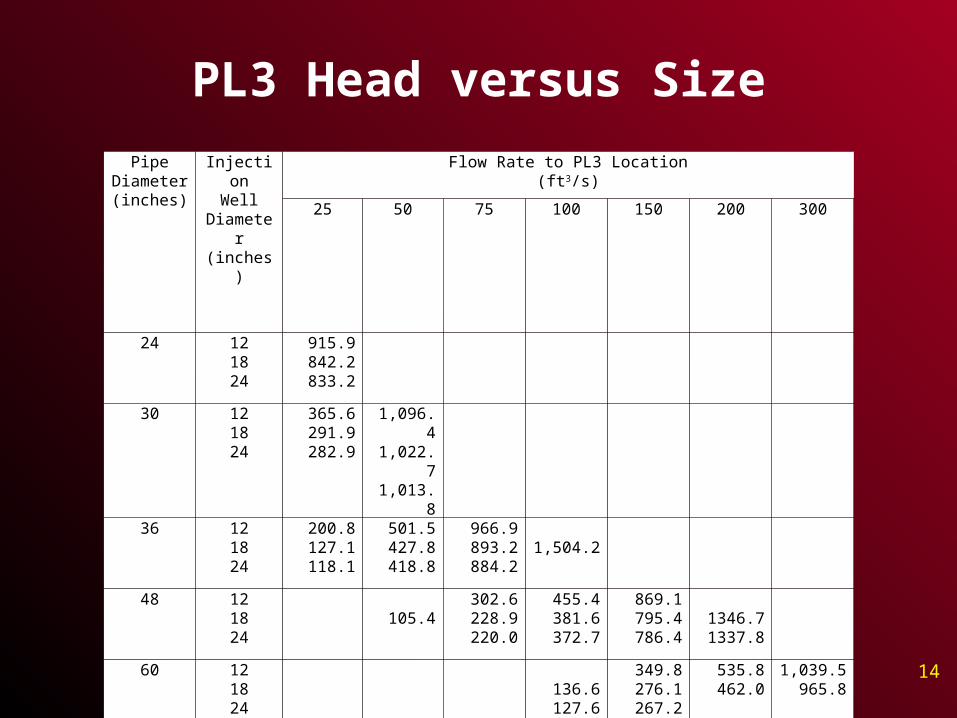
PL3 Head versus Size
Pipe Diameter(inches)
InjectionWell
Diameter(inches)
Flow Rate to PL3 Location(ft3/s)
25 50 75 100 150 200 300
24 121824
915.9842.2833.2
30 121824
365.6291.9282.9
1,096.41,022.71,013.8
36 121824
200.8127.1118.1
501.5427.8418.8
966.9893.2884.2
1,504.2
48 121824
105.4302.6228.9220.0
455.4381.6372.7
869.1795.4786.4
1346.71337.8
60 121824
136.6127.6
349.8276.1267.2
535.8462.0
1,039.5965.8
72 121824
111.6 188.2478.1404.4395.4 14
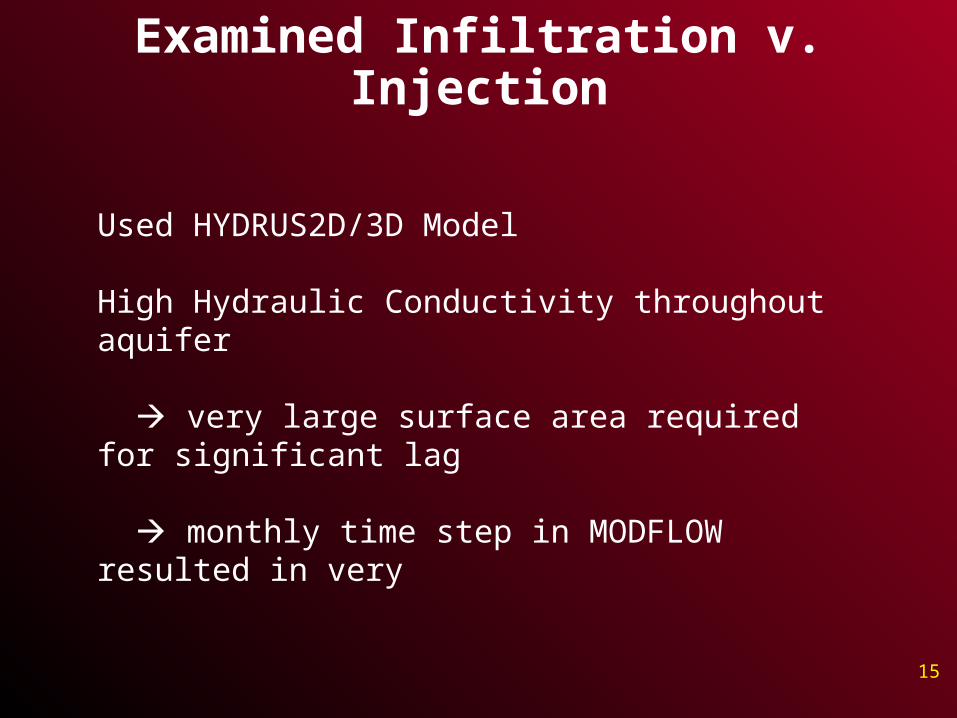
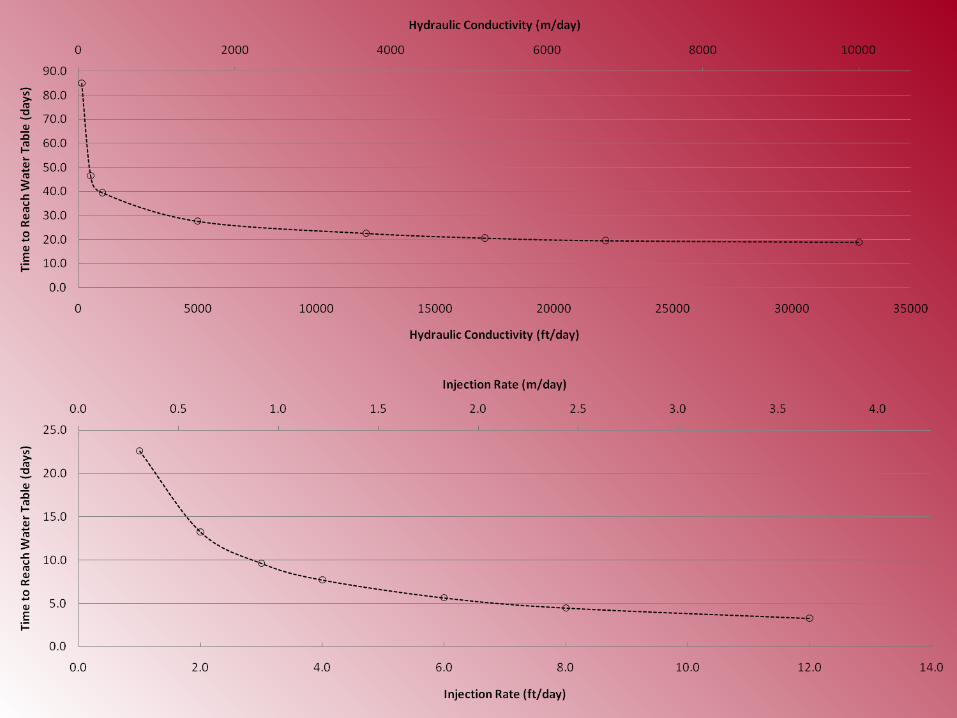
Examined Infiltration v. Injection
15
Used HYDRUS2D/3D Model
High Hydraulic Conductivity throughout aquifer
very large surface area required for significant lag
monthly time step in MODFLOW resulted in very
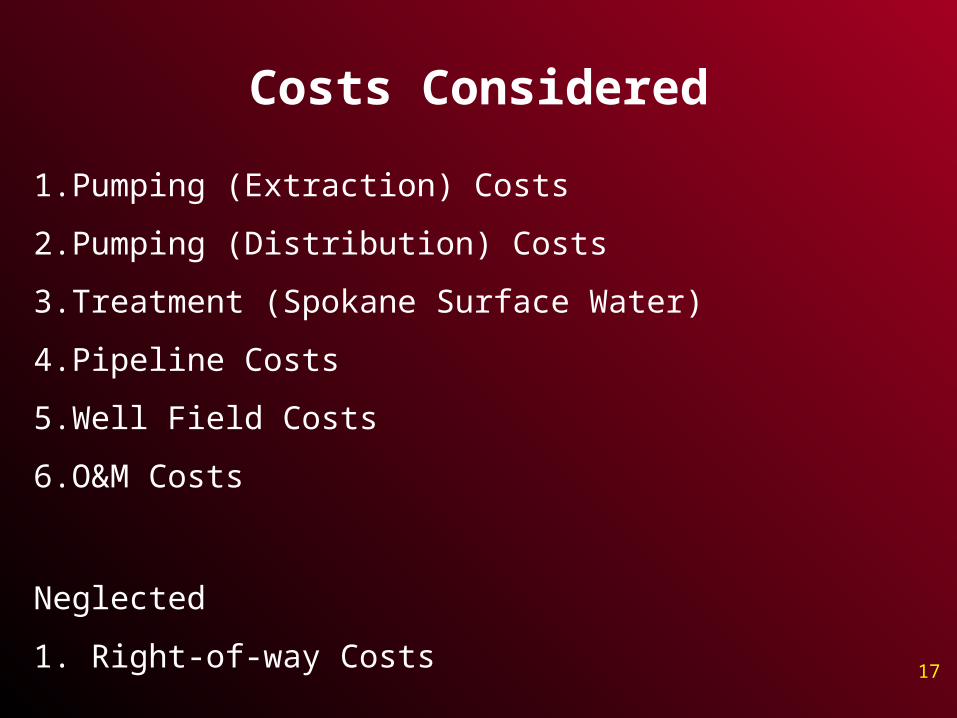
Costs Considered
1. Pumping (Extraction) Costs
2. Pumping (Distribution) Costs
3. Treatment (Spokane Surface Water)
4. Pipeline Costs
5. Well Field Costs
6. O&M Costs
Neglected
1. Right-of-way Costs17
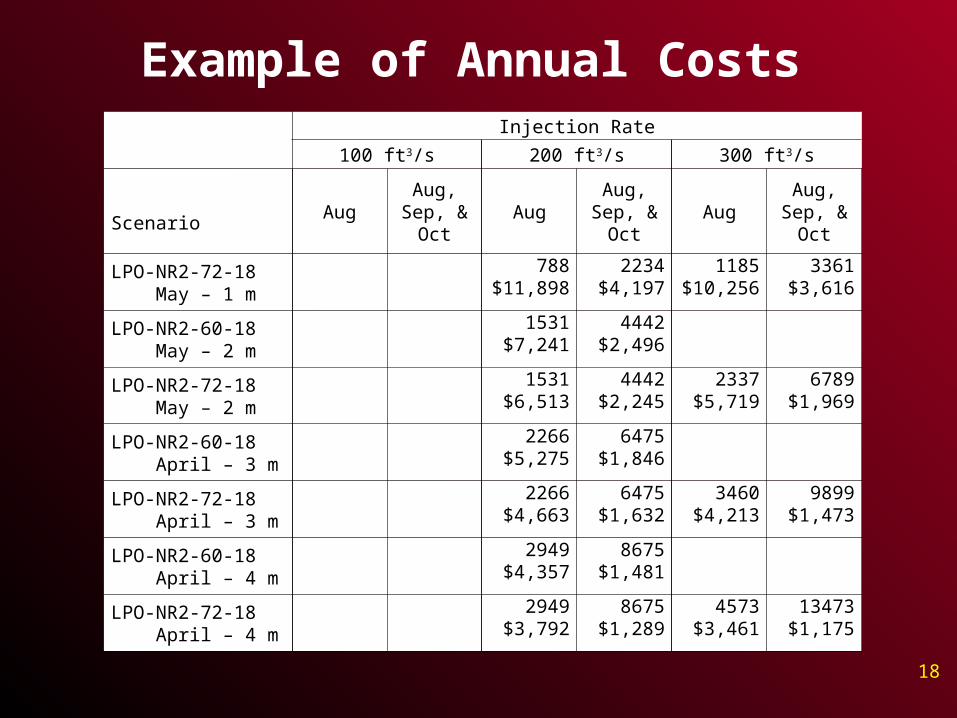
Example of Annual CostsInjection Rate
100 ft3/s 200 ft3/s 300 ft3/s
ScenarioAug
Aug, Sep, & Oct
AugAug, Sep,
& OctAug
Aug, Sep, & Oct
LPO-NR2-72-18 May – 1 m
788$11,898
2234$4,197
1185$10,256
3361$3,616
LPO-NR2-60-18 May – 2 m
1531$7,241
4442$2,496
LPO-NR2-72-18 May – 2 m
1531$6,513
4442$2,245
2337$5,719
6789$1,969
LPO-NR2-60-18 April – 3 m
2266$5,275
6475$1,846
LPO-NR2-72-18 April – 3 m
2266$4,663
6475$1,632
3460$4,213
9899$1,473
LPO-NR2-60-18 April – 4 m
2949$4,357
8675$1,481
LPO-NR2-72-18 April – 4 m
2949$3,792
8675$1,289
4573$3,461
13473$1,175
18
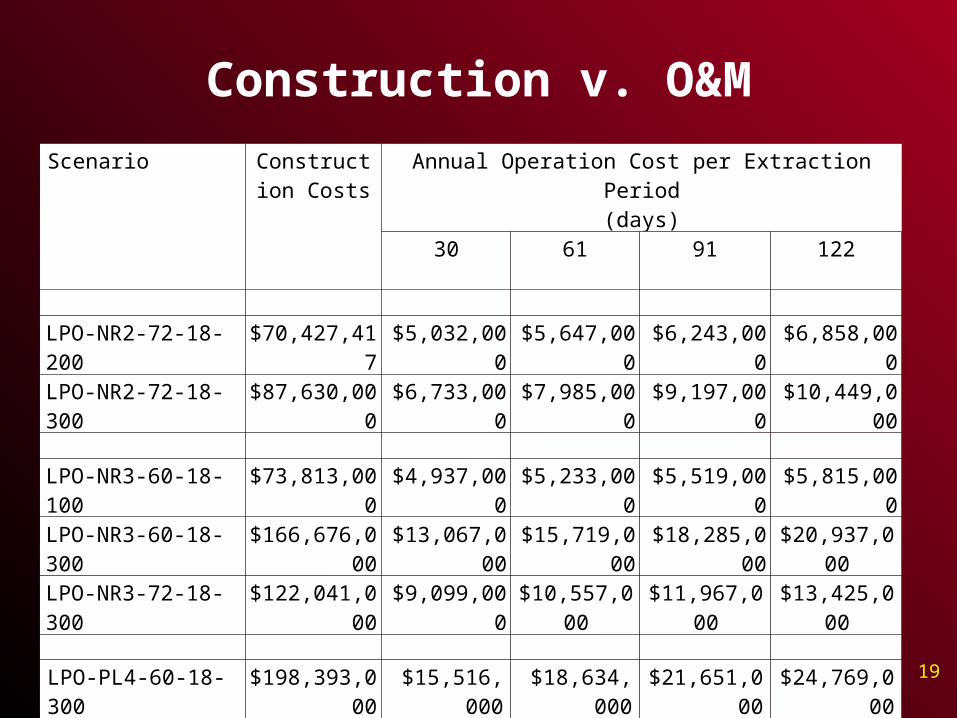
Construction v. O&M
Scenario Construction Costs
Annual Operation Cost per Extraction Period(days)
30 61 91 122
LPO-NR2-72-18-200 $70,427,417 $5,032,000 $5,647,000 $6,243,000 $6,858,000
LPO-NR2-72-18-300 $87,630,000 $6,733,000 $7,985,000 $9,197,000 $10,449,000
LPO-NR3-60-18-100 $73,813,000 $4,937,000 $5,233,000 $5,519,000 $5,815,000
LPO-NR3-60-18-300 $166,676,000 $13,067,000 $15,719,000 $18,285,000 $20,937,000
LPO-NR3-72-18-300 $122,041,000 $9,099,000 $10,557,000 $11,967,000 $13,425,000
LPO-PL4-60-18-300 $198,393,000 $15,516,000 $18,634,000 $21,651,000 $24,769,000
SR-PL3-72-18-300 $464,299,000 $12,391,000 $13,008,000 $13,606,000 $14,223,000
19
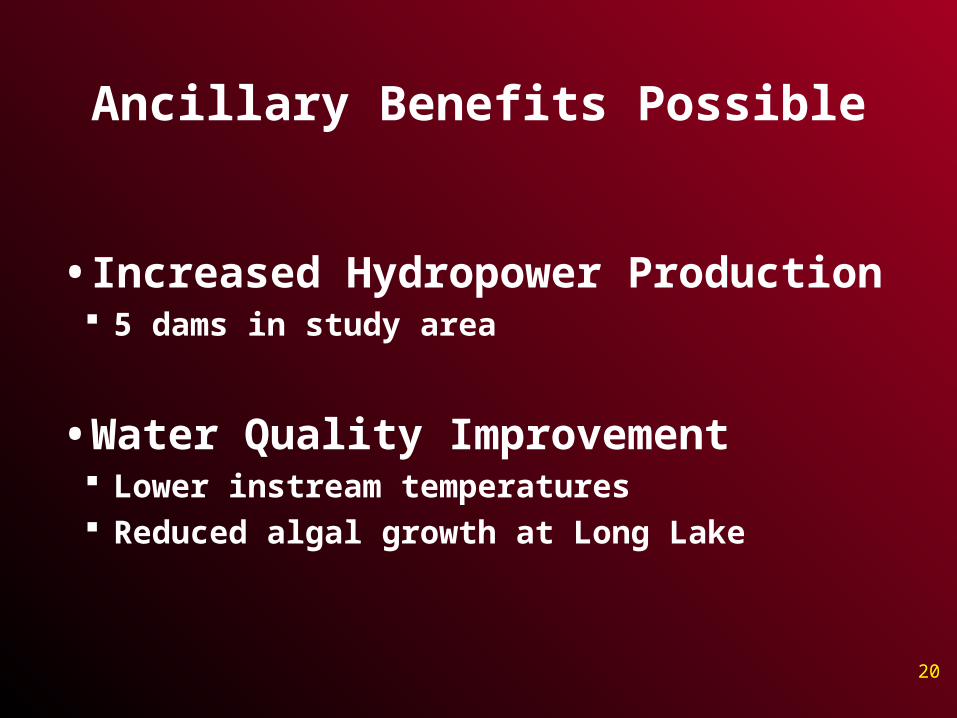
Ancillary Benefits Possible
• Increased Hydropower Production 5 dams in study area
• Water Quality Improvement Lower instream temperatures Reduced algal growth at Long Lake
20
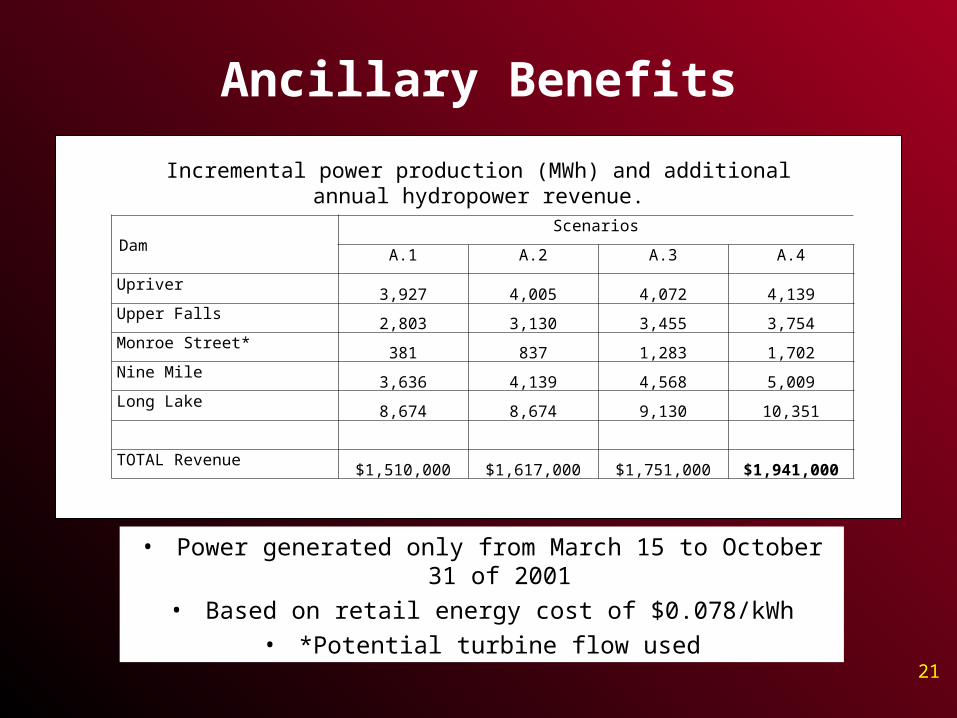
Ancillary Benefits
DamScenarios
A.1 A.2 A.3 A.4
Upriver3,927 4,005 4,072 4,139
Upper Falls2,803 3,130 3,455 3,754
Monroe Street*381 837 1,283 1,702
Nine Mile3,636 4,139 4,568 5,009
Long Lake8,674 8,674 9,130 10,351
TOTAL Revenue$1,510,000 $1,617,000 $1,751,000 $1,941,000
Incremental power production (MWh) and additional annual hydropower revenue.
• Power generated only from March 15 to October 31 of 2001
• Based on retail energy cost of $0.078/kWh
• *Potential turbine flow used
21
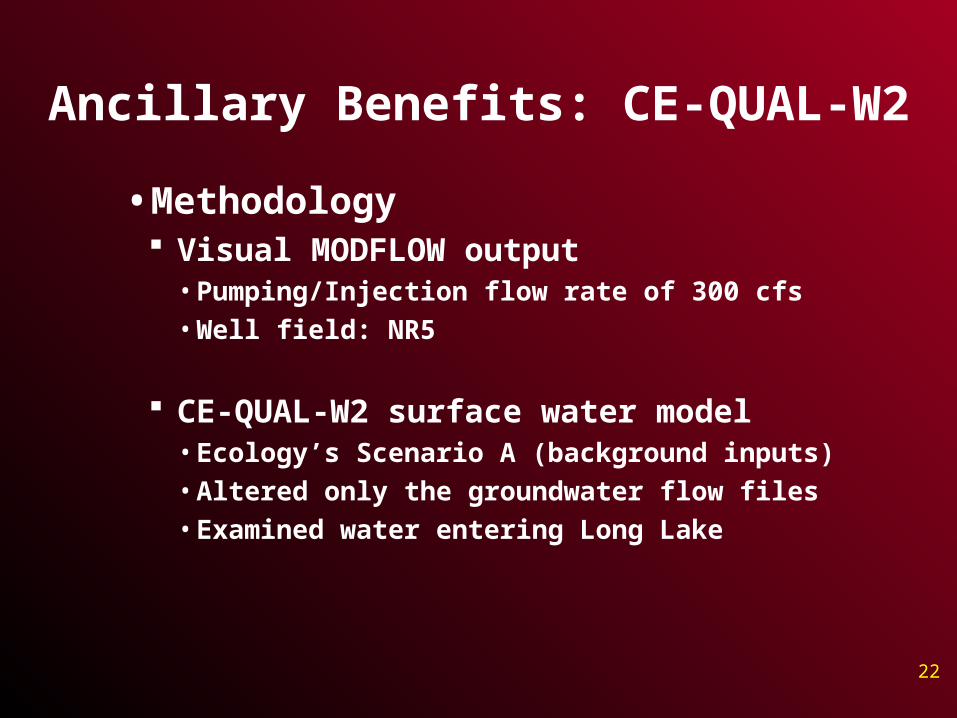
Ancillary Benefits: CE-QUAL-W2
• Methodology Visual MODFLOW output
• Pumping/Injection flow rate of 300 cfs• Well field: NR5
CE-QUAL-W2 surface water model• Ecology’s Scenario A (background inputs)• Altered only the groundwater flow files• Examined water entering Long Lake
22
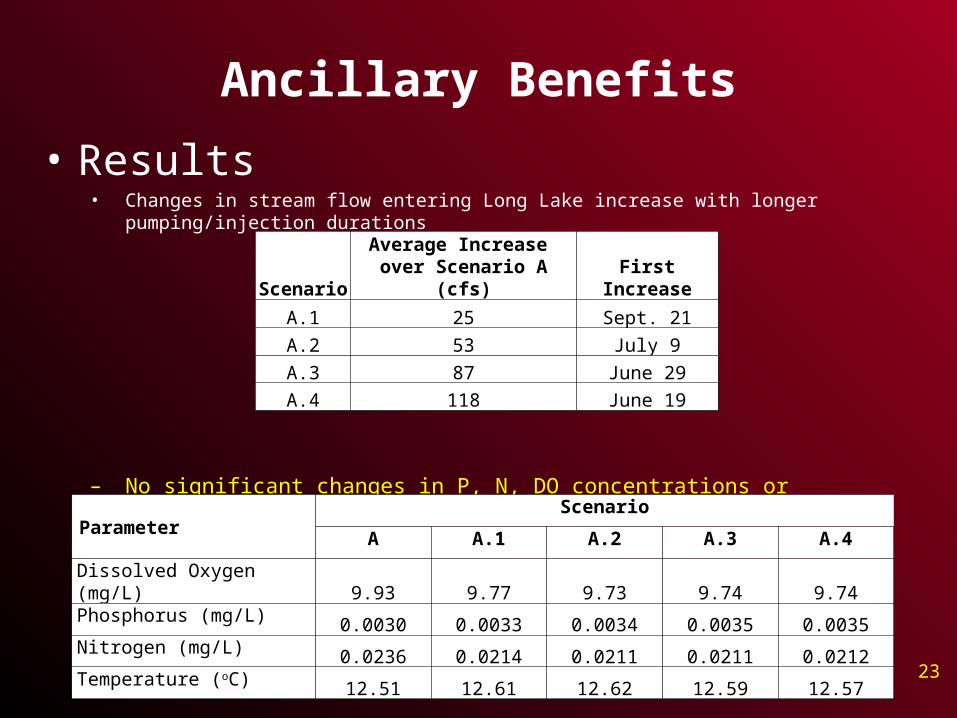
Ancillary Benefits
• Results• Changes in stream flow entering Long Lake increase with longer pumping/injection durations
– No significant changes in P, N, DO concentrations or temperature**
ScenarioAverage Increase
over Scenario A (cfs) First Increase
A.1 25 Sept. 21A.2 53 July 9A.3 87 June 29A.4 118 June 19
ParameterScenario
A A.1 A.2 A.3 A.4
Dissolved Oxygen (mg/L) 9.93 9.77 9.73 9.74 9.74Phosphorus (mg/L) 0.0030 0.0033 0.0034 0.0035 0.0035Nitrogen (mg/L) 0.0236 0.0214 0.0211 0.0211 0.0212Temperature (oC) 12.51 12.61 12.62 12.59 12.57 23
A few key final observations :
• It appears technically feasible to use Lake Pend Oreille water to enhance SVRP and Spokane River
• It is not viable to extract Spokane River water due to excessive water treatment costs
• NR and PL lines most promising – others possible
• Direct injection is preferable to infiltration
• Cost rather than technical concerns
•Discussions with stakeholders, exploratory field work, and model refinement is needed
ConclusionsConclusions
2424
Report AvailabilityReport Availability
• Spokane Regional Ecology OfficeSpokane Regional Ecology Office– John Covert or Guy GregoryJohn Covert or Guy Gregory
2525

Questions?
2626