Embed Size (px)
Citation preview
ARTICLE IN PRESS
0278-4343/$ - se
doi:10.1016/j.cs
�Correspondi100 Joondalup
E-mail addre
Continental Shelf Research 25 (2005) 1561–1582
www.elsevier.com/locate/csr
Sporadic upwelling on a downwelling coast: Phytoplanktonresponses to spatially variable nutrient dynamics off the
Gascoyne region of Western Australia
C.E. Hanson�, C.B. Pattiaratchi, A.M. Waite
Centre for Water Research, The University of Western Australia, 35 Stirling Hwy, Crawley, Western Australia 6009, Australia
Received 20 February 2004; received in revised form 22 October 2004; accepted 15 April 2005
Available online 1 July 2005
Abstract
The Gascoyne continental shelf extends from North West Cape (21.31S) to Shark Bay (26.51S), Western Australia,
and is dominated by the Leeuwin Current (LC), an anomalous oligotrophic eastern boundary current that transports
tropical water poleward and generates large-scale downwelling. In summer, shelf dynamics are influenced by wind-
generated countercurrents (the Ningaloo and Capes Currents) that flow equatorward and are associated with localized
upwelling. Here, we examined phytoplankton responses (biomass levels and distribution, primary production rates,
species composition) to small-scale upwelling in this ecosystem which is generally dominated by a poleward current,
using physical, chemical and biological oceanographic field data collected during a two-week research cruise through
the Gascoyne region in the early austral summer of 2000. We found LC and offshore waters to be associated with low
phytoplankton biomass (21.476.9 s.d. mg chl am�2) and low primary production (110–530mg Cm�2 d�1); surface
(o50m) waters were nitrate-depleted (generallyo0.1 mM), with a strong nutricline present at the base of the mixed
layer. Upwelling associated with the Ningaloo Current (NC) sourced water from this nutricline, and in conjunction with
mixing generated by seaward offshoots, resulted in nitrate levels of up to 2–6mM within the euphotic zone. Biomass in
these NC waters (35.9711.6mg chl am�2) was significantly higher than in LC/offshore regions, with primary
production in the range of 840–1310mg Cm�2 d�1. Capes Current (CC) water was also highly productive (990mg
Cm�2 d�1), and with low silicate levels and a high proportion of centric diatoms, was typical of an aging upwelled water
mass. Thus, the dominance of the oligotrophic LC along the Gascoyne region can be offset by these equatorward
countercurrents, although we hypothesize that the biological impact of any upwelling on the inner shelf would be a
function of: (a) the depth of the LC’s nutrient-depleted mixed layer, (b) the strength and duration of upwelling-
e front matter r 2005 Elsevier Ltd. All rights reserved.
r.2005.04.003
ng author. Current address: Centre for Ecosystem Management, School of Natural Sciences, Edith Cowan University,
Drive, Joondalup, Western Australia 6027, Australia.
ss: [email protected].
ARTICLE IN PRESS
C.E. Hanson et al. / Continental Shelf Research 25 (2005) 1561–15821562
favorable winds (i.e. the intensity of upwelling), and (c) geographical location, primarily with respect to the width of the
continental shelf and resultant proximity of upwelling flows to deep nutrient pools.
r 2005 Elsevier Ltd. All rights reserved.
Keywords: Primary production; Coastal upwelling; Oligotrophic; Eastern Indian Ocean; Leeuwin Current; Ningaloo Current; Western
Australia; Gascoyne 211S to 301S and 1111E to 1151E
1. Introduction
Eastern boundary currents are present in all ofthe major ocean basins, and generally consist of anequatorward surface flow accompanied by large-scale upwelling, high rates of primary productionand abundant fisheries (Wooster and Reid, 1963;Mann and Lazier, 1996). Off the coast of WesternAustralia (WA), the unusual poleward-flowingLeeuwin Current (LC) restricts the eastern arm ofthe Indian Ocean gyre to offshore regions, generat-ing large-scale downwelling as it travels along thecontinental shelf break (Pearce, 1991; Smith et al.,1991). The LC is known to reduce coastal nutrientlevels (Johannes et al., 1994), influence marinespecies distributions (Morgan and Wells, 1991) andlimit productivity at higher trophic levels (Lenan-ton et al., 1991; Caputi et al., 1996). As opposed tothe dominance of pelagic finfish stocks in othereastern boundary regions, the major fishery off WAis the benthic rock lobster, with its life cycle andrecruitment strongly tied to the dynamics of the LC(Phillips et al., 1991).
Inshore of the Leeuwin Current, a system ofequatorward coastal countercurrents is driven byupwelling-favorable southerly winds which prevailduring the austral summer (December–March).Part of that system, the Capes Current (CC)extends along the southwest coast of WA (Pearceand Pattiaratchi, 1999) while the Ningaloo Cur-rent (NC) extends along the northwest coast(Taylor and Pearce, 1999). The combination ofthese wind-forced shelf currents and localizedEkman-driven upwelling (Gersbach et al., 1999;Woo et al., in review) seasonally restricts theinshore extent of the LC (Pearce and Pattiaratchi,1999; Taylor and Pearce, 1999).
The Gascoyne continental shelf extends fromNorth West Cape (21.31S) to Shark Bay (26.51S),Western Australia (Fig. 1), and encompasses the
northern portion of LC waters. Control of phyto-plankton production in coastal regions such as theGascoyne is often closely tied to ambient nutrientlevels, which in turn are strongly influenced by thelocal oceanography (Mann and Lazier, 1996).Along the west coast of WA, the nutrient-poorLC is thought to support only a limited amount ofphytoplankton biomass and productivity, leadingto oligotrophic conditions (Pearce, 1991).Yet both phytoplankton biomass and primary
production data in the Gascoyne region are sparse.Historical chlorophyll a estimates, sourced fromthe International Indian Ocean Expedition (IIOE,1959–1965), give an annual range of 5 to 20mgchl am�2 (recalculated from Humphrey, 1966 asper Humphrey, 1978) in an irregularly sampled51 latitude/longitude grid off the Gascoyne coast.Limited primary productivity data (also sourcedfrom the IIOE) indicates levels of 100–250mgCm�2 d�1 (Koblentz-Mishke et al., 1970; FAO,1981), although these measurements were re-stricted to 1101E (Jitts, 1969), approximately400 km offshore and well outside LC and coastalcountercurrent waters. To date, a lack of researcheffort along the Gascoyne continental shelf haslimited regional estimates of phytoplankton bio-mass and productivity. The importance of suchmeasurements are highlighted by recent studies ofLC influence on rock lobster recruitment, whichnote that the mechanisms behind the relationshipbetween LC flow and recruitment strength areunclear (Caputi et al., 2001), and that variations inlevels of primary production may be a majorfactor (Griffin et al., 2001).The aim of the present paper is therefore to
identify how the Leeuwin, Ningaloo and CapesCurrents influence phytoplankton dynamics (bio-mass levels and distribution, rates of primaryproduction, species composition) along the Gas-coyne shelf. The dominance of the LC in the
ARTICLE IN PRESS
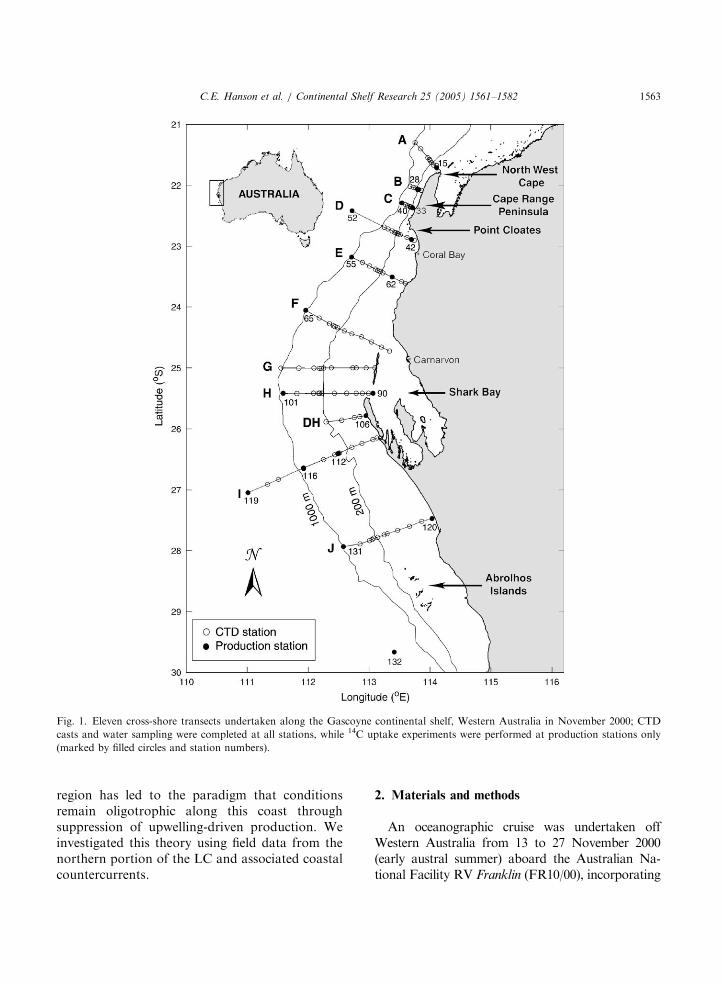
Fig. 1. Eleven cross-shore transects undertaken along the Gascoyne continental shelf, Western Australia in November 2000; CTD
casts and water sampling were completed at all stations, while 14C uptake experiments were performed at production stations only
(marked by filled circles and station numbers).
C.E. Hanson et al. / Continental Shelf Research 25 (2005) 1561–1582 1563
region has led to the paradigm that conditionsremain oligotrophic along this coast throughsuppression of upwelling-driven production. Weinvestigated this theory using field data from thenorthern portion of the LC and associated coastalcountercurrents.
2. Materials and methods
An oceanographic cruise was undertaken offWestern Australia from 13 to 27 November 2000(early austral summer) aboard the Australian Na-tional Facility RV Franklin (FR10/00), incorporating
ARTICLE IN PRESS
C.E. Hanson et al. / Continental Shelf Research 25 (2005) 1561–15821564
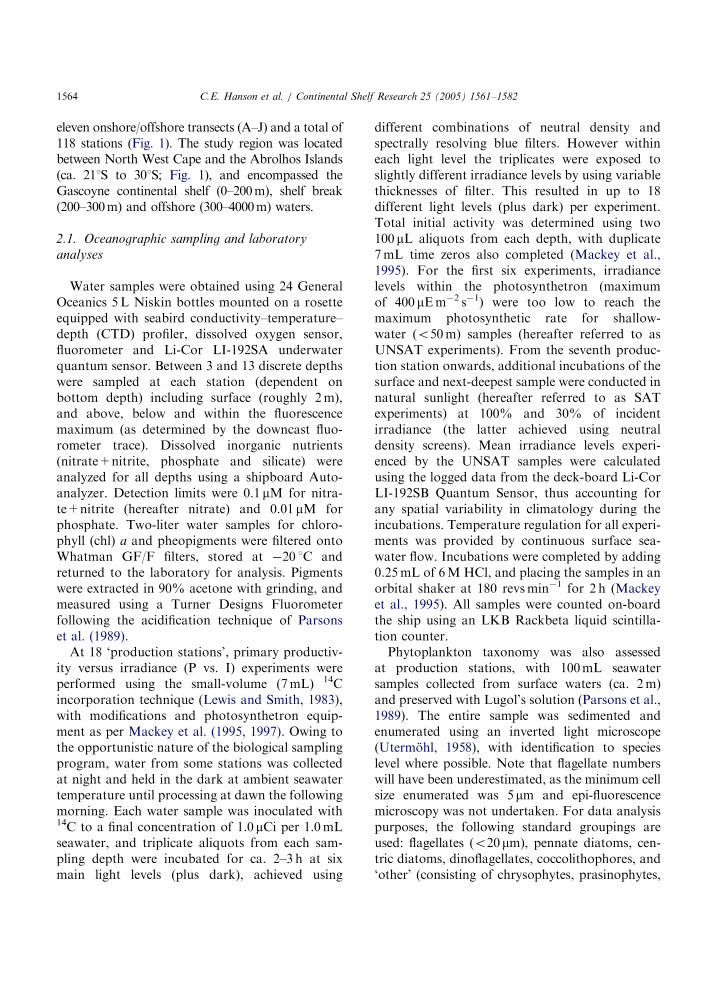
eleven onshore/offshore transects (A–J) and a total of118 stations (Fig. 1). The study region was locatedbetween North West Cape and the Abrolhos Islands(ca. 211S to 301S; Fig. 1), and encompassed theGascoyne continental shelf (0–200m), shelf break(200–300m) and offshore (300–4000m) waters.
2.1. Oceanographic sampling and laboratory
analyses
Water samples were obtained using 24 GeneralOceanics 5L Niskin bottles mounted on a rosetteequipped with seabird conductivity–temperature–depth (CTD) profiler, dissolved oxygen sensor,fluorometer and Li-Cor LI-192SA underwaterquantum sensor. Between 3 and 13 discrete depthswere sampled at each station (dependent onbottom depth) including surface (roughly 2m),and above, below and within the fluorescencemaximum (as determined by the downcast fluo-rometer trace). Dissolved inorganic nutrients(nitrate+nitrite, phosphate and silicate) wereanalyzed for all depths using a shipboard Auto-analyzer. Detection limits were 0.1 mM for nitra-te+nitrite (hereafter nitrate) and 0.01 mM forphosphate. Two-liter water samples for chloro-phyll (chl) a and pheopigments were filtered ontoWhatman GF/F filters, stored at �20 1C andreturned to the laboratory for analysis. Pigmentswere extracted in 90% acetone with grinding, andmeasured using a Turner Designs Fluorometerfollowing the acidification technique of Parsonset al. (1989).
At 18 ‘production stations’, primary productiv-ity versus irradiance (P vs. I) experiments wereperformed using the small-volume (7mL) 14Cincorporation technique (Lewis and Smith, 1983),with modifications and photosynthetron equip-ment as per Mackey et al. (1995, 1997). Owing tothe opportunistic nature of the biological samplingprogram, water from some stations was collectedat night and held in the dark at ambient seawatertemperature until processing at dawn the followingmorning. Each water sample was inoculated with14C to a final concentration of 1.0 mCi per 1.0mLseawater, and triplicate aliquots from each sam-pling depth were incubated for ca. 2–3 h at sixmain light levels (plus dark), achieved using
different combinations of neutral density andspectrally resolving blue filters. However withineach light level the triplicates were exposed toslightly different irradiance levels by using variablethicknesses of filter. This resulted in up to 18different light levels (plus dark) per experiment.Total initial activity was determined using two100 mL aliquots from each depth, with duplicate7mL time zeros also completed (Mackey et al.,1995). For the first six experiments, irradiancelevels within the photosynthetron (maximumof 400 mEm�2 s�1) were too low to reach themaximum photosynthetic rate for shallow-water (o50m) samples (hereafter referred to asUNSAT experiments). From the seventh produc-tion station onwards, additional incubations of thesurface and next-deepest sample were conducted innatural sunlight (hereafter referred to as SATexperiments) at 100% and 30% of incidentirradiance (the latter achieved using neutraldensity screens). Mean irradiance levels experi-enced by the UNSAT samples were calculatedusing the logged data from the deck-board Li-CorLI-192SB Quantum Sensor, thus accounting forany spatial variability in climatology during theincubations. Temperature regulation for all experi-ments was provided by continuous surface sea-water flow. Incubations were completed by adding0.25mL of 6M HCl, and placing the samples in anorbital shaker at 180 revsmin�1 for 2 h (Mackeyet al., 1995). All samples were counted on-boardthe ship using an LKB Rackbeta liquid scintilla-tion counter.Phytoplankton taxonomy was also assessed
at production stations, with 100mL seawatersamples collected from surface waters (ca. 2m)and preserved with Lugol’s solution (Parsons et al.,1989). The entire sample was sedimented andenumerated using an inverted light microscope(Utermohl, 1958), with identification to specieslevel where possible. Note that flagellate numberswill have been underestimated, as the minimum cellsize enumerated was 5mm and epi-fluorescencemicroscopy was not undertaken. For data analysispurposes, the following standard groupings areused: flagellates (o20mm), pennate diatoms, cen-tric diatoms, dinoflagellates, coccolithophores, and‘other’ (consisting of chrysophytes, prasinophytes,
ARTICLE IN PRESS
C.E. Hanson et al. / Continental Shelf Research 25 (2005) 1561–1582 1565
prymnesiophytes, silicoflagellates, cryptophytesand filamentous cyanobacteria).
2.2. Data processing and production calculations
The upper limit of the nitracline was defined asthe depth where the nitrate concentration equalled0.2 mM, as linearly interpolated between watersampling depths. In these extremely oligotrophicwaters, this value was considered more represen-tative of the nitracline than the criteria of 1.0 mMcommonly used for other regions (e.g. Maranonand Holligan, 1999; Moran and Estrada, 2001).
In situ fluorescence was calibrated with ex-tracted chl a data using linear regression, and usedas a proxy for phytoplankton biomass. Where datapermitted (minimum of 5 data points), a separateregression was performed for each station; other-wise, stations were calibrated using pooleddata for that transect (r2 ¼ 0:7620:92). The deepchlorophyll maximum (DCM) was taken as thedepth of maximum subsurface chl a concentration.
Computations of daily rates of primary produc-tion were performed as in Mackey et al. (1995) andWalsby (1997). Chlorophyll-normalized photosyn-thetic parameters (Pm
* or Ps*, a* and b*) were
linearly interpolated between sample depths. Cali-brated fluorescence was used to scale theseparameters at 2m depth intervals, and produc-tion (P) was calculated using the equation ofPlatt et al. (1980): P ¼ Psð1� e�aI=PsÞe�bI=Ps,where I ¼ irradiance. Daily rates were computedusing both actual irradiance data (recorded in airat five minute intervals by a deck-board Li-CorLI-192SB Quantum Sensor) and theoretical sinecurves of irradiance (based on latitude and date).Irradiance in air was corrected for water reflec-tance to obtain irradiance below surface byincorporating solar elevation, effective zenithangle and surface wind roughening (from 5minwind averages; Walsby, 1997).
The vertical light profile was obtained usingattenuation coefficients (Kd) calculated from fielddata through a linear regression of the natural logof photosynthetically available radiation (PAR)vs. depth, according to the relation: lnEdð0Þ ¼�Kdz þ lnEdðzÞ, where Edð0Þ and EdðzÞ are thevalues of downwelling PAR at the surface and at z
m, respectively (Kirk, 1994). A smoothed irradi-ance profile was then used to determine the depthof the euphotic zone. Attenuation coefficients usedfor production calculations were those measuredat each station, although if the data did not existthe mean value of Kd for the study area was used.The double integral of photosynthesis through
depth and time (mg Cm�2 d�1) was computedusing trapezoidal integration (Walsby, 1997).These calculations provide only an estimate ofdaily gross production, as no attempt was made tocorrect for losses of carbon via respiration orgrazing. All depth integrations (for primaryproduction, chl a and nutrients) were to the0.1% light level, or sea bottom if shallower. Assampling was undertaken with standard uncoatedhydrowire and General Oceanics Niskin bottlesthat had not been fitted with silicone tubing and o-rings, we must assume that photosynthetic rateswere potentially underestimated due to contam-ination effects (Marra and Heinemann, 1987;Williams and Robertson, 1989). Using similarmethodologies and calculation techniques as thepresent study, Mackey et al. (1995) found thatdepth-integrated productivity was underestimatedby up to 50%. It is therefore reasonable toconsider that a similar effect may have occurredwith our results. However, while the absoluteproduction values may have been underestimated,any identified differences in productivity betweenregions should remain valid.In the case of UNSAT experiments, Pm was
taken as the maximum photosynthetic rateachieved in the photosynthetron (at �400 mEm-2 s�1), providing a conservative estimate of thisparameter. These UNSAT experiments wereconsequently without a measure of the photo-inhibition parameter (b). In the case of SATexperiments, surface samples did not displayphotoinhibition, as is common for phytoplanktonadapted to high light conditions (e.g. Maranonand Holligan, 1999; Basterretxea and Aristegui,2000; Moran and Estrada, 2001). Samples asso-ciated with the DCM did exhibit photoinhibition,but because light levels at these depths were belowthe inhibition threshold, this was of little impor-tance when calculating in situ production. Thus,for UNSAT experiments we have assumed that
ARTICLE IN PRESS
C.E. Hanson et al. / Continental Shelf Research 25 (2005) 1561–15821566
b ¼ 0. The implications of that assumption areaddressed in Hanson (2004).
3. Results
3.1. Physical water types
To facilitate the interpretation of geographicalpatterns, CTD and production stations weregrouped into water types based on temperature-salinity (TS) characteristics, Acoustic DopplerCurrent Profiler (ADCP) data and sea-surfacetemperature (SST) images (see Woo et al., inreview). Stations from the Leeuwin Current, off-shore waters and three shelf water types wereclassified as follows (Fig. 2): (1) Leeuwin Current/
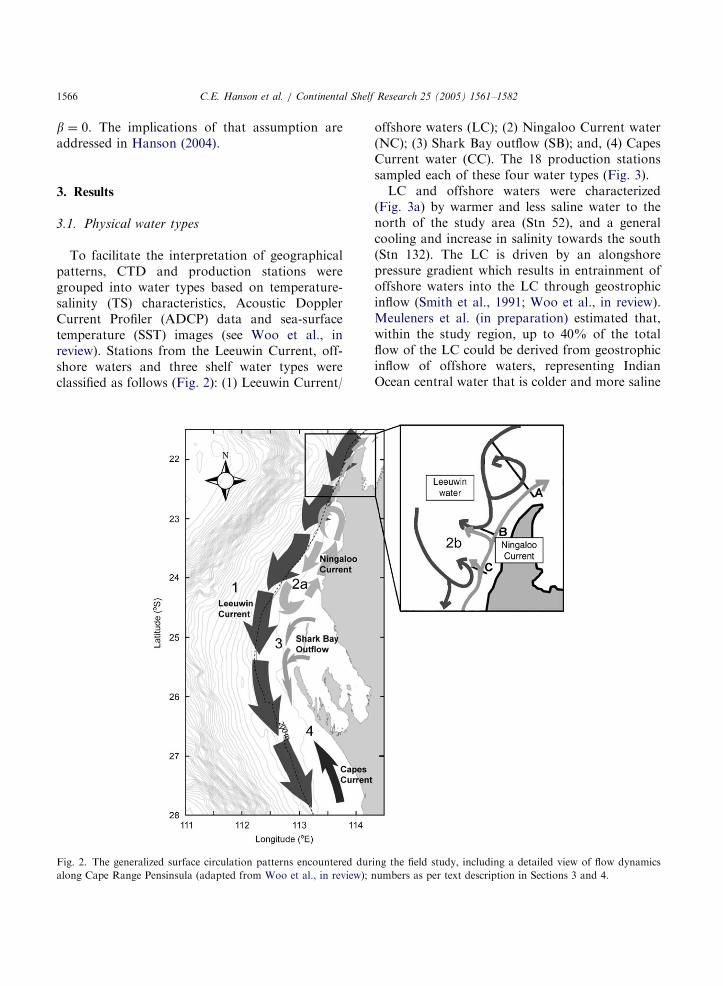
Fig. 2. The generalized surface circulation patterns encountered dur
along Cape Range Pensinsula (adapted from Woo et al., in review); n
offshore waters (LC); (2) Ningaloo Current water(NC); (3) Shark Bay outflow (SB); and, (4) CapesCurrent water (CC). The 18 production stationssampled each of these four water types (Fig. 3).LC and offshore waters were characterized
(Fig. 3a) by warmer and less saline water to thenorth of the study area (Stn 52), and a generalcooling and increase in salinity towards the south(Stn 132). The LC is driven by an alongshorepressure gradient which results in entrainment ofoffshore waters into the LC through geostrophicinflow (Smith et al., 1991; Woo et al., in review).Meuleners et al. (in preparation) estimated that,within the study region, up to 40% of the totalflow of the LC could be derived from geostrophicinflow of offshore waters, representing IndianOcean central water that is colder and more saline
ing the field study, including a detailed view of flow dynamics
umbers as per text description in Sections 3 and 4.
ARTICLE IN PRESS
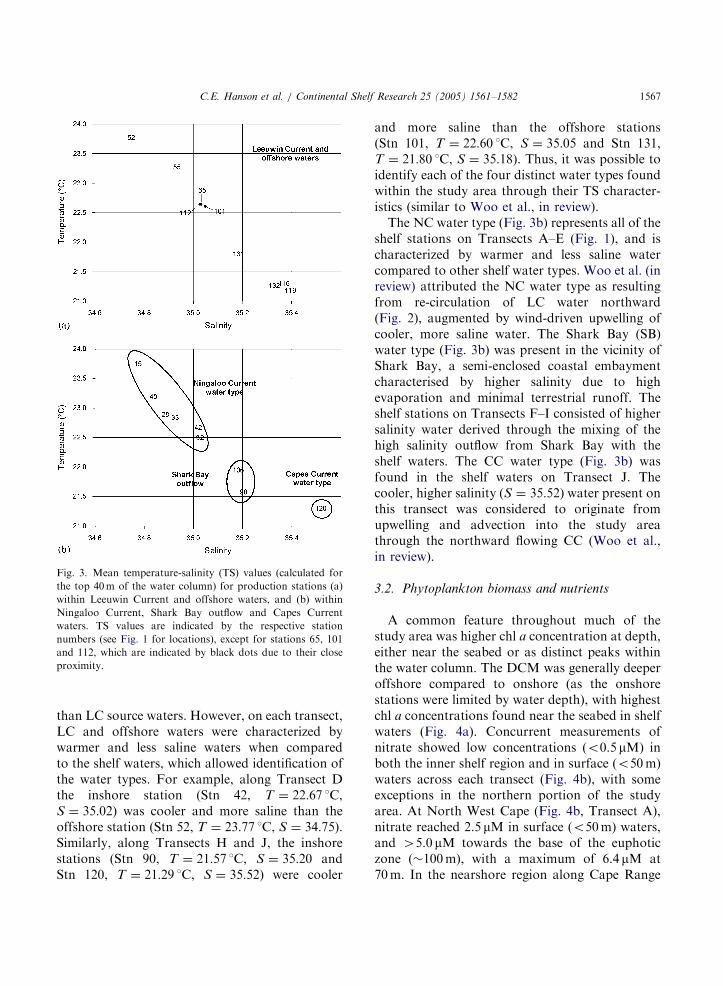
Fig. 3. Mean temperature-salinity (TS) values (calculated for
the top 40m of the water column) for production stations (a)
within Leeuwin Current and offshore waters, and (b) within
Ningaloo Current, Shark Bay outflow and Capes Current
waters. TS values are indicated by the respective station
numbers (see Fig. 1 for locations), except for stations 65, 101
and 112, which are indicated by black dots due to their close
proximity.
C.E. Hanson et al. / Continental Shelf Research 25 (2005) 1561–1582 1567
than LC source waters. However, on each transect,LC and offshore waters were characterized bywarmer and less saline waters when comparedto the shelf waters, which allowed identification ofthe water types. For example, along Transect Dthe inshore station (Stn 42, T ¼ 22:67 1C,S ¼ 35:02) was cooler and more saline than theoffshore station (Stn 52, T ¼ 23:77 1C, S ¼ 34:75).Similarly, along Transects H and J, the inshorestations (Stn 90, T ¼ 21:57 1C, S ¼ 35:20 andStn 120, T ¼ 21:29 1C, S ¼ 35:52) were cooler
and more saline than the offshore stations(Stn 101, T ¼ 22:60 1C, S ¼ 35:05 and Stn 131,T ¼ 21:80 1C, S ¼ 35:18). Thus, it was possible toidentify each of the four distinct water types foundwithin the study area through their TS character-istics (similar to Woo et al., in review).The NC water type (Fig. 3b) represents all of the
shelf stations on Transects A–E (Fig. 1), and ischaracterized by warmer and less saline watercompared to other shelf water types. Woo et al. (inreview) attributed the NC water type as resultingfrom re-circulation of LC water northward(Fig. 2), augmented by wind-driven upwelling ofcooler, more saline water. The Shark Bay (SB)water type (Fig. 3b) was present in the vicinity ofShark Bay, a semi-enclosed coastal embaymentcharacterised by higher salinity due to highevaporation and minimal terrestrial runoff. Theshelf stations on Transects F–I consisted of highersalinity water derived through the mixing of thehigh salinity outflow from Shark Bay with theshelf waters. The CC water type (Fig. 3b) wasfound in the shelf waters on Transect J. Thecooler, higher salinity (S ¼ 35:52) water present onthis transect was considered to originate fromupwelling and advection into the study areathrough the northward flowing CC (Woo et al.,in review).
3.2. Phytoplankton biomass and nutrients
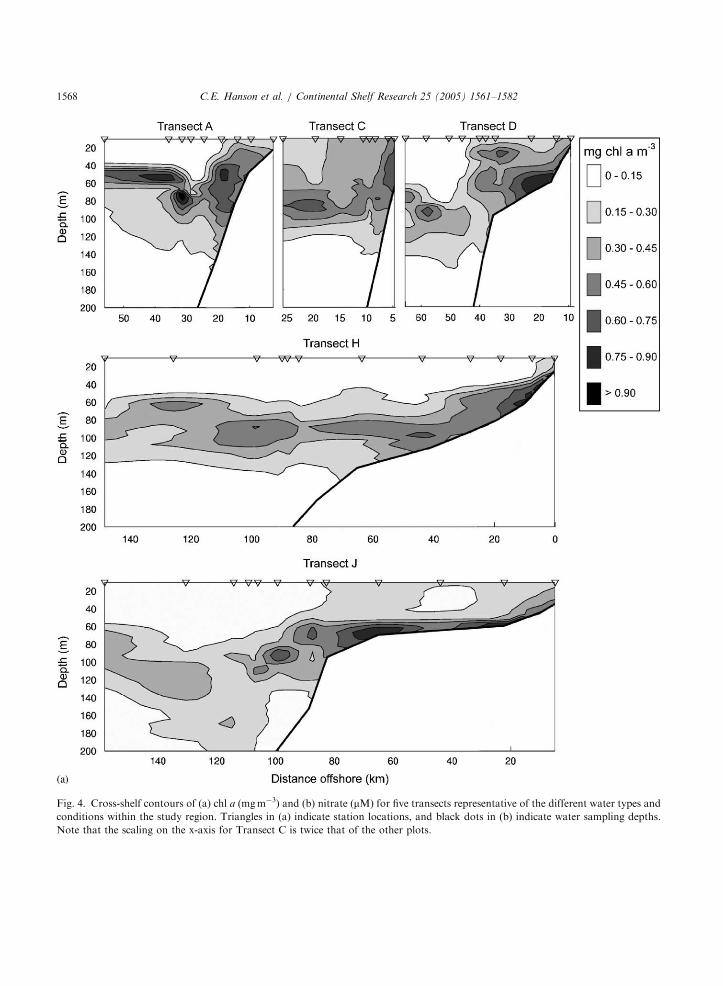
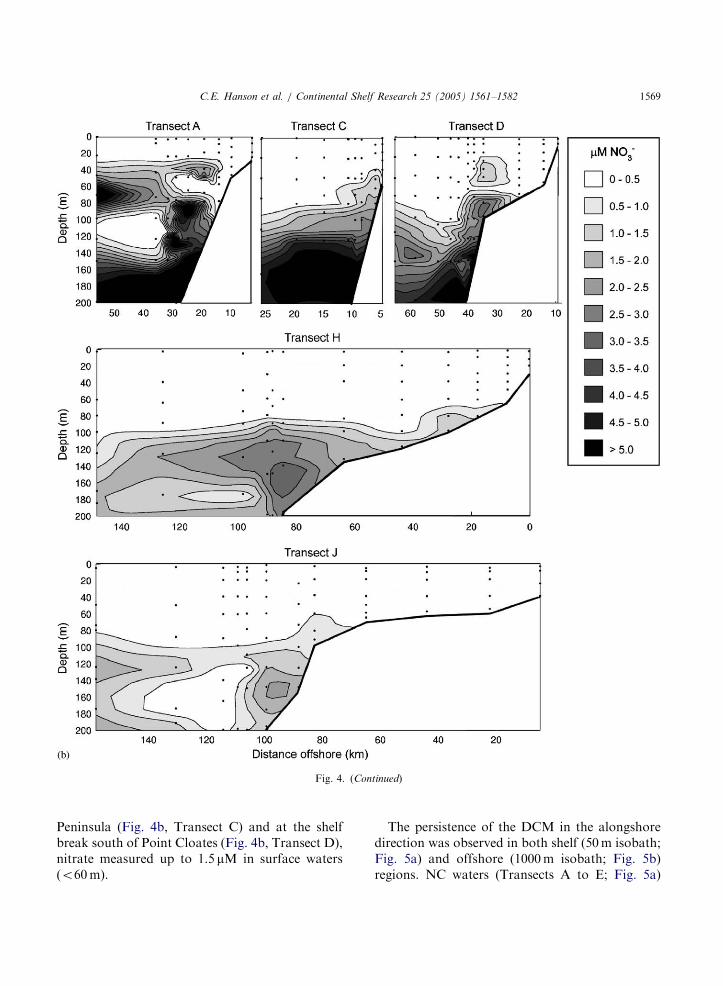
A common feature throughout much of thestudy area was higher chl a concentration at depth,either near the seabed or as distinct peaks withinthe water column. The DCM was generally deeperoffshore compared to onshore (as the onshorestations were limited by water depth), with highestchl a concentrations found near the seabed in shelfwaters (Fig. 4a). Concurrent measurements ofnitrate showed low concentrations (o0.5 mM) inboth the inner shelf region and in surface (o50m)waters across each transect (Fig. 4b), with someexceptions in the northern portion of the studyarea. At North West Cape (Fig. 4b, Transect A),nitrate reached 2.5 mM in surface (o50m) waters,and 45.0 mM towards the base of the euphoticzone (�100m), with a maximum of 6.4 mM at70m. In the nearshore region along Cape Range
ARTICLE IN PRESS
Fig. 4. Cross-shelf contours of (a) chl a (mgm�3) and (b) nitrate (mM) for five transects representative of the different water types and
conditions within the study region. Triangles in (a) indicate station locations, and black dots in (b) indicate water sampling depths.
Note that the scaling on the x-axis for Transect C is twice that of the other plots.
C.E. Hanson et al. / Continental Shelf Research 25 (2005) 1561–15821568
ARTICLE IN PRESS
Fig. 4. (Continued)
C.E. Hanson et al. / Continental Shelf Research 25 (2005) 1561–1582 1569
Peninsula (Fig. 4b, Transect C) and at the shelfbreak south of Point Cloates (Fig. 4b, Transect D),nitrate measured up to 1.5 mM in surface waters(o60m).
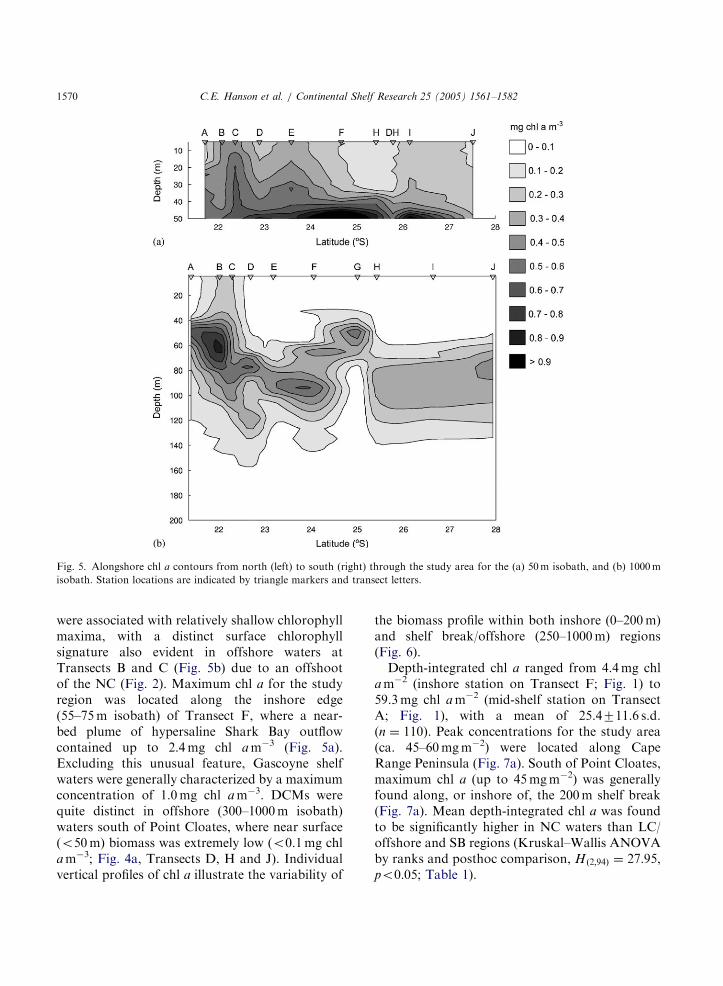
The persistence of the DCM in the alongshoredirection was observed in both shelf (50m isobath;Fig. 5a) and offshore (1000m isobath; Fig. 5b)regions. NC waters (Transects A to E; Fig. 5a)
ARTICLE IN PRESS
Fig. 5. Alongshore chl a contours from north (left) to south (right) through the study area for the (a) 50m isobath, and (b) 1000m
isobath. Station locations are indicated by triangle markers and transect letters.
C.E. Hanson et al. / Continental Shelf Research 25 (2005) 1561–15821570
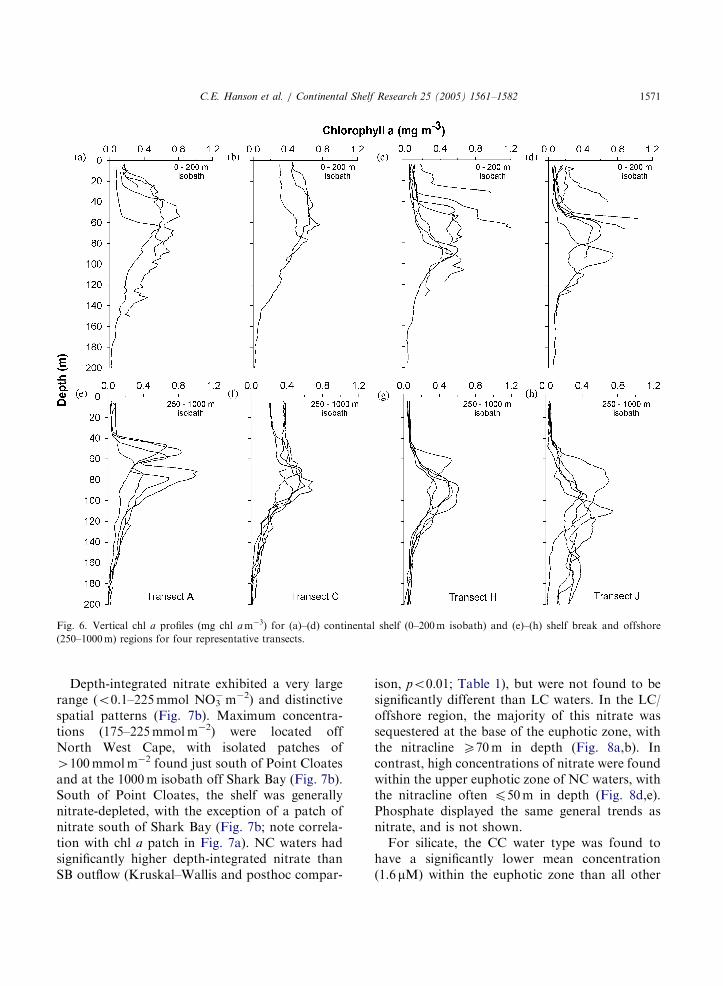
were associated with relatively shallow chlorophyllmaxima, with a distinct surface chlorophyllsignature also evident in offshore waters atTransects B and C (Fig. 5b) due to an offshootof the NC (Fig. 2). Maximum chl a for the studyregion was located along the inshore edge(55–75m isobath) of Transect F, where a near-bed plume of hypersaline Shark Bay outflowcontained up to 2.4mg chl am�3 (Fig. 5a).Excluding this unusual feature, Gascoyne shelfwaters were generally characterized by a maximumconcentration of 1.0mg chl am�3. DCMs werequite distinct in offshore (300–1000m isobath)waters south of Point Cloates, where near surface(o50m) biomass was extremely low (o0.1mg chlam�3; Fig. 4a, Transects D, H and J). Individualvertical profiles of chl a illustrate the variability of
the biomass profile within both inshore (0–200m)and shelf break/offshore (250–1000m) regions(Fig. 6).Depth-integrated chl a ranged from 4.4mg chl
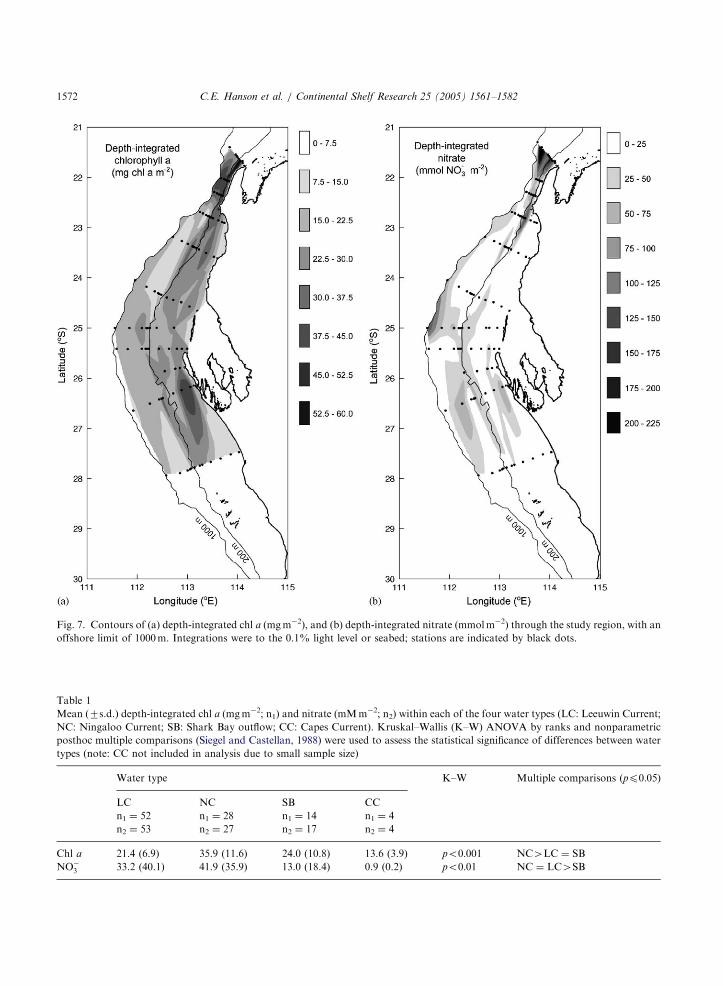
am�2 (inshore station on Transect F; Fig. 1) to59.3mg chl am�2 (mid-shelf station on TransectA; Fig. 1), with a mean of 25.4711.6 s.d.(n ¼ 110). Peak concentrations for the study area(ca. 45–60mgm�2) were located along CapeRange Peninsula (Fig. 7a). South of Point Cloates,maximum chl a (up to 45mgm�2) was generallyfound along, or inshore of, the 200m shelf break(Fig. 7a). Mean depth-integrated chl a was foundto be significantly higher in NC waters than LC/offshore and SB regions (Kruskal–Wallis ANOVAby ranks and posthoc comparison, H ð2;94Þ ¼ 27:95,po0:05; Table 1).
ARTICLE IN PRESS
Fig. 6. Vertical chl a profiles (mg chl am�3) for (a)–(d) continental shelf (0–200m isobath) and (e)–(h) shelf break and offshore
(250–1000m) regions for four representative transects.
C.E. Hanson et al. / Continental Shelf Research 25 (2005) 1561–1582 1571
Depth-integrated nitrate exhibited a very largerange (o0.1–225mmol NO3
�m�2) and distinctivespatial patterns (Fig. 7b). Maximum concentra-tions (175–225mmolm�2) were located offNorth West Cape, with isolated patches of4100mmolm�2 found just south of Point Cloatesand at the 1000m isobath off Shark Bay (Fig. 7b).South of Point Cloates, the shelf was generallynitrate-depleted, with the exception of a patch ofnitrate south of Shark Bay (Fig. 7b; note correla-tion with chl a patch in Fig. 7a). NC waters hadsignificantly higher depth-integrated nitrate thanSB outflow (Kruskal–Wallis and posthoc compar-
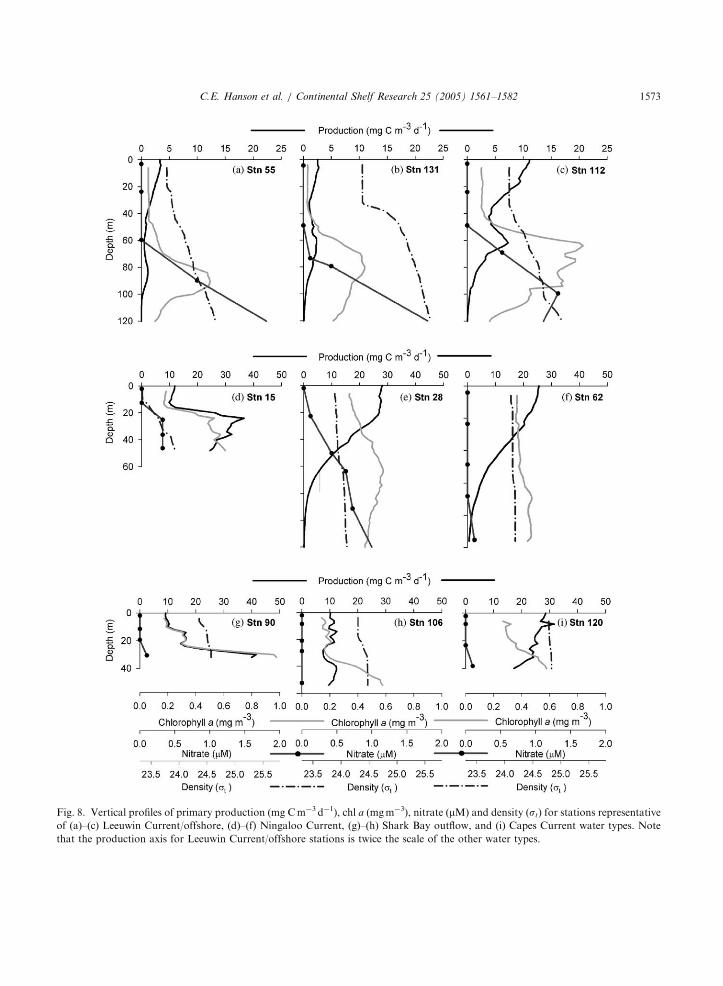
ison, po0:01; Table 1), but were not found to besignificantly different than LC waters. In the LC/offshore region, the majority of this nitrate wassequestered at the base of the euphotic zone, withthe nitracline X70m in depth (Fig. 8a,b). Incontrast, high concentrations of nitrate were foundwithin the upper euphotic zone of NC waters, withthe nitracline often p50m in depth (Fig. 8d,e).Phosphate displayed the same general trends asnitrate, and is not shown.For silicate, the CC water type was found to
have a significantly lower mean concentration(1.6 mM) within the euphotic zone than all other
ARTICLE IN PRESS
Fig. 7. Contours of (a) depth-integrated chl a (mgm�2), and (b) depth-integrated nitrate (mmolm�2) through the study region, with an
offshore limit of 1000m. Integrations were to the 0.1% light level or seabed; stations are indicated by black dots.
Table 1
Mean (7s.d.) depth-integrated chl a (mgm�2; n1) and nitrate (mMm�2; n2) within each of the four water types (LC: Leeuwin Current;
NC: Ningaloo Current; SB: Shark Bay outflow; CC: Capes Current). Kruskal–Wallis (K–W) ANOVA by ranks and nonparametric
posthoc multiple comparisons (Siegel and Castellan, 1988) were used to assess the statistical significance of differences between water
types (note: CC not included in analysis due to small sample size)
Water type K–W Multiple comparisons (pp0:05)
LC NC SB CC
n1 ¼ 52 n1 ¼ 28 n1 ¼ 14 n1 ¼ 4
n2 ¼ 53 n2 ¼ 27 n2 ¼ 17 n2 ¼ 4
Chl a 21.4 (6.9) 35.9 (11.6) 24.0 (10.8) 13.6 (3.9) po0:001 NC4LC ¼ SB
NO�3 33.2 (40.1) 41.9 (35.9) 13.0 (18.4) 0.9 (0.2) po0:01 NC ¼ LC4SB
C.E. Hanson et al. / Continental Shelf Research 25 (2005) 1561–15821572
ARTICLE IN PRESS
Fig. 8. Vertical profiles of primary production (mg Cm�3 d�1), chl a (mgm�3), nitrate (mM) and density (st) for stations representative
of (a)–(c) Leeuwin Current/offshore, (d)–(f) Ningaloo Current, (g)–(h) Shark Bay outflow, and (i) Capes Current water types. Note
that the production axis for Leeuwin Current/offshore stations is twice the scale of the other water types.
C.E. Hanson et al. / Continental Shelf Research 25 (2005) 1561–1582 1573
ARTICLE IN PRESS
C.E. Hanson et al. / Continental Shelf Research 25 (2005) 1561–15821574
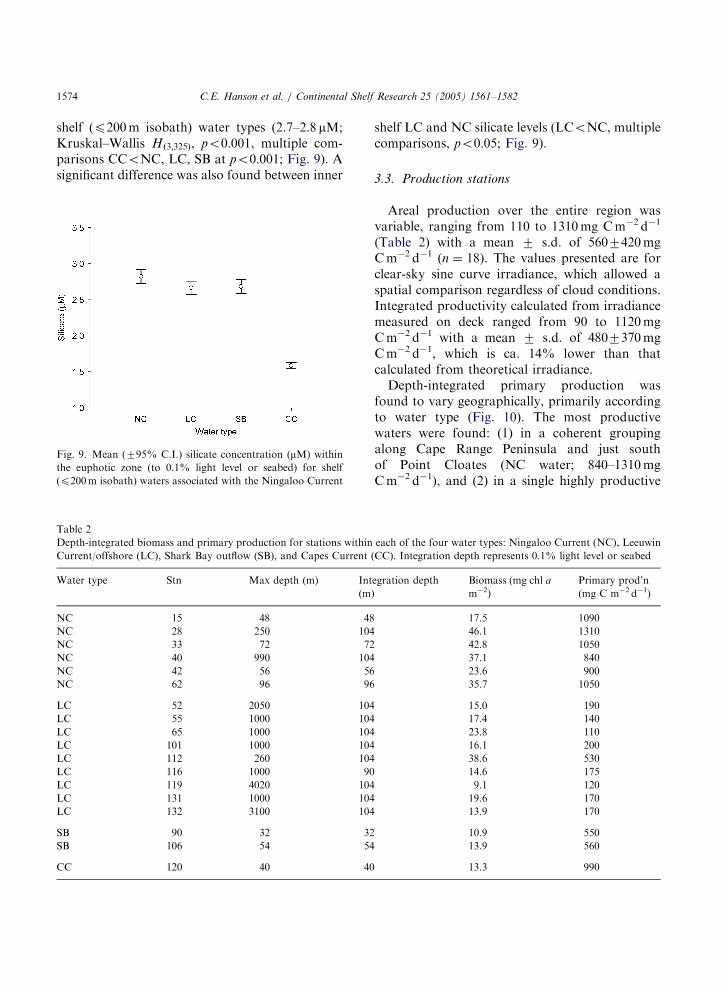
shelf (p200m isobath) water types (2.7–2.8 mM;Kruskal–Wallis H ð3;325Þ, po0:001, multiple com-parisons CCoNC, LC, SB at po0:001; Fig. 9). Asignificant difference was also found between inner
Fig. 9. Mean (795% C.I.) silicate concentration (mM) within
the euphotic zone (to 0.1% light level or seabed) for shelf
(p200m isobath) waters associated with the Ningaloo Current
Table 2
Depth-integrated biomass and primary production for stations within
Current/offshore (LC), Shark Bay outflow (SB), and Capes Current (
Water type Stn Max depth (m) Int
(m)
NC 15 48 48
NC 28 250 104
NC 33 72 72
NC 40 990 104
NC 42 56 56
NC 62 96 96
LC 52 2050 104
LC 55 1000 104
LC 65 1000 104
LC 101 1000 104
LC 112 260 104
LC 116 1000 90
LC 119 4020 104
LC 131 1000 104
LC 132 3100 104
SB 90 32 32
SB 106 54 54
CC 120 40 40
shelf LC and NC silicate levels (LCoNC, multiplecomparisons, po0:05; Fig. 9).
3.3. Production stations
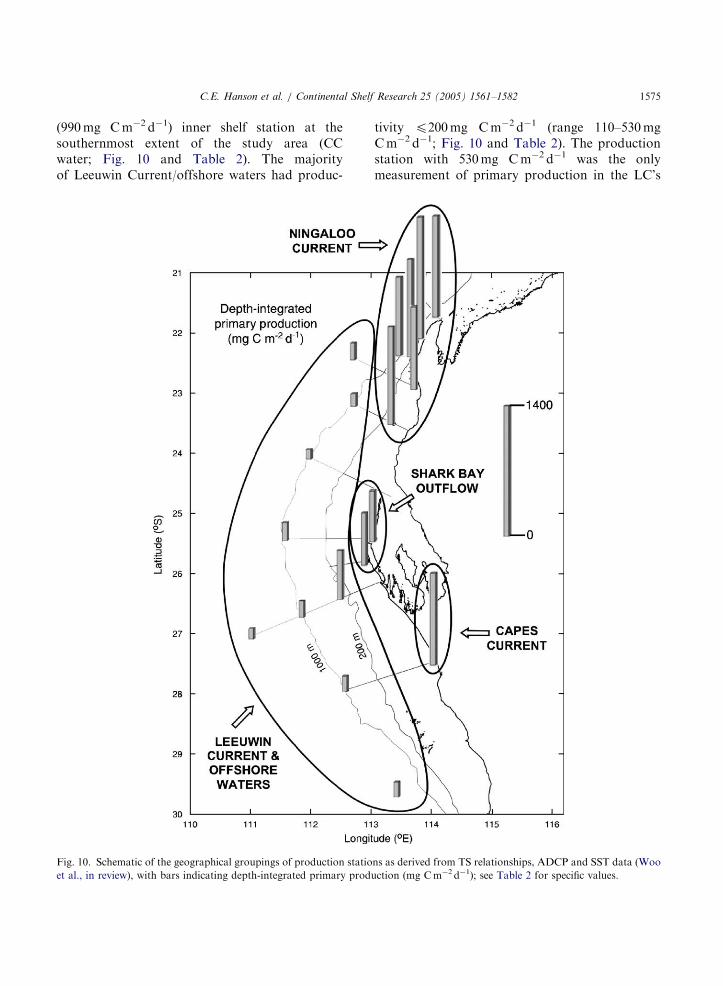
Areal production over the entire region wasvariable, ranging from 110 to 1310mg Cm�2 d�1
(Table 2) with a mean 7 s.d. of 5607420mgCm�2 d�1 (n ¼ 18). The values presented are forclear-sky sine curve irradiance, which allowed aspatial comparison regardless of cloud conditions.Integrated productivity calculated from irradiancemeasured on deck ranged from 90 to 1120mgCm�2 d�1 with a mean 7 s.d. of 4807370mgCm�2 d�1, which is ca. 14% lower than thatcalculated from theoretical irradiance.Depth-integrated primary production was
found to vary geographically, primarily accordingto water type (Fig. 10). The most productivewaters were found: (1) in a coherent groupingalong Cape Range Peninsula and just southof Point Cloates (NC water; 840–1310mgCm�2 d�1), and (2) in a single highly productive
each of the four water types: Ningaloo Current (NC), Leeuwin
CC). Integration depth represents 0.1% light level or seabed
egration depth Biomass (mg chl a
m�2)
Primary prod’n
(mg C m�2 d�1)
17.5 1090
46.1 1310
42.8 1050
37.1 840
23.6 900
35.7 1050
15.0 190
17.4 140
23.8 110
16.1 200
38.6 530
14.6 175
9.1 120
19.6 170
13.9 170
10.9 550
13.9 560
13.3 990
ARTICLE IN PRESS
C.E. Hanson et al. / Continental Shelf Research 25 (2005) 1561–1582 1575
(990mg Cm�2 d�1) inner shelf station at thesouthernmost extent of the study area (CCwater; Fig. 10 and Table 2). The majorityof Leeuwin Current/offshore waters had produc-
Fig. 10. Schematic of the geographical groupings of production statio
et al., in review), with bars indicating depth-integrated primary produ
tivity p200mg Cm�2 d�1 (range 110–530mgCm�2 d�1; Fig. 10 and Table 2). The productionstation with 530mg Cm�2 d�1 was the onlymeasurement of primary production in the LC’s
ns as derived from TS relationships, ADCP and SST data (Woo
ction (mg Cm�2 d�1); see Table 2 for specific values.
ARTICLE IN PRESS
C.E. Hanson et al. / Continental Shelf Research 25 (2005) 1561–15821576
core (Stn 112, at the 250m isobath on Transect I);all other LC/offshore stations were X1000mdepth. Shark Bay outflow was characterized byintegrated productivity between 550 and 560mgCm�2 d�1 (Fig. 10). Grouped together, shelf/countercurrent waters (NC, SB, CC) were sig-nificantly more productive (Mann–Whitney test,po0:001) than Leeuwin Current/offshore regions.
Vertical profiles of primary production, chl a,nitrate and density indicate variation both be-tween, and within, water types (Fig. 8). LeeuwinCurrent/offshore waters were characterised bywell-defined deep chlorophyll maxima located nearthe nitracline (Fig. 8a–c). These DCMs were often(�60% of stations) associated with deep peaks inproductivity, although maximum production rateswere generally found in near-surface waters.Station 112 (from the shelf break on Transect I;Fig. 1) had the shallowest nitracline (57m) of allLC/offshore production stations (Fig. 8c).
The water column was fairly well-mixed at NCproduction stations, and chlorophyll profiles hadless distinct subsurface peaks than in LC/offshoreregions (Fig. 8e,f). Station 15 (on Transect A off
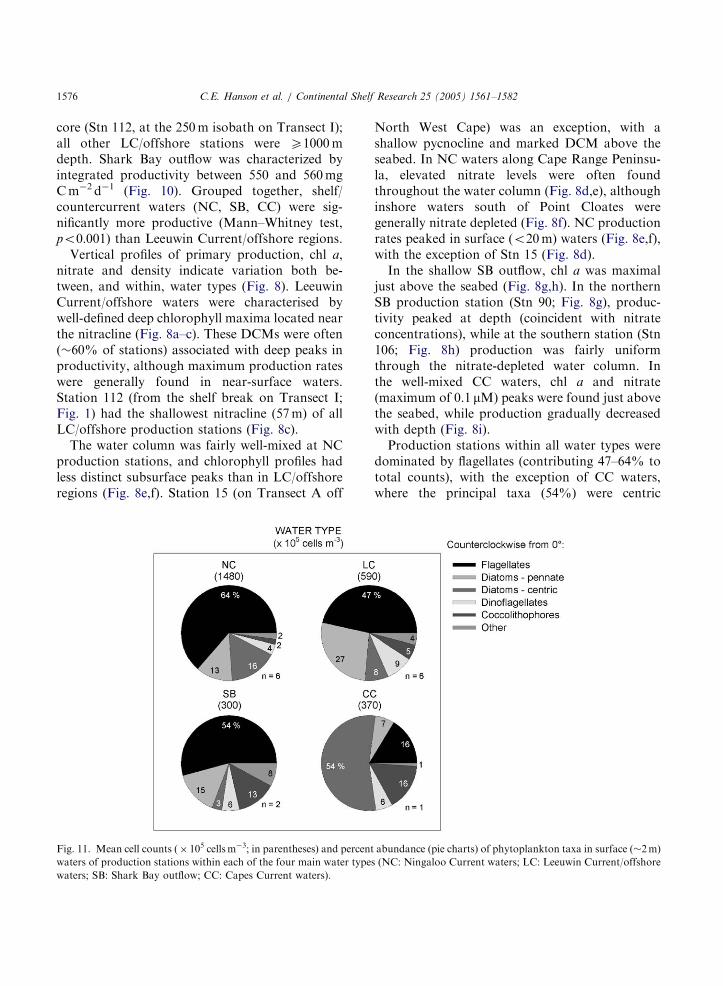
Fig. 11. Mean cell counts (� 105 cellsm�3; in parentheses) and percent
waters of production stations within each of the four main water types
waters; SB: Shark Bay outflow; CC: Capes Current waters).
North West Cape) was an exception, with ashallow pycnocline and marked DCM above theseabed. In NC waters along Cape Range Peninsu-la, elevated nitrate levels were often foundthroughout the water column (Fig. 8d,e), althoughinshore waters south of Point Cloates weregenerally nitrate depleted (Fig. 8f). NC productionrates peaked in surface (o20m) waters (Fig. 8e,f),with the exception of Stn 15 (Fig. 8d).In the shallow SB outflow, chl a was maximal
just above the seabed (Fig. 8g,h). In the northernSB production station (Stn 90; Fig. 8g), produc-tivity peaked at depth (coincident with nitrateconcentrations), while at the southern station (Stn106; Fig. 8h) production was fairly uniformthrough the nitrate-depleted water column. Inthe well-mixed CC waters, chl a and nitrate(maximum of 0.1 mM) peaks were found just abovethe seabed, while production gradually decreasedwith depth (Fig. 8i).Production stations within all water types were
dominated by flagellates (contributing 47–64% tototal counts), with the exception of CC waters,where the principal taxa (54%) were centric
abundance (pie charts) of phytoplankton taxa in surface (�2m)
(NC: Ningaloo Current waters; LC: Leeuwin Current/offshore
ARTICLE IN PRESS
C.E. Hanson et al. / Continental Shelf Research 25 (2005) 1561–1582 1577
diatoms (Fig. 11). In all cases, diatoms (centric+pennate) were numerically dominant over dino-flagellates, although in LC and Shark Bay waters,pennate diatoms were more numerous than centricspecies (Fig. 11). Relatively high percentages ofcoccolithophores were noted in CC and SB surfacewaters (16% and 13%, respectively). The highestmean cell counts (1480� 105 cellsm�3) were foundin NC waters (Fig. 11).
4. Discussion
In this early austral summer field study, theGascoyne continental shelf was found to be aregion of dynamic physical oceanographic pro-cesses, a detailed description of which is presentedin Woo et al. (in review) and summarized in Fig. 2.The key features include:
(1)
the southward-flowing LC, generally centredalong the shelf break (�200m isobath) andassociated with downwelling south of PointCloates;(2)
the NC, (a) sourced from re-circulated LCwaters south of Point Cloates, and (b) aug-mented by upwelling (with a contribution fromcolder water below the LC) and mixing withLC waters via coastal offshoots along CapeRange Peninsula;(3)
hypersaline Shark Bay (SB) outflow, whichmixed with LC water and formed a distinctivewater mass that flowed poleward from SharkBay; and,(4)
the northern extension of the CC, encounteredon the inner shelf at the southern limit of thestudy region (Fig. 2).While our field study consisted of only twoweeks of measurements, these physical dynamicscan be considered fairly typical of early summer(November–December) conditions within this re-gion based on the observed persistent southerlywind field (Woo et al., in review) that bothgenerates the inshore countercurrents (Pearce andPattiaratchi, 1999; Taylor and Pearce, 1999) andslows the Leeuwin Current’s southward progres-sion during this season (Godfrey and Ridgway,
1985). An exception to this was the presence of thesouthward-flowing mixed coastal water mass offShark Bay, which was generated by a short periodof anomalous northerly winds off the Shark Bayregion and may not be a regular occurrence (Wooet al., in review).The following discussion investigates how the
physical processes summarized above directlyaffect phytoplankton biomass distributions, ratesof primary production and species composition.First, we compare our biomass estimates andproduction rates with historical values and thosefrom other regions, and second we elucidateregional patterns in the coupling of physical andbiological processes along the Gascoyne shelf. Wethen consider the implications of our findings forhigher trophic levels.
4.1. Biomass and production rates in context
This study provides a much more detailedspatial examination of phytoplankton biomassand primary production than has previously beenundertaken along the Gascoyne continental shelf,and updates historical estimates for the region.The majority of LC and offshore stations hadproductivity levels below 200mg Cm�2 d�1, simi-lar to waters of the Coral Sea (Furnas andMitchell, 1996), the eastern Mediterranean (Igna-tiades et al., 2002) and the North Pacific gyre(Hayward et al., 1983); this eastern boundarycurrent was therefore strongly oligotrophic (de-fined aso270mg Cm�2 d�1; Nixon, 1995). Aver-age LC/offshore phytoplankton biomass (ca.21mg chl am�2) was also characteristic of lowproductivity oceanic waters of the Indian, Pacificand Atlantic Oceans (ca. 20–28mg chl am�2;Humphrey, 1966; Dandonneau and Lemasson,1987; Maranon et al., 2000). Historical values forthe Gascoyne region (ca. 5–20mg chl am�2 and100–250mg Cm�2 d�1; Humphrey, 1966 andKoblentz-Mishke et al., 1970) are mainly indica-tive of offshore waters due to inadequate coverageof the continental shelf region, and are thuscomparable to the majority of our LC/offshoremeasurements.Primary production rates in coastal counter-
current waters (Ningaloo and Capes Currents)
ARTICLE IN PRESS
C.E. Hanson et al. / Continental Shelf Research 25 (2005) 1561–15821578
ranged from 840 to 1310mg Cm�2 d�1, althoughthese values may have been underestimated due tothe non-saturating light levels (UNSAT condi-tions) employed with the NC samples. Yet evenwith this conservative estimate, such levels ofproduction are regionally significant for theGascoyne region, although are towards the lowerend of measurements from upwelling-influencedzones off California (500–2600mg Cm�2 d�1;Pilskaln et al., 1996), NW Spain (400–3700mgCm�2 d�1; Tilstone et al., 1999), and southernAfrica (1000–3500mg Cm�2 d�1; Brown et al.,1991). Phytoplankton biomass in such upwellingregions can reach ca. 120–180mg chl am�2
(Brown and Field, 1986; Basterretxea and Aris-tegui, 2000). In comparison, the maximum depth-integrated chl a in our study was about half thisamount (59mg chl am�2), and associated with theupwelling-influenced NC water off North WestCape. Thus, although the equatorward summercountercurrents can offset the regional dominanceof the LC along the Gascoyne coast (withproduction levels up to five times greater thanhistorical estimates for the area), their productivityduring the early summer of 2000/01 was consider-ably less than upwelling regimes along othereastern ocean boundaries.
4.2. Regional patterns in coupled
physical– biological processes
The LC is a well-documented feature of the westcoast of WA (Pearce, 1991; Woo et al., in review),and nitrate and phosphate concentrations in themixed layer of the LC are known to beo0.2 mM(Pearce, 1997), similar to offshore surface watersof the Indian Ocean (Rochford, 1980). Thenutricline within the LC can be between 70 and200m deep (this study and Pearce, 1997), and theprevalence of downwelling along the coast of WAis thought to prevent deep nutrient concentrationsfrom reaching surface waters (Pearce, 1991).
However, in the early summer of 2000/01, bothlocalized upwelling and mixing associated withseaward offshoots along Cape Range Peninsularesulted in high nitrate concentrations in theeuphotic zone. These nutrients were most likelysourced from the nutricline at the base of the
Leeuwin Current, given the close proximity of NCand LC waters along the peninsula (Woo et al., inreview). This region has both the narrowest shelf(6–17 km) and steepest shelf break found in anypart of the study area, and this bathymetry iscritical in bringing the opposing flows in closecontact with each other and enhancing mixing(Woo et al., in review). Maximum nitrate levelswithin the euphotic zone reached approximately2–6 mM along Cape Range Peninsula and at theshelf break just south of Point Cloates. This inputof ‘new’ nitrogen was linked with substantialcarbon uptake rates (840–1310mg Cm�2 d�1)and high phytoplankton cell counts. But overallnutrient enrichment levels, and consequent pri-mary productivity, are likely capped in this regionby the presence of the Leeuwin Current.The depth of the LC’s nutrient-depleted mixed
layer governs nutrient concentrations within up-welled water, as suggested by Gersbach et al.(1999) in relation to CC upwelling off south-western WA. In that case, upwelled water from thebase of the LC contained 0.4 mM nitrate (Gersbachet al., 1999). This is an order of magnitude lessthan our observations off northwestern WA, andindicates the potential variability of the upwellingresponse associated with these equatorward coun-tercurrents. This interpretation is, however, com-plicated by the concurrent uptake of nutrients byphytoplankton. Yet there is enough evidence toindicate that the strength and position of theLeeuwin Current, and the depth of its mixed layer,varies both spatially (Smith et al., 1991) andtemporally (Godfrey and Ridgway, 1985; Pearceand Phillips, 1988; Feng et al., 2003) along thewest coast of WA. We therefore hypothesize thatthe biological impact of any upwelling in thisregion is expected to be a function of: (a) the depthof the LC’s nutrient-depleted upper layer (asinfluenced by mixing and the rate of phytoplank-ton consumption), (b) the strength and duration ofupwelling-favorable winds (i.e. the intensity ofupwelling), and (c) geographical location, primar-ily with respect to the width of the continentalshelf and resultant proximity of upwelling flows todeep nutrient pools.In contrast to the active upwelling and mixing
processes identified at North West Cape, the
ARTICLE IN PRESS
C.E. Hanson et al. / Continental Shelf Research 25 (2005) 1561–1582 1579
northward-flowing CC water type (located on theinner shelf at the southern extent of the study area)was postulated to consist of previously upwelledwater advected from beyond the study region(Woo et al., in review). The low nitrate/highproductivity signature associated with this flow isconsistent with an aging upwelled water mass(Dugdale et al., 1990). This case is also supportedby our observations of low silicate levels and ahigh proportion of centric diatoms within CCsurface waters (Kudela et al., 1997; Tilstone et al.,2000). Carbon uptake rates in upwelling zones areknown to peak a number of days after nitrateenrichment occurs (Kudela et al., 1997), given thephysiological time lag between nitrate uptake andutilization by phytoplankton (Collos and Slawyk,1980). Intracellular storage of nitrate can occur inmarine microalgae and may, under some condi-tions, provide a buffer during low-nitrate condi-tions (Bode et al., 1997). However, of much greaterimportance during the later stages of upwellingevents is the shift from ‘new’ to ‘regenerated’forms of nitrogen (Dugdale and Goering, 1967), asseen in the upwelling regions off Spain (Bode andVarela, 1994) and California (Kudela et al., 1997).Accordingly, measurement of ammonium and/orurea concentrations in the study area wouldprovide an important connection between nutrientdynamics and production, both in the CC and inthe nitrate-depleted inner shelf waters south ofPoint Cloates.
In addition to dynamics associated with loca-lized upwelling, processes at the shelf break werealso found to be of biological importance duringour study period. South of Point Cloates, the200m isobath essentially formed the boundarybetween high biomass (15.0–45.0mg chl am�2)continental shelf waters and lower biomass(7.5–22.5mg chl m�2) offshore waters, similar tothe observations of Pattiaratchi et al. (unpublisheddata). A band of relatively high depth-integratednitrate was located along much of the shelf break(reflective of a shoaling of the nitracline evident inthe cross-shelf nitrate contours), and providedsome evidence for potential alleviation of oligo-trophic conditions within the Leeuwin Current.While the bulk of the LC/offshore productionstations were located along the 1000m isobath,
one station was situated at the shelf break (Stn 112on Transect I), where the LC’s core flow (max-imum velocity) occurred (Woo et al., in review).Relatively high biomass (38.6mg chl am�2) andprimary production (530mg Cm�2 d�1) at thisstation provides a further example of the possibleimpact of shelf break processes on phytoplanktondynamics. Current shear between LC and shelfwaters has been observed (Pearce and Griffiths,1991) and modelled (Meuleners et al., in prepara-tion) along this boundary, and LC meanders canentrain significant amounts of shelf water (Pattiar-atchi et al., unpublished data). Thus, the shelfbreak can be an area of active mixing, and we inferthat this may promote nutrient fluxes into theeuphotic zone and fuel localized production andbiomass peaks.
4.3. Implications of biomass and productivity
patterns for community ecology
This study has highlighted the seasonal NCwaters as a ‘hotspot’ for primary production offWestern Australia; the same may be true of CCwaters, although limited data in the southernregion does not allow us to draw this conclusionwithout further investigation. The uniqueness ofthe Ningaloo area has been known for some time,as it is the site of the only substantial coralreef system found on the west coast of a continent(Taylor and Pearce, 1999) and attracts a numberof megafauna (including whale sharks andmanta rays; Taylor, 1994). Dense schools ofzooplankton are seasonally common in this region,and Wilson et al. (2002) proposed that upwellingnear North West Cape might drive the productionof large euphausiid populations off Ningalooreef. While we postulate that the high primaryproduction measured in this region was generatedlocally in the nutrient-enriched water along CapeRange Peninsula, we must also consider theinfluence of shelf circulation within this region.As discussed in Woo et al. (in review), thenorthward branching of the eddy at Point Cloatespartly contributed to the NC flow along thepeninsula, and may have advected productivewaters into the region. It is clear from ourmeasurements that the waters bordering Ningaloo
ARTICLE IN PRESS
C.E. Hanson et al. / Continental Shelf Research 25 (2005) 1561–15821580
reef can be highly productive, and that thishigh productivity and levels of phytoplanktonbiomass are potential links between nutrientenrichment (from coastal upwelling and/or othermixing processes) and the high secondary produc-tivity within this region, with such nutrientinputs generally supporting a shorter food chainthan found in oligotrophic waters (Cushing,1989). The elevated proportion of centric diatomsat NC production stations provides some supportfor this theory, as even though flagellateswere numerically dominant in NC waters, theirrelative contribution to total biomass wouldlikely be fairly low given their small size(similar to observations in the Iberian upwellingsystem; Joint et al., 2001). Studies that examinesize-fractionated primary production, in conjunc-tion with the seasonality of nutrient enrichmentand secondary productivity, would be the nextstep in elucidating the ecological processes ofthis region.
5. Conclusions
In this paper, we investigated early summerprimary production regimes, as linked with me-soscale physical processes and nutrient dynamics,along a broad stretch of the Western Australiancoastline. While large-scale upwelling is incompa-tible with the poleward flowing Leeuwin Current,localized seasonal upwelling associated with innershelf countercurrents has been demonstrated forboth the Ningaloo (Woo et al., in review) andCapes Currents (Gersbach et al., 1999). We foundthat primary production associated with theseseasonal equatorward flows was of regionalsignificance, and we hypothesize that nutrientenrichment associated with these currents may bea function of geographical location, intensity ofthe upwelling flow, and depth of the LeeuwinCurrent’s nutricline. Mixing and/or current shearalong the 200m shelf break, which separated highbiomass continental shelf waters from low biomassoffshore waters, was also considered an importantprocess leading to peaks in productivity along thisotherwise oligotrophic coast.
Acknowledgements
We thank the Captain, crew and scientificsupport staff of the RV Franklin for the successfulexecution of Cruise FR10/00, and the shipboardscientific party (T. Koslow, B. Nahas, W. Schroe-der, P. Thompson, M. Woo) for their assistanceand constructive discussions. B. Griffiths (CSIROMarine Research) is thanked both for the use ofthe photosynthetron equipment and for thedetailed training provided to CH. D. Griffin(CSIRO Marine Research) supplied real-timesatellite imagery, and the staff at CMR DataCentre (particularly T. Byrne, G. Critchley andB. Beattie) provided extensive assistance with theCTD and hydrology datasets. B. Alexander andJ. McLaughlin are thanked for pre- and post-cruise technical support, and I. Jameson (CSIRO)for phytoplankton taxonomic analysis. Criticalcomments by S. Pesant, W. Schroeder, M. Inalland one anonymous reviewer significantly im-proved the manuscript. Financial assistance wasprovided by a UWA Research Grant, a UWA ViceChancellor’s Discretionary Grant, and an Inter-national Postgraduate Research Scholarship/Uni-versity Postgraduate Award (to CH). Thiscontribution is Centre for Water Research refer-ence ED1874.
References
Basterretxea, G., Aristegui, J., 2000. Mesoscale variability in
phytoplankton biomass distribution and photosynthetic
parameters in the Canary-NW African coastal transition
zone. Marine Ecology-Progress Series 197, 27–40.
Bode, A., Varela, M., 1994. Planktonic carbon and nitrogen
budgets for the N-NW Spanish shelf: the role of pelagic
nutrient regeneration during upwelling events. Scientia
Marina 58 (3), 221–231.
Bode, A., Botas, J.A., Fernandez, E., 1997. Nitrate storage by
phytoplankton in a coastal upwelling environment. Marine
Biology 129, 399–406.
Brown, P.C., Field, J.G., 1986. Factors limiting phytoplankton
production in a nearshore upwelling area. Journal of
Plankton Research 8 (1), 55–68.
Brown, P.C., Painting, S.J., Cochraine, K.L., 1991. Estimates
of phytoplankton and bacterial biomass and production in
the northern and southern Benguela ecosystems. South
African Journal of Marine Science 11, 537–564.
ARTICLE IN PRESS
C.E. Hanson et al. / Continental Shelf Research 25 (2005) 1561–1582 1581
Caputi, N., Fletcher, W.J., Pearce, A., Chubb, C.F., 1996.
Effect of the Leeuwin Current on the recruitment of fish and
invertebrates along the Western Australian coast. Marine
and Freshwater Research 47, 147–155.
Caputi, N., Chubb, C., Pearce, A., 2001. Environmental effects
on recruitment of the western rock lobster, Panulirus cygnus.
Marine and Freshwater Research 52, 1167–1174.
Collos, Y., Slawyk, G., 1980. Nitrogen uptake and assimilation
by marine phytoplankton. In: Falkowski, P.G. (Ed.),
Primary Productivity in the Sea. Plenum Press, London,
pp. 195–211.
Cushing, D.H., 1989. A difference in structure between
ecosystems in strongly stratified waters and those that are
only weakly stratified. Journal of Plankton Research 11,
1–13.
Dandonneau, Y., Lemasson, L., 1987. Water-column chlor-
ophyll in an oligotrophic environment: correction for the
sampling depths and variations of the vertical structure of
density, and observation of a growth period. Journal of
Plankton Research 9, 215–234.
Dugdale, R.C., Goering, J.J., 1967. Uptake of new and
regenerated forms of nitrogen in primary productivity.
Limnology and Oceanography 12, 196–206.
Dugdale, R.C., Wilkerson, F.P., Morel, A., 1990. Realization
of new production in coastal upwelling areas: a means to
compare relative performance. Limnology and Oceanogra-
phy 35, 822–829.
FAO, 1981. Atlas of the Living Resources of the Sea. Food and
Agricultural Organisation, Fisheries Department.
Feng, M., Meyers, G., Pearce, A., Wijffels, S., 2003. Annual
and interannual variations of the Leeuwin Current at 321S.
Journal of Geophysical Research 108 (C11), 19-1–19-21.
Furnas, M.J., Mitchell, A.W., 1996. Pelagic primary production
in the Coral and southern Solomon Seas. Marine and
Freshwater Research 47, 695–706.
Gersbach, G.H., Pattiaratchi, C.B., Ivey, G.N., Cresswell,
G.R., 1999. Upwelling on the south-west coast of Austra-
lia—source of the Capes Current? Continental Shelf
Research 19, 363–400.
Godfrey, J.S., Ridgway, K.R., 1985. The large-scale environ-
ment of the poleward-flowing Leeuwin Current, Western
Australia: longshore steric height gradients, wind stresses
and geostrophic flow. Journal of Physical Oceanography 15,
481–495.
Griffin, D.A., Wilkin, J.L., Chubb, C.F., Pearce, A.F., Caputi,
N., 2001. Ocean currents and the larval phase of Australian
western rock lobster, Panulirus cygnus. Marine and Fresh-
water Research 52, 1187–1199.
Hanson, C.E., 2004. Oceanographic Forcing of Phytoplankton
Dynamics in the Coastal Eastern Indian Ocean. Ph.D.
Thesis, University of Western Australia, Perth, WA.
Hayward, T.L., Venrick, E.L., McGowan, J.A., 1983. Environ-
mental heterogeneity and plankton community structure in
the central North Pacific. Journal of Marine Research 41,
711–729.
Humphrey, G.F., 1966. The concentration of chlorophylls a
and c in the south-east Indian Ocean. Marine and Fresh-
water Research 17, 135–145.
Humphrey, G.F., 1978. The recalculation of marine chlorophyll
concentrations with special reference to Australian waters.
Marine and Freshwater Research 29, 409–416.
Ignatiades, L., Psarra, S., Zervakis, V., Pagou, K., Souverme-
zoglou, E., Assimakopoulou, G., Gotsis-Skretas, O., 2002.
Phytoplankton size-based dynamics in the Aegean Sea
(Eastern Mediterranean). Journal of Marine Systems 36,
11–28.
Jitts, H.R., 1969. Seasonal variations in the Indian Ocean along
110E. IV. Primary production. Australian Journal of
Marine and Freshwater Research 20, 65–75.
Johannes, R.E., Pearce, A.F., Wiebe, W.J., Crossland, C.J.,
Rimmer, D.W., Smith, D.F., Manning, C., 1994. Nutrient
characteristics of well-mixed coastal waters off Perth,
Western Australia. Estuarine, Coastal and Shelf Science
39, 273–285.
Joint, I., Inall, M., Torres, R., Figueiras, F.G., Alvarez-
Salgado, X.A., Rees, A.P., Woodward, E.M.S., 2001. Two
Lagrangian experiments in the Iberian Upwelling System:
tracking an upwelling event and an off-shore filament.
Progress in Oceanography 51, 221–248.
Kirk, J.T.O., 1994. Light and Photosynthesis in Aquatic
Ecosystems. Cambridge University Press, Melbourne.
Koblentz-Mishke, O.J., Volkovinsky, V.V., Kabanova, J.G.,
1970. Plankton primary production of the world ocean. In:
Wooster, W.S. (Ed.), Scientific Exploration of the South
Pacific. National Academy of Sciences, Washington,
pp. 183–193.
Kudela, R.M., Cochlan, W.P., Dugdale, R.C., 1997. Carbon
and nitrogen uptake response to light by phytoplankton
during an upwelling event. Journal of Plankton Research 19
(5), 609–630.
Lenanton, R.C., Joll, L., Penn, J., Jones, K., 1991. The
influence of the Leeuwin Current on coastal fisheries in
Western Australia. Journal of the Royal Society of Western
Australia 74, 101–114.
Lewis, M.R., Smith, J.C., 1983. A small volume, short-
incubation-time method for measurement of photosynthesis
as a function of incident irradiance. Marine Ecology-
Progress Series 13, 99–102.
Mackey, D.J., Parslow, J., Higgins, H.W., Griffiths, F.B.,
O’Sullivan, J.E., 1995. Plankton productivity and biomass
in the western equatorial Pacific: biological and physical
controls. Deep-Sea Research 42, 499–533.
Mackey, D.J., Parslow, J.S., Griffiths, F.B., Higgins, H.W.,
Tilbrook, B., 1997. Phytoplankton productivity and the
carbon cycle in the western Equatorial Pacific under El Nino
and non-El Nino conditions. Deep-Sea Research II 44
(9–10), 1951–1978.
Mann, K.H., Lazier, J.R.N., 1996. Dynamics of Marine
Ecosystems: Biological–physical Interactions in the Oceans.
Blackwell Science, Carlton.
ARTICLE IN PRESS
C.E. Hanson et al. / Continental Shelf Research 25 (2005) 1561–15821582
Maranon, E., Holligan, P.M., 1999. Photosynthetic parameters
of phytoplankton from 50N to 50 S in the Atlantic Ocean.
Marine Ecology-Progress Series 176, 191–203.
Maranon, E., Holligan, P.M., Varela, M., Mourino, B., Bale,
A.J., 2000. Basin-scale variability of phytoplankton bio-
mass, production and growth in the Atlantic Ocean. Deep-
Sea Research I 47, 825–857.
Marra, J., Heinemann, K.R., 1987. Primary production in the
North Pacific Central Gyre: some new measurements based
on 14C. Deep-Sea Research 34, 1821–1829.
Meuleners, M.J., Pattiaratchi, C.B., Ivey, G.N., (in prepara-
tion). Numerical modelling of the mean flow characteristics
of the Leeuwin Current System. In preparation for
submission to Ocean Dynamics.
Moran, X.A.G., Estrada, M., 2001. Short-term variability of
photosynthetic parameters and particulate and dissolved
primary production in the Alboran Sea (SW Mediterra-
nean). Marine Ecology-Progress Series 212, 53–67.
Morgan, G.J., Wells, F.E., 1991. Zoogeographic provinces of
the Humboldt, Benguela and Leeuwin Current systems.
Journal of the Royal Society of Western Australia 74,
59–69.
Nixon, S., 1995. Coastal marine eutrophication: a definition,
social causes, and future concerns. Ophelia 41, 199–219.
Parsons, T.R., Maita, Y., Lalli, C.M., 1989. A Manual of
Chemical and Biological Methods for Seawater Analysis.
Pergamon Press, Toronto.
Pearce, A.F., 1991. Eastern boundary currents of the southern
hemisphere. Journal of the Royal Society of Western
Australia 74, 35–45.
Pearce, A.F., 1997. The Leeuwin Current and the Houtman
Abrolhos Islands. In: Wells, F.E. (Ed.), The Marine Flora
and Fauna of the Houtman Abrolhos Islands. Western
Australian Museum, Perth, pp. 11–46.
Pearce, A.F., Griffiths, R.W., 1991. The mesoscale structure of
the Leeuwin Current. Journal of Geophysical Research C
96, 16739–16757.
Pearce, A.F., Pattiaratchi, C., 1999. The Capes Current: a
summer countercurrent flowing past Cape Leeuwin and
Cape Naturaliste, Western Australia. Continental Shelf
Research 19, 401–420.
Pearce, A.F., Phillips, B.F., 1988. ENSO events, the Leeuwin
Current, and larval recruitment of the western rock lobster.
Journal du Conseil International pour l’Exploration de la
Mer 45, 13–21.
Phillips, B.F., Pearce, A.F., Litchfield, R.T., 1991. The Leeuwin
Current and larval recruitment to the rock (spiny) lobster
fishery off Western Australia. Journal of the Royal Society
of Western Australia 74, 93–100.
Pilskaln, C.H., Paduan, J.B., Chavez, F.P., Anderson, R.Y.,
Berelson, W.M., 1996. Carbon export and regeneration in
the coastal upwelling system of Monterey Bay, central
California. Journal of Marine Research 54, 1149–1178.
Platt, T., Gallegos, C.L., Harrison, W.G., 1980. Photoinhibi-
tion of photosynthesis in natural assemblages of marine
phytoplankton. Journal of Marine Research 38 (4),
687–701.
Rochford, D.J., 1980. Nutrient status of the oceans around
Australia. CSIRO Division of Fisheries and Oceanography.
Siegel, S., Castellan, N.J., 1988. Nonparametric Statistics for
the Behavioural Sciences, second ed. McGraw-Hill, New
York.
Smith, R.L., Huyer, A., Godfrey, J.S., Church, J.A., 1991. The
Leeuwin Current off Western Australia. Journal of Physical
Oceanography 21, 323–345.
Taylor, J.G., 1994. Whale Sharks: the Giants of Ningaloo Reef.
Angus and Robertson, Sydney.
Taylor, J.G., Pearce, A.F., 1999. Ningaloo Reef currents:
implications for coral spawn dispersal, zooplankton and
whale shark abundance. Journal of the Royal Society of
Western Australia 82, 57–65.
Tilstone, G.H., Figueiras, F.G., Fermin, E.G., Arbones, B.,
1999. Significance of nanophytoplankton photosynthesis
and primary production in a coastal upwelling system
(Ria de Vigo, NW Spain). Marine Ecology-Progress Series
183, 13–27.
Tilstone, G.H., Miguez, B.M., Figueiras, F.G., Fermin, E.G.,
2000. Diatom dynamics in a coastal ecosystem affected by
upwelling: coupling between species succession, circulation
and biogeochemical processes. Marine Ecology-Progress
Series 205, 23–41.
Utermohl, H., 1958. Zur Vervollkommnung der quantitativen
phytoplankton-methodik. Internationale Vereinigung fur
theoretische und angewandte Limnologie, Mitteilungen 9,
1–38.
Walsby, A.E., 1997. Numerical integration of phytoplankton
photosynthesis through time and depth in a water column.
New Phytologist 136, 189–209.
Williams, P.J.leB., Robertson, J.I., 1989. A serious inhibition
problem from a Niskin sampler during plankton productiv-
ity studies. Limnology and Oceanography 34, 1300–1305.
Wilson, S.G., Pauly, T., Meekan, M.G., 2002. Distribution of
zooplankton inferred from hydroacoustic backscatter data
in coastal waters off Ningaloo Reef, Western Australia.
Marine and Freshwater Research 53, 1005–1015.
Woo, L.M., Pattiaratchi, C.B., Schroeder, W., (in review).
Summer surface circulation along the Gascoyne continental
shelf, Western Australia. Continental Shelf Research, in
review.
Wooster, W.S., Reid, J.L., 1963. Eastern boundary currents. In:
Hill, M.N. (Ed.), The Sea. Pergamon Press, Oxford,
pp. 253–279.