Embed Size (px)
Citation preview

emote Sensing 60 (2006) 134–146www.elsevier.com/locate/isprsjprs
ISPRS Journal of Photogrammetry & R
SPOT 5 HRS geometric performances: Using block adjustment as akey issue to improve quality of DEM generation
Aurélie Bouillon a,⁎, Marc Bernard b, Patrick Gigord c, Alain Orsoni a,Véronique Rudowski a, Alain Baudoin d
a IGN Espace, BP 42116, 6 avenue de l'Europe, 31521 Ramonville Saint Agne Cedex, Franceb SPOT IMAGE, 5 rue des Satellites, BP 14359, F31030 Toulouse Cedex 4, France
c CNES, 18 avenue Edouard Belin, 31401 Toulouse Cedex 4, Franced CNES, 2 place Maurice Quentin, 75039, Paris Cedex 01, France
Received 12 August 2005; received in revised form 6 March 2006; accepted 13 March 2006Available online 21 April 2006
Abstract
HRS instrument on board of SPOT 5 allows acquisition of stereoscopic pairs in a single pass. Its final purpose is to provide theworldwide database of Digital Terrain Models and Orthoimages, called Reference3D®, with no use of ground control points and ahorizontal location specified as 16 m for 90% of the points. The stake is not only to fulfil the HRS' location specification of 50 m inroot mean square but to obtain a location performance as best as possible and to check that the instrument can cope with therealisation of the Reference3D® database. That's why HRS has been the subject of specific attention even after the end of SPOT 5in-flight commissioning phase.
This comprehensive paper summarizes the steps jointly taken by CNES, IGN, Spot Image and HRS end-users to calibrate,monitor and validate the HRS image accuracy as well as the accuracy of the final DEM products.
First, an overview of HRS on SPOT 5 will be given, with a specific attention paid to the instrument geometry and rigoroussensor model available through ancillary data given with the images.
Then, methods and means used by the French Space Agency (CNES) and the French Mapping Agency (IGN) to reach theobjectives will be described and the final accuracy reached will be given. It concerns:
– calibration and monitoring of the HRS geometrical parameters, and the several on board improvements brought to the satellite byCNES to improve the location accuracy at the single pair level (i.e. no tie points nor ground control points used);
– the HRS block adjustment model calibration and the evaluation performed by IGN at the stereo pair level (i.e with tie points usedwithin the pair) and block level (with tie points used between different HRS strips).
Finally, the article deals with several comparisons of HRS DEM's against available DEMs (eg. SRTM DTED level 2) and alsoreviews various evaluations of the HRS and the Reference3D® products made by independent users against ground truth issuedfrom field measurements or high quality/high scale geodata.© 2006 International Society for Photogrammetry and Remote Sensing, Inc. (ISPRS). Published by Elsevier B.V. All rightsreserved.
Keywords: SPOT; HRS; stereoscopic; geometric; performance; calibration; monitoring; block; adjustment; DEM; accuracy
⁎ Corresponding author. Tel.: +33 5 62 19 18 13; fax: +33 5 61 75 03 17.E-mail address: [email protected] (A. Bouillon).
0924-2716/$ - see front matter © 2006 International Society for Photogrammetry and Remote Sensing, Inc. (ISPRS). Published by Elsevier B.V.All rights reserved.doi:10.1016/j.isprsjprs.2006.03.002

Table 1Spot orbit parameters
Parameter Nominal value
Altitude 818–833 kmInclination 98.72°Period 101 minDescending node local time 10:15 amRevolutions per day 14+5 /26Cycle duration 26 days
135A. Bouillon et al. / ISPRS Journal of Photogrammetry & Remote Sensing 60 (2006) 134–146
1. Introduction
This paper presents the latest SPOTsatellite, SPOT 5,and its innovative sensor dedicated to a DEM generation,HRS. A world wide DEM database, Reference3D®, isgenerated without any Ground Control Point by SpotImage and IGN thanks to the accurate knowledge of theHRS geometry and of the stereoscopic acquisitioncapacity of this instrument which allows bundleadjustment over large areas.
The HRS geometry is described and results obtainedduring the Commission Phase and afterwards arepresented in part 3, showing the location accuracyimprovements thanks to systematic errors correctionsknown through the HRS behaviour analysis andmodelization.
Block Adjustment of the HRS data on very largeareas is described in part 4, showing how this techniquecan improve the horizontal and vertical accuracy andespecially according to the block size.
Assessments of the DEM accuracy and quality havebeen performed, through the ISPRS–CNES initiativebut also with other Mapping agencies such as NGA ( USGovernment National Geospatial-Intelligence Agency)or FÖMI (Hungarian Mapping Agency) and results aregiven in part 5.
2. HRS on SPOT 5
2.1. SPOT 5
SPOT 5 is the latest satellite of the SPOT family,launched during the night of the 3rd to the 4th of May2002 from the European Spaceport in Kourou (FrenchGuyana) with one of the last Ariane 4 to be used (FlightV151 with AR42P).
Fig. 1. SPOT5 satellite and sensors.
This satellite (Fig. 1) ensures data continuity withthe previous satellites but provides also enhancedimages (at approx. 2.5 m pixel size with its twoHRG instruments) and new stereoscopic capabilitieswith the HRS instrument. A fourth imaging sensor,Vegetation 2 (recurrent model of Vegetation 1 onSPOT 4) gives a wide-swath (2500 km) dailycoverage.
SPOT 5 is on the same orbit as SPOT 1, 2, 3 and 4.This is a polar, circular, sun-synchronous orbit. Itscharacteristics are recalled in Table 1.
More details about SPOT 5 system and groundsegment can be found in (Gleyzes et al., 2003).
2.2. HRG cameras
Two High Resolution Geometric instruments (HRG)give SPOT 5 the capacity to pursue and to improve theHRVIR SPOT 4 service.
Each instrument has the same field of view (4.13°)and the same off-track pointing capabilities (±27°) asthe HRVIR instrument on SPOT 4, which gives theopportunity to cover 60 km (vertical view), and up to80 km for an oblique view.
Improvements from SPOT 1, 2, 3 and SPOT 4 toSPOT 5 are the following:
– Panchromatic images (0.49–0.69 μm) are acquiredusing two staggered linear array detector lines of12000 elements of a size of 6.5 μm giving 5 mresolution at nadir. These two lines can be combinedto achieve a better resolution and a pixel size ofapprox. 2.5 m.
– Multispectral images are acquired with 6000 pixelsper line in three bands B1, B2, B3 and 3000 pixels inthe SWIR band.
– Compression rate and transmission (up to a factor 2).
Improved location accuracy (10 m rms after groundprocessing) is reached using a star tracker not present onthe previous SPOT satellites.

Fig. 2. HRS camera.
136 A. Bouillon et al. / ISPRS Journal of Photogrammetry & Remote Sensing 60 (2006) 134–146
2.3. HRS camera
The High Resolution Stereoscopic instrument (HRS)has been designed for a DEM mass production all overthe world. It is made of two telescopes allowing along-track stereoscopy with a 20° fore view and a 20° aftview (Fig. 2).
Stereo pairs could be already acquired from HRVand HRVIR on the previous SPOT satellites but fromdifferent orbits, either using the same satellite atdifferent days or from two SPOT satellites on the sameday only on few parts of the world. With HRS the twoimages of the stereo pair are acquired within aninterval of only 90 s, following the satellite track andcovering an area of 120 km wide by up to 600 kmlong (Fig. 3). This limitation of the acquisition lengthis due to the fact that the two images could not berecorded simultaneously and corresponds to thedistance on the ground between the fore and aftviewing directions.
The main characteristics of this instrument are givenin Table 2. A panchromatic band is used (0.48 to0.7 μm) which does not include near infrared to avoiddark shadows in mountainous areas. The 120 km swathhas been specified for insuring a compatibility with bi-
Fig. 3. HRS' stereo acquisition process.
HRG nadir viewing (an HRG image is 60 km wide) butalso, and mainly, for ensuring a global coverage even atthe Equator. The spatial resolution (10 m), as the B/H(0.8) have been chosen to get the expected DEMaccuracy of 10 m (with 90% confidence on slopes lessthan 10%). From these parameters the number ofdetectors (12000) within a single CCD array and theirsize (6.5 μm), as well as the integration time (0.752 ms)have been deduced.
Considering that epipolar lines of the stereo pair areparallel to the track of the satellite (for along trackstereo) the sampling rate has been doubled in order toget a better correlation between the two images, leadingto rectangular pixel (5 m along track×10 m acrosstrack).
2.4. HRS' Geometry
The HRS is fully integrated on board SPOT 5 andancillary data provided with each image of an HRSstereo pair has got same characteristics as SPOT 5High Geometric Resolution principal mission ancillarydata.
Table 2HRS characteristics
Mass 90 kgPower 128 WSize 1.0×1.3×0.4 m3
Panchromatic band 0.48–0.70 μmGround sampling distance 10 m cross-track, 5 m along trackField of view/swath +/−4° 120 kmFocal length 0.580 mDetectors per line 12000Detector size 6.5 μmIntegration time/line 0.752 msFore/aft viewing angle +/−20°Signal/noise ratio >120MTF >0.25

137A. Bouillon et al. / ISPRS Journal of Photogrammetry & Remote Sensing 60 (2006) 134–146
All data necessary for a physical geometric model-ling of an image are given in a DIMAP format filenamed METADATA.DIM:
– Line dating is made through two models: acorrespondence between board time (BT) anduniversal time (UT) is given by a Doris ultrastable oscillator and a correspondence betweenimage line and board time is given by an onboardoscillator. Image centre line time, line period andeach ephemeris and attitude sample time arededuced from these models and given in universaltime;
– The satellite position and the velocity is given every10 s by DORIS DIODE on board orbit determination.The best orbit arc is fit on a DIODE data thanks to aTRIODE software and the result in ephemeris pointsis given every 30 s.;
– The satellite yaw, pitch and roll orientation angles arecomputed out of quaternions delivered by the onboard stellar location unit (ULS) and given every125 ms (8 Hz);
– Pair of viewing angles psiX, psiY are calibrated onground and given for each detector of the CCD array.
Details about how to proceed with the rigoroussensor model of SPOT 5 images are given in Spot Image(2002).
Pre-launch location requirement for a single HRSpair was fixed to 50 m rms. Before the launch, someexpectations even showed that a 25 m rms performancecould be reached.
This performance level, much better than for theprevious SPOT satellites, is mainly due to the onboardstellar location unit. This system uses both star trackerand gyroscopes data to compute absolute orientation ofthe satellite. The result is a good low frequency accuracythanks to the star tracker, and a good high frequencyaccuracy thanks to the gyroscopes.
2.5. Reference3D® database
The HRS data is currently used by IGN and SpotImage to build a worldwide accurate database calledReference3D®, which consists of three informationlayers: Digital Elevation Model at 1-arc-second resolu-tion (approx. 30 m), Orthoimage1 at ca. 5 m resolutionand Quality Metadata. Since 2003, the Reference3D®
1 These images are orthorectified from the DEM and have a highdegree of geometric quality and location accuracy.
database is progressively incremented at a yearly pace of6 to 7 million sq. km. The low cost production process isbased only on the use of tie points, no ground controlpoints are required.
The Reference3D® specifications were set beforelaunch, examining both the HRS performances expectedand taking into account the production process. TheOrthoimage layer absolute horizontal accuracy specifiedis 16 m (circular error for 90% of the points). The DEMlayer absolute requirements are:
– horizontal circular absolute accuracy of 15 m at 90%;– vertical absolute accuracy depending on the slope:– 10 m at 90% for slopes lower than 20%;– 18 m at 90% for slopes between 20% and 40%;– 30 m at 90% for slopes greater than 40%.
The production process can be basically described inthree steps:
– relative orientation of each HRS pair;– DEM processing by automatic correlation of eachstereopair;
– global processing of the absolute geometry by bundleblock adjustment over large areas.
The key to reach the absolute location performancespecification is a good initial absolute location perfor-mance at the single pair level and an effective blockadjustment process taking advantage of tie points. Thevalidation of these two aspects is presented in followingsections.
3. Assessment of HRS geometry
3.1. Geometric calibration of HRS during the in-flightcommissioning phase
The image quality commissioning phase was dividedinto two parts. The first two months were dedicated tofirst calibrations and characterisation in order to ensurethat SPOT 5was fulfilling its specifications and ready forcommercial exploitation. During the next 4 months,image quality commissioning went on, with a finecharacterisation, and improvement of the first calibrationprocessed.
The HRS' geometric calibration during this phasehas consisted in:
– measuring orientation bias of the two cameras onSPOT 5 platform thanks to ground control points(exterior orientation);

Fig. 4. HRS relative location (single pair) from Bouillon and Gigord(2004)—Ellipse shows the 3×std boundary. (a) Before correction.(b) After correction.
Fig. 5. HRS absolute location (single pair) from Bouillon and Gigord(2004)—Ellipse shows the 3×std boundary. (a) Before correction.(b) After correction.
138 A. Bouillon et al. / ISPRS Journal of Photogrammetry & Remote Sensing 60 (2006) 134–146
– calibration of the optic distortion and relativeorientation of the two cameras by comparison ofHRS images with a precise aerial reference (innerorientation).
This process resulted in updates of the list of viewingdirections psiX, psiY given for each detector. Detailsabout the geometric calibrations and the performancemeasurements carried out during the commissioningphase are given in Bouillon et al. (2002), Bouillon et al.(2003), Breton et al. (2002), Gachet (2004), Valorge etal. (2003).
At the end of the commissioning phase (November2002), it was stated that the initial goal for HRS of 50 mrms location accuracy for a single pair, was clearly met.Therefore some steps obviously remained to get thelocation performance in accordance with on the onehand the 25 m-rms pre flight expectations and on theother hand the 16 m-at-90% Reference3D® productrequirement.
3.2. On-board corrections performed after launch
After the end of the commissioning phase, thepotential ways of improvement of the HRS locationperformance were already identified and explored by aworking group involving the French Space Agency(CNES), the French Mapping Agency (IGN), the SPOT5 satellite integrator (ASTRIUM) and the star trackerdeveloper (SODERN). A full description of the processand detailed results are given in Bouillon and Gigord(2004).
These studies unveiled a noise caused by a variabledeformation of the foot of the cameras. This effect wassuccessfully corrected through a modification of the on-board thermal control performed on February 25, 2003.After this correction, HRS relative location accuracy isbetter than the pixel instantaneous field of view of 10 m(Fig. 4).
An important variation of the absolute locationperformance, correlated with the latitude, was suc-cessfully corrected on September 2003 through a
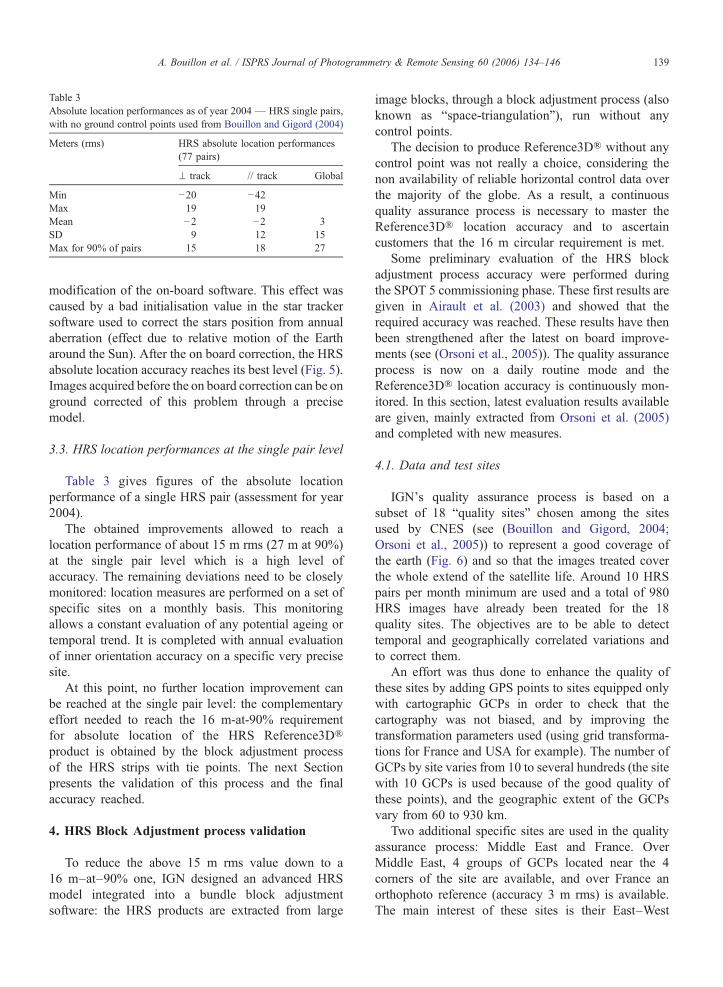
Table 3Absolute location performances as of year 2004 — HRS single pairs,with no ground control points used from Bouillon and Gigord (2004)
Meters (rms) HRS absolute location performances(77 pairs)
⊥ track // track Global
Min −20 −42Max 19 19Mean −2 −2 3SD 9 12 15Max for 90% of pairs 15 18 27
139A. Bouillon et al. / ISPRS Journal of Photogrammetry & Remote Sensing 60 (2006) 134–146
modification of the on-board software. This effect wascaused by a bad initialisation value in the star trackersoftware used to correct the stars position from annualaberration (effect due to relative motion of the Eartharound the Sun). After the on board correction, the HRSabsolute location accuracy reaches its best level (Fig. 5).Images acquired before the on board correction can be onground corrected of this problem through a precisemodel.
3.3. HRS location performances at the single pair level
Table 3 gives figures of the absolute locationperformance of a single HRS pair (assessment for year2004).
The obtained improvements allowed to reach alocation performance of about 15 m rms (27 m at 90%)at the single pair level which is a high level ofaccuracy. The remaining deviations need to be closelymonitored: location measures are performed on a set ofspecific sites on a monthly basis. This monitoringallows a constant evaluation of any potential ageing ortemporal trend. It is completed with annual evaluationof inner orientation accuracy on a specific very precisesite.
At this point, no further location improvement canbe reached at the single pair level: the complementaryeffort needed to reach the 16 m-at-90% requirementfor absolute location of the HRS Reference3D®product is obtained by the block adjustment processof the HRS strips with tie points. The next Sectionpresents the validation of this process and the finalaccuracy reached.
4. HRS Block Adjustment process validation
To reduce the above 15 m rms value down to a16 m–at–90% one, IGN designed an advanced HRSmodel integrated into a bundle block adjustmentsoftware: the HRS products are extracted from large
image blocks, through a block adjustment process (alsoknown as “space-triangulation”), run without anycontrol points.
The decision to produce Reference3D® without anycontrol point was not really a choice, considering thenon availability of reliable horizontal control data overthe majority of the globe. As a result, a continuousquality assurance process is necessary to master theReference3D® location accuracy and to ascertaincustomers that the 16 m circular requirement is met.
Some preliminary evaluation of the HRS blockadjustment process accuracy were performed duringthe SPOT 5 commissioning phase. These first results aregiven in Airault et al. (2003) and showed that therequired accuracy was reached. These results have thenbeen strengthened after the latest on board improve-ments (see (Orsoni et al., 2005)). The quality assuranceprocess is now on a daily routine mode and theReference3D® location accuracy is continuously mon-itored. In this section, latest evaluation results availableare given, mainly extracted from Orsoni et al. (2005)and completed with new measures.
4.1. Data and test sites
IGN's quality assurance process is based on asubset of 18 “quality sites” chosen among the sitesused by CNES (see (Bouillon and Gigord, 2004;Orsoni et al., 2005)) to represent a good coverage ofthe earth (Fig. 6) and so that the images treated coverthe whole extend of the satellite life. Around 10 HRSpairs per month minimum are used and a total of 980HRS images have already been treated for the 18quality sites. The objectives are to be able to detecttemporal and geographically correlated variations andto correct them.
An effort was thus done to enhance the quality ofthese sites by adding GPS points to sites equipped onlywith cartographic GCPs in order to check that thecartography was not biased, and by improving thetransformation parameters used (using grid transforma-tions for France and USA for example). The number ofGCPs by site varies from 10 to several hundreds (the sitewith 10 GCPs is used because of the good quality ofthese points), and the geographic extent of the GCPsvary from 60 to 930 km.
Two additional specific sites are used in the qualityassurance process: Middle East and France. OverMiddle East, 4 groups of GCPs located near the 4corners of the site are available, and over France anorthophoto reference (accuracy 3 m rms) is available.The main interest of these sites is their East–West

Fig. 6. Quality sites used for HRS modelling process.
140 A. Bouillon et al. / ISPRS Journal of Photogrammetry & Remote Sensing 60 (2006) 134–146
geographic extent (around 1000 km for France and2500 km for Middle East) and the number of imagesused (110 images for France and 960 for MiddleEast). The extent of those sites and the number ofimages are important for the inner orientation para-meters estimation (see Section 4.3).
4.2. Method
4.2.1. Space-triangulationSpace triangulation is the technique used at IGN
Espace to register satellite images. This method allows tosimultaneously optimise the geometric models relatingto a set of contiguous scenes grouped in blocks, using theviewing parameters associated to the scenes, groundcontrol points and tie points between the scenes so thatthe global model computed for the block will be coherentfor the whole block.
This method is based on a physical description of theimage acquisition process. It allows to choose physicalcorrection parameters as representative as possible andtherefore to limit the number of unknowns to bedetermined.
4.2.2. HRS block adjustments processingThe Reference3D® block adjustment process is
based on a set of HRS stereo pairs covering an extendedarea connected by tie points identified on differentstereo pairs. This method allows averaging the non-systematic errors.
So, the first aspect of the quality assurance process isto detect and remove all the systematic errors affectingthe absolute location of the images. This work isperformed through a specific block adjustment proces-sing over the “quality sites” and results are detailed inSection 4.3.
After removing these errors, the block adjustmentprocess performances are studied through the com-parison of HRS pairs location obtained from a blockadjustment using both ground control points and tiepoints as a reference processing and another oneusing only tie points which is representative of theReference3D® production process. The comparisonwith the reference processing is made before andafter the Reference3D®-like block adjustment proces-sing in order to assess the performances both at thestereopair and the block level. Results are detailed inSection 4.4.
4.2.3. Physical model parameters used in the blockadjustment process
The parameters considered in the different blockadjustment processing are:
– satellite position bias (3 parameters by strip);– second degree polynomial for satellite orientationangles roll, pitch and yaw (3⁎3 parameters by strip);
– time tagging bias parameter (one parameter by singleimage);
– inner-orientation parameters (a set by block, only inthe case of calibration processing).
A strip is composed of at least one HRS pair, and itcan be more as soon as ephemeris and attitude data ofsuccessive HRS pairs can be merged.
4.3. HRS block adjustment model calibration
In this section, the results of systematic errorsevaluation are detailed: temporal and geographicalvariations as well as inner-orientation parametersrefinement.

141A. Bouillon et al. / ISPRS Journal of Photogrammetry & Remote Sensing 60 (2006) 134–146
4.3.1. Temporal model of the attitude angles evolutionA first bundle block-adjustment process is per-
formed on each test site, without inner-orientationparameters. The results are used to compute mathemat-ical functions representing the temporal components ofthe satellite orientation for roll, pitch and yaw. The rollcomponent shows a periodic evolution, with a signif-icant linear tendency. The ageing effect is treated as abeginning-of-life linear tendency mostly for the yawcomponent (Fig. 7).
4.3.2. Inner-orientation parameters refinementThe data available for the validation of the block
adjustment process also allowed to improve the innerorientation provided by CNES. The focal plane shape(i.e. optical distortion) is not improved by the process.The five inner orientation parameters considered in theadjustment process are:
– a scale factor along the CCD array direction for eachsensor (equivalent to a focal length unknown);
Fig. 7. Roll, pitch and yaw (micro-radians) evolutio
– the CCD array orientation in the focal plane for eachsensor (called front and back “pseudo-yaw”);
– the relative pitch of the 2 cameras (angle whichdetermine the stereo base).
Inner orientation parameters were computed sepa-rately on the 18 test sites (18 independent determina-tions), then with the data of these 18 sites joined together(1 determination) and finally over France and MiddleEast blocks separately.
Evaluation for each site allowed studying of theeventual geographic correlation of these parameterswhile the global evaluation for the 18 sites gives anaverage result independent from the geographic posi-tion. Finally the most important correlation noted was astrong decrease of the rms of the solutions with thegeographic extent of the ground control points and withthe number of images for the site.
Studying the variations of the 21 solutions shows thatthe relative pitch is the most stable parameter with aglobal rms <2.5 micro-radians. For the sensors array
n against Julian day. a: Roll. b: Pitch. c: Yaw.

Fig. 8. Along track (Y) versus across track (X) corrections in micro-radians for single stereo pairs (1 micro-radian corresponds to ca.0.8 mon the ground).
Fig. 9. Estimated location accuracy of the Reference3D® modellingprocess from Orsoni et al. (2005). North differences against Eastdifferences in meters. The circle represents Reference3D® locationspecification of 15 m for 90% of the points.
142 A. Bouillon et al. / ISPRS Journal of Photogrammetry & Remote Sensing 60 (2006) 134–146
scale factor, the rms decreases from 15 to 5 ppm whenconsidering only the sites with a GCPs extension greaterthan 200 km. The sensor lines orientation parameters(front and back pseudo-yaw) show the strongestvariations in the different results. Its rms decreasesfrom 22 to 5 micro-radians when selecting only the siteswith more than 100 HRS images.
Therefore, assuming that Middle East block has agreat east–west extension and a great number of images,it was decided that the values computed for this site(confirmed by the other sites, including France) will beused in all the processes.
A good estimation of the inner orientation parametersis very important in the scope of the Reference3D®processing. The use of large blocks enables a goodaveraging of the attitude errors but a wrong estimation ofthese parameters would propagate the errors in the block.
To improve the precision of the values of linemagnification coefficients and orientation angles, rolland pitch corrections variations estimated for each stereopair are studied against the track longitude at Equator (forthis purpose the block will be adjusted without GCPsconstraint). A bad evaluation of the scale factors would bereflected by a linear tendency of the roll relatively to thetrack longitude at equator. In the same way a pitchtendencywould reflect a bad evaluation of the sensor linesorientation. Measuring these tendencies with regularintervals of time is part of our quality assurance process.
4.4. HRS absolute location performance at thestereopair and block level
The above two steps provide an advanced HRSgeometrical model, based upon the refined values for
HRS inner-orientation parameters, as well as a set offunctions to optimise attitude angles considering theacquisition date. These results are taken into account inevery further block adjustment processing.
In this section, we present the Reference3D® blockadjustment processing performances at the stereopairand the block level by comparison with a referenceprocessing using ground control points.
4.4.1. Before bundle block adjustmentThe performance before space triangulation is
measured through the roll and pitch corrections appliedduring the bundle block adjustment:
– 10.1 m rms along track– 9.2 m rms across trackThe global absolute location performance for a stereo
pair connected with tie points is then 13.7 m rms. (Fig.8)
4.4.2. After bundle block adjustment
4.4.2.1. Estimation of horizontal performance. Toassess the location performance of the models in theReference3D® process, we first process all the test siteswith all GCP XY coordinates activated and after with allXY coordinates de-activated. We finally compare thecoordinates estimated during the two processes. Theseresults include eventual biases of the references used forthese sites (Fig. 9).

Fig. 11. Horizontal and vertical performance of the Reference3D®process in dependence of the block size from Orsoni et al. (2005).
143A. Bouillon et al. / ISPRS Journal of Photogrammetry & Remote Sensing 60 (2006) 134–146
This shows a 4.1 m rms (Easting) and 3.1 m rms(Northing) performance. This represents a horizontalaccuracy of 8.4 m for 90% of the points.
4.4.2.2. Estimation of vertical performance. The samemethod as above is used: 2 bundle block adjustmentprocessed, one with the XYZ GCPs constraints, theother one with XYZ GCPs coordinates deactivated.Thus the comparison also includes eventual biases in theelevation references. The 90% threshold elevationperformance is 4.5 m (Fig. 10).
4.4.2.3. Block size and performance. A study wasperformed using the Middle East block to quantify theabsolute location performance relatively to the blocksize.
The block is composed of 480 stereo pairs. It wasseparated in 4, 8, 16, 32, 96 and 480 blocks (in this lastcase 1 stereo pair=1 block). In each configuration all theblocks were computed twice: one process using thealtimetric GCPs constraint and tie points and anotherusing only tie points. For each block and process thestereo pairs corners position is compared with the samestereo pairs corners of the block computed with theGCPs horizontal and vertical constraints (Fig. 11).
According to these results, the minimum number ofstereo pairs (connected by tie points) necessary for theblock to meet the Reference3D® specifications is 10pairs. This block configuration gives a horizontalperformance of 7.5 m and altimetric performance of 4to 5 m depending on the availability of elevationpoints.
We considered that the horizontal accuracy of thespace triangulation process represents only 50% of the
Fig. 10. Estimated vertical accuracy of the Reference3D® modellingprocess from Orsoni et al. 2005 (differences in meters).
location budget performance of 15 m at 90% set by theReference3D® specifications. The other 50% of theperformance is due to on board high-frequency phe-nomena affecting the location model accuracy, andmatching errors in the DEM generation process. Bothaffect the DEM and orthoimages generated. It is thusnecessary to assess the DEM accuracy to get a globalevaluation of the overall accuracy of the process andvalid the compliance of the final product with thespecifications. The next Section gives several results onthis point.
5. Assessments of the altimetric accuracy of HRSand Reference3D® products
5.1. Several assessments at international level for theworldwide Reference3D®
Apart from technical comparisons carried out by IGN(against ASTER, against French National DEM,…),several assessments of the accuracy of the HRS and theReference3D® products have been performed byindependent users:
– a devoted ISPRS team, HRS SAP, gathered 10+PIsto investigate the intrinsic potential of HRS imagery
– NGA and IGN performed in 2003–2004 a crossevaluation of the SRTM and the Reference3D®DEMs
– Joint Research Center Ispra (JRC) and FÖMIrecently performed a very complete evaluation overHungary
– Other labs or users from Canada, UK, China,…
Their results are briefly presented here below.

Table 4Differences (in meters) in elevation between SRTM DTED2 finishedproduct from NGA and Reference3D® (computed as SRTM–Reference3D®), from Rudowski (2005)
Cell # Landscape Figures at 90%
Min Max Mean SD
E035n29 High relief −5 15 4.4 4.0E035n33 High relief −10 4 −2.7 3.0E048n32 Flat+ relief −21 1 −7.3 4.4
High relief −27 3 −9.4 6.0Flat terrain −9 −1 −5.3 2.0
E049n30 Flat+ relief −6 5 −0.4 2.4High relief −5 4 −0.5 2.2Flat terrain −10 7 −0.5 3.7
E033n30 Medium relief −6 10 3.7 3.3E032n30 Medium relief −6 11 1.5 3.7E047n30 Flat terrain −9 −1 −4.6 1.9E048n29 Flat terrain −12 −1 −6.7 2.5E048n30 Flat terrain −10 1 −5.5 2.2
144 A. Bouillon et al. / ISPRS Journal of Photogrammetry & Remote Sensing 60 (2006) 134–146
5.2. Assessment of Reference3D® against BD Topo
BD Topo is the French national elevation databasemostly extracted from stereo plotting. It was used in theearly stages of the production (a few weeks after SPOT 5 'slaunch) to assess the accuracy of the Reference3D®production process. The study has been performed byIGN Espace using the standard Reference3D® proces-sing. The results were presented at the 2003 IEEEInternational Geoscience and Remote Sensing Sym-posium (IGARSS 2003) held in Toulouse, France, inJuly 2003 and greatly contributed to consolidate ourconfidence in HRS data.
5.3. ISPRS “Scientific Assessment Program” Team
The HRS Scientific Assessment Program Team (SAPteam) and the achievements are extensively described inBaudoin et al. (2004), Rudowski (2004). The PIs andCoIs presented their results during the 2004 ISPRSXXth Congress in Istanbul, and their studies werepublished in the Proceedings of the Congress. PIs andCoIs used raw HRS data and ground control points toproduce DEM and compare them with a precisereference DEM.
Nine datasets were freely available to the investiga-tors, and many of them were studied by severalresearchers (eg. Barcelona, Bavaria,…). Each datasetwas made of HRS imagery complemented by “groundtruth” (precise DEM and orthophotos) provided by thePIs.
Globally, the authors conclude that HRS is able toprovide DEMs within a vertical accuracy better than 5 min flat areas, and around 10 m in relief areas.
5.4. Cross evaluation of Reference3D® and SRTMDTED 2 with NGA
A joint comparison of Reference3D® with finishedSRTM DTED 2 (from SRTM-C-Band data) for 12 pre-selected cells (over the Middle-East “quality site”) thatwere exchanged with NGA was launched in earlyNovember 2003. The 12 selected cells were chosen toshow out various landscapes, from very flat desert up tovery high mountain areas.
The technical works have been carried out in parallelby NGA and IGN until March 2004. The detailed resultswere presented within the SRTM Workshop held inReston (VA—USA) in June 2005, see Rudowski(2005). The short summary listed in Table 4 shows thefull compatibility of the SRTM DTED level 2 and theReference3D® products.
Besides these figures, the studies stressed thecomplementarities of the SRTM DTED2 and theReference3D® products: a very important ratio ofSRTM voids could be filled in by the validReference3D® values, and on the reverse side, SRTMproved present with valid values to complement theHRS data where image matching was hindered by localconditions (smokes, small clouds, dark shadows,…).
5.5. Evaluation of Reference3D® by JRC and FÖMI
The JRC Ispra and the FÖMI thoroughly evaluatedthe accuracy of the Reference3D® (the tiles wereproduced by IGN in the standard Reference3D®processing) against very precise geodata produced byFÖMI. The test was performed over a 1°×1° framelocated South West from lake Balaton.
The Reference3D® horizontal accuracy, carefullychecked against a 0.70 m orthophoto, was found betterthan 10 m at 90%.
The Reference3D® elevation values were comparedto about 5000 geodetic points from the Hungariannetwork, and a 5.4 m rms error was reported.
From a comparison with the MADOP DTM (5 mnation-wide DTM), the global Reference3D® verticalaccuracy was evaluated better than 3.5 m rms.
It is important to note that the study by FÖMI andJRC included detailed evaluations of the elevationaccuracy, through segmented classes describing i) thelocal slope (10%, 20% and 40% thresholds) and ii) theland use (agriculture, forest, urban). All of themconfirmed that the Reference3D® accuracy require-ments were met (Fig. 12).

Fig. 12. Elevation accuracy of the Reference3D, displayed for differentclasses of slopes and land uses (from S.Kay—JRC).
145A. Bouillon et al. / ISPRS Journal of Photogrammetry & Remote Sensing 60 (2006) 134–146
The study was first presented in Budapest inNovember 2004. For further details, please see Kay etal. (2004).
5.6. Evaluation of Reference3D® over steep areas
Steep areas are without no doubt difficult areas forDEM extraction. Various evaluations over such zoneswere performed by several Reference3D® users indifferent countries. The most recent one took place inChina, where a local user made an in-depth assessmentof a Reference3D® cell located over a mountainousarea.
The Reference3D® was first checked against 83 GPSpoints measured on purpose; more than 85% of thepoints were found better than 10 m in elevation, and thehorizontal accuracy proved better than 10 m rms.
The Reference3D® was also compared to a DEMextracted from 1:48,000 scale aerial photos (convertedfrom the Chinese datum to WGS84). The comparisonwas taking into account the slope classes mentioned inthe Reference3D® requirements (20% and 40% slopesthresholds), and confirmed that the requirements weremet.
6. Conclusion
A huge effort was necessary to get the maximumaccuracy from the HRS data. Obviously, this effortshall be pursued as long as the HRS is “alive”, tounveil in due time any possible modification orevolution (of the sensor), and to make the necessaryadaptations to the on-board and ground software.
The Reference3D® accuracy requirements were setat a very ambitious level. However, CNES and IGNand Spot Image enthusiastically took up the challenge,as well as the numerous Reference3D® users who
performed detailed evaluations of many Reference3D®products.
In parallel, the international scientific communityshowed a large interest in the HRS data, and their paperscorroborated the rich potentialities of the HRS data.
The results show that all the Reference3D® require-ments are met, though considered as unrealistic by manyin the past (including some of the authors), regarding thefact they had to be met without using any GCP. So theReference3D® turns a once utopistic concept into dailyroutine.
Acknowledgments
The authors would like to thank Daniel Vidal-Madjarfrom CNES, Philippe Munier from Spot Image andPhilippe Campagne from IGN who have given all thenecessary financial support for the HRS ScientificAssessment Program.
Ian Dowman, Secretary General of ISPRS, StanleyMorain, President of Commission I and ManfredSchroeder, Chairman of WG I/2 on Sensor Calibrationand Testing, during the 2000–2004 period should begratefully thanked for organising within ISPRS thescientific assessment of the HRS instrument.
Acknowledgments should also be given to Chris-tophe Valorge and Claude Fratter from CNES for theirsupport in the creation of SPOT 5 working group for theimprovement of HRS location performance; to SergePotteck and Didier Rami from CNES, Sylvain Airault,Eric Breton, and Denis Toustou from IGN, OlivierHameury and Patrick Rouchit from ASTRIUM andPhilippe Jacob from SODERN members of SPOT 5working group who actively participated to theachievement of the on board corrections performedafter launch.
Very special thanks should be paid to J.Slater (NGA),S.Kay (JRC Ispra) and P. Winkler (FOMI) and theirteams, who performed the priceless evaluations ofReference3D®.
Last but not least, the authors would like to give veryspecial thanks to the Reference3D® Production Team,Michel Deloménie, Bernard Roche, J.F Albert, BrigitteGuénanten and the whole staff, whose day-to-dayfeedback and remarks allow the optimization of HRSperformances.
References
Airault, S., Gigord, P., Cunin, L., Breton, E., Bouillon, A., Gachet, R.,Bernard, M., 2003. Reference3D Location Performance Reviewand Prospects. Proceedings of the ISPRS Worshop High

146 A. Bouillon et al. / ISPRS Journal of Photogrammetry & Remote Sensing 60 (2006) 134–146
Resolution Mapping from Space 2003, Hanover, 6–8 October2003, 2003. IPI Universität Hannover. 5 pp. (on CDROM).
Baudoin, A., Schroeder, M., Valorge, C., Bernard, M., Rudowski, V.,2004. The HRS–SAP initiative: a scientific assessment of the HighResolution Stereoscopic Instrument on Board of SPOT 5 by ISPRSInvestigators. International Archives of Photogrammetry, RemoteSensing and Spatial Information Sciences 35 (Part B1), 372–378.
Bouillon, A., Gigord, P., 2004. SPOT 5 HRS location performancetuning and monitoring principles. International Archives ofPhotogrammetry, Remote Sensing and Spatial InformationSciences 35 (Part B1), 379–384.
Bouillon, A., Breton, E., De Lussy, F., Gachet, R., 2002. SPOT5 HRGand HRS first in-flight geometric quality results. Proc. 9thInternational Symposium on Remote Sensing, Aghia Pelagia,Greece, 22–27 September 2002, vol. 4881, pp. 212–223.
Bouillon, A., Breton, E., De Lussy, F., Gachet, R., 2003. SPOT5Geometric Image Quality. Proceedings of 2003 IEEE InternationalGeoscience and Remote Sensing Symposium, Toulouse, France,21–25 July 2003, vol. I, pp. 303–305.
Breton, E., Bouillon, A., Gachet, R., De Lussy, F., 2002. Pre-flight andin-flight geometric calibration of SPOT5 HRG and HRS images.International Archives of Photogrammetry, Remote Sensing andSpatial Information Sciences 34 (Part 1). 6 pp.
Gachet, R., 2004. Spot5 in-flight commissioning: inner orientation ofHRG And HRS Instruments. International Archives of Photo-grammetry, Remote Sensing and Spatial Information Sciences 35(Part B1), 535–539.
Gleyzes, J.P., Meygret, A., Fratter, C., Panem, C., Baillarin, S.,Valorge, C., 2003. SPOT5: system overview and image groundsegment. Proceedings 2003 IEEE International Geoscience and
Remote Sensing Symposium, Toulouse, France, 21–25 July 2003,vol. I, pp. 300–302.
Kay, S., Zieliñski, R., Spruyt, P., Mihály, S., Winkler, P., Ivan, G.,2004. An independent evaluation of the SPOT Image/IGNReference3D digital elevation model and HRS orthoimageproducts. Proceedings of the 10th Conference on Control withRemote Sensing of Area-Based Subsidies (MARS Seminar),Budapest, Hungria, 25–27 November 2004. http://agrifish.jrc.it/marspac/cwrs/meetings/2004-11_budapest.htm (accessed March10, 2006).
Orsoni, A., Gigord, P., Bouillon, A., 2005. Optimization of SPOT 5calibration in order to reach the ambitious Reference3D locationspecifications. Proceedings of Physics in Signal and ImageProcessing Fourth International Conference, PSIP'2005, Toulouse,France, 31 January – 3 February 2005 (on CDROM).
Rudowski, V., 2004. Synthesis of studies relating to HRS DTMproduction. International Archives of Photogrammetry, RemoteSensing and Spatial Information Sciences 35 (Part B1), 399–409.
Rudowski, V., 2005. Comparison of SPOT Reference3D DigitalElevation Model Data with SRTM Derived DTED® Level 2. Proc.SRTM Data Validation and Applications Workshop, Reston,Virginia, USA, 14–16 June 2005 (on CDROM).
Spot Image, 2002. SPOT Satellite Geometry Handbook, S-NT-73-12-SI, Edition1, Revision0.
Valorge, C., Meygret, A., Lebègue, L., Henry, P., Bouillon, A., Gachet,R., Breton, E., Léger, D., Viallefont, F., 2003. 40 years ofexperience with SPOT in-flight calibration. In: Budge, A.M.,Morain, S.A. (Eds.), Post-Launch Calibration of Satellite Sensors.ISPRS Book Series, vol. 2, pp. 119–133.


![MODERN TECHNIQUES OF LANDS AND CONSTRUCTIONS …revcad.uab.ro/upload/36_450_Paper23_RevCAD17_2014.pdfsignificantly improved geometric levelling operational performances. [1] In surveying,](https://img.pdfslide.net/doc/110x75/5e7a6711bcb1c62a463c1f46/modern-techniques-of-lands-and-constructions-significantly-improved-geometric-levelling.jpg)