Embed Size (px)
Citation preview
Empsight International, LLC | 222 Broadway Suite 1837| New York, NY 10038 | 212.683.7745 | www.empsight.com
Spot Survey of 2021 Salary Budget Forecasts &Remote Work Practices
Part 2 of 2 - Remote Work Practices - Participant ReportJanuary 2021Lorem Ipsum
©2021 Empsight International, LLC Page 2
© 2021 Empsight International, LLC
All rights reserved. This report is provided by Empsight International, LLC solely for the use by the participant in connection with the participant’s own internal human resources management. No one may use or reproduce the report or any data it contains, in any form whatsoever, for any purpose other than in documents prepared for the company’s internal management. This report, and the know-how embodied in it, is the confidential and proprietary work product of Empsight International, LLC, which owns all related intellectual property rights.
©2021 Empsight International, LLC Page 3
Table of Contents
Introduction ........................................................................................................................................................................ 4
Participant Profile ................................................................................................................................................................ 5
Survey Participants .............................................................................................................................................................. 6
Remote Work Practices ....................................................................................................................................................... 8
Remote Work Policy ................................................................................................................................................................ 8 Remote Work Policy – By Industry .......................................................................................................................................... 8 Remote Work Policy – Ongoing & Permanent or Temporary ................................................................................................. 9 Remote Work Policy – Ongoing & Permanent or Temporary – By Industry ........................................................................... 9 Changes to Remote Work Policy after COVID-19 is Brought Under Control ........................................................................ 10 Remote Work Policy Development ....................................................................................................................................... 10 Remote Work Eligibility ......................................................................................................................................................... 11 Remote Work Policy Guidelines and Eligibility ..................................................................................................................... 11 Percent Remote Work Permitted ......................................................................................................................................... 12 Guidelines / Restrictions on Remote Work Location ............................................................................................................ 13 Guidelines / Restrictions on Remote Work Location– By Industry ....................................................................................... 14 Considering Adding Location Guidelines / Restrictions ........................................................................................................ 15
Use of Geographic Differentials ......................................................................................................................................... 16
Use of Geographic Differentials – By Industry ...................................................................................................................... 18 Organizations Considering Adopting Geographic Differentiated Compensation Policy ....................................................... 19 Components of Pay Affected by Geographic Differentials ................................................................................................... 20 Geographic Differentials for Employees who work 100% Remotely .................................................................................... 21 Geographic Differentials for Hybrid Office / Remote Employees ......................................................................................... 22 Tracking Remote Workforce Location .................................................................................................................................. 23 Number of Geographic Salary Areas ..................................................................................................................................... 24 Basis for Geographic Salary Areas ......................................................................................................................................... 24 Lowest and Highest Geographic Differentials ....................................................................................................................... 25 Geographic Policy – Applicable Levels .................................................................................................................................. 25 Geographic Policy – Applicable Salary Levels........................................................................................................................ 26 Geographic Policy – Applicable Businesses / Functions ........................................................................................................ 26 Individual Initiated Relocations............................................................................................................................................. 27 Company Initiated Relocations ............................................................................................................................................. 28
Remote Work Equipment / Expenses Covered .................................................................................................................. 29
©2021 Empsight International, LLC Page 4
Introduction
Empsight conducted a Spot Survey of Fortune 500 and large multi-national companies between November 8th and December 14th, 2020 on Salary Budget Forecasts & Remote Work Practices. The analyses are based on the answers provided, in whole or in part, by 202 companies. The results for this survey have been published in two parts.
• Part 1. Salary Budget, STI and LTI Forecasts for 2021 • Part 2. Remote Work Practices
Both of these reports are available for download at: https://www.empsight.com/Policies-Practices-Survey-Results Part 2, which is this report, covers the following topics:
• Remote Work Practices • Use of Geographic Differentials • Remote Work Equipment / Expenses
About Empsight Empsight International, LLC is a human resource consulting firm which helps employers make better decisions about their investment in people. Empsight’s compensation surveys enable Fortune 500 and large multinational corporations to benchmark their critical functional areas against other relevant peers. Our surveys are seen as definitive data reference sources in markets where such information is critical to maintaining competitiveness. The surveys cover key corporate functional areas, with an emphasis on new and emerging roles. Our survey participation tools are streamlined and designed for ease of use. We rely on input and feedback from our Survey Advisory Group comprised of industry leaders to keep our surveys competitive and on-point. Our Principals and staff have significant experience in consulting on compensation, organizational and human resource issues across multiple industry sectors. For information about this report please contact Jeremy Feinstein at [email protected] or (212) 683-7745 ext. 101. For more information about Empsight please visit https://www.empsight.com/
©2021 Empsight International, LLC Page 5
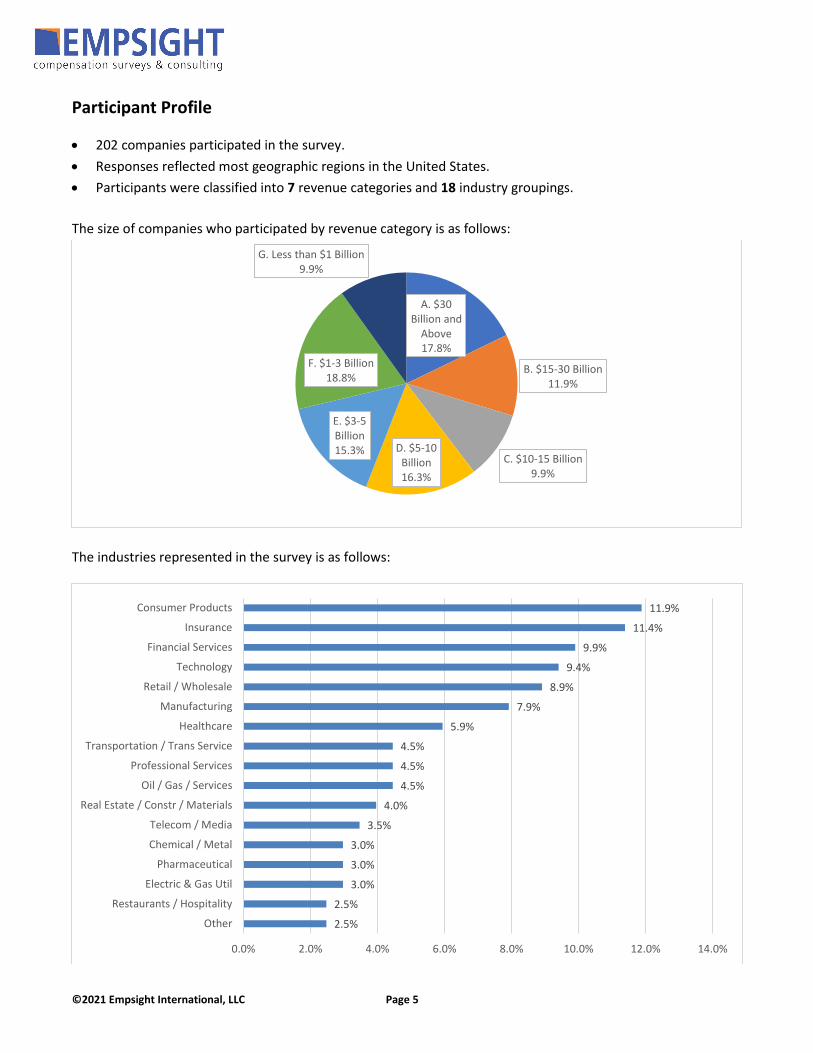
Participant Profile
• 202 companies participated in the survey. • Responses reflected most geographic regions in the United States. • Participants were classified into 7 revenue categories and 18 industry groupings. The size of companies who participated by revenue category is as follows:
The industries represented in the survey is as follows:
A. $30 Billion and
Above17.8%
B. $15-30 Billion11.9%
C. $10-15 Billion9.9%
D. $5-10 Billion16.3%
E. $3-5 Billion15.3%
F. $1-3 Billion18.8%
G. Less than $1 Billion9.9%
11.9%
11.4%
9.9%
9.4%
8.9%
7.9%
5.9%
4.5%
4.5%
4.5%
4.0%
3.5%
3.0%
3.0%
3.0%
2.5%
2.5%
0.0% 2.0% 4.0% 6.0% 8.0% 10.0% 12.0% 14.0%
Consumer Products
Insurance
Financial Services
Technology
Retail / Wholesale
Manufacturing
Healthcare
Transportation / Trans Service
Professional Services
Oil / Gas / Services
Real Estate / Constr / Materials
Telecom / Media
Chemical / Metal
Pharmaceutical
Electric & Gas Util
Restaurants / Hospitality
Other
©2021 Empsight International, LLC Page 6
Survey Participants AbbVie Advocate Aurora Health AGCO AkzoNobel Alliance Data American National Insurance Company American Red Cross Amica Mutual Ins Co Asahi Kasei America, Inc ASCAP AT&T Autoliv Automobile Club of Southern California AvalonBay Communities AvidXchange BASF SE Baxter Bed Bath and Beyond Benchmark Electronics bp Brighthouse Financial Cabot Corporation Campbell Soup Capital One Cargill Casey's General Store CBRE Centene Corporation Charter Communications Church & Dwight Citizens Bank Citizens Property Insurance Corporation Colgate Palmolive Columbia University Community Health Network Coty Crowe LLP Cynosure Dell Technologies Deloitte Touche Tohmatsu Designer Brands Inc Dewberry
Dole Packaged Foods Dollar General Dominion Energy, Inc. Dril-Quip DTE Energy Echostar - Hughes Network Systems Entergy Enterprise Products Equitable Equity Residential Expedia Group Facebook Fairway Independent Mortgage Farmers Insurance FedEx Corporation Fifth Third Bank First United Bank FIS Fortive Franklin Templeton Frank's International Freeport-McMoRan Fugro Gartner Genpact LLC Genuine Parts Company Google Granite Construction Inc. Gruma Corporation Guardian Life Insurance H.B. Fuller Company Hanes Inc Harris Health System Hawaiian Airlines Henkel Hewlett Packard Enterprise Hilton Grand Vacations Hormel Foods Houston Methodist Humana Inc. Intel International Paper IP Infusion Johnson & Johnson
Kaiser Permanente Kao USA Kellogg Kohl's, Inc. Lamb Weston Land O'Lakes Landis+Gyr L Brands Ledcor Legal & General America Lennar Lexmark International Inc Liberty Mutual Insurance LMI L’Oréal USA Lowe's Companies Inc Lumen Technologies Lyondellbasell M&T Bank Corp Macy's Marriott International Marsh & McLennan Companies Mary Kay Inc. Mattel, Inc. MD Anderson Cancer Center MDU Resources Group, Inc. Memorial Sloan Kettering Cancer Center Merck Mercury Insurance MetLife Micron Moody's Corporation MOOG, Inc. Mutual of Omaha Nationwide Insurance Navy Federal Credit Union New York Presbyterian Hospital Nexteer Automotive NextEra Energy Inc Niagara Bottling, LLC Noblis Nordson Norfolk Southern Northwestern Mutual
©2021 Empsight International, LLC Page 7
Northwestern University NuStar Energy L.P. NVR, INC. ON Semiconductor OnDeck Patterson-UTI PepsiCo Plains All American Polaris Industries Port Houston Principal Financial Grou Public Service Enterprise Group PVH Corp. Qurate Retail Group R/GA Reckitt Beckiser US Republic National Distributing Company Robert Half International Inc Sanofi SAP SE Savage Services SC Johnson Schneider National, Inc. Schwans Seagen
Sentry Insurance Siemens USA Simon Property Group Sinai Health Systems Smart & Final Spectrum Brands Starbucks Coffee Company Steelcase Swiss Re Symetra Financial The Clorox Company The E.W. Scripps Co The Estee Lauder Companies The Hanover Insurance Group The Home Depot, Inc. The Lubrizol Corporation The Manitowoc Company, Inc. The Menninger Clinic The Mosaic Company The Progressive Corporation Thrivent Financial Tiffany & Co. Toshiba Global Commerce Solutions, Inc. Toyota Motor North America Tyson Foods Inc.
U.S. Bank Under Armour UnitedHealth Group University of Texas Medical Branch US Xpress, Inc. Valero Energy Valvoline Inc. Varo Money Vertex Inc. Volvo Group Voya Financial Walgreens WarnerMedia, LLC Washington University Waste Management Wheels Wiley WoodmenLife Worthington Industries Wyndham Destinations Yum! Brands Zurich North America
©2021 Empsight International, LLC Page 8
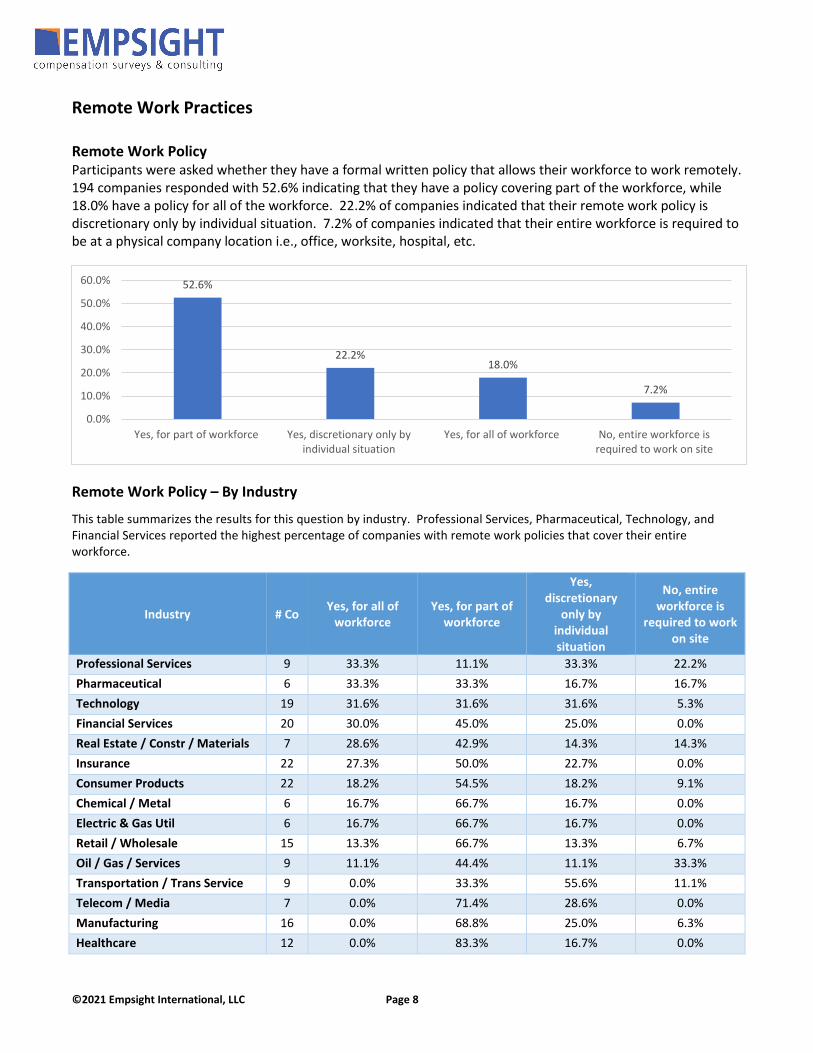
Remote Work Practices Remote Work Policy Participants were asked whether they have a formal written policy that allows their workforce to work remotely. 194 companies responded with 52.6% indicating that they have a policy covering part of the workforce, while 18.0% have a policy for all of the workforce. 22.2% of companies indicated that their remote work policy is discretionary only by individual situation. 7.2% of companies indicated that their entire workforce is required to be at a physical company location i.e., office, worksite, hospital, etc.
Remote Work Policy – By Industry
This table summarizes the results for this question by industry. Professional Services, Pharmaceutical, Technology, and Financial Services reported the highest percentage of companies with remote work policies that cover their entire workforce.
Industry # Co Yes, for all of workforce
Yes, for part of workforce
Yes, discretionary
only by individual situation
No, entire workforce is
required to work on site
Professional Services 9 33.3% 11.1% 33.3% 22.2% Pharmaceutical 6 33.3% 33.3% 16.7% 16.7% Technology 19 31.6% 31.6% 31.6% 5.3% Financial Services 20 30.0% 45.0% 25.0% 0.0% Real Estate / Constr / Materials 7 28.6% 42.9% 14.3% 14.3% Insurance 22 27.3% 50.0% 22.7% 0.0% Consumer Products 22 18.2% 54.5% 18.2% 9.1% Chemical / Metal 6 16.7% 66.7% 16.7% 0.0% Electric & Gas Util 6 16.7% 66.7% 16.7% 0.0% Retail / Wholesale 15 13.3% 66.7% 13.3% 6.7% Oil / Gas / Services 9 11.1% 44.4% 11.1% 33.3% Transportation / Trans Service 9 0.0% 33.3% 55.6% 11.1% Telecom / Media 7 0.0% 71.4% 28.6% 0.0% Manufacturing 16 0.0% 68.8% 25.0% 6.3% Healthcare 12 0.0% 83.3% 16.7% 0.0%
52.6%
22.2%18.0%
7.2%
0.0%
10.0%
20.0%
30.0%
40.0%
50.0%
60.0%
Yes, for part of workforce Yes, discretionary only byindividual situation
Yes, for all of workforce No, entire workforce isrequired to work on site
©2021 Empsight International, LLC Page 9
Remote Work Policy – Ongoing & Permanent or Temporary
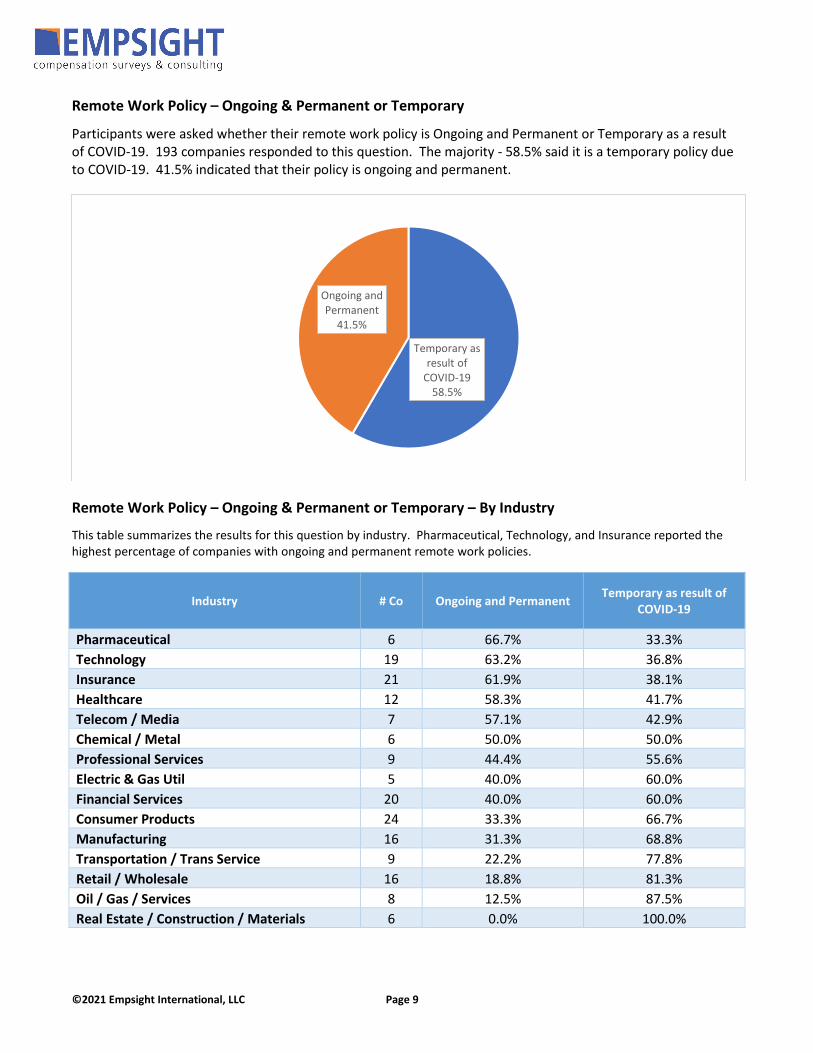
Participants were asked whether their remote work policy is Ongoing and Permanent or Temporary as a result of COVID-19. 193 companies responded to this question. The majority - 58.5% said it is a temporary policy due to COVID-19. 41.5% indicated that their policy is ongoing and permanent.
Remote Work Policy – Ongoing & Permanent or Temporary – By Industry
This table summarizes the results for this question by industry. Pharmaceutical, Technology, and Insurance reported the highest percentage of companies with ongoing and permanent remote work policies.
Industry # Co Ongoing and Permanent Temporary as result of COVID-19
Pharmaceutical 6 66.7% 33.3% Technology 19 63.2% 36.8% Insurance 21 61.9% 38.1% Healthcare 12 58.3% 41.7% Telecom / Media 7 57.1% 42.9% Chemical / Metal 6 50.0% 50.0% Professional Services 9 44.4% 55.6% Electric & Gas Util 5 40.0% 60.0% Financial Services 20 40.0% 60.0% Consumer Products 24 33.3% 66.7% Manufacturing 16 31.3% 68.8% Transportation / Trans Service 9 22.2% 77.8% Retail / Wholesale 16 18.8% 81.3% Oil / Gas / Services 8 12.5% 87.5% Real Estate / Construction / Materials 6 0.0% 100.0%
Temporary as result of
COVID-19 58.5%
Ongoing and Permanent
41.5%
©2021 Empsight International, LLC Page 10
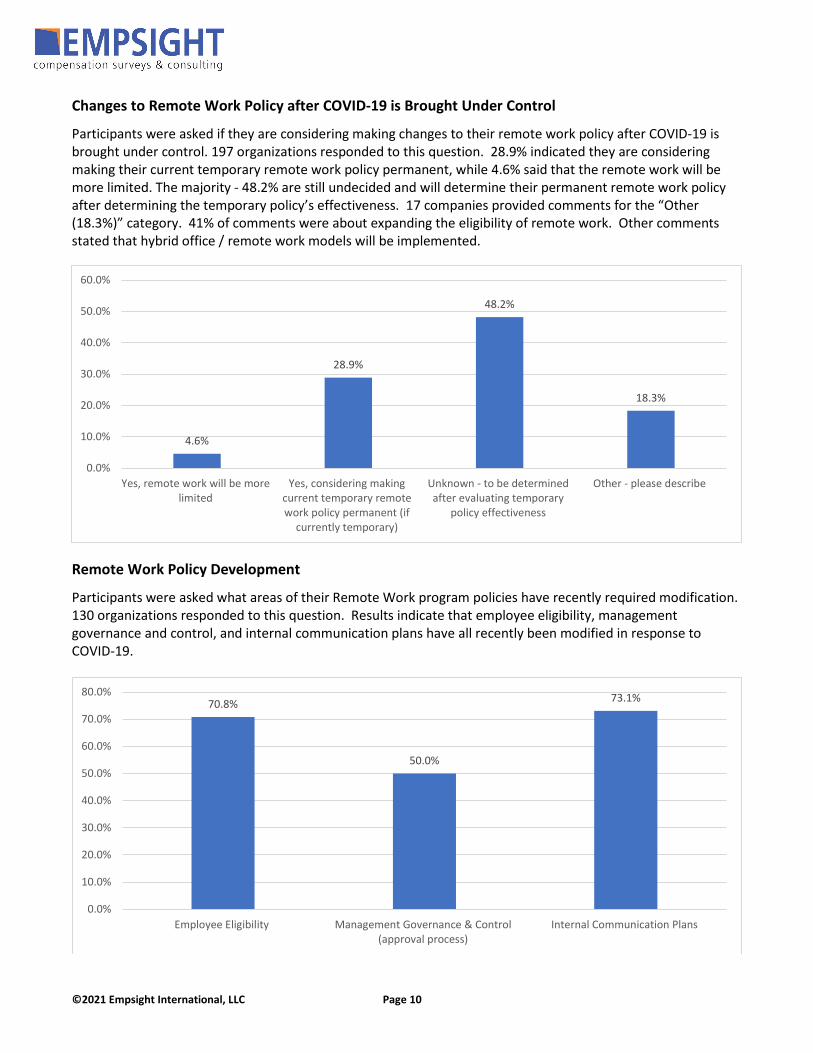
Changes to Remote Work Policy after COVID-19 is Brought Under Control
Participants were asked if they are considering making changes to their remote work policy after COVID-19 is brought under control. 197 organizations responded to this question. 28.9% indicated they are considering making their current temporary remote work policy permanent, while 4.6% said that the remote work will be more limited. The majority - 48.2% are still undecided and will determine their permanent remote work policy after determining the temporary policy’s effectiveness. 17 companies provided comments for the “Other (18.3%)” category. 41% of comments were about expanding the eligibility of remote work. Other comments stated that hybrid office / remote work models will be implemented.
Remote Work Policy Development
Participants were asked what areas of their Remote Work program policies have recently required modification. 130 organizations responded to this question. Results indicate that employee eligibility, management governance and control, and internal communication plans have all recently been modified in response to COVID-19.
4.6%
28.9%
48.2%
18.3%
0.0%
10.0%
20.0%
30.0%
40.0%
50.0%
60.0%
Yes, remote work will be morelimited
Yes, considering makingcurrent temporary remotework policy permanent (if
currently temporary)
Unknown - to be determinedafter evaluating temporary
policy effectiveness
Other - please describe
70.8%
50.0%
73.1%
0.0%
10.0%
20.0%
30.0%
40.0%
50.0%
60.0%
70.0%
80.0%
Employee Eligibility Management Governance & Control(approval process)
Internal Communication Plans
©2021 Empsight International, LLC Page 11
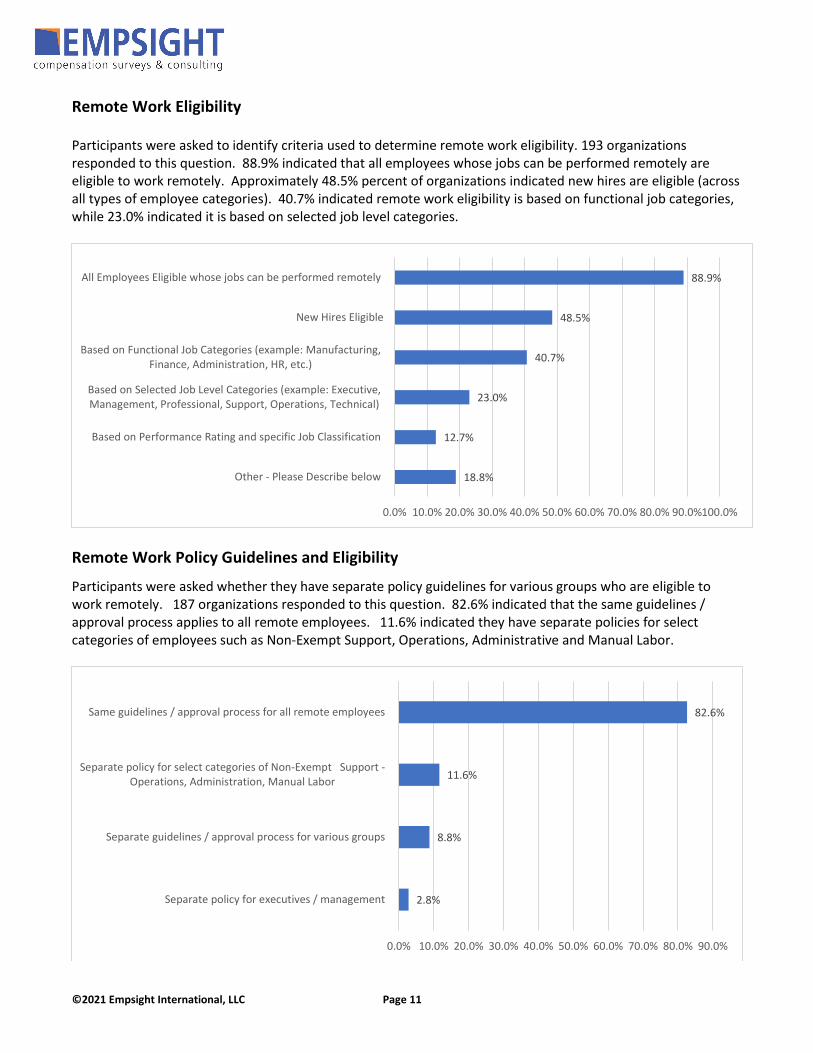
Remote Work Eligibility Participants were asked to identify criteria used to determine remote work eligibility. 193 organizations responded to this question. 88.9% indicated that all employees whose jobs can be performed remotely are eligible to work remotely. Approximately 48.5% percent of organizations indicated new hires are eligible (across all types of employee categories). 40.7% indicated remote work eligibility is based on functional job categories, while 23.0% indicated it is based on selected job level categories.
Remote Work Policy Guidelines and Eligibility
Participants were asked whether they have separate policy guidelines for various groups who are eligible to work remotely. 187 organizations responded to this question. 82.6% indicated that the same guidelines / approval process applies to all remote employees. 11.6% indicated they have separate policies for select categories of employees such as Non-Exempt Support, Operations, Administrative and Manual Labor.
18.8%
12.7%
23.0%
40.7%
48.5%
88.9%
0.0% 10.0% 20.0% 30.0% 40.0% 50.0% 60.0% 70.0% 80.0% 90.0%100.0%
Other - Please Describe below
Based on Performance Rating and specific Job Classification
Based on Selected Job Level Categories (example: Executive,Management, Professional, Support, Operations, Technical)
Based on Functional Job Categories (example: Manufacturing,Finance, Administration, HR, etc.)
New Hires Eligible
All Employees Eligible whose jobs can be performed remotely
2.8%
8.8%
11.6%
82.6%
0.0% 10.0% 20.0% 30.0% 40.0% 50.0% 60.0% 70.0% 80.0% 90.0%
Separate policy for executives / management
Separate guidelines / approval process for various groups
Separate policy for select categories of Non-Exempt Support -Operations, Administration, Manual Labor
Same guidelines / approval process for all remote employees
©2021 Empsight International, LLC Page 12
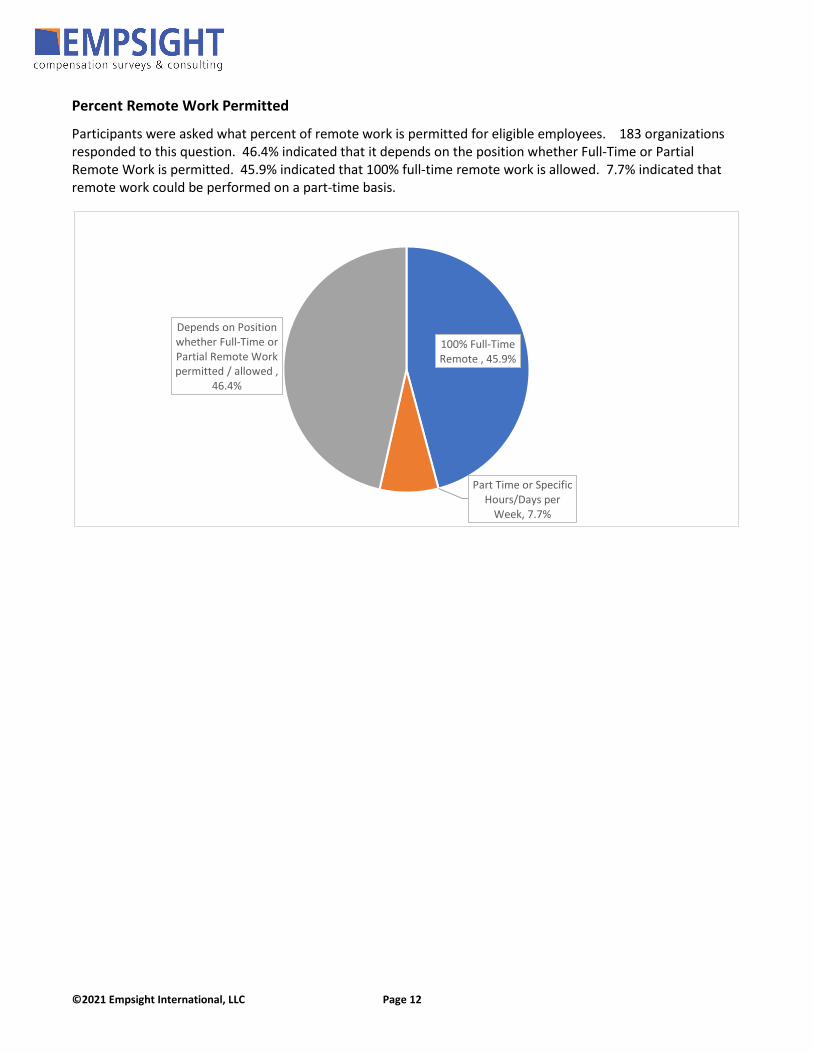
Percent Remote Work Permitted
Participants were asked what percent of remote work is permitted for eligible employees. 183 organizations responded to this question. 46.4% indicated that it depends on the position whether Full-Time or Partial Remote Work is permitted. 45.9% indicated that 100% full-time remote work is allowed. 7.7% indicated that remote work could be performed on a part-time basis.
100% Full-Time Remote , 45.9%
Part Time or Specific Hours/Days per
Week, 7.7%
Depends on Position whether Full-Time or Partial Remote Work permitted / allowed ,
46.4%
©2021 Empsight International, LLC Page 13
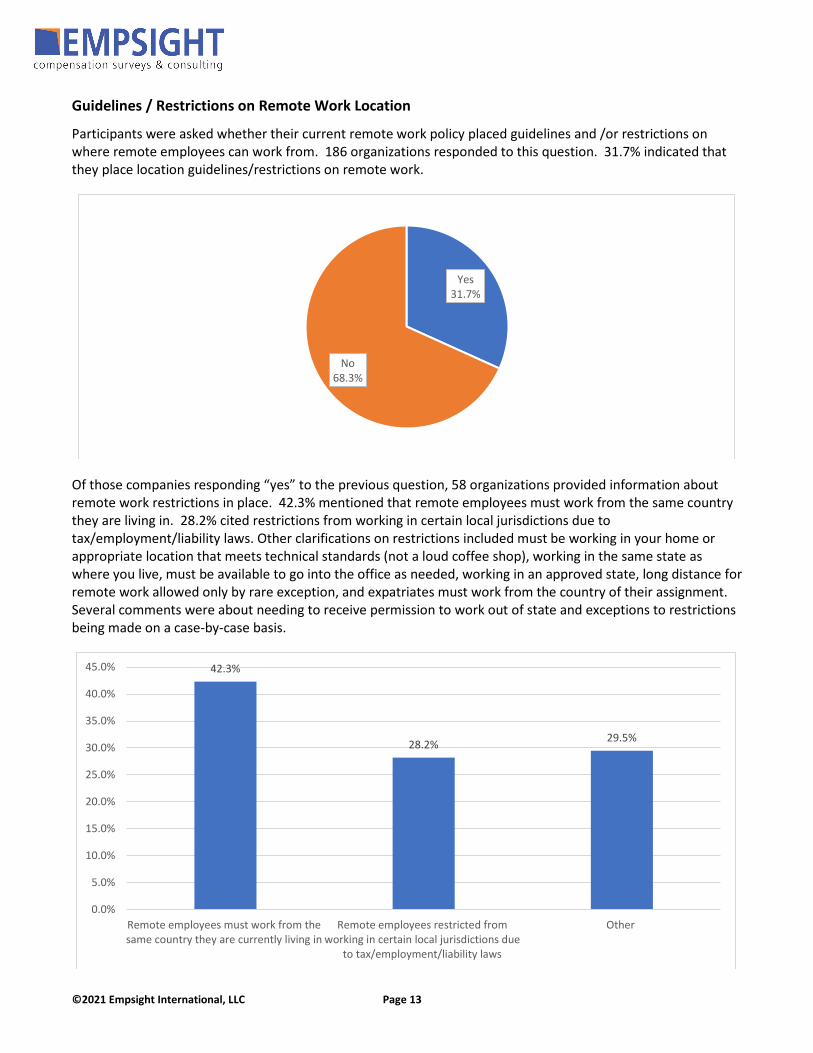
Guidelines / Restrictions on Remote Work Location
Participants were asked whether their current remote work policy placed guidelines and /or restrictions on where remote employees can work from. 186 organizations responded to this question. 31.7% indicated that they place location guidelines/restrictions on remote work.
Of those companies responding “yes” to the previous question, 58 organizations provided information about remote work restrictions in place. 42.3% mentioned that remote employees must work from the same country they are living in. 28.2% cited restrictions from working in certain local jurisdictions due to tax/employment/liability laws. Other clarifications on restrictions included must be working in your home or appropriate location that meets technical standards (not a loud coffee shop), working in the same state as where you live, must be available to go into the office as needed, working in an approved state, long distance for remote work allowed only by rare exception, and expatriates must work from the country of their assignment. Several comments were about needing to receive permission to work out of state and exceptions to restrictions being made on a case-by-case basis.
Yes 31.7%
No 68.3%
42.3%
28.2% 29.5%
0.0%
5.0%
10.0%
15.0%
20.0%
25.0%
30.0%
35.0%
40.0%
45.0%
Remote employees must work from thesame country they are currently living in
Remote employees restricted fromworking in certain local jurisdictions due
to tax/employment/liability laws
Other
©2021 Empsight International, LLC Page 14
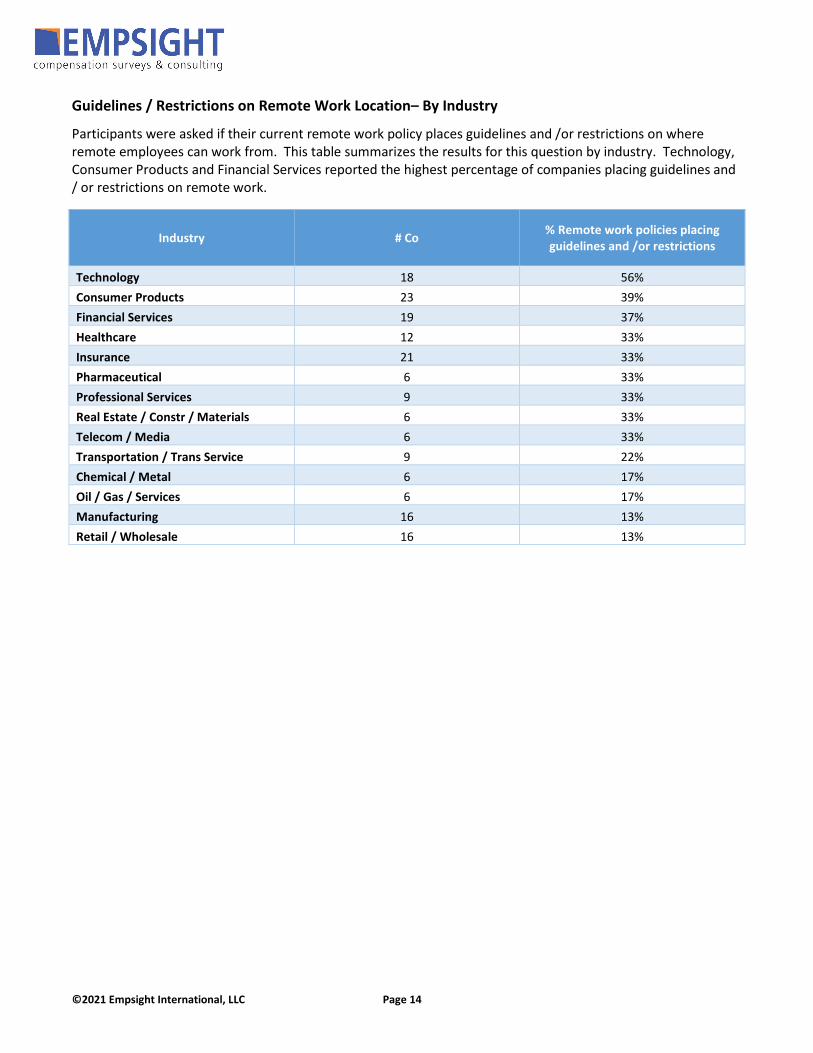
Guidelines / Restrictions on Remote Work Location– By Industry
Participants were asked if their current remote work policy places guidelines and /or restrictions on where remote employees can work from. This table summarizes the results for this question by industry. Technology, Consumer Products and Financial Services reported the highest percentage of companies placing guidelines and / or restrictions on remote work.
Industry # Co % Remote work policies placing guidelines and /or restrictions
Technology 18 56% Consumer Products 23 39% Financial Services 19 37% Healthcare 12 33% Insurance 21 33% Pharmaceutical 6 33% Professional Services 9 33% Real Estate / Constr / Materials 6 33% Telecom / Media 6 33% Transportation / Trans Service 9 22% Chemical / Metal 6 17% Oil / Gas / Services 6 17% Manufacturing 16 13% Retail / Wholesale 16 13%
©2021 Empsight International, LLC Page 15
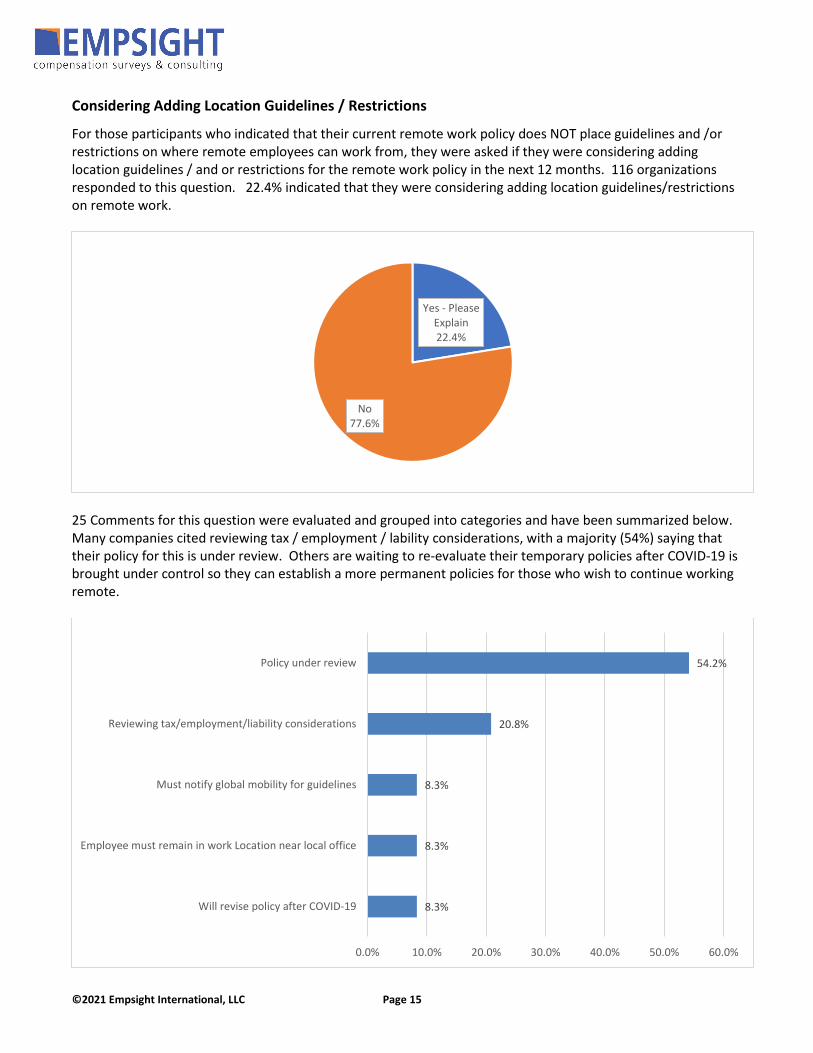
Considering Adding Location Guidelines / Restrictions
For those participants who indicated that their current remote work policy does NOT place guidelines and /or restrictions on where remote employees can work from, they were asked if they were considering adding location guidelines / and or restrictions for the remote work policy in the next 12 months. 116 organizations responded to this question. 22.4% indicated that they were considering adding location guidelines/restrictions on remote work.
25 Comments for this question were evaluated and grouped into categories and have been summarized below. Many companies cited reviewing tax / employment / lability considerations, with a majority (54%) saying that their policy for this is under review. Others are waiting to re-evaluate their temporary policies after COVID-19 is brought under control so they can establish a more permanent policies for those who wish to continue working remote.
Yes - Please Explain 22.4%
No 77.6%
54.2%
20.8%
8.3%
8.3%
8.3%
0.0% 10.0% 20.0% 30.0% 40.0% 50.0% 60.0%
Policy under review
Reviewing tax/employment/liability considerations
Must notify global mobility for guidelines
Employee must remain in work Location near local office
Will revise policy after COVID-19
©2021 Empsight International, LLC Page 16
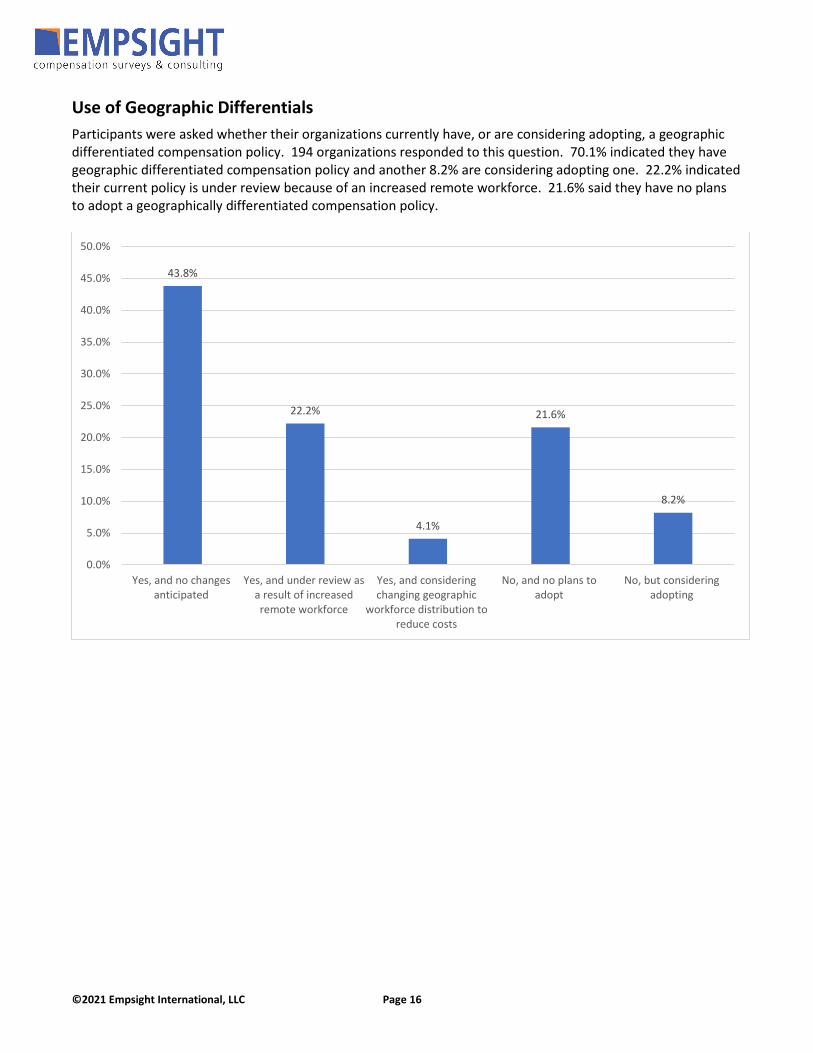
Use of Geographic Differentials Participants were asked whether their organizations currently have, or are considering adopting, a geographic differentiated compensation policy. 194 organizations responded to this question. 70.1% indicated they have geographic differentiated compensation policy and another 8.2% are considering adopting one. 22.2% indicated their current policy is under review because of an increased remote workforce. 21.6% said they have no plans to adopt a geographically differentiated compensation policy.
43.8%
22.2%
4.1%
21.6%
8.2%
0.0%
5.0%
10.0%
15.0%
20.0%
25.0%
30.0%
35.0%
40.0%
45.0%
50.0%
Yes, and no changesanticipated
Yes, and under review asa result of increasedremote workforce
Yes, and consideringchanging geographic
workforce distribution toreduce costs
No, and no plans toadopt
No, but consideringadopting
©2021 Empsight International, LLC Page 17
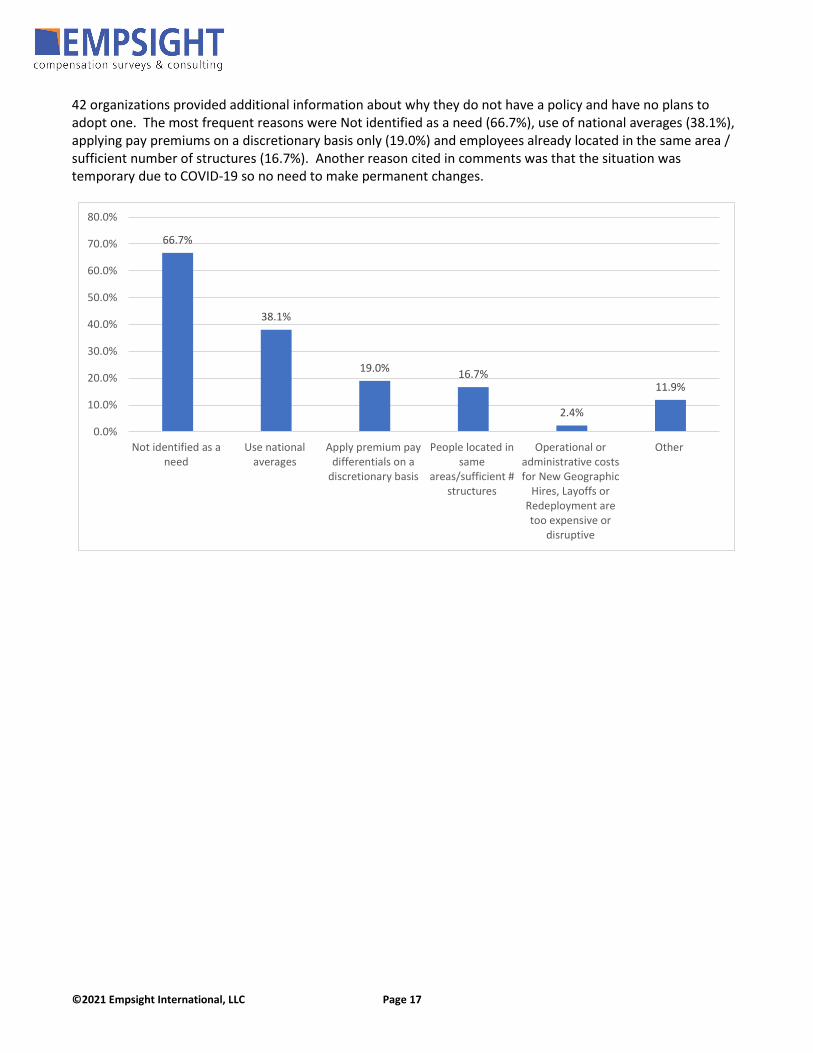
42 organizations provided additional information about why they do not have a policy and have no plans to adopt one. The most frequent reasons were Not identified as a need (66.7%), use of national averages (38.1%), applying pay premiums on a discretionary basis only (19.0%) and employees already located in the same area / sufficient number of structures (16.7%). Another reason cited in comments was that the situation was temporary due to COVID-19 so no need to make permanent changes.
66.7%
38.1%
19.0% 16.7%
2.4%
11.9%
0.0%
10.0%
20.0%
30.0%
40.0%
50.0%
60.0%
70.0%
80.0%
Not identified as aneed
Use nationalaverages
Apply premium paydifferentials on a
discretionary basis
People located insame
areas/sufficient #structures
Operational oradministrative costsfor New Geographic
Hires, Layoffs orRedeployment aretoo expensive or
disruptive
Other
©2021 Empsight International, LLC Page 18
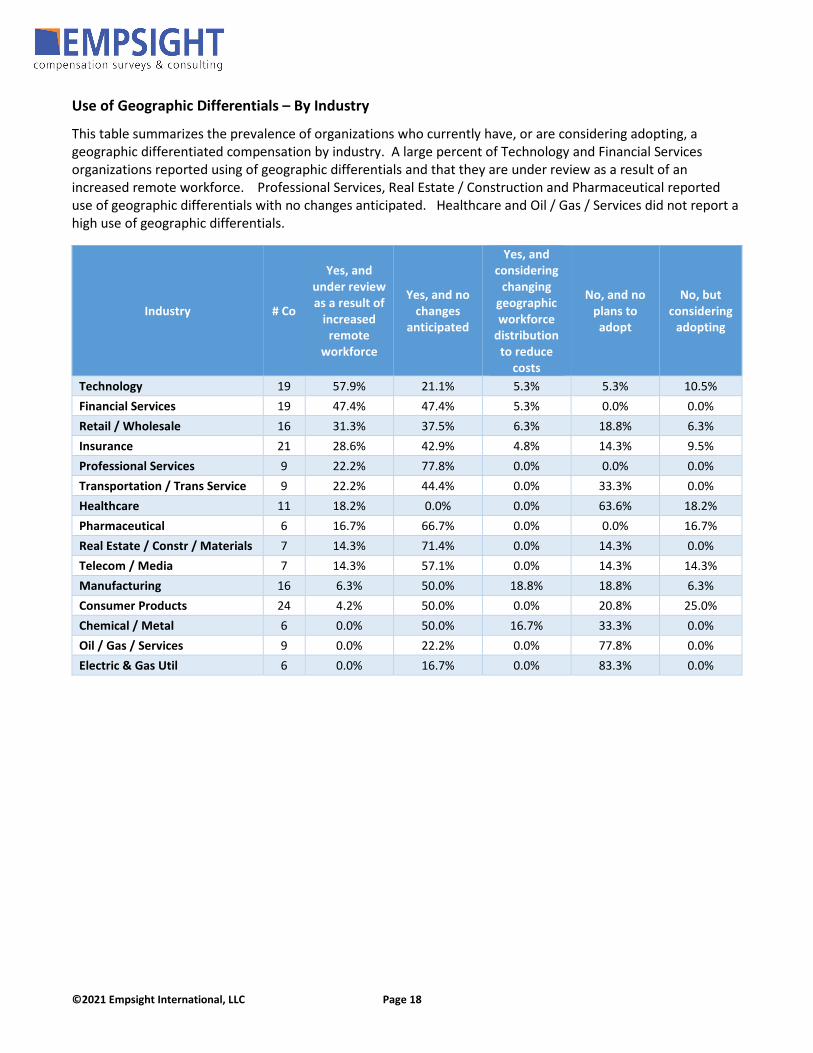
Use of Geographic Differentials – By Industry
This table summarizes the prevalence of organizations who currently have, or are considering adopting, a geographic differentiated compensation by industry. A large percent of Technology and Financial Services organizations reported using of geographic differentials and that they are under review as a result of an increased remote workforce. Professional Services, Real Estate / Construction and Pharmaceutical reported use of geographic differentials with no changes anticipated. Healthcare and Oil / Gas / Services did not report a high use of geographic differentials.
Industry # Co
Yes, and under review as a result of
increased remote
workforce
Yes, and no changes
anticipated
Yes, and considering
changing geographic workforce
distribution to reduce
costs
No, and no plans to adopt
No, but considering
adopting
Technology 19 57.9% 21.1% 5.3% 5.3% 10.5% Financial Services 19 47.4% 47.4% 5.3% 0.0% 0.0% Retail / Wholesale 16 31.3% 37.5% 6.3% 18.8% 6.3% Insurance 21 28.6% 42.9% 4.8% 14.3% 9.5% Professional Services 9 22.2% 77.8% 0.0% 0.0% 0.0% Transportation / Trans Service 9 22.2% 44.4% 0.0% 33.3% 0.0% Healthcare 11 18.2% 0.0% 0.0% 63.6% 18.2% Pharmaceutical 6 16.7% 66.7% 0.0% 0.0% 16.7% Real Estate / Constr / Materials 7 14.3% 71.4% 0.0% 14.3% 0.0% Telecom / Media 7 14.3% 57.1% 0.0% 14.3% 14.3% Manufacturing 16 6.3% 50.0% 18.8% 18.8% 6.3% Consumer Products 24 4.2% 50.0% 0.0% 20.8% 25.0% Chemical / Metal 6 0.0% 50.0% 16.7% 33.3% 0.0% Oil / Gas / Services 9 0.0% 22.2% 0.0% 77.8% 0.0% Electric & Gas Util 6 0.0% 16.7% 0.0% 83.3% 0.0%
©2021 Empsight International, LLC Page 19
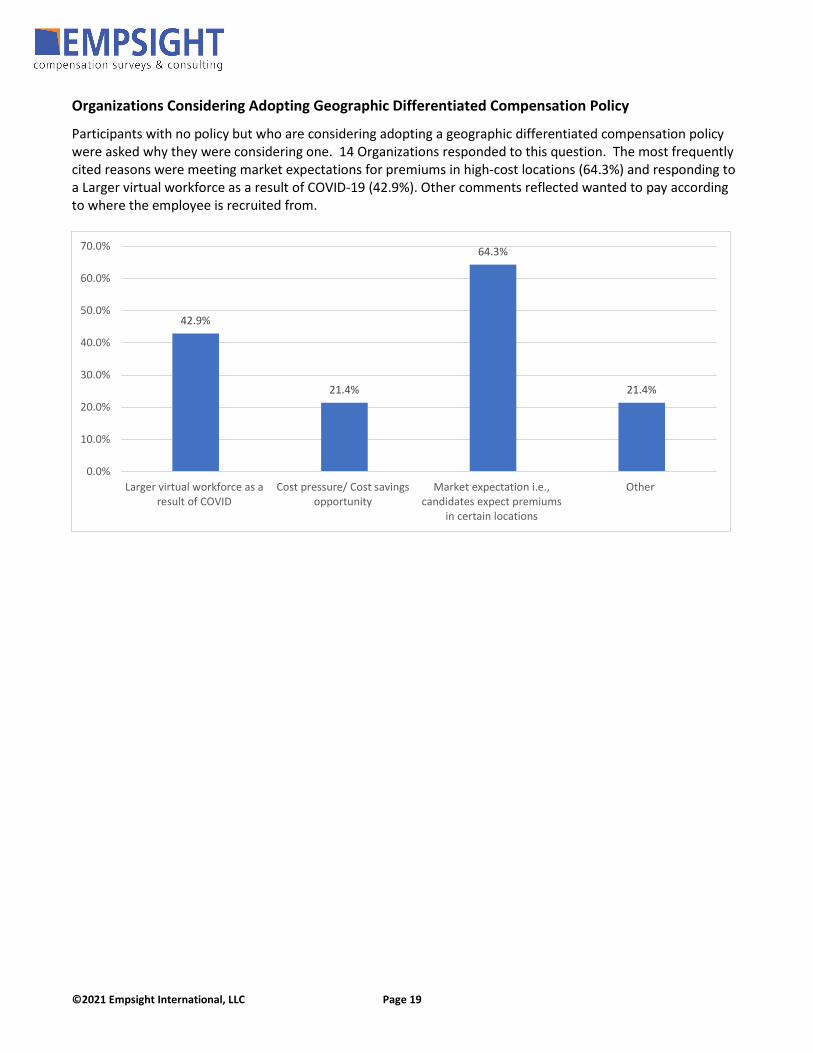
Organizations Considering Adopting Geographic Differentiated Compensation Policy
Participants with no policy but who are considering adopting a geographic differentiated compensation policy were asked why they were considering one. 14 Organizations responded to this question. The most frequently cited reasons were meeting market expectations for premiums in high-cost locations (64.3%) and responding to a Larger virtual workforce as a result of COVID-19 (42.9%). Other comments reflected wanted to pay according to where the employee is recruited from.
42.9%
21.4%
64.3%
21.4%
0.0%
10.0%
20.0%
30.0%
40.0%
50.0%
60.0%
70.0%
Larger virtual workforce as aresult of COVID
Cost pressure/ Cost savingsopportunity
Market expectation i.e.,candidates expect premiums
in certain locations
Other
©2021 Empsight International, LLC Page 20
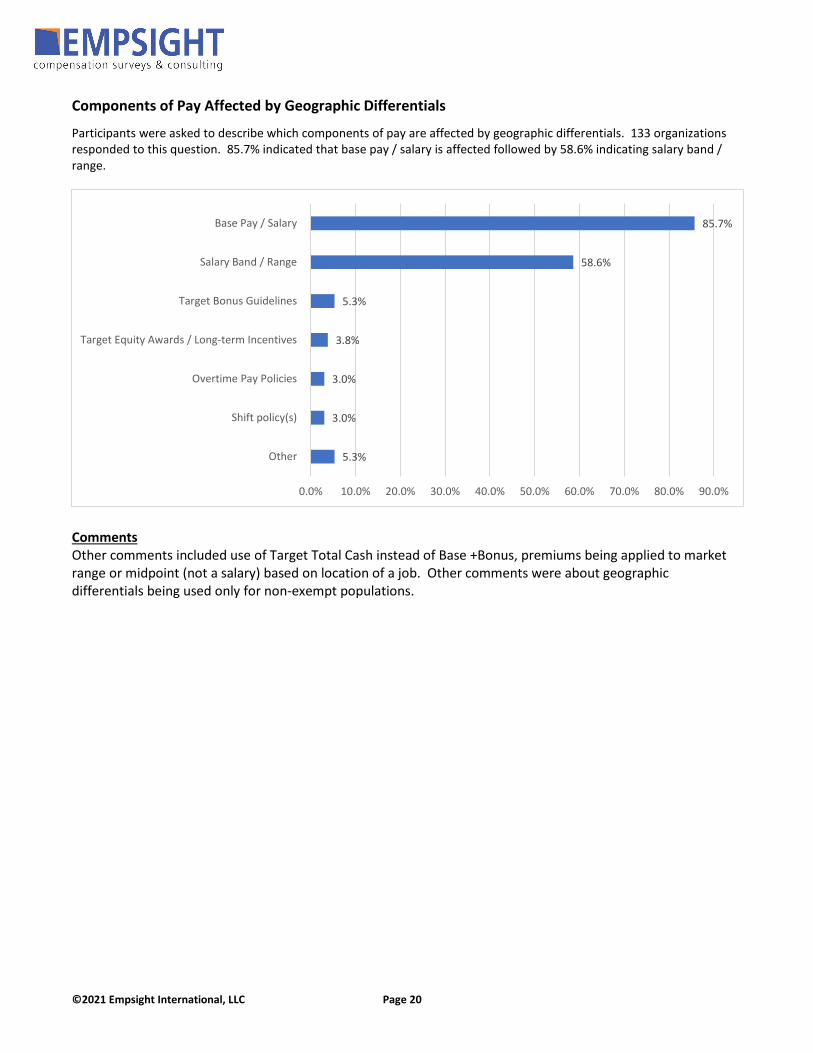
Components of Pay Affected by Geographic Differentials
Participants were asked to describe which components of pay are affected by geographic differentials. 133 organizations responded to this question. 85.7% indicated that base pay / salary is affected followed by 58.6% indicating salary band / range.
Comments Other comments included use of Target Total Cash instead of Base +Bonus, premiums being applied to market range or midpoint (not a salary) based on location of a job. Other comments were about geographic differentials being used only for non-exempt populations.
5.3%
3.0%
3.0%
3.8%
5.3%
58.6%
85.7%
0.0% 10.0% 20.0% 30.0% 40.0% 50.0% 60.0% 70.0% 80.0% 90.0%
Other
Shift policy(s)
Overtime Pay Policies
Target Equity Awards / Long-term Incentives
Target Bonus Guidelines
Salary Band / Range
Base Pay / Salary
©2021 Empsight International, LLC Page 21
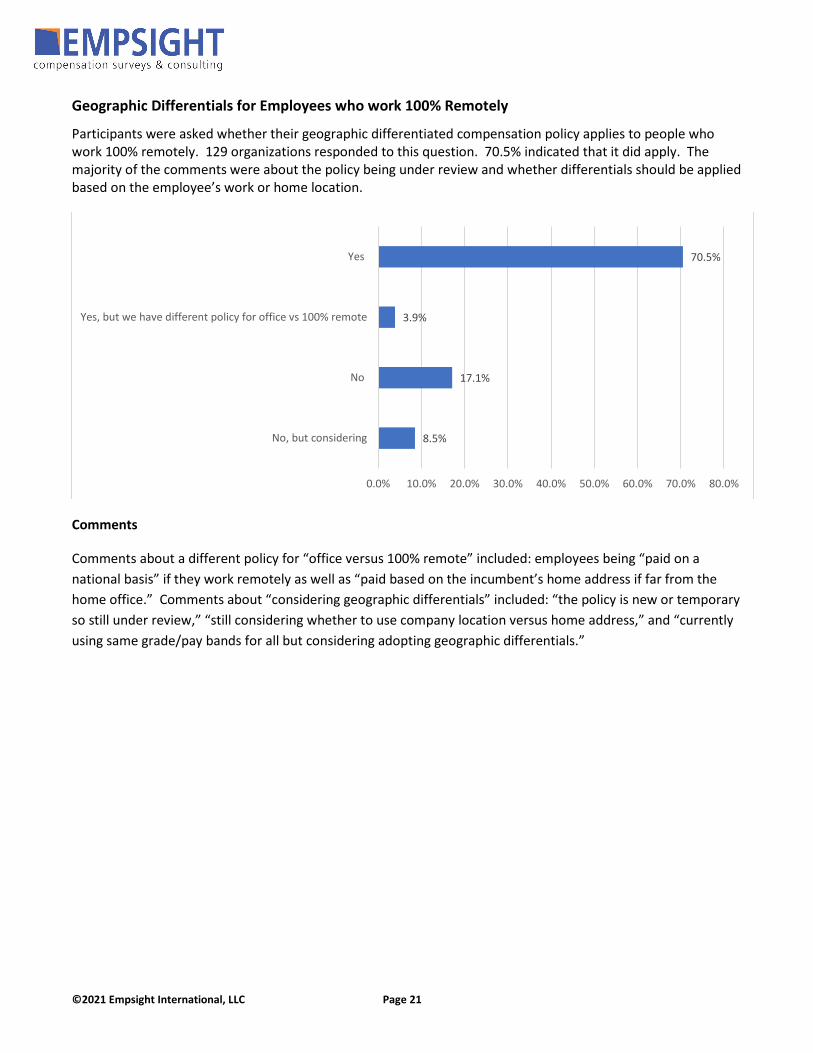
Geographic Differentials for Employees who work 100% Remotely
Participants were asked whether their geographic differentiated compensation policy applies to people who work 100% remotely. 129 organizations responded to this question. 70.5% indicated that it did apply. The majority of the comments were about the policy being under review and whether differentials should be applied based on the employee’s work or home location.
Comments
Comments about a different policy for “office versus 100% remote” included: employees being “paid on a national basis” if they work remotely as well as “paid based on the incumbent’s home address if far from the home office.” Comments about “considering geographic differentials” included: “the policy is new or temporary so still under review,” “still considering whether to use company location versus home address,” and “currently using same grade/pay bands for all but considering adopting geographic differentials.”
8.5%
17.1%
3.9%
70.5%
0.0% 10.0% 20.0% 30.0% 40.0% 50.0% 60.0% 70.0% 80.0%
No, but considering
No
Yes, but we have different policy for office vs 100% remote
Yes
©2021 Empsight International, LLC Page 22
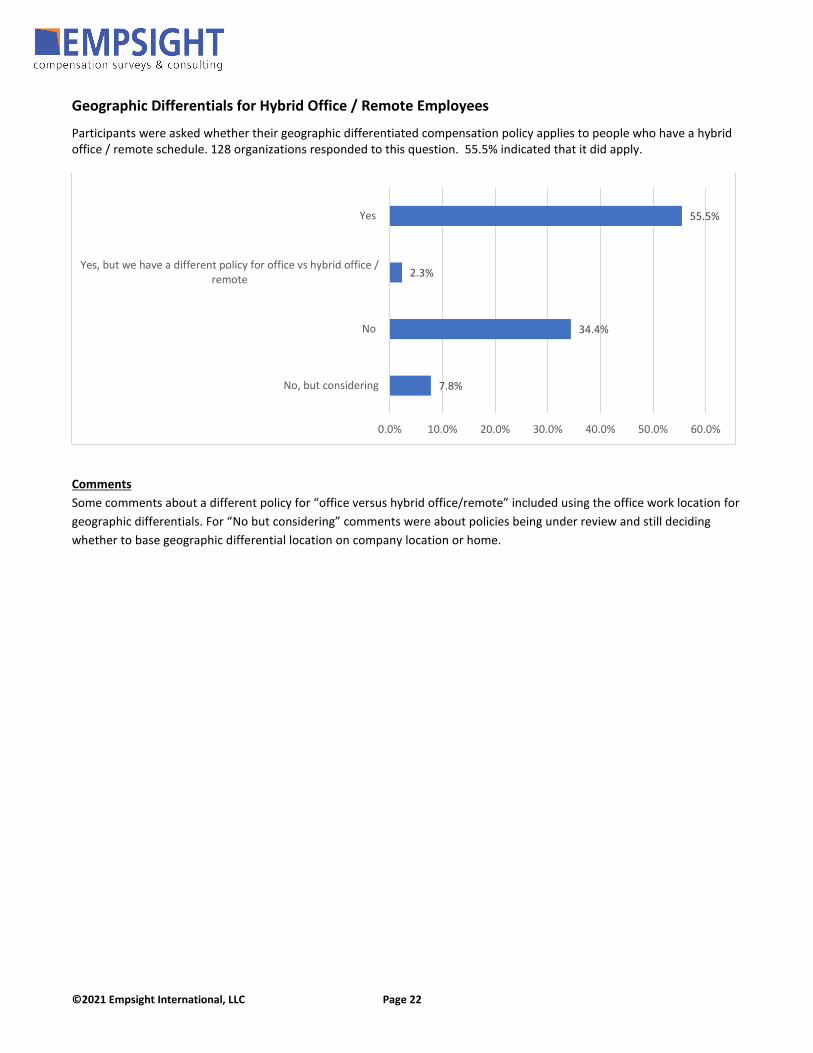
Geographic Differentials for Hybrid Office / Remote Employees
Participants were asked whether their geographic differentiated compensation policy applies to people who have a hybrid office / remote schedule. 128 organizations responded to this question. 55.5% indicated that it did apply.
Comments Some comments about a different policy for “office versus hybrid office/remote” included using the office work location for geographic differentials. For “No but considering” comments were about policies being under review and still deciding whether to base geographic differential location on company location or home.
7.8%
34.4%
2.3%
55.5%
0.0% 10.0% 20.0% 30.0% 40.0% 50.0% 60.0%
No, but considering
No
Yes, but we have a different policy for office vs hybrid office /remote
Yes
©2021 Empsight International, LLC Page 23
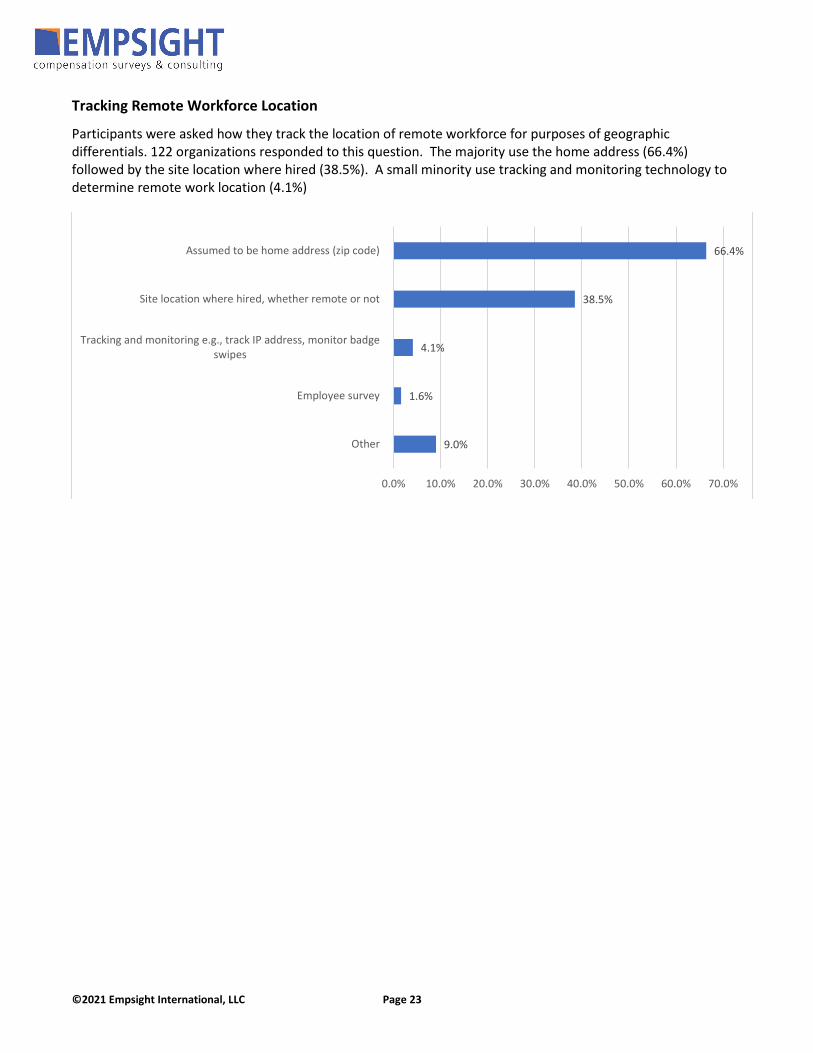
Tracking Remote Workforce Location
Participants were asked how they track the location of remote workforce for purposes of geographic differentials. 122 organizations responded to this question. The majority use the home address (66.4%) followed by the site location where hired (38.5%). A small minority use tracking and monitoring technology to determine remote work location (4.1%)
9.0%
1.6%
4.1%
38.5%
66.4%
0.0% 10.0% 20.0% 30.0% 40.0% 50.0% 60.0% 70.0%
Other
Employee survey
Tracking and monitoring e.g., track IP address, monitor badgeswipes
Site location where hired, whether remote or not
Assumed to be home address (zip code)
©2021 Empsight International, LLC Page 24
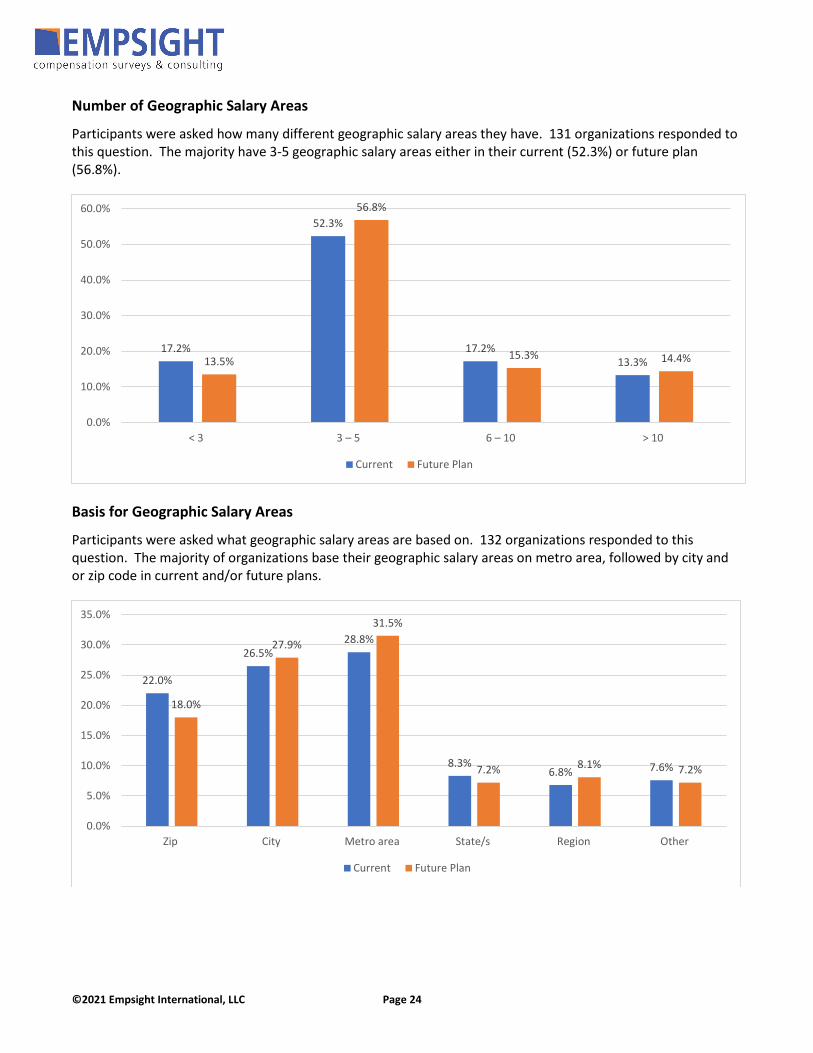
Number of Geographic Salary Areas
Participants were asked how many different geographic salary areas they have. 131 organizations responded to this question. The majority have 3-5 geographic salary areas either in their current (52.3%) or future plan (56.8%).
Basis for Geographic Salary Areas
Participants were asked what geographic salary areas are based on. 132 organizations responded to this question. The majority of organizations base their geographic salary areas on metro area, followed by city and or zip code in current and/or future plans.
17.2%
52.3%
17.2%13.3%13.5%
56.8%
15.3% 14.4%
0.0%
10.0%
20.0%
30.0%
40.0%
50.0%
60.0%
< 3 3 – 5 6 – 10 > 10
Current Future Plan
22.0%
26.5%28.8%
8.3%6.8% 7.6%
18.0%
27.9%
31.5%
7.2% 8.1% 7.2%
0.0%
5.0%
10.0%
15.0%
20.0%
25.0%
30.0%
35.0%
Zip City Metro area State/s Region Other
Current Future Plan
©2021 Empsight International, LLC Page 25
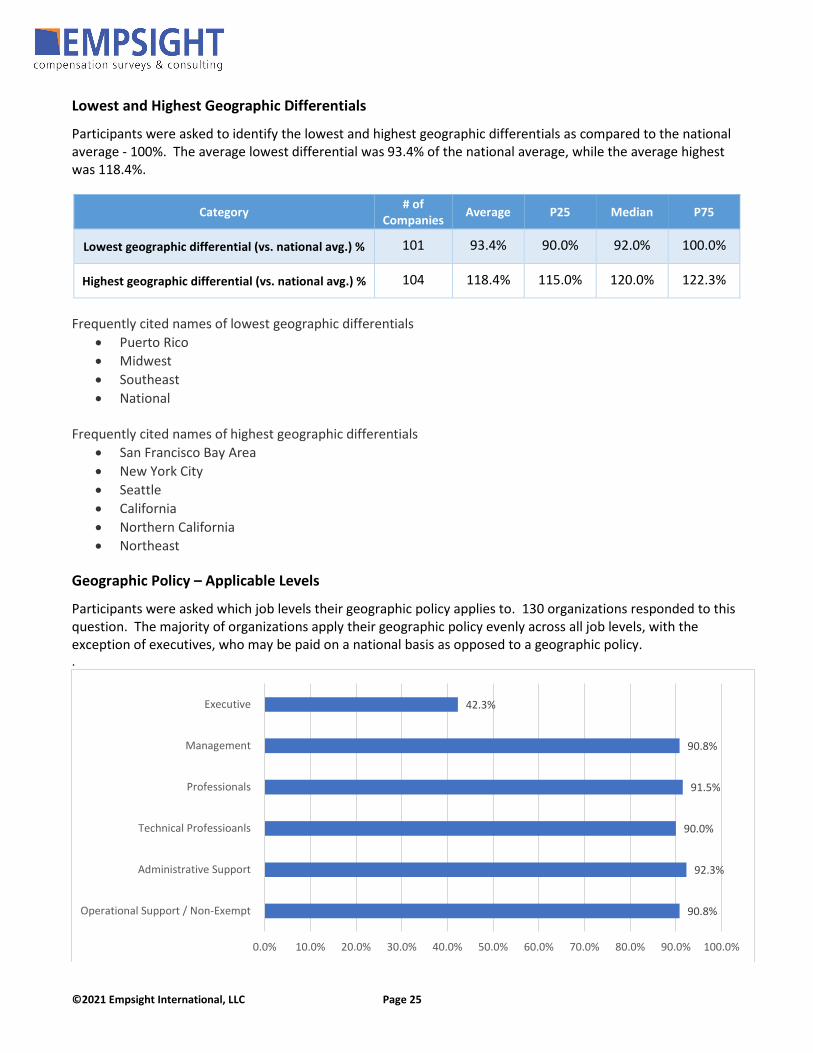
Lowest and Highest Geographic Differentials
Participants were asked to identify the lowest and highest geographic differentials as compared to the national average - 100%. The average lowest differential was 93.4% of the national average, while the average highest was 118.4%.
Category # of Companies Average P25 Median P75
Lowest geographic differential (vs. national avg.) % 101 93.4% 90.0% 92.0% 100.0%
Highest geographic differential (vs. national avg.) % 104 118.4% 115.0% 120.0% 122.3%
Frequently cited names of lowest geographic differentials
• Puerto Rico • Midwest • Southeast • National
Frequently cited names of highest geographic differentials
• San Francisco Bay Area • New York City • Seattle • California • Northern California • Northeast
Geographic Policy – Applicable Levels
Participants were asked which job levels their geographic policy applies to. 130 organizations responded to this question. The majority of organizations apply their geographic policy evenly across all job levels, with the exception of executives, who may be paid on a national basis as opposed to a geographic policy. .
90.8%
92.3%
90.0%
91.5%
90.8%
42.3%
0.0% 10.0% 20.0% 30.0% 40.0% 50.0% 60.0% 70.0% 80.0% 90.0% 100.0%
Operational Support / Non-Exempt
Administrative Support
Technical Professioanls
Professionals
Management
Executive
©2021 Empsight International, LLC Page 26
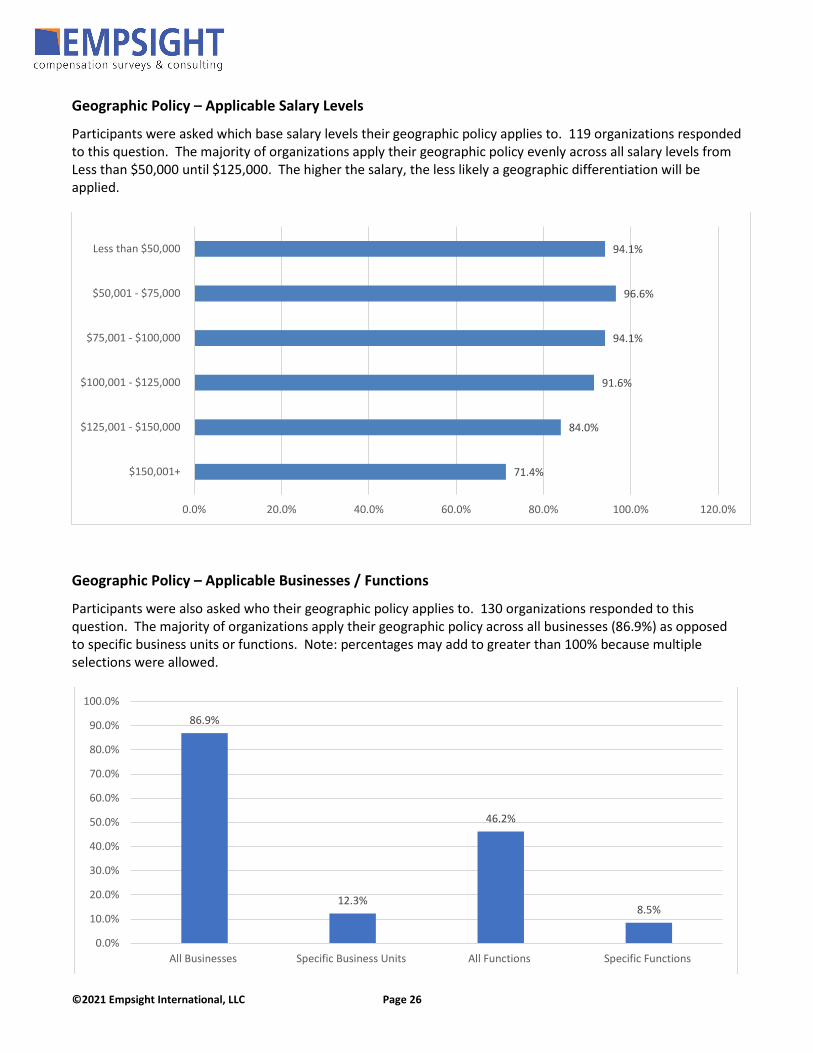
Geographic Policy – Applicable Salary Levels
Participants were asked which base salary levels their geographic policy applies to. 119 organizations responded to this question. The majority of organizations apply their geographic policy evenly across all salary levels from Less than $50,000 until $125,000. The higher the salary, the less likely a geographic differentiation will be applied.
Geographic Policy – Applicable Businesses / Functions
Participants were also asked who their geographic policy applies to. 130 organizations responded to this question. The majority of organizations apply their geographic policy across all businesses (86.9%) as opposed to specific business units or functions. Note: percentages may add to greater than 100% because multiple selections were allowed.
94.1%
96.6%
94.1%
91.6%
84.0%
71.4%
0.0% 20.0% 40.0% 60.0% 80.0% 100.0% 120.0%
Less than $50,000
$50,001 - $75,000
$75,001 - $100,000
$100,001 - $125,000
$125,001 - $150,000
$150,001+
86.9%
12.3%
46.2%
8.5%
0.0%
10.0%
20.0%
30.0%
40.0%
50.0%
60.0%
70.0%
80.0%
90.0%
100.0%
All Businesses Specific Business Units All Functions Specific Functions
©2021 Empsight International, LLC Page 27
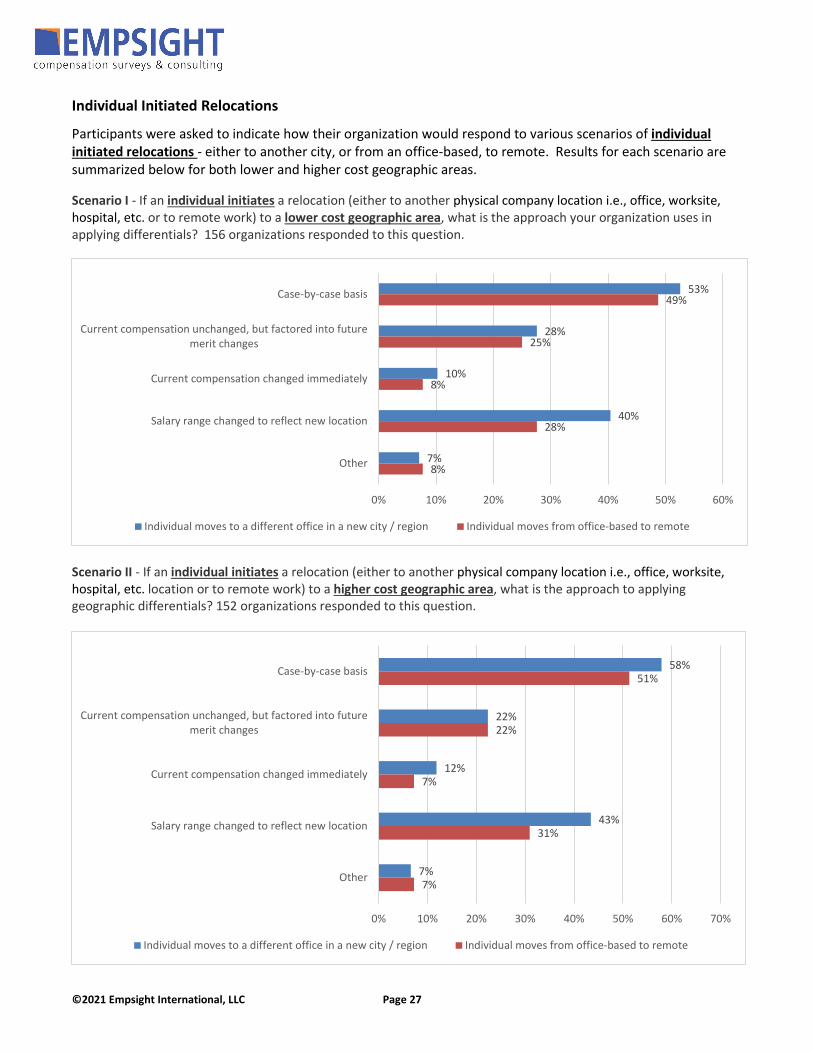
Individual Initiated Relocations
Participants were asked to indicate how their organization would respond to various scenarios of individual initiated relocations - either to another city, or from an office-based, to remote. Results for each scenario are summarized below for both lower and higher cost geographic areas.
Scenario I - If an individual initiates a relocation (either to another physical company location i.e., office, worksite, hospital, etc. or to remote work) to a lower cost geographic area, what is the approach your organization uses in applying differentials? 156 organizations responded to this question.
Scenario II - If an individual initiates a relocation (either to another physical company location i.e., office, worksite, hospital, etc. location or to remote work) to a higher cost geographic area, what is the approach to applying geographic differentials? 152 organizations responded to this question.
53%
28%
10%
40%
7%
49%
25%
8%
28%
8%
0% 10% 20% 30% 40% 50% 60%
Case-by-case basis
Current compensation unchanged, but factored into futuremerit changes
Current compensation changed immediately
Salary range changed to reflect new location
Other
Individual moves to a different office in a new city / region Individual moves from office-based to remote
58%
22%
12%
43%
7%
51%
22%
7%
31%
7%
0% 10% 20% 30% 40% 50% 60% 70%
Case-by-case basis
Current compensation unchanged, but factored into futuremerit changes
Current compensation changed immediately
Salary range changed to reflect new location
Other
Individual moves to a different office in a new city / region Individual moves from office-based to remote
©2021 Empsight International, LLC Page 28
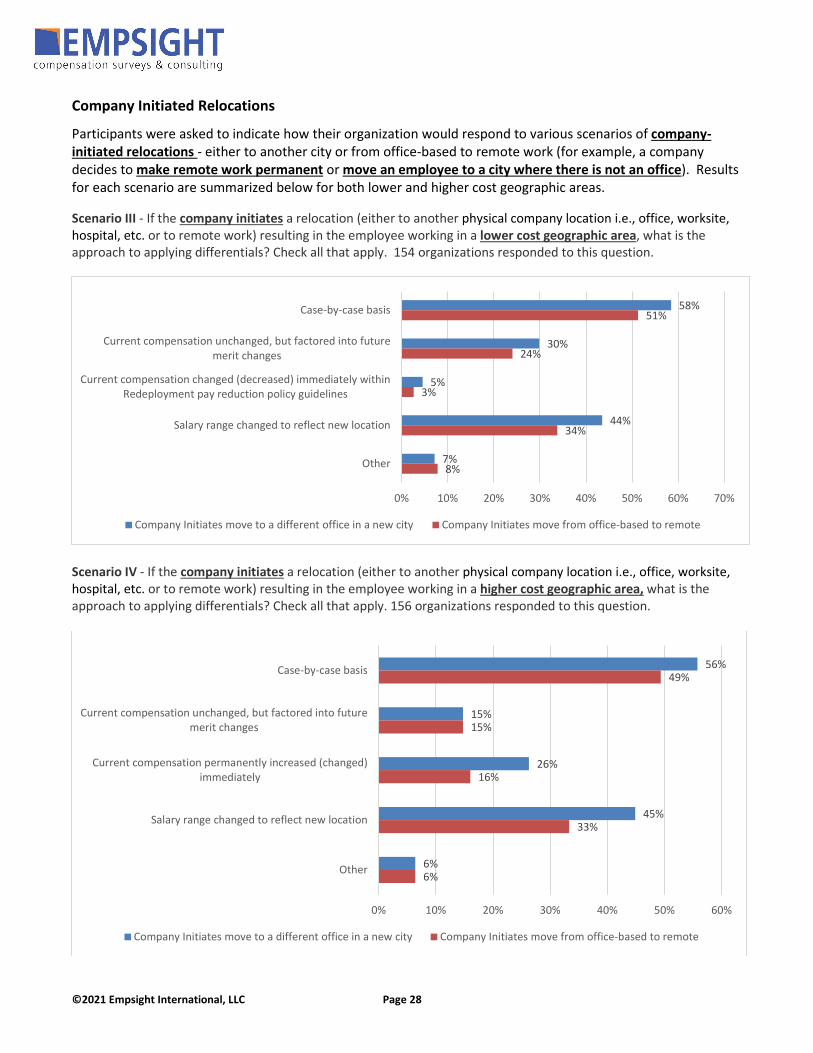
Company Initiated Relocations
Participants were asked to indicate how their organization would respond to various scenarios of company-initiated relocations - either to another city or from office-based to remote work (for example, a company decides to make remote work permanent or move an employee to a city where there is not an office). Results for each scenario are summarized below for both lower and higher cost geographic areas.
Scenario III - If the company initiates a relocation (either to another physical company location i.e., office, worksite, hospital, etc. or to remote work) resulting in the employee working in a lower cost geographic area, what is the approach to applying differentials? Check all that apply. 154 organizations responded to this question.
Scenario IV - If the company initiates a relocation (either to another physical company location i.e., office, worksite, hospital, etc. or to remote work) resulting in the employee working in a higher cost geographic area, what is the approach to applying differentials? Check all that apply. 156 organizations responded to this question.
58%
30%
5%
44%
7%
51%
24%
3%
34%
8%
0% 10% 20% 30% 40% 50% 60% 70%
Case-by-case basis
Current compensation unchanged, but factored into futuremerit changes
Current compensation changed (decreased) immediately withinRedeployment pay reduction policy guidelines
Salary range changed to reflect new location
Other
Company Initiates move to a different office in a new city Company Initiates move from office-based to remote
56%
15%
26%
45%
6%
49%
15%
16%
33%
6%
0% 10% 20% 30% 40% 50% 60%
Case-by-case basis
Current compensation unchanged, but factored into futuremerit changes
Current compensation permanently increased (changed)immediately
Salary range changed to reflect new location
Other
Company Initiates move to a different office in a new city Company Initiates move from office-based to remote
©2021 Empsight International, LLC Page 29
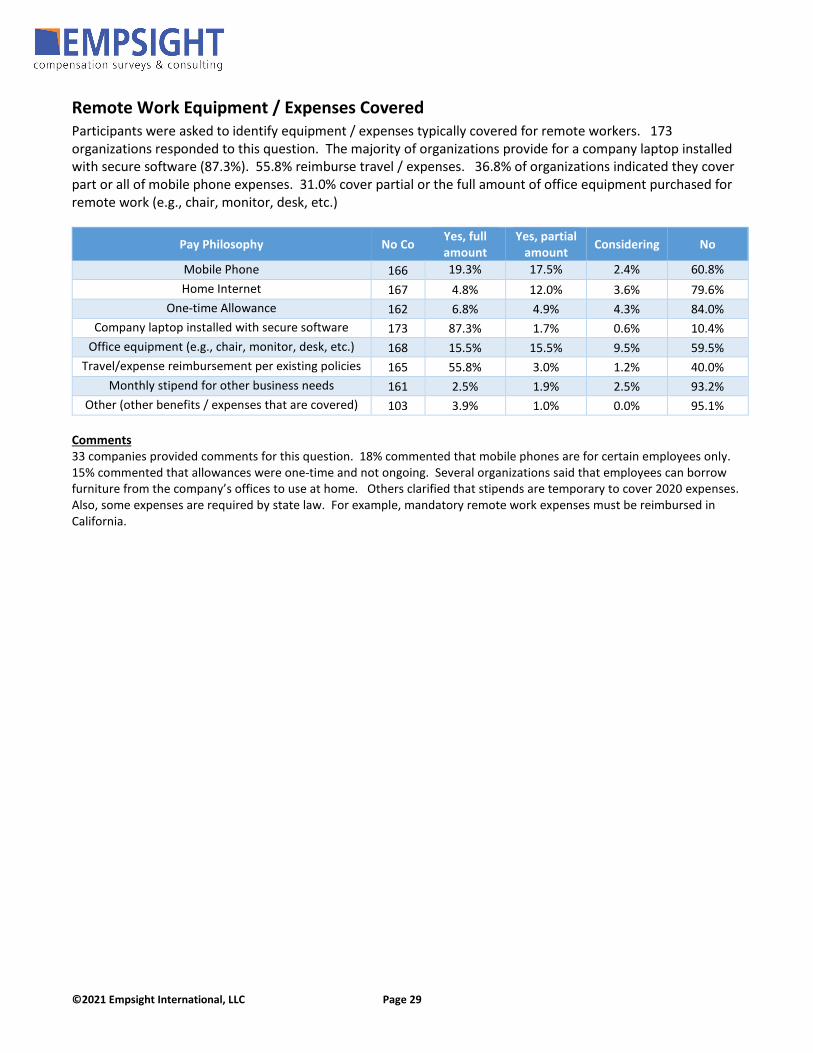
Remote Work Equipment / Expenses Covered Participants were asked to identify equipment / expenses typically covered for remote workers. 173 organizations responded to this question. The majority of organizations provide for a company laptop installed with secure software (87.3%). 55.8% reimburse travel / expenses. 36.8% of organizations indicated they cover part or all of mobile phone expenses. 31.0% cover partial or the full amount of office equipment purchased for remote work (e.g., chair, monitor, desk, etc.)
Pay Philosophy No Co Yes, full amount
Yes, partial amount Considering No
Mobile Phone 166 19.3% 17.5% 2.4% 60.8% Home Internet 167 4.8% 12.0% 3.6% 79.6%
One-time Allowance 162 6.8% 4.9% 4.3% 84.0% Company laptop installed with secure software 173 87.3% 1.7% 0.6% 10.4%
Office equipment (e.g., chair, monitor, desk, etc.) 168 15.5% 15.5% 9.5% 59.5% Travel/expense reimbursement per existing policies 165 55.8% 3.0% 1.2% 40.0%
Monthly stipend for other business needs 161 2.5% 1.9% 2.5% 93.2% Other (other benefits / expenses that are covered) 103 3.9% 1.0% 0.0% 95.1%
Comments 33 companies provided comments for this question. 18% commented that mobile phones are for certain employees only. 15% commented that allowances were one-time and not ongoing. Several organizations said that employees can borrow furniture from the company’s offices to use at home. Others clarified that stipends are temporary to cover 2020 expenses. Also, some expenses are required by state law. For example, mandatory remote work expenses must be reimbursed in California.