Embed Size (px)
Citation preview
Savills World Research The Netherlands logistics
Spotlight Logistics property market The Netherlands Q4/2016
A FAST MOVING PROPERTY SECTOR
savills.nl/research
2
Spotlight Logistics property market The Netherlands
TABLE 1
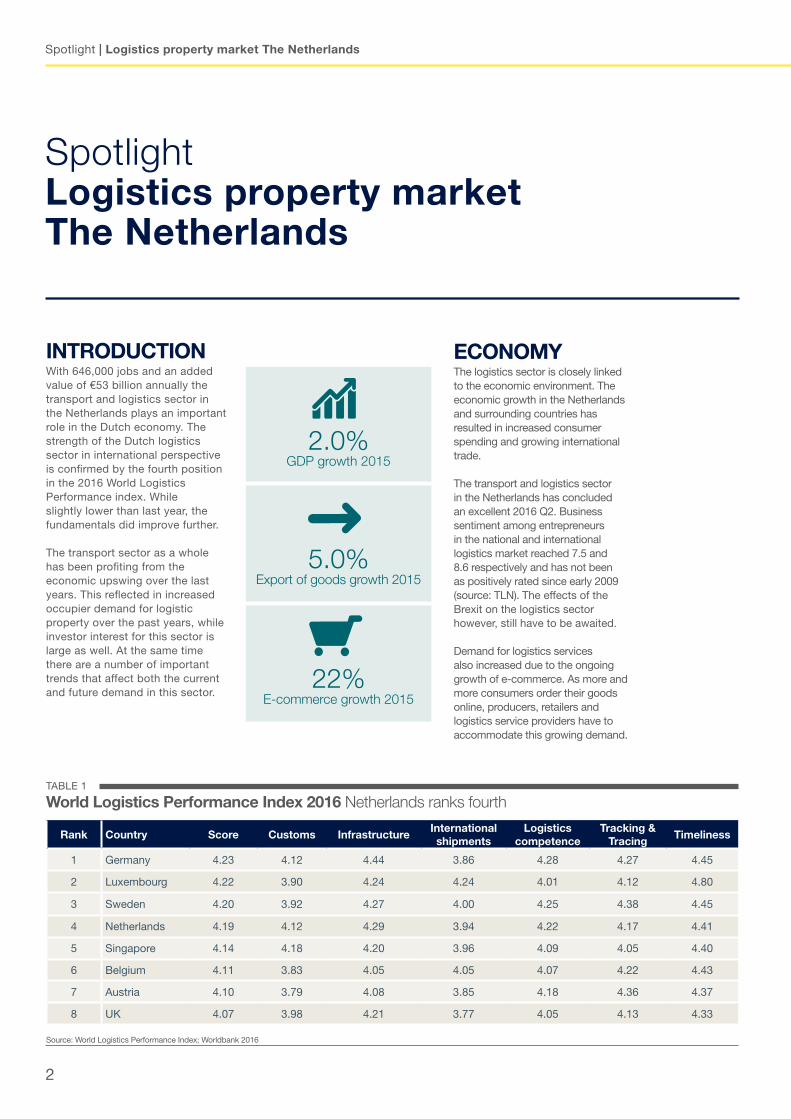
World Logistics Performance Index 2016 Netherlands ranks fourth
Source: World Logistics Performance Index; Worldbank 2016
Spotlight | Logistics property market The Netherlands
INTRODUCTION With 646,000 jobs and an added value of €53 billion annually the transport and logistics sector in the Netherlands plays an important role in the Dutch economy. The strength of the Dutch logistics sector in international perspective is confirmed by the fourth position in the 2016 World Logistics Performance index. While slightly lower than last year, the fundamentals did improve further.
The transport sector as a whole has been profiting from the economic upswing over the last years. This reflected in increased occupier demand for logistic property over the past years, while investor interest for this sector is large as well. At the same time there are a number of important trends that affect both the current and future demand in this sector.
ECONOMY The logistics sector is closely linked to the economic environment. The economic growth in the Netherlands and surrounding countries has resulted in increased consumer spending and growing international trade. The transport and logistics sector in the Netherlands has concluded an excellent 2016 Q2. Business sentiment among entrepreneurs in the national and international logistics market reached 7.5 and 8.6 respectively and has not been as positively rated since early 2009 (source: TLN). The effects of the Brexit on the logistics sector however, still have to be awaited.
Demand for logistics services also increased due to the ongoing growth of e-commerce. As more and more consumers order their goods online, producers, retailers and logistics service providers have to accommodate this growing demand.
Rank Country Score Customs InfrastructureInternational shipments
Logistics competence
Tracking & Tracing
Timeliness
1 Germany 4.23 4.12 4.44 3.86 4.28 4.27 4.45
2 Luxembourg 4.22 3.90 4.24 4.24 4.01 4.12 4.80
3 Sweden 4.20 3.92 4.27 4.00 4.25 4.38 4.45
4 Netherlands 4.19 4.12 4.29 3.94 4.22 4.17 4.41
5 Singapore 4.14 4.18 4.20 3.96 4.09 4.05 4.40
6 Belgium 4.11 3.83 4.05 4.05 4.07 4.22 4.43
7 Austria 4.10 3.79 4.08 3.85 4.18 4.36 4.37
8 UK 4.07 3.98 4.21 3.77 4.05 4.13 4.33
2.0%GDP growth 2015
5.0%Export of goods growth 2015
22%E-commerce growth 2015
Q4/2016
3
* Data for onlines sales from Thuiswinkel.org, data for total retail sales from CBS.
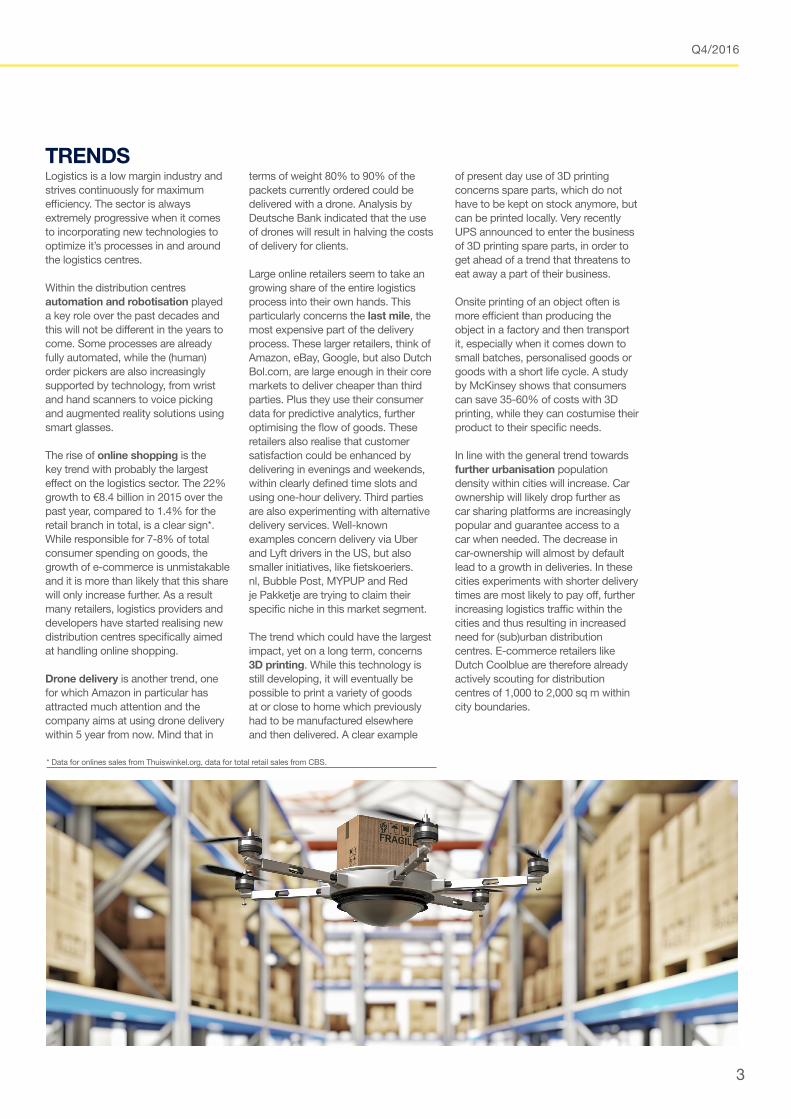
TRENDSLogistics is a low margin industry and strives continuously for maximum efficiency. The sector is always extremely progressive when it comes to incorporating new technologies to optimize it’s processes in and around the logistics centres. Within the distribution centres automation and robotisation played a key role over the past decades and this will not be different in the years to come. Some processes are already fully automated, while the (human) order pickers are also increasingly supported by technology, from wrist and hand scanners to voice picking and augmented reality solutions using smart glasses. The rise of online shopping is the key trend with probably the largest effect on the logistics sector. The 22% growth to €8.4 billion in 2015 over the past year, compared to 1.4% for the retail branch in total, is a clear sign*. While responsible for 7-8% of total consumer spending on goods, the growth of e-commerce is unmistakable and it is more than likely that this share will only increase further. As a result many retailers, logistics providers and developers have started realising new distribution centres specifically aimed at handling online shopping. Drone delivery is another trend, one for which Amazon in particular has attracted much attention and the company aims at using drone delivery within 5 year from now. Mind that in
terms of weight 80% to 90% of the packets currently ordered could be delivered with a drone. Analysis by Deutsche Bank indicated that the use of drones will result in halving the costs of delivery for clients. Large online retailers seem to take an growing share of the entire logistics process into their own hands. This particularly concerns the last mile, the most expensive part of the delivery process. These larger retailers, think of Amazon, eBay, Google, but also Dutch Bol.com, are large enough in their core markets to deliver cheaper than third parties. Plus they use their consumer data for predictive analytics, further optimising the flow of goods. These retailers also realise that customer satisfaction could be enhanced by delivering in evenings and weekends, within clearly defined time slots and using one-hour delivery. Third parties are also experimenting with alternative delivery services. Well-known examples concern delivery via Uber and Lyft drivers in the US, but also smaller initiatives, like fietskoeriers.nl, Bubble Post, MYPUP and Red je Pakketje are trying to claim their specific niche in this market segment. The trend which could have the largest impact, yet on a long term, concerns 3D printing. While this technology is still developing, it will eventually be possible to print a variety of goods at or close to home which previously had to be manufactured elsewhere and then delivered. A clear example
of present day use of 3D printing concerns spare parts, which do not have to be kept on stock anymore, but can be printed locally. Very recently UPS announced to enter the business of 3D printing spare parts, in order to get ahead of a trend that threatens to eat away a part of their business. Onsite printing of an object often is more efficient than producing the object in a factory and then transport it, especially when it comes down to small batches, personalised goods or goods with a short life cycle. A study by McKinsey shows that consumers can save 35-60% of costs with 3D printing, while they can costumise their product to their specific needs. In line with the general trend towards further urbanisation population density within cities will increase. Car ownership will likely drop further as car sharing platforms are increasingly popular and guarantee access to a car when needed. The decrease in car-ownership will almost by default lead to a growth in deliveries. In these cities experiments with shorter delivery times are most likely to pay off, further increasing logistics traffic within the cities and thus resulting in increased need for (sub)urban distribution centres. E-commerce retailers like Dutch Coolblue are therefore already actively scouting for distribution centres of 1,000 to 2,000 sq m within city boundaries.
Spotlight | Logistics property market The Netherlands
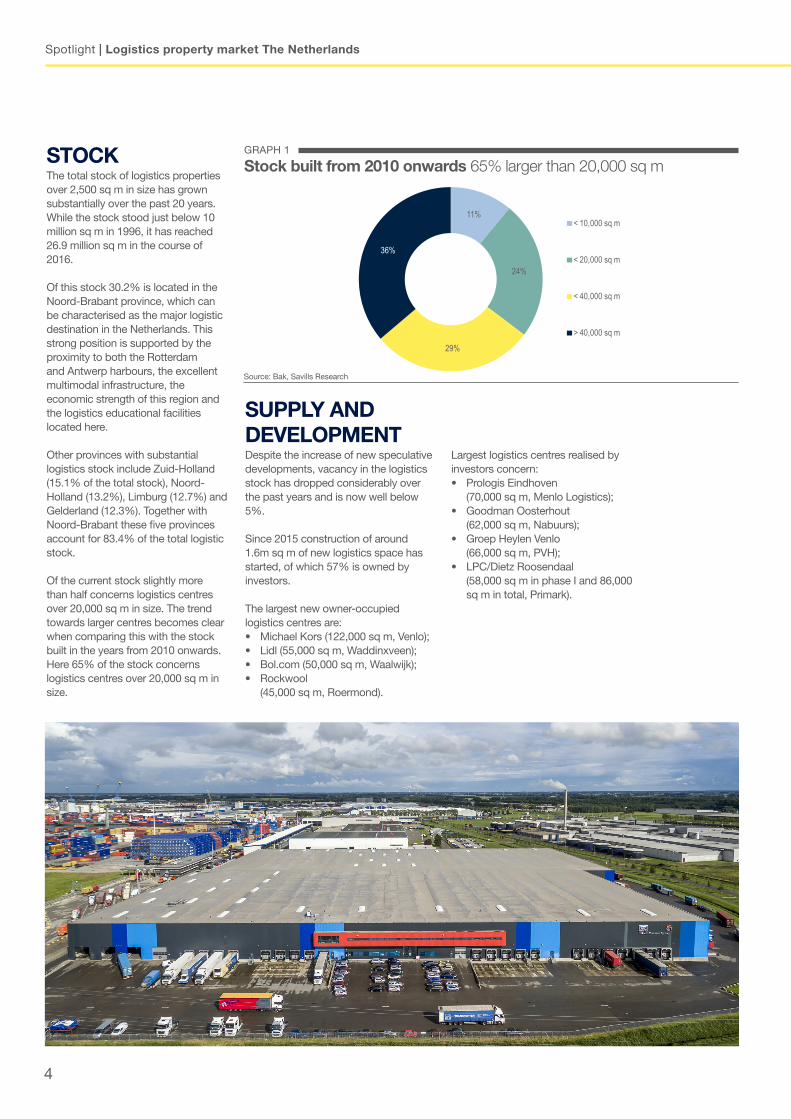
STOCK The total stock of logistics properties over 2,500 sq m in size has grown substantially over the past 20 years. While the stock stood just below 10 million sq m in 1996, it has reached 26.9 million sq m in the course of 2016. Of this stock 30.2% is located in the Noord-Brabant province, which can be characterised as the major logistic destination in the Netherlands. This strong position is supported by the proximity to both the Rotterdam and Antwerp harbours, the excellent multimodal infrastructure, the economic strength of this region and the logistics educational facilities located here. Other provinces with substantial logistics stock include Zuid-Holland (15.1% of the total stock), Noord-Holland (13.2%), Limburg (12.7%) and Gelderland (12.3%). Together with Noord-Brabant these five provinces account for 83.4% of the total logistic stock. Of the current stock slightly more than half concerns logistics centres over 20,000 sq m in size. The trend towards larger centres becomes clear when comparing this with the stock built in the years from 2010 onwards. Here 65% of the stock concerns logistics centres over 20,000 sq m in size.
GRAPH 1
Stock built from 2010 onwards 65% larger than 20,000 sq m
11%
24%
29%
36%
< 10,000 sq m
< 20,000 sq m
< 40,000 sq m
> 40,000 sq m
Source: Bak, Savills Research
4
SUPPLY AND DEVELOPMENT Despite the increase of new speculative developments, vacancy in the logistics stock has dropped considerably over the past years and is now well below 5%. Since 2015 construction of around 1.6m sq m of new logistics space has started, of which 57% is owned by investors. The largest new owner-occupied logistics centres are:• Michael Kors (122,000 sq m, Venlo);• Lidl (55,000 sq m, Waddinxveen);• Bol.com (50,000 sq m, Waalwijk);• Rockwool
(45,000 sq m, Roermond).
Largest logistics centres realised by investors concern:• Prologis Eindhoven
(70,000 sq m, Menlo Logistics);• Goodman Oosterhout
(62,000 sq m, Nabuurs);• Groep Heylen Venlo
(66,000 sq m, PVH);• LPC/Dietz Roosendaal
(58,000 sq m in phase I and 86,000 sq m in total, Primark).
Q4/2016
While many of the new developments concern built-to-suit developments aimed at occupiers with specific housing needs, there are also speculative developments, aimed at the fast growing need for logistics space by e-commerce related retailers or logistic service providers. Examples of these speculative developments include Standard Life Investments realising a 33,000 sq m logistics centre in Vianen, AEW/Borghese realising a 30,000 sq m development at Schiphol (phase 1) and DHG realising two 25,000 sq m projects at risk (Moerdijk- phase 1 and Rotterdam-Europoort).
Limburg and Noord-Brabant were jointly responsible for almost 1.0m sq m of the 1.6m sq m of new developments. Venlo (Limburg) is leading the pack with 310,000 sq m of newly realised logistics property in total, followed by Moerdijk (275,000 sq m) and Rotterdam (250,000 sq m).
TAKE-UPOver the past two years occupier demand for logistics properties in the Netherlands has increased rapidly, due to a combination of four trends:• the growth of the Dutch economy
supporting national consumer demand;
• international trade continued to grow;• the fast growth of e-commerce;• the Netherlands further increased
its position in the EDC (European distribution centres) market.
As a result logistics take-up reached a record high 1.65 million sq m in 2015. This trend continued in the first half of 2016, with a total of 710,000 sq m of logistics properties taken up.
Having the largest stock, Noord-Brabant is logically also the major destination for occupiers of logistics properties. The province has 30.2% of total stock and over the past 18 months was able to attract 31.9% of total take-up. For the other four provinces with a large logistics stock (Noord-Holland, Zuid-Holland, Utrecht and Limburg) the share in take-up is close to the share in total stock. The five most important provinces were able to attract 85.4% of all take-up in 2015 and H1 2016.
5
"International online retailers play a dominant role in demand for the extra large logistics centres in the Netherlands.”
Douglas van Oers,
Savills Logistics & Industrial
Netherlands
0
200
400
600
800
1,000
1,200
1,400
1,600
1,800
2009 2010 2011 2012 2013 2014 2015 16 H1
x 1,000 sq m
GRAPH 3
Logistics take-up Boom in 2015 continues in 2016
GRAPH 2
Major destinations 2015 - 2016 H1 Top 8 cities: 4x Noord-Brabant
Source: Savills Research Source: Savills Research
City Province Take-up (sq m)
Venlo Limburg 290,000
Moerdijk Noord-Brabant 275,000
Rotterdam Zuid-Holland 250,000
Tilburg Noord-Brabant 230,000
Roosendaal Noord-Brabant 120,000
Eindhoven Noord-Brabant 115,000
Schiphol Noord-Holland 105,000
Amsterdam Noord-Holland 75,000
The dominance of Noord-Brabant is also reflected in the fact that four of the eight most dominant logistics destinations (see figure 5) are located here. Venlo accounted for the largest share in total take-up in the period 2015-2016 H1 and reached 290,000 sq m.
Among the largest transactions in this period were:• Michael Kors (122,000 sq m, Venlo);• Primark (86,000 sq m, Roosendaal);• Menlo Logistics (70,000 sq m,
Eindhoven);• Canon/Nippon Express
(70,000 sq m, Rotterdam);• Nabuurs (61,700 sq m, Oosterhout);• PVH Europe (60,000 sq m, Venlo);• Bol.com (first phase of
50,000 sq m, Waalwijk).
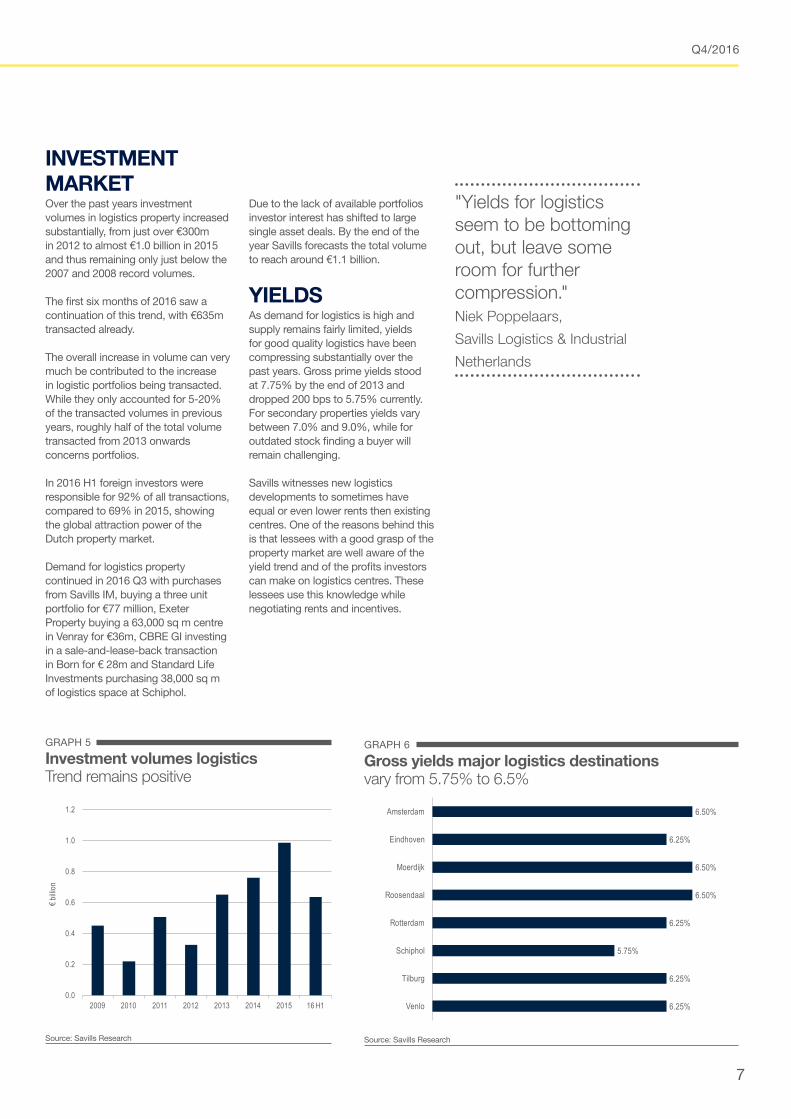
GRAPH 4
Prime and secondary rents in €/sq m/year
30.0
35.0
35.0
35.0
35.0
45.0
45.0
60.0
47.5
47.5
50.0
52.5
55.0
65.0
65.0
90.0
Roosendaal
Venlo
Tilburg
Moerdijk
Eindhoven
Rotterdam
Amsterdam
SchipholPrime rent Secondary rent
6
Spotlight | Logistics property market The Netherlands
RENTS AND INCENTIVES Headline rents for logistic properties remained fairly stable over the past years. Highest rent levels can be found in the Schiphol Airport area and reach €90 per sq m annually for prime properties. At other major logistics destination prime rents are between €50 and €65 per sq m annually. Incentives vary per location, but are often between 10% and 15% at the major sites.
Source: Savills Research
Q4/2016
INVESTMENT MARKET Over the past years investment volumes in logistics property increased substantially, from just over €300m in 2012 to almost €1.0 billion in 2015 and thus remaining only just below the 2007 and 2008 record volumes.
The first six months of 2016 saw a continuation of this trend, with €635m transacted already.
The overall increase in volume can very much be contributed to the increase in logistic portfolios being transacted. While they only accounted for 5-20% of the transacted volumes in previous years, roughly half of the total volume transacted from 2013 onwards concerns portfolios.
In 2016 H1 foreign investors were responsible for 92% of all transactions, compared to 69% in 2015, showing the global attraction power of the Dutch property market.
Demand for logistics property continued in 2016 Q3 with purchases from Savills IM, buying a three unit portfolio for €77 million, Exeter Property buying a 63,000 sq m centre in Venray for €36m, CBRE GI investing in a sale-and-lease-back transaction in Born for € 28m and Standard Life Investments purchasing 38,000 sq m of logistics space at Schiphol.
7
Due to the lack of available portfolios investor interest has shifted to large single asset deals. By the end of the year Savills forecasts the total volume to reach around €1.1 billion.
YIELDS As demand for logistics is high and supply remains fairly limited, yields for good quality logistics have been compressing substantially over the past years. Gross prime yields stood at 7.75% by the end of 2013 and dropped 200 bps to 5.75% currently. For secondary properties yields vary between 7.0% and 9.0%, while for outdated stock finding a buyer will remain challenging.
Savills witnesses new logistics developments to sometimes have equal or even lower rents then existing centres. One of the reasons behind this is that lessees with a good grasp of the property market are well aware of the yield trend and of the profits investors can make on logistics centres. These lessees use this knowledge while negotiating rents and incentives.
"Yields for logistics seem to be bottoming out, but leave some room for further compression." Niek Poppelaars,
Savills Logistics & Industrial
Netherlands
0.0
0.2
0.4
0.6
0.8
1.0
1.2
2009 2010 2011 2012 2013 2014 2015 16 H1
€billi
on
6.50%
6.25%
6.50%
6.50%
6.25%
5.75%
6.25%
6.25%
Amsterdam
Eindhoven
Moerdijk
Roosendaal
Rotterdam
Schiphol
Tilburg
Venlo
GRAPH 5
Investment volumes logistics Trend remains positive
GRAPH 6
Gross yields major logistics destinations vary from 5.75% to 6.5%
Source: Savills Research Source: Savills Research

■ The outlook for the logistics sector remains strong. The Dutch economy keeps growing driving national consumption. E-commerce keeps gaining larger market shares driving demand for retailers and service providers for HQ DC’s. Trade keeps growing, although the Brexit did somewhat hamper the expectations.
■ This resulted in ongoing strong demand at the occupier side, with take-up reaching 710,000 sq m in the first half of 2016 and vacancy dropping well below 5%.
■ It also resulted in many new developments. While part of these developments are speculative, many of them concern extra large logistics centres (over 40,000 sq m in size) built-to-suit for online retailers. Venlo is a main attractor for these centres, as both land and construction are relatively cheap.
■ Investor interest remains large and by the end of the year Savills forecasts the total volume to reach around €1.1 billion, surpassing last year. Foreign buyers will remain dominant, as they picked up 92% of al investments in 2016 H1 already.
■ The large investor interest keeps a downward pressure on yields. However, as the largest contraction has taken place over the past two years, yields do seem to be bottoming out.
■ Savills witnesses new logistics developments to sometimes have equal or even lower rents then existing centres. One of the reasons behind this is that lessees with a good grasp of the property market are well aware of the yield trend and the profits investors can make on logistics centres. These lessees use this knowledge while negotiating rents and incentives.
■ The logistics sector is extremely progressive and very much focused on new (technological) developments. In the coming years augmented reaility, drone delivery and even 3D printing could well be incorporated in the logistic processes.
■ Already we witness the need for smaller sized distribution centres within city boundaries in order to further limit delivery time.
8
Spotlight | Logistics property market The Netherlands
KEY FINDINGSIn order to further limit driving times, demand for smaller sized distribution centres within city boundaries is increasing
Savills team Please contact us for further information at +31 (0) 20 301 2000
Savills plcSavills is a leading global real estate service provider listed on the London Stock Exchange. The company established in 1855, has a rich heritage with unrivalled growth. It is a company that leads rather than follows, and now has over 700 offices and associates throughout the Americas, Europe, Asia Pacific, Africa and the Middle East.
This report is for general informative purposes only. It may not be published, reproduced or quoted in part or in whole, nor may it be used as a basis for any contract, prospectus, agreement or other document without prior consent. Whilst every effort has been made to ensure its accuracy, Savills accepts no liability whatsoever for any direct or consequential loss arising from its use. The content is strictly copyright and reproduction of the whole or part of it in any form is prohibited without written permission from Savills Research.
Niek PoppelaarsLogistics & IndustrialAssociate [email protected]
Jeroen JansenResearchHead of [email protected]
Douglas van OersLogistics & IndustrialAssociate [email protected]