Embed Size (px)
Citation preview

Spousal Disability and the Labor Market
Sven E. WilsonBrigham Young University

Marriage and Economic Coordination• A largely unresolved puzzle is the
extent to which household members (especially married couples) coordinate their economic behavior.
• Possible types of coordination:– Timing of retirement– Work schedules – Production of household public goods– Leisure activities

Rationales for Coordination
• In the unitary household model, coordination is a obvious outcome of shared preferences and shared budgets.
• In bargaining models of marriage, the extent of coordination is less clear– Individuals have private preferences and
have to be induced to provide “public goods.”
– The burden of unexpected events may not be shared significantly between partners.

Marriage as Disability Insurance
• In most marriages, there would seem to be an incentive to share risk:– Common savings– Joint insurance policies– Income substitution as response to
shocks (the “Added Worker Effect”)– Provision of informal health care– Information sharing

Consumption Smoothing
• Most life-cycle models imply that individuals (and households) will try to “smooth” their consumption from year to year, even though their income may vary considerably– Expected declines in income should
have minimal impact on consumption– Unexpected declines (“shocks”) may
cause significant changes in consumption, as well as changes in how labor and leisure are allocated within the household.

Health and the Labor Market
• For in individual, a decline in health is a strong determinant of reductions in labor supply.– Causal arguments are sometimes hard
to make, especially with self-reported data•“Rationalization” or “Justification.”

Spousal Health
• A unhealthy or disabled spouse imposes conflicting incentives with respect to labor supply:– Factors causing increases in labor
supply:•Loss of spousal income • Increase in medical expenses
– Factors causing decreases in labor supply:•Care needs of the spouse•Complementarity of leisure (especially near
retirement ages)

Research Questions
• Does spousal disability influence labor supply?– What is the magnitude and direction
of the response?
• General Approaches– Cross-sectional and Longitudinal
Regression models among married couples (aged 45-64)

Empirical Evidence
• Retirement Behavior– Available evidence suggests
significant coordination•About 1/3 of couples in labor force at age
50 retire within one year of each other•Complementarity of leisure is more
important that financial incentives– Hurd (1990); Blau (1998); Gustman and
Steimneier 2002; Johns and Favreault 2001; Maestas 2001.
•Men are reponsive to their wives financial incentives, but women are not reponsive to their husband’s incentives (Coile 2004)

Empirical Evidence
• Spousal Coordination of Labor Supply– A small literature shows that job
displacement is usually associated with an increase in labor supply of the spouse•However, this “added worker effect” is
quite small as a percentage of lost household income.

Empirical Evidence
• Health and Labor Supply– One’s own health is a strong predictor of
reductions in labor supply (esp. labor force withdrawl and retirement.
– A few studies have looked at labor force participation and spousal health find a small increase in participation as a response to the disability of the spouse
• though since different dichotomous measures of disability are used, it is hard to compare the studies
– A recent study by Coile (2004) using the HRS finds no added worker effect (with response to health shocks) for women and a small effect for men

Caregiving and Employment
• Ettner: (JHR, 1995; Demog. 1995) – Caregiving by women of elderly
parents significantly reduces their hours worked and increases their withdrawl from the labor force.
– No similar effect for men

Caregiving and Employment
– Caregiving of family members is a common activity of American families:
– 1997 MetLife Study•23.2% of households are involved in adult
caregiving– The majority of these caregivers have full-time
employment, but:» 10% gave up work permanently» 11% had taken a leave of absense» 7.3% reduced their work intensity
•Conservatively estimates that over $11 billion productivity loss occurs each year. [likely growing as population ages]

Caregiving and Employment
• Employment among caregivers– Of those who are giving care, a significant
percentage (especially of women) have either withdrawn from the labor force, reduced hours, adjusted their work schedules, or had other adverse work outcomes:
• Stone et al. (1987) ; Enright and Fress (1987) ; Scharlach and Boyd (1987); McLanahan and Monson (1990), Grunfeld, et al. (2004); Wakabaysashi and Donato (2005)
• These studies treat caregiving as exogenous and cannot, therefore, control for the frequency with which potential caregivers choose not to provide care.
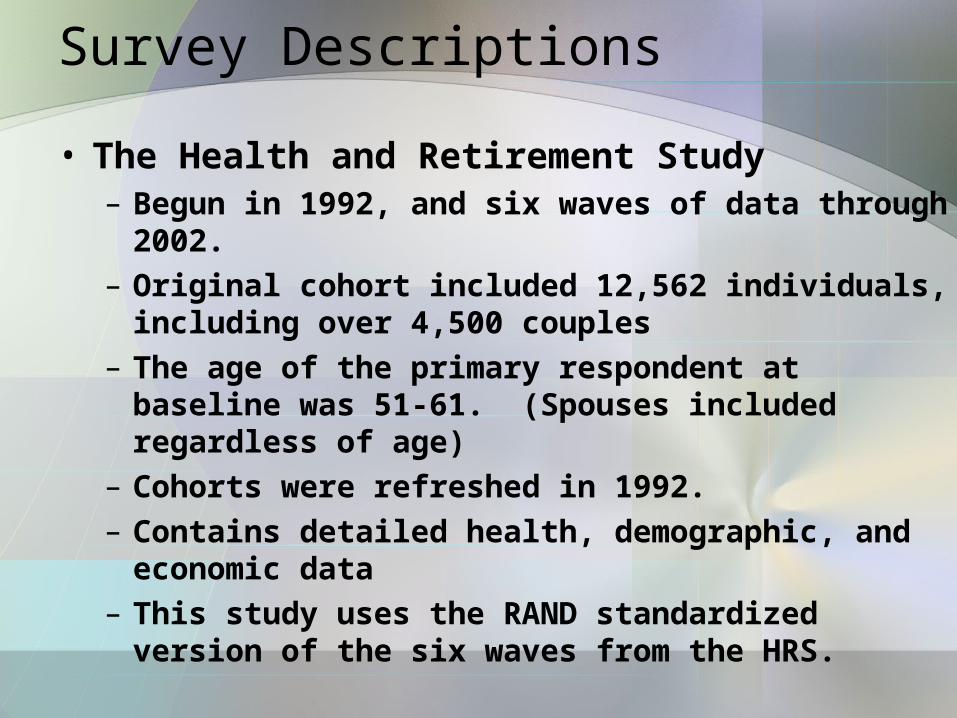
Survey Descriptions
• The Health and Retirement Study– Begun in 1992, and six waves of data
through 2002.– Original cohort included 12,562 individuals,
including over 4,500 couples– The age of the primary respondent at
baseline was 51-61. (Spouses included regardless of age)
– Cohorts were refreshed in 1992.– Contains detailed health, demographic, and
economic data– This study uses the RAND standardized
version of the six waves from the HRS.

Health Measures in the HRS
• Chronic Illnesses– Arthritis, Heart Disease, etc.
• Self-Reported Health:– Excellent, Very Good, Good, Fair, Poor
• Functional Limitations– Walking, Lifting, Stooping, etc.
• Activity Restrictions– ADL’s: Bathing, Dressing, Eating, etc.– Work/Home activity limitation
• Mental/Emotional Health– CESD Scale

The Disability Index
• The methodology used here is to reduce the four indexes (SRHS, IFLAR, CESD, LIMITS) to a single scale using factor analysis
• The Disability index will then be used to study the linear and non-linear association between disability and labor market variables.

The Disability Index
• Factor Model of Four Sub-Indexes– SRHS, IFLAR, CESD, LIMITS– Factor Model Results:

The Disability Index
• Factor Loadings are then used to create scoring coefficients (weights) that are used to average different sub-indexes into a common disability index.
Index is further scaled to have a standard deviation of 1, and a minimum value of 0

The Disability Index

Economic Data
• Employment– Whether or not the respondent is working at
time of interview
• Weekly Hours• Annual earnings
– total earnings in calendar year prior to interview—reported separately for husband and wife.
• Total Household Wealth• Non-earned income
– Including disability income and other government transfer income

Static Analyses
• Pro: Gets at the long-run association between variables
• Con: Harder to make causal argument

Descriptive Statistics
• Employment• Hours• Earnings (2002) dollars

Employment
Men
91.1%85.5%
64.5%
24.2%
85.2%
74.2%78.7%
68.1%
0.0%
20.0%
40.0%
60.0%
80.0%
100.0%
0 1 2 3
Disability Index
Em
plo
ymen
t R
ate
Own Health Spouse's Health

Employment
Women
75.1%
65.4%
54.1%
23.7%
70.5%68.0%
64.4%
52.6%
0.0%
10.0%
20.0%
30.0%
40.0%
50.0%
60.0%
70.0%
80.0%
0 1 2 3
Disability Index
Em
plo
ymen
t R
ate
Own Health Spouse's Health

Employment and Spousal Disability
Men / Women
0.0%
20.0%
40.0%
60.0%
80.0%
100.0%
50-54
55-59
60-64
50-54
55-59
60-64
Spousal Disability by Age
Em
po
ym
en
t R
ate
0 1 2 3
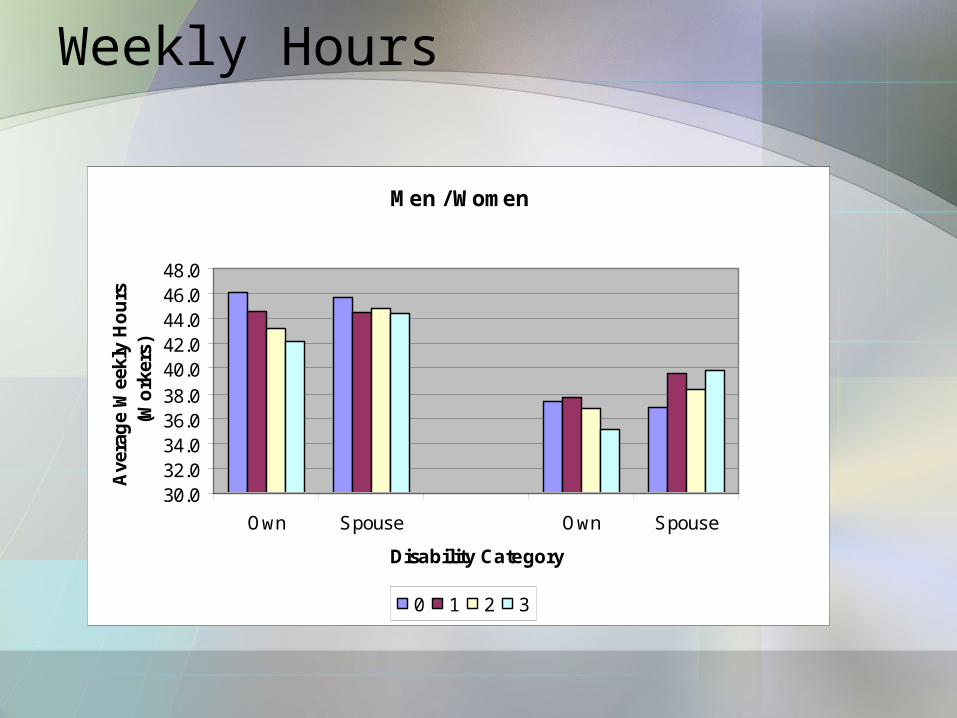
Weekly Hours
Men / Women
30.032.034.036.038.040.042.044.046.048.0
Own Spouse Own Spouse
Disability Category
Ave
rag
e W
eekl
y H
ou
rs
(Wo
rker
s)
0 1 2 3

Earnings
Men / Women
0
10000
20000
30000
40000
50000
Own Spouse Own Spouse
Disability Category
An
nu
al E
arn
ing
s
0 1 2 3

Earnings and Spousal Disability
Men / Women
0
10000
20000
30000
40000
50000
60000
50-54 55-59 60-64 50-54 55-59 60-64
Disability Category (by age)
An
nu
al E
arn
ing
s
0 1 2 3

Descriptive Statistics: Summary
• For both men and women, one’s own disability is strongly associated with employment and earnings during working ages (50-64).
• Most differences occur at the extensive margin (employment) rather than the intensive margin (hours).
• Spousal disability is also negatively correlated with income and earnings for both men and women.
• Spousal effects are present across age groups.

Regression Approach (Static)
• The following is the basic static equation to be estimated
ititt uaBXy Two regression approaches are taken:• Cross-Sectional OLS using the first-interview for each couple, which ignores the idiosyncratic couple effect, ai
• A Fixed-Effect model that nets out the unobserved couple effect.• The disability index is included as a quadratic for both male and female disability

Static Regressions: Employment
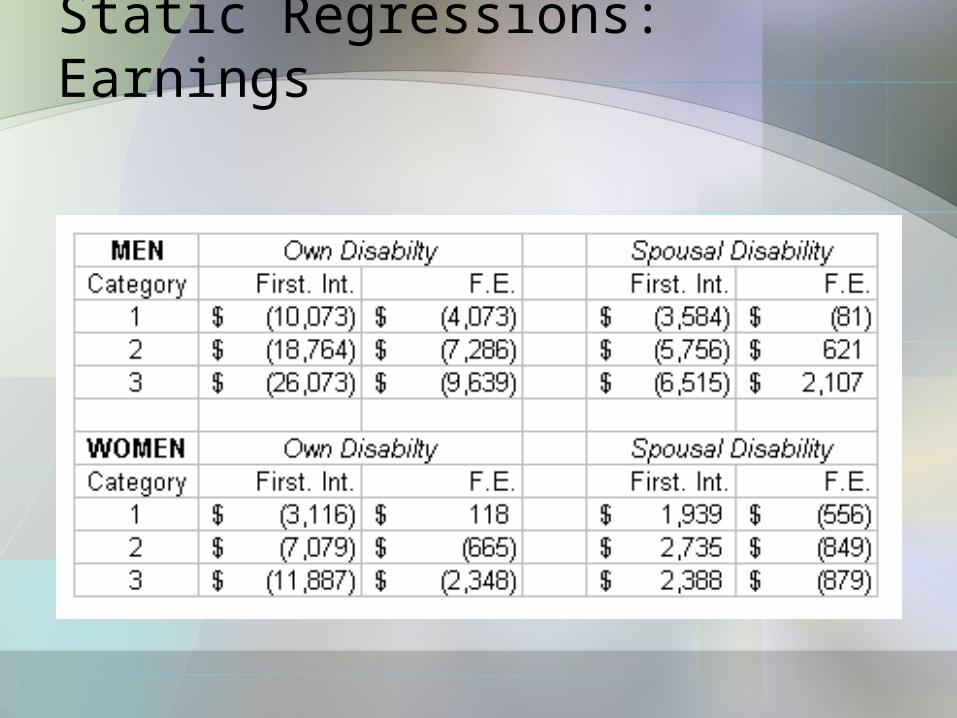
Static Regressions: Earnings

Marital Co-Disability

Spousal Characteristics

Regression Approach (Dynamic)
• The following is the basic dynamic equation to be estimated
Results shown here are obtained from estimating the model above in first differences• This allows the estimation of an immediate effect (between periods t and t-2 and a lagged effect (between periods t-2 and t-4• The disability index is included as a quadratic for both male and female disability
itittt uaBXBXy 211

Dynamic Regressions: Employment

Dynamic Regressions: Hours

Dynamic Regressions: Earnings

Summary of Results from Dynamic Models• Estimated responses to spousal
disability over time are small and generally statistically significant
• The immediate effects of spousal disability seem to raise employment and earnings
• Longer-term net effects are to reduce employment
• Puzzle: Even though the longer-term earnings of men are higher, their employment rates are lower.
• Women’s responses are lower than men’s (consistent with what Coile (2004) has found).
Future Directions
• Attention to labor supply responses for couples with different SES– Rich have little incentive to replace
marginal losses in income– Couples in the middle may be the most
likely to compensate.– Poor may already by “maxed out” in
many cases• though poor have significant non-labor
time—they work fewer hours than the non-poor.

Future Directions (cont.)
• Retirement v. LFP– Focus here has been on current
employment—which is transitory. The HRS has data that can be used to look at retirement (though retirement is not always permanent)

Future Directions (cont.)
• Other Family Responsibilities– What happens on couple is
responsible for care of an elderly parent or other relative?
• Social Insurance– These results control for non-earned
income, including disability insurance, but further study needs to address the role of disability income and other income sources on the spousal response

Conclusions
• At a point in time, a person with a disabled spouse is much less likely to be working and earns much less than a person with a healthy spouse.– But unhealthy persons are much more
likely than average to have an unhealthy spouse.
• However, there is little evidence that spousal health has a significant impact on the labor market behavior of married persons.

Conclusions (cont.)
• There is little evidence that spousal labor is being used as a type of disability insurance– Though changes in earnings by men are
economically significant (though not statistically so).
– The earnings and employment patterns over time have yet to be reconciled.
• Men are generally more responsive to spousal health variables than are women– The opposite of what has been assumed in
many previous studies

Conclusions (cont.)
• What does this say about the coordination of economic behavior within the marriage?– Possible Explanation 1: Not as much
“sharing” as we might anticipate: The employment decisions of married persons are made independently of the work capacity of their spouses.•Not consistent with the evidence showing
strong coordination of retirement behavior in general.

Conclusions (cont.)
– Possible Explanation 2: Couples can “weather the storm” with other resources (savings or disability insurance, etc.)•There is some evidence that couples
anticipate (and plan for) health declines.
– Possible Explanation 3: The income needs of the couple are offset by the need for care of the spouse•Might be true at high levels of disability,
but many people withdraw from the labor force for health reasons even though they don’t need care.

Conclusions (cont.)
– Possible Explanation 4: Labor force transitions are costly and difficult•However, the cross-sectional results
(which can reflect longer-term adjustments) indicate little coordination that wasn’t explained by other factors