Embed Size (px)
Citation preview

273REVISTA - Bogotá (Colombia) Vol. 13 N.° 2 - Julio-diciembre
rev.relac.int.estrateg.segur.13(2):273-296,2018
Fech
a d
e re
cep
ción
: 13
de ju
lio d
e 20
17Fe
cha
de
eval
uac
ión
: 15
de s
eptie
mbr
e de
201
7 Fe
cha
de
apro
bac
ión
: 15
de n
ovie
mbr
e de
201
7
Art
ícul
o de
refl
exió
n
Ref
eren
cia:
Bl
anca
s N
eira
, A
. y
Már
quez
M
endo
za,
M.
A.
(201
8).
Spre
adin
g H
igh-
tech
Ind
ustr
y In
nova
tions
in
Col
ombi
a an
d M
exic
o. A
Q
ualit
ativ
e In
put-
Out
put
Ana
lysi
s. R
evis
ta d
e R
elac
ione
s In
tern
acio
nale
s,
Est
rate
gia
y Se
guri
dad,
13(
2),
273-
296.
DO
I: h
ttps
://d
oi.o
rg/1
0.18
359/
ries
.294
8
* Institute for Economic Research, National Autonomous University of Mexico (UNAM), typology 1.
** Ph.D. in Economics, Institute for Economic Research, UNAM. E-mail: [email protected]
*** Postdoctoral scholarship program, UNAM. Postdoctoral fellow at the Institute for Economic Research and advised by Andrés Blancas Neria, Ph.D. in Economics. E-mail: [email protected]
Spreading High-tech Industry Innovations in Colombia and Mexico. A Qualitative Input-Output Analysis*
Andrés Blancas Neria**Marco Antonio Márquez Mendoza***
Abstract
Economic structure integration is an expression of mar-ket complexity that depends on the level of technol-ogy that has been adopted. This work is based on the premise that, in developed countries, the high tech-nology industry (HTI) has greater productive linkage, which allows it to spread any growth momentum. The paper questions the role of the HTI in expanding in-novations in the Colombian and Mexican economies. Using a qualitative input-output analysis, we prove that the spreading degree of the HTI is similar between these economies. The results point out that, while Co-lombia has higher innovative propagation in domestic structure, Mexico has a greater effect on the output. Nonetheless, the HTI is diffusive in both economies but they receive innovations only when imported interme-
274 REVISTA DE RELACIONES INTERNACIONALES, ESTRATEGIA Y SEGURIDAD
Spreading High-tech Industry Innovations in Colombia and Mexico. A Qualitative Input-Output Analysis
diate inputs are used in the production process. In the Mexican economy, inno-vations expand due to the use of imported intermediate inputs.
Keywords: high-technology industry; innovation; input-output model; networks; technology change.
La propagación de las innovaciones de la industria de alta tecnología en Colombia y México. Análisis cualitativo de insumo-producto
Resumen
La integración de la estructura productiva es una manifestación de la complejidad del mercado que depende del nivel tecnológico alcanzado. Este trabajo parte de la premisa de que, en países desarrollados, la industria de alta tecnología (IAT) presen-ta mayor encadenamiento productivo, que le permite propagar cualquier tipo de impulso al crecimiento. El documento cuestiona el papel de la IAT en la expansión de innovaciones para las economías de Colombia y México. Con el análisis cualita-tivo de insumo-producto se prueba que el grado de propagación de la IAT es pareci-do entre estas dos economías. Los resultados señalan a grosso modo que, mientras que Colombia tiene una propagación innovadora más alta que México, este último tiene mayor efecto sobre el producto; no obstante, en ambas economías la IAT es difusora, pero no reciben innovaciones sino solo cuando se utilizan los insumos intermedios importados en el proceso productivo. En la economía de México, las innovaciones se propagan mediante el uso de insumos intermedios importados.
Palabras clave: cambio tecnológico; industria de alta tecnología; innovación; modelo de insumo-producto; redes.
A propagação das inovações da indústria de alta tecnologia na Colômbia e no México. Análise qualitativa de insumo-produto
Resumo
A integração da estrutura produtiva é uma manifestação da complexidade do mercado que depende do nível tecnológico alcançado. Este trabalho parte da premissa de que nos países desenvolvidos a indústria de alta tecnologia (IAT) apresenta um maior encadeamento produtivo, que lhe permite propagar qual-quer tipo de impulso ao crescimento. O documento questiona o papel da IAT na expansão de inovações para as economias da Colômbia e do México. Com a análise qualitativa de insumo-produto prova-se que o grau de propagação da IAT é parecido entre estas duas economias. Os resultados indicam a grosso modo que, enquanto a Colômbia tem uma propagação inovadora mais alta do que o

Andrés Blancas Neria - Marco Antonio Marquez Mendoza
275REVISTA - Bogotá (Colombia) Vol. 13 N.° 2 - Julio-diciembre
México, este último tem maior efeito sobre o produto; não obstante, em ambas as economias a IAT é difusora, mas somente recebem inovações quando são uti-lizados os insumos intermediários importados no processo produtivo.
Palavras-chave: câmbio tecnológico; indústria de alta tecnologia; inovação; modelo de insumo-produto; redes.
Introduction
In economic thinking, the study of the high-tech industry (HTI) can be traced back to classical economists, who argued that industry arises from improved production and the intense division of labor. This improves the spe-cialization and optimum use of factors. They also believed that the division of labor and market size are interdepen-dent (Smith, 1958). The neoclassical economists concluded that industry showed increasing returns to scale due to the constant improvement of pro-duction and productive factors, which reduces production costs and increas-es efficiency. These concepts derived in the analysis of internal and external economies (Marshall, 1931), the influ-ence of terms, the division of labor and market size.
According to the theory, the industrial sector defines the pattern of economic development because its growth af-fects the whole economy (Kaldor, 1966), is a determining factor of a complex structure in the inter-sectoral economic system (Leontief, 1986), and constantly pushes for innovation and technological changes, which modify the productive apparatus. In addition,
the industrial sector defines patterns of consumption and investment in the circular flow of actors in the system (Schumpeter, 1978).
The study of the HTI is a special fea-ture of the analysis of the industrial sector but, since it produces and em-ploys highly complex factors, is deci-sive for the economic growth in the long term (ONUDI, 2015). The HTI al-lows to evaluate and diagnose the level of development of economies. Using the study of multisector models, it has been possible to answer interesting questions of the HTI on the economic structure. Some authors have broken down the effects of output growth of by changing the use of raw materials in the production process in Europe (García, Aroche, & Ramos, 2007), in accordance with the groups defined as high-tech and low-tech. The results pointed out that the high-tech group has the greatest impact on growth. More recently, it has been found that, in North America (Marquez, 2016), the HTI coordinates the interindustry networks of the productive structure from the trading block and that it con-ditions his way; however, this general-ity does not apply to three economies that form the economic zone.

276 REVISTA DE RELACIONES INTERNACIONALES, ESTRATEGIA Y SEGURIDAD
Spreading High-tech Industry Innovations in Colombia and Mexico. A Qualitative Input-Output Analysis
The HTI is a subset of the total num-ber of divisions. These divisions have been widely recognized because they coordinate processes among countries forming global chains of production, depend mainly on the current state of technology and the use of con-stant innovations to create assets, and use factors such as capital and highly specialized (Shapiro & Varian, 1999). The HTI has reduced transaction costs, streamlined the reproduction of the real and financial spheres of the econ-omy, and impacted the productivity and development of countries.
This work uses the International Stan-dard Industrial Classification of All Eco-nomic Activities, Revision 3 (ISIC, Rev. 3) that identifies the divisions of high tech-nology such as: 1) chemicals, except medical and pharmaceutical products; 2) manufacture of machinery and equip-ment n.e.c., , manufacture of electri-cal machinery and apparatus n.e.c.; 3) manufacture of office, accounting and computing machinery, manufacture of radio, television and communication equipment and apparatus, manufac-ture of medical, precision instruments and optical instruments, watches and clocks, manufacture of furniture; manu-facturing n.e.c., recycling; and 4) manu-facture of motor vehicles, trailers and semi-trailers, building and repairing of ships and boats, manufacture of aircraft and spacecraft, manufacture of railway and tramway locomotives and rolling stock, manufacture of transport equip-ment n.e.c.
The objective of this study is to evaluate the role of the HTI in spreading innova-tions within the interindustry networks of the Colombian and Mexican eco-nomic structures using a Qualitative Input–Output Analysis (QIOA). This is due to the results of other studies that found that the Colombian economy has greater internal integration than the Mexican one (Marquez, 2018). The assumption behind this objective is that, despite the structural heteroge-neity of Colombia and Mexico, weak HTI innovations spread in networks involving purchases of domestic in-puts to outputs. This means that the effect of HTI innovation is truncated in the production of national goods that serve as components of the output of other industries, having a low impact on production; however, the spread of HTI innovations grows as the pro-ductive apparatus uses raw materials produced abroad, as is the case of the Mexican economy.
This research is composed of four sec-tions. Section one presents the input-output model (IOM) and the study of innovation expansion. Section two shows the techniques of the QIOA that will be used for the study of Colombia and Mexico. Section three describes the dynamics and results of investment in research and development and in-novation spending (RDI). Finally, the document points out some of the con-clusions of spreading HTI innovations in the study case.
Andrés Blancas Neria - Marco Antonio Marquez Mendoza
277REVISTA - Bogotá (Colombia) Vol. 13 N.° 2 - Julio-diciembre
The Input-Output Model and Innovation Spreading
The IOM understands the economy as a set of divisions that belong to a sector (primary, secondary or tertiary sectors) and produces a type of used value that is consumed as a commodity to meet the needs of economic agents that constitute the demand, or as an inter-mediate input, i.e. as a component to develop another output, and therefore, it is highly complex. No matter the level of disaggregation, the model assumes that each division creates a homoge-neous well using specific technology, which determines the demand of raw materials used as well as the amount of capital and labor; in other words, it determines the number of factors not produced in the economic system and those produced inside the IOM.
The IOM employs three tables that form the input-output tables (IOTs) to study the production structure. The first one is a double-entry table which records sales and purchases of inputs among divisions, defined as the array of intermediate transactions. Inter-mediate consumption is calculated as the sum of columns, i.e. the total of intermediate purchases, and interme-diate demand as the sum of rows, i.e. the sales of finished products used by other industries as intermediate goods. The second table is final demand, dis-aggregated by economic activity and for economic factors such as families, the Government or the external sector. Finally, the added value table is used, which contains the payment of pro-
ductive factors. So, the IOTs consider the value of the output of each division as the sum of intermediate demand and final demand (Equation 1) or the sum of intermediate consumption and value added (Equation 2); that is to say, by the side of the demand and supply, so that the IOTs is an accounting bal-ance (Miller & Blair, 2009).
= ´ + (1)
= + (2)
In Equations 1 and 2, = + indicates row and = + column, which represent the disaggre-
gation of the IOTs; = + is the gross value of production; = + is the matrix of inter-mediate transactions; = ´ + is the vector line unit; and = ´ + , = + are the vectors of final demand and value added, respectively.
One assumption of the IOM is that pro-duction functions are linear and ho-mogeneous, and have constant returns to scale; therefore, the coefficients or parameters of the IOM are constant or fixed (Leontief, 1986). Still, as the IOTs represents a point in time, technology does not change; only the cost of the inputs used to produce an industry is known.
According to Equation 1, the technical coefficients are defined as the propor-tion of input per unit of output gen-erated. In this way, beyond doubling the production, it doubles the use of inputs but preserves the same propor-tion of each input regarding output (Leontief, 1986). Nevertheless, the set of technical coefficients are defined as:
278 REVISTA DE RELACIONES INTERNACIONALES, ESTRATEGIA Y SEGURIDAD
Spreading High-tech Industry Innovations in Colombia and Mexico. A Qualitative Input-Output Analysis
= { ⁄ } = { }
Therefore:
= +
Thus, the gross value is defined as:
= ( − )− 1 (3)
The entries in the array ( − )− 1 are di-rect and indirect requirements among divisions and expresses how many units of inputs are required to produce the total output of the economy. This matrix is also called matrix of multipli-ers or Leontief-inverse and expresses the impacts caused by the change of an element of both final demand and added value, but also by other exog-enous variables such as investment on research, development and innovation spending (RDI), government consump-tion, exports, etc.
From the IOM, the propagation of in-novations leads to changes in the com-position of technical coefficients as part of the resources obtained in the production process must be directed to the acquisition of new methods and applications to create new values in use. Thus, the use of innovations mod-ifies interindustry relations that can be interpreted as a technological change, implying the emergence and disap-pearance of certain industries in the long term. Yet, new industries change the proportion of inputs and factors used in production in the short term. Innovation and technical changes in a
sector of the economy modify the col-umns of matrix = + (Aroche, 2006; So-nis, Hewings, & Guo, 1996), but may also be by altering the proportions of inputs that are not created in the sys-tem, such as labor and capital or some combination of the above. In general, innovation means a transformation of the way in which sectors are interre-lated; that is, a metamorphosis of the productive structure.
Innovation and technical change have been studied through various mea-sures with reference to the analysis of comparative statics (Sakurai, Papacon-stantinou, & Ioannidis, 1997). It is to compare the use of primary inputs, the effect on growth, structural change, in final demand, and the change of factors such as capital and labor, in addition to the use of primary inputs. Precisely, it is the change in endogenous variables and exogenous to the model, which in both cases benefit from the level of production.
Another area in which the analysis has been made is impact analysis using the concept of a National Innovation System (NIS). The NIS is a representa-tion of how to propagate RDI in an economy; these disbursements are aimed at forming human capital and creating new capital goods. Nonethe-less, each of them contains items that make up an innovation system with-in each process, there are different agents that stimulate innovation and development. In this way, the concept of NIS can be incorporated based on the spending to stimulate the invention

Andrés Blancas Neria - Marco Antonio Marquez Mendoza
279REVISTA - Bogotá (Colombia) Vol. 13 N.° 2 - Julio-diciembre
and development of tools for the pro-duction process from the interdepen-dence of economic divisions (Schnabl, 1995). The payment for these purpos-es comes from the funds of companies and the budgets of public institutions.
The Qualitative Input-Output Analysis in the Study of Innovation
Spreading
The qualitative input-output analysis (QIOA) seeks to highlight the main con-nections that exist in the productive system according to certain features of the relations among divisions. The predecessors of this approach can be traced back to the fifties when Whi-tin (1954) linked the concept of eco-nomic structure to network; however, the person who defined this approach as known today was Czayka (1972, as citied in Schanbl, 1979), because his methodology was mostly used in ana-lyzing the set of interindustry relations from the theory of networks or graphs.
The analysis of networks is explained by the patterns of connections among agents, who make up networks with certain structures (Bon, 1989). Thus, the network of relationships among di-visions is a resource that facilitates the study of interdependence of a phe-nomenon such as the use of new in-novations; however, since the way in which network is the strength of the fluidity among divisions of the pro-ductive fabric. Several studies have used the theory of networks to study economic phenomena, which have to do with industrial organization
(Aroche, 2001; Czamansky & Ablas, 1979; Duque, Rey, & Gómez, 2009), trade (Hidalgo & Hausmann 2009, Shi, Zhang, & Yang, 2014), etc. This work has employed two techniques to analyze networks: the Minimum Flow Analysis (Schnabl, 1995) and the Im-portant Coefficient Analysis (Aroche, 1996).
The Minimum Flow Analysis (MFA) studies a part of the economic system, a concept originally proposed by Sraffa (1960) and Pasinetti (1973) related to the search for the pattern and vertically integrated vector; that is, each division directly demands a set of productive factors such as capital and labor em-ployed in creating the inputs required. The MFA is used to analyze the impacts of the RDI on the output by selecting the entries in the technical coefficients matrix that are equal to or lower than the average of the multipliers of the RDI, as follows:
= (
〈
)− 1( − ))− 1 (4)
〈
= ( )− 1( − ))− 1 (4.1)
〈−= ( ´ ( )− 1( − ))− 1 ) − 1 (4.2)
Equation 4 indicates the equality of the RDI from the IOM and ( )− 1
〈
is the diagonal matrix of the vector of RDI coefficients. Equation 4.1 expresses the vector of multipliers of the RDI and Equation 4.2 is the value of the criteri-on for selecting the entries of the tech-nical coefficient matrix, where
〈
−= ( ´ ( )− 1( − ))− 1 ) − 1 is the number of productive divisions.

280 REVISTA DE RELACIONES INTERNACIONALES, ESTRATEGIA Y SEGURIDAD
Spreading High-tech Industry Innovations in Colombia and Mexico. A Qualitative Input-Output Analysis
The qualitative transformation
〈
= ( )− 1( − ))− 1 in = = − 1
validates the fact that complies with the properties of the similarity matrix equivalent to the input-output model, as follows:
= = − 1 (5)
= = − 1 stands for the representative flows of the impact of the RDI, which can be understood as the flow of innovations.
= = − 1 can also be obtained through the known sensitivity analysis developed by Scherman and Morrison (1949) in which it is assumed that both for a matrix is not singular and its inverse, if one element of the array changes, it produces changes in the inverse of one or more elements in accordance with the change of that item (Scherman & Morrison, 1949). In the IOM, the goal is to change inputs to facilitate the out-put of at least one sector; nonetheless, it is expected that not all changes in the entries of the coefficients
=1
[ + ( ⁄ ) ] have similar effects on the entries of the vec-tor
=1
[ + ( ⁄ ) ]. Based on this analysis, important coefficients (ICs) have been defined as those changes in productive inputs that cause more variation in the entries for the output (
=1
[ + ( ⁄ ) ]) (Forsell, 1988).
ICs are those in which the terms of trade of inputs between two sectors (i and j) imply a greater number of indirect relations among divisions, through the connection
=1
[ + ( ⁄ ) ]. In this way, a change in this entry involves many divisions and, therefore, modifies the output of at least one sector.
ICs are detected by means of the toler-ance limits that are defined as follows (Shintke & Stäglin, 1988):
=1
[ + ( ⁄ ) ] (6)
Where are elements of the matrix , are elements of the Leontief-in-
verse matrix, and is the gross value of production.
The identification of ICs contributes to the analysis of the key sectors of the economy constitute the fundamental structure (Jackson, 1991), which are distinguished between the estimate of error coefficients and the change of technical coefficients (Miller & Blair, 2009) that simulate a change gener-ally considered to be 10 % of the out-put. Each that is less than or equal to 10 % of the output is an important input of the matrix . In this way, the values of ≠ {0 > ≤ 10} implies an entry that is not important. Important entries are transformed in some and the rest to zeros, which results in a new matrix .
Using array of the criterion of MFA and the ICs, innovation spreading is identified by the concept of complex-ity to measure the degree of absorp-tion and propagation of innovations. Equations 7 and 8 show the degree of complexity that arises in the deliv-ery and reception of innovations of a network. Also, the degree of over-

Andrés Blancas Neria - Marco Antonio Marquez Mendoza
281REVISTA - Bogotá (Colombia) Vol. 13 N.° 2 - Julio-diciembre
all complexity can be understood as the absorption and dissemination in the whole structure, calculated as the weight of the real links in the network among the total of possible links. This measure shows the degree of direct and indirect propagation between two divisions when they receive or deliver innovations.
= − 1 (7)
= ´ − 1 (8)
Applications for Colombia and Mexico
Developed economies devote exten-sive resources to the promotion of RDI as a part of the development strategy followed by these economies. Accord-ing to the Organization for Econom-ic Cooperation and Development (OECD), the percentage of RDI with re-spect to gross domestic product (GDP) for the member countries was 2.4 % in 2015, while in Japan was 3.4 %, Swit-zerland 3.2 %, Australia and China 3 %, Denmark 2.9 %, Germany 2.8 % and the United States 2.7 %; however, in economies such as China, South Korea and Taiwan also intended considered amounts of RDI (2.1, 4.3 and 3 per cent, respectively) but in the case of Colom-bia and Mexico intended low amounts with respect of GDP, both economies share the goal of 1 % of GDP.
Figure 1 reveals that, in 2014, the Mexican economy was 0,3 percent-age points above the investment that makes Colombia, as well as the fore-casts by the Technological Develop-ment and Innovation Business of the National Council of Science and Tech-nology (Consejo Nacional de Ciencia y Tecnología [Conacyt], 2013), the Colombian Observatory of Science, Technology and Innovation, and the National Administrative Department of Statistics (Departamento Adminis-trativo Nacional de Estadística [DANE], 2015). For this type of investment ex-pectations of the expenditure incurred by the countries will remain around 0.19 % for Colombia and 0.47 % for Mexico.
According to the World Bank, the av-erage share of the RDI investment for the period between 2000 and 2014 in Colombia was 0.17 % while in Mexico was of 0.41 %. This investment has been provided mainly by government resources; for example, in the case of the Mexican economy, it is estimated that 60 % of RDI investments are made by the public sector and 40 % by pri-vate initiative. This investment repre-sents 10 % of the potential impact on the product (Conacyt, 2013), while in the case of the Colombian economy, the government investment is 66.45 % and 33.55 % reaches the private sector (DANE, 2015).

282 REVISTA DE RELACIONES INTERNACIONALES, ESTRATEGIA Y SEGURIDAD
Spreading High-tech Industry Innovations in Colombia and Mexico. A Qualitative Input-Output Analysis
The average growth of RDI invest-ment for the period between 2000 and 2014 in Colombia was 10.4 % and in Mexico 6.3 %. Yet, as shown in Figure 2, Colombia had a spectacular fall in 2004 and 2014 and Mexico in 2006 and 2011. In the fall of RDI in-vestment, the area affected has been research centers and the creation of
0
0.1
0.2
0.3
0.4
0.5
0.6
2000 2001 2002 2003 2004 2005 2006 2007 2008 2009 2010 2011 2012 2013 2014
Colombia México
Figure 1. Percentage of research, development and innovation spending with respect to gross domestic product. Prepared by the authors with data from the World Bank (2017).
specialized capital in both countries, covering about 80 % of expenditure; for example, according to the DANE (2015), the latter is focused on social and human sciences, followed by ex-act and natural sciences. Still, scientific production in the country only grows at a rate of 13 %.
-0.3
-0.2
-0.1
0
0.1
0.2
0.3
0.4
0.5
0.6
0.7
2001 2002 2003 2004 2005 2006 2007 2008 2009 2010 2011 2012 2013 2014
Colombia RDI México RDI Colombia GDP México GDP
Figure 2. Growth of gross domestic product and investment in research, development and innovation. Prepared by the authors with data from the World Bank and the OECD (2017).

Andrés Blancas Neria - Marco Antonio Marquez Mendoza
283REVISTA - Bogotá (Colombia) Vol. 13 N.° 2 - Julio-diciembre
In the case of the Mexican economy, the investment being made in univer-sities and research centers has been targeted to innovation strategic sectors such as telecommunications, energy production, and distribution and trans-port. Like Colombia, it maintains the distribution of scientific areas, as point-ed out by Conacyt (2013); the supply of social and human sciences reaches 67.9 % of the total number of offers for scientific research, development and innovation.
Furthermore, according to the data published by the OECD measured in national currency, Colombia has an average output growth rate that almost doubles that of the Mexican economy (4.3 and 2.3 %, respectively). When considering the statistical correla-tion between output growth and RDI investment of each country, it seems that there are independent variables in Colombia since the correlation is 73 %, while in Mexico is 90 %. These results suggest that, in addition to out-
put, there are other variables that af-fect the amount of RDI investment; for example, the political cycle.
Size differences between the econo-mies determine growth and a stable and inverse relation between them, thus maintaining the axiom that a de-veloped economy grows at a lower rate than other economies (Solow, 1956). In addition, as shown in Figure 2, the level of output of both countries dropped with the Great Recession, and the Mexican economy suffered the impact of such a phenomenon.
Output growth can be explained by the high share of the services sector, followed by the manufacturing sector, and a very small primary sector in both countries. Table 1 presents the growth rate and average output contribu-tion for the 2003-2014 period broken down by sector in both economies. As it can be seen, the least significant sec-tor in both cases is the primary sector.
Table 1. Output by Economic Activity. Constant Price for 2010 in National Currency
SectorColombia Mexico
Growth Contribution Growth Contribution
Primary 4 .1 % 6 .8 % 1 .7 % 2 .8 %
Manufacture 2 .6 % 42 .5 % 2 .0 % 45 .5 %
Services 4 .5 % 50 .7 % 3 .3 % 51 .7 %
Note. Prepared by the authors with data from the OECD (2017).
According to Márquez (2010), a struc-tural change in the Mexican economy has meant a loss in the share of the pri-mary sector due to an increase in ser-vices; such increase is also explained
by the loss of share of the industrial sector. Even though Colombia shows the same trend as Mexico, the Colom-bian primary sector grows and brings more to the output than Mexico.

284 REVISTA DE RELACIONES INTERNACIONALES, ESTRATEGIA Y SEGURIDAD
Spreading High-tech Industry Innovations in Colombia and Mexico. A Qualitative Input-Output Analysis
The RDI investment data disaggregated by divisions are shown in Table 2 for 2014, according to OECD data and DANE surveys to the manufacturing and service sectors. The information in Table 2 reveals that both Colombia and Mexico have five industry divi-sions that are above the average RDI investment; in the services sector, the Colombian data are more distributed and highlight six divisions of this sec-tor with a high investment percentage.
In Mexico, the disaggregated RDI data of the services sector are not complete and the existing data highlights five di-visions. Nevertheless, considering the subgroup of HTI, it turns out that only the division of chemical and pharma-ceutical products in Colombia intend-ed extensive resources in RDI, while in Mexico, the divisions Machinery and equipment and Computer, electronic and optical equipment consume large amounts of RDI.
Table 2. Distribution of RDI Investment by Division in 2014
Division Colombia Mexico
1 Agriculture, hunting, forestry and fishing 0 .0 % 0 .0 %
2 Mining and quarrying 0 .0 % 0 .7 %
3 Food products, beverages and tobacco 13 .5 % 5 .0 %
4 Textile, apparel, leather and footwear 1 .6 % 0 .7 %
5 Wood and products of wood and cork 0 .2 % 0 .2 %
6 Pulp, paper, paper products, printing and publishing 6 .1 % 0 .6 %
7 Coke, refined petroleum products and nuclear fuel 8 .5 % 0 .3 %
8 Chemicals and chemical products 8 .1 % 8 .2 %
9 Rubber and plastics products 2 .2 % 0 .5 %
10 Other non-metallic mineral products 5 .5 % 1 .2 %
11 Basic metals 1 .7 % 0 .8 %
12 Fabricated metal products 0 .5 % 2 .6 %
13 Machinery and equipment n.e.c. 0 .5 % 1 .4 %
14 Computer, electronic and optical equipment 0 .0 % 2 .3 %
15 Electrical machinery and apparatus n.e.c. 0 .3 % 6 .6 %
16 Motor vehicles, trailers and semi-trailers 1 .2 % 11 .4 %
17 Other transport equipment 0 .1 % 0 .7 %
18 Manufacturing n.e.c.; recycling 1 .8 % 0 .1 %
19 Electricity, gas and water supply 3 .1 % 0 .4 %
20 Construction 0 .0 % 0 .3 %
21 Wholesale and retail trade; repairs 1 .8 % 0 .0 %
22 Hotels and restaurants 0 .1 % 0 .0 %
23 Transport and storage 1 .7 % 0 .0 %
24 Post and telecommunications 0 .5 % 6 .4 %

Andrés Blancas Neria - Marco Antonio Marquez Mendoza
285REVISTA - Bogotá (Colombia) Vol. 13 N.° 2 - Julio-diciembre
25 Financial intermediation 7 .0 % 6 .0 %
26 Real estate activities 0 .0 % 20 .2 %
27 Renting of machinery and equipment 9 .5 % 0 .0 %
28 Computer and related activities 2 .0 % 6 .4 %
29 RDI and other business activities 4 .2 % 2 .8 %
30 Public administration and defense; compulsory social security 0 .0 % 0 .0 %
31 Education 13 .0 % 0 .0 %
32 Health and social work 5 .4 % 0 .0 %
33 Other community, social and personal services 0 .0 % 14 .4 %
34 Private households as employers 0 .0 % 0 .0 %
Note. Prepared by the authors with data from the OECD (2017) and the DANE (2017).
Interindustry Networks and Innovation Spreading
To identify interindustry networks, this work used the IOTs published by the OECD for both countries in 2011. One advantage of using this database is that they have the same criterion to define economic divisions and the same level
of disaggregation. According to the in-formation in Table 2, the impact of RDI investment output has been simulated and the results are shown in Table 3 by total and internal transactions. Rough-ly, the economic structure of Mexico has a larger number of divisions than RDI investment allocations to above-average impact of the structure.
Table 3. Impacts of Research, Development and Innovation Spending in 2014 on Gross Domestic Product
DivisionColombia Mexico
Internal Total Internal Total
1 Agriculture, hunting, forestry and fishing 0 .008 0 .010 0 .007 0 .011
2 Mining and quarrying 0 .024 0 .030 0 .037 0 .066
3 Food products, beverages and tobacco 0 .019 0 .020 0 .015 0 .017
4 Textile, apparel, leather and footwear 0 .010 0 .011 0 .014 0 .017
5 Wood and products of wood and cork 0 .010 0 .010 0 .013 0 .015
6 Pulp, paper, paper products, printing and publishing 0 .048 0 .052 0 .023 0 .034
7 Coke, refined petroleum products and nuclear fuel 0 .028 0 .032 0 .018 0 .037
8 Chemicals and chemical products 0 .039 0 .057 0 .071 0 .105
9 Rubber and plastics products 0 .022 0 .026 0 .014 0 .025
10 Other non-metallic mineral products 0 .034 0 .034 0 .022 0 .024
11 Basic metals 0 .013 0 .020 0 .032 0 .066
12 Fabricated metal products 0 .013 0 .019 0 .054 0 .073
13 Machinery and equipment n.e.c. 0 .008 0 .011 0 .017 0 .034

286 REVISTA DE RELACIONES INTERNACIONALES, ESTRATEGIA Y SEGURIDAD
Spreading High-tech Industry Innovations in Colombia and Mexico. A Qualitative Input-Output Analysis
14 Computer, electronic and optical equipment 0 .004 0 .007 0 .017 0 .050
15 Electrical machinery and apparatus n.e.c. 0 .010 0 .016 0 .073 0 .090
16 Motor vehicles, trailers and semi-trailers 0 .016 0 .021 0 .045 0 .054
17 Other transport equipment 0 .004 0 .005 0 .055 0 .059
18 Manufacturing n.e.c.; recycling 0 .021 0 .022 0 .004 0 .008
19 Electricity, gas and water supply 0 .023 0 .025 0 .030 0034
20 Construction 0 .004 0 .004 0 .002 0 .002
21 Wholesale and retail trade; repairs 0 .025 0 .036 0 .063 0 .103
22 Hotels and restaurants 0 .005 0 .006 0 .007 0 .008
23 Transport and storage 0 .020 0 .028 0 .026 0 .035
24 Post and telecommunications 0 .007 0 .008 0 .072 0 .074
25 Financial intermediation 0 .043 0 .049 0 .055 0 .061
26 Real estate activities 0 .010 0 .012 0 .026 0 .028
27 Renting of machinery and equipment 0 .488 0 .492 0 .003 0 .004
28 Computer and related activities 0 .028 0 .029 0 .327 0 .328
29 RDI and other business activities 0 .047 0 .052 0 .152 0 .174
30 Public administration and defense; compulsory social security 0 .001 0 .001 0 .097 0 .097
31 Education 0 .029 0 .030 0 .002 0 .002
32 Health and social work 0 .018 0 .019 0 .000 0 .000
33 Other community, social and personal services 0 .005 0 .006 0 .236 0 .237
34 Private households as employers 0 .000 0 .000 0 .000 0 .000
Average 0 .032 0 .035 0 .048 0 .058
Note. Prepared by the authors with data from IOT 2011 by the OECD and DANE and the OECD RDI Spending 2014.
In the case of HTI, the impacts of RDI on the output highlights the division of chemical and pharmaceutical products in Colombia, with 0.06 cents per peso invested, while in Mexico it is 0.11. In addition, there are divisions of electri-cal equipment (0.09) and other trans-port equipment (0.06). The average impact of RDI investment in Mexico is greater than in Colombia by 0.023 cents per peso.
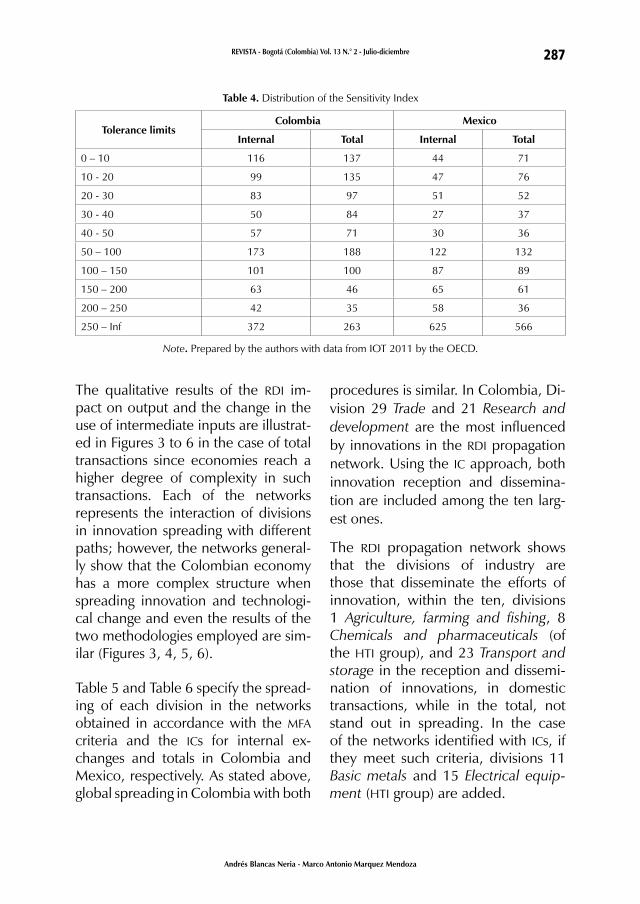
The results in Table 4 show the distri-bution of the sensitivity index, to iden-tify ICs. The number of these and is that which is in the first limit of tolerance of the Table 4 and it indicates that Co-lombia expands the effects of a change to a greater number of divisions in pro-portion of inputs on the growth that Mexico, for a total of 1,156 entries in each type of transaction. Colombia has 137 more entries and Mexico 71.
Andrés Blancas Neria - Marco Antonio Marquez Mendoza
287REVISTA - Bogotá (Colombia) Vol. 13 N.° 2 - Julio-diciembre
Table 4. Distribution of the Sensitivity Index
Tolerance limitsColombia Mexico
Internal Total Internal Total
0 – 10 116 137 44 71
10 - 20 99 135 47 76
20 - 30 83 97 51 52
30 - 40 50 84 27 37
40 - 50 57 71 30 36
50 – 100 173 188 122 132
100 – 150 101 100 87 89
150 – 200 63 46 65 61
200 – 250 42 35 58 36
250 – Inf 372 263 625 566
Note. Prepared by the authors with data from IOT 2011 by the OECD.
The qualitative results of the RDI im-pact on output and the change in the use of intermediate inputs are illustrat-ed in Figures 3 to 6 in the case of total transactions since economies reach a higher degree of complexity in such transactions. Each of the networks represents the interaction of divisions in innovation spreading with different paths; however, the networks general-ly show that the Colombian economy has a more complex structure when spreading innovation and technologi-cal change and even the results of the two methodologies employed are sim-ilar (Figures 3, 4, 5, 6).
Table 5 and Table 6 specify the spread-ing of each division in the networks obtained in accordance with the MFA criteria and the ICs for internal ex-changes and totals in Colombia and Mexico, respectively. As stated above, global spreading in Colombia with both
procedures is similar. In Colombia, Di-vision 29 Trade and 21 Research and development are the most influenced by innovations in the RDI propagation network. Using the IC approach, both innovation reception and dissemina-tion are included among the ten larg-est ones.
The RDI propagation network shows that the divisions of industry are those that disseminate the efforts of innovation, within the ten, divisions 1 Agriculture, farming and fishing, 8 Chemicals and pharmaceuticals (of the HTI group), and 23 Transport and storage in the reception and dissemi-nation of innovations, in domestic transactions, while in the total, not stand out in spreading. In the case of the networks identified with ICs, if they meet such criteria, divisions 11 Basic metals and 15 Electrical equip-ment (HTI group) are added.

288 REVISTA DE RELACIONES INTERNACIONALES, ESTRATEGIA Y SEGURIDAD
Spreading High-tech Industry Innovations in Colombia and Mexico. A Qualitative Input-Output Analysis
Figure 3. Propagation of research, development and innovation in Colombia. Prepared by the authors with data from IOT 2011 by the OECD.
Figure 4. Propagation of input change in Colombia. Prepared by the authors with data from IOT 2011 by the OECD.

Andrés Blancas Neria - Marco Antonio Marquez Mendoza
289REVISTA - Bogotá (Colombia) Vol. 13 N.° 2 - Julio-diciembre
Figure 5. Propagation of research, development and innovation in Mexico. Prepared by the authors with data from IOT 2011 by the OECD.
Figure 6. Propagation of input change in Mexico. Prepared by the authors with data from IOT 2011 by the OECD.

290 REVISTA DE RELACIONES INTERNACIONALES, ESTRATEGIA Y SEGURIDAD
Spreading High-tech Industry Innovations in Colombia and Mexico. A Qualitative Input-Output Analysis
Table 5. Degree of Innovations Spreading in Colombia
Division
MFA IC
Internal Total Internal Total
Di Do Di D Di Do Di Do
1 Agriculture, hunting, forestry and fishing 12 % 12 % 12 % 12 % 15 % 12 % 12 % 12 %
2 Mining and quarrying 18 % 3 % 18 % 3 % 21 % 15 % 15 % 12 %
3 Food products, beverages and tobacco 9 % 12 % 9 % 12 % 12 % 9 % 12 % 12 %
4 Textile, apparel, leather and footwear 9 % 9 % 9 % 15 % 9 % 9 % 9 % 15 %
5 Wood and products of wood and cork 6 % 18 % 6 % 15 % 6 % 15 % 6 % 15 %
6 Pulp, paper, paper products, printing and publishing
3 % 15 % 3 % 18 % 6 % 18 % 9 % 18 %
7 Coke, refined petroleum products and nuclear fuel
3 % 6 % 3 % 6 % 3 % 6 % 3 % 6 %
8 Chemicals and chemical products 12 % 12 % 24 % 12 % 24 % 21 % 29 % 24 %
9 Rubber and plastics products 6 % 18 % 6 % 18 % 3 % 9 % 12 % 15 %
10 Other non-metallic mineral products 6 % 18 % 6 % 18 % 6 % 12 % 6 % 15 %
11 Basic metals 12 % 9 % 21 % 9 % 12 % 18 % 26 % 15 %
12 Fabricated metal products 18 % 9 % 18 % 9 % 24 % 9 % 24 % 21 %
13 Machinery and equipment n.e.c. 0 % 12 % 6 % 15 % 0 % 12 % 9 % 15 %
14 Computer, electronic and optical equipment
0 % 18 % 3 % 24 % 0 % 21 % 3 % 24 %
15 Electrical machinery and apparatus n.e.c. 9 % 12 % 12 % 12 % 12 % 12 % 15 % 15 %
16 Motor vehicles, trailers and semi-trailers 3 % 12 % 3 % 12 % 3 % 12 % 3 % 12 %
17 Other transport equipment 3 % 12 % 3 % 21 % 3 % 9 % 6 % 21 %
18 Manufacturing n.e.c.; recycling 3 % 18 % 3 % 24 % 0 % 9 % 0 % 12 %
19 Electricity, gas and water supply 15 % 9 % 12 % 9 % 15 % 9 % 12 % 12 %
20 Construction 3 % 12 % 3 % 15 % 0 % 3 % 0 % 9 %
21 Wholesale and retail trade; repairs 59 % 9 % 59 % 9 % 59 % 29 % 68 % 21 %
22 Hotels and restaurants 3 % 12 % 0 % 9 % 0 % 9 % 0 % 9 %
23 Transport and storage 32 % 12 % 35 % 12 % 26 % 15 % 35 % 21 %
24 Post and telecommunications 3 % 18 % 3 % 15 % 3 % 9 % 3 % 9 %
25 Financial intermediation 18 % 6 % 18 % 6 % 18 % 6 % 21 % 6 %
26 Real estate activities 9 % 3 % 6 % 3 % 3 % 3 % 3 % 3 %
27 Renting of machinery and equipment 3 % 6 % 3 % 6 % 3 % 3 % 3 % 3 %
28 Computer and related activities 3 % 3 % 3 % 3 % 3 % 3 % 3 % 3 %
29 RDI and other business activities 59 % 6 % 56 % 6 % 50 % 12 % 53 % 15 %
30 Public administration and defense; compulsory social security
0 % 9 % 0 % 9 % 0 % 6 % 0 % 6 %
31 Education 0 % 6 % 0 % 3 % 0 % 0 % 0 % 0 %
32 Health and social work 3 % 9 % 3 % 9 % 3 % 6 % 3 % 9 %
Andrés Blancas Neria - Marco Antonio Marquez Mendoza
291REVISTA - Bogotá (Colombia) Vol. 13 N.° 2 - Julio-diciembre
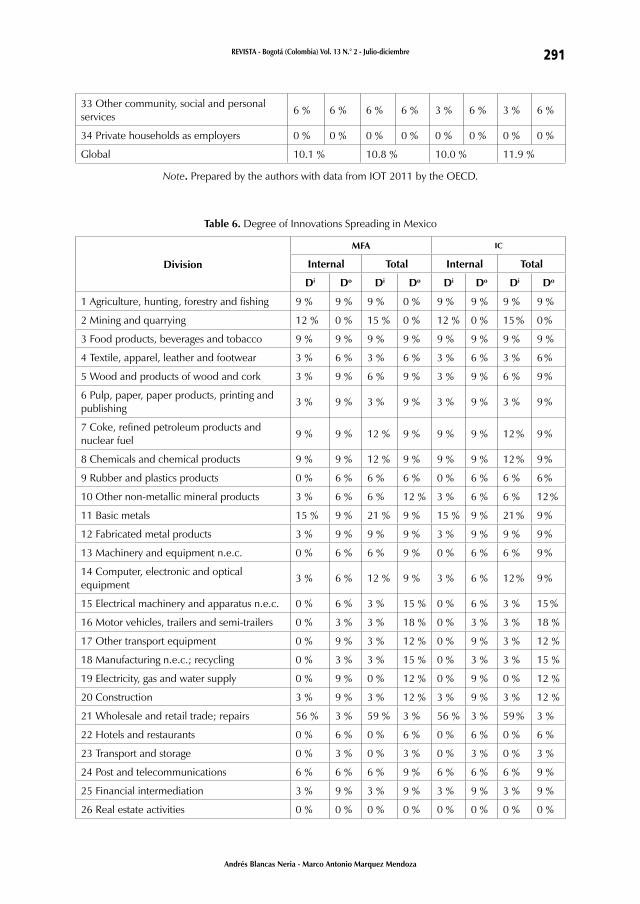
Table 6. Degree of Innovations Spreading in Mexico
Division
MFA IC
Internal Total Internal Total
Di Do Di Do Di Do Di Do
1 Agriculture, hunting, forestry and fishing 9 % 9 % 9 % 0 % 9 % 9 % 9 % 9 %
2 Mining and quarrying 12 % 0 % 15 % 0 % 12 % 0 % 15 % 0 %
3 Food products, beverages and tobacco 9 % 9 % 9 % 9 % 9 % 9 % 9 % 9 %
4 Textile, apparel, leather and footwear 3 % 6 % 3 % 6 % 3 % 6 % 3 % 6 %
5 Wood and products of wood and cork 3 % 9 % 6 % 9 % 3 % 9 % 6 % 9 %
6 Pulp, paper, paper products, printing and publishing
3 % 9 % 3 % 9 % 3 % 9 % 3 % 9 %
7 Coke, refined petroleum products and nuclear fuel
9 % 9 % 12 % 9 % 9 % 9 % 12 % 9 %
8 Chemicals and chemical products 9 % 9 % 12 % 9 % 9 % 9 % 12 % 9 %
9 Rubber and plastics products 0 % 6 % 6 % 6 % 0 % 6 % 6 % 6 %
10 Other non-metallic mineral products 3 % 6 % 6 % 12 % 3 % 6 % 6 % 12 %
11 Basic metals 15 % 9 % 21 % 9 % 15 % 9 % 21 % 9 %
12 Fabricated metal products 3 % 9 % 9 % 9 % 3 % 9 % 9 % 9 %
13 Machinery and equipment n.e.c. 0 % 6 % 6 % 9 % 0 % 6 % 6 % 9 %
14 Computer, electronic and optical equipment
3 % 6 % 12 % 9 % 3 % 6 % 12 % 9 %
15 Electrical machinery and apparatus n.e.c. 0 % 6 % 3 % 15 % 0 % 6 % 3 % 15 %
16 Motor vehicles, trailers and semi-trailers 0 % 3 % 3 % 18 % 0 % 3 % 3 % 18 %
17 Other transport equipment 0 % 9 % 3 % 12 % 0 % 9 % 3 % 12 %
18 Manufacturing n.e.c.; recycling 0 % 3 % 3 % 15 % 0 % 3 % 3 % 15 %
19 Electricity, gas and water supply 0 % 9 % 0 % 12 % 0 % 9 % 0 % 12 %
20 Construction 3 % 9 % 3 % 12 % 3 % 9 % 3 % 12 %
21 Wholesale and retail trade; repairs 56 % 3 % 59 % 3 % 56 % 3 % 59 % 3 %
22 Hotels and restaurants 0 % 6 % 0 % 6 % 0 % 6 % 0 % 6 %
23 Transport and storage 0 % 3 % 0 % 3 % 0 % 3 % 0 % 3 %
24 Post and telecommunications 6 % 6 % 6 % 9 % 6 % 6 % 6 % 9 %
25 Financial intermediation 3 % 9 % 3 % 9 % 3 % 9 % 3 % 9 %
26 Real estate activities 0 % 0 % 0 % 0 % 0 % 0 % 0 % 0 %
33 Other community, social and personal services
6 % 6 % 6 % 6 % 3 % 6 % 3 % 6 %
34 Private households as employers 0 % 0 % 0 % 0 % 0 % 0 % 0 % 0 %
Global 10.1 % 10.8 % 10.0 % 11.9 %
Note. Prepared by the authors with data from IOT 2011 by the OECD.

292 REVISTA DE RELACIONES INTERNACIONALES, ESTRATEGIA Y SEGURIDAD
Spreading High-tech Industry Innovations in Colombia and Mexico. A Qualitative Input-Output Analysis
27 Renting of machinery and equipment 0 % 0 % 0 % 0 % 0 % 0 % 0 % 0 %
28 Computer and related activities 0 % 3 % 0 % 3 % 0 % 3 % 0 % 3 %
29 RDI and other business activities 29 % 3 % 29 % 3 % 29 % 3 % 29 % 3 %
30 Public administration and defense; compulsory social security
0 % 0 % 0 % 0 % 0 % 0 % 0 % 0 %
31 Education 0 % 0 % 0 % 0 % 0 % 0 % 0 % 0 %
32 Health and social work 0 % 3 % 0 % 6 % 0 % 3 % 0 % 6 %
33 Other community, social and personal services
0 % 3 % 0 % 3 % 0 % 3 % 0 % 3 %
34 Private households as employers 0 % 0 % 0 % 0 % 0 % 0 % 0 % 0 %
Global 5.2 % 7.1 % 5.2 % 7.1 %
Note. Prepared by the authors with data from IOT 2011 by the OECD.
The results suggest that the HTI in Colombia spreads innovation promi-nently with other divisions of industry toward the primary and services sec-tors; however, in addition to the men-tioned divisions of the industrial sector, 3 Food, beverages and tobacco and 12 Manufacture of fabricated metal prod-ucts, except machinery and equipment are influenced.
In the case of Mexico, the overall dis-semination rate indicates that, on av-erage, each division sends or receives innovations with other two, half of which is happening in Colombia. None-theless, the divisions that stand out in innovation reception and dissemina-tion are 1 Agriculture, farming and fish-ing; 3 Food, beverages and tobacco; 7 Petroleum products and nuclear energy; 8 Chemicals and pharmaceuticals (of the HTI group); and 12 Manufacture of fabricated metal products, except ma-chinery and equipment. HTI diffusion in the networks reviewed stands out only in the case of imported inputs.
The results show that, in the Colom-bian and Mexican economies, inno-vation flows in the HTI little affect the productive structure. In both coun-tries, division 8 Chemicals and chemi-cal products has a spreading effect into the strategic economy since it receives and disseminates innovations; how-ever, the rest of the HTI group is dif-ferent in structure between the two countries. The results of total transac-tions in Colombia reveal that, in the HTI, dissemination occurs in division 14 Computer, electronic and opti-cal equipment (to eight divisions), 17 Other transport equipment (to seven divisions), 13 Machinery and equip-ment (to five divisions), and finally, di-visions 15 Electrical machinery and 16 Motor vehicles, trailers and semitrailers (to four divisions). In Mexico, these two divisions are the most widespread (to five and six divisions), followed by division 17 Other transport equipment (to four divisions), and finally, divisions 13 Machinery and equipment and

Andrés Blancas Neria - Marco Antonio Marquez Mendoza
293REVISTA - Bogotá (Colombia) Vol. 13 N.° 2 - Julio-diciembre
14 Computer, electronic and optical equipment (to three divisions).
These results reveal that, in Mexico, there is a less integrated structure and, like Colombia, the effects of RDI investment does not respond to inter-industry linkages. In both cases, the HTI is composed of divisions whose companies have oligopolistic market structures. The strategic enterprises of division 8 Chemicals and chemical products are made up of transnation-al corporations such as Pfizer, Sanofi, Bayer, and Novartis (García, 2014; Ar-dila, 2014), which exploit the benefits of each economy. The effects of RDI in-vestment on the HTI are differentiated across industries and countries.
The results of innovation diffusion are due to the different processes of opening economies, which generally respond to the corporate behavior of transnational corporations, the state of the host economy, and the interna-tional environment (Ramírez de la O, 1983), as the Mexican economy has experienced in the face of the current U.S. administration.
Conclusions
The premise with which this work be-gan is appropriate and explains the re-sults of the economies analyzed since they have revealed that HTI does not play a relevant role in coordinating the process of spreading innovation, as expected to happen with developed economies. Although, for both econo-mies the analyzed economic networks
reflect low levels of complexity, i.e. limited intersectoral linkages in the productive fabric, impact size and RDI investment amounts in respect of each country are similar.
Using the input-output analysis, it is possible to identify the path followed by a change in the conditions of final demand or payment of productive fac-tors, as well as a change in the techni-cal conditions per unit of output. The main techniques developed in the QIOA do not differ from the results; however, the Intermediate Output method seems to be more appropri-ate to spread innovations and, to a greater extent, technological change as this procedure is based on internal in-formation of the productive structure. Moreover, MCFP depends on an exog-enous variable, which may vary from one year to another. This occurs with the identification of the Intermediate Output.
Without a doubt, because of the low levels of RDI investment, both econo-mies require to encourage such invest-ment and stimulate funding by private initiative through taxable base incen-tives or other instruments. Even when economies are in a context of global production managed by transnational corporations, they should undertake efforts to increase RDI.
In addition to size differences in each economy, the dissemination of RDI in-vestment is more extensive in the Co-lombian economic structure and, like the Mexican structure, most industrial

294 REVISTA DE RELACIONES INTERNACIONALES, ESTRATEGIA Y SEGURIDAD
Spreading High-tech Industry Innovations in Colombia and Mexico. A Qualitative Input-Output Analysis
divisions have considerable effects on the RDI diffusion of innovations. In the particular case of HTI, the Mexican economy spreads more products by innovation than Colombia but in no case receives innovations from other divisions, except when productive processes incorporate imported inter-mediate inputs.
In Mexico, the primary and service sectors play a dual role in spreading innovations and technological change: they deliver and receive innovations, while in Colombia receives more in-novations. Consequently, this country also needs to focus efforts on creat-ing innovations in such sectors. If the goal that economies pursue is to have greater effect on RDI investment, it will be necessary to increase the allocated amounts and incorporate a greater number of divisions so that their flow is greater and the impacts on output spread across more activities.
References
Ardila, R. (2014). Caracterización de la industria farmacéutica en Colombia y análisis de la competencia desde la perspectiva de la planeación es-tratégica. Revista Teckne, 12(2), 23-28.
Aroche, F. (2006). Regímenes de cre-cimiento, cambio estructural y co-eficientes de insumo. El Trimestre Económico, LXXIII(4)(292), 881-902.
Bon, R. (1989). Qualitative Input-Output Analysis. In R. E. Miller, K. R. Polenske, & A. Z. Rose (Eds.),
Frontiers in Input-Output Analy-sis (222-231). Nueva York: Oxford University Press.
Consejo Nacional de Ciencia y Tec-nología (Conacyt) (2013). Informe general del estado de la ciencia, tecnología e innovación. Mexico, Mexico City.
Departamento Administrativo Nacio-nal de Estadística (DANE) (2015). En-cuesta de Desarrollo e Innovación Tecnológica. Bogotá.
Duque, J., Rey, S., & Gómez D. (2009). Identifying Industry Clusters in Co-lombia Based on Graph Theory. Ensayos sobre Política Económica, 27(59), 14-45.
Forsell, O. (1988). Growth and the changes in the structure of the Fin-nish economy in the 1960s and 1970s. In M. Ciaschini (Ed.), Input-output analysis. Current develo-pment (pp. 287-302). New York: Chapman and Hall.
García, A., Aroche, F., & Ramos, C. (2007). Determinación de coefi-cientes importantes por niveles tec-nológicos: una aproximación desde el modelo de Miyazawa. Investiga-ciones Económicas, XXI(1), 161-190.
García, E. (2014). Ranking: las 10 empresas farmacéuticas con ma-yores ventas en México. Sentido Común. Retrieved from http://bs.sentidocomun.com.mx/articulo.phtml?id=12595&auth=qkpzienvbq73btr
Jackson, R. W. (1991).The Relative Im-portance of Input Coefficients and
Andrés Blancas Neria - Marco Antonio Marquez Mendoza
295REVISTA - Bogotá (Colombia) Vol. 13 N.° 2 - Julio-diciembre
Transactions in Input-output Struc-ture. In J. H. Llewelyn Dewhurst, R. C. Jensen, & G. Hewings (Eds.), Re-gional input-output modelling. New developments and interpretations (pp. 51-65). Aldershot: Avebury.
Kaldor, N. (1966). Causes of the slow rate of economic growth of the Uni-ted Kingdom: an Inaugural Lecture. Cambridge: Cambridge University Press.
Leontief, W. (1986). Input-output eco-nomics. New York: Oxford Univer-sity Press.
Márquez, G. (2010). Evolución y es-tructura del PIB. In S. Kuntz Ficker (Coord.), Historia económica gene-ral de México. De la colonia a nues-tros días (pp. 549-572). Mexico, Mexico City: El Colegio de México, Secretaría de Economía,
Márquez, M. A. (2016). Los sectores de alta tecnología en América del Norte: un análisis de redes interin-dustriales (Doctoral dissertation). Mexico, Universidad Nacional Au-tónoma de México.
Márquez, M. A. (2018). La derrama de las exportaciones en países de Lati-noamérica. Problemas del Desarro-llo, (193) [on press].
Marshall, A. (1931). Principios de eco-nomía. Introducción al estudio de esta ciencia. Barcelona: Biblioteca de Cultura Económica.
Miller, R., & Blair, P. (2009). Input-output analysis. Foundations and extentions. New York: Cambridge University Press.
Organización de las Naciones Unidas para el Desarrollo Industrial (ONU-DI) (2015). Informe sobre el Desa-rrollo Industrial 2016. El rol de la tecnología y la innovación en el de-sarrollo industrial inclusivo y soste-nible. Summary. Vienna.
Pasinetti, L. (1973). The Notion of Ver-tical Integration in Economic Analy-sis. Metroeconomica, 25(1), 1-29.
Ramírez de la O, R. (1983) De la im-provisación al fracaso. La política de la inversión extranjera en México. Mexico, Mexico City: Centro de Desarrollo, Ediciones Océano.
Sakurai, N., Papaconstantinou, G., & Ioannidis, E. (1997). Impact of R&D and technology diffusion on pro-ductivity growth: Empirical eviden-ce for 10 OECD countries. Economic Systems Research, 9(1), 81-109.
Schnabl, H., & Holub, H. (1979). Qua-litative und quantitative, aspekte der input-output analyse: Ansatz-punkte zu einer neuorientierung der konjunturpolitik. Zeitschrift für die gesamte staatswissenschaft / Journal of Institutional and Theorical Economics, (4), 657-678.
Schnabl, H. (1995). The subsystem-MFA: A Qualitative Method for Analyzing National Innovation Systems. The Case of Germany. Economic Systems Research, 7(4), 383-396.
Scherman, J., & Morrison, W. J. (1949). Adjustment of an inverse matrix corresponding to a change in one element of a given matrix. Annals of

296 REVISTA DE RELACIONES INTERNACIONALES, ESTRATEGIA Y SEGURIDAD
Spreading High-tech Industry Innovations in Colombia and Mexico. A Qualitative Input-Output Analysis
Mathematical Statistics, (17), 124-127.
Schumpeter, J. (1978). Teoría del des-envolvimiento económico. Una investigación sobre las ganancias, capital, crédito, interés y ciclo eco-nómico. Mexico, Mexico City: Fon-do de Cultura Económica.
Shapiro, C., & Varian, H. (1999). El do-minio de la información: Una guía estratégica para la economía de red. Barcelona: Antoni y Bosch.
Shi, P., Zhang, J., Yang B., & Luo, J. (2014). Hierarchicality of trade flow networks reveals complexity of pro-ducts. https://doi.org/10.1371/jour-nal.pone.0098247
Shintke, J., & Stäglin, R. (1988). Im-portant input coefficients in market transactions tables and production flow tables. In M. Ciaschini (Ed.), Input-Output Analysis. Current De-velopments (pp. 43-60). New York: Chapman and Hall.
Smith, A. (1958). Investigación sobre la naturaleza y causas de la riqueza de las naciones. Mexico, Mexico City: Fondo de Cultura Económica.
Sonis, M., Hewings, G.J.D., & Guo, J., (1996). Sources of structural chan-ges in input-output systems: a field of influence approach. Economic Systems Research, 8, 15-32.
Solow, R. (1956). A Contribution to the Theory of Economic Growth. The Quarterly Journal of Economics, 70(1), 65-94.
Sraffa, P. (1960). Producción de mer-cancías por medio de mercancías. Barcelona: Oikos-Tau.
Whitin, T. (1954). An economic appli-cation of “Matrices and trees”. In O. Morgenstern (Ed.), Economic Activity Analysis (pp. 401-418). Mi-chigan: John Wiley & Sons, Inc., Chapman & Hall, Ltd.