Embed Size (px)
Citation preview
1
Spreadsheet Analysisfor
Portfolio Optimization
Anava Capital Management LLC408-918-9333
Bob Smithson
Please Note: Individual companies shown or discussed in this presentation have been used as examples only and are not intended as recommendations of any kind by Anava Capital Management LLC or any of its representatives.
2
PORTFOLIO OPTIMIZATION
WHAT ARE THE CHARACTERISTICS OF AN OPTIMUM PORTFOLIO?
• An optimum portfolio is one that meets your individual investment objectives as well as possible given the investments available.
• An optimum portfolio can be constructed only if you can specify mathematically exactly what you want.
• Investment objectives are specified by giving the desired minimum return as a function of time, and the desired maximum risk as a function of time.
• The specified risk and return combination must be possible to achieve.
Maybe the greatest benefit of using computerized portfolio construction and management is that this approach forces you to think about what you really want out of your investments, and how you want to go about achieving your goals. If you know these things well enough to tell a computer what to do, you are much more conscious of how you make your investment decisions than most investors. Even more importantly, computer portfolio tracking provides a clear record of performance, and tells you what is and is not possible to accomplish with your methods. These are the basic questions you need to answer by proving actual numbers:
1. How much money will you be able to invest now and in the future?
2. How much money do you need to have in reserve for known (tuition, vacation, etc.) and unanticipated (unemployment, medical, expenses) expenses now and in the future?
3. What is your estimated income, exclusive of the portfolio you are planning, now and in the future?
4. What are your estimated routine expenses now and in the future?
5. What level of inflation to you expect in the future?
These things needn’t be known exactly, but they should be given reasonable estimates. The answers to them will provide an objective estimate of the minimum return you need, and the maximum risk you can take. If the risk and return combination you need can’t be achieved, then you know that other measures need to be taken – cut expenses or increase income or both. If they can be met, portfolio optimization techniques can be used to estimate the margin of safety (defined as the probability you will meet your goals) you can achieve. If the margin is greater than you feel you need, you can spend more or save more. It’s up to you. If it’s less, you need to cut expenses or increase income.

3
EXCEL SPREADSHEETS
• Microsoft Excel is the de facto standard spreadsheet for portfolio analysis.
• Capabilities of Excel include- Automatic downloading of data- Storage of moderate amounts of data- Spreadsheet functions including sophisticated
statistical analysis methods that can be used directly on the spreadsheet
- Macro programming using VBA (Microsoft Visual Basic For Applications)
- The ability to use add-ins written in other languages such as C++
- Extensive charting features
Using Excel can be dauntingly complex or surprisingly simple. There are likely people in this course that are expert programmers who can make a computer do pretty much everything, and there are others that simply want to run a spreadsheet constructed by someone else, and others that are competent with everything except macro and add-in programming.
By providing an example spreadsheet, we hope to provide a starting point for people at all three levels. The spreadsheet was created for this course by Bob Smithson, and is copyrighted by Bob, Anava Corporation, and Anava Capital Management LLC. It is being released under the Gnu General License developed by the Free Software Foundation. This allows unlimited copying and modifying of the program as well as unlimited distribution of copies to others, provided that all such copies and modified versions of the code contain the Gnu License Statements distributed with the original program.
The workbook has protection added to the Input and Results worksheets, but there is no password, so protection can be removed and changes can be made easily. Macro source code is available and unprotected, as are all the other worksheets. The code is not professional quality, and it is possible for a user to accidentally damage the program code or data. For this reason, it is best to keep one or more safe backup copies that are never used for calculation.

4
CLASS STRUCTURE
• Built around a free open-source spreadsheet that uses- Automatic historical data downloads from Yahoo
Finance- Manual methods to analyze the performance of
any given portfolio using several different criteria- VBA macros that calculate optimum portfolios
using random search and gradient ascent methods and any one of five different performance criteria.
- Charts to help evaluate the quality of the optimized portfolio
• We will demonstrate the use of this software to construct optimized portfolios containing stocks, bonds, mutual funds, and cash.
We will demonstrate:
1. How to use the spreadsheet to create an optimized portfolio
2. Historical data downloads, both manual and automatic, from Yahoo Finance
3. Manual analysis of portfolio performance
4. Use of macros
5. Use of charts
6. How to record a macro
7. A little bit of how to write a macro or change macro code
8. How to handle stocks, bonds, mutual funds, and cash

5
OPTIMIZATION METHODS
• SEARCHES ARE THE ONLY METHOD APPLICABLE TO STOCKS- Try different proportions of the candidate stocks
to see which performs best as a portfolio.- Use the actual historical returns over some past
time period for the search. This tells you how a portfolio would really have performed in the past. This is the method we use.
- Use randomly generated data similar to the actual returns (same mean and standard deviation). This is called a Monte Carlo technique.
• DIRECT CALCULATION- Possible for known income (most treasuries but
only if they are held to maturity)
For this class we assume that you have somehow selected a set of candidate securities which you like individually. The only feasible method for finding an optimum portfolio containing most securities is to try a lot of different combinations of your selected securities to see which will likely have the best performance. What is “best” differs depending on your investment objectives and your personal prejudices.
The main problem with this technique is that you must make your decisions based on past performance, which is never the same as future performance. There are two commonly used methods. One is to use actual past performance over some time period as a guide. The other (favored by those who believe in the “efficient market hypothesis”) is to use the performance of portfolios created at random but with the same average returns and risks as the actual data. This removes all correlation between price movements of the securities in the belief that they cannot be predicted to occur in the same way in the future. This second method is called the “Monte Carlo” technique because of the random “price histories” that are generated.
The difference between the two in practice is that the actual data shows a wider range of portfolio performance than the Monte Carlo simulation. This is because in the real world, price fluctuations are frequently strongly correlated with each other (or anti-correlated). Thus the best portfolio found in a search on real data will be better than the best found with Monte Carlo data, and the worst will be worse.
The argument in favor of Monte Carlo is that because it is unlikely that the performance of the best portfolio in the past will be repeated, it is best to assume that the future movements of the securities will be uncorrelated, leading to a more realistic estimate. The argument in favor of using historical data is that you should be realistic in your estimates. The real world is the real world. Therefore, the spreadsheet doesn’t just give a best portfolio. It shows you the actual performance in the past of a thousand or more portfolios so you can see the possible effects of mistakes in portfolio allocation. This gives you a much better fell for the risks and possible rewards than an one number, however calculated.

6
OPTIMIZATION - SEARCHES
�Searches• Random
- Select the percentage of each stock at random to create a portfolio, then calculate the quality of the portfolio (for example by calculating the Sharpe ratio) Repeat many times and choose the best found.
• Pseudo-random- Same as above, but pick the percentages so that they
cover certain possibilities more completely (e.g. – nearly all one stock, or favoring equal weighting).
• Systematic- Use a systematic search (e. g. – even steps in the weights
for each stock, like 0.0, 0.1, 0.2, …, 1.0)• The more you know the more systematic you can be.
7
WHAT RESULTS TO EXPECT
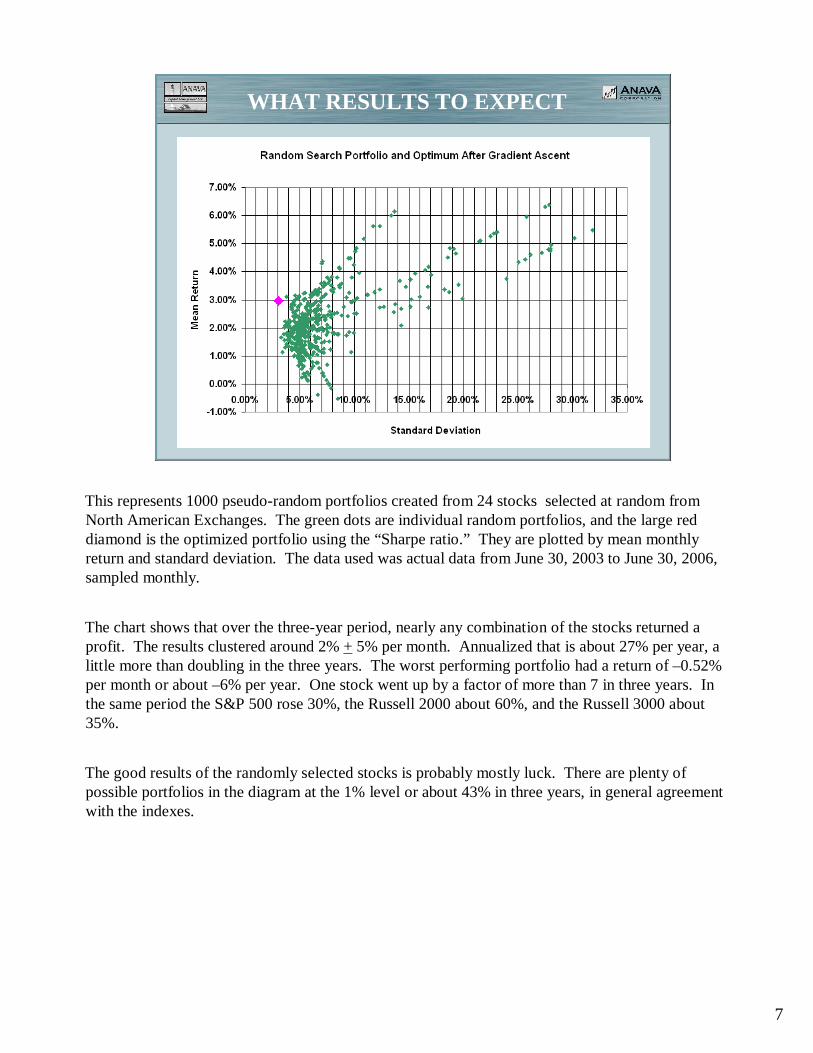
This represents 1000 pseudo-random portfolios created from 24 stocks selected at random from North American Exchanges. The green dots are individual random portfolios, and the large red diamond is the optimized portfolio using the “Sharpe ratio.” They are plotted by mean monthly return and standard deviation. The data used was actual data from June 30, 2003 to June 30, 2006, sampled monthly.
The chart shows that over the three-year period, nearly any combination of the stocks returned a profit. The results clustered around 2% +5% per month. Annualized that is about 27% per year, a little more than doubling in the three years. The worst performing portfolio had a return of –0.52% per month or about –6% per year. One stock went up by a factor of more than 7 in three years. In the same period the S&P 500 rose 30%, the Russell 2000 about 60%, and the Russell 3000 about 35%.
The good results of the randomly selected stocks is probably mostly luck. There are plenty of possible portfolios in the diagram at the 1% level or about 43% in three years, in general agreement with the indexes.

8
INPUT SHEET
The input sheet has grey areas which are not protected. They are used for user inputs. There are also three green buttons, one for downloads, one to compute equal-dollar-weighted averages for sectors, and one to optimize the portfolio.

9
INPUT PARAMETERS
The gray area on the upper left allows the input of up to 99 tickers, and associated sectors. The sectors are used only for computing sector averages. The tickers are used only for downloading data. The information in the gray areas on the upper right includes:
1. Annualized % treasury bond rate for the sampling period. In most cases the current T-bill rate can be used. THIS IS USED IN OPTIMIZATION
2. The minimum % cash to be placed in each security. Be sure the number you enter is possible. For example, you can’t put a minimum of 20% into each of 10 stocks. This should usually be left at 0.
3. The maximum % cash to be placed in each stock. Again, be sure it’s possible. The program assumes you want to allocate 100% of your money, and you can’t get there with a maximum of 5% in each of 10 stocks. This should usually be left at 100.
4. The sample period, m for monthly, w for weekly, and d for daily. THIS VALUE IS USED FOR DOWNLOAD AND OPTIMIZATION, WHEN OPTIMIZING ON STORED DATA, BE SURE THAT IT IS SET TO THE INTERVAL AT WHICH THE DATA IS SAMPLED
5. The date range to download. Be sure the from date is before the to date.
6. The number of random search iterations. For now, 1000 works well for most things. If you enter 0, the program will compute an appropriate number, but it may take longer to compute without adding any accuracy.
The green download button downloads data from Yahoo Finance. You will be given an opportunity to specify the destination worksheet. The default is Data.
The compute sector values button computes the equal-weighted sector values from a sheet with ticker data and sector labels. You will be given an opportunity to specify the source and destination worksheets. The default source is Data. The default destination is Sectors.
The green optimize portfolio button starts the optimization process. You can select to optimize the Sharpe ratio, the Standard Deviation, or the Down Standard Deviation, or to find the best return for a given desired standard deviation, or the smallest standard deviation for a given desired return.

10
OUTPUT SHEET
The green dots are the random portfolios plotted by mean return and standard deviation over the sample interval. THESE ARE NOT ANNUALIZED. The red diamond is the optimized portfolio. The statistics for the optimized portfolio are on the “Optimum” line on the top left. The security dollar weighting for the optimized portfolio is on the top right. The cash to be allocated to each stock is next to the weight, based on the “Available Cash” entered at top center. The available cash is not used in optimization and can be changed at any time after the calculations are done.

11
RESULT CHART
Here’s a closer look.

12
RESULTING PORTFOLIO
Each share is given a dollar weight, and the value of the optimum investment based on the dollars available. The weights are rounded to the nearest 0.1% and the value to the nearest penny.
The standard deviation and mean return is over the sample period that is 1 day if daily data was used, 1 week for weekly data, and 1 month for monthly data. The table shows statistics for the risk-free investment, and for the optimum portfolio. The “End” line should be ignored.
13
DOWNLOADED DATA
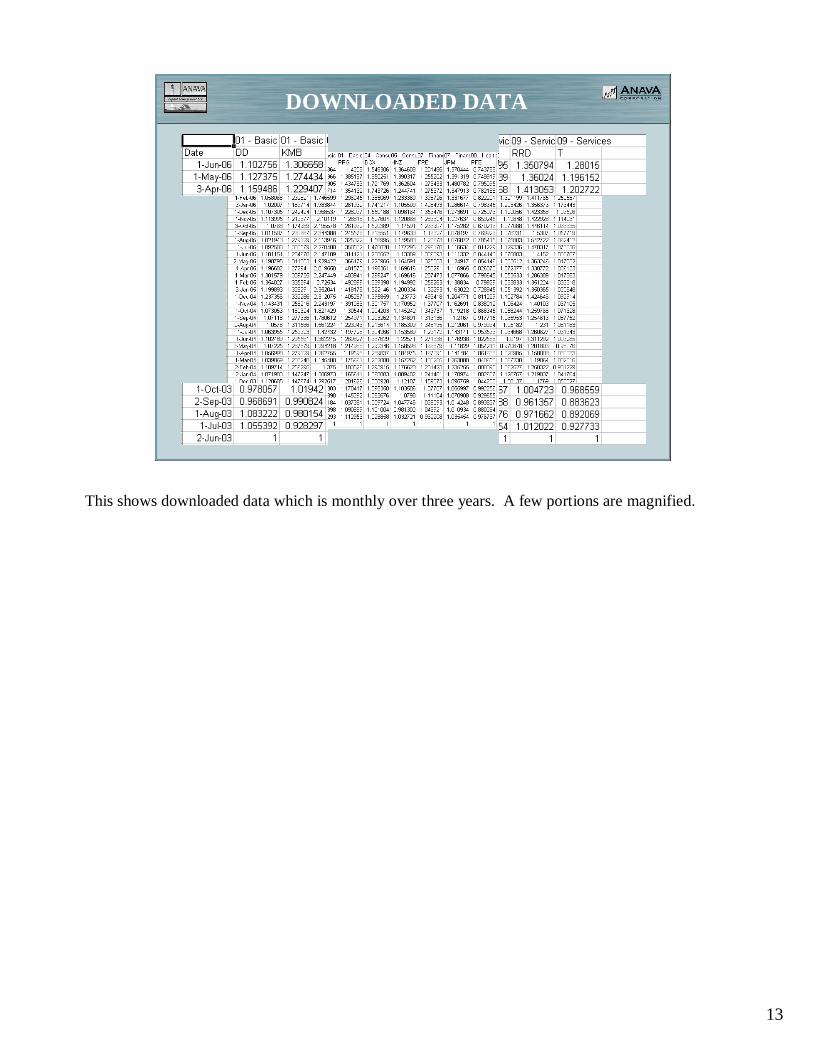
This shows downloaded data which is monthly over three years. A few portions are magnified.

14
OPEN SOURCE CODE
This shows some of the source code. If you know how to write macros, feel free to use them as a starting point for your own.

15
YAHOO BOND DATA
SHY: 1SHY: 1SHY: 1SHY: 1----3 Yr Treasury ETF3 Yr Treasury ETF3 Yr Treasury ETF3 Yr Treasury ETF IEF: 7IEF: 7IEF: 7IEF: 7----10C Yr Treasury ETF10C Yr Treasury ETF10C Yr Treasury ETF10C Yr Treasury ETF TLT: 20+ Yr Treasury ETFTLT: 20+ Yr Treasury ETFTLT: 20+ Yr Treasury ETFTLT: 20+ Yr Treasury ETF
LQD: Corp. Bond ETFLQD: Corp. Bond ETFLQD: Corp. Bond ETFLQD: Corp. Bond ETF VUSTX: LT Treasury MFVUSTX: LT Treasury MFVUSTX: LT Treasury MFVUSTX: LT Treasury MF PRWBX: ST Bond MFPRWBX: ST Bond MFPRWBX: ST Bond MFPRWBX: ST Bond MF
Bond ETFs & Mutual Funds
0.9
1
1.1
1.2
10-Dec-02
28-Jun-03
14-Jan-04
1-Aug-04
17-Feb-05
5-Sep-05
24-Mar-06
10-Oct-06
Date
Val
ue
SHY IEF TLT LQD VUSTX PRWBX
Bonds, even “risk-free” bonds, are usually best approximated by prices for ETFs or mutual funds. The reason for this is that they represent the value of your holdings versus time, the amount you would receive if you were forced to cash in a bond before maturity. Notice the fluctuations in short-term treasuries, the most risk-free of all risk-free investments.
I am not aware of any source for historical prices on individual bonds.

16
YAHOO MONEY MARKET DATA
Money Market Mutual Funds
1
1.02
1.04
1.06
1.08
1.1
10-Dec-02
28-Jun-03
14-Jan-04
1-Aug-04
17-Feb-05
5-Sep-05
24-Mar-06
10-Oct-06
Date
Val
ue
DFINX DVMKX
DFINX: DFINX: DFINX: DFINX: Diversified Investors Insti Mon
DVMKX: DVMKX: DVMKX: DVMKX: Diversified Money Market Inv
Money market funds can be treated in the same way as stock and bond funds if the earlier price of the fund (usually kept constant at $1 or $10) is adjusted at each dividend time assuming reinvestment of dividends. This is done in the “Adjusted Close” column for funds listed in Yahoo historical prices. It can also be done manually (on the spreadsheet of course) for any such fund for which a dividend history is available.
Money in CDs, annuities and the like, with guaranteed future interest rates can be analyzed using FUTURE cash-out returns as a function of time, plotted as cash value to you as a function of time. Of course you should include a possibility of loss from defaults, not really necessary for insured savings. Then there’s the “under the mattress” account, which is simply a flat line in non-inflation adjusted dollars (zero risk, zero return) to start with, but should be corrected for the chance of loss caused by fire, theft, foolish spending, etc. as a function of time.
The foolish spending factor, by the way, is a particularly bad problem for easy-to-spend accounts like cash, but always exists for nearly any form of assets. I have never seen it considered in any financial analysis.
17
SHARPE - MM vs STOCK FUND
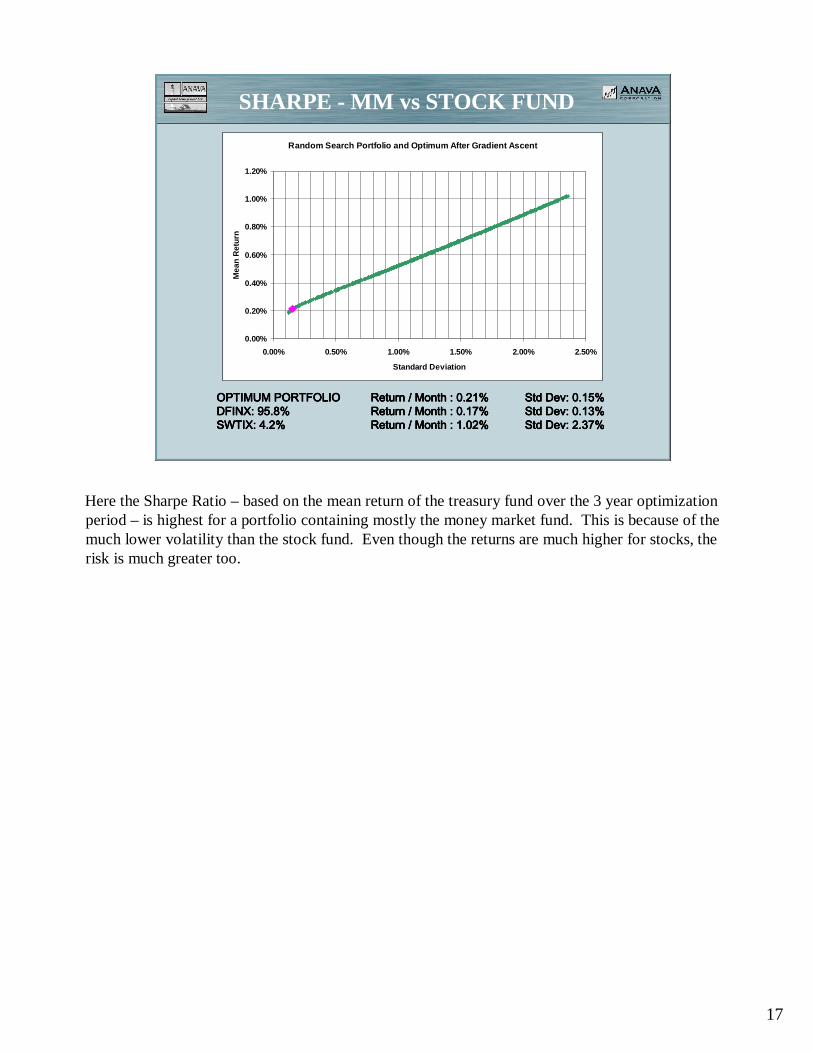
OPTIMUM PORTFOLIOOPTIMUM PORTFOLIOOPTIMUM PORTFOLIOOPTIMUM PORTFOLIO Return / Month : 0.21% Return / Month : 0.21% Return / Month : 0.21% Return / Month : 0.21% Std Dev: 0.15%Std Dev: 0.15%Std Dev: 0.15%Std Dev: 0.15%DFINX: 95.8%DFINX: 95.8%DFINX: 95.8%DFINX: 95.8% Return / Month : 0.17% Return / Month : 0.17% Return / Month : 0.17% Return / Month : 0.17% Std Dev: 0.13%Std Dev: 0.13%Std Dev: 0.13%Std Dev: 0.13%SWTIX: 4.2%SWTIX: 4.2%SWTIX: 4.2%SWTIX: 4.2% Return / Month : 1.02% Return / Month : 1.02% Return / Month : 1.02% Return / Month : 1.02% Std Dev: 2.37%Std Dev: 2.37%Std Dev: 2.37%Std Dev: 2.37%
Random Search Portfolio and Optimum After Gradient Ascent
0.00%
0.20%
0.40%
0.60%
0.80%
1.00%
1.20%
0.00% 0.50% 1.00% 1.50% 2.00% 2.50%
Standard Deviation
Mea
n R
etu
rn
Here the Sharpe Ratio – based on the mean return of the treasury fund over the 3 year optimization period – is highest for a portfolio containing mostly the money market fund. This is because of the much lower volatility than the stock fund. Even though the returns are much higher for stocks, the risk is much greater too.

18
STD DEV - MM vs STOCK FUND
Random Search Portfolio and Optimum After Gradient Ascent
0.00%
0.20%
0.40%
0.60%
0.80%
1.00%
1.20%
0.00% 0.50% 1.00% 1.50% 2.00% 2.50%
Standard Deviation
Mea
n R
etu
rn
OPTIMUM PORTFOLIOOPTIMUM PORTFOLIOOPTIMUM PORTFOLIOOPTIMUM PORTFOLIO Return / Month : 0.18% Return / Month : 0.18% Return / Month : 0.18% Return / Month : 0.18% Std Dev: 0.12%Std Dev: 0.12%Std Dev: 0.12%Std Dev: 0.12%DFINX: 98.9%DFINX: 98.9%DFINX: 98.9%DFINX: 98.9% Return / Month : 0.17% Return / Month : 0.17% Return / Month : 0.17% Return / Month : 0.17% Std Dev: 0.13%Std Dev: 0.13%Std Dev: 0.13%Std Dev: 0.13%SWTIX: 1.1%SWTIX: 1.1%SWTIX: 1.1%SWTIX: 1.1% Return / Month : 1.02% Return / Month : 1.02% Return / Month : 1.02% Return / Month : 1.02% Std Dev: 2.37%Std Dev: 2.37%Std Dev: 2.37%Std Dev: 2.37%
The standard deviation is lowest at 1.1% stocks. So if you want the least risk you should have most of your money in the money market fund, but keep a little over 1% in the stock fund. There isn’t a lot of improvement over 100% money market, but the return is higher and the risk lower by keeping a little money in uncorrelated but riskier investments. This is not what you would think intuitively. Wouldn’t it always be best to put everything in the safest investment? The answer is no. Maybe the guy who came up with modern portfolio theory won a Nobel prize because this is so counter to common sense.
19
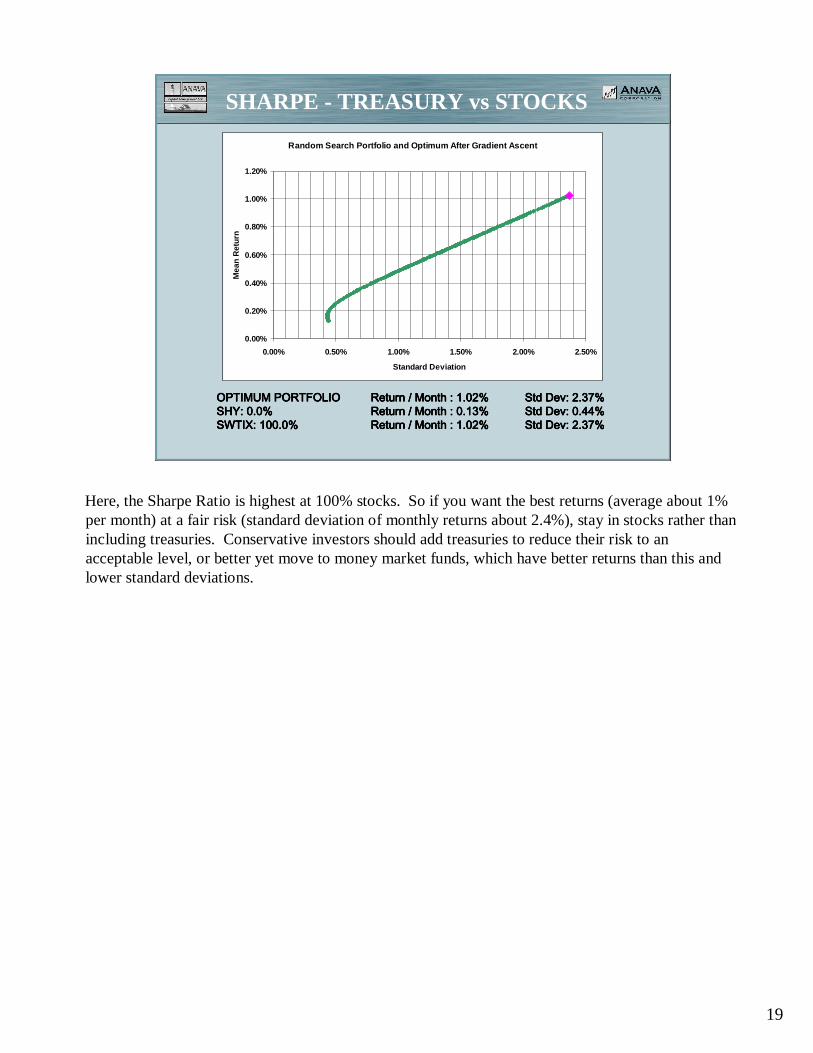
SHARPE - TREASURY vs STOCKS
OPTIMUM PORTFOLIOOPTIMUM PORTFOLIOOPTIMUM PORTFOLIOOPTIMUM PORTFOLIO Return / Month : 1.02% Return / Month : 1.02% Return / Month : 1.02% Return / Month : 1.02% Std Dev: 2.37%Std Dev: 2.37%Std Dev: 2.37%Std Dev: 2.37%SHY: 0.0%SHY: 0.0%SHY: 0.0%SHY: 0.0% Return / Month : 0.13% Return / Month : 0.13% Return / Month : 0.13% Return / Month : 0.13% Std Dev: 0.44%Std Dev: 0.44%Std Dev: 0.44%Std Dev: 0.44%SWTIX: 100.0%SWTIX: 100.0%SWTIX: 100.0%SWTIX: 100.0% Return / Month : 1.02% Return / Month : 1.02% Return / Month : 1.02% Return / Month : 1.02% Std Dev: 2.37%Std Dev: 2.37%Std Dev: 2.37%Std Dev: 2.37%
Random Search Portfolio and Optimum After Gradient Ascent
0.00%
0.20%
0.40%
0.60%
0.80%
1.00%
1.20%
0.00% 0.50% 1.00% 1.50% 2.00% 2.50%
Standard Deviation
Mea
n R
etu
rn
Here, the Sharpe Ratio is highest at 100% stocks. So if you want the best returns (average about 1% per month) at a fair risk (standard deviation of monthly returns about 2.4%), stay in stocks rather than including treasuries. Conservative investors should add treasuries to reduce their risk to an acceptable level, or better yet move to money market funds, which have better returns than this and lower standard deviations.
20
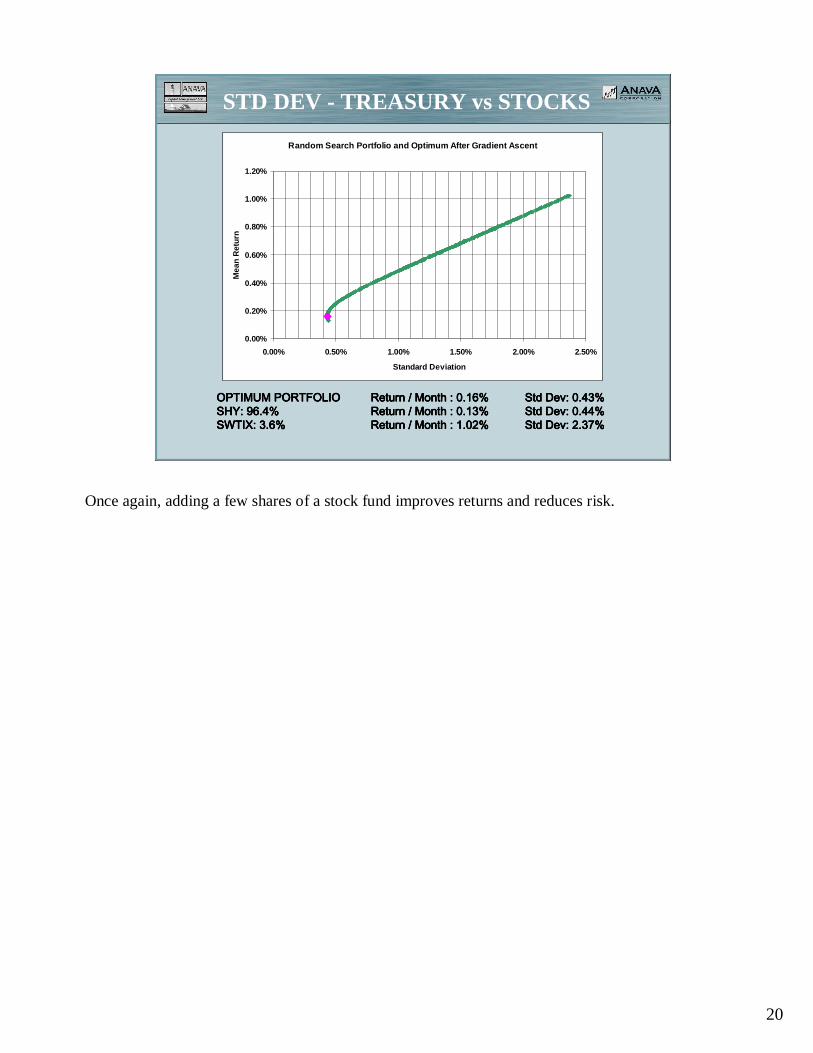
STD DEV - TREASURY vs STOCKS
OPTIMUM PORTFOLIOOPTIMUM PORTFOLIOOPTIMUM PORTFOLIOOPTIMUM PORTFOLIO Return / Month : 0.16% Return / Month : 0.16% Return / Month : 0.16% Return / Month : 0.16% Std Dev: 0.43%Std Dev: 0.43%Std Dev: 0.43%Std Dev: 0.43%SHY: 96.4%SHY: 96.4%SHY: 96.4%SHY: 96.4% Return / Month : 0.13% Return / Month : 0.13% Return / Month : 0.13% Return / Month : 0.13% Std Dev: 0.44%Std Dev: 0.44%Std Dev: 0.44%Std Dev: 0.44%SWTIX: 3.6%SWTIX: 3.6%SWTIX: 3.6%SWTIX: 3.6% Return / Month : 1.02% Return / Month : 1.02% Return / Month : 1.02% Return / Month : 1.02% Std Dev: 2.37%Std Dev: 2.37%Std Dev: 2.37%Std Dev: 2.37%
Random Search Portfolio and Optimum After Gradient Ascent
0.00%
0.20%
0.40%
0.60%
0.80%
1.00%
1.20%
0.00% 0.50% 1.00% 1.50% 2.00% 2.50%
Standard Deviation
Mea
n R
etu
rn
Once again, adding a few shares of a stock fund improves returns and reduces risk.

21
SHARPE - TREASURY vs MM
OPTIMUM PORTFOLIOOPTIMUM PORTFOLIOOPTIMUM PORTFOLIOOPTIMUM PORTFOLIO Return / Month : 0.17% Return / Month : 0.17% Return / Month : 0.17% Return / Month : 0.17% Std Dev: 0.13%Std Dev: 0.13%Std Dev: 0.13%Std Dev: 0.13%SHY: 0.0%SHY: 0.0%SHY: 0.0%SHY: 0.0% Return / Month : 0.13% Return / Month : 0.13% Return / Month : 0.13% Return / Month : 0.13% Std Dev: 0.44%Std Dev: 0.44%Std Dev: 0.44%Std Dev: 0.44%DFINX: 100.0%DFINX: 100.0%DFINX: 100.0%DFINX: 100.0% Return / Month : 0.17% Return / Month : 0.17% Return / Month : 0.17% Return / Month : 0.17% Std Dev: 0.13%Std Dev: 0.13%Std Dev: 0.13%Std Dev: 0.13%
Random Search Portfolio and Optimum After Gradient Ascent
0.00%
0.02%
0.04%
0.06%
0.08%
0.10%
0.12%
0.14%
0.16%
0.18%
0.20%
0.00% 0.05% 0.10% 0.15% 0.20% 0.25% 0.30% 0.35% 0.40% 0.45% 0.50%
Standard Deviation
Mea
n R
etu
rn
OK, you don’t trust any stocks. So let’s stick with the safest investments, treasuries and money markets. The curve may surprise you. It’s inverted from the usual one because the security with the highest return also has the lowest risk. Here we have a return of about 0.17% monthly or about 2.1% annually from the money market fund, but only 0.13% (1.52% annually) from the treasuries. The treasuries have higher risk than the money market, assuming you might need the money at any time, but lower if you keep them all to maturity. We’re using the former assumption.

22
STD DEV - TREASURY vs MM
OPTIMUM PORTFOLIOOPTIMUM PORTFOLIOOPTIMUM PORTFOLIOOPTIMUM PORTFOLIO Return / Month: 0.1705% Return / Month: 0.1705% Return / Month: 0.1705% Return / Month: 0.1705% Std Dev: 0.1269%Std Dev: 0.1269%Std Dev: 0.1269%Std Dev: 0.1269%SHY: 5.2%SHY: 5.2%SHY: 5.2%SHY: 5.2% Return / Month : 0.13% Return / Month : 0.13% Return / Month : 0.13% Return / Month : 0.13% Std Dev: 0.44%Std Dev: 0.44%Std Dev: 0.44%Std Dev: 0.44%DFINX : 94.8%DFINX : 94.8%DFINX : 94.8%DFINX : 94.8% Return / Month : 0.1730% Return / Month : 0.1730% Return / Month : 0.1730% Return / Month : 0.1730% Std Dev: 0.1291%Std Dev: 0.1291%Std Dev: 0.1291%Std Dev: 0.1291%
Random Search Portfolio and Optimum After Gradient Ascent
0.00%
0.02%
0.04%
0.06%
0.08%
0.10%
0.12%
0.14%
0.16%
0.18%
0.20%
0.00% 0.05% 0.10% 0.15% 0.20% 0.25% 0.30% 0.35% 0.40% 0.45% 0.50%
Standard Deviation
Mea
n R
etu
rn
Once again, adding a few shares of a riskier security reduces risk. However, in this case, it doesn’t increase returns. That’s because the higher risk treasury fund has lower returns, but reduces overall risk by virtue of being uncorrelated with the money market. It doesn’t make a lot of difference though. We had to go to 3 decimal places to see it.
23
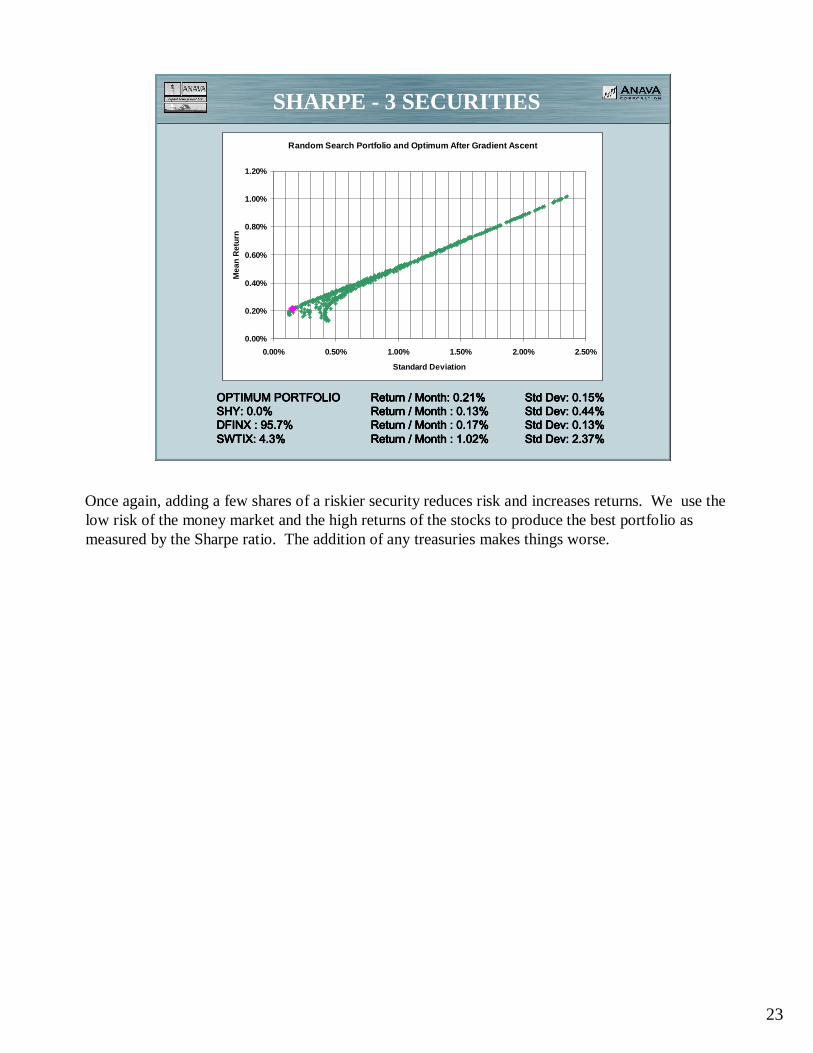
SHARPE - 3 SECURITIES
OPTIMUM PORTFOLIOOPTIMUM PORTFOLIOOPTIMUM PORTFOLIOOPTIMUM PORTFOLIO Return / Month: 0.21% Return / Month: 0.21% Return / Month: 0.21% Return / Month: 0.21% Std Dev: 0.15%Std Dev: 0.15%Std Dev: 0.15%Std Dev: 0.15%SHY: 0.0%SHY: 0.0%SHY: 0.0%SHY: 0.0% Return / Month : 0.13% Return / Month : 0.13% Return / Month : 0.13% Return / Month : 0.13% Std Dev: 0.44%Std Dev: 0.44%Std Dev: 0.44%Std Dev: 0.44%DFINX : 95.7%DFINX : 95.7%DFINX : 95.7%DFINX : 95.7% Return / Month : 0.17% Return / Month : 0.17% Return / Month : 0.17% Return / Month : 0.17% Std Dev: 0.13%Std Dev: 0.13%Std Dev: 0.13%Std Dev: 0.13%SWTIX: 4.3%SWTIX: 4.3%SWTIX: 4.3%SWTIX: 4.3% Return / Month : 1.02% Return / Month : 1.02% Return / Month : 1.02% Return / Month : 1.02% Std Dev: 2.37%Std Dev: 2.37%Std Dev: 2.37%Std Dev: 2.37%
Random Search Portfolio and Optimum After Gradient Ascent
0.00%
0.20%
0.40%
0.60%
0.80%
1.00%
1.20%
0.00% 0.50% 1.00% 1.50% 2.00% 2.50%
Standard Deviation
Mea
n R
etu
rn
Once again, adding a few shares of a riskier security reduces risk and increases returns. We use the low risk of the money market and the high returns of the stocks to produce the best portfolio as measured by the Sharpe ratio. The addition of any treasuries makes things worse.
24
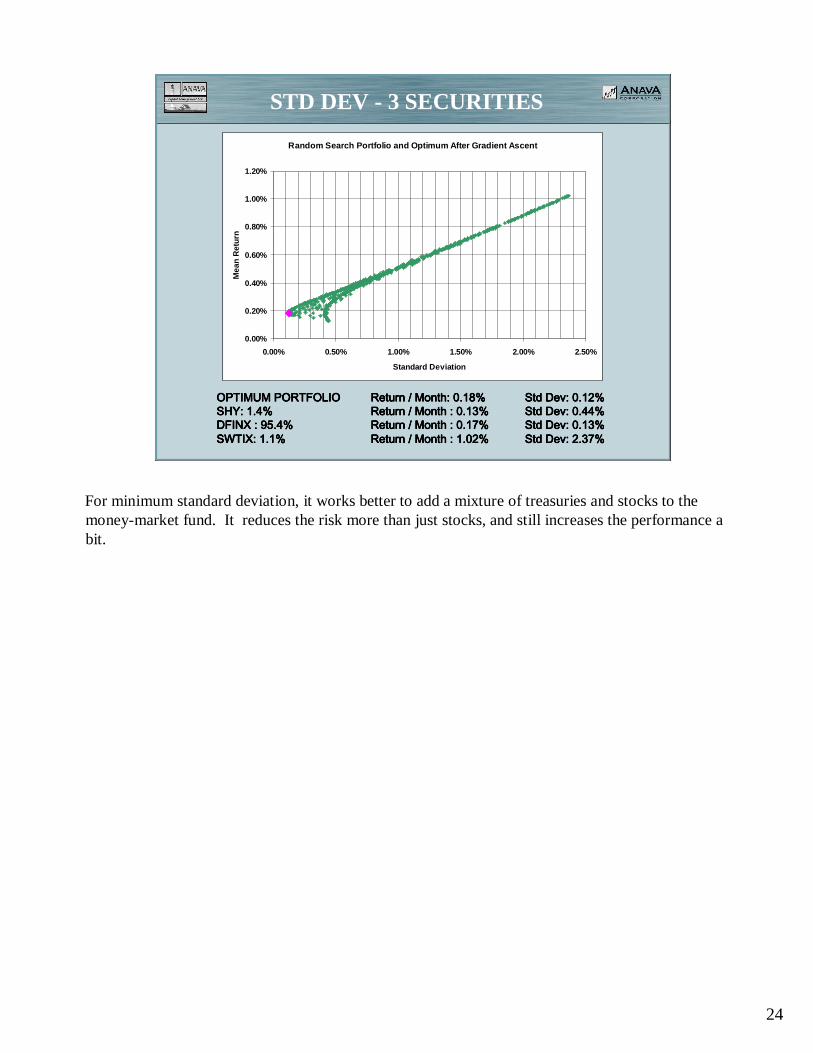
STD DEV - 3 SECURITIES
OPTIMUM PORTFOLIOOPTIMUM PORTFOLIOOPTIMUM PORTFOLIOOPTIMUM PORTFOLIO Return / Month: 0.18% Return / Month: 0.18% Return / Month: 0.18% Return / Month: 0.18% Std Dev: 0.12%Std Dev: 0.12%Std Dev: 0.12%Std Dev: 0.12%SHY: 1.4%SHY: 1.4%SHY: 1.4%SHY: 1.4% Return / Month : 0.13% Return / Month : 0.13% Return / Month : 0.13% Return / Month : 0.13% Std Dev: 0.44%Std Dev: 0.44%Std Dev: 0.44%Std Dev: 0.44%DFINX : 95.4%DFINX : 95.4%DFINX : 95.4%DFINX : 95.4% Return / Month : 0.17% Return / Month : 0.17% Return / Month : 0.17% Return / Month : 0.17% Std Dev: 0.13%Std Dev: 0.13%Std Dev: 0.13%Std Dev: 0.13%SWTIX: 1.1%SWTIX: 1.1%SWTIX: 1.1%SWTIX: 1.1% Return / Month : 1.02% Return / Month : 1.02% Return / Month : 1.02% Return / Month : 1.02% Std Dev: 2.37%Std Dev: 2.37%Std Dev: 2.37%Std Dev: 2.37%
Random Search Portfolio and Optimum After Gradient Ascent
0.00%
0.20%
0.40%
0.60%
0.80%
1.00%
1.20%
0.00% 0.50% 1.00% 1.50% 2.00% 2.50%
Standard Deviation
Mea
n R
etu
rn
For minimum standard deviation, it works better to add a mixture of treasuries and stocks to the money-market fund. It reduces the risk more than just stocks, and still increases the performance a bit.

25
FINAL HOMEWORK
Use this spreadsheet (modified if you like), or any or all of the other tools demonstrated in previous classes, to produce a portfolio that meets your requirements for investing, or to come as close as you can.
There are a lot of capabilities that have not been shown in thisintroduction. Analysis can be done by sectors, or by any other category such as market cap, US versus foreign, etc.
The purpose of all these classes is to guide you at least once through a computerized procedure that can help meet your own investing goals.
By the way – once you’re completely computerized it’s easy to make sell decisions. You sell when the computer says to.
Revisions of the spreadsheet will be posted from time-to-time over the next couple of months, as well as a more comprehensive manual. Check the website, or watch your email. They will be announce via the class mailing list.