Embed Size (px)
Citation preview

Spreadsheet Skills for all Types of Planning
1
06_Y551_Ch01.indd 306_Y551_Ch01.indd 3 11/19/2008 12:33:37 PM11/19/2008 12:33:37 PM

Financial Planning Using Excel
5
The most popularly claimed pitfall of planning concerns com-mitment. The assumption is that with the support and partici-pation of the top management, all will be well. But the questions must be asked: well with what and well for whom? For planners? To be sure. But for the organisation?
– Henry Mintzberg, The Rise and Fall of Strategic Planning , 1994.
Introduction
Whether a spreadsheet is being developed as a forecasting plan, a profit and loss account or a marketing plan, it is essential that due care and attention be given to the design and structure of the plan. Establishing some rules as to how all the spreadsheets in a department or organisation are developed enables different people to look at different plans and feel familiar with the layout, style, reports, charts, etc. This is similar to the way users feel familiar with software applications that have a common interface such as those in the Microsoft Office suite of products.
The objectives of good design in spreadsheet terms are exactly the same as those required for any other software development:
● To ensure that the spreadsheet is as error free as possible. ● To ensure that the spreadsheet can be used without much
training or control. ● To minimise the work required to enhance or change the
spreadsheet.
If care is taken to ensure sound structure and good design, a spread-sheet will be straightforward to develop, easy to read, simple to use, not difficult to change and will produce the required results.
The plan developed over a number of developmental stages in this chapter illustrates a variety of aspects of the principles of spreadsheet design and development. The series begins with a plan that has had little or no thought put into its design and layout, and as the chapter proceeds ways of improving and enhancing the plan are identified and explained. These plans can be found on the CD accompanying the book under the names STYLE 01 through STYLE 10 .
06_Y551_Ch01.indd 506_Y551_Ch01.indd 5 11/19/2008 12:33:37 PM11/19/2008 12:33:37 PM

Fina
ncia
l Pla
nnin
g U
sing
Exc
el
6
Spreadsheet 1: Getting started
The spreadsheet in Figure 1.1 is a simple profit projection that may be of use to the author, but it is unlikely to be helpful to anyone else. This is clearly a quick one-off plan which has been prepared with very little care and which might not even be saved on the disk.
Figure 1.1 Simple profit projection
STYLE01.XLS
Problems with this spreadsheet
The immediate obvious problems with this spreadsheet are that it has no title, it is not clear what the columns represent (i.e. they are different periods or perhaps different products) and the author is unknown.
With regard to the data itself, the figures are hard to read as there are varying numbers of decimal places. Whilst perhaps there has been a growth in sales and price, the percentage has not been indicated. The costs line could also be misleading as no indica-tion of where the costs have been derived is supplied.
Positive aspects of this spreadsheet
If the author of the spreadsheet required a quick profit estimation based on known data and growth rates for sales units, prices and costs, then the spreadsheet would have supplied that information quickly and in a more concise form than would have been achiev-able using a calculator and recording the results on a paper.
Spreadsheet 2: Ownership and version
In Figure 1.2 the three major shortfalls of the first spreadsheet have been remedied. The plan has also been given a title and author details have been included. It is important that every business
06_Y551_Ch01.indd 606_Y551_Ch01.indd 6 11/19/2008 12:33:37 PM11/19/2008 12:33:37 PM

Financial Planning Using Excel
7
plan has a clear owner who is responsible for overseeing the accu-racy and maintenance of the system. A name plus some form of contact details should always be included.
Problems with this spreadsheet
The construction of the data and results is still unclear and the lack of formatting makes the figures hard to read. The costs remain grouped together.
Positive aspects of this spreadsheet
In addition to the owner details having been added to the plan, the date when the plan was written is a useful feature. The date becomes particularly important when the question of spreadsheet versions arise. Note that the date has been entered here as text. If a DATE function had been used, it would be continually updated each time the file is retrieved, whereas here it is the date of the last update that is required. The ruling lines above and below spe-cific sections of the spreadsheet are also quite helpful. This can be quickly achieved using the automatic formatting features. These are accessed via the FORMAT AUTOFORMAT command (HOME STYLES).
Spreadsheet 3: Formatting
In Figure 1.3 the data for the four quarters is totalled and reported as an annual figure. The values in the plan have also been formatted
Figure 1.2 Incorporating some annotation
STYLE02.XLS
06_Y551_Ch01.indd 706_Y551_Ch01.indd 7 11/19/2008 12:33:38 PM11/19/2008 12:33:38 PM

Fina
ncia
l Pla
nnin
g U
sing
Exc
el
8
with the majority of figures being formatted to zero decimal places and the price line to two decimal places.
One of the automatic formatting options has been selected to shade and outline the plan.
Problems with this spreadsheet
By looking at the plan in Figure 1.3 it can be seen that the sales and the costs both increase over time. However, the rate of increase of the sales and the costs is not clear because the sales growth factor and the increase in costs have been incorporated into the formulae as absolute references.
The inclusion of absolute values in formulae is not recommended and can lead to GIGO*. To change the sales growth factor in Figure 1.3 two processes are required. First, cell C 7 is accessed, the growth factor is changed and the ENTER key is pressed. This has changed the formula in this one cell, but only once the for-mula has been extrapolated across into cells D 7 and E 7 is the amendment complete. It is not difficult to see that there is room for error here in a number of different ways.
Positive aspects of this spreadsheet
Having a current date and time indicator displayed on the spreadsheet ensures that a hard copy report will reflect the date,
Figure 1.3 Formatting the plan
RISK OF GIGO
STYLE03.XLS
*GIGO is computer acronym meaning Garbage In Garbage Out.
06_Y551_Ch01.indd 806_Y551_Ch01.indd 8 11/19/2008 12:33:40 PM11/19/2008 12:33:40 PM

Financial Planning Using Excel
9
and perhaps more importantly the time it was printed. This is achieved through the NOW() function, which can be formatted with a range of different display options. Because it is likely that a spreadsheet will be recalculated, even if it is set to manual cal-culation, before printing, the date and time will always be up to date. It is of course possible to include the date and time in head-ers and footers, but during the development phase of a system the page layout is of less relevant than printing the section being worked on and so thought should be given to the positioning of the NOW() function.
The cells in this plan have now been formatted, which makes the data easier to read. When formatting a spreadsheet it is important to consider the entire plan and not just the cells that are currently being worked on. The entire spreadsheet should be formatted to the degree of accuracy the majority of the plan is to be. The cells that need to be different, such as percentages, can be reformatted when necessary. This is quickly achieved by right clicking on the top left corner of the spreadsheet at the intersection between the column letters and row numbers and then by selecting format cells option. Whatever formatting is now applied will affect the entire worksheet.
It is important to understand that formatting cells only changes the display and does not affect the results of calculations that are still performed to the full degree of accuracy, which is usually 16 significant decimal places. This is why a cell containing the sum of a range of cells might display an answer that does not agree with the result of visually adding the values in the range.
The ROUND function is the only safe way to ensure that the results of a calculation are actually rounded to a given number of dec-imal places. Figure 1.4 shows two tables representing the same extract from a profit and loss account. In both cases all the cells have been formatted to zero decimal places, but in Table B the ROUND function has been incorporated in the formulae for cells F 15 through F 19 .
The formula entered into cell F 15, which can then be copied for the other line items is:
�ROUND SUM B E( ( 15 15 0: ), )
TECHNIQUE
TIP!
06_Y551_Ch01.indd 906_Y551_Ch01.indd 9 11/19/2008 12:33:42 PM11/19/2008 12:33:42 PM

Fina
ncia
l Pla
nnin
g U
sing
Exc
el
10 The effect of the ROUND function can be seen in cell F 20. By vis-ually adding up the numbers in the range F 15 through F 19 the result is 78,111, whereas the formatting of these cells without the use of the ROUND function in Table A returns a value of 78,112 in cell F 20. Having applied the ROUND function to a cell, any future reference made to that cell will use the rounded value.
Excel does offer an alternative to the ROUND function in the Precision as displayed option within TOOLS OPTIONS C ALCULATION ( EXCEL OPTIONS : ADVANCED : WHEN CALCULATING THIS WORKBOOK : SET PRECISION AS DISPLAYED). This command assumes that calculations will be performed to the level of accuracy currently displayed. The danger of using this command is that when data is changed or added to the spreadsheet the command is no longer valid and it is then necessary to repeat the command to update the spreadsheet.
Spreadsheet 4: Documentation
Spreadsheet developers are notoriously bad at supplying docu-mentation and other supporting information about the plan.
Figure 1.4 Difference between rounding and formatting cells
RISK OF GIGO
06_Y551_Ch01.indd 1006_Y551_Ch01.indd 10 11/19/2008 12:33:42 PM11/19/2008 12:33:42 PM

Financial Planning Using Excel
11
There are a number of features offered by Excel to assist in the documenting of plans including the INSERT COMMENT command (R EVIEW : A DD COMMENT ). Figure 1.5 shows a comment being entered onto a plan – notice how the user name of the comment author is included. This is useful when a team of people are working on a system. The presence of a comment is indicated by a small red triangle on the cell. To read the comment move the cursor over the cell and it will automatically be displayed. A word of caution concerning the use of comment boxes – they take up a consider-able amount of space and if used widely they can make a notice-able difference to the size of a file. To clear all the comments use the EDIT CLEAR COMMENTS ( HOME: CLEAR COMMENTS ) command. A quick way to access the comment commands is to right click on a cell and select INSERT COMMENT .
TECHNIQUE
TIP!
Figure 1.5 Inserting comments
STYLE04.XLS
The provision of a hard copy report showing the logic used to cre-ate a plan is also helpful as this is the ultimate reference point if a formula has been overwritten and needs to be reconstructed.
In Excel there is a shortcut key to display the formulas which is ctrl � � (accent grave). Alternatively, this can be achieved through the TOOLS OPTIONS VIEW command and then check the Formulas box ( EXCEL OPTIONS : ADVANCED : DISPLAY OPTIONS FOR THIS SPREADSHEET : SHOW FORMULAS IN CELLS INSTEAD OF THEIR CALCULATED RESULTS).
In addition to providing documentation for a spreadsheet system, looking at the contents of the cells as opposed to the results can
06_Y551_Ch01.indd 1106_Y551_Ch01.indd 11 11/19/2008 12:33:43 PM11/19/2008 12:33:43 PM

Fina
ncia
l Pla
nnin
g U
sing
Exc
el
12
also be a helpful auditing tool. For example, Figure 1.6 highlights the fact that there are still values embedded in formulae, which is not good practice and is addressed in the next version of the plan.
A third form of documentation, which can be particularly use-ful for large systems is the ‘ sentence at the end of the row ’ tech-nique. Requiring less file space than comment boxes, and always on view, it can be useful to have a brief description of the activity taking place in each row of a plan.
Spreadsheet 5: Minimising absolute values
One of the reasons that spreadsheets have become such an integral part of the way we do business is the fact that they facilitate quick, easy and inexpensive what-if analysis. What-if analysis may be defined as the process of investigating the effect of changes to assumptions on the objective function of a business plan.
Performing what-if analysis on the opening sales assumption or the opening price assumption is quite straightforward, which involves placing the cursor on the figure and entering the new value. On pressing Enter the spreadsheet is re-evaluated and all cells that refer to the changed values, either directly or indirectly, are updated.
The success of performing even the simplest what-if analysis is dependent on the spreadsheet having been developed with the correct series of relationships. For example, changing the opening sales value in Figure 1.7 would automatically cause the other quar-ter sales values to recalculate, as well as the revenue, costs and
Figure 1.6 Report showing formulae
06_Y551_Ch01.indd 1206_Y551_Ch01.indd 12 11/19/2008 12:33:45 PM11/19/2008 12:33:45 PM

Financial Planning Using Excel
13
profit lines, because they relate, through the cell references in the formulae, either directly or indirectly to the sales value in cell B 5.
However, as already mentioned this plan incorporates absolute values in the formulae for sales and costs growth. Furthermore, the price is a fixed value and has been entered once into cell B 6 and the value has then been copied into the other periods. This presents problems when what-if analysis is required on any of these factors.
Problems with this spreadsheet
Because no growth in the price is required, the opening value of 12.55 has been copied for the four quarters. Whilst this is fine wherever the price of 12.55 is required, it presents a problem if the price needs to be changed. With this spreadsheet it would be necessary to overwrite the price in the first quarter and then copy the new value for the remaining three quarters. The same applies if the sales growth or the cost factors need to be changed.
Spreadsheet 6: Separating growth and cost factors
To prevent the problems in Spreadsheet 5 from arising, a different approach to the development of the plan needs to be taken.
In the first instance, all growth and cost factors should be repre-sented in a separate area of the spreadsheet – even on a different
Figure 1.7 Absolute values restricting what-if analysis
STYLE05.XLS
06_Y551_Ch01.indd 1306_Y551_Ch01.indd 13 11/19/2008 12:33:46 PM11/19/2008 12:33:46 PM

Fina
ncia
l Pla
nnin
g U
sing
Exc
el
14
sheet altogether in the case of a large system with a lot of input. The factors can then be referenced from within the plan as and when they are required. Figure 1.8 shows the adapted layout for this plan after extracting the sales growth and cost factors.
Figure 1.8 Using cell references for non-changing values
Figure 1.9 Amended formulae to take account of extracted growth and cost factors
STYLE06.XLS
Having the growth and cost factors in separate cells means that the formulae need to be changed to pick up this information. Figure 1.9 shows the amended formulae for this plan.
Note that the references to cells D 15, D 16 and D 17 are fixed refer-ences. This is achieved by placing the $ symbol before the column
06_Y551_Ch01.indd 1406_Y551_Ch01.indd 14 11/19/2008 12:33:47 PM11/19/2008 12:33:47 PM

Financial Planning Using Excel
15
letter and row number (i.e. $ D $15) and it means that when the for-mula is copied the reference to cell D 15 remains fixed. A shortcut key to add the $ symbols to a cell reference is F 4.
In this plan an option in the growth factors has been included for the price, despite the fact that in this plan the price does not change. It is important to always think ahead when developing any plan and although the price does not currently change, it might be necessary to include a percentage increase in the future. Having the facility for change built-in to the plan could save time later, and for the time being the growth factor is simply set to zero.
Removing the growth and cost factors from the main body of a business plan is the first step in developing a data input form which will ultimately separate all the input data from the actual logic of the spreadsheet. This separation of the data allows the logic cells to be protected from accidental damage. This is dis-cussed further in the ‘ Template ’ section of this chapter.
Spreadsheet 7: Optimising layout
The amount of detail supplied in the plan so far is clearly insuf-ficient for any real decision-making process.
More detail of the firm’s cost structure would constitute an obvi-ous improvement and Figure 1.10 shows how this might be incorporated. This sample plan is obviously small, and even the expanded plan fits onto a screen. But wherever possible do try and divide plans into sections that fit comfortably in the screen area, and indicate if there is more information to follow by writ-ing in a prompt such as press page down for cost analysis.
Some people might find the spreadsheet in Figure 1.10 disjointed with revenue in one section and the costs in another. Although good spreadsheet design is essential, personal preference will always have a role to play in the finished result. The way in which a system is used and for what purpose will also play an important role in deciding which variables are grouped together. For example, it is not difficult to restructure this plan as shown in Figure 1.11 .
TECHNIQUE
TIP!
06_Y551_Ch01.indd 1506_Y551_Ch01.indd 15 11/19/2008 12:33:52 PM11/19/2008 12:33:52 PM

Fina
ncia
l Pla
nnin
g U
sing
Exc
el
16 Figure 1.10 Expanded cost structure
Figure 1.11 Alternative approach for expanding costs
STYLE07A.XLS
STYLE07B.XLS
06_Y551_Ch01.indd 1606_Y551_Ch01.indd 16 11/19/2008 12:33:52 PM11/19/2008 12:33:52 PM

Financial Planning Using Excel
17
Spreadsheet 8: Arithmetic cross-checks
As mentioned earlier spreadsheet users are not inherently good at auditing plans as thoroughly as perhaps they should, and there-fore an important aspect of spreadsheet design is to build into the system checks on the arithmetical accuracy that will raise the alarm if things begin to go wrong. This might include validat-ing input data through the use of an IF function, or performing a cross-check on a calculation. In the file STYLE 08 the cross check control box has been placed on a separate sheet to the main plan.
When creating calculation checks the first step is to select a number of key items from the model, whose result can be cal-culated using a different arithmetic reference. For example, in Figure 1.12 , the year-end gross profit has been calculated by referencing the individual total values in column F and then by totalling the values in the gross profit row. An IF function is then applied to compare the two results and if they are not the same the word ‘ error ’ is displayed in cell D 8.
Figure 1.12 Cross-check control box
STYLE08.XLS
TECHNIQUE
TIP!
The formulae required in cells D 6 and D 7, which calculate the year-end gross profit from the plan illustrated in Figure 1.11 are:
For the vertical total,
� � �‘ ’ ‘ ’ ‘ ’P&L ACCOUNT !F P&L ACCOUNT !F P&L ACCOUNT !F10 17 19
and for the horizontal total,
�SUM P&L ACCOUNT B E( ! 23: 23)‘ ’
Note that the worksheet containing the main plan has been named ‘ P&L ACCOUNT ’ and so this is referenced in the formula in cells D 6 and D 7 of the control box.
To name a worksheet double click on the sheet tab at the bottom of the screen and enter a name.
06_Y551_Ch01.indd 1706_Y551_Ch01.indd 17 11/19/2008 12:33:53 PM11/19/2008 12:33:53 PM

Fina
ncia
l Pla
nnin
g U
sing
Exc
el
18
The formula in cell D 8 is an IF function that compares the two cells as follows:
�IF(D6��D7,“ERROR”,“OK”)
A macro could also be created that alerts the user, should the arithmetic not balance, probably by a beep and going to a suitable message screen.
Spreadsheet 9: Charts
It is useful to support the information supplied in business plans with charts. In the profit and loss account used in this chapter, various charts might be useful, for example, to show the relative impact of price and sales volume figures. Although charts can be placed on the same worksheet as the plan, it is usually pref-erable to keep graphs on separate chart sheets. The exception might be if either it is appropriate to view changes on a chart at the same time the data in the plan is changed, or if a spreadsheet is to be copied into a management report being created in Word. Figure 1.13 is an example of the type of chart that might be pro-duced from the plan used in this chapter. This chart has been cre-ated using the data in Figure 1.11 .
0
5000
10000
15000
20000
25000
30000
35000
Val
ue
1 2 3 4Quarters
RevenueTotal costsGross profit /loss
Figure 1.13 Three-dimensional graph
STYLE09.XLS
Spreadsheet 10: Multiple sheets
The plan used in this chapter has been a simple quarterly plan, but in many cases business plans will be larger and more com-plex. Figure 1.14 is an extract from a five-year quarterly plan.
06_Y551_Ch01.indd 1806_Y551_Ch01.indd 18 11/19/2008 12:33:53 PM11/19/2008 12:33:53 PM

Financial Planning Using Excel
19
The report of each year has been formatted with a different col-our font. This is a useful technique when working with large models because it enables the user to quickly know which part of the plan is being viewed or worked on, without having to scroll around the spreadsheet to see the titles. This colour coding can then be carried over to summary reports and other reports per-taining to the different parts of the plan.
From a design point of view it is preferable to place different reports associated with a plan on separate worksheets. The report in Figure 1.15 , which has been placed on a separate sheet called Summary is created by referencing the cells from the yearly totals in the main plan.
Figure 1.14 Five-year extended plan
Figure 1.15 Summary report
TECHNIQUE
TIP!
STYLE10.XLS
To assign a name to a worksheet simply double click on the sheet reference at the bottom of the screen and type in the required name.
Templates
A business plan that requires time and effort to design and imple-ment is likely to be in regular use for some time. In addition, the
06_Y551_Ch01.indd 1906_Y551_Ch01.indd 19 11/19/2008 12:33:53 PM11/19/2008 12:33:53 PM

Fina
ncia
l Pla
nnin
g U
sing
Exc
el
20
data in the plan will almost certainly change, either as situations within the business change, or on a periodic basis. In such circum-stances it is advisable to convert the developed plan into a tem-plate, into which different data can be entered whenever necessary.
A template is a plan that contains the logic required, that is the formulae, but from which the data has been removed. When new data is entered the formulae will be calculated. Figure 1.16 shows the simplest approach to creating a template. Taking the one-year quarterly plan used in this chapter the input data and growth fac-tors have been removed and these cells have been highlighted by shading them. The file can be found on the CD accompanying the book under the name TEMPLATE 1 .
Figure 1.16 Plan converted to a template
TEMPLATE1.XLS
When the input cells are set to zero all other cells that are directly or indirectly related to those cells should also display zero. The only exception to this is if there are division formulae in which case a division by zero error will be displayed. The act of remov-ing the data is in itself a useful auditing tool, because if values are found in any cells this indicates that there is an error in the way that the plan was developed which can be rectified.
06_Y551_Ch01.indd 2006_Y551_Ch01.indd 20 11/19/2008 12:33:55 PM11/19/2008 12:33:55 PM
Financial Planning Using Excel
21
When the template is complete the spreadsheet should be pro-tected, specifying only the cells into which data can be entered as unprotected cells. This is a two-step process. First, the cells into which data can be entered are unprotected using the FORMAT CELLS PROTECTION command and removing the tick on the Locked box (HOME : FORMAT : LOCK CELL) . The second step is to then enable protection by selecting TOOLS PROTECTION PROTECT SHEET (HOME : FORMAT : PROTECT SHEET) .
It is also important to save the file now as a Template file as opposed to a Worksheet file. This is achieved by selecting FILE SAVE AS Template ( * .XLT) in the File Type box ( SAVE AS). The location of the template file defaults to the directory where other Microsoft Office template files are located. To use the template, FILE NEW ( NEW) is selected, which accesses the Template direc-tory and when a file is selected a copy of it is opened, leaving the original template unchanged on the disk.
Data input forms
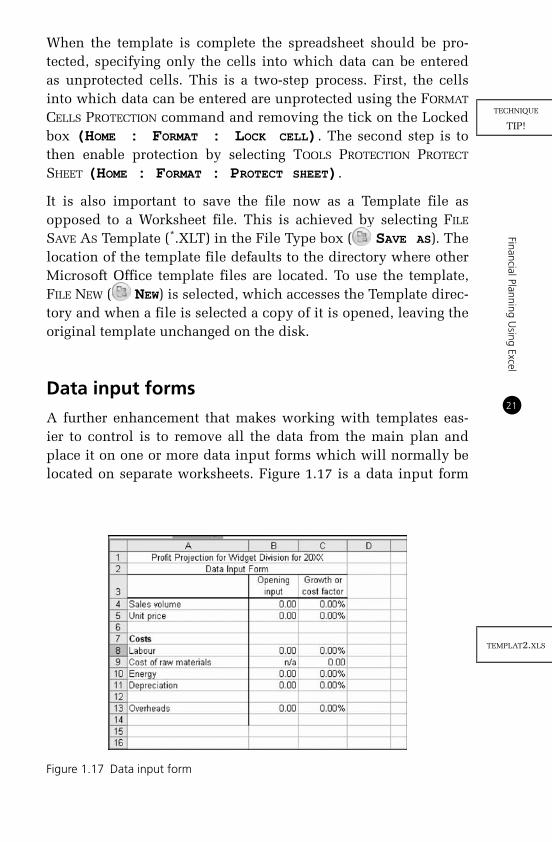
A further enhancement that makes working with templates eas-ier to control is to remove all the data from the main plan and place it on one or more data input forms which will normally be located on separate worksheets. Figure 1.17 is a data input form
Figure 1.17 Data input form
TEMPLAT2.XLS
TECHNIQUE
TIP!
06_Y551_Ch01.indd 2106_Y551_Ch01.indd 21 11/19/2008 12:33:56 PM11/19/2008 12:33:56 PM

Fina
ncia
l Pla
nnin
g U
sing
Exc
el
22
for the quarterly plan, and Figure 1.18 shows the amended formu-lae in the plan, which picks up the data from the input form.
Figure 1.18 Amended formulae to reference data input form
There are many benefits to be derived from using data input forms including the fact that the data can be checked more eas-ily. Sometimes it might be possible to design an input form that is compatible with a forecasting or accounting system so that the data can be electronically picked up from the other system without having to type it in again. Even if this is not possible, the order of items in the data input form does not have to be the same as the order in which they are referenced in the logic, which means that the data input form can be created to be as compatible with the source of the input data as possible. Furthermore, the worksheet containing the logic for the plan can be protected, and if necessary made read-only, in order to maintain the integrity of the system.
It is not a trivial task to change existing systems to be templates with data input forms, and it will also take a little longer to develop a new system in this way, as opposed to incorporating the data with the logic. However, the ease of data input and ongo-ing maintenance should make the additional effort worthwhile.
Summary
This chapter has considered some of the principal design ele-ments that need to be considered when embarking on the creation
06_Y551_Ch01.indd 2206_Y551_Ch01.indd 22 11/19/2008 12:33:56 PM11/19/2008 12:33:56 PM

Financial Planning Using Excel
23
of any business model or plan, be it a financial statement, a budg-etary control system, a marketing model or a forecasting plan. A small plan has been used for demonstration purposes, but many of the techniques illustrated are essential when working with larger plans. Taking time to consider the layout and design of a system before embarking on its development has been proven by many users to pay considerable dividends in the long term. In addition, it is worth talking with colleagues who might find a plan useful before starting development to see whether some additional lines should be incorporated, as it is always more difficult to add to a spreadsheet later.
06_Y551_Ch01.indd 2306_Y551_Ch01.indd 23 11/19/2008 12:33:57 PM11/19/2008 12:33:57 PM

06_Y551_Ch01.indd 2406_Y551_Ch01.indd 24 11/19/2008 12:33:57 PM11/19/2008 12:33:57 PM