Embed Size (px)
Citation preview

Spreadsheets and Workforce Management – An Odd Couple
A Verint Systems White Paper
by Bill Durr, Principal Global Solutions Consultant

Table of Contents
The Basic Tasks of Contact Center Management . . . . . . . . . . . . . . . . . . . . . . . . . . . . . . . . . . . . . . . .2
Forecasting . . . . . . . . . . . . . . . . . . . . . . . . . . . . . . . . . . . . . . . . . . . . . . . . . . . . . . . . . . . . . . . . . . . . . .2
Scheduling . . . . . . . . . . . . . . . . . . . . . . . . . . . . . . . . . . . . . . . . . . . . . . . . . . . . . . . . . . . . . . . . . . . . . .3
Spreadsheets in Forecasting and Scheduling . . . . . . . . . . . . . . . . . . . . . . . . . . . . . . . . . . . . . . . . . . .9
Problems with Manual and Spreadsheet Approaches . . . . . . . . . . . . . . . . . . . . . . . . . . . . . . . . . . . .10
Special Problems in Small and Medium Centers . . . . . . . . . . . . . . . . . . . . . . . . . . . . . . . . . . . . . . . .11
Conclusion . . . . . . . . . . . . . . . . . . . . . . . . . . . . . . . . . . . . . . . . . . . . . . . . . . . . . . . . . . . . . . . . . . . . .16
Unauthorized use, duplication, or modification of this document in whole or in part without the written consent of Verint Systems
Inc. is strictly prohibited.
By providing this document, Verint Systems Inc. is not making any representations regarding the correctness or completeness
of its contents and reserves the right to alter this document at any time without notice.
All marks referenced herein with the ® or TM symbol are registered trademarks or trademarks of Verint Systems Inc. or its
subsidiaries. All rights reserved. All other marks are trademarks of their respective owners.
© 2008 Verint Systems Inc. All Rights Reserved Worldwide.
WASG0308001U

PrefaceThis paper discusses workforce management from the perspective of the small and medium contact center.
The paper reviews the manual forecasting and scheduling process, identifies execution-oriented problems
associated with using spreadsheets for this process, and explains how a robust workforce management (WFM)
solution can be particularly helpful to small and medium centers.
About Verint Witness Actionable SolutionsVerint® Witness Actionable Solutions™ was formed as a result of the company’s successful combination with workforce optimization provider Witness Systems. Verint Witness Actionable Solutions enables organizations to capture and analyze customer interactions, improve workforce performance and optimizeservice processes in contact center, branch, and back-office operations. With the industry’s broadest portfolio of innovative solutions for customer service analytics, workforce optimization, quality monitoring/full-time recording, workforce management, eLearning, performance management, and customer surveys,Verint Witness Actionable Solutions helps companies uncover business trends, discover the root cause of employee and customer behavior, and power the right decisions to help ensure service excellence andachieve continuous performance improvement across every aspect of customer operations.
Verint. Powering Actionable Intelligence.®Verint Systems Inc. is a leading provider of actionable intelligence™ solutions for an optimized enterprise and a safer world. More than 10,000 organizations in over 150 countries rely on Verint solutions to perform moreeffectively, build competitive advantage, and enhance the security of people, facilities, and infrastructure.
1

2
The Basic Tasks of Contact Center ManagementIn the seminal book Call Center Management on Fast Forward*, Brad Cleveland and Julia Mayben defineincoming contact center management as:
“The art of having the right number of skilled people and supporting resources in place at the right times to handle an accurately forecasted workload, at service level and with quality.”
Although they use just 31 words to define the task, don’t let the brevity mislead you. Successfully managing a contact center can be a difficult task because of the internal and external variables, many of which are beyond your control. Mix in the random nature of call arrivals and the ordinary variability of human performance, and the magnitude of the task is fully realized.
What Cleveland and Mayben defined is known as workforce management, or more simply, as forecasting and scheduling. And ironically, smaller and medium-sized (SME) centers are generally harder to manage than larger centers. Why? Let’s take a closer look.
Forecasting Workforce management is principally concerned with forecasting the workload and creating a set of schedulesfor your agents. The objective is to handle the workload at your service-level target while using the fewestnumber of paid agent labor hours. Overstaff the center, and you spend money needlessly, a perilous practicein today’s economic climate. Understaff the center and you miss revenue opportunities or create customerdissatisfaction that can lead to reduced revenues. Creating a set of schedules that matches the expectedworkload throughout the day, every day, is difficult. It’s like flipping a coin and having it land on its edge.
As difficult as that may sound, over the years, contact center managers have developed a well-defined conceptual approach to creating reliable forecasts and generating efficient schedules. The steps are reviewedhere in brief.
Assembling Historical DataForecasting the future workload in a contact center is dependent upon the past operational experience. The more relevant historical information you have, the better. Clearly, if your center has gone through some major changes in mission, added responsibilities, or even merged or consolidated previously separateoperations, then historical data may not be relevant or as useful. That aside, it’s useful to collect as much historical data as possible. Two or three years of data are ideal. The reason so much data is required has to do with uncovering trends and patterns in call demand.
Using some mathematical tools including averaging, time series analysis, data de-trending, and weighted averaging, the historical data can be manipulated so as to discover time of day, day of week, day of month,monthly, and seasonal patterns that can affect call demand in your center.
* Call Center Management on Fast Forward: Succeeding in Today's Dynamic Inbound Environment, Brad Cleveland and Julia Mayben, Call Center Press, Anapolis, MD, 1997.

3
Creating Tiered ForecastsMost manual approaches to forecasting start with creating useful monthly forecasts. From this base forecast,we can use the insights provided by day-of-month, day-of-week, and time-of-day analysis to eventually develop either hourly or half-hourly call demand. It is important to forecast the number of calls expected as well as the average handle time. Just as call demand fluctuates over the course of a day or week, so does the average handle time. Often, the handle time lengthens, reflecting to some degree the fatigue of the agents as the day progresses. Having the number of calls and the average handle time enables us to calculate the workload. Number of calls multiplied by the average handle time equals the workload that needs to be met.
Forecasting ArtistryForecasting is part science and part artistry. Ideally, the forecaster has insight into plans and activities that will influence the future workload. Maybe marketing has a special promotion in mind for next month.Perhaps a new self-service initiative is about to come on line that will reduce call volume. Historical data alone can’t provide these kinds of insights. So, after the math is finished, the artistry begins. It’s important to always save a copy of the original forecast alongside the altered forecast for feedback reasons. Forecasterscan sharpen their artistry over time by reflecting on where their forecast alterations were correct and wherethey went awry. With a forecast firmly in place, the process moves to a critical step.
SchedulingCalculating Resource RequirementsWe learned earlier that the workload is the product of call volume times average handle time. It’s important to remember that average handle time is comprised of two components: average talk time and after-call work time. Average talk time is straightforward — it’s the time the agent spends talking with the customer(including time when the customer is placed on hold). After-call work time represents the time the agentspends doing work directly associated with the conversation just completed. This may entail the completionof data entry fields, coding the transaction, or performing follow-up activities.
With the workload figure in hand, we can begin the task of discovering how many resources we will need to handle the work at our service-level goal. At face value, it would seem logical to determine the number of agents needed in a contact center by dividing the number of calls expected to arrive by the average handle time of the calls. For example, if 100 calls arrive in 30 minutes, and each call takes on average three minutes to service, then each agent can take ten calls per hour. Therefore, it appears that ten agentsand ten telephone lines should be able to service the anticipated call load.
The Impact of RandomnessThe flaw in this logic is that transactions do not arrive in an orderly fashion, with one right after the other. Likecustomers at a bank, telephone calls arrive at random times, independent of each other. The average arrivalrate in the example above is one call every 18 seconds, but the actual arrival time is distributed randomly.

4
Some calls will arrive at the same time, others will arrive while the first set of calls are still being served, and during some intervals, no calls will arrive at all. The fact is there are an almost infinite number of ways for 100 calls to arrive in thirty minutes. The figure below depicts just one random call arrival chart:
Figure 1: 100 Call Arrivals in 30 Minutes Viewed at 1-Minute Granularity
The microbursts depicted in this time line are not exaggerated and are actually quite representative of real-world experience. If we staff our center with ten agents, there will be times during the half hour whenmany agents are idle, and other times when many callers linger in queue. Of course, this creates short-termhavoc with contact center performance measurements. Clearly, we should schedule some number of agents beyond ten. How many more involves the interaction between service level and occupancy at givenstaffing levels.
For a given workload, the faster you want to answer the calls, the more agents you need. But it’s not a linearrelationship. Although the mathematical relationship among workload, service level, and required staff is quitecomplex, it has been studied for decades and is well understood.
Nearly a century ago, Agner Erlang, a Danish mathematician, created a set of statistical tables that help solvethis problem. Specifically, the Erlang C tables consider transaction volume, average handle time, and desiredservice level to determine the number of staffed agent positions required. The solution works for one queuebeing served by one agent team. Simple computer programs are available for little to no cost that automatethe calculation, and there is even an Erlang function that can be added into spreadsheet programs.

5
Using an Erlang calculator for 100 three-minute calls in 30 minutes with a service level of 80 percent in 20 seconds produces the following data array:
Average Speed Service Average Delay for Staff of Answer Level Occupancy Delayed Callers
11 122.8 sec. 38.9% 90.9% 180 sec.
12 40.5 sec. 64.0% 83.3% 90 sec.
13 17.1 sec. 79.6% 76.9% 60 sec.
14 7.8 sec. 88.8% 71.4% 45 sec.
15 3.7 sec. 94.1% 66.6% 36 sec.
16 1.7 sec. 97.0% 62.5% 30 sec.
17 .8 sec. 98.5% 58.8% 25 sec.
18 .4 sec. 99.4% 55.5% 22 sec.
How many staffed positions we require actually depends on other considerations, such as whether these calls have revenue attached, how much value each transaction carries, and what the total cost is for a staffedposition. Putting those considerations aside, we might choose to staff either 13 or 14 positions, dependingupon the patience of our callers. Notice the relationship between staff, service level, and occupancy. Thefaster we want to answer calls, the more staff we require. Ironically, as we add staff, they become individuallyless busy. There is no way to answer calls faster without agents becoming less busy.
OccupancyAgent occupancy is an important issue and tends to be poorly understood. Occupancy is a measure of howhard the agents are working. The standard calculation is:
(Total Talk Time + Total After-call Work Time)/ Total Sign-on Time
This formula will give you a decimal figure that should be multiplied by 100 to transform it into a percentage,the usual presentation of the measure.
The misunderstood element of agent occupancy is that it is an outcome based on the choice of a service level and the workload. While it is always a concern, it is not a metric that can be actively managed.
An illustration can clarify this point:
Suppose three different contact centers each have a service-level objective of answering 80 percent of thecalls in 20 seconds or less. The size of the workload is important, since the greater the workload, the largerthe agent team will be.
• The first center expects to have 500 calls arrive in one hour, with a total average handle time of 210 seconds. Using Erlang C statistical tables, if you staff 34 agents, the expected service level will be 84 percent in 20 seconds, and the agent occupancy will be about 86 percent.
• The second center is much smaller and expects only 100 calls in one hour with the identical averagehandle time. Erlang C now predicts that if you staff at nine agents, the expected service level will be88 percent and the agent occupancy will be about 65 percent.
• The third center is the largest and expects 2,000 calls in one hour with the same average handletime. Erlang C predicts that if you staff at 123 agents, the expected service level will be 82 percentand the agent occupancy will be about 95 percent.

6
Three differently sized agent teams dealing with demand at essentially the same service level have very different occupancy. As you can see from the numbers, larger agent teams are more efficient than smallerteams. Small agent teams typically have trouble meeting service-level goals and maintaining high occupancybecause of the probability of an agent becoming available at the same time a new caller enters the queue.
Here is a way to visualize the problem:
Imagine that you are in a closed room with one door. Your most important task is to greet a person enteringthe room immediately. You don't know when the door will open, but it is imperative — a matter of life or death — that you greet the person immediately when the door opens. To do this, you will probably do nothingother than watch the door.
This is exactly what agents do, in a manner of speaking. To answer a random incoming call, an agent has to be waiting, ready and available. With lower call volumes and therefore longer periods between call arrivals,there will be more waiting, which lowers occupancy. With higher call volumes, there will be less waiting andhigher occupancy. You can affect occupancy only by consciously over-staffing or under-staffing. As a generalrule, service level and occupancy are inversely proportional. For a given workload, as service level goes up,occupancy goes down.
The Impact of ShrinkageThere is another consideration as well. Shrinkage is the term that defines employee time that you pay for, but forwhich you get no work. Sources of shrinkage include vacation, holidays, sick time, breaks, lunches, training, one-on-one coaching sessions, project work, and unscheduled breaks. The effect of shrinkage means that tomake sure we have 13 staffed positions, we will need to schedule a greater number of agents because of breaks,training, absences, and so on. The formula that captures the impact of shrinkage is as follows:
Scheduled Staff = Base Staff---------------------------------------------------------
(1 – shrinkage percent)
Applying the formula to our example and assuming our shrinkage has been measured to be 34 percent, wewould find the following:
Scheduled Staff = 14 = 21---------------------------------------------------------
(1 – 0.34)
To ensure that we have 14 staffed positions throughout the day, we will need to schedule 21 people.
The concept and effect of shrinkage is sometimes confusing. A useful way to think about it is to imagine thatinstead of a 30-minute period, we are attempting to have 14 staffed positions all day long. With this thoughtin mind, it’s easier to see that breaks, lunches, tardies, and meetings reduce the number of people available to handle transactions. Whenever an agent leaves his or her position, another agent has to step in.
The example also vividly demonstrates why centers can spend much time and energy trying to manage shrinkage. In our example, if the center management team can reduce shrinkage from 34 to 30 percent, theycan save the cost of one agent.

7
The Impact of Skill RoutingModern automatic call distributor (ACD) technologies offer powerful call routing tools that can help centersrecapture lost economies of scale when the transactional complexity exceeds the abilities of the averageagent. Centers establish queues that separate and distribute the incoming calls according to transaction typeand complexity. Agent skill groups are created that identify the available resources to the ACD routing engine.A beneficial strategy is to develop multi-skilled agents who can handle a variety of different transactions fromdifferent queues.
We’ve already seen that larger agent teams are more efficient than are smaller teams. Using sophisticatedrouting rules, ACD systems can create pseudo-large agent teams from smaller skill groups. They accomplishthis by relying on the random nature of call arrivals. The ACD can aggregate the workload from three separatequeues, for example. It directs a particular call type to the agents that have the best skills for that call type. If they are busy, the ACD looks to other agents who also have the skill to handle this call type, but with perhaps less efficiency. In effect, the ACD “borrows” an agent from a different group that primarily handles a different call type. It can do this successfully over and over because of the random nature of call arrivals. In this way, it creates a large team effect from the aggregation of smaller queues.
Unfortunately, Agner Erlang never anticipated such a development. When multi-skill agents and skill routingappear, manual and spreadsheet processes that rely upon Erlang C agent requirement calculations are no longer useful. His approach to calculating agent requirements just doesn’t work in a multi-skills environment.
There have been some attempts to remedy the Erlang skills deficiency, but all of them require arbitrary assumptions about how a multi-skilled agent will apportion his or her time among the various queues. The only practical method for creating schedules in a skill routing environment is through simulation. This is clearlybeyond the capabilities of manual or spreadsheet-based systems.
Scheduling ResourcesOnce we understand how many agents we need to schedule, we can start to deploy our resources. When should agents report for work? When should their respective breaks and lunches occur? How manyfull-time staff versus part-time staff should we have? What’s the role of overtime? Developing forecasts may involve working with lots of data, and calculating agent requirements may involve tedious arithmetic, but trying to put together cost-effective schedules that meet service level goals is even more difficult.
One approach is to build a matrix based on time of day that reflects your weekly operating hours. Suppose,for an example, that the center is open five days a week from 6:00 a.m. to 10:00 p.m. The center has five 16-hour days broken into half-hour segments. From the forecast and the Erlang tables, we know howmany staffed positions we require in each half-hour segment to achieve our service level goal, if the dayunfolds as expected.
8
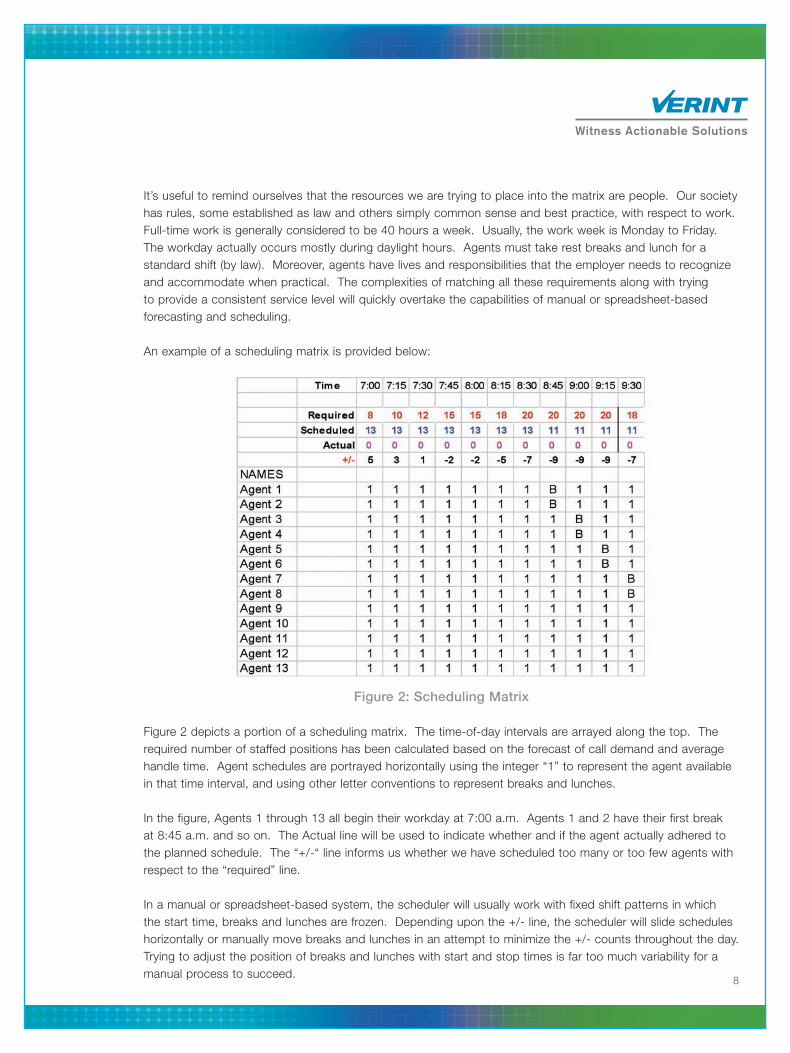
It’s useful to remind ourselves that the resources we are trying to place into the matrix are people. Our societyhas rules, some established as law and others simply common sense and best practice, with respect to work.Full-time work is generally considered to be 40 hours a week. Usually, the work week is Monday to Friday.The workday actually occurs mostly during daylight hours. Agents must take rest breaks and lunch for a standard shift (by law). Moreover, agents have lives and responsibilities that the employer needs to recognizeand accommodate when practical. The complexities of matching all these requirements along with trying to provide a consistent service level will quickly overtake the capabilities of manual or spreadsheet-based forecasting and scheduling.
An example of a scheduling matrix is provided below:
Figure 2: Scheduling Matrix
Figure 2 depicts a portion of a scheduling matrix. The time-of-day intervals are arrayed along the top. Therequired number of staffed positions has been calculated based on the forecast of call demand and averagehandle time. Agent schedules are portrayed horizontally using the integer “1” to represent the agent availablein that time interval, and using other letter conventions to represent breaks and lunches.
In the figure, Agents 1 through 13 all begin their workday at 7:00 a.m. Agents 1 and 2 have their first break at 8:45 a.m. and so on. The Actual line will be used to indicate whether and if the agent actually adhered tothe planned schedule. The “+/-“ line informs us whether we have scheduled too many or too few agents withrespect to the “required” line.
In a manual or spreadsheet-based system, the scheduler will usually work with fixed shift patterns in which the start time, breaks and lunches are frozen. Depending upon the +/- line, the scheduler will slide scheduleshorizontally or manually move breaks and lunches in an attempt to minimize the +/- counts throughout the day.Trying to adjust the position of breaks and lunches with start and stop times is far too much variability for amanual process to succeed.
9
Spreadsheets in Forecasting and SchedulingWorkforce management software systems totally automate the process described above and have been commercially available for 20 years. Almost all larger centers have invested in these solutions, but many smalland medium-sized (SME) centers have been troubled by the cost and rely instead on spreadsheet software.
Overwhelmingly, the use of spreadsheets appears in the forecasting function. Given good spreadsheet skills, a person with a basic understanding of the process briefly described here can fashion a utilitarian forecastingtool. Typically, forecasting spreadsheet tools employ multiple worksheets that are linked so as to eliminatesome of the tedium and time it takes to acquire, transcribe, and enter actual call arrival and average handletime by half-hour. Daily data is entered on one worksheet, while weekly and monthly totals are rolled up onother worksheets.
Better spreadsheets employ fairly complex arithmetic calculations that go well beyond a basic averages-basedforecast. It is more frequently the case that spreadsheet forecasts will be simply derived by using averagesmodified by various factors calculated in the spreadsheet itself. For example, the spreadsheet calculates the average number of calls per day by examining some actual performance data from the ACD reports. Thespreadsheet also calculates what percentage of calls arrives during each half-hour, as well as what percentageof the weekly call total arrives each particular day of the week. These factors can be applied to the calculatedaverage number of calls per day to arrive at reasonable call arrival forecasts.
The use of spreadsheets in the scheduling function is less prevalent because scheduling is a much tougherproblem. Forecasts are derived from hard facts recorded by the ACD. Schedules, on the other hand, are fluid constructs bounded by a variety of rules, best practice, and common sense. Most spreadsheet-basedscheduling systems rely upon fixed schedules, as do totally manual systems. Fundamentally, the schedulingprocess is not a simple arithmetic process that can be automated inside a spreadsheet. Instead, the scheduling process is more like a spatial jigsaw puzzle.
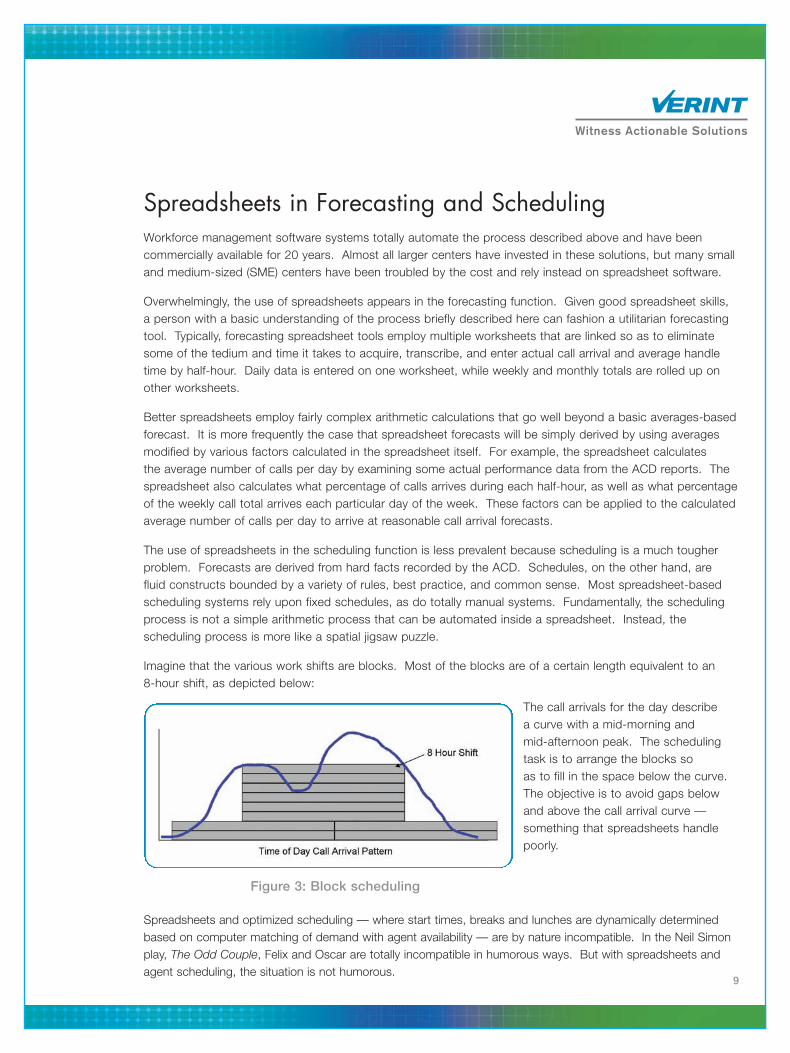
Imagine that the various work shifts are blocks. Most of the blocks are of a certain length equivalent to an 8-hour shift, as depicted below:
The call arrivals for the day describe a curve with a mid-morning and mid-afternoon peak. The schedulingtask is to arrange the blocks so as to fill in the space below the curve.The objective is to avoid gaps belowand above the call arrival curve —something that spreadsheets handlepoorly.
Figure 3: Block scheduling
Spreadsheets and optimized scheduling — where start times, breaks and lunches are dynamically determinedbased on computer matching of demand with agent availability — are by nature incompatible. In the Neil Simonplay, The Odd Couple, Felix and Oscar are totally incompatible in humorous ways. But with spreadsheets andagent scheduling, the situation is not humorous.

10
Problems with Manual and Spreadsheet ApproachesWe’ve already touched on a few of the problems and issues associated with manual and spreadsheet-basedforecasting and scheduling. Specifically, these approaches fall short in the following areas:
• Data Acquisition – ACD systems generate lots of data that must be painstakingly transcribed from thereports onto paper-based manual systems or rekeyed into spreadsheets. This takes time and effort andcompetes with other obligatory tasks for attention.
• Trend Spotting – There are long-term trends, particularly in the forecasting process, that can have profound influence upon the accuracy of the forecast. In manual and spreadsheet systems, it is very hardto identify the trends, since the process entails the analysis of data that typically spans many months.
• Time-Consuming Methods – Rekeying and manipulating the data and performing arithmetic operationsover and over without error is tedious and takes time.
• Staffing Tradeoff Analysis – Since the scheduling of agents is the key process (although entirelydependent upon a good forecast), victory is often declared when a schedule that meets minimumrequirements is generated at all. It seems almost cruel to suggest that the scheduler continue to slaveaway to create alternative schedules that also meet requirements, in order to have some choices or todevelop a set of schedules that has the fewest number of paid agent labor hours.
• Skill Routing Environments – The Erlang C function that is central to all manual and spreadsheet-basedapproaches does not produce accurate agent requirements in the multi-skilled agent environment. Itoverstaffs to a large degree.
• Schedule Adherence Tracking – A schedule can’t be effective unless people follow it. This is calledschedule adherence. To meet service-level objectives, agents must follow their schedules. We’ve seenthat one agent can make a big difference in SME centers. Not following the schedule has ripple effectsthroughout the day and can create conditions where it is impossible to achieve the service goal.
• Complex Work Rules – For centers that have extended hours of operation or that are open more than five days a week, rules regarding overtime, consecutive days worked, and fairness regarding workingweekends and off-shifts add a level of complexity that compounds the degree of difficulty in an alreadyproblematic task.
• Alternatives and Options – Because creating a schedule is challenging, manual and spreadsheetapproaches to scheduling almost never afford the opportunity to easily look at options and alternatives.
• Staff Preferences – Typically, the only way to meet staff scheduling preferences is to capitulate. This iswhy most manual and spreadsheet approaches to scheduling rely entirely upon fixed schedules thatagents are comfortable with. This leads to the next and final problem.
• Over- and Under Staffing – The result of these problems and issues is a highly compromised set ofschedules that is almost certainly not properly aligned with the call demand. This means that the centerwill experience periods of over-staffing and under-staffing in the same day, which can lead to needlessexpense and lost customer revenue and goodwill.
• Schedule Dissemination – Posting schedules on the bulletin board and performing “chair drops” are classic ways of informing the staff about new schedules. Unfortunately, these methods almost always result in a few people remaining uninformed. Posting schedules and changes on an Intranetwhere agents can access the information from anywhere using a standard Web browser is a more effective process.

11
Special Problems in Small and Medium CentersSME centers are the most likely to use manual or spreadsheet-based approaches to forecasting and scheduling because they are concerned that the cost of workforce management software can’t be justified.It’s ironic, since SME centers typically have more difficulty managing service levels than larger centers for the following reasons:
1. SME centers don’t have the efficiencies associated with large agent teams.
2. Individual agent behaviors have far greater impact on the overall operations in SME centers than inlarger centers.
3. Operations personnel in smaller contact centers usually wear multiple hats. Contact centers are complex, and smaller centers simply don’t have the budgets for specialized support resources to deal with increasing complexity. There is more work put on existing operational staff, with less focuson each task. High-payoff tasks such as coaching get squeezed out of the day because of reactionmanagement and administrative responsibilities.
The contention that SME centers are harder to successfully manage can be demonstrated using the Erlang chart. Let’s consider a simple center with one call type with a duration of 180 seconds. The expectedto receive 100 call arrivals in 30 minutes.
Average Speed Service Average Delay for Staff of Answer Level Occupancy Delayed Callers
11 122.8 sec. 38.9% 90.9% 180 sec.
12 40.5 sec. 64.0% 83.3% 90 sec.
13 17.1 sec. 79.6% 76.9% 60 sec.
14 7.8 sec. 88.8% 71.4% 45 sec.
15 3.7 sec. 94.1% 66.6% 36 sec.
16 1.7 sec. 97.0% 62.5% 30 sec.
17 .8 sec. 98.5% 58.8% 25 sec.
18 .4 sec. 99.4% 55.5% 22 sec.
In this example, if we assume that the service level goal should be 80 percent of calls answered in 20 secondsor less, then we should ideally staff 13 agent positions. If one of the 13 agents leaves his or her positionunexpectedly — just one! — the service level will fall from 79.6 to 64 percent, and the average speed ofanswer falls from a reasonable 17.1 seconds to a problematic 40.5 seconds. Notice also that if we overstaffby one agent — just one! — the service level soars from 79.6 to 88.8 percent and the average speed ofanswer decreases from 17.1 seconds to a mere 7.8 seconds.
We’ve already seen that manual and spreadsheet-based approaches are prone to significant over- and understaffing. Indeed, we would be fortunate if our +/- line only varied by one staffed position through all theintervals of the day. It is more likely that our +/- line will vary by 2 or 3 or more staffed positions from intervalto interval. In our example above, the center would experience swings in service level ranging from 20 to 97 percent, and an average speed of answer ranging from more than 130 seconds to slightly less than 2 seconds. From the customer’s perspective, there would be no consistency in service at all! From theagents’ perspective, there would be periods of boredom and periods of intense activity.

12
These wild swings in service level and agent occupancy can give rise to a whole host of related problems for SME centers, including:
• Excessive administrative time expended – Without appropriate tools, center management tends to spend far too much time on manual processes, to the detriment of agent development via coaching.
• Frequent schedule changes – Because schedules tend to be fixed and poorly linked to calldemand, center management often is in a perpetual crisis management mode of operation, characterized by changing individual agent schedules on the fly based on ACD real-time queue results.
• Tracking adherence and attendance – Accounting for agent time is typically a major task, taking away the opportunity of the management team to engage in development activities and creating an adversarial environment between management and the agent staff.
• Excessive agent idle time – Inaccurate forecasts, fixed agent shifts, and the inability to easily develop alternative scheduling approaches can result in excessive agent idle time that produces nothing for the company.
• High agent turnover – The stress levels in SME centers often are much higher than in larger centers, owing to the wild swings in service level, queue times, and resulting caller attitudes. The volatility of the center can wear down even the most highly motivated agents over time.
• Improving agent productivity – The only way to improve agent productivity is to first identify which agents are in greatest need of coaching and then to work with those agents closely to discover their skill gaps and devise programs to close the gaps. This requires time that often is unavailable, owing to the problems created by manual and spreadsheet-based forecasting and scheduling.
• Minimizing costs – Every center is challenged to hold or reduce costs while holding or improvingservice. Since agent labor costs are the largest component of overall center expense, sub-optimalapproaches to forecasting and scheduling can hamstring management’s attempts to deliver whatsenior executives demand.
Many of these issues and problems are the direct or secondary effects of inefficient scheduling. Consideration of the costs associated with the above litany of SME problems casts the justification for more effective forecasting and scheduling tools into a new light.
A common mistake SME centers make with regard to workforce management is to consider only the costs associated with the administrative time expended to develop forecasts and schedules. The assumptionis that the in-place schedules are good enough, and that the agents have become accustomed to fixedschedules that seldom change over time.

13
Our experience with SME centers shows that most operations realize significant returns on their investment in workforce management software from the following areas:
• Reduction in administrative hours to develop forecasts and schedules – Using a forecasting and scheduling solution can reduce administrative time spent developing forecasts and schedules by up to 90 percent.
• Reduction in excessive agent idle time – A huge payback can be quickly realized when agent schedules are more closely aligned with call demand. Software is much better suited to the schedule generation task, because computers can assess hundreds of different sets of agentschedules in minutes.
• Reduction in agent turnover – With a better match between workload and workforce, the center experiences less service level volatility, leading to a more predictable work experience for the agents. By involving agents in the scheduling process, agents are empowered to play agreater role in their work/life balance, further aided by shift swapping and work preferences.
• Reduction in shrinkage – We’ve seen that shrinkage must be managed carefully to keep costsdown. Forecasting and scheduling software enables sound management by first helping to accurately measure the sources of shrinkage and then providing tools that minimize its occurrence.
• Improved agent productivity – With more time available to front-line management, productivityimprovements from focused coaching are realized.
• Improved service levels – A better match between workload and workforce means that service levels often improve without the addition of paid agent labor hours.
• Less service-level volatility – Less volatility in service levels means that the customer experience is more consistent, which can lead to improved customer satisfaction, loyalty, and repeat sales.
• Reduced telecom costs – Improved service levels and less service-level volatility typically mean that fewer callers are in queue for excessive times, often leading to reduced charges for 800-number services.

15
ConclusionHowever success is defined for your contact center — profit, cost, or somewhere in between — accurate forecasting and scheduling of the agent resources is critically important. While forecasting and schedulingprocesses are well-understood conceptually, execution can be problematic. Manual approaches have manyproblems that can contribute to excessive costs and unrealized opportunity. Attempts to streamline calculationshave led to spreadsheet-based approaches that focus on forecasts and agent requirements. While they speed and simplify calculations, spreadsheets are fundamentally not well-suited for solving the scheduling part of the application.
It is ironic that small and medium centers typically are harder to manage successfully than larger centers, yet are most likely to use manual and spreadsheet-based forecasting and scheduling systems. Given the budget associated with agent labor, centers should consider the benefits provided by an automated workforcemanagement solution. These solutions offer distinct advantages over manual and spreadsheet-based forecasting and scheduling, including the ability to easily create accurate forecasts, which drive the generation of optimized schedules and help ensure that service levels are met with minimum agent labor.
About the AuthorWilliam (Bill) Durr serves as principal global solutions consultant for Verint Witness Actionable Solutions. With more than 20 years
of experience in the industry, Bill has authored numerous articles, white papers and has written two books on the technology
and management of contact centers. He is a frequent industry speaker, specializing in workforce and performance management.