Embed Size (px)
Citation preview
BPMJ: Spreadsheets for Business Process Management
Spreadsheets for Business Process Management
Using process mining to deal with “events” rather than“numbers”
Wil M.P. van der Aalst
Preprint, to appear in Business Process Management Journal (BPMJ)http://www.emeraldinsight.com/journal/bpmj
Paper received: 3 October 2016 / Paper accepted: 15 January 2017
Abstract
Purpose - Process mining provides a generic collection of techniques to turnevent data into valuable insights, improvement ideas, predictions, and recom-mendations. This paper uses spreadsheets as a metaphor to introduce processmining as an essential tool for data scientists and business analysts. The goalis to illustrate that process mining can do with events what spreadsheets cando with numbers.
Design/methodology/approach - The paper discusses the main conceptsin both spreadsheets and process mining. Using a concrete data set as arunning example the different types of process mining are explained. Wherespreadsheets work with numbers, process mining starts from event data withthe aim to analyze processes.
Findings - Differences and commonalities between spreadsheets and processmining are described. Unlike process mining tools like ProM, spreadsheets pro-grams cannot be used to discover processes, check compliance, analyze bottle-necks, animate event data, and provide operational process support. Pointersto existing process mining tools and their functionality are given.
Practical implications - Event logs and operational processes can be foundeverywhere and process mining techniques are not limited to specific appli-cation domains. Comparable to spreadsheet software widely used in finance,
Wil M.P. van der AalstProcess and Data Science (PADS), Department of Computer Science, RWTH Aachen Uni-versity, 52056 Aachen, Germany.E-mail: [email protected]
2 Wil M.P. van der Aalst
production, sales, education, and sports, process mining software can be usedin a broad range of organizations.
Originality/value - The paper provides an original view on process miningby relating it to spreadsheets. The value of spreadsheet-like technology tailoredtowards the analysis of behavior rather than numbers is illustrated by the over20 commercial process mining tools available today and the growing adoptionin a variety of application domains.
Keywords - Process mining, Business Process Management (BPM), Spread-sheets, Data science
1 Introduction
Spreadsheets are used everywhere. A spreadsheet is composed of cells orga-nized in rows and columns. Some cells serve as input, other cells have val-ues computed over a collection of other cells (e.g., taking the sum over anarray of cells). VisiCalc was the “killer application” for the Apple II com-puter in 1979 and Lotus 1-2-3 played a comparable role for the IBM PC in1983. People were buying these computers in order to run spreadsheet software[Ceruzzi, 2003]: A nice example of the “tail” (VisiCalc/Lotus 1-2-3 ) waggingthe “dog” (Apple-II/IBM PC). After decades of spectacular IT-developments,spreadsheet software can still be found on most computers (e.g. Excel is partof Microsoft’s Office) and can be accessed online (e.g., Google Sheets as partof Google Docs). Spreadsheet software survived 50 years of IT-developmentsbecause spreadsheets are highly generic and valuable for many. The situationsin which spreadsheets can be used in a meaningful way are almost endless[Jelen, 2005]. Spreadsheets can be used to do anything with numbers. Of courseone needs to write dedicated programs if computations get complex or usedatabase technology if data sets get large. However, for the purpose of thispaper we assume that spreadsheets adequately deal with numerical data. Wewould like to argue that process mining software enables users to do anythingwith events. In this paper, we introduce process mining against the backdropof spreadsheets.
Instead of numbers we consider discrete events, i.e., things that have hap-pened and could be recorded. Events may take place inside a machine (e.g.,an ATM or baggage handling system), inside an enterprise information system(e.g., a purchase decision or salary payment), inside a hospital (e.g., makingan X-ray), inside a social network (e.g., sending a twitter message), inside atransportation system (e.g., checking in at an airport), etc. Events may be“life events”, “machine events”, or “organization events”. The term Internetof Events (IoE), coined in [Aalst, 2014], refers to all event data available. TheIoE is roughly composed of the Internet of Content (IoC), the Internet of Peo-ple (IoP), Internet of Things (IoT), and Internet of Locations (IoL). These areoverlapping, e.g., a tweet sent by a mobile phone from a particular location is
Spreadsheets for Business Process Management 3
in the intersection of IoP and IoL. Process mining aims to exploit event datain a meaningful way, for example, to provide insights, identify bottlenecks, an-ticipate problems, record policy violations, recommend countermeasures, andstreamline processes [Aalst, 2016].
Process mining should be in the toolbox of data scientists, business an-alysts, and others who need to analyze event data. Unfortunately, processmining is not yet a widely adopted technology. Surprisingly, the process per-spective is absent in the majority of Big Data initiatives and data sciencecurricula. We argue that event data should be used to improve end-to-endprocesses: It is not sufficient to consider “numbers” and isolated activities.Data science approaches tend to be process agonistic whereas Business ProcessManagement (BPM) approaches tend to be model-driven without consideringthe “evidence” hidden in the data [Aalst, 2013].
Developments in BPM have resulted in a well-established set of princi-ples, methods and tools that combine knowledge from information technology,management sciences and industrial engineering for the purpose of improvingbusiness processes [Weske, 2007,Aalst, 2013,Dumas et al., 2013]. BPM can beviewed as a continuation of the Workflow Management (WFM) wave in thethe nineties. The maturity of WFM/BPM is partly reflected by a range ofbooks:
– [Jablonski & Bussler, 1996] (first comprehensive WFM book focusing onthe different workflow perspectives and the MOBILE language),
– [Leymann & Roller, 1999] (book on production WFM systems closely re-lated to IBM’s workflow products),
– [Aalst et al., 2000] (edited book that served as the basis for the BPM con-ference series),
– [Aalst & Hee, 2004] (most cited WFM book; a Petri net-based approach isused to model, analyze and enact workflow processes),
– [Muehlen, 2004] (book relating WFM systems to operational performance),– [Dumas et al., 2005] (edited book on process-aware information systems),– [Smith & Fingar, 2006] (visionary book linking management perspectives
to the pi calculus),– [Weske, 2007] (book presenting the foundations of BPM, including different
languages and architectures),– [Hofstede et al., 2010] (book based on YAWL and the workflow patterns),– [Brocke & Rosemann, 2010,Brocke & Rosemann, 2014] (handbooks on Busi-
ness Process Management),– [Becker et al., 2011] (book on the design of process-oriented organizations),– [Reichert & Weber, 2012] (book on supporting flexibility in process-aware
information systems), and– [Dumas et al., 2013] (tutorial-style book covering the whole BPM lifecy-
cle).
As mentioned, WFM/BPM approaches tend to be model-driven. Notable ex-ceptions are the process mining approaches developed over the last decade[Aalst, 2016].
4 Wil M.P. van der Aalst
Process mining can be seen as a means to bridge the gap between data sci-ence and classical process management (WFM/BPM) [Aalst, 2013]. By fram-ing process mining as a spreadsheet-like technology for event data, we hope toincrease awareness in the information systems community.
The remainder of this paper is organized as follows. Section 2 introduces aconcrete data set which will be used as a running example. By using an easy-to-understand business setting to introduce both spreadsheets and process min-ing, we can explain their differences and commonalities. Section 3 summarizesthe basic concepts used by spreadsheet software like Excel and also describesthe relevance of spreadsheets in a historical context. Section 4 demonstratesthat process mining technology can be positioned as spreadsheets to analyzedynamic behavior rather than numbers. Process mining techniques such asprocess discovery and conformance checking are illustrated using the runningexample. Section 5 concludes the paper.
2 Running Example
As an example, let us consider the process of handling customer orders. Cus-tomers can order phones via the website of a telecom company. The customerfirst places an order. Multiple phones of the same type can be ordered at thesame time. The customer is expected to pay before the phones are delivered.An invoice is sent to the customer, but the customer can also pay before re-ceiving the invoice. If the customer does not pay in time, a reminder is sent.This is only done after sending the invoice. If the customer does not pay aftertwo reminders, the order is canceled. If the customer pays, the order’s deliveryis prepared, followed by the actual delivery and a conformation of payment(in any order).
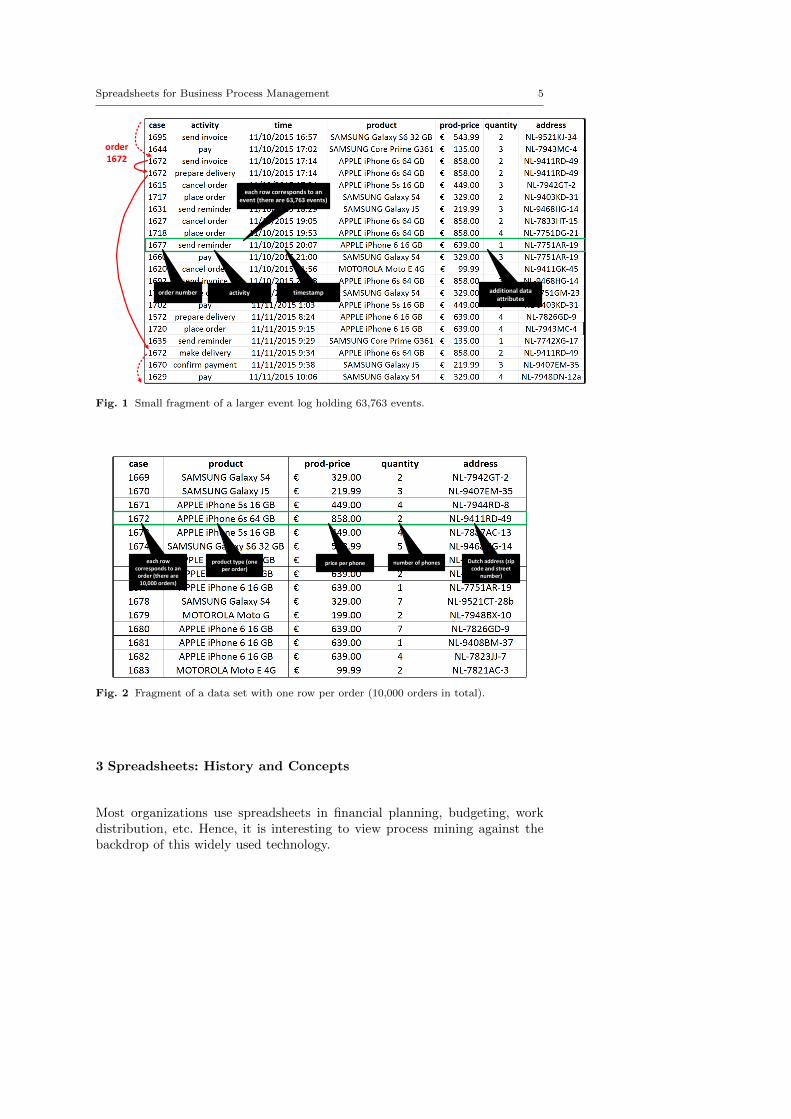
Figure 1 shows some event data recorded for our order handling process.Each row corresponds to an event, i.e., the execution of an activity for aparticular order. The highlighted row refers to the sending of a reminder fororder 1677 on 11/10/2015. There may be multiple rows (i.e., events) relatedto the same order. For example, the small fragment shows three events relatedto order 1672 (see red lines). Order 1672 consists of six events in total. Thisis close to the average number of events per order (6.38).
Whereas Figure 1 shows the “raw” events, Figure 2 shows more high-level data with precisely one row per order. For example, all events relatedto order 1672 are “collapsed” into a single row. There are 10,000 orders. Perorder we can see the quantity, number of phones ordered, and a zip code withstreet number (plus possible suffix) uniquely identifying an address in theNetherlands.
The data sets shown in Figure 1 and Figure 2 will be used to introduceprocess mining techniques and to relate these to spreadsheet-based analysis.
Spreadsheets for Business Process Management 5
each row corresponds to an event (there are 63,763 events)
order number activity timestamp additional data attributes
order 1672
Fig. 1 Small fragment of a larger event log holding 63,763 events.
each row corresponds to an order (there are 10,000 orders)
product type (one per order)
price per phone number of phones Dutch address (zip code and street
number)
Fig. 2 Fragment of a data set with one row per order (10,000 orders in total).
3 Spreadsheets: History and Concepts
Most organizations use spreadsheets in financial planning, budgeting, workdistribution, etc. Hence, it is interesting to view process mining against thebackdrop of this widely used technology.
6 Wil M.P. van der Aalst
3.1 History
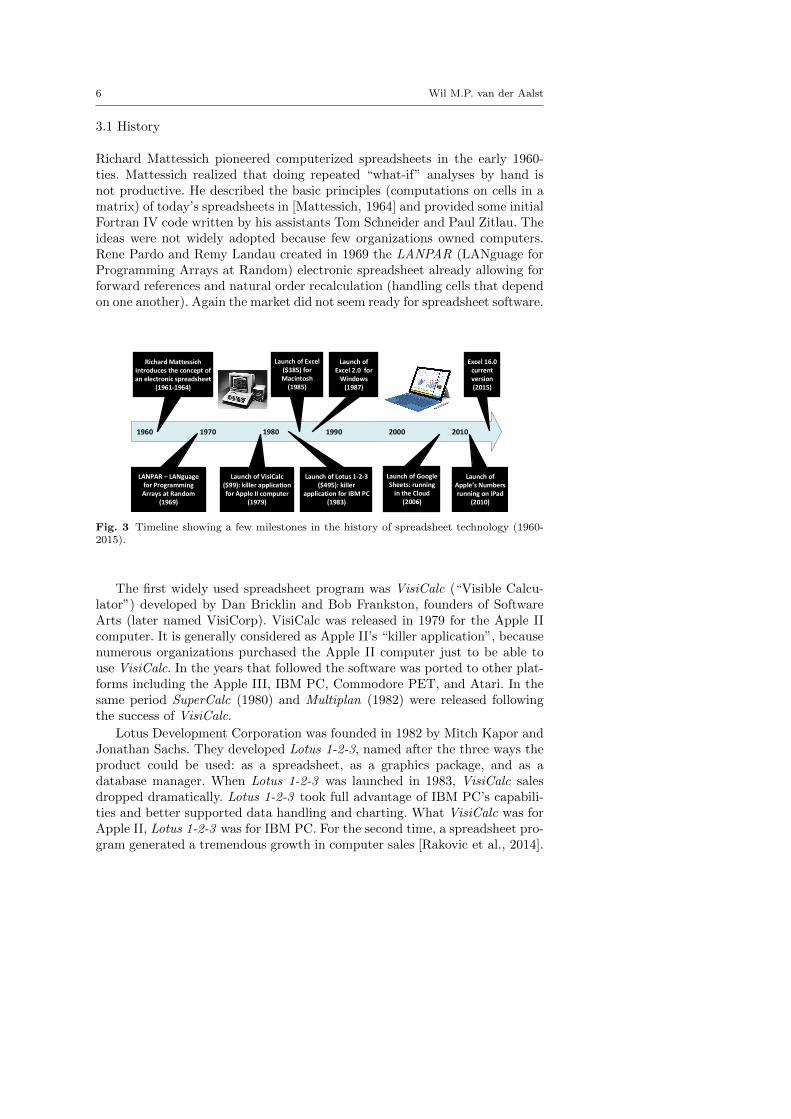
Richard Mattessich pioneered computerized spreadsheets in the early 1960-ties. Mattessich realized that doing repeated “what-if” analyses by hand isnot productive. He described the basic principles (computations on cells in amatrix) of today’s spreadsheets in [Mattessich, 1964] and provided some initialFortran IV code written by his assistants Tom Schneider and Paul Zitlau. Theideas were not widely adopted because few organizations owned computers.Rene Pardo and Remy Landau created in 1969 the LANPAR (LANguage forProgramming Arrays at Random) electronic spreadsheet already allowing forforward references and natural order recalculation (handling cells that dependon one another). Again the market did not seem ready for spreadsheet software.
1960 1970 1980 1990 2000 2010
Richard Mattessich introduces the concept of an electronic spreadsheet
(1961-1964)
Launch of VisiCalc ($99): killer application for Apple II computer
(1979)
Launch of Lotus 1-2-3 ($495): killer
application for IBM PC(1983)
Launch of Excel ($385) for Macintosh
(1985)
Launch of Excel 2.0 for
Windows (1987)
Excel 16.0 current version (2015)
Launch of Google Sheets: running
in the Cloud(2006)
Launch of Apple’s Numbers running on iPad
(2010)
LANPAR – LANguage for Programming Arrays at Random
(1969)
Fig. 3 Timeline showing a few milestones in the history of spreadsheet technology (1960-2015).
The first widely used spreadsheet program was VisiCalc (“Visible Calcu-lator”) developed by Dan Bricklin and Bob Frankston, founders of SoftwareArts (later named VisiCorp). VisiCalc was released in 1979 for the Apple IIcomputer. It is generally considered as Apple II’s “killer application”, becausenumerous organizations purchased the Apple II computer just to be able touse VisiCalc. In the years that followed the software was ported to other plat-forms including the Apple III, IBM PC, Commodore PET, and Atari. In thesame period SuperCalc (1980) and Multiplan (1982) were released followingthe success of VisiCalc.
Lotus Development Corporation was founded in 1982 by Mitch Kapor andJonathan Sachs. They developed Lotus 1-2-3, named after the three ways theproduct could be used: as a spreadsheet, as a graphics package, and as adatabase manager. When Lotus 1-2-3 was launched in 1983, VisiCalc salesdropped dramatically. Lotus 1-2-3 took full advantage of IBM PC’s capabili-ties and better supported data handling and charting. What VisiCalc was forApple II, Lotus 1-2-3 was for IBM PC. For the second time, a spreadsheet pro-gram generated a tremendous growth in computer sales [Rakovic et al., 2014].
Spreadsheets for Business Process Management 7
Lotus 1-2-3 dominated the spreadsheet market until 1992. The dominanceended with the uptake of Microsoft Windows.
Microsoft’s Excel was released in 1985. Microsoft originally sold the spread-sheet program Multiplan, but replaced it by Excel in an attempt to competewith Lotus 1-2-3. The software was first released for the Macintosh computer in1985. Microsoft released Excel 2.0 in 1987 which included a run-time version ofMS Windows. Five years later, Excel was market leader and became immenselypopular as an integral part of the Microsoft’s Office suite. Borland’s Quattrowhich was released in 1988 competed together with Lotus 1-2-3 against Excel,but could not sustain a reasonable market share. Excel has dominated thespreadsheet market over the last 25 years. In 2015, the 16th release of Excelbecame available.
Online cloud-based spreadsheets such as Google Sheets (part of Google Docssince 2006) provide spreadsheet functionality in a web browser. Numbers is aspreadsheet application developed by Apple available on iPhones, iPads (iOS),and Macs (OS X). Dozens of other spreadsheet apps are available via GooglePlay or Apple’s App Store.
Figure 3 summarizes 55 years of spreadsheet history. The key point is thatspreadsheets have been one of the primary reasons to use computers in businessenvironments.
3.2 Basic Concepts
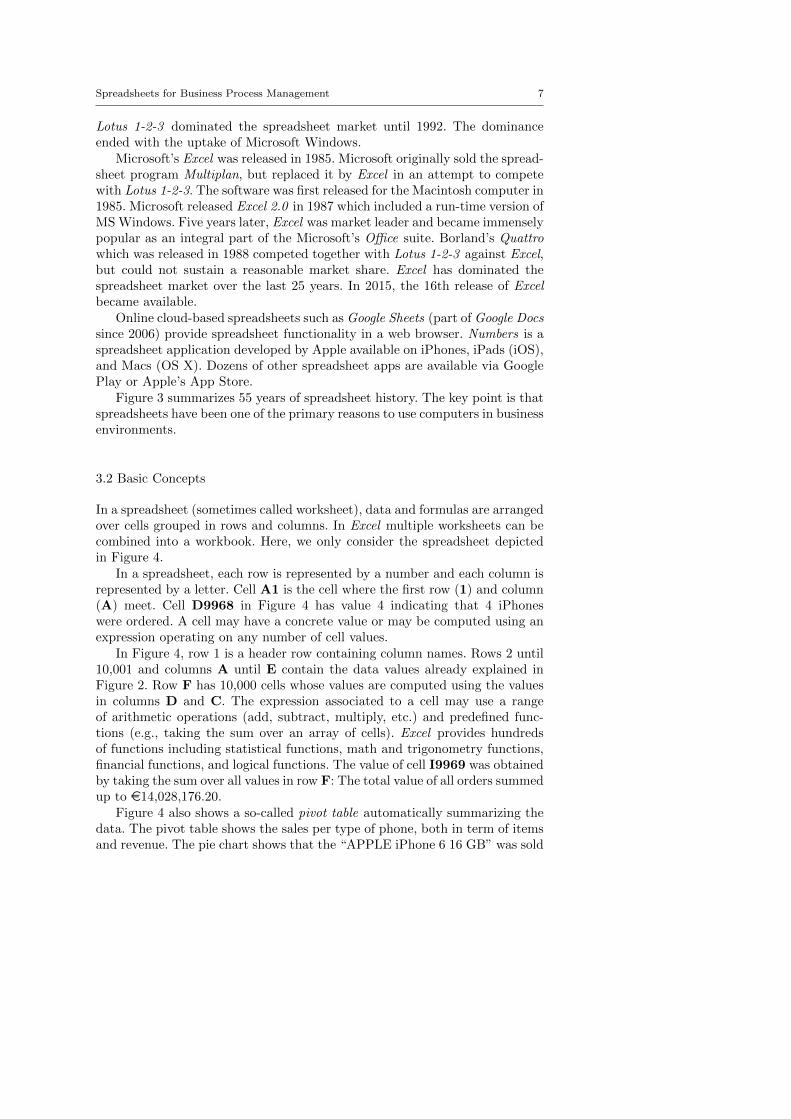
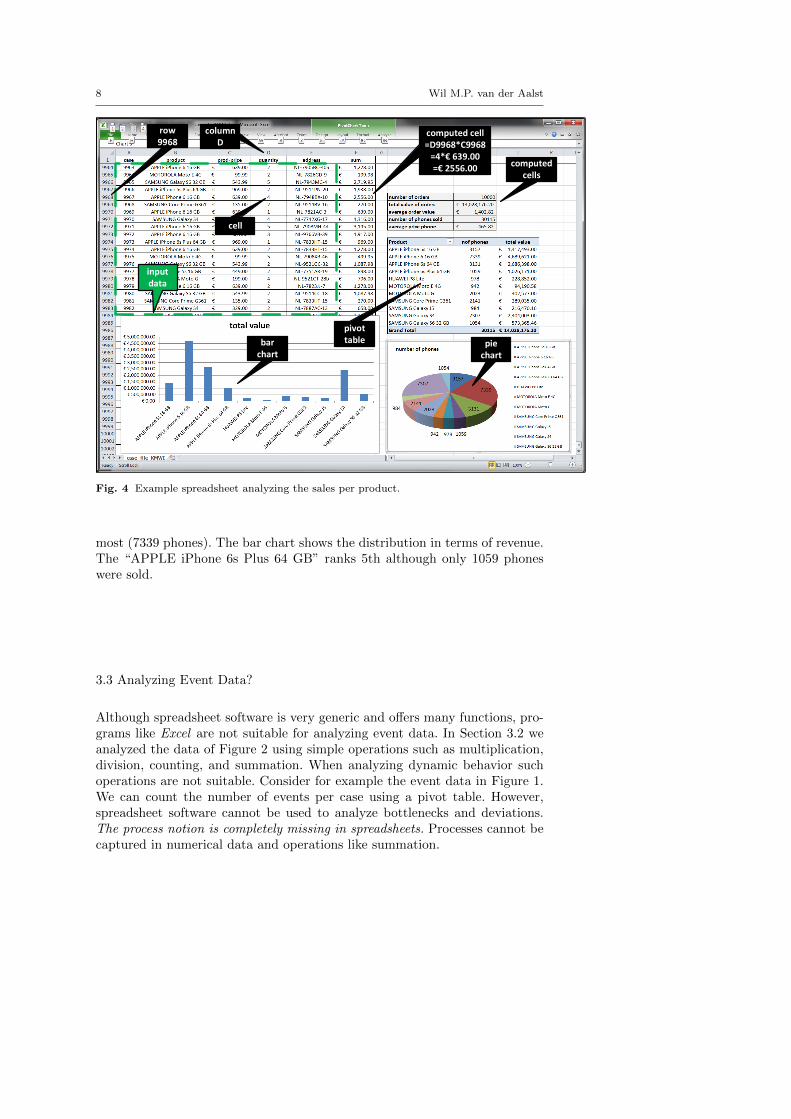
In a spreadsheet (sometimes called worksheet), data and formulas are arrangedover cells grouped in rows and columns. In Excel multiple worksheets can becombined into a workbook. Here, we only consider the spreadsheet depictedin Figure 4.
In a spreadsheet, each row is represented by a number and each column isrepresented by a letter. Cell A1 is the cell where the first row (1) and column(A) meet. Cell D9968 in Figure 4 has value 4 indicating that 4 iPhoneswere ordered. A cell may have a concrete value or may be computed using anexpression operating on any number of cell values.
In Figure 4, row 1 is a header row containing column names. Rows 2 until10,001 and columns A until E contain the data values already explained inFigure 2. Row F has 10,000 cells whose values are computed using the valuesin columns D and C. The expression associated to a cell may use a rangeof arithmetic operations (add, subtract, multiply, etc.) and predefined func-tions (e.g., taking the sum over an array of cells). Excel provides hundredsof functions including statistical functions, math and trigonometry functions,financial functions, and logical functions. The value of cell I9969 was obtainedby taking the sum over all values in row F: The total value of all orders summedup to e14,028,176.20.
Figure 4 also shows a so-called pivot table automatically summarizing thedata. The pivot table shows the sales per type of phone, both in term of itemsand revenue. The pie chart shows that the “APPLE iPhone 6 16 GB” was sold
8 Wil M.P. van der Aalst
cell
columnD
computed cell=D9968*C9968
=4*€ 639.00=€ 2556.00
pivot table pie
chart
bar chart
computed cells
input data
row 9968
Fig. 4 Example spreadsheet analyzing the sales per product.
most (7339 phones). The bar chart shows the distribution in terms of revenue.The “APPLE iPhone 6s Plus 64 GB” ranks 5th although only 1059 phoneswere sold.
3.3 Analyzing Event Data?
Although spreadsheet software is very generic and offers many functions, pro-grams like Excel are not suitable for analyzing event data. In Section 3.2 weanalyzed the data of Figure 2 using simple operations such as multiplication,division, counting, and summation. When analyzing dynamic behavior suchoperations are not suitable. Consider for example the event data in Figure 1.We can count the number of events per case using a pivot table. However,spreadsheet software cannot be used to analyze bottlenecks and deviations.The process notion is completely missing in spreadsheets. Processes cannot becaptured in numerical data and operations like summation.
Spreadsheets for Business Process Management 9
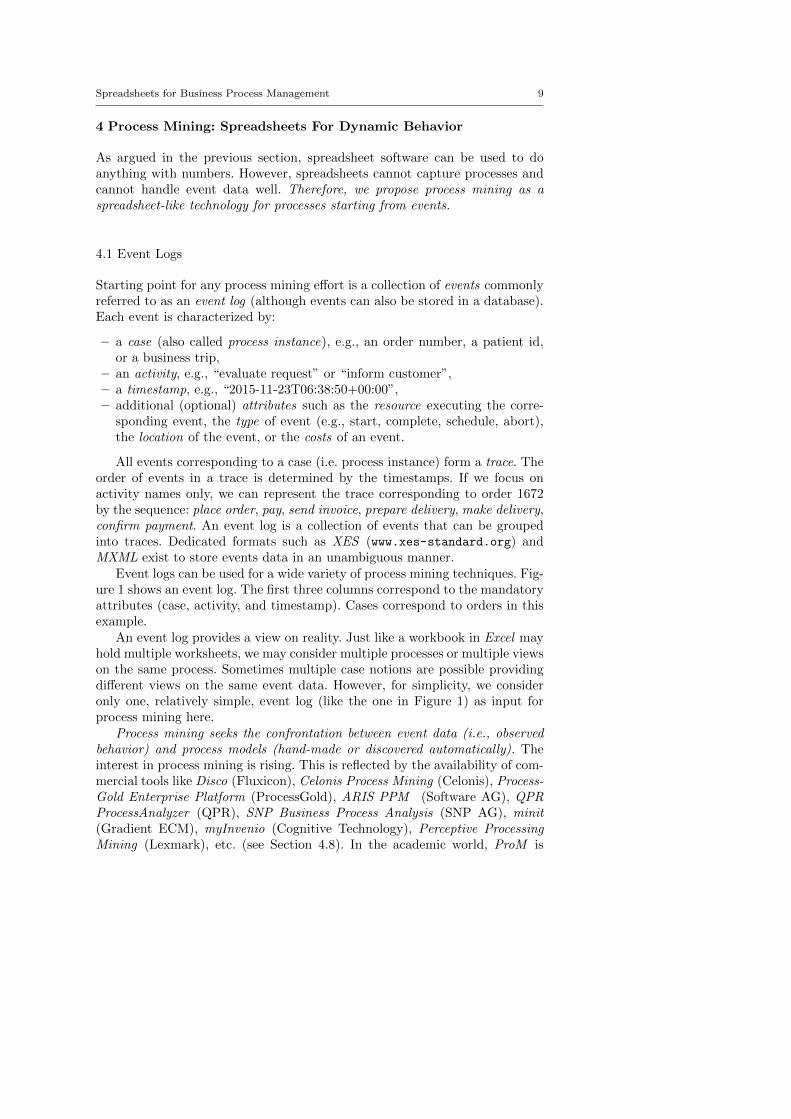
4 Process Mining: Spreadsheets For Dynamic Behavior
As argued in the previous section, spreadsheet software can be used to doanything with numbers. However, spreadsheets cannot capture processes andcannot handle event data well. Therefore, we propose process mining as aspreadsheet-like technology for processes starting from events.
4.1 Event Logs
Starting point for any process mining effort is a collection of events commonlyreferred to as an event log (although events can also be stored in a database).Each event is characterized by:
– a case (also called process instance), e.g., an order number, a patient id,or a business trip,
– an activity, e.g., “evaluate request” or “inform customer”,– a timestamp, e.g., “2015-11-23T06:38:50+00:00”,– additional (optional) attributes such as the resource executing the corre-
sponding event, the type of event (e.g., start, complete, schedule, abort),the location of the event, or the costs of an event.
All events corresponding to a case (i.e. process instance) form a trace. Theorder of events in a trace is determined by the timestamps. If we focus onactivity names only, we can represent the trace corresponding to order 1672by the sequence: place order, pay, send invoice, prepare delivery, make delivery,confirm payment. An event log is a collection of events that can be groupedinto traces. Dedicated formats such as XES (www.xes-standard.org) andMXML exist to store events data in an unambiguous manner.
Event logs can be used for a wide variety of process mining techniques. Fig-ure 1 shows an event log. The first three columns correspond to the mandatoryattributes (case, activity, and timestamp). Cases correspond to orders in thisexample.
An event log provides a view on reality. Just like a workbook in Excel mayhold multiple worksheets, we may consider multiple processes or multiple viewson the same process. Sometimes multiple case notions are possible providingdifferent views on the same event data. However, for simplicity, we consideronly one, relatively simple, event log (like the one in Figure 1) as input forprocess mining here.
Process mining seeks the confrontation between event data (i.e., observedbehavior) and process models (hand-made or discovered automatically). Theinterest in process mining is rising. This is reflected by the availability of com-mercial tools like Disco (Fluxicon), Celonis Process Mining (Celonis), Process-Gold Enterprise Platform (ProcessGold), ARIS PPM (Software AG), QPRProcessAnalyzer (QPR), SNP Business Process Analysis (SNP AG), minit(Gradient ECM), myInvenio (Cognitive Technology), Perceptive ProcessingMining (Lexmark), etc. (see Section 4.8). In the academic world, ProM is
10 Wil M.P. van der Aalst
the de-facto standard (www.processmining.org) and research groups all overthe world have contributed to the hundreds of ProM plug-ins available. Allanalysis results depicted in this paper were obtained using ProM.
4.2 Exploring Event Data
Starting from an event log like the one in Figure 1, we can explore the set ofevents. Simple descriptive statistics can be applied to the event log, e.g., theaverage flow time of cases or the percentage of cases completed within oneweek. Univariate statistical analysis focuses on a single variable like flow time,including its central tendency (including the mean, median, and mode) anddispersion (including the range and quantiles of the data-set, and measuresof spread such as the variance and standard deviation). Bivariate statisticalanalysis focuses on the relationship between variables, e.g., correlation. How-ever, to get a good feel for the behavior captured in the event log, one needsto look beyond basic descriptive statistics.
(a) case duration sorted on order number (b) case duration sorted on duration
(c) distribution of events over day (d) distribution of events over week
color of dot indicates activity
time since start of case
cases sorted by duration
seasonal pattern (5x)
time since start of case
place ordersend invoicepaysend reminderprepare deliveryconfirm paymentmake deliverycancel order
night evening
morning
lunchtime
afternoon
Sunday
Monday Wednesday
Tuesday Thursday
Friday
Saturday
1
2
3
4
5
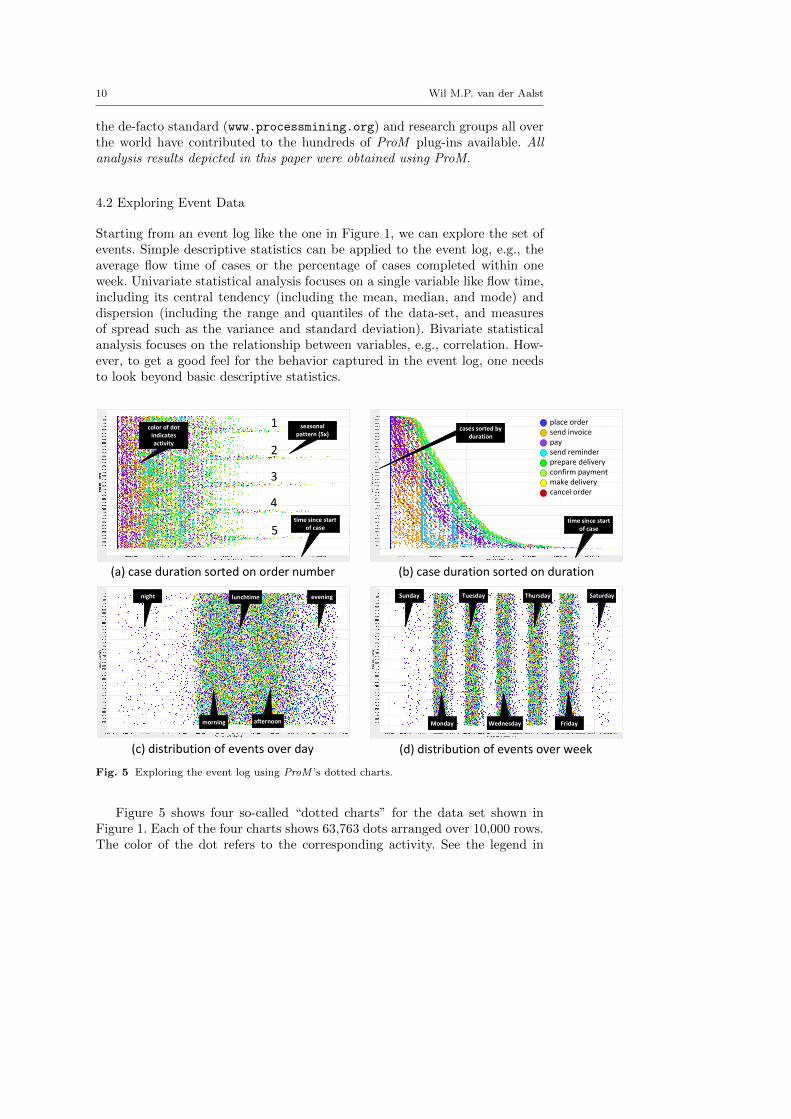
Fig. 5 Exploring the event log using ProM ’s dotted charts.
Figure 5 shows four so-called “dotted charts” for the data set shown inFigure 1. Each of the four charts shows 63,763 dots arranged over 10,000 rows.The color of the dot refers to the corresponding activity. See the legend in
Spreadsheets for Business Process Management 11
Figure 5(b) for the mapping, e.g., the dark blue dot refers to activity placeorder. In all four diagrams, the X-axis refers to a temporal property of theevent and the Y-axis refers to the corresponding case (i.e., customer order).In Figure 5(a) the time since the start of the case is used for the X-axis.All orders start with a blue dot at time zero indicating that cases start withactivity place order. The colored bands show that activities tend to happenin certain periods, e.g., the first reminder (if any) is typically sent after aweek. One can also see clearly seasonal patterns; at certain periods flow timesare considerably longer. Figure 5(a) shows five such periods. In Figure 5(b)the cases are sorted based on their flow time. The top cases take the leasttime to completion; the bottom cases take the longest. Again one can seeclear patterns. For example, cases that take longer have multiple reminders.Figure 5(c) shows the distribution of events over the day. Most activities takeplace during office hours. One can also note the effect of lunch breaks. Duringthe night we only see blue and purple dots indicating the placing of ordersand payments. These activities are done by customers not bound to officehours. Figure 5(d) shows the distribution of events over the week. Again wecan clearly notice that, apart from placing of orders and making payments,most activities take place during office hours and not during weekends.
Figure 5 provides insights that get lost if events are aggregated into num-bers. Unlike spreadsheets, process mining treats concepts such as case (X-axis),time (Y-axis), and activity (color dot) as first-class citizens during analysis.
4.3 Process Discovery
Most of process mining research focused on the discovery of process modelsfrom event data [Aalst, 2016]. The process model should be able to capturecausalities, choices, concurrency, and loops. Process discovery is a notoriouslydifficult problem because event logs are often far from complete and thereare at least four competing quality dimensions: (1) fitness, (2) simplicity, (3)precision, and (4) generalization. A model with good fitness allows for most ofthe behavior seen in the event log. A model has a perfect fitness if all tracesin the log can be replayed by the model from beginning to end. The simplestmodel that can explain the behavior seen in the log is the best model. Thisprinciple is known as Occam’s Razor. Fitness and simplicity alone are notsufficient to judge the quality of a discovered process model. For example, it isvery easy to construct an extremely simple process model that is able to replayall traces in an event log (but also any other event log referring to the sameset of activities). Similarly, it is undesirable to have a model that only allowsfor the exact behavior seen in the event log. Remember that the log containsonly example behavior and that many traces that are possible may not havebeen observed yet. A model is precise if it does not allow for “too much”behavior. A model that is not precise is “underfitting”, i.e., the model allowsfor behaviors very different from what was seen in the log. At the same time,the model should generalize and not restrict behavior to just the examples
12 Wil M.P. van der Aalst
seen in the log. A model that does not generalize is “overfitting”. Overfittingmeans that an overly specific model is generated whereas it is obvious thatthe log only holds example behavior (i.e., the model explains the particularsample log, but there is a high probability that the model is unable to explainthe next batch of cases).
The discussion above shows that process discovery needs to deal with var-ious trade-offs. Therefore, most process discovery algorithms have parametersto influence the result. Hence, different models can be created based on thequestions at hand.
(a) process model discovered using the inductive miner without filtering
(b) process model discovered without two low-frequent activities
(c) process model discovered for happy path
(d) process model discovered using the ILP miner
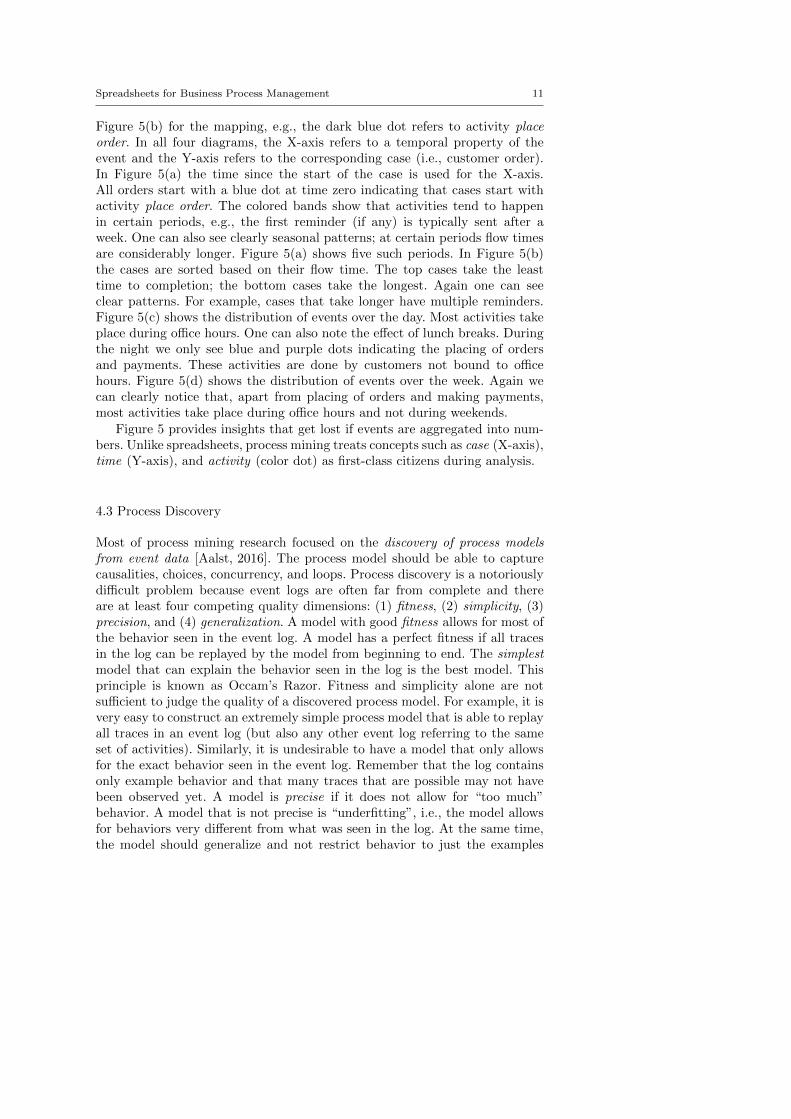
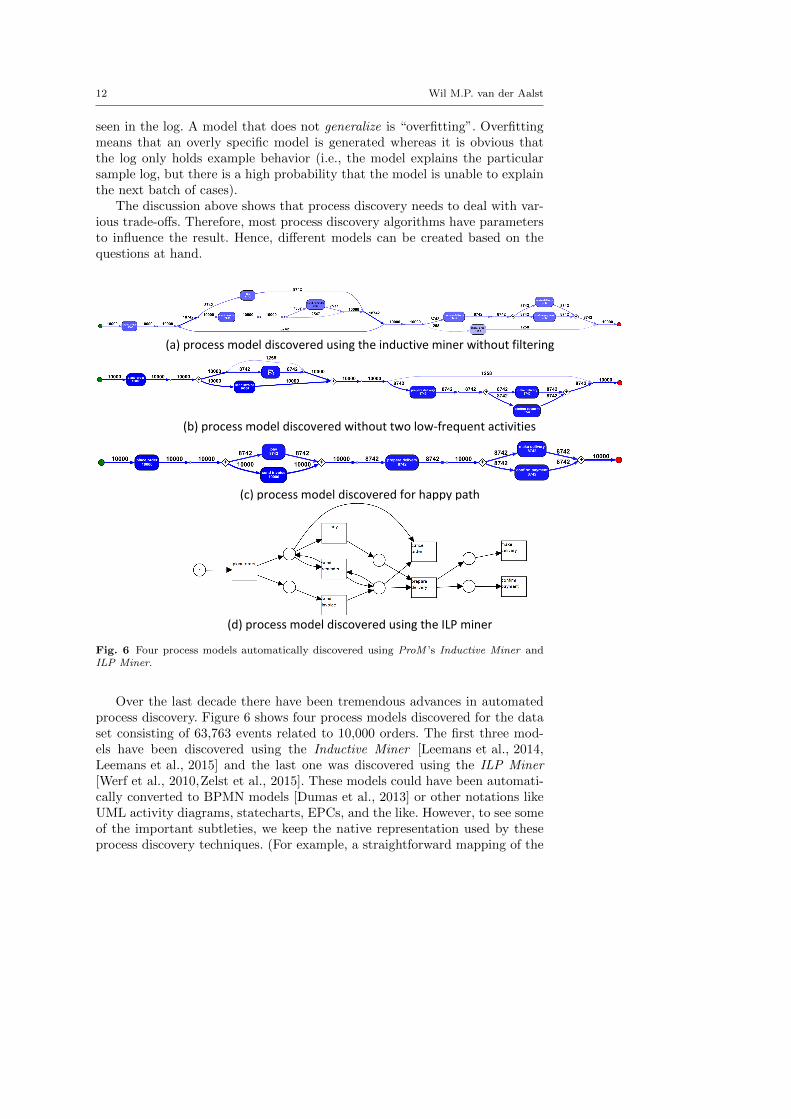
Fig. 6 Four process models automatically discovered using ProM ’s Inductive Miner andILP Miner.
Over the last decade there have been tremendous advances in automatedprocess discovery. Figure 6 shows four process models discovered for the dataset consisting of 63,763 events related to 10,000 orders. The first three mod-els have been discovered using the Inductive Miner [Leemans et al., 2014,Leemans et al., 2015] and the last one was discovered using the ILP Miner[Werf et al., 2010,Zelst et al., 2015]. These models could have been automati-cally converted to BPMN models [Dumas et al., 2013] or other notations likeUML activity diagrams, statecharts, EPCs, and the like. However, to see someof the important subtleties, we keep the native representation used by theseprocess discovery techniques. (For example, a straightforward mapping of the
Spreadsheets for Business Process Management 13
Petri net in Figure 6(d) to a BPMN model having precisely the same behavioris impossible.)
Figure 6(a) shows a perfectly fitting process model showing all eight ac-tivities. Each case starts with the placement of an order and ends with acancellation, a delivery, or a confirmation of payment. The diamond shaped“+” nodes correspond to AND-splits/joins. All other splits/joins are of typeXOR. Figure 6(b) shows a perfectly fitting process model after automaticallyremoving the two least frequent activities. Note that the placement of an orderis always followed by the sending of an invoice and sometimes by a payment.For 1,258 orders there was no payment as shown by the number on the arcbypassing activity pay. Figure 6(c) shows another automatically discoveredprocess model, but now the Inductive Miner was asked to uncover the “happypath” (i.e., the most frequent behavior). In this idealized model all customerpay (either before or after receiving the invoice), there are no cancelations, theorder is always delivered, and payment is always confirmed.
Figure 6(a) is perfectly fitting but not very precise. Using the ILP Miner wediscovered the Petri net shown in Figure 6(d). Using Petri nets we can expressthings missing in the earlier diagrams. For example, Figure 6(d) shows thatcancelation only takes place after sending the invoice and missing payment. Ifthe customer pays before cancelation, the order is eventually delivered. More-over, reminders are only sent after sending the invoice and before payment.
Each of the four models could be discovered in a few seconds on a normallaptop. Note that the discovered process model is not the end-goal of processmining: It is the backbone for further analysis!
4.4 Checking Compliance
The second type of process mining is conformance checking [Aalst, 2016]. Here,an existing process model is compared with an event log of the same process.Conformance checking can be used to check if reality, as recorded in the log,conforms to the model and vice versa. The process model used as input maybe hand-made or discovered. To check compliance often a normative hand-crafted model is used. However, to find exceptional cases, one can also use adiscovered process model showing the mainstream behavior. It is also possibleto “repair” process models based on event data.
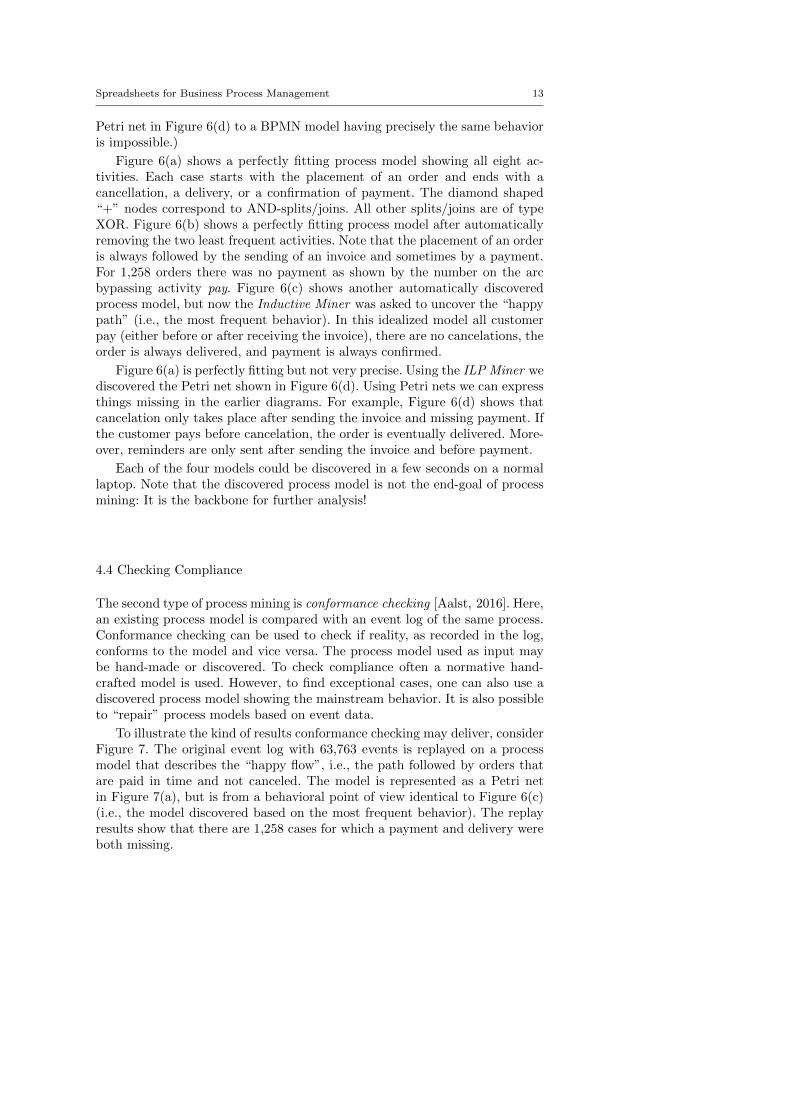
To illustrate the kind of results conformance checking may deliver, considerFigure 7. The original event log with 63,763 events is replayed on a processmodel that describes the “happy flow”, i.e., the path followed by orders thatare paid in time and not canceled. The model is represented as a Petri netin Figure 7(a), but is from a behavioral point of view identical to Figure 6(c)(i.e., the model discovered based on the most frequent behavior). The replayresults show that there are 1,258 cases for which a payment and delivery wereboth missing.
14 Wil M.P. van der Aalst
for 1258 cases there was no
payment
the orders without payment were also
not delivered
2916 conforming cases
1791 cases having one reminder(move on log)
1258 canceled orders(moves on log &
moves on model)
(a) model view showing where model does not fit reality
(b) log view showing where reality does not fit model
move on model (should have happened)
move on log (should not have happened)
Fig. 7 Conformance checking as a means to show deviations between observed and modeledbehavior.
The diagnostics in Figure 7 are based on so-called alignments, i.e., traces inthe event log are mapped onto nearest paths in the model [Aalst et al., 2012].Basically, there are two types of deviations:
– Move on model : An activity was supposed to happen according to themodel but did not happen in reality, i.e., the corresponding event wasmissing in the event log. Such deviations are indicated in purple.
– Move on log : An activity happened in reality but was not supposed tohappen at this stage according to the model, i.e., there is an event in thelog that was not allowed at that point in time. Such deviations are indicatedin yellow.
Figure 7(a) shows a model-based view with conformance diagnostics. The smallpurple lines at the bottom of the four highlighted activities show the moveson model. For example, activity prepare delivery was skipped 1,258 times.The yellow places correspond to states where activities happened in reality,but were not allowed according to the model. Figure 7(b) shows a log-basedconformance view. Again the colors indicate deviations.
Using conformance checking one can analyze the severity of the differenttypes of deviations. It is also possible to select cases having a specific typeof deviation and automatically see what differentiates them from conform-ing cases. In this way, we can learn about the root causes of non-conformingbehavior.
Spreadsheets for Business Process Management 15
4.5 Analyzing Performance
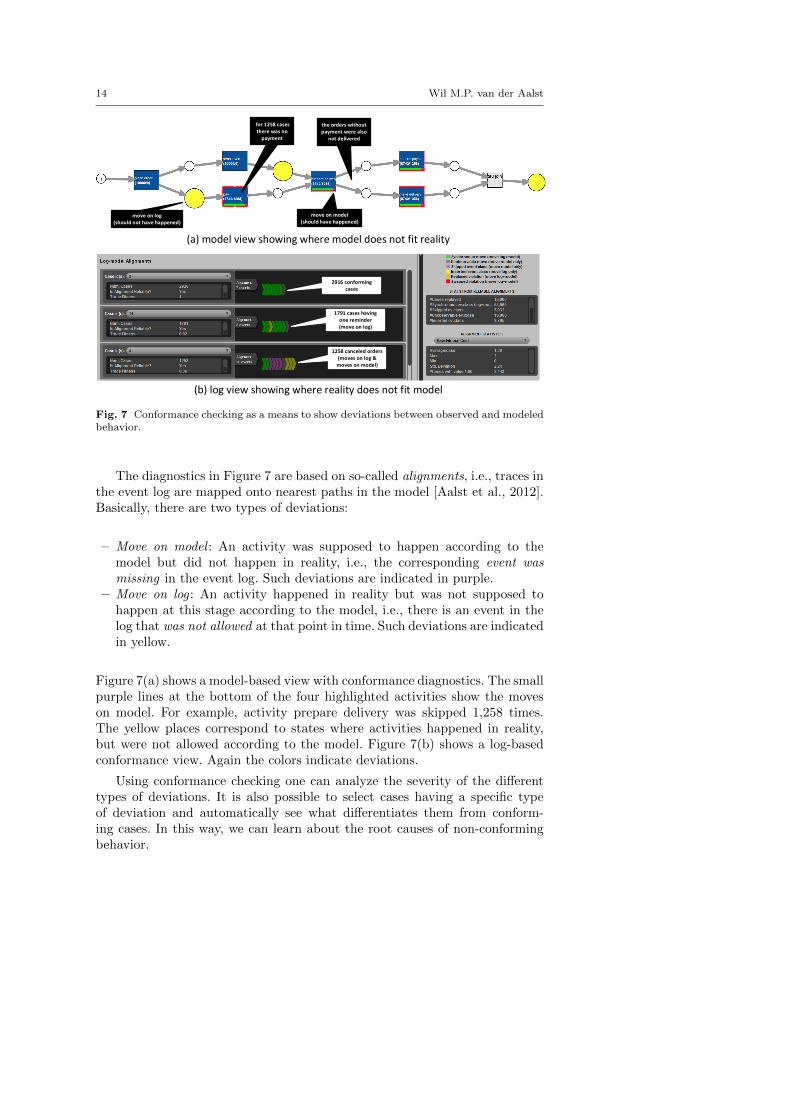
Using the notion of alignments, we can replay any event log on the corre-sponding model even when there are deviations. Recall that each event in thelog has a timestamp (third column in Figure 1). While replaying the eventlog we can take into account these timestamps and measure the time spentin-between activities. This way we can analyze waiting times. If logs haveboth start and complete events for activities, we can also measure the dura-tion of such activities. If event logs also have resource information, we candetect over/under-utilization of resources. Hence, while replaying we can getall information needed for performance analysis.
on average it takes 6.01 days
to send an invoice
no waiting time because place order
is the first activitypreparation of the
delivery is often delayed because of the
invoice and not the actual payment
after preparation the delivery is done within
a day (on average)
send invoice statisticsfrequency: 10,000 times
minimum waiting time: 33.2 minutesmaximum waiting time: 23.00 days
mean waiting time: 6.01 daysstandard deviation: 3.53 days
Fig. 8 Average waiting times for activities computed by replaying the whole event log.
All 63,763 events in Figure 1 are complete events. Therefore, we can onlyanalyze the times in-between activities. Figure 8 shows the mean waiting timesfor activities using the model discovered by the ILP Miner (cf. Figure 6(d)).Next to the mean we can show the minimum, maximum, median, standarddeviation, variance, etc. The main bottleneck in the process seems to be thesending of invoices. It is also possible to select cases taking longer than somenormative time and see what differentiates them from the other cases. Thisallows us to diagnose bottlenecks and generate ideas for process improvement.
4.6 Process Animation
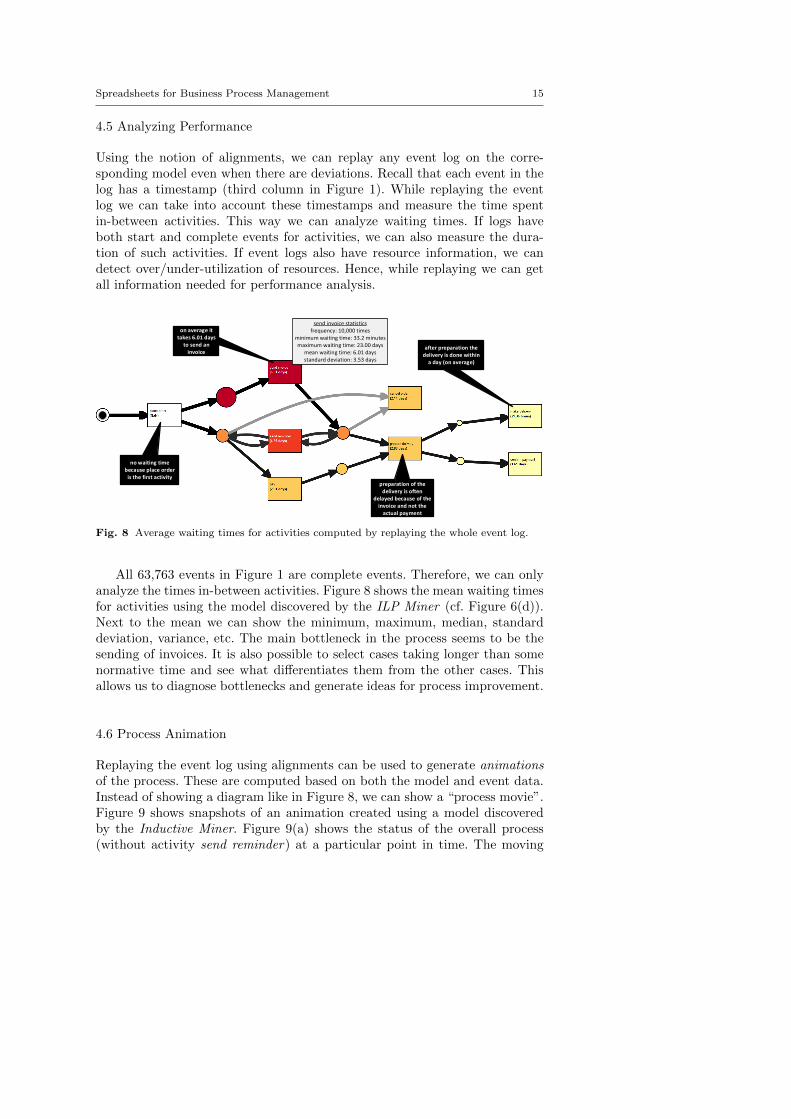
Replaying the event log using alignments can be used to generate animationsof the process. These are computed based on both the model and event data.Instead of showing a diagram like in Figure 8, we can show a “process movie”.Figure 9 shows snapshots of an animation created using a model discoveredby the Inductive Miner. Figure 9(a) shows the status of the overall process(without activity send reminder) at a particular point in time. The moving
16 Wil M.P. van der Aalst
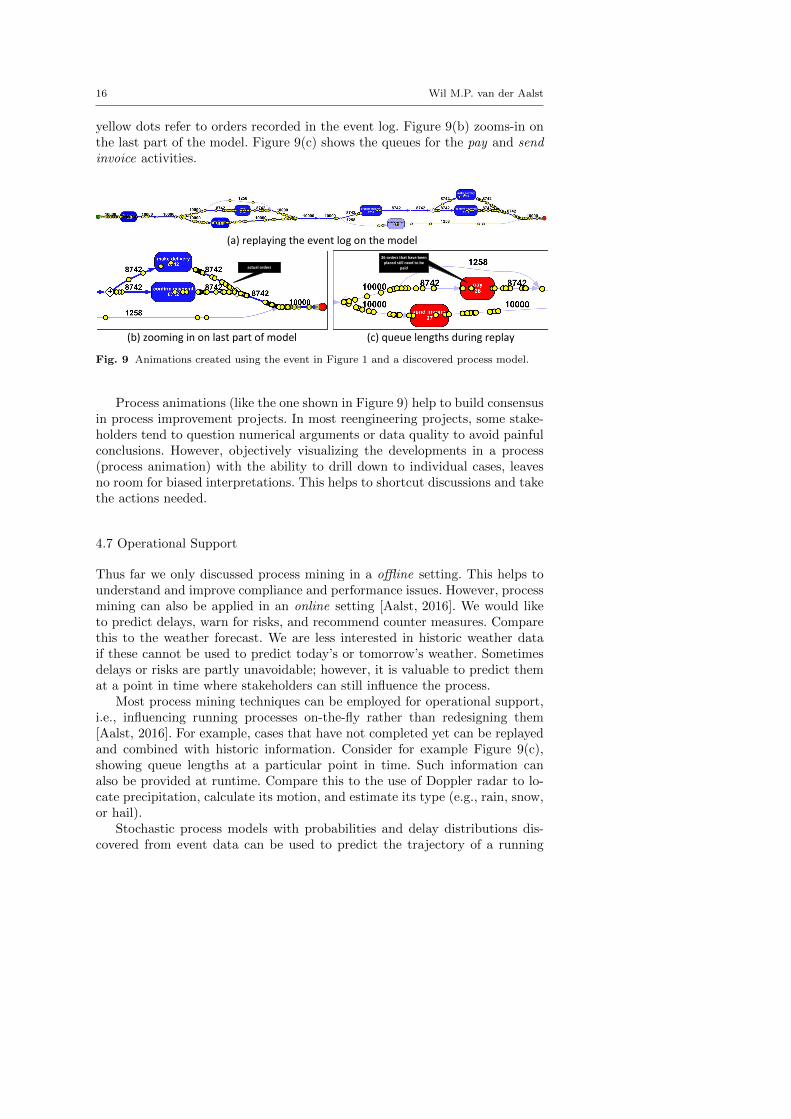
yellow dots refer to orders recorded in the event log. Figure 9(b) zooms-in onthe last part of the model. Figure 9(c) shows the queues for the pay and sendinvoice activities.
(a) replaying the event log on the model
(b) zooming in on last part of model (c) queue lengths during replay
actual orders
26 orders that have been placed still need to be
paid
Fig. 9 Animations created using the event in Figure 1 and a discovered process model.
Process animations (like the one shown in Figure 9) help to build consensusin process improvement projects. In most reengineering projects, some stake-holders tend to question numerical arguments or data quality to avoid painfulconclusions. However, objectively visualizing the developments in a process(process animation) with the ability to drill down to individual cases, leavesno room for biased interpretations. This helps to shortcut discussions and takethe actions needed.
4.7 Operational Support
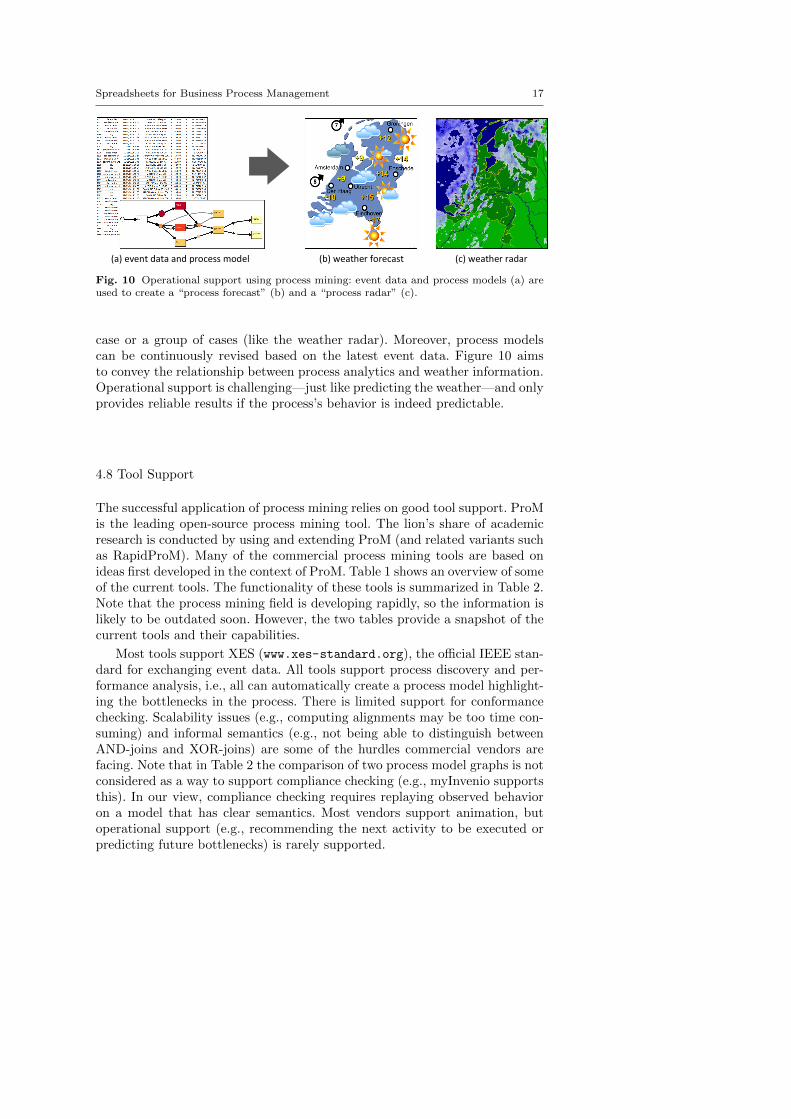
Thus far we only discussed process mining in a offline setting. This helps tounderstand and improve compliance and performance issues. However, processmining can also be applied in an online setting [Aalst, 2016]. We would liketo predict delays, warn for risks, and recommend counter measures. Comparethis to the weather forecast. We are less interested in historic weather dataif these cannot be used to predict today’s or tomorrow’s weather. Sometimesdelays or risks are partly unavoidable; however, it is valuable to predict themat a point in time where stakeholders can still influence the process.
Most process mining techniques can be employed for operational support,i.e., influencing running processes on-the-fly rather than redesigning them[Aalst, 2016]. For example, cases that have not completed yet can be replayedand combined with historic information. Consider for example Figure 9(c),showing queue lengths at a particular point in time. Such information canalso be provided at runtime. Compare this to the use of Doppler radar to lo-cate precipitation, calculate its motion, and estimate its type (e.g., rain, snow,or hail).
Stochastic process models with probabilities and delay distributions dis-covered from event data can be used to predict the trajectory of a running
Spreadsheets for Business Process Management 17
(a) event data and process model (b) weather forecast (c) weather radar
Fig. 10 Operational support using process mining: event data and process models (a) areused to create a “process forecast” (b) and a “process radar” (c).
case or a group of cases (like the weather radar). Moreover, process modelscan be continuously revised based on the latest event data. Figure 10 aimsto convey the relationship between process analytics and weather information.Operational support is challenging—just like predicting the weather—and onlyprovides reliable results if the process’s behavior is indeed predictable.
4.8 Tool Support
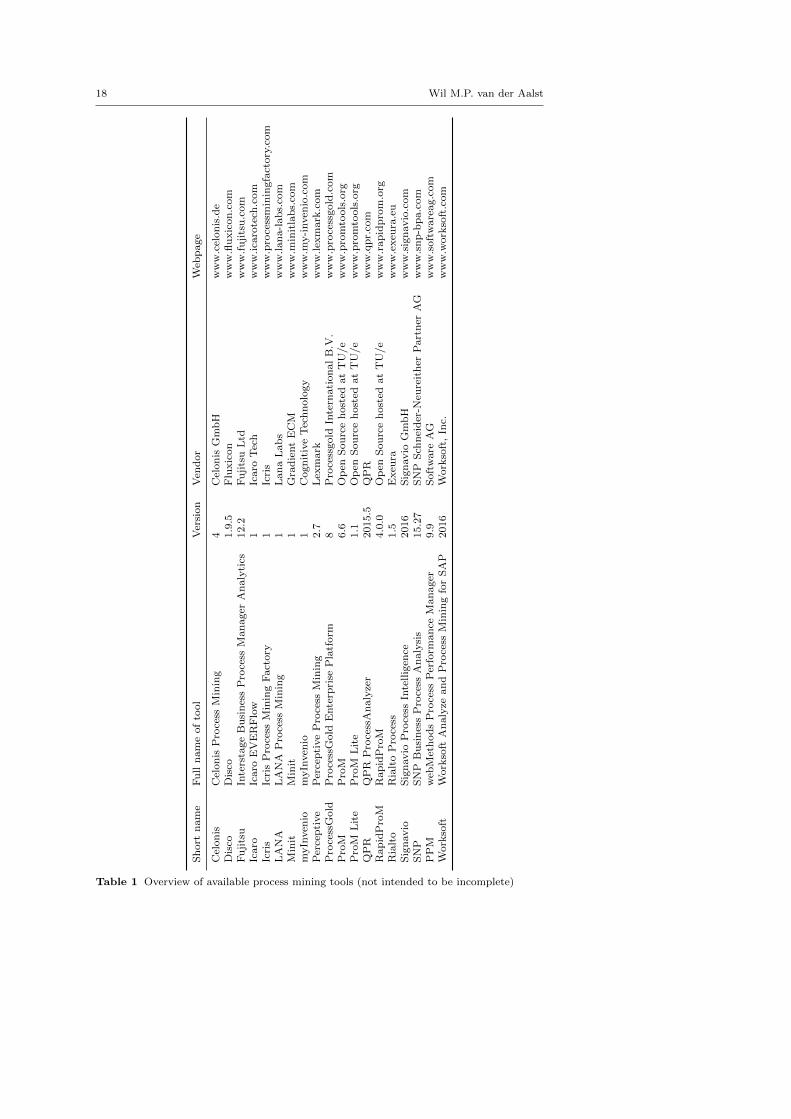
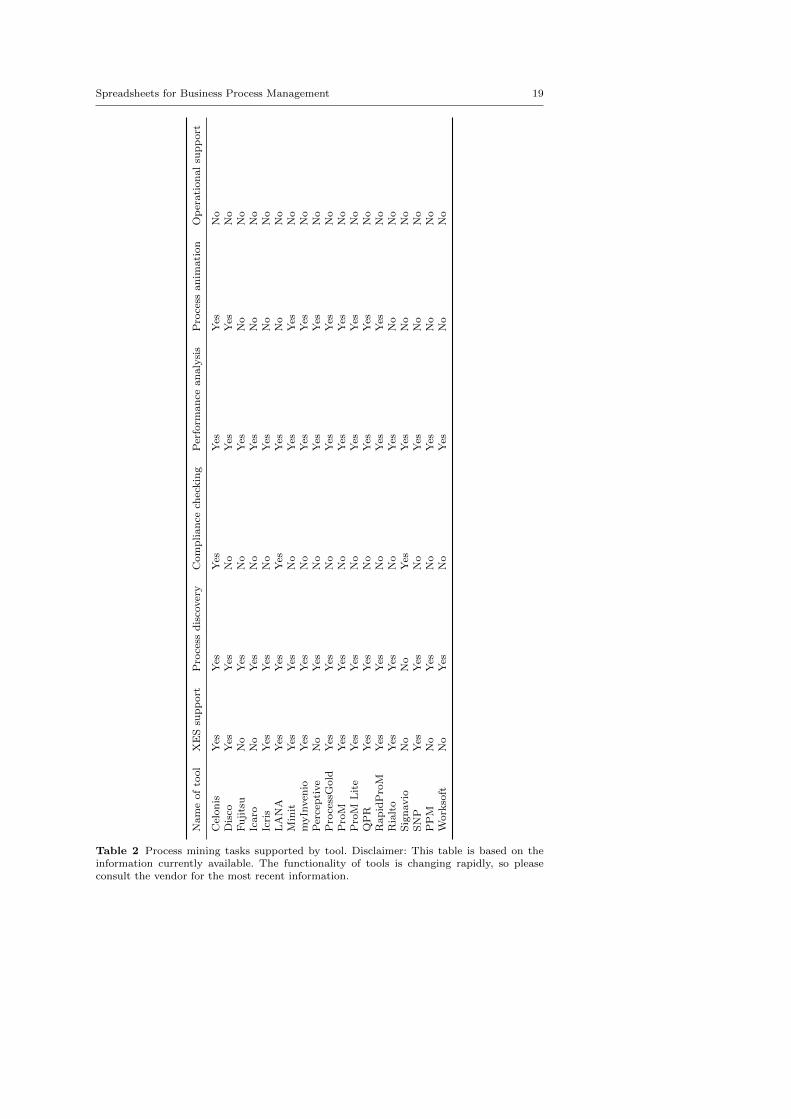
The successful application of process mining relies on good tool support. ProMis the leading open-source process mining tool. The lion’s share of academicresearch is conducted by using and extending ProM (and related variants suchas RapidProM). Many of the commercial process mining tools are based onideas first developed in the context of ProM. Table 1 shows an overview of someof the current tools. The functionality of these tools is summarized in Table 2.Note that the process mining field is developing rapidly, so the information islikely to be outdated soon. However, the two tables provide a snapshot of thecurrent tools and their capabilities.
Most tools support XES (www.xes-standard.org), the official IEEE stan-dard for exchanging event data. All tools support process discovery and per-formance analysis, i.e., all can automatically create a process model highlight-ing the bottlenecks in the process. There is limited support for conformancechecking. Scalability issues (e.g., computing alignments may be too time con-suming) and informal semantics (e.g., not being able to distinguish betweenAND-joins and XOR-joins) are some of the hurdles commercial vendors arefacing. Note that in Table 2 the comparison of two process model graphs is notconsidered as a way to support compliance checking (e.g., myInvenio supportsthis). In our view, compliance checking requires replaying observed behavioron a model that has clear semantics. Most vendors support animation, butoperational support (e.g., recommending the next activity to be executed orpredicting future bottlenecks) is rarely supported.
18 Wil M.P. van der Aalst
Sh
ort
nam
eF
ull
nam
eof
tool
Ver
sion
Ven
dor
Web
page
Cel
on
isC
elon
isP
roce
ssM
inin
g4
Cel
on
isG
mb
Hw
ww
.cel
on
is.d
eD
isco
Dis
co1.9
.5F
luxic
on
ww
w.fl
uxic
on
.com
Fu
jits
uIn
ters
tage
Bu
sin
ess
Pro
cess
Man
ager
An
aly
tics
12.2
Fu
jits
uL
tdw
ww
.fu
jits
u.c
om
Icaro
Icaro
EV
ER
Flo
w1
Icaro
Tec
hw
ww
.ica
rote
ch.c
om
Icri
sIc
ris
Pro
cess
Min
ing
Fact
ory
1Ic
ris
ww
w.p
roce
ssm
inin
gfa
ctory
.com
LA
NA
LA
NA
Pro
cess
Min
ing
1L
an
aL
ab
sw
ww
.lan
a-l
ab
s.co
mM
init
Min
it1
Gra
die
nt
EC
Mw
ww
.min
itla
bs.
com
myIn
ven
iom
yIn
ven
io1
Cogn
itiv
eT
ech
nolo
gy
ww
w.m
y-i
nven
io.c
om
Per
cep
tive
Per
cep
tive
Pro
cess
Min
ing
2.7
Lex
mark
ww
w.lex
mark
.com
Pro
cess
Gold
Pro
cess
Gold
Ente
rpri
seP
latf
orm
8P
roce
ssgold
Inte
rnati
on
al
B.V
.w
ww
.pro
cess
gold
.com
Pro
MP
roM
6.6
Op
enS
ou
rce
host
edat
TU
/e
ww
w.p
rom
tools
.org
Pro
ML
ite
Pro
ML
ite
1.1
Op
enS
ou
rce
host
edat
TU
/e
ww
w.p
rom
tools
.org
QP
RQ
PR
Pro
cess
An
aly
zer
2015.5
QP
Rw
ww
.qp
r.co
mR
ap
idP
roM
Rap
idP
roM
4.0
.0O
pen
Sou
rce
host
edat
TU
/e
ww
w.r
ap
idp
rom
.org
Ria
lto
Ria
lto
Pro
cess
1.5
Exeu
raw
ww
.exeu
ra.e
uS
ign
avio
Sig
navio
Pro
cess
Inte
llig
ence
2016
Sig
navio
Gm
bH
ww
w.s
ign
avio
.com
SN
PS
NP
Bu
sin
ess
Pro
cess
An
aly
sis
15.2
7S
NP
Sch
nei
der
-Neu
reit
her
Part
ner
AG
ww
w.s
np
-bp
a.c
om
PP
Mw
ebM
eth
od
sP
roce
ssP
erfo
rman
ceM
an
ager
9.9
Soft
ware
AG
ww
w.s
oft
ware
ag.c
om
Work
soft
Work
soft
An
aly
zean
dP
roce
ssM
inin
gfo
rS
AP
2016
Work
soft
,In
c.w
ww
.work
soft
.com
Table 1 Overview of available process mining tools (not intended to be incomplete)
Spreadsheets for Business Process Management 19
Nam
eof
tool
XE
Ssu
pp
ort
Pro
cess
dis
cover
yC
om
plian
cech
eckin
gP
erfo
rman
cean
aly
sis
Pro
cess
an
imati
on
Op
erati
on
al
sup
port
Cel
on
isY
esY
esY
esY
esY
esN
oD
isco
Yes
Yes
No
Yes
Yes
No
Fu
jits
uN
oY
esN
oY
esN
oN
oIc
aro
No
Yes
No
Yes
No
No
Icri
sY
esY
esN
oY
esN
oN
oL
AN
AY
esY
esY
esY
esN
oN
oM
init
Yes
Yes
No
Yes
Yes
No
myIn
ven
ioY
esY
esN
oY
esY
esN
oP
erce
pti
ve
No
Yes
No
Yes
Yes
No
Pro
cess
Gold
Yes
Yes
No
Yes
Yes
No
Pro
MY
esY
esN
oY
esY
esN
oP
roM
Lit
eY
esY
esN
oY
esY
esN
oQ
PR
Yes
Yes
No
Yes
Yes
No
Rap
idP
roM
Yes
Yes
No
Yes
Yes
No
Ria
lto
Yes
Yes
No
Yes
No
No
Sig
navio
No
No
Yes
Yes
No
No
SN
PY
esY
esN
oY
esN
oN
oP
PM
No
Yes
No
Yes
No
No
Work
soft
No
Yes
No
Yes
No
No
Table 2 Process mining tasks supported by tool. Disclaimer: This table is based on theinformation currently available. The functionality of tools is changing rapidly, so pleaseconsult the vendor for the most recent information.
20 Wil M.P. van der Aalst
As mentioned, tables 1 and 2 merely provide a snapshot. However, theyillustrate the emergence of a new class of tools able to analyze event data ina truly generic manner.
5 Conclusion
Just like spreadsheet software, process mining aims to provide a generic ap-proach not restricted to a particular application domain. Whereas spreadsheetsfocus on numbers, process mining focuses on events. There have been some at-tempts to extend spreadsheets with process mining capabilities. For example,QPR’s ProcessAnalyzer can be deployed as an Excel add-in. However, pro-cesses and events are very different from bar/pie charts and numbers. Processmodels and concepts related to cases, events, activities, timestamps, and re-sources need to be treated as first-class citizens during analysis. Data miningtools and spreadsheet programs take as input any tabular data without dis-tinguishing between these key concepts. As a result, such tools tend to beprocess-agnostic.
5.1 Comparison of Concepts
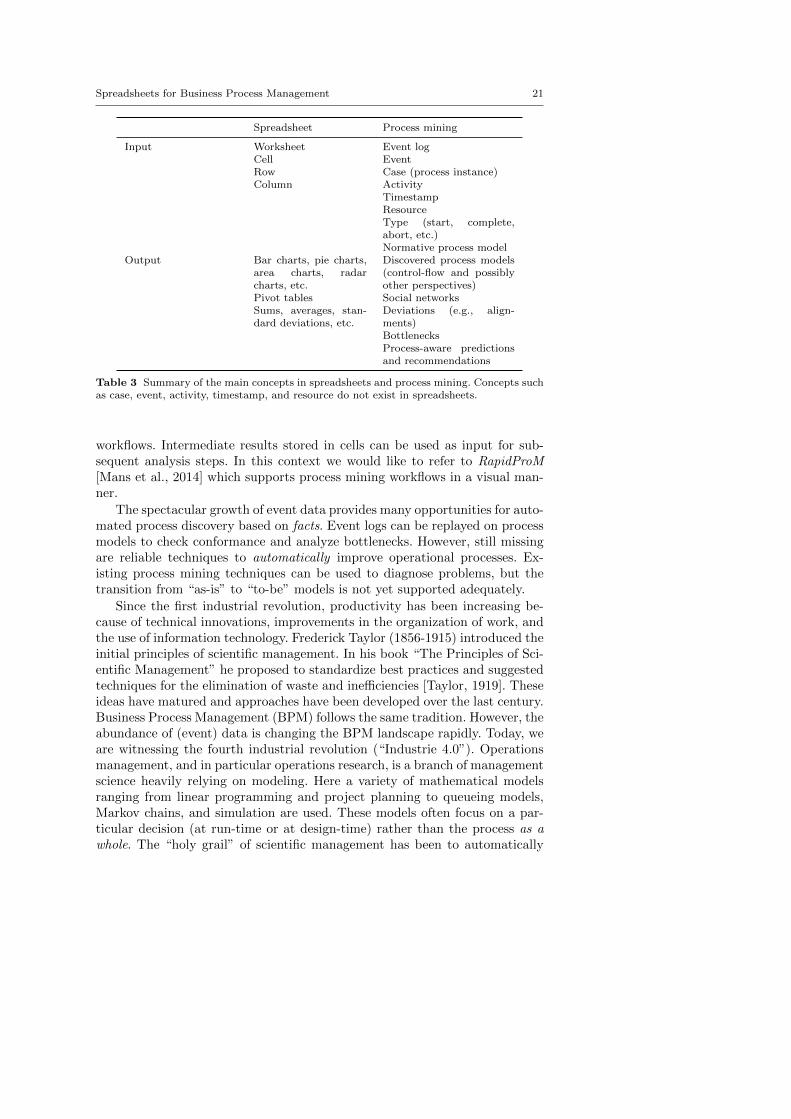
Table 3 summarizes some of the main concepts in spreadsheets and processmining. The event notion does not exist in spreadsheets. Spreadsheets can pro-duce a variety of charts, but cannot discover a process model from event data.The input for process mining is an event log that consists of events groupedin cases. Each case (also called process instance) is described by a sequenceof events. Events may have any number of attributes. Each event refers toan activity and has a timestamp. An event may also refer to a resource (per-son, machine, software component, etc.) and carry transactional information(start, complete, suspend, etc.). Based on event data a process model can bediscovered showing bottlenecks, mainstream behavior, exceptional executionpaths, etc. A process model can also be given as input to conduct conformancechecking or to enrich or repair process models. Any type of process model canbe used as long as it can be related to sequences of events. Table 3 shows thatdiscovered models, social networks, compliance diagnostics, predictions, andrecommendations are possible outputs of process mining activities. The tablealso shows that the concepts are as generic as the concepts one can find in aspreadsheet.
5.2 Challenges
Still we can learn from spreadsheets and improve the accessibility of processmining. The direct manipulation of data combined with a large repertoire offunctions is very powerful. Moreover, spreadsheets implicity encode analysis
Spreadsheets for Business Process Management 21
Spreadsheet Process mining
Input Worksheet Event logCell EventRow Case (process instance)Column Activity
TimestampResourceType (start, complete,abort, etc.)Normative process model
Output Bar charts, pie charts,area charts, radarcharts, etc.
Discovered process models(control-flow and possiblyother perspectives)
Pivot tables Social networksSums, averages, stan-dard deviations, etc.
Deviations (e.g., align-ments)BottlenecksProcess-aware predictionsand recommendations
Table 3 Summary of the main concepts in spreadsheets and process mining. Concepts suchas case, event, activity, timestamp, and resource do not exist in spreadsheets.
workflows. Intermediate results stored in cells can be used as input for sub-sequent analysis steps. In this context we would like to refer to RapidProM[Mans et al., 2014] which supports process mining workflows in a visual man-ner.
The spectacular growth of event data provides many opportunities for auto-mated process discovery based on facts. Event logs can be replayed on processmodels to check conformance and analyze bottlenecks. However, still missingare reliable techniques to automatically improve operational processes. Ex-isting process mining techniques can be used to diagnose problems, but thetransition from “as-is” to “to-be” models is not yet supported adequately.
Since the first industrial revolution, productivity has been increasing be-cause of technical innovations, improvements in the organization of work, andthe use of information technology. Frederick Taylor (1856-1915) introduced theinitial principles of scientific management. In his book “The Principles of Sci-entific Management” he proposed to standardize best practices and suggestedtechniques for the elimination of waste and inefficiencies [Taylor, 1919]. Theseideas have matured and approaches have been developed over the last century.Business Process Management (BPM) follows the same tradition. However, theabundance of (event) data is changing the BPM landscape rapidly. Today, weare witnessing the fourth industrial revolution (“Industrie 4.0”). Operationsmanagement, and in particular operations research, is a branch of managementscience heavily relying on modeling. Here a variety of mathematical modelsranging from linear programming and project planning to queueing models,Markov chains, and simulation are used. These models often focus on a par-ticular decision (at run-time or at design-time) rather than the process as awhole. The “holy grail” of scientific management has been to automatically
22 Wil M.P. van der Aalst
improve operational processes, i.e., to observe a process as it is unfolding andus this to provide clear and reliable suggestions for improvement. Although thepractical value of evidence-based automated process optimization is evident,it has only been realized for rather specific operational decisions. However,the omnipresence of event data and the availability of reliable and fast processmining techniques make it possible to discover faithful control-flow models andto align reality with these discovered models. This creates new opportunitiesfor scientific management.
The focus of future process mining research should be on automaticallyimproving processes by changing the underlying process models or by bettercontrolling existing ones. How to do this?
– Starting point should be the discovered as-is models. These models andthe event data can be used for comparative process mining. Given multiplevariants of the same process, the same process in different periods, or dif-ferent types of cases within the same process, we can discover characteristiccommonalities and differences while exploiting the underlying event data.This provides novel diagnostic information aiming at better understandingthe factors influencing performance.
– The as-is model can also be used for predictive analytics, e.g., predictingthe remaining flow time for a running case or recommending a suitableresource at run-time.
– It is also possible to combine the as-is model with so-called change con-straints. Here also domain knowledge is used to determine the “degrees offreedom” in redesign. To automatically suggest improved process designs,as-is models, event data, change constraints, and goals are used as input.The resulting (hopefully) improved to-be process models can be evaluatedusing a combination of real event data and simulated event data.
The overall approach envisioned supports a data-driven approach to automat-ically improve process performance. This goes far beyond existing approachesthat only support “what-if” analysis and require experts to model the process.
In conclusion, we promoted process mining as a generic technology on theinterface between data science and Business Process Management (BPM). Wehope that process mining will become the “tail wagging the dog” (with the dogbeing Big Data initiatives) and play a role comparable to spreadsheets. Thismay seem unrealistic, but there is a clear need to bridge the gap between datascience and process management. Process mining provides the glue connectingboth worlds, but there is room for improvement. As indicated, the challengeis to move from diagnostics to semi-automated process improvement. Processmining comes in three principal flavors: descriptive, predictive and prescrip-tive. The focus has been on descriptive analytics. Now it is time to focus onpredictive and prescriptive analytics. Process mining tools like ProM alreadysupport techniques like prediction. However, process mining for prescriptiveanalytics is still a rather unexplored territory in BPM.
Spreadsheets for Business Process Management 23
References
[Aalst, 2013] Aalst, W.M.P. van der 2013. Business Process Management: A ComprehensiveSurvey. ISRN Software Engineering, pages 1–37. doi:10.1155/2013/507984.
[Aalst, 2014] Aalst, W.M.P. van der 2014. Data Scientist: The Engineer of the Future.In Mertins, K., F. Benaben, R. Poler, & J. Bourrieres (eds), Proceedings of the I-ESAConference, volume 7 of Enterprise Interoperability, pages 13–28. Springer-Verlag, Berlin.
[Aalst, 2016] Aalst, W.M.P. van der 2016. Process Mining: Data Science in Action. Springer-Verlag, Berlin.
[Aalst et al., 2012] Aalst, W.M.P. van der, A. Adriansyah, & B. van Dongen 2012. Re-playing History on Process Models for Conformance Checking and Performance Analysis.WIREs Data Mining and Knowledge Discovery, 2(2):182–192.
[Aalst et al., 2000] Aalst, W.M.P. van der, J. Desel, & A. Oberweis (eds) 2000. BusinessProcess Management: Models, Techniques, and Empirical Studies, volume 1806 of LectureNotes in Computer Science. Springer-Verlag, Berlin.
[Aalst & Hee, 2004] Aalst, W.M.P. van der, & K.M. van Hee 2004. Workflow Management:Models, Methods, and Systems. MIT press, Cambridge, MA.
[Becker et al., 2011] Becker, J., M. Kugeler, & M. Rosemann (eds) 2011. Process Manage-ment: A Guide for the Design of Business Processes, International Handbooks on Infor-mation Systems. Springer-Verlag, Berlin.
[Brocke & Rosemann, 2010] Brocke, J. vom, & M. Rosemann (eds) 2010. Handbookon Business Process Management, International Handbooks on Information Systems.Springer-Verlag, Berlin.
[Brocke & Rosemann, 2014] Brocke, J. vom, & M. Rosemann (eds) 2014. Handbook onBusiness Process Management 1: Introduction, Methods, and Information Systems, Inter-national Handbooks on Information Systems. Springer-Verlag, Berlin.
[Ceruzzi, 2003] Ceruzzi, P.E. 2003. A History of Modern Computing. MIT Press.[Dumas et al., 2005] Dumas, M., W.M.P. van der Aalst, & A.H.M. ter Hofstede 2005.
Process-Aware Information Systems: Bridging People and Software through Process Tech-nology. Wiley & Sons.
[Dumas et al., 2013] Dumas, M., M. La Rosa, J. Mendling, & H. Reijers 2013. Fundamentalsof Business Process Management. Springer-Verlag, Berlin.
[Hofstede et al., 2010] Hofstede, A.H.M. ter, W.M.P. van der Aalst, M. Adams, & N. Rus-sell 2010. Modern Business Process Automation: YAWL and its Support Environment.Springer-Verlag, Berlin.
[Jablonski & Bussler, 1996] Jablonski, S., & C. Bussler 1996. Workflow Management: Mod-eling Concepts, Architecture, and Implementation. International Thomson ComputerPress, London, UK.
[Jelen, 2005] Jelen, B. 2005. The Spreadsheet at 25: 25 Amazing Excel Examples thatEvolved from the Invention that Changed the World. Holy Macro! Books.
[Leemans et al., 2014] Leemans, S.J.J., D. Fahland, & W.M.P. van der Aalst 2014. Discov-ering Block-Structured Process Models from Event Logs Containing Infrequent Behaviour.In Lohmann, N., M. Song, & P. Wohed (eds), Business Process Management Workshops,International Workshop on Business Process Intelligence (BPI 2013), volume 171 of Lec-ture Notes in Business Information Processing, pages 66–78. Springer-Verlag, Berlin.
[Leemans et al., 2015] Leemans, S.J.J., D. Fahland, & W.M.P. van der Aalst 2015. ScalableProcess Discovery with Guarantees. In Gaaloul, K., R. Schmidt, S. Nurcan, S. Guerreiro,& Q. Ma (eds), Enterprise, Business-Process and Information Systems Modeling (BPMDS2015), volume 214 of Lecture Notes in Business Information Processing, pages 85–101.Springer-Verlag, Berlin.
[Leymann & Roller, 1999] Leymann, F., & D. Roller 1999. Production Workflow: Conceptsand Techniques. Prentice-Hall PTR, Upper Saddle River, New Jersey, USA.
[Mans et al., 2014] Mans, R., W.M.P. van der Aalst, & E. Verbeek 2014. Supporting ProcessMining Workflows with RapidProM. In Limonad, L., & B. Weber (eds), Business ProcessManagement Demo Sessions (BPMD 2014), volume 1295 of CEUR Workshop Proceedings,pages 56–60. CEUR-WS.org.
[Mattessich, 1964] Mattessich, R. 1964. Simulation of the Firm Through a Budget Com-puter Program. Homewood, R.D. Irwin.
24 Wil M.P. van der Aalst
[Muehlen, 2004] Muehlen, M. zur 2004. Workflow-based Process Controlling: Foundation,Design and Application of workflow-driven Process Information Systems. Logos, Berlin.
[Rakovic et al., 2014] Rakovic, L., M. Sakal, & V. Pavlicevic 2014. Spreadsheets - How ItStarted. International Scientific Journal of Management Information Systems, 9(4):9–14.
[Reichert & Weber, 2012] Reichert, M., & B. Weber 2012. Enabling Flexibility in Process-Aware Information Systems: Challenges, Methods, Technologies. Springer-Verlag, Berlin.
[Smith & Fingar, 2006] Smith, H., & P. Fingar 2006. Business Process Management: TheThird Wave. Meghan Kiffer Press.
[Taylor, 1919] Taylor, F.W. 1919. The Principles of Scientific Management. Harper andBothers Publishers, New York.
[Werf et al., 2010] Werf, J.M.E.M. van der, B.F. van Dongen, C.A.J. Hurkens, & A. Sere-brenik 2010. Process Discovery using Integer Linear Programming. Fundamenta Infor-maticae, 94:387–412.
[Weske, 2007] Weske, M. 2007. Business Process Management: Concepts, Languages, Ar-chitectures. Springer-Verlag, Berlin.
[Zelst et al., 2015] Zelst, S.J. van, B.F. van Dongen, & W.M.P. van der Aalst 2015. ILP-Based Process Discovery Using Hybrid Regions. In Proceedings of the International Work-shop on Algorithms and Theories for the Analysis of Event Data (ATAED 2015), volume1371 of CEUR Workshop Proceedings, pages 47–61. CEUR-WS.org.