Embed Size (px)
Citation preview
Spring Chinook Salmon Hatcheries in the Willamette Basin: Existing Data, Discernable Patterns and Information Gaps
Final Report to:
U.S. Army Corps of Engineers, Task Order NWPPM-09-FH-05
Marc A. Johnson
Thomas A. Friesen
Oregon Department of Fish and Wildlife Corvallis Research Laboratory
28655 Highway 34 Corvallis, Oregon 97333
Keywords: Upper Willamette River, spring Chinook salmon, hatcheries, mitigation,
research, management, evaluation
2
SUMMARY This report has been developed in response to Amendment 0001 to the USACE Special Studies and Evaluations Task Order (NWPPM-09-FH-05), which called for “a comprehensive review of the Willamette Basin spring Chinook hatchery program.” To accomplish this task, we have provided a brief overview of upper Willamette River (UWR) spring Chinook salmon biology, status and management (Chapter 2), followed by an extensive review of existing data, past and present hatchery practices and documents used to define program objectives (Chapter 3). We have incorporated information from a wide range of sources into this review, including data from HMIS, RMIS, published literature, technical reports and direct communications with hatchery managers, biologists, and collaborating researchers. Our findings indicate that UWR spring Chinook salmon hatcheries often, but not always, meet mitigation objectives as measured through juvenile releases and adult returns. Hatchery practices have in many cases served to advance our knowledge of both hatchery and natural production spring Chinook populations, although improvements could be made with respect to data collection, management and analysis. Nevertheless, UWR hatcheries have either been directly involved with or provided support to numerous research efforts that have generated data on adult spring Chinook run sizes, spatial distributions, stock structures, straying rates, production, survivorship, juvenile outmigration, ocean distribution and harvest. We have summarized these data in this report. Our review has also identified numerous critical uncertainties and information gaps related to UWR spring Chinook hatchery programs. We have identified these points through the review of existing data, and developed an exercise to relate these data to previously identified information needs (Chapter 4). Based on our analyses and identification of critical uncertainties, we developed recommendations (Chapter 5) intended to improve the focus and management of UWR spring Chinook hatcheries through research, management and evaluation (RM&E) efforts.

3
TABLE OF CONTENTS
1. Purpose and Scope of this Report 9
2. An Introduction to Upper Willamette River Spring Chinook 10
2.1 Characterization of Upper Willamette River Spring Chinook Salmon (Oncorhynchus tshawytscha) 10
2.2 Past and Present Threats 10
2.3 Mitigation through Hatchery Operations 11
3. An Inventory, Review, and Analysis of Available Data from Upper Willamette River Spring Chinook Hatcheries and Sub-basins 14
3.1 Adult Migrations to the Upper Willamette River 14 3.1.1 Fish Counts at Dams and Broodstock Collection Facilities 14 3.1.2 Occurrence on Natural Spawning Grounds 17 3.1.3 Straying 18 3.2.1 Characterization of Broodstock 22 3.2.1.1 Numbers of Adults Collected, Spawned or Recycled 22 3.2.1.2 Geographic Origin 25 3.2.1.3 Time of Collection 26 3.2.1.3 Age Class Structure 26 3.2.1.4 Length Distributions 26 3.2.1.5 Sex Ratios 27 3.2.1.6 Condition at Time of Collection 28 3.2.1.7 Genetic Diversity 28 3.2.2 Holding Adult Chinook 29 3.2.2.1 Holding Facilities 29 3.2.2.2 Antibiotic Treatments 29 3.2.2.3 Pre-Spawn Mortality 29
3.3 Spawning 30 3.3.1 Data Collected per Individual Spawner 31 3.3.2 Use of Precocial Males (Jacks) 31 3.3.3 Use of Natural Origin Spawners 32 3.3.4 Use of Chemical Treatments 32 3.3.5 Adult Outplanting 32
3.4 Egg Incubation 36 3.4.1 Incubation Facilities and Techniques 36 3.4.2 Numbers of Eggs Incubated 36 3.4.3 Egg and Fry Survival 37
3.5 Juvenile Rearing 40

4
3.5.1 Holding Facilities 41 3.5.2 Feeding 41 3.5.3 Juvenile Fish Health 41 3.5.4 Growth 42
3.6 Marking and Tagging Juveniles 42 3.6.1 Marking 43 3.6.1.1 Adipose Fin Clipping 43 3.6.1.2 Thermal Marking Otoliths 43 3.6.2 Tagging 43 3.6.2.1 PIT Tags 44 3.6.2.2 Coded Wire Tags 44 3.6.2.3 Acoustic Tags 45 3.6.2.4 Elastomer Tags 45
3.7 Juvenile Releases 45 3.7.1 Fry 49 3.7.2 Fingerlings 49 3.7.3 Smolts 50 3.7.4 Release Strategies 51 3.7.4.1 Volitional vs. Forced Releases 51 3.7.4.2 Offsite Releases 51 3.7.4.3 Timing of Releases 52
3.8 Tracking Juvenile Movements and Downstream Migration 52 3.8.1 PIT Tags 54 3.8.2 Acoustic Tags 54 3.8.3 Genetic Tags 54
3.9 Estuary and Plume Studies 55
3.10 Adult Ocean Distribution 55
3.11 Harvest 56
4. Relating Available Data to Research, Management and Evaluation 59
4.1 Context of Analysis 59
4.2 Approach 59
4.3 Results 59
4.4 Implications 60
5. Critical Uncertainties and Recommended Actions 62
5.1 Critical Uncertainties 62
5
5.1.1 Hatchery Program Goals and Objectives 62 5.1.2 Population Characteristics 62 5.1.2.1 Hatchery Origin Populations 62 5.1.2.2 Natural Origin Populations 63 5.1.2.3 Interactions among Populations 63 5.1.3 Effects of Hatchery Practices 64 5.1.4 Causes of Observed Phenomena 65
5.2 Recommended Actions 65 5.2.1 Hatchery Program Goals 66 5.2.2 Expand Baseline Knowledge 66 5.2.3 Evaluate Effects of Hatchery Practices 66 5.2.4 Identify Sources of Variation 67
Acknowledgments 67
References 68
APPENDICES 76
6
LIST OF FIGURES
Figure 3.1. Chinook upstream passage at Willamette Falls, 1946-2009 15
Figure 3.2 Proportion of adult Chinook without an adipose fin clip 15
Figure 3.3. Passage at Leaburg Dam, 1979-2009 16
Figure 3.4a. Number of marked and unmarked Chinook at Leaburg, 2002-2009 16
Figure 3.4b. Number of marked and unmarked Chinook at Willamette Falls,
2002-2009 17
Figure 3.5. Recovery locations for McKenzie Chinook released into the mainstem
Willamette River, 1992-1999 19
Figure 3.6. Probability for "homing" by McKenzie Chinook 21
Figure 3.7a-b. Number of Chinook collected, spawned and outplanted by Marion Forks
and South Santiam hatcheries, 1998-2009 23
Figure 3.7c-d. Number of Chinook collected, spawned and outplanted by McKenzie and
Willamette hatcheries, 1998-2009 24
Figure 3.8. Proportion assigning to 5-year old age class 27
Figure 3.9. Total egg take by UWR hatcheries, 1983-2009 37
Figure 3.10a-b. Egg and fry losses at Marion Forks and South Santiam hatcheries 38
Figure 3.10c-d. Egg and fry losses at McKenzie and Willamette hatcheries 39
Figure 3.11. Unclipped hatchery origin Chinook, 2002-2008 43
Figure 3.12a-b. Production goals, mitigation limits and pounds of spring Chinook
released by Marion Forks and South Santiam hatcheries, 1983-2010. 47
Figure 3.12c-d. Production goals, mitigation limits and pounds of spring Chinook
released by McKenzie and Willamette hatcheries, 1983-2010. 48
Figure 3.13. Annual number of fry, fingerlings and smolt liberated, 1978-2009 49
Figure 3.14. Spring Chinook liberated from each UWR hatchery, 1978-2009 50
Figure 4.1 IQ Index scores for RM&E variables 60
7
LIST OF TABLES
Table 3.1. Logistic regression model parameters for homing by McKenzie Chinook 20
Table 3.2. Number of spring Chinook recycled by UWR hatcheries 20
Table 3.3. Chinook pre-spawning mortality in the Willamette Basin, 2001–2008 30
Table 3.4. Percent broodstock comprised by 3-year old males, 2005-2009 31
Table 3.5a. Number of Chinook outplanted by UWR hatcheries, 1998-2009 34
Table 3.5b. Number of unmarked Chinook outplanted by UWR hatcheries, 1998-2009 35
Table 3.6. Number of eggs taken annually, 1983-2009 36
Table 3.7. Linear regression parameter estimates for percent egg and fry losses 40
Table 3.8. Juvenile releases from McKenzie Hatchery, 1968-2008 53
Table 3.9. Run size of Willamette spring Chinook and harvest, 1995-2009 57
Table 4.1. Information quality metrics 59
8
ACRONYMS USED IN THIS DOCUMENT
AAT – All Adult Transactions
COE (also as USACE) – U.S. Army Corps of Engineers
CWT – Coded Wire Tag
CROOS – Collaborative Research of Oregon Ocean Salmon
BKD – Bacterial Kidney Disease
EFR – Egg and Fry Report
ESU – Evolutionarily Significant Unit
FLR – Fish Liberation Report
GAPS – Genetic Analysis of Pacific Salmon
HGMP – Hatchery Genetic Management Plan
HMIS – Hatchery Management Information System
IHN – Infectious Haematopoietic Necrosis
IQ – Information Quality
JSATS – Juvenile Salmon Acoustic Telemetry System
MPFR – Monthly Ponded Fish Report
NMFS – National Marine Fisheries Service
ODFW – Oregon Department of Fish and Wildlife
PIT – Passive Integrated Transponder (tag)
RM&E – Research, Monitoring and Evaluation
RMPC – Regional Mark Processing Center
RMIS – Regional Mark Information System
RPA – Reasonable and Prudent Alternative
SAFE – Select Area Fisheries Enhancement (Program)
SAR – Smolt to Adult Recruitment
STEP – Salmon and Trout Enhancement Program
USACE (also as COE) – United States Army Corps of Engineers
UWR – Upper Willamette River
9
CHAPTER 1 Purpose and Scope of this Report
The purpose of this report is to provide a comprehensive review of the Oregon Department of Fish and Wildlife’s Willamette River spring Chinook salmon (Oncorhynchus tshawytscha) hatchery programs, as they aim to:
Mitigate for impacts to upper Willamette River (UWR) spring Chinook caused by the construction and operation of Willamette Project dams, in accordance with the “Cooperative Agreement between the United States of America and the State of Oregon for the Operation and Maintenance of Certain Portland District COE Hatcheries” (hereafter referred to as the “Cooperative Agreement”). Provide information necessary to understand hatchery impacts on anadromous fish species listed under the United States Endangered Species Act of 1973.
We reviewed and analyzed information collected through field studies, monitoring programs and routine UWR hatchery operations. We have evaluated data in the context of the Willamette Project Biological Opinion (NMFS 2008), and the Willamette Hatchery Mitigation Program Research, Monitoring, and Evaluation Plan (Peven and Keefe 2010). As suggested by Peven and Keefe (2010), existing UWR hatchery information can serve to inform core management and conservation issues while also identifying critical data needs.
10
CHAPTER 2 An Introduction to Upper Willamette River Spring Chinook 2.1 Characterization of Upper Willamette River Spring Chinook Salmon The Willamette River is the 13th largest river by volume in the United States. Located entirely within the State of Oregon, it drains an area of approximately 12,000 square miles (31,080 km2), and delivers an average 32,000 cubic feet (906,139 L) of water per second to its confluence with the Columbia River. The Willamette River hosts a modestly diverse assemblage of indigenous salmonid fish species, including Chinook salmon, bull trout (Salvelinus confluentus), cutthroat trout (O. clarkii), and resident rainbow trout and steelhead (O. mykiss). Coho salmon (O. kisutch) have been introduced above Willamette Falls on multiple occasions (Myers et al. 2006), and in recent years have become more abundant, though genetic data suggest that the stock currently occupying the basin is of southwest Washington State origin. Within the Willamette Basin, Chinook and steelhead are characterized by multiple temporally isolated populations, defined through seasonal differences for migration into freshwater. However, of these forms, only spring Chinook and winter steelhead are historically native to the basin above Willamette Falls. Fall Chinook and summer steelhead are represented by introduced populations. The Willamette River once produced large numbers of spring Chinook salmon (Mattson 1948, Myers et al. 2006). Based on historical accounts, life history, genetic, and geographical data, Myers et al. (2006) concluded that seven demographically independent populations of spring Chinook once occupied the Willamette River system, spawning in the upper reaches of the Clackamas, Molalla, North Santiam, South Santiam, Calapooia, McKenzie and Middle Fork Willamette river sub-basins. Over the past century, these populations have suffered marked declines in census size, and in the most severe cases (Molalla, Calapooia and upper Middle Fork Willamette), local native populations are believed to have been completely extirpated (WRI 2004, HSRG 2009). Currently, the UWR spring Chinook Evolutionarily Significant Unit (ESU) is listed as “threatened” under the U.S. Endangered Species Act of 1973 (NMFS 2005).
2.2 Past and Present Threats A number of anthropogenic factors are believed to have negatively impacted and possibly contributed to the decline of UWR spring Chinook. These factors have previously been reviewed in detail (McElhany et al. 2004, NMFS 2008), but include: alterations to channel morphology (Gregory 2007), agricultural pesticides (Baldwin et al. 2009), harvest practices (WCCSBRT 1997), introduction of non-native fish species (Hughes and Gammon 1987, WCCSBRT 1997) and the installation of migration barriers (Sheer and Steel 2006). The most visible and widely recognized migration barriers for UWR spring Chinook are the 13 Willamette Project dams present on all major tributaries of the basin. These flood-control and hydro-electric dams, constructed by the U.S. Army Corps of Engineers during 1941-1968, rendered the majority of historical UWR Chinook spawning habitat inaccessible to the species by blocking all upstream passage by salmonids. Large
11
hydroelectric dams can also alter river flow and temperature regimes (Moyle and Mount 2007), inundate spawning grounds (Altman et al. 1997), alter dissolved gas concentrations (Johnson et al. 2007) and reduce spawning gravel recruitment in lower reaches (Moyle and Mount 2007).
2.3 Mitigation through Hatchery Operations To mitigate for lost natural production and reduced sport and commercial harvest opportunities caused by Willamette Project dams, the U. S. Army Corps of Engineers has provided major operational funding to four Oregon Department of Fish and Wildlife (ODFW) hatchery facilities. These facilities are located on the North Santiam River (Marion Forks Hatchery), South Santiam River (South Santiam Hatchery), McKenzie River (McKenzie Hatchery) and Middle Fork Willamette River (Willamette Hatchery). Collectively, UWR hatcheries have released a mean 6,178,390 spring Chinook smolts annually for the past 10 years (data from Hatchery Management Information System - HMIS). The Cooperative Agreement clearly identifies maximum hatchery production levels to be sponsored by the United States Army Corps of Engineers (USACE) for Willamette Project mitigation purposes. These are as follows:
Marion Forks Hatchery – “no more than 84,000 pounds of juvenile Chinook (O. tshawytscha) and steelhead (O. mykiss). The proposed annual production level, as mutually agreed to by the state and Corps, fully meets the Corps’ mitigation responsibility for lost salmon and steelhead spawning and rearing habitat on the North Santiam River upstream of the Minto Egg Taking Facility which includes Detroit and Big Cliff dams.” South Santiam Hatchery – “…annual production of a maximum of 71,000 pounds of juvenile Chinook (O. tshawytscha) and steelhead (O. mykiss) excluding gradeouts. This poundage level will be sufficient to maintain the hatchery equivalent of the production, including harvest, from the 1,400 lost wild spring Chinook spawners and 700 lost wild steelhead spawners above Foster Dam.” McKenzie Hatchery – “…a maximum of 80,800 pounds of juvenile spring Chinook (Oncorhynchus tshawytscha). This poundage will be sufficient to maintain the hatchery equivalent of the production, including harvest, from the 4,060 lost wild spring Chinook spawners which returned to the areas above Cougar and Blue River dams.” Willamette Hatchery – “…annual production of no more than 235,000 pounds of juvenile Chinook (O. tshawytscha) and steelhead (O. mykiss) excluding gradeouts. The proposed annual production level, as mutually agreed to by the State and Corps, fully meets the Corps’ mitigation responsibility for lost salmon and steelhead spawning and rearing habitat upstream of Dexter Dam which includes Lookout Point and Hills Creek dams.”
12
While hatchery operations have often been deemed essential to both fisheries management and salmon recovery, growing concern has focused on the potentially negative impacts that hatcheries may have on wild populations. For example, hatchery fish may impose a wide range of ecological threats to native species (including conspecifics) by directly competing for food, space and other resources (Kostow 2009). They may also function as disease vectors (O’Connor and Hoffnagle 2007) and attract predators (Wiese et al. 2008). A growing body of evidence further suggests that unintended artificial selection and broodstock management practices may reduce the reproductive fitness and genetic diversity of hatchery populations (Kostow et al. 2003, Kostow 2004, Moyer et al. 2007, Nordeide 2007, Wedekind et al. 2007, Araki et al. 2009). Deleterious genetic effects carry the greatest consequences when introgression occurs between hatchery and wild populations, as may occur through hatchery straying or deliberate broodstock integration and supplementation (e.g. outplanting). In recent years, UWR hatcheries have outplanted adult Chinook above Willamette Project dams with the intent to re-establish sustainable populations in historic spring Chinook habitat and provide a prey base for other native salmonids (discussed further in Section 3.3.5). In some instances, natural origin Chinook have been incorporated into these programs. These activities present additional threats to UWR spring Chinook, through direct mortality associated with 1) adult holding and transport, 2) juvenile passage through project turbines or spillways and 3) predation by native and non-native piscivores in reservoirs and upper tributaries. Delayed migration through reservoirs and dams may also pose a significant threat to juvenile Chinook produced from outplanted adults. These potential threats underscore the need for continued evaluation of UWR spring Chinook hatchery management strategies, and the ability of these programs to monitor their effects on wild populations. Scientific evaluation of any hatchery program must proceed in the context of clearly defined goals and objectives, taking into account the ecological and genetic impacts that hatcheries impose on wild populations (Waples 1999). As stated by ODFW’s draft Hatchery Genetic Management Plans (HGMPs), goals common to UWR spring Chinook hatcheries are:
1. Mitigate the loss of spring Chinook salmon catch in sport and commercial fisheries caused by construction of Willamette Project dams;
2. Provide adequate adult returns to the hatchery to maintain the broodstock to perpetuate program goals as outlined in Subbasin Fish Management Plans (Oregon Administrative Record 635-500-1666); and
3. Maintain an integrated or appropriate broodstock for ongoing and future population conservation and recovery efforts throughout the subbasin, including potential outplanting above Willamette Project dams.
We emphasize that, at the time of this report, draft HGMPs are still under development and review, and goals identified by these documents may be subject to change prior to finalization.

13
HGMP goals are reiterated in Peven and Keefe (2010), and in Chapter 2 of the Willamette Project Biological Opinion (NMFS 2008). However, Chapter 5 of the Willamette Project Biological Opinion (NMFS 2008) states that the two primary hatchery management goals for the UWR ESU are to:
1) Minimize hatchery effects immediately in the two populations with relatively healthy runs and quality habitat that is still accessible (i.e. above Leaburg Dam on the McKenzie River and above North Fork Dam on the Clackamas River) and;
2) Use the hatchery program to re-establish runs above currently impassable dams into historical habitat in specific populations where appropriate.
Although the goals identified in Chapter 5 of the Willamette Project Biological Opinion might be met concurrently with goals identified by other pertinent documents (and Chapter 2 of the Biological Opinion), there is an apparent need for resolution of priority for hatchery management goals. Without such resolution, priority conflicts could impair objective program evaluations.
14
CHAPTER 3 An Inventory, Review, and Analysis of Available Data from Upper Willamette River Spring Chinook Hatcheries and Sub-Basins 3.1 Adult Migrations to the Upper Willamette River
3.1.1 Fish Counts at Dams and Broodstock Collection Facilities Through direct observations and digital video records, Oregon Department of Fish and Wildlife biologists monitor the upstream passage of adult, jack and minijack (Beckman and Larson 2005) spring Chinook salmon at multiple sites throughout the upper Willamette River basin. Principal among these sites are:
- Willamette Falls Passage Facility – Lower mainstem Willamette River - Bennett Dams complex – North Santiam River - South Santiam Hatchery – South Santiam River - Leaburg Dam – McKenzie River - Fall Creek fishway – upper Middle Fork Willamette River - Dexter Dam –Middle Fork Willamette River
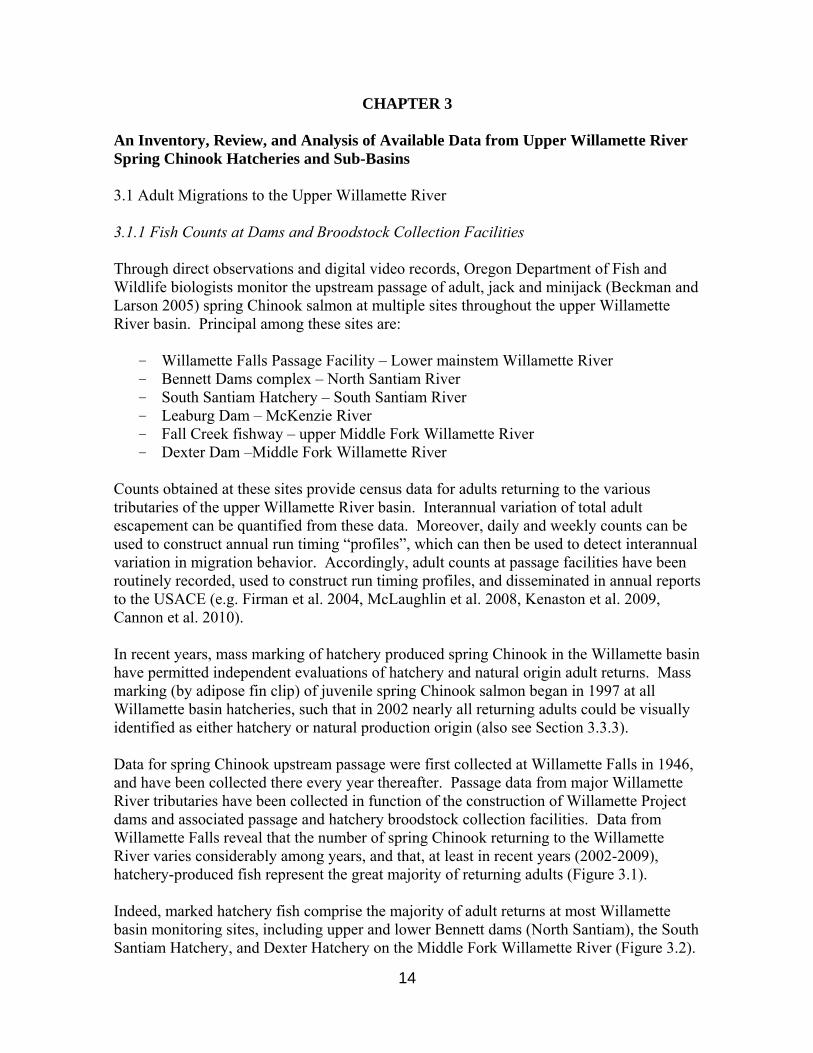
Counts obtained at these sites provide census data for adults returning to the various tributaries of the upper Willamette River basin. Interannual variation of total adult escapement can be quantified from these data. Moreover, daily and weekly counts can be used to construct annual run timing “profiles”, which can then be used to detect interannual variation in migration behavior. Accordingly, adult counts at passage facilities have been routinely recorded, used to construct run timing profiles, and disseminated in annual reports to the USACE (e.g. Firman et al. 2004, McLaughlin et al. 2008, Kenaston et al. 2009, Cannon et al. 2010). In recent years, mass marking of hatchery produced spring Chinook in the Willamette basin have permitted independent evaluations of hatchery and natural origin adult returns. Mass marking (by adipose fin clip) of juvenile spring Chinook salmon began in 1997 at all Willamette basin hatcheries, such that in 2002 nearly all returning adults could be visually identified as either hatchery or natural production origin (also see Section 3.3.3). Data for spring Chinook upstream passage were first collected at Willamette Falls in 1946, and have been collected there every year thereafter. Passage data from major Willamette River tributaries have been collected in function of the construction of Willamette Project dams and associated passage and hatchery broodstock collection facilities. Data from Willamette Falls reveal that the number of spring Chinook returning to the Willamette River varies considerably among years, and that, at least in recent years (2002-2009), hatchery-produced fish represent the great majority of returning adults (Figure 3.1). Indeed, marked hatchery fish comprise the majority of adult returns at most Willamette basin monitoring sites, including upper and lower Bennett dams (North Santiam), the South Santiam Hatchery, and Dexter Hatchery on the Middle Fork Willamette River (Figure 3.2).
However, Fall Creek, a tributary of the Middle Fork Willamette, tends to receive relatively equal numbers of marked and unmarked adult spring Chinook.
Year
1950 1960 1970 1980 1990 2000
Num
ber o
f Spr
ing
Chi
nook
0
20000
40000
60000
80000
100000Marked JacksUnmarked JacksMarked AdultsUnmarked Adults
Figure 3.1. Interannual variation in spring Chinook upstream passage at Willamette Falls, Oregon, 1946-2009. Minijacks not included. Mass-marking (adipose fin-clipping) began in 1997. The first cohort of mass-marked age-4 fish returned in 2002.
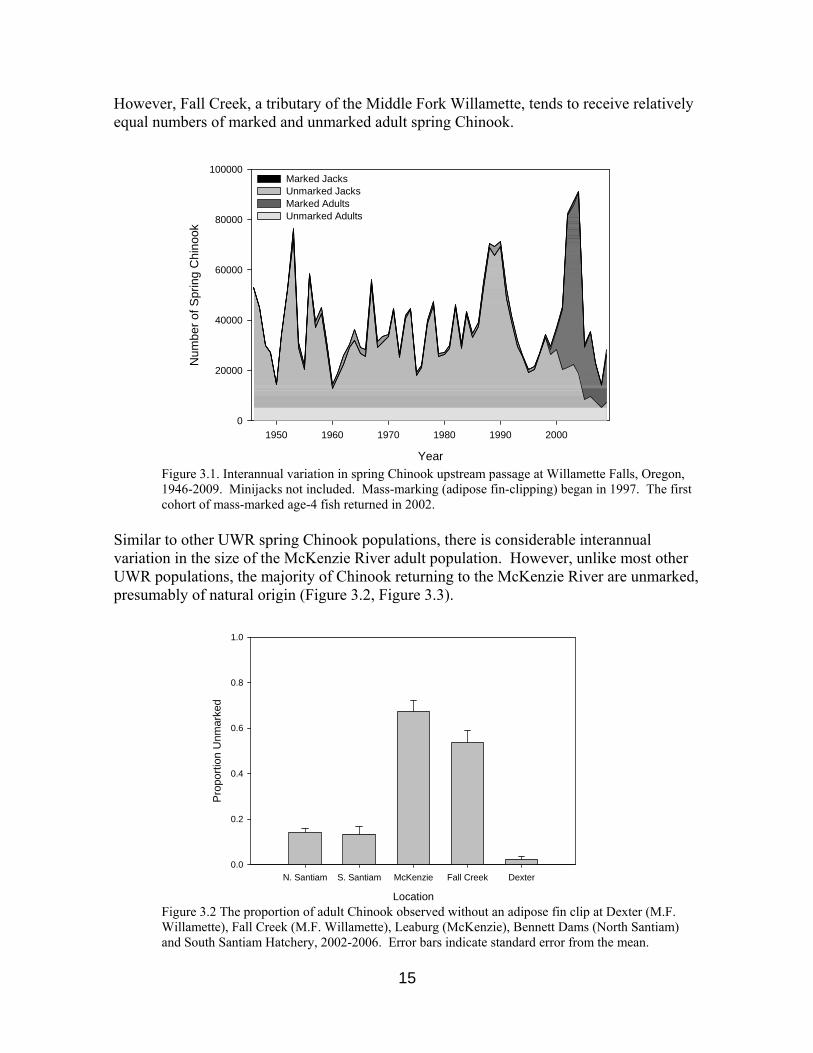
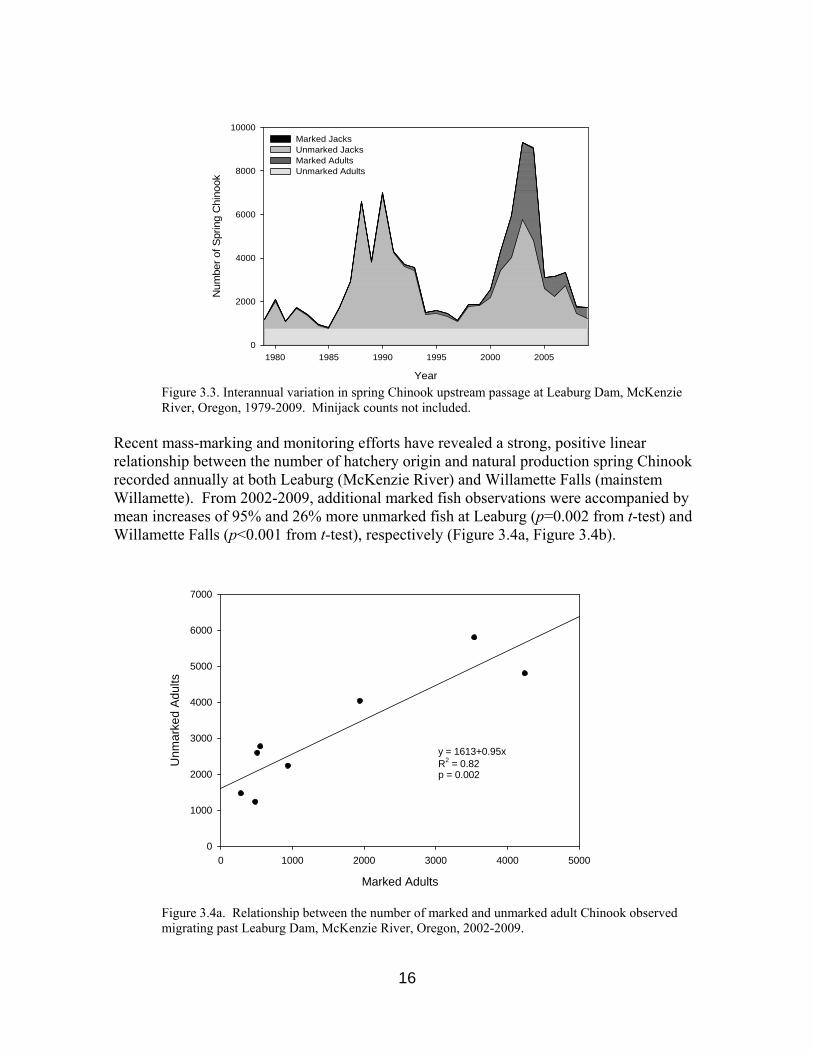
Similar to other UWR spring Chinook populations, there is considerable interannual variation in the size of the McKenzie River adult population. However, unlike most other UWR populations, the majority of Chinook returning to the McKenzie River are unmarked, presumably of natural origin (Figure 3.2, Figure 3.3).
Location
N. Santiam S. Santiam McKenzie Fall Creek Dexter
Pro
porti
on U
nmar
ked
0.0
0.2
0.4
0.6
0.8
1.0
Figure 3.2 The proportion of adult Chinook observed without an adipose fin clip at Dexter (M.F. Willamette), Fall Creek (M.F. Willamette), Leaburg (McKenzie), Bennett Dams (North Santiam) and South Santiam Hatchery, 2002-2006. Error bars indicate standard error from the mean.
15
Year
1980 1985 1990 1995 2000 2005
Num
ber o
f Spr
ing
Chi
nook
0
2000
4000
6000
8000
10000Marked JacksUnmarked JacksMarked AdultsUnmarked Adults
Figure 3.3. Interannual variation in spring Chinook upstream passage at Leaburg Dam, McKenzie River, Oregon, 1979-2009. Minijack counts not included.
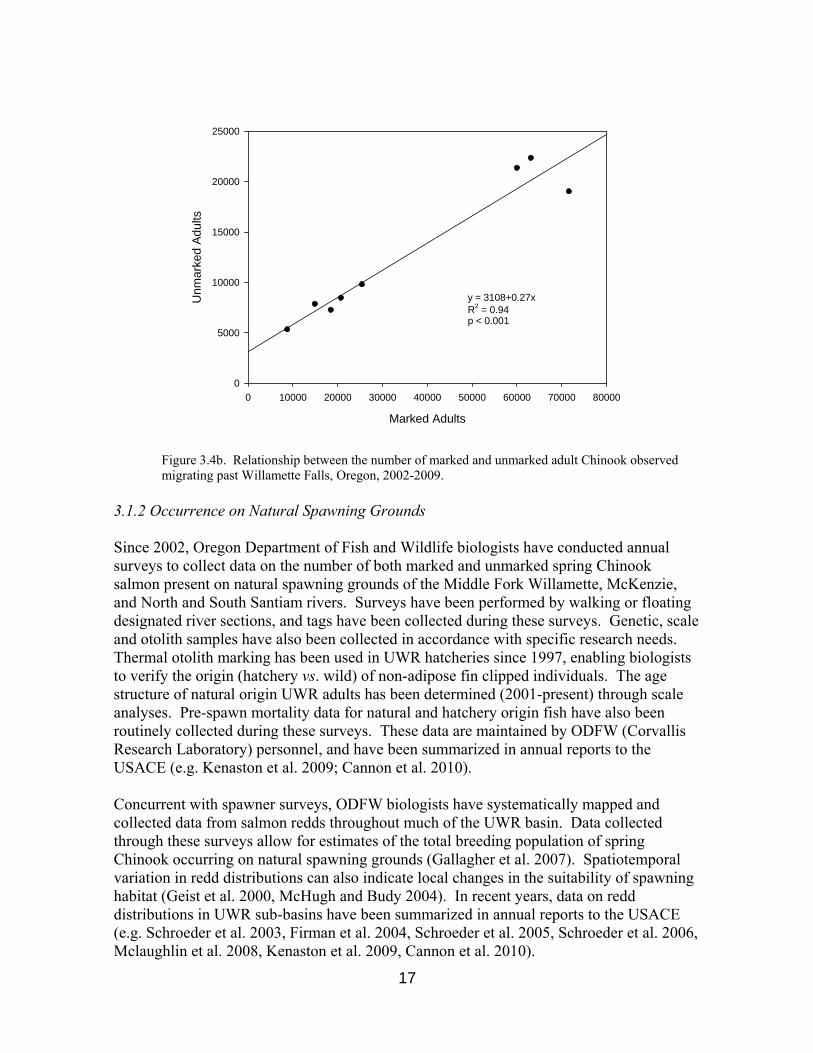
Recent mass-marking and monitoring efforts have revealed a strong, positive linear relationship between the number of hatchery origin and natural production spring Chinook recorded annually at both Leaburg (McKenzie River) and Willamette Falls (mainstem Willamette). From 2002-2009, additional marked fish observations were accompanied by mean increases of 95% and 26% more unmarked fish at Leaburg (p=0.002 from t-test) and Willamette Falls (p<0.001 from t-test), respectively (Figure 3.4a, Figure 3.4b).
Marked Adults
0 1000 2000 3000 4000 5000
Unm
arke
d A
dults
0
1000
2000
3000
4000
5000
6000
7000
y = 1613+0.95xR2 = 0.82p = 0.002
Figure 3.4a. Relationship between the number of marked and unmarked adult Chinook observed migrating past Leaburg Dam, McKenzie River, Oregon, 2002-2009.
16
Marked Adults
0 10000 20000 30000 40000 50000 60000 70000 80000
Unm
arke
d A
dults
0
5000
10000
15000
20000
25000
y = 3108+0.27xR2 = 0.94p < 0.001
Figure 3.4b. Relationship between the number of marked and unmarked adult Chinook observed migrating past Willamette Falls, Oregon, 2002-2009.
3.1.2 Occurrence on Natural Spawning Grounds Since 2002, Oregon Department of Fish and Wildlife biologists have conducted annual surveys to collect data on the number of both marked and unmarked spring Chinook salmon present on natural spawning grounds of the Middle Fork Willamette, McKenzie, and North and South Santiam rivers. Surveys have been performed by walking or floating designated river sections, and tags have been collected during these surveys. Genetic, scale and otolith samples have also been collected in accordance with specific research needs. Thermal otolith marking has been used in UWR hatcheries since 1997, enabling biologists to verify the origin (hatchery vs. wild) of non-adipose fin clipped individuals. The age structure of natural origin UWR adults has been determined (2001-present) through scale analyses. Pre-spawn mortality data for natural and hatchery origin fish have also been routinely collected during these surveys. These data are maintained by ODFW (Corvallis Research Laboratory) personnel, and have been summarized in annual reports to the USACE (e.g. Kenaston et al. 2009; Cannon et al. 2010). Concurrent with spawner surveys, ODFW biologists have systematically mapped and collected data from salmon redds throughout much of the UWR basin. Data collected through these surveys allow for estimates of the total breeding population of spring Chinook occurring on natural spawning grounds (Gallagher et al. 2007). Spatiotemporal variation in redd distributions can also indicate local changes in the suitability of spawning habitat (Geist et al. 2000, McHugh and Budy 2004). In recent years, data on redd distributions in UWR sub-basins have been summarized in annual reports to the USACE (e.g. Schroeder et al. 2003, Firman et al. 2004, Schroeder et al. 2005, Schroeder et al. 2006, Mclaughlin et al. 2008, Kenaston et al. 2009, Cannon et al. 2010).
17
18
3.1.3 Straying Juvenile salmon imprint upon the chemical signatures of their natal streams (Hasler and Wisby 1951, Wisby and Hasler 1954). Most olfactory imprinting appears to take place during the parr-smolt transformation, as juveniles undergo the physiological and behavioral changes that prepare them for seaward migration (Dittman et al. 1994, Dittman et al. 1996). As adults, salmon then utilize olfactory cues to return, or “home”, to their streams (or hatcheries) of origin after spending up to three years in the marine environment. Homing behavior serves to isolate local populations, generate population genetic structure, and presumably favor the retention of locally adaptive traits (Taylor 1991, McDowall 2001). However, in any given population, a small (but variable) percentage of salmon stray into non-natal streams at the time of spawning migration. Straying behavior may represent an evolutionarily stable strategy for the species (Smith 1982), balancing benefits gained through local adaptation with those of gene flow and a mechanism for colonizing vacant yet suitable habitat (Quinn 2005). Although natural production strays are generally difficult to detect, mass-marking programs and coded-wire tags (CWTs) have allowed researchers to identify hatchery strays and determine their hatchery of origin. The Regional Mark Information System (RMIS - http://www.rmpc.org/) serves as a warehouse for CWT data, and represents a powerful resource for identifying hatchery practices that may be correlated with homing and straying behavior. In some instances, such analyses may provide useful information to managers, allowing them to select management strategies that minimize undesirable hatchery-wild interactions.
A number of juvenile release strategies have been used by UWR hatcheries to improve survival and homing rates of hatchery spring Chinook. Utilizing RMIS, we downloaded the following information for all tagged McKenzie Hatchery spring Chinook released as smolts from 1978-2005: release site, release date, broodyear, and release type (forced vs. volitional). We then downloaded the following data for all tagged McKenzie Hatchery adults collected from spawning grounds, hatcheries and broodstock collection facilities for years 1980-2009: sex, length, collection date (including year), and collection location. By aligning tag data of releases and recoveries, we calculated the age of recovered fish (recovery year minus broodyear) and determined whether each adult Chinook had homed to the sub-basin into which it had been outplanted as a smolt, or strayed at time of return migration.
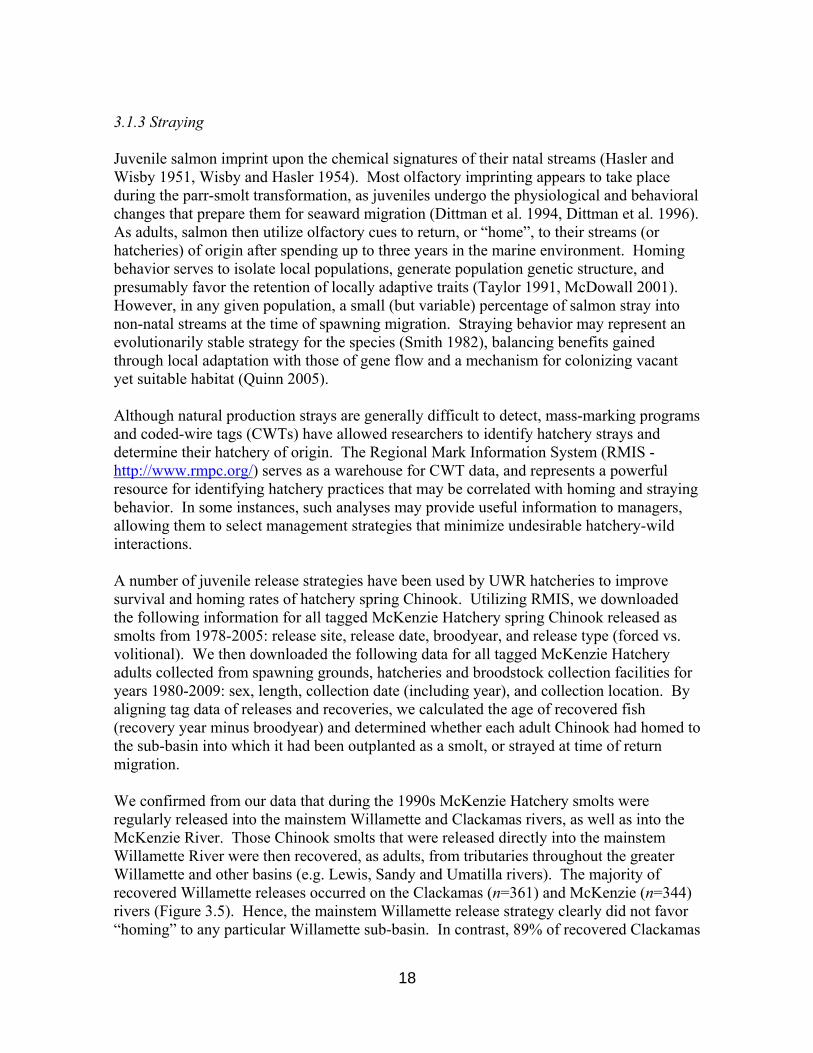
We confirmed from our data that during the 1990s McKenzie Hatchery smolts were regularly released into the mainstem Willamette and Clackamas rivers, as well as into the McKenzie River. Those Chinook smolts that were released directly into the mainstem Willamette River were then recovered, as adults, from tributaries throughout the greater Willamette and other basins (e.g. Lewis, Sandy and Umatilla rivers). The majority of recovered Willamette releases occurred on the Clackamas (n=361) and McKenzie (n=344) rivers (Figure 3.5). Hence, the mainstem Willamette release strategy clearly did not favor “homing” to any particular Willamette sub-basin. In contrast, 89% of recovered Clackamas
releases (n=1,217) were recovered from the Clackamas sub-basin, and >99% of the recovered McKenzie releases (n=5,977) were recovered from the McKenzie sub-basin. It is important to note that these values do not represent absolute “homing rates”, as homing individuals are presumably recovered at higher rates than strays, which may migrate into unsurveyed river basins.
N. Santiamn = 112
McKenzien = 344
Clackamasn = 361
Willametten = 11
Bonneville-Lewis-Sandyn = 18S. Santiam
n = 47
Figure 3.5. Recovery locations for coded-wire tagged adult spring Chinook reared at McKenzie Hatchery and released as smolts into the mainstem Willamette River, 1992-1999. Numbers of recovered tags indicated below locations.
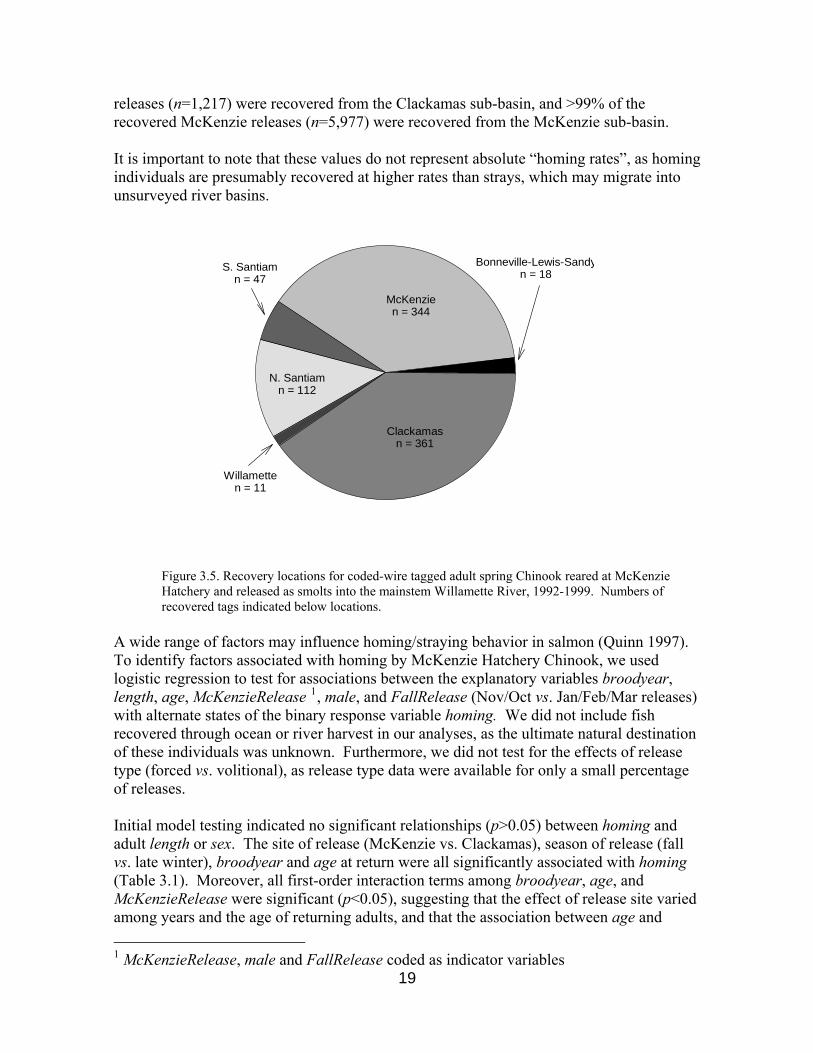
A wide range of factors may influence homing/straying behavior in salmon (Quinn 1997). To identify factors associated with homing by McKenzie Hatchery Chinook, we used logistic regression to test for associations between the explanatory variables broodyear, length, age, McKenzieRelease 1, male, and FallRelease (Nov/Oct vs. Jan/Feb/Mar releases) with alternate states of the binary response variable homing. We did not include fish recovered through ocean or river harvest in our analyses, as the ultimate natural destination of these individuals was unknown. Furthermore, we did not test for the effects of release type (forced vs. volitional), as release type data were available for only a small percentage of releases. Initial model testing indicated no significant relationships (p>0.05) between homing and adult length or sex. The site of release (McKenzie vs. Clackamas), season of release (fall vs. late winter), broodyear and age at return were all significantly associated with homing (Table 3.1). Moreover, all first-order interaction terms among broodyear, age, and McKenzieRelease were significant (p<0.05), suggesting that the effect of release site varied among years and the age of returning adults, and that the association between age and
191 McKenzieRelease, male and FallRelease coded as indicator variables
homing varied among years. Of these interaction terms, broodyear x McKenzieRelease had the greatest effect (coefficient=1.294, p=0.001). We modeled the probability of homing by incorporating all statistically significant main effects variables into the logistic function:
π =)...exp(1
)...exp(
110
110
pp
pp
XXXX
ββββββ
++
+
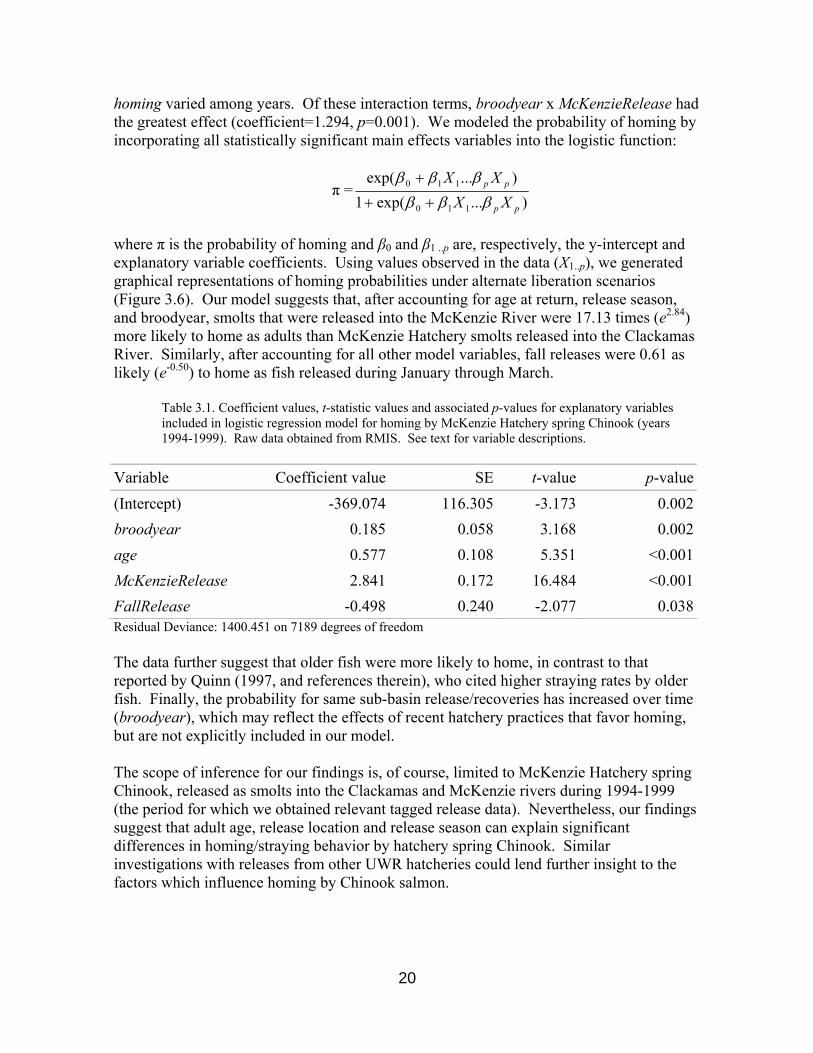
where π is the probability of homing and β0 and β1 ..p are, respectively, the y-intercept and explanatory variable coefficients. Using values observed in the data (X1..p), we generated graphical representations of homing probabilities under alternate liberation scenarios (Figure 3.6). Our model suggests that, after accounting for age at return, release season, and broodyear, smolts that were released into the McKenzie River were 17.13 times (e2.84) more likely to home as adults than McKenzie Hatchery smolts released into the Clackamas River. Similarly, after accounting for all other model variables, fall releases were 0.61 as likely (e-0.50) to home as fish released during January through March.
Table 3.1. Coefficient values, t-statistic values and associated p-values for explanatory variables included in logistic regression model for homing by McKenzie Hatchery spring Chinook (years 1994-1999). Raw data obtained from RMIS. See text for variable descriptions.
Variable Coefficient value SE t-value p-value(Intercept) -369.074 116.305 -3.173 0.002broodyear 0.185 0.058 3.168 0.002age 0.577 0.108 5.351 <0.001McKenzieRelease 2.841 0.172 16.484 <0.001FallRelease -0.498 0.240 -2.077 0.038Residual Deviance: 1400.451 on 7189 degrees of freedom The data further suggest that older fish were more likely to home, in contrast to that reported by Quinn (1997, and references therein), who cited higher straying rates by older fish. Finally, the probability for same sub-basin release/recoveries has increased over time (broodyear), which may reflect the effects of recent hatchery practices that favor homing, but are not explicitly included in our model. The scope of inference for our findings is, of course, limited to McKenzie Hatchery spring Chinook, released as smolts into the Clackamas and McKenzie rivers during 1994-1999 (the period for which we obtained relevant tagged release data). Nevertheless, our findings suggest that adult age, release location and release season can explain significant differences in homing/straying behavior by hatchery spring Chinook. Similar investigations with releases from other UWR hatcheries could lend further insight to the factors which influence homing by Chinook salmon.
20
Year
1993 1994 1995 1996 1997 1998 1999 2000
Pro
babi
lity
of R
ecov
ery
from
Sub
-bas
in o
f Rel
ease
0.5
0.6
0.7
0.8
0.9
1.0
McKenzie spring McKenzie fall Clackamas spring Clackamas fall
Figure 3.6. Probability that an adult McKenzie Hatchery spring Chinook would be recovered from the same basin that it had been released as a smolt, as a function of broodyear (x-axis), season of release, and sub-basin of release (McK=McKenzie, Clack=Clackamas).
3.2 Broodstock Collection and Management Early attempts to artificially propagate spring Chinook from the Clackamas and Upper Willamette rivers began in the late 1800s, with “egg-take stations” operating throughout the greater Willamette River basin (WCCBRT 1997). By the early 1900s, state-sponsored hatchery racks were spawning Chinook on the Clackamas, Santiam, McKenzie, and Middle Fork Willamette rivers. Originally, eggs were incubated at offsite facilities (e.g. Bonneville), but with the construction of Willamette Project hatcheries, spawning, incubating and rearing could be carried out onsite. Until recently, stock transfers among UWR facilities were common, although introductions of non-Willamette spring Chinook stocks to the basin have been rare (SHAG 2003). Broodstock transfers are believed to have largely homogenized Clackamas and UWR Chinook populations (Myers et al. 2006), although the degree of historical population structure is unknown. Hatchery practices, including broodstock collection methods, are also believed to have selected against the early and late components of native UWR spring Chinook runs (WCCBRT 1997). Contemporary broodstock management has been informed by research and monitoring efforts aimed at determining the age, origin (hatchery vs. wild), sex, run timing, genetic composition, condition and morphometrics of Chinook used for spawning. Currently, hatchery management plans aim to minimize genetic differences between hatchery populations and local, naturally reproducing stocks. By minimizing genetic differences between hatchery and natural origin populations, it is believed that deleterious genetic effects from hatchery-wild interactions will be reduced (HSRG 2005). To achieve this goal, each hatchery’s broodstock includes:
21
22
- only fish returning to that hatchery’s sub-basin - individuals collected throughout the temporal distribution of the run - Up to 25% contribution from natural production Chinook, not to exceed 10% of the
total natural run Criteria used to determine when and how to integrate natural origin Chinook into hatchery broodstocks have recently been drafted in the Upper Willamette River Conservation and Recovery Plan for Chinook Salmon and Steelhead (ODFW 2010), though optimal integration practices remain the subject of ongoing research. Information obtained through research focused on hatchery broodstocks serve, in part, to satisfy Reasonable and Prudent Alternatives (RPAs) 9.5, 6.2.2, and 6.2.4 of the Willamette River basin Biological Opinion (NMFS 2008). Information documenting broodstock management are here reviewed in greater detail. 3.2.1 Characterization of Broodstock Prior to 2000, a mixed “Willamette stock” was commonly used by UWR hatcheries in addition to local broodstock sources. In compliance with measures specified by the National Marine Fisheries Service (NMFS) Biological Opinion for Hatchery Programs in the Willamette Basin (NMFS 2008), all broodstocks for UWR spring Chinook hatcheries have been collected locally (within sub-basins) since 2000 (SHAG 2003). Moreover, UWR hatcheries currently aim to incorporate the diversity present in local naturally spawning populations (e.g. age structure, run-timing, lengths, genetic diversity, etc.) into broodstock populations. 3.2.1.1 Numbers of Adults Collected, Spawned or Recycled The numbers of adults collected for broodstock are recorded onto both Monthly Ponded Fish Reports (MPFRs) and All Adult Transactions (AAT) reports. Data from MPFRs and AATs have been stored in HMIS since 1998 and 1984, respectively. Although the number of adult Chinook collected by UWR hatcheries has tended to vary considerably among years, the number of individuals incorporated into each hatchery's brood has remained relatively constant, in accordance with production goals established through Hatchery Operations Plans (HOPs) and the Cooperative Agreement. Among UWR hatcheries, Willamette Hatchery typically collects and spawns the most fish, while Marion Forks Hatchery (North Santiam) tends to collect and spawn the fewest. Numbers of Chinook collected and spawned by all UWR hatcheries for years 1998-2009 are presented in Figures 3.7a-3.7d. The Cooperative Agreement states that hatchery production shall aim to mitigate for estimated losses of 1,400 and 4,060 spring Chinook spawners on the South Santiam and McKenzie rivers, respectively. Similar adult mitigation figures are not stated in the Cooperative Agreement for the North Santiam or Middle Fork Willamette rivers. The sum of adults spawned and outplanted by South Santiam Hatchery typically exceeds this facility’s adult mitigation objective (Figure 3.7b). The number of adults returning to the McKenzie River at Leaburg (Figure 3.3) suggests that adult mitigation objectives are often,
but not always, met in this sub-basin. Regardless of adult return counts to Willamette sub-basins, mitigation production for UWR hatcheries is legally defined through pounds of juveniles released annually (Cooperative Agreement), as discussed in Sections 2.3 and 3.7. a) Marion Forks Hatchery
Year
1996 1998 2000 2002 2004 2006 2008 2010
Num
ber o
f spr
ing
Chi
nook
0
1000
2000
3000
4000
5000
6000CollectedSpawnedSpawned + outplanted
b) South Santiam Hatchery
Year
1996 1998 2000 2002 2004 2006 2008 2010
Num
ber o
f spr
ing
Chi
nook
0
2000
4000
6000
8000
10000
12000
14000
16000CollectedSpawnedSpawned + outplantedAdult Mitigation
Figure 3.7a-b. The number of adult spring Chinook (including jacks) collected, spawned and outplanted by Marion Forks (top) and South Santiam (bottom) hatcheries, 1998-2009. Adult spawner mitigation objectives are plotted for South Santiam Hatchery (1,400 spawners).
Adult Chinook that are not spawned at UWR hatcheries are either released downstream (recycled), dispatched to recover CWTs, provided to tribal organizations, donated to foodshare programs, or released to spawn naturally through adult outplanting programs (usually above USACE Willamette Project dams). Recycling provides additional angling opportunities during years that present a surplus of adult returns, and is primarily conducted
23
on the Santiam rivers. Table 3.2 presents the number of Chinook salmon recycled annually by UWR hatcheries for the period 1998-2009. Adult outplanting programs are discussed in Section 3.3.5. All actions taken with adult Chinook (and precocial individuals) are systematically recorded onto AAT reports. c) McKenzie Hatchery
Year
1996 1998 2000 2002 2004 2006 2008 2010
Num
ber o
f spr
ing
Chi
nook
0
2000
4000
6000
8000
10000CollectedSpawnedSpawned + outplantedAdult Mitigation
d) Willamette Hatchery
Year
1996 1998 2000 2002 2004 2006 2008 2010
Num
ber o
f spr
ing
Chi
nook
0
2000
4000
6000
8000
10000
12000CollectedSpawnedSpawned + outplanted
Figure 3.7c-d. The number of adult spring Chinook (including jacks) collected, spawned and outplanted by McKenzie (top) and Willamette (bottom) hatcheries, 1998-2009. Adult spawner mitigation objectives are plotted for McKenzie Hatchery (4,060 spawners).
24
25
Table 3.2. Number of hatchery spring Chinook recycled by UWR hatcheries, 1998-2009.
Year Marion Forks South Santiam McKenzie Willamette2009 220 427 0 3732008 0 0 0 02007 32 46 0 02006 54 1626 0 02005 108 1216 0 02004 216 5985 0 02003 102 3651 0 02002 68 3196 0 02001 327 2521 0 582000 75 1441 0 01999 0 991 0 01998 0 766 0 653
3.2.1.2 Geographic Origin As recently as 1987, a composite “Willamette Stock”, comprised of spring Chinook from several Willamette River sub-basins, was used to establish the Clackamas Hatchery spring Chinook population. However, contemporary hatchery practices aim to minimize genetic differences between local wild and hatchery populations. Thus, broodstock for the Marion Forks, South Santiam, McKenzie and Middle Fork Willamette spring Chinook hatchery programs are now obtained through collection efforts within each hatchery's respective sub-basin. A brief history of the geographic origin of spring Chinook broodstock for each UWR hatchery is as follows:
Marion Forks Hatchery • 1951: North Santiam stock (stock 021) founded with North Santiam
River spring Chinook • Late 1970s: Introduction of a single generation of Carson River
(WA) stock • 1999 – present: All broodstock collected from the North Santiam
River South Santiam Hatchery
• 1968: South Santiam stock (stock 024) founded with South Santiam River spring Chinook
• 1999 – Present: All broodstock collected from the South Santiam River
McKenzie Hatchery • 1908-1938: A mixed McKenzie/Middle Fork Willamette stock used
for egg take • 1953: Broodstock continues to incorporate Middle Fork Willamette
fish (~30%) • 1965-1974: Continued use of mixed Middle Fork
Willamette/McKenzie stock
26
• 1975: 1.2 million eggs from South Santiam used to supplement mixed “Willamette stock”
• 1990 – Present: All McKenzie Hatchery broodstock (stock 023) collected, spawned and progeny reared at McKenzie Hatchery
Willamette Hatchery • 1954 – Willamette stock (stock 022) founded by adult spring
Chinook returning to the Middle Fork Willamette River • 1992: Received supplemental eggs from Marion Forks Hatchery
(stock 021) • 1999 – Present: All broodstock collected from the Middle Fork
Willamette River
3.2.1.3 Time of Collection UWR hatcheries currently aim to collect broodstock throughout the temporal distribution of the adult spawning migration, which typically begins in May and ends in October. Adult collections are recorded on AAT reports, and have been stored in HMIS since 1984. These data, which directly inform RPA 9.5.1 (NMFS 2008), indicate that temporal variation in adult collection rates generally reflect the bimodal distribution of spring Chinook run timing into UWR sub-basins (Kenaston et al. 2009). 3.2.1.3 Age Class Structure Large fluctuations in age class structure can be cause for concern, as such fluctuations can significantly reduce genetic effective population size in Pacific salmon (Waples 2002) and confound run-size forecasting models (Haeseker et al. 2007). Boatner and Foster (2001) used data from both scale analyses and CWTs collected by UWR hatcheries to compare the age class structures of adult Chinook that returned to UWR hatcheries with those of Chinook that were spawned at UWR hatcheries. In all instances, across years and hatcheries, they found that the dominant year class of returning adults was also represented by the greatest percentage of spawned adults. This study clearly illustrated a potential application of RMIS; to monitor and manage age class structure within UWR hatcheries. An initial step might be to use RMIS to perform tests designed to detect long term trends in UWR hatchery Chinook age class structure. Scales were also collected and analyzed from randomly sampled fish at UWR hatcheries in 2007 and 2008. Results from these data are presented together with those of Boatner and Foster (2001) in Figure 3.8, which illustrates the variable contribution of age-5 fish among years. 3.2.1.4 Length Distributions The fork lengths of all adult Chinook collected at UWR broodstock trapping facilities are routinely measured and recorded. These data are maintained in the HMIS and lengths for fish with CWTs are stored in RMIS.
Using length data from 3,712 natural and hatchery origin UWR spring Chinook sampled in 2007, McLaughlin et al. (2008) reported significant differences for adult mean lengths among most UWR hatcheries, though Marion Forks values were not significantly different from South Santiam. They further reported that “fin-clipped Chinook were larger than unclipped Chinook at Marion Forks and South Santiam hatcheries, whereas unclipped Chinook were larger than fin-clipped Chinook at McKenzie and Willamette hatcheries.” Cannon et al. (2010) found no significant difference in median fork length between marked and unmarked fish used as broodstock by UWR hatcheries in 2009. However, median fork length for marked broodstock was greater at Marion Forks Hatchery than other UWR hatcheries, and hatchery origin broodstock were longer at Willamette Hatchery than at South Santiam Hatchery (Cannon et al. 2010). Again, RMIS could be used to investigate spatiotemporal patterns of UWR adult spring Chinook lengths, though such analyses have not been routinely performed.
1995 1996 1997 1998 1999 2000 2001 2002 2003 2004 2005 2006 2007 2008YEAR
0.0
0.2
0.4
0.6
0.8
Prop
ortio
n 5
Yea
r Old
s
Figure 3.8. Proportion of adults collected at Marion Forks, South Santiam and McKenzie hatcheries that assigned to 5-year old age class, according to CWT and scale analyses, 1995-2000, 2007, and 2008. Data for 2001 is from McKenzie Hatchery only.
3.2.1.5 Sex Ratios The sex of all adult Chinook collected at UWR broodstock trapping facilities are routinely recorded by hatchery personnel onto AAT reports, then transferred to HMIS. Data from coded-wire tagged individuals are stored on the RMIS. The number of males and females incorporated into broodstock are also recorded by UWR hatcheries. No formal analyses of sex ratios observed in UWR collections or broodstocks have been made with long-term datasets.
27
28
3.2.1.6 Condition at Time of Collection The condition of fish used for spawning is anecdotally recorded. Common observations include presence/absence of fungus, pinneped bite marks and “ripeness” (readiness to spawn). These features are occasionally used to identify culls within broodstock. In addition to visual inspections, ODFW Fish Health Services conducts bacterial kidney disease (BKD), virus and other pathogen detection assays on all broodstock. These data are used to reduce pathogen prevalence through culling, and are stored in electronic databases, further described in Section 3.5.3. 3.2.1.7 Genetic Diversity Beacham et al. (2006) used microsatellites to genetically characterize the McKenzie, North Santiam and Clackamas spring Chinook hatchery populations in a coastwide context, and two of these populations (McKenzie and North Santiam) have been included in the GAPS baseline (Seeb et al. 2007), widely used for mixed-stock analyses. Myers et al. (2006) also examined structure among these populations, and further included wild populations from the North Santiam, McKenzie and Clackamas rivers in their analyses. Their findings indicated that while significant genetic structure appeared to exist among hatchery and wild populations, it did not reflect any clear geographic pattern. They attributed their puzzling results to the effects of having sampled only juveniles from wild populations, and adults from hatchery populations. Juvenile samples are notorious for generating misleading estimates of divergence, as a result of bias generated from high relatedness among siblings often included among samples (Allendorf and Phelps 1981). Nevertheless, when considered together in a broader context, UWR spring Chinook appear to be genetically distinct from both lower Columbia River fall Chinook populations and other Columbia River spring Chinook populations (Beacham et al. 2006). Genetic (tissue) samples have not been routinely collected by UWR hatcheries, and a comprehensive evaluation of UWR spring Chinook population genetic structure has not been performed. However, in 2009, all UWR hatcheries collected tissue samples from adults outplanted above Willamette Project dams. These samples could be used to provide estimates of within and among population genetic diversity, yet such analyses have not been performed. Although no genetic monitoring program currently exists for UWR spring Chinook, draft HGMPs used by UWR hatcheries include broodstock management guidelines intended to preserve genetic diversity within hatchery populations. For example, efforts are made to integrate natural origin spawners and diverse phenotypes (run timing, lengths) into the broodstock. These measures aim to satisfy RPAs 6.2.2 and 9.5.1 (NMFS 2008), yet without genetic monitoring the effectiveness of these measures cannot be quantified. While phenotypic data may provide a basis for detecting some components of population genetic variation (e.g. genetic components of migration timing, growth, disease resistance, etc.), these data are subject to confounding environmental effects.
29
3.2.2 Holding Adult Chinook UWR spring Chinook hatcheries typically begin broodstock collections in June (though some fish are occasionally collected in May), and cease collections in October, after peak spawning. Adult Chinook are held by UWR hatchery facilities from the time of fish collection until spawning, release or other disposition. 3.2.2.1 Holding Facilities The following adult collection and holding facilities are used by UWR spring Chinook hatcheries:
• Marion Forks – Adults are collected and held at Minto Ponds, 33 miles downstream from Marion Forks Hatchery. A single 31,488 ft3 pond, constructed in 1975, is used to hold adults and acclimate juveniles prior to liberation. Minto Ponds is currently undergoing reconstruction that will provide improved sorting capacity to meet conditions of RPAs 4.6, 6.1.3, and 9.5.1 (NMFS 2008)
• South Santiam – Adults are collected at Foster Dam. Holding and spawning occurs
at South Santiam Hatchery. A single adult holding pond, constructed in 1969, remains in operation at South Santiam Hatchery.
• McKenzie – Adults are collected and held at McKenzie Hatchery. In 1975, two
40,500 ft3 adult holding ponds were constructed. These ponds currently remain in operation.
• Willamette – Adults are collected at Dexter Ponds and held at Willamette Hatchery.
Willamette Hatchery operates a single 9,500 ft3 adult holding pond, constructed in 1940. Adult holding facilities intended to replace this pond were constructed at Dexter Ponds in 1978. However, operation of the new ponds was deemed unsatisfactory, and adult holding resumed at Willamette Hatchery.
3.2.2.2 Antibiotic Treatments All UWR hatcheries treat adult Chinook to be held as broodstock with oxytetracycline (10 mg/kg body weight) and erythromycin (22 mg/kg body weight). Treatment guidelines have been established by the ODFW Fish Health Services, are documented in Hatchery Operating Procedures, and are intended to lower pre-spawn mortality rates. Keefer et al. (2010) found no clear association between antibiotic treatments and occurrence of pre-spawn mortality for adult Chinook outplanted into the North Fork of the Middle Fork Willamette River, above Lookout and Dexter reservoirs. Adult outplanting programs are further discussed in Section 3.3.5. 3.2.2.3 Pre-Spawn Mortality
30
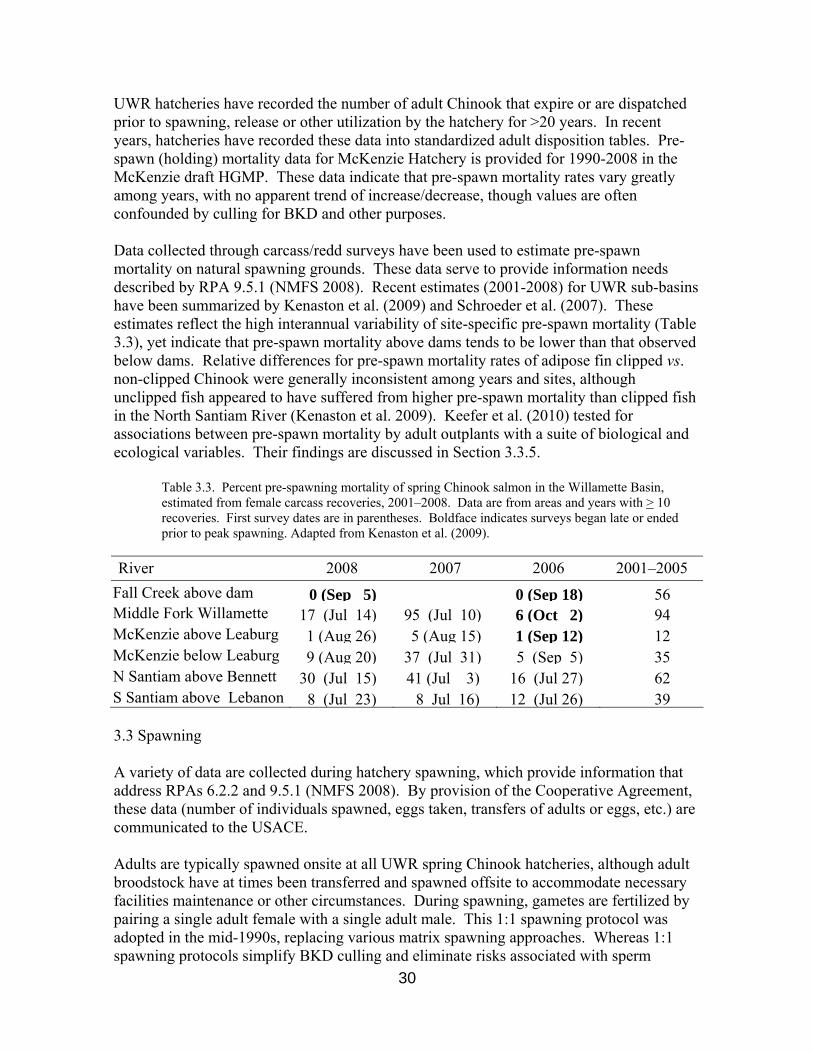
UWR hatcheries have recorded the number of adult Chinook that expire or are dispatched prior to spawning, release or other utilization by the hatchery for >20 years. In recent years, hatcheries have recorded these data into standardized adult disposition tables. Pre-spawn (holding) mortality data for McKenzie Hatchery is provided for 1990-2008 in the McKenzie draft HGMP. These data indicate that pre-spawn mortality rates vary greatly among years, with no apparent trend of increase/decrease, though values are often confounded by culling for BKD and other purposes. Data collected through carcass/redd surveys have been used to estimate pre-spawn mortality on natural spawning grounds. These data serve to provide information needs described by RPA 9.5.1 (NMFS 2008). Recent estimates (2001-2008) for UWR sub-basins have been summarized by Kenaston et al. (2009) and Schroeder et al. (2007). These estimates reflect the high interannual variability of site-specific pre-spawn mortality (Table 3.3), yet indicate that pre-spawn mortality above dams tends to be lower than that observed below dams. Relative differences for pre-spawn mortality rates of adipose fin clipped vs. non-clipped Chinook were generally inconsistent among years and sites, although unclipped fish appeared to have suffered from higher pre-spawn mortality than clipped fish in the North Santiam River (Kenaston et al. 2009). Keefer et al. (2010) tested for associations between pre-spawn mortality by adult outplants with a suite of biological and ecological variables. Their findings are discussed in Section 3.3.5.
Table 3.3. Percent pre-spawning mortality of spring Chinook salmon in the Willamette Basin, estimated from female carcass recoveries, 2001–2008. Data are from areas and years with > 10 recoveries. First survey dates are in parentheses. Boldface indicates surveys began late or ended prior to peak spawning. Adapted from Kenaston et al. (2009).
River 2008 2007 2006 2001–2005
Fall Creek above dam 0 (Sep 5) 0 (Sep 18) 56Middle Fork Willamette 17 (Jul 14) 95 (Jul 10) 6 (Oct 2) 94McKenzie above Leaburg 1 (Aug 26) 5 (Aug 15) 1 (Sep 12) 12McKenzie below Leaburg 9 (Aug 20) 37 (Jul 31) 5 (Sep 5) 35N Santiam above Bennett 30 (Jul 15) 41 (Jul 3) 16 (Jul 27) 62S Santiam above Lebanon 8 (Jul 23) 8 Jul 16) 12 (Jul 26) 39 3.3 Spawning A variety of data are collected during hatchery spawning, which provide information that address RPAs 6.2.2 and 9.5.1 (NMFS 2008). By provision of the Cooperative Agreement, these data (number of individuals spawned, eggs taken, transfers of adults or eggs, etc.) are communicated to the USACE. Adults are typically spawned onsite at all UWR spring Chinook hatcheries, although adult broodstock have at times been transferred and spawned offsite to accommodate necessary facilities maintenance or other circumstances. During spawning, gametes are fertilized by pairing a single adult female with a single adult male. This 1:1 spawning protocol was adopted in the mid-1990s, replacing various matrix spawning approaches. Whereas 1:1 spawning protocols simplify BKD culling and eliminate risks associated with sperm
31
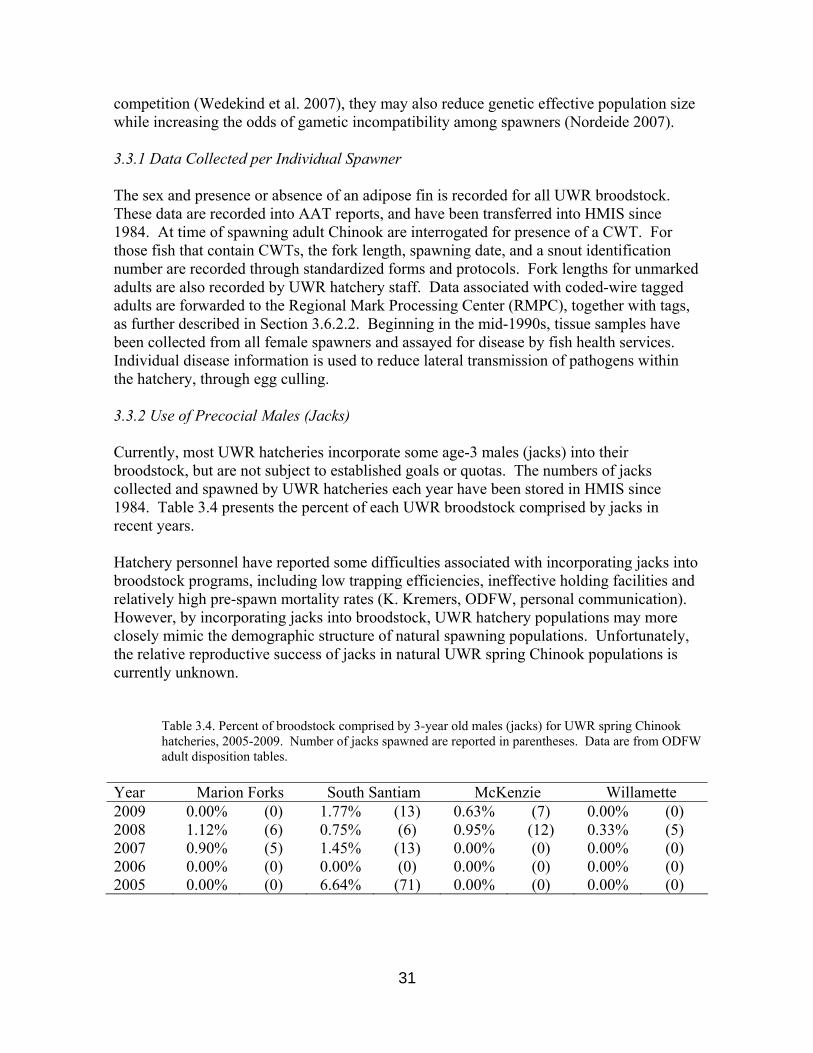
competition (Wedekind et al. 2007), they may also reduce genetic effective population size while increasing the odds of gametic incompatibility among spawners (Nordeide 2007). 3.3.1 Data Collected per Individual Spawner The sex and presence or absence of an adipose fin is recorded for all UWR broodstock. These data are recorded into AAT reports, and have been transferred into HMIS since 1984. At time of spawning adult Chinook are interrogated for presence of a CWT. For those fish that contain CWTs, the fork length, spawning date, and a snout identification number are recorded through standardized forms and protocols. Fork lengths for unmarked adults are also recorded by UWR hatchery staff. Data associated with coded-wire tagged adults are forwarded to the Regional Mark Processing Center (RMPC), together with tags, as further described in Section 3.6.2.2. Beginning in the mid-1990s, tissue samples have been collected from all female spawners and assayed for disease by fish health services. Individual disease information is used to reduce lateral transmission of pathogens within the hatchery, through egg culling. 3.3.2 Use of Precocial Males (Jacks) Currently, most UWR hatcheries incorporate some age-3 males (jacks) into their broodstock, but are not subject to established goals or quotas. The numbers of jacks collected and spawned by UWR hatcheries each year have been stored in HMIS since 1984. Table 3.4 presents the percent of each UWR broodstock comprised by jacks in recent years. Hatchery personnel have reported some difficulties associated with incorporating jacks into broodstock programs, including low trapping efficiencies, ineffective holding facilities and relatively high pre-spawn mortality rates (K. Kremers, ODFW, personal communication). However, by incorporating jacks into broodstock, UWR hatchery populations may more closely mimic the demographic structure of natural spawning populations. Unfortunately, the relative reproductive success of jacks in natural UWR spring Chinook populations is currently unknown.
Table 3.4. Percent of broodstock comprised by 3-year old males (jacks) for UWR spring Chinook hatcheries, 2005-2009. Number of jacks spawned are reported in parentheses. Data are from ODFW adult disposition tables.
Year Marion Forks South Santiam McKenzie Willamette 2009 0.00% (0) 1.77% (13) 0.63% (7) 0.00% (0) 2008 1.12% (6) 0.75% (6) 0.95% (12) 0.33% (5) 2007 0.90% (5) 1.45% (13) 0.00% (0) 0.00% (0) 2006 0.00% (0) 0.00% (0) 0.00% (0) 0.00% (0) 2005 0.00% (0) 6.64% (71) 0.00% (0) 0.00% (0)
32
3.3.3 Use of Natural Origin Spawners UWR spring Chinook hatcheries currently aim to include up to 25% natural origin spawners in broodstock populations, yet not take >10% of the total natural origin run. This practice is intended to bolster broodstock genetic diversity and reduce genetic divergence from local wild populations, as might occur through neutral or selection-driven evolutionary processes. Moreover, these efforts conform to RPAs 6.1 and 6.2.2, as ODFW works to “ensure that Willamette Project hatchery programs are not reducing the viability of ESUs” by implementing “conservation and supplementation programs that build genetic diversity using local broodstocks” (NMFS 2008). In 2002, UWR hatcheries began recording the number of marked (adipose fin clip) and unmarked Chinook collected and spawned. These data are collected through AAT reports, have been summarized in ODFW annual reports (McLaughlin et al. 2008, Cannon et al. 2010), and indicate a steady increase in the proportion of natural origin fish in most UWR broodstocks from 2002-2008. In 2009, managers opted to forego integration of natural origin Chinook into hatchery broodstocks in response to low adult return numbers. This decision was based on the view that under such conditions risks posed to natural populations by integration would be greater than any benefits gained by the broodstock programs. The integration of natural origin fish into hatchery broodstocks relies upon the ability to recognize natural origin fish. Mass marking of hatchery fish, through adipose fin clipping began in 1997, such that by 2002 all returning hatchery origin adults had been subjected to marking as juveniles. According to mass marking program objectives, UWR hatcheries aimed to adipose fin clip all hatchery production spring Chinook (except those fish released as fry). However, mis-clips and fin regeneration were believed to result in a mark rate below 100%. Schroeder et al. (2004) used data from otolith analyses to estimate the fraction of non-adipose fin clipped Chinook spawned by UWR hatcheries in 2003 that were not of natural origin. Hatchery induced thermal markings on otoliths revealed that between 75-92% of unclipped spawners were actually of hatchery origin. However, results from subsequent otolith analyses, summarized by McLaughlin et al. (2008) and Kenaston et al. (2009), indicated that the percentage of hatchery Chinook without adipose fin clips has declined considerably since mass marking began. This improvement is likely the result of increased automation in marking procedures. 3.3.4 Use of Chemical Treatments UWR hatcheries treat eggs with an iodophor disinfectant solution and treat adults with hydrogen peroxide to control fungus and external parasites. These measures were developed in coordination with ODFW Fish Health Services. All data associated with these treatments have been stored in the ODFW Fish Health Investigations database. 3.3.5 Adult Outplanting During the late 1980s and 1990s UWR hatcheries began outplanting surplus adult hatchery origin Chinook above Willamette Project dams. The initial rationale for adult outplanting
33
was to provide a prey base for threatened bull trout (Salvelinus confluentus) populations in upper UWR tributaries. Adult outplanting appeared to generate some level of natural production, and the re-establishment of naturally reproducing populations above UWR dams became a new goal for these efforts. As directed by RPA 4.1 (NMFS 2008), “Action Agencies will continue capturing spring Chinook salmon below USACE dams and transporting them into habitat above the following dams:
• Detroit Dam in the North Santiam River basin; • Foster Dam in the South Santiam River basin; • Cougar Dam in the South Fork McKenzie River basin; • Lookout Point and Hills Creek dams in the upper Middle Fork Willamette river
subbasin; and • Fall Creek Dam in the Fall Creek River basin.”
Accordingly, outplanting of adult Chinook is scheduled to continue at these sites. Coordinated with these efforts, ODFW staff are collecting morphometric (sex, length) and release (site, date) data to assist with the identification of improved collection and release strategies. Tissue samples have also been collected at most locations in support of future genetics studies intended to estimate relative reproductive success among outplanted fish (Cannon et al. 2010). To date, adult Chinook outplanting data have been regularly recorded by ODFW staff through AAT reports and summarized in several annual reports (e.g. Schroeder et al. 2003, Schroeder and Kenaston 2004, McLaughlin et al. 2008, Kenaston et al. 2009). Tables 3.5a and 3.5b present the numbers of all adult Chinook and numbers of unmarked adult Chinook outplanted by UWR hatcheries since 1998. Beidler and Knapp (2005) provided a review of the adult spring Chinook outplanting program and indicated a need for improved data collection with respect to condition of outplanted fish, habitat quality at release site (including temperature and flow), handling conditions (time and temperature), pre-spawn mortality and juvenile production. Although data were limited, they concluded that no clear relationship existed between the number of adults outplanted and juvenile production. Moreover, their report indicated that sex ratios among outplanted adults were heavily skewed toward a higher proportion of males to females for most sites and years (Beidler and Knapp 2005). Skewed sex ratios among outplanted adults were again cited in a report by Kenaston et al. (2009). However, the effects that skewed sex ratios may have on production and other program objectives remain unclear. A major concern associated with adult outplanting is the occasionally high, yet variable rate of pre-spawn mortality observed among outplanted fish. Using data from 242 radio-tagged adult Chinook outplanted into the North Fork of the Middle Fork Willamette River, Keefer et al. (2010) tested for associations between pre-spawn mortality and a suite of environmental and biological variables. Their results indicated that while pre-spawn mortality rates can vary drastically among years, female and “poor/fair” condition fish tended to experience significantly higher rates of pre-spawn mortality than males or
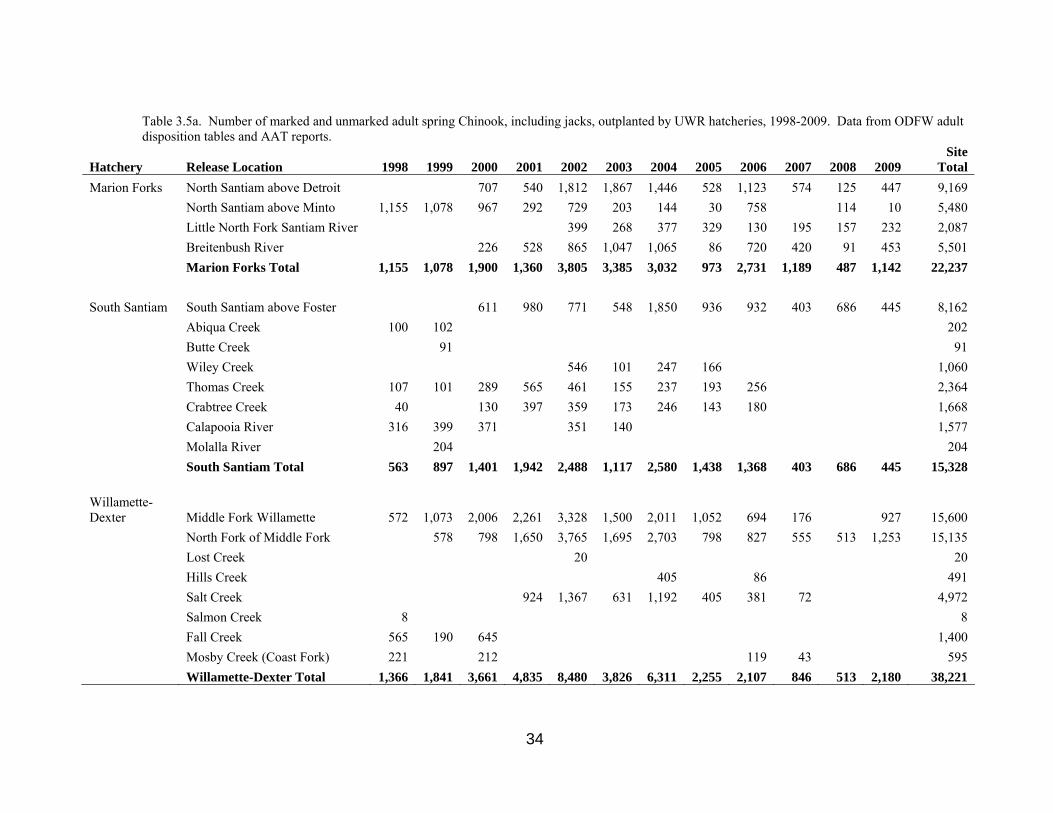
Table 3.5a. Number of marked and unmarked adult spring Chinook, including jacks, outplanted by UWR hatcheries, 1998-2009. Data from ODFW adult disposition tables and AAT reports.
Hatchery Release Location 1998 1999 2000 2001 2002 2003 2004 2005 2006 2007 2008 2009 Site
Total Marion Forks North Santiam above Detroit 707 540 1,812 1,867 1,446 528 1,123 574 125 447 9,169 North Santiam above Minto 1,155 1,078 967 292 729 203 144 30 758 114 10 5,480 Little North Fork Santiam River 399 268 377 329 130 195 157 232 2,087 Breitenbush River 226 528 865 1,047 1,065 86 720 420 91 453 5,501 Marion Forks Total 1,155 1,078 1,900 1,360 3,805 3,385 3,032 973 2,731 1,189 487 1,142 22,237 South Santiam South Santiam above Foster 611 980 771 548 1,850 936 932 403 686 445 8,162 Abiqua Creek 100 102 202 Butte Cre ek 91 91
ek 8 8
Wiley Creek 546 101 247 166 1,060 Thomas Creek 107 101 289 565 461 155 237 193 256 2,364 Crabtree Creek 40 130 397 359 173 246 143 180 1,668 Calapooia River 316 399 371 351 140 1,577 Molalla River 204 204 South Santiam Total 563 897 1,401 1,942 2,488 1,117 2,580 1,438 1,368 403 686 445 15,328 Willamette-Dexter Middle Fork Willamette 572 1,073 2,006 2,261 3,328 1,500 2,011 1,052 694 176 927 15,600 North Fork of Middle Fork 578 798 1,650 3,765 1,695 2,703 798 827 555 513 1,253 15,135 Lost Creek 20 20 Hills Creek 405 86 491 Salt Creek 924 1,367 631 1,192 405 381 72 4,972 Salmon Cre Fall Creek 565 190 645 1,400 Mosby Creek (Coast Fork) 221 212 119 43 595 Willamette-Dexter Total 1,366 1,841 3,661 4,835 8,480 3,826 6,311 2,255 2,107 846 513 2,180 38,221
34
35
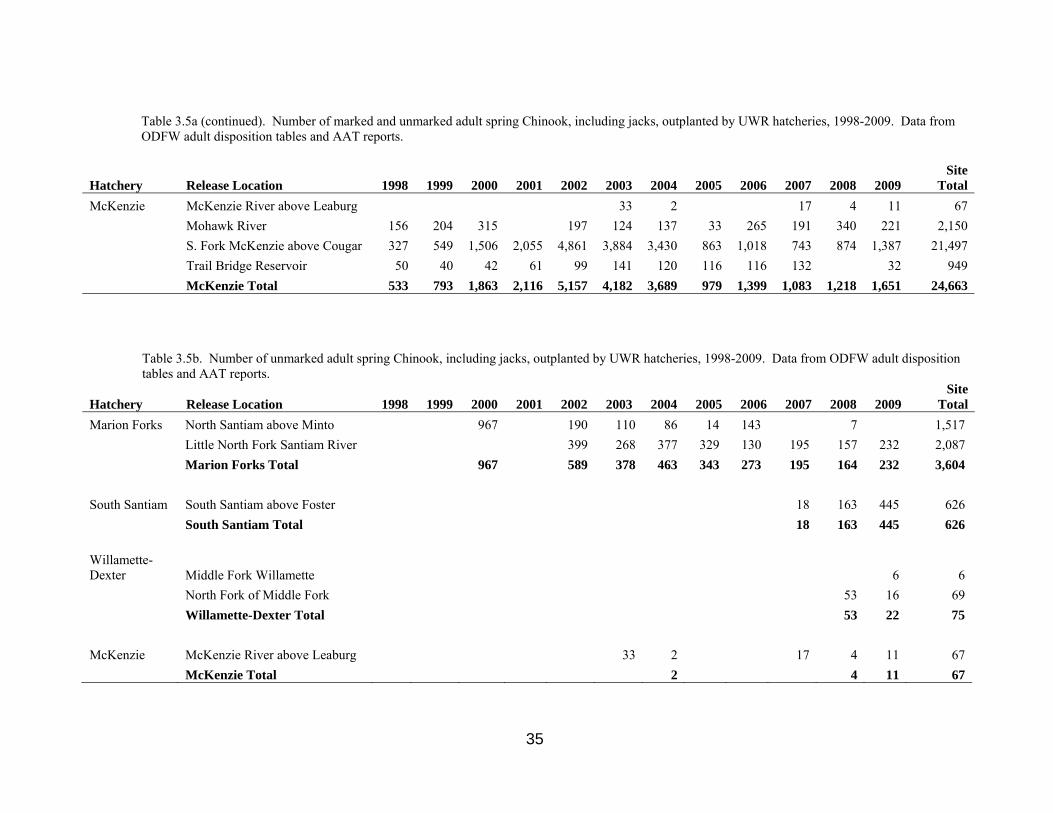
Table 3.5a (continued). Number of marked and unmarked adult spring Chinook, including jacks, outplanted by UWR hatcheries, 1998-2009. Data from ODFW adult disposition tables and AAT reports.
Hatchery Release Location 1998 1999 2000 2001 2002 2003 2004 2005 2006 2007 2008 2009 Site
Total McKenzie McKenzie River above Leaburg 33 2 17 4 11 67 Mohawk River 156 204 315 197 124 137 33 265 191 340 221 2,150 S. Fork McKenzie above Cougar 327 549 1,506 2,055 4,861 3,884 3,430 863 1,018 743 874 1,387 21,497 Trail Bridge Reservoir 50 40 42 61 99 141 120 116 116 132 32 949 McKenzie Total
533 793 1,863 2,116 5,157 4,182 3,689
979 1,399 1,083 1,218 1,651 24,663
Table 3.5b. Number of unmarked adult spring Chinook, including jacks, outplanted by UWR hatcheries, 1998-2009. Data from ODFW adult disposition tables and AAT reports.
Hatchery Release Location 1998 1999 2000 2001 2002 2003 2004 2005 2006 2007 2008 2009 Site
Total Marion Forks North Santiam above Minto 967 190 110 86 14 143 7 1,517 Little North Fork Santiam River 399 268 377 329 130 195 157 232 2,087 Marion Forks Total 967 589 378 463 343 273 195 164 232 3,604 South Santiam South Santiam above Foster 18 163 445 626 South Santiam Total 18 163 445 626 Willamette-Dexter Middle Fork Willamette 6 6 North Fork of Middle Fork 53 16 69 Willamette-Dexter Total 53 22 75 McKenzie McKenzie River above Leaburg 33 2 17 4 11 67 McKenzie Total 2 4 11 67
36
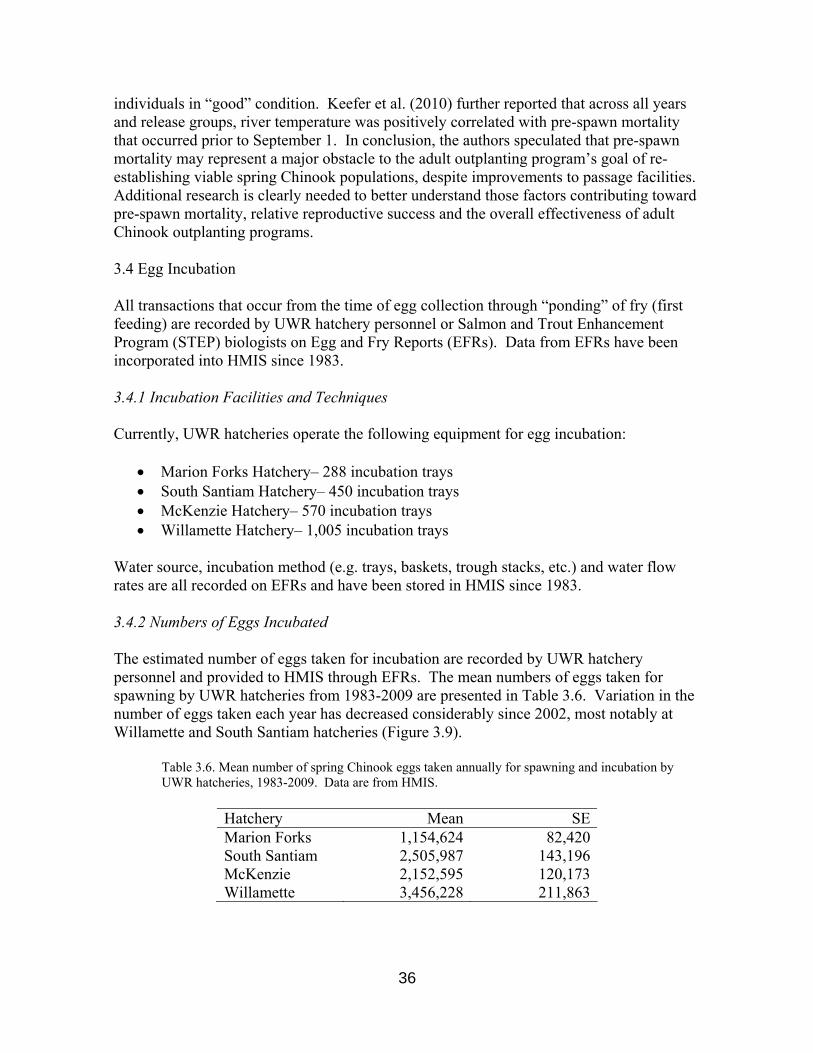
individuals in “good” condition. Keefer et al. (2010) further reported that across all years and release groups, river temperature was positively correlated with pre-spawn mortality that occurred prior to September 1. In conclusion, the authors speculated that pre-spawn mortality may represent a major obstacle to the adult outplanting program’s goal of re-establishing viable spring Chinook populations, despite improvements to passage facilities. Additional research is clearly needed to better understand those factors contributing toward pre-spawn mortality, relative reproductive success and the overall effectiveness of adult Chinook outplanting programs. 3.4 Egg Incubation All transactions that occur from the time of egg collection through “ponding” of fry (first feeding) are recorded by UWR hatchery personnel or Salmon and Trout Enhancement Program (STEP) biologists on Egg and Fry Reports (EFRs). Data from EFRs have been incorporated into HMIS since 1983. 3.4.1 Incubation Facilities and Techniques Currently, UWR hatcheries operate the following equipment for egg incubation:
• Marion Forks Hatchery– 288 incubation trays • South Santiam Hatchery– 450 incubation trays • McKenzie Hatchery– 570 incubation trays • Willamette Hatchery– 1,005 incubation trays
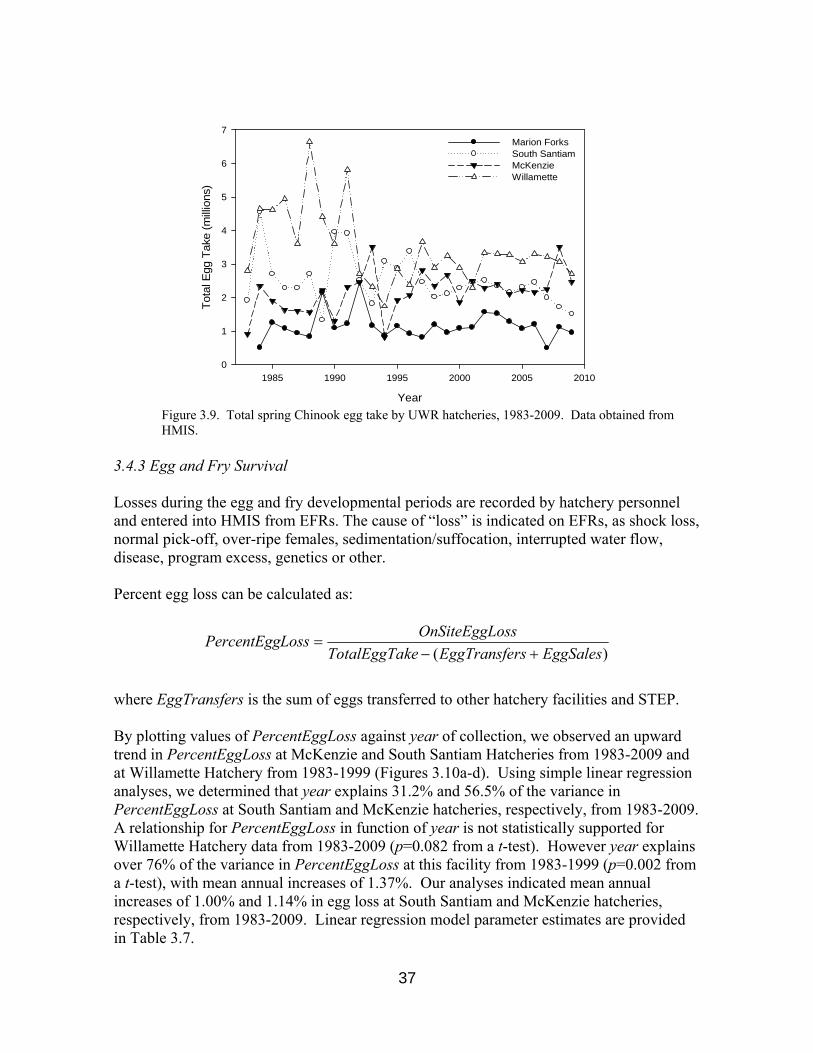
Water source, incubation method (e.g. trays, baskets, trough stacks, etc.) and water flow rates are all recorded on EFRs and have been stored in HMIS since 1983. 3.4.2 Numbers of Eggs Incubated The estimated number of eggs taken for incubation are recorded by UWR hatchery personnel and provided to HMIS through EFRs. The mean numbers of eggs taken for spawning by UWR hatcheries from 1983-2009 are presented in Table 3.6. Variation in the number of eggs taken each year has decreased considerably since 2002, most notably at Willamette and South Santiam hatcheries (Figure 3.9).
Table 3.6. Mean number of spring Chinook eggs taken annually for spawning and incubation by UWR hatcheries, 1983-2009. Data are from HMIS.
Hatchery Mean SE Marion Forks 1,154,624 82,420 South Santiam 2,505,987 143,196 McKenzie 2,152,595 120,173 Willamette 3,456,228 211,863
Year
1985 1990 1995 2000 2005 2010
Tota
l Egg
Tak
e (m
illion
s)
0
1
2
3
4
5
6
7Marion Forks South Santiam McKenzie Willamette
Figure 3.9. Total spring Chinook egg take by UWR hatcheries, 1983-2009. Data obtained from HMIS.
3.4.3 Egg and Fry Survival Losses during the egg and fry developmental periods are recorded by hatchery personnel and entered into HMIS from EFRs. The cause of “loss” is indicated on EFRs, as shock loss, normal pick-off, over-ripe females, sedimentation/suffocation, interrupted water flow, disease, program excess, genetics or other. Percent egg loss can be calculated as:
)( EggSalesrsEggTransfekeTotalEggTaossOnSiteEggLLossPercentEgg
+−=
where EggTransfers is the sum of eggs transferred to other hatchery facilities and STEP. By plotting values of PercentEggLoss against year of collection, we observed an upward trend in PercentEggLoss at McKenzie and South Santiam Hatcheries from 1983-2009 and at Willamette Hatchery from 1983-1999 (Figures 3.10a-d). Using simple linear regression analyses, we determined that year explains 31.2% and 56.5% of the variance in PercentEggLoss at South Santiam and McKenzie hatcheries, respectively, from 1983-2009. A relationship for PercentEggLoss in function of year is not statistically supported for Willamette Hatchery data from 1983-2009 (p=0.082 from a t-test). However year explains over 76% of the variance in PercentEggLoss at this facility from 1983-1999 (p=0.002 from a t-test), with mean annual increases of 1.37%. Our analyses indicated mean annual increases of 1.00% and 1.14% in egg loss at South Santiam and McKenzie hatcheries, respectively, from 1983-2009. Linear regression model parameter estimates are provided in Table 3.7.
37
a)
Year
1985 1990 1995 2000 2005 2010
Per
cent
Los
s
0
20
40
60
80Percent Egg LossPercent Fry Loss
First year ofBKD culling
Marion Forks Hatchery
Eggs taken (from N. Santiambroodstock) at McKenzie Hatchery, incubated untileyed-egg stage, then tranferredback to Marion Forks Hatchery
b)
Year
1985 1990 1995 2000 2005 2010
Per
cent
Los
s
0
20
40
60
80Percent Egg LossPercent Fry Loss
1F:1M spawningreplaces 8F:3Mmatrix
First year ofBKD culling
South Santiam Hatchery
Figure 3.10a-b. Percent loss of eggs and fry for spring Chinook stocks 021 and 024 at (a) Marion Forks and (b) South Santiam hatcheries, respectively Note: South Santiam stock (024) production is transferred as eyed eggs to Willamette hatchery for ponding. Data obtained from HMIS.
Linear regression analyses further suggested that from 1983-2009, 16.6% of the variance in PercentEggLoss at McKenzie Hatchery can be explained by the number of eggs taken each year (p=0.035 from a t-test). This result suggests that the upward trend in PercentEggLoss may be in part the result of increased egg takes accompanied by disease and excess egg culling. Screening and culling for BKD and infectious haematopoietic necrosis (IHN) was implemented at UWR hatcheries in the mid-1990s. Indeed, culling for excess and diseased eggs were reported as cause of loss for 16% (excess) and 41% (disease) of stock 023 egg loss reports from McKenzie Hatchery from 1995-2009. Prior to 1995, nearly all egg losses
38
at this facility were attributed to shock loss or normal pick-off. Additional efforts have been made at McKenzie Hatchery to identify other causes of egg loss, including analyses of gamete viability (sperm motility) and egg disinfection treatment effects (K. Kremers, ODFW, personal communication). c)
Year
1985 1990 1995 2000 2005 2010
Per
cent
Los
s
0
20
40
60
80Percent Egg LossPercent Fry Loss
First year of BKD cullingand most "Heath" incubatorsreplaced by "Marisource"incubators
McKenzie Hatchery
d)
Year
1985 1990 1995 2000 2005 2010
Per
cent
Los
s
0
20
40
60
80Percent Egg LossPercent Fry Loss
1F:1M spawningreplaces 2F:1Mmatrix
First year ofBKD culling
Willamette Hatchery
Figure 3.10c-d. Percent loss of eggs and fry for spring Chinook stocks 023 and 022 at (c) McKenzie and (d) Willamette hatcheries, respectively. Data obtained from HMIS.
Although no significant associations exist between number of eggs collected and percent egg loss at other UWR spring Chinook hatcheries (p>0.05 from t-tests), culling for BKD and IHN may again explain increased percent egg losses in recent years. For example, prior to 1995 no egg loss reports from South Santiam Hatchery indicate disease culling as cause for egg loss, and percent egg loss remained relatively low (Figure 3.10b). However,
39
40
from 1995-2009, 39% of egg loss reports at South Santiam Hatchery cite disease culling for stock 024 losses. Incidentally, shock loss was cited at a very similar frequency during this period at South Santiam Hatchery (40% of reports, 1995-2009).
Table 3.7. Linear regression parameter estimates for percent egg and fry losses at UWR spring Chinook hatcheries in function of year. Data are from HMIS, 1983-2009, except as indicated for Willamette Hatchery.
Variable Coefficient SE t-statistic p-value R2
y-intercept -1969.81 589.66 -3.34 0.0026 South Santiam egg loss year 1.00 0.30 3.37 0.0024 0.312
y-intercept -2248.61 398.35 -5.64 <0.0001 McKenzie egg
loss year 1.14 0.20 5.70 <0.0001 0.565
y-intercept -2717.65 391.08 -6.95 <0.0001 Willamette egg
loss (1983-1999) year 1.37 0.20 6.99 <0.0001 0.765
y-intercept -253.78 113.79 -2.23 0.0349 McKenzie fry
loss year 0.13 0.06 2.25 0.0335 0.168
Percent loss of spring Chinook fry at UWR hatcheries has historically been quite low, although a minor yet statistically significant upward trend in loss (annual increase of 0.12 in mean percent loss, p=0.034 from a t-test) is suggested by data from McKenzie Hatchery (Table 3.7). Occasional “spikes” in percent fry loss have also been observed at most hatcheries (Figures 3.10a-d), though causes for these spikes have not been conclusively identified. Nevertheless, anecdotal evidence may provide some clues toward practices associated with higher fry loss. For example, in 2007 and 2009, flow and temperature conditions from Big Cliff Dam on the North Santiam River presented a serious threat to broodstock being held downstream at Minto Ponds. In response, North Santiam broodstock were transferred to McKenzie Hatchery and spawned at that facility. The fertilized eggs were then incubated at McKenzie hatchery until the eyed egg stage. These eyed eggs were then transferred back to Marion Forks Hatchery, where they were raised through fry stage and beyond. These two years presented the highest percent fry losses recorded by Marion Forks Hatchery during the past 21 years (Figure 3.10a). Transfers may therefore induce elevated fry losses, though a causal relationship cannot be established from these data. It should be noted that similar transfers between Marion Forks Hatchery and McKenzie Hatchery are scheduled to take place in 2010, while Minto Ponds undergoes construction and renovation. 3.5 Juvenile Rearing Once fry have been ponded, their feed rations, growth, survivorship and other biological data are recorded by UWR hatchery personnel onto MPFRs. Data from these reports have been stored in HMIS since 1998.
41
3.5.1 Holding Facilities UWR hatcheries utilize combinations of fiberglass Canadian troughs and concrete raceways for rearing spring Chinook from the fry through smolt stages. Current juvenile holding facilities for each UWR hatchery are as follows:
• Marion Forks Hatchery – 12 Canadian troughs, 8 raceways, 48 circular ponds o Minto Pond – 1 acclimation pond
• South Santiam Hatchery – 14 Burroughs raceways • McKenzie Hatchery – 6 Canadian troughs, 30 raceways • Willamette Hatchery – 13 Canadian troughs, 40 Burroughs ponds, 10 raceways
o Dexter Ponds – 4 raceways, 1 rearing pond 3.5.2 Feeding The type (brand) and ration of feed provided to juvenile spring Chinook has been shown to be significantly associated with variable weight gain (Twibell et al. 2009), immune function (Alcorn et al. 2003) and early sexual maturation (Shearer et al. 2006). Accordingly, the type, size and pounds of food provided to juvenile spring Chinook at UWR facilities are routinely recorded onto MPFRs, and these data are stored in HMIS. Weight gain in function of feeding is routinely tracked (food conversion) through MPFRs. However, formal analyses to test for associations between feeding and fish health or early maturation rates have not been conducted on a regular basis. 3.5.3 Juvenile Fish Health In accordance with HGMP and Integrated Hatchery Operations Team (IHOT) guidelines, ODFW fish pathologists conduct monthly inspections of juvenile hatchery spring Chinook prior to liberation. ODFW’s Fish Health Management Policy provides additional guidelines and procedures to prevent, detect, treat and respond to fish pathogens (http://www.dfw.state.or.us/fish/hatchery/docs/fish_mgmt_policy.pdf). ODFW Fish Health Services maintains copies of all disease examination records from UWR spring Chinook hatcheries. In Oregon, fish health records are continually stored on four separate electronic databases: 1) a BKD database, 2) a Myxobolus cerebralis (whirling disease causative agent) database, 3) a virus screening database, and 4) a Native Fish Investigations database. A comprehensive Fish Health Investigations database, which compiles and archives information from each of the four independent fish health databases (on a quarterly basis), is maintained by Fish Health Services in Corvallis. This database is managed with FileMaker Pro® software, and contains electronic records dating back to the early 1980s. Paper records dating back to the 1960s are currently being transferred into electronic format. Information stored on the Fish Health Investigations database may be obtained through individual queries made to ODFW Fish Health Services. Select data are presented annually in ODFW Fish Propagation Reports, which have been published electronically since 2003 at http://www.dfw.state.or.us/fish/hatchery/ .
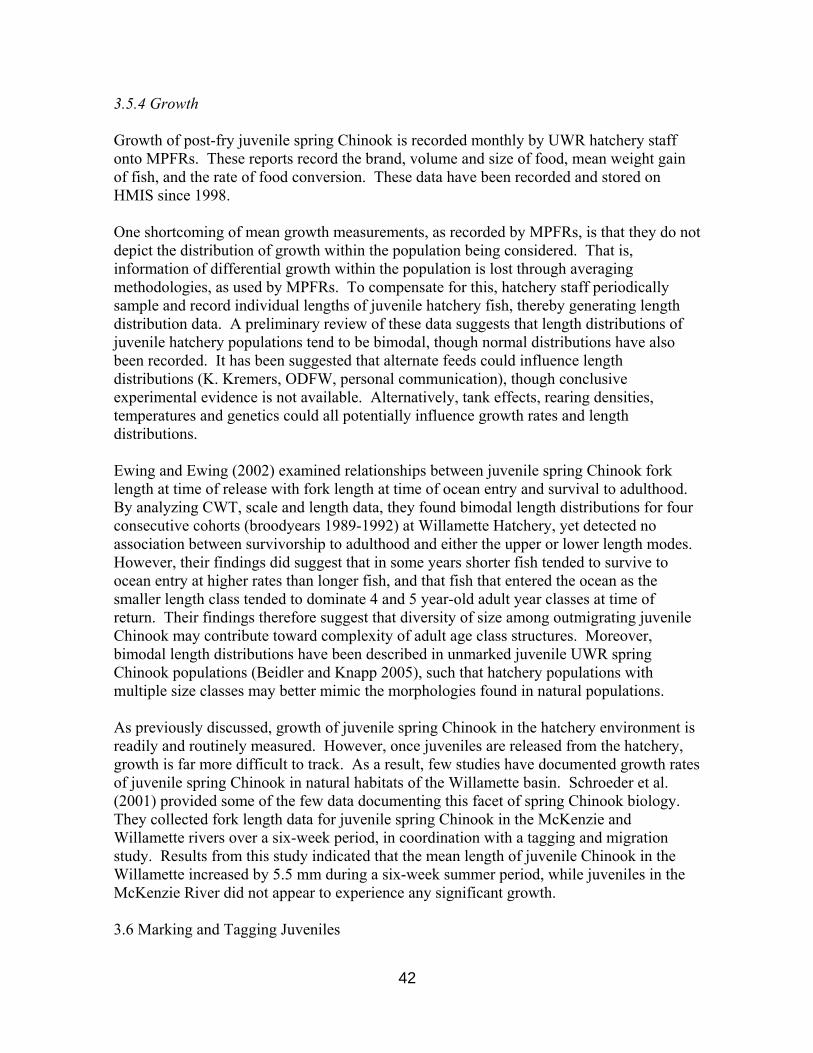
42
3.5.4 Growth Growth of post-fry juvenile spring Chinook is recorded monthly by UWR hatchery staff onto MPFRs. These reports record the brand, volume and size of food, mean weight gain of fish, and the rate of food conversion. These data have been recorded and stored on HMIS since 1998. One shortcoming of mean growth measurements, as recorded by MPFRs, is that they do not depict the distribution of growth within the population being considered. That is, information of differential growth within the population is lost through averaging methodologies, as used by MPFRs. To compensate for this, hatchery staff periodically sample and record individual lengths of juvenile hatchery fish, thereby generating length distribution data. A preliminary review of these data suggests that length distributions of juvenile hatchery populations tend to be bimodal, though normal distributions have also been recorded. It has been suggested that alternate feeds could influence length distributions (K. Kremers, ODFW, personal communication), though conclusive experimental evidence is not available. Alternatively, tank effects, rearing densities, temperatures and genetics could all potentially influence growth rates and length distributions. Ewing and Ewing (2002) examined relationships between juvenile spring Chinook fork length at time of release with fork length at time of ocean entry and survival to adulthood. By analyzing CWT, scale and length data, they found bimodal length distributions for four consecutive cohorts (broodyears 1989-1992) at Willamette Hatchery, yet detected no association between survivorship to adulthood and either the upper or lower length modes. However, their findings did suggest that in some years shorter fish tended to survive to ocean entry at higher rates than longer fish, and that fish that entered the ocean as the smaller length class tended to dominate 4 and 5 year-old adult year classes at time of return. Their findings therefore suggest that diversity of size among outmigrating juvenile Chinook may contribute toward complexity of adult age class structures. Moreover, bimodal length distributions have been described in unmarked juvenile UWR spring Chinook populations (Beidler and Knapp 2005), such that hatchery populations with multiple size classes may better mimic the morphologies found in natural populations. As previously discussed, growth of juvenile spring Chinook in the hatchery environment is readily and routinely measured. However, once juveniles are released from the hatchery, growth is far more difficult to track. As a result, few studies have documented growth rates of juvenile spring Chinook in natural habitats of the Willamette basin. Schroeder et al. (2001) provided some of the few data documenting this facet of spring Chinook biology. They collected fork length data for juvenile spring Chinook in the McKenzie and Willamette rivers over a six-week period, in coordination with a tagging and migration study. Results from this study indicated that the mean length of juvenile Chinook in the Willamette increased by 5.5 mm during a six-week summer period, while juveniles in the McKenzie River did not appear to experience any significant growth. 3.6 Marking and Tagging Juveniles
3.6.1 Marking Within the context of UWR hatchery programs, marking can provide a readily identifiable means of determining the origin, release history, or other characteristic of fish being harvested, monitored or studied. The continuation of mass marking has been directed by RPA 6.1.3 (NMFS 2008). 3.6.1.1 Adipose Fin Clipping Adipose fin clips have been the primary marking technique used by UWR hatcheries to identify hatchery origin spring Chinook from natural origin fish. This technique does not appear to affect survivorship (Vander Haegen et al. 2005) and marks are readily identifiable in the field. Mass marking of hatchery fish began in 1997 to facilitate the development of a selective, hatchery based fishery and to aid conservation measures intended to protect natural origin UWR spring Chinook. Adipose fin clipping was initially performed manually, often with the assistance of public volunteers. But in recent years the McKenzie Hatchery (2003), Marion Forks Hatchery (2009) and Willamette Hatchery (2004) have begun to use mobile, automated tagging trailers that appear to greatly improve adipose fin clipping speed and accuracy. Marking data, including the number of fish clipped, are collected by each hatchery and stored in HMIS.
Year
2001 2002 2003 2004 2005 2006 2007 2008 2009
Per
cent
Unc
lippe
d
0
20
40
60
80
100McKenzie N. Santiam S. Santiam MF Willamette
Figure 3.11. Percentage of unclipped (adipose fin) spring Chinook determined to be of hatchery origin from otolith thermal marks. Samples were collected through carcass surveys on the North Santiam, South Santiam, McKenzie and Middle Fork Willamette rivers, 2002-2008. No data from Middle Fork Willamette River was available in 2006. Adapted from Kenaston et al. 2009.
3.6.1.2 Thermal Marking Otoliths
43
Because adipose fin clip marking techniques do not always achieve 100% mark rates, UWR hatcheries also began inducing otolith thermal markings on all UWR juvenile hatchery Chinook in 1997. By oscillating hatchery water temperatures, a series of
44
recognizable thermal bands can be produced in the otolith ring structure of juvenile fish. These ring structures are retained throughout the life of the fish, and otolith analyses can be used to distinguish hatchery origin fish from natural origin fish, regardless of adipose fin clip status. Data obtained through otolith analyses have been used to verify the origin of non-adipose fin clipped adults used for broodstock or encountered on natural spawning grounds. These data have been summarized in annual reports provided to the USACE (e.g. Kenaston et al. 2009), and indicate that adipose fin clipping rates have improved considerably during the past decade (Figure 3.11). 3.6.2 Tagging Both adipose fin clips and otolith thermal marks serve to distinguish hatchery origin from natural origin spring Chinook. A variety of tagging techniques can provide additional, higher resolution data. Data that have been collected through tagging of spring Chinook include: hatchery of origin, broodyear, release strategy (fall vs. spring, acclimation vs. direct release, etc.), and temporospatial distribution of tagged adults. Expanded tagging efforts (e.g. CWTs) have also been advocated by RPA 6.1.3, to assist in the identification and sorting of hatchery and wild Chinook (RPA 6.1.4) at UWR adult collection facilities (NMFS 2008). 3.6.2.1 PIT Tags Passive integrated transponder (PIT) tags can be used on both juvenile and adult Chinook, and can provide tag specific data through multiple non-lethal sampling methods. PIT tags have been used by ODFW researchers and regional biologists to study the growth and movements of wild and hatchery spring Chinook, as well as the effects of alternate juvenile release strategies (Schroeder et al. 2001, Schroeder et al. 2003). Tagging and associated data collection has typically been carried out by the involved research group. Results from past ODFW PIT tag-based research are briefly discussed in Section 3.8.1. 3.6.2.2 Coded Wire Tags Coded wire tags are small, inexpensive metal tags that are typically inserted into the nasal cartilage of juvenile salmonids. This procedure does not appear to adversely affect survivorship or behavior of tagged fish (Vander Haegen et al. 2005, but see Elliot and Pascho 2001) and the large number of possible tag codes helps to ensure accurate identification of release groups. The primary disadvantage of CWTs is that data (beyond presence/absence) can only be collected through lethal sampling techniques. CWTs are typically collected from adult Chinook by UWR hatcheries, ODFW researchers and other entities through harvest sampling, spawner surveys, and routine hatchery operations. CWT collection data, including date, location, and morphometrics (sex, length), are recorded through standardized forms and protocols. ODFW provides all CWTs, together with associated data, to the RMPC for analyses. The RMPC collects, archives and manages all CWT data, which are stored on the RMIS and can be obtained through a web accessible query engine at http://www.rmpc.org/. Sections 3.1.2, 3.2.1.3, 3.7.4.2, and 3.10 cite applications of CWT data.
45
3.6.2.3 Acoustic Tags Acoustic tags can provide high resolution, individual-specific, spatial information. However, acoustic tags are relatively large and expensive. Accordingly, few studies have used acoustic tags for spring Chinook RM&E (reviewed further in Section 3.8.2). 3.6.2.4 Elastomer Tags Elastomer tags are inexpensive tags, which can provide data through non-lethal sampling, though efficiency of non-lethal data collection may diminish over time (FitzGerald et al. 2004). Elastomer tags have not been used to study UWR spring Chinook.
3.7 Juvenile Releases The Cooperative Agreement defines the maximum number of pounds (lbs.) of juvenile spring Chinook and steelhead to be produced with USACE funding by UWR hatcheries for mitigation purposes. These maximum values are provided in Section 2.3. The Cooperative Agreement further states that “if there is an additional fish production capacity, it may be used by the State” and that, “additional rearing costs shall be borne solely by the State and shall not be a part of this agreement”. Indeed, Hatchery Operating Plans (2010 HOPs) include UWR spring Chinook production goals that exceed Cooperative Agreement mitigation production values at South Santiam and McKenzie hatcheries, where a greater percentage of operation and maintenance costs are assumed by the State of Oregon (50% and 30%, respectively; 16.25% of costs are state funded at Willamette and Marion Forks hatcheries). With respect only to UWR spring Chinook stocks, HOP production goals are:
• Marion Forks Hatchery – 61,651 lbs. • South Santiam Hatchery – 87,833 lbs., plus eggs for incubation and rearing
at Willamette Hatchery to produce an additional 77,947 lbs., for a total 165,780 lbs. of juvenile production to be released primarily into the South Santiam River
• McKenzie Hatchery – 115,040 lbs., plus an additional 750 lbs. for STEP and 17,857 lbs. for Youngs Bay net pens
• Willamette Hatchery – 171,333 lbs., plus a limited number of eggs (15,000) for STEP
Mitigation production is to be of native stock, released primarily within the subbasin of hatchery operation, and entirely within the Willamette River Basin (Cooperative Agreement). In some cases, fish of various stages are transferred among facilities and sub-basins, as allowed by the Cooperative Agreement and dictated by specific infrastructural and management needs. Actual production of juvenile spring Chinook can therefore be categorized into various rearing and release strategies:
• Strategy 1 – Juvenile UWR Chinook are reared and released within their native sub-basin
• Strategy 2 – Juvenile UWR Chinook are reared within their native sub-basin, then released into a non-native sub-basin of the Willamette basin
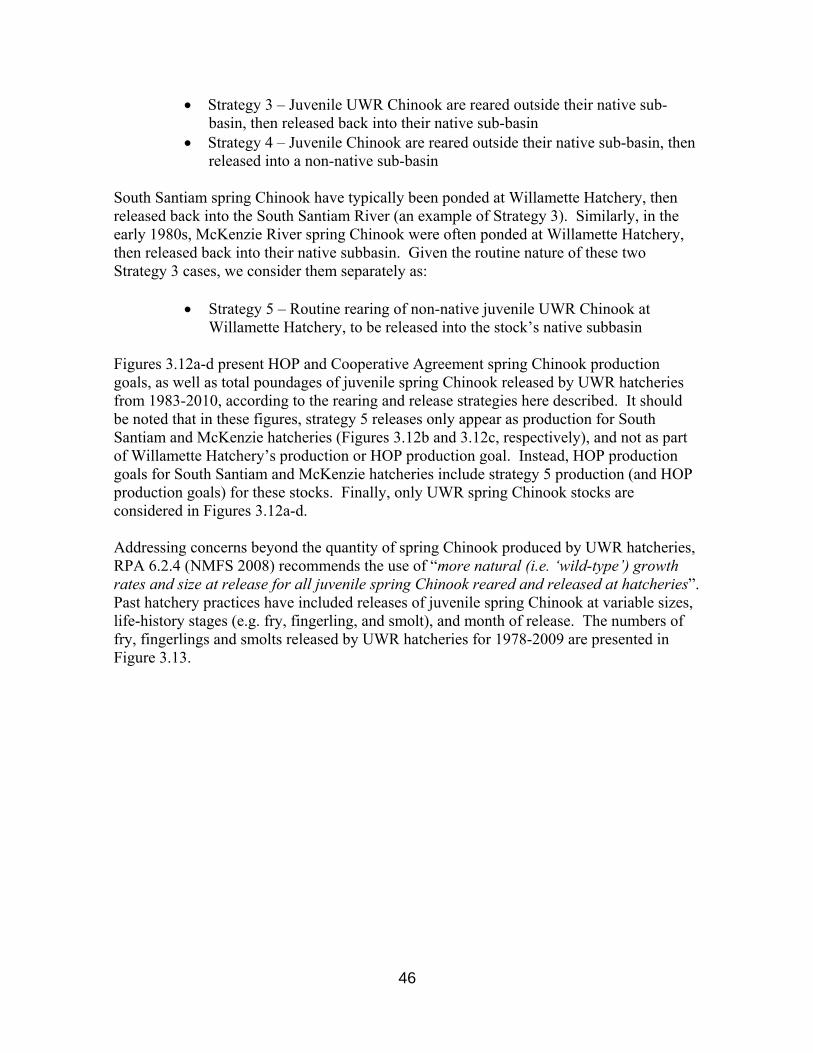
46
• Strategy 3 – Juvenile UWR Chinook are reared outside their native sub-basin, then released back into their native sub-basin
• Strategy 4 – Juvenile Chinook are reared outside their native sub-basin, then released into a non-native sub-basin
South Santiam spring Chinook have typically been ponded at Willamette Hatchery, then released back into the South Santiam River (an example of Strategy 3). Similarly, in the early 1980s, McKenzie River spring Chinook were often ponded at Willamette Hatchery, then released back into their native subbasin. Given the routine nature of these two Strategy 3 cases, we consider them separately as:
• Strategy 5 – Routine rearing of non-native juvenile UWR Chinook at Willamette Hatchery, to be released into the stock’s native subbasin
Figures 3.12a-d present HOP and Cooperative Agreement spring Chinook production goals, as well as total poundages of juvenile spring Chinook released by UWR hatcheries from 1983-2010, according to the rearing and release strategies here described. It should be noted that in these figures, strategy 5 releases only appear as production for South Santiam and McKenzie hatcheries (Figures 3.12b and 3.12c, respectively), and not as part of Willamette Hatchery’s production or HOP production goal. Instead, HOP production goals for South Santiam and McKenzie hatcheries include strategy 5 production (and HOP production goals) for these stocks. Finally, only UWR spring Chinook stocks are considered in Figures 3.12a-d. Addressing concerns beyond the quantity of spring Chinook produced by UWR hatcheries, RPA 6.2.4 (NMFS 2008) recommends the use of “more natural (i.e. ‘wild-type’) growth rates and size at release for all juvenile spring Chinook reared and released at hatcheries”. Past hatchery practices have included releases of juvenile spring Chinook at variable sizes, life-history stages (e.g. fry, fingerling, and smolt), and month of release. The numbers of fry, fingerlings and smolts released by UWR hatcheries for 1978-2009 are presented in Figure 3.13.
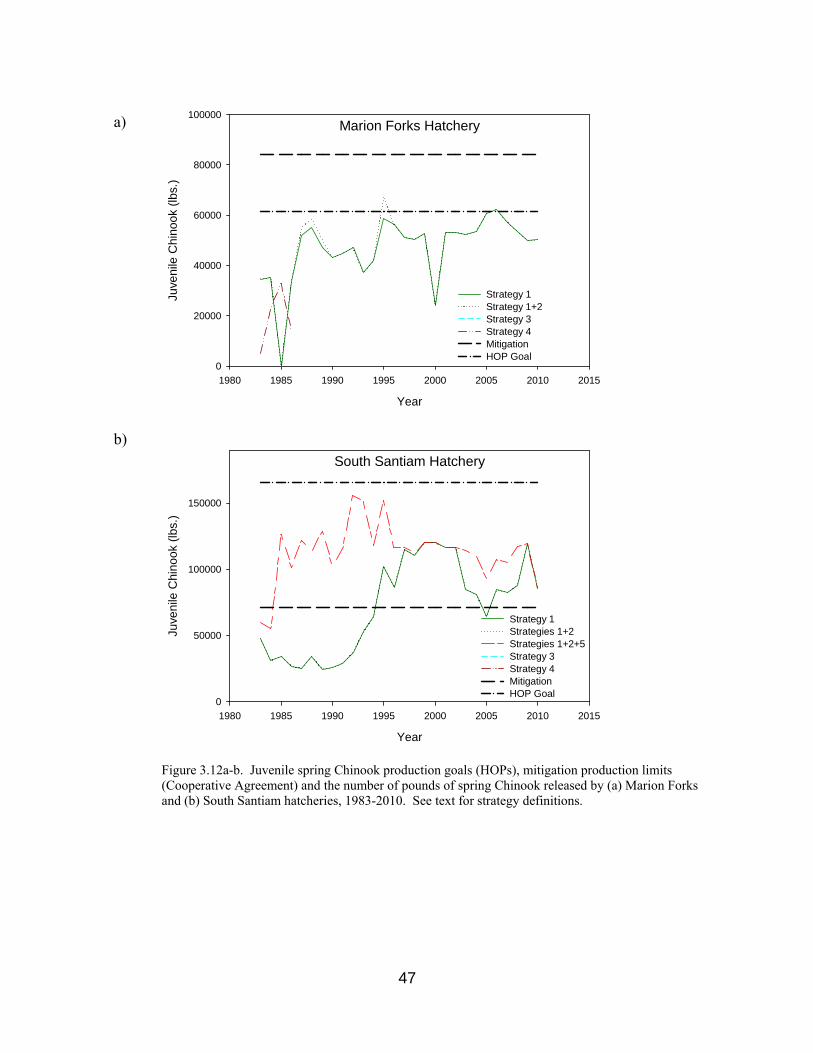
a) Marion Forks Hatchery
Year
1980 1985 1990 1995 2000 2005 2010 2015
Juve
nile
Chi
nook
(lbs
.)
0
20000
40000
60000
80000
100000
Strategy 1Strategy 1+2Strategy 3Strategy 4MitigationHOP Goal
b) South Santiam Hatchery
Year
1980 1985 1990 1995 2000 2005 2010 2015
Juve
nile
Chi
nook
(lbs
.)
0
50000
100000
150000
Strategy 1Strategies 1+2Strategies 1+2+5Strategy 3Strategy 4MitigationHOP Goal
Figure 3.12a-b. Juvenile spring Chinook production goals (HOPs), mitigation production limits (Cooperative Agreement) and the number of pounds of spring Chinook released by (a) Marion Forks and (b) South Santiam hatcheries, 1983-2010. See text for strategy definitions.
47
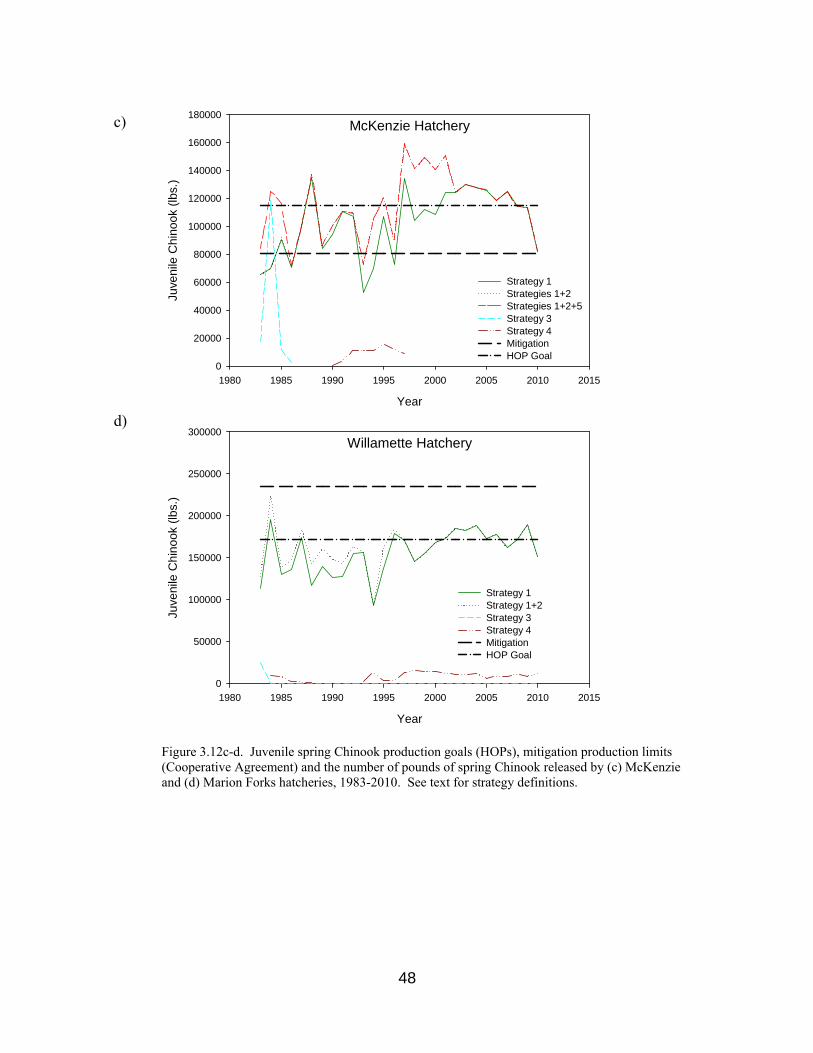
c) McKenzie Hatchery
Year
1980 1985 1990 1995 2000 2005 2010 2015
Juve
nile
Chi
nook
(lbs
.)
0
20000
40000
60000
80000
100000
120000
140000
160000
180000
Strategy 1Strategies 1+2Strategies 1+2+5Strategy 3Strategy 4MitigationHOP Goal
d)
Willamette Hatchery
Year
1980 1985 1990 1995 2000 2005 2010 2015
Juve
nile
Chi
nook
(lbs
.)
0
50000
100000
150000
200000
250000
300000
Strategy 1Strategy 1+2Strategy 3Strategy 4MitigationHOP Goal
Figure 3.12c-d. Juvenile spring Chinook production goals (HOPs), mitigation production limits (Cooperative Agreement) and the number of pounds of spring Chinook released by (c) McKenzie and (d) Marion Forks hatcheries, 1983-2010. See text for strategy definitions.
48
Year
1980 1985 1990 1995 2000 2005 2010
Num
ber R
elea
sed
0
2000000
4000000
6000000
8000000
10000000
FryFingerlingsSmolts
Figure 3.13. Annual number of fry, fingerling and smolt stage spring Chinook liberated from UWR hatcheries, 1978-2009. Data obtained from HMIS.
3.7.1 Fry Fry stage spring Chinook have been routinely released by UWR hatcheries. The estimated number of fish and release site are recorded onto Fish Liberation Reports (FLRs). FLR data have been maintained in HMIS since 1978, though the earliest HMIS record for a UWR fry liberation is from Marion Forks Hatchery in 1980 (212,962 fry, released into Green Peter Reservoir). The most recent records (2009) are from Willamette Hatchery (311,591 fry released into Lookout Point Reservoir; and 171,234 fry released into Hills Creek Reservoir), and McKenzie Hatchery (70,176 fry released into the Mohawk River). From 1980 to 2009, UWR hatcheries released a total 56,689,177 fry stage spring Chinook. The majority of these releases were from Willamette Hatchery (Figure 3.14). Fry have typically been released unmarked, precluding analyses of survivorship or productivity. 3.7.2 Fingerlings Fingerling stage spring Chinook are routinely released from UWR hatcheries. For each liberation of fingerlings, the estimated number of fish and liberation site are recorded by hatchery personnel through FLRs. These data are maintained in the HMIS. The earliest HMIS records for UWR fingerlings liberations are from 1979: South Santiam Hatchery (87,915 fingerlings released into the Willamette River and 106,821 fingerlings released into the South Fork Santiam River), Marion Forks Hatchery (two releases totaling 961,273 fingerlings into the North Fork Santiam River), and McKenzie Hatchery (158,077 fingerlings released into Middle Fork Willamette and 432,723 fingerlings released into the McKenzie River). The most recent fingerling liberation record is from Marion Forks Hatchery, which released 150,570 fingerlings into Detroit Reservoir and 1,503 fingerlings into Big Lake in 2009. During 1980-2009, UWR hatcheries have released a total 13,081,371 fingerling stage spring Chinook. Most of these releases have been from Marion Forks Hatchery (Figure 3.14), though Willamette Hatchery has released nearly as many during this period.
49
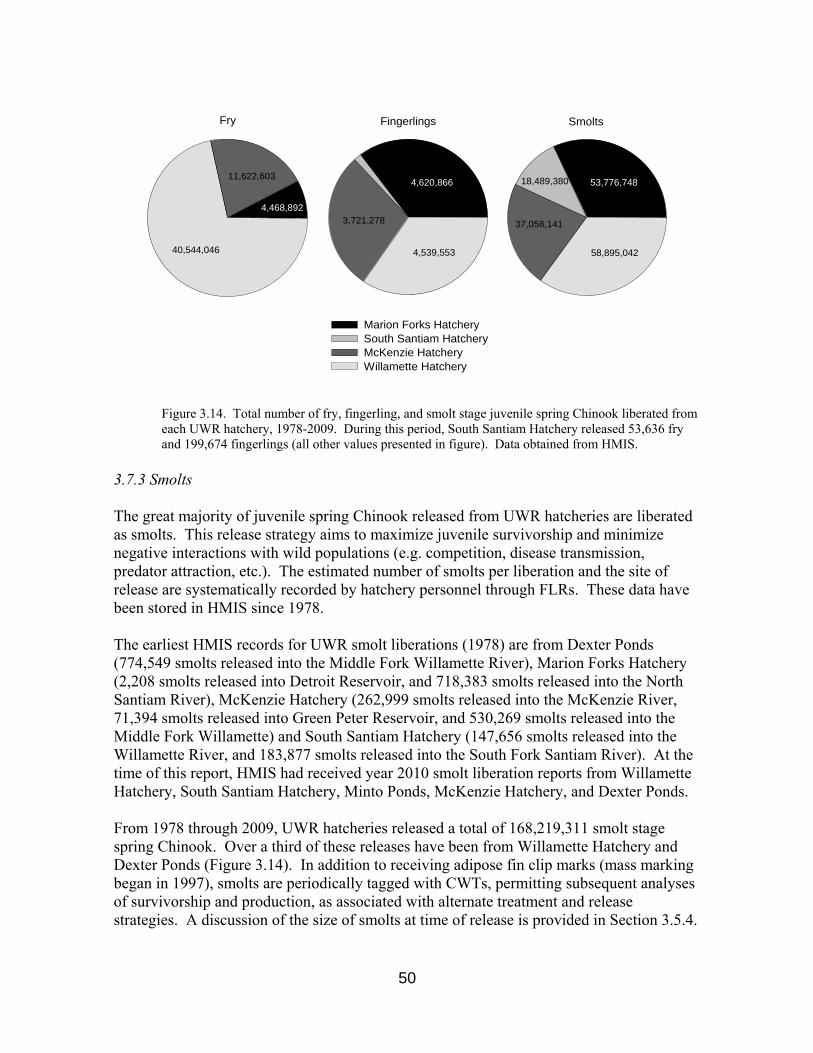
Fingerlings
Marion Forks HatcherySouth Santiam HatcheryMcKenzie HatcheryWillamette Hatchery
Fry Smolts
40,544,046
11,622,603
4,468,892
4,539,553
4,620,866
3,721,278
58,895,042
37,058,141
18,489,380 53,776,748
Figure 3.14. Total number of fry, fingerling, and smolt stage juvenile spring Chinook liberated from each UWR hatchery, 1978-2009. During this period, South Santiam Hatchery released 53,636 fry and 199,674 fingerlings (all other values presented in figure). Data obtained from HMIS.
3.7.3 Smolts The great majority of juvenile spring Chinook released from UWR hatcheries are liberated as smolts. This release strategy aims to maximize juvenile survivorship and minimize negative interactions with wild populations (e.g. competition, disease transmission, predator attraction, etc.). The estimated number of smolts per liberation and the site of release are systematically recorded by hatchery personnel through FLRs. These data have been stored in HMIS since 1978. The earliest HMIS records for UWR smolt liberations (1978) are from Dexter Ponds (774,549 smolts released into the Middle Fork Willamette River), Marion Forks Hatchery (2,208 smolts released into Detroit Reservoir, and 718,383 smolts released into the North Santiam River), McKenzie Hatchery (262,999 smolts released into the McKenzie River, 71,394 smolts released into Green Peter Reservoir, and 530,269 smolts released into the Middle Fork Willamette) and South Santiam Hatchery (147,656 smolts released into the Willamette River, and 183,877 smolts released into the South Fork Santiam River). At the time of this report, HMIS had received year 2010 smolt liberation reports from Willamette Hatchery, South Santiam Hatchery, Minto Ponds, McKenzie Hatchery, and Dexter Ponds. From 1978 through 2009, UWR hatcheries released a total of 168,219,311 smolt stage spring Chinook. Over a third of these releases have been from Willamette Hatchery and Dexter Ponds (Figure 3.14). In addition to receiving adipose fin clip marks (mass marking began in 1997), smolts are periodically tagged with CWTs, permitting subsequent analyses of survivorship and production, as associated with alternate treatment and release strategies. A discussion of the size of smolts at time of release is provided in Section 3.5.4.
50
51
3.7.4 Release Strategies Alternate release strategies have been employed by UWR hatcheries to improve homing rates, mimic “wild-type” outmigration life histories, and reduce the potential for negative interactions with native fish populations. These alternate strategies include releasing juveniles of variable sizes at multiple release locations and seasons. All releases (liberations), transfers and receipts of non-fry juvenile Chinook are recorded onto FLRs. Data from FLRs have been stored in HMIS since 1978. R2 Resource Consultants (2006) used data from CWT recoveries to model the relative contributions to UWR adult returns associated with alternate hatchery release strategies; namely, length at time of release, fall vs. spring releases, location of releases and number of juveniles in release group. In brief, their findings indicated that different combinations of these explanatory variables were significantly associated with adult returns at each hatchery (i.e. no single set of variables best explained variation of adult returns for all hatcheries). 3.7.4.1 Volitional vs. Forced Releases Juvenile spring Chinook are either allowed to exit acclimation and release ponds by their own volition, or are forced out of these areas. These alternate release strategies are only occasionally recorded as comments on FLRs. 3.7.4.2 Offsite Releases Extensive offsite releases (those from locations other than the hatchery) of juvenile spring Chinook have been made by UWR hatcheries. Offsite releases have been motivated by interests to re-populate vacant habitats (e.g. releases into the Molalla River, above USACE dams, etc.), support commercial and sport fisheries (net pen and Youngs Bay releases), support STEP activities, and facilitate research (e.g. dam passage studies). Efforts to evaluate the effects of offsite releases have at times been plagued by small sample sizes of tagged fish (Smith et al. 1978). However, R2 Resource Consultants used CWT data from RMIS to test for associations between release locations and contribution rates (number of tagged fish recovered/number of fish tagged). Their results, from generalized linear regression analyses, suggested that South Santiam Hatchery fish released directly into the Willamette River were recovered at higher rates than when released into the South Santiam River. In contrast, McKenzie Hatchery fish released into the McKenzie River were associated with higher contribution rates than when fish from this hatchery were released into the Willamette River. No statistically significant relationships between release location and contribution rates were found for either Marion Forks or Willamette hatchery spring Chinook. A discussion of associations between offsite releases and homing by McKenzie hatchery spring Chinook has been provided in Section 3.1.3. Both Marion Forks and Willamette hatcheries regularly perform offsite releases at Minto and Dexter ponds, respectively, to circumvent dams and reservoirs below the hatchery
52
facilities. Excluding these routine releases, the number of juvenile fish released offsite by UWR hatcheries has generally decreased in recent years. For example, beginning in 1997 out-of-basin releases by McKenzie Hatchery began to steadily decline, and by 2002 all McKenzie production has been released within the McKenzie River sub-basin (Table 3.8). However, in 2010, approximately 125,000 McKenzie Hatchery juvenile Chinook were released into the lower Columbia River at Youngs Bay, in support of the Select Area Fisheries Enhancement (SAFE) program. These releases represent hatchery production that exceeds mitigation requirements, as the Cooperative Agreement mandates that the mitigation component of UWR hatchery production be released “primarily” into the sub-basin of hatchery operation, “and, at least totally within the Willamette River Basin”. Current plans project similar SAFE program releases of 250,000 McKenzie juveniles per year, for the next three years (M. Farinas, ODFW, personal communication). 3.7.4.3 Timing of Releases Hatchery releases of UWR juvenile spring Chinook have traditionally taken place in the late winter/spring months (February-April), and in the fall (October-December). These release timings (spring and fall) have aimed to mimic outmigration timings of natural production UWR spring Chinook. In their analysis of contribution rates, R2 Resource Consultants (2006) found that time of release was significantly associated with contribution rates for Marion Forks Hatchery spring Chinook. Results from that study suggested that fish released in the spring were recovered as adults at higher rates than fish released in the fall. Similarly, juvenile Chinook released into the McKenzie River in the spring presented significantly higher contribution rates than fish released into the McKenzie River in the fall. Interestingly, our analysis of homing rates (Section 3.1.3) suggested that McKenzie River fall releases were also more likely to stray than fish released in the spring. 3.8 Tracking Juvenile Movements and Downstream Migration By tracking movements of juvenile hatchery and wild Chinook, researchers and managers have gained greater understanding of spring Chinook outmigration patterns and the effectiveness of downstream passage facilities throughout the UWR. Information obtained through tracking studies serve to inform RPAs 4.10, 4.11, 6.2.4 and 9.5.1 (NMFS 2008).
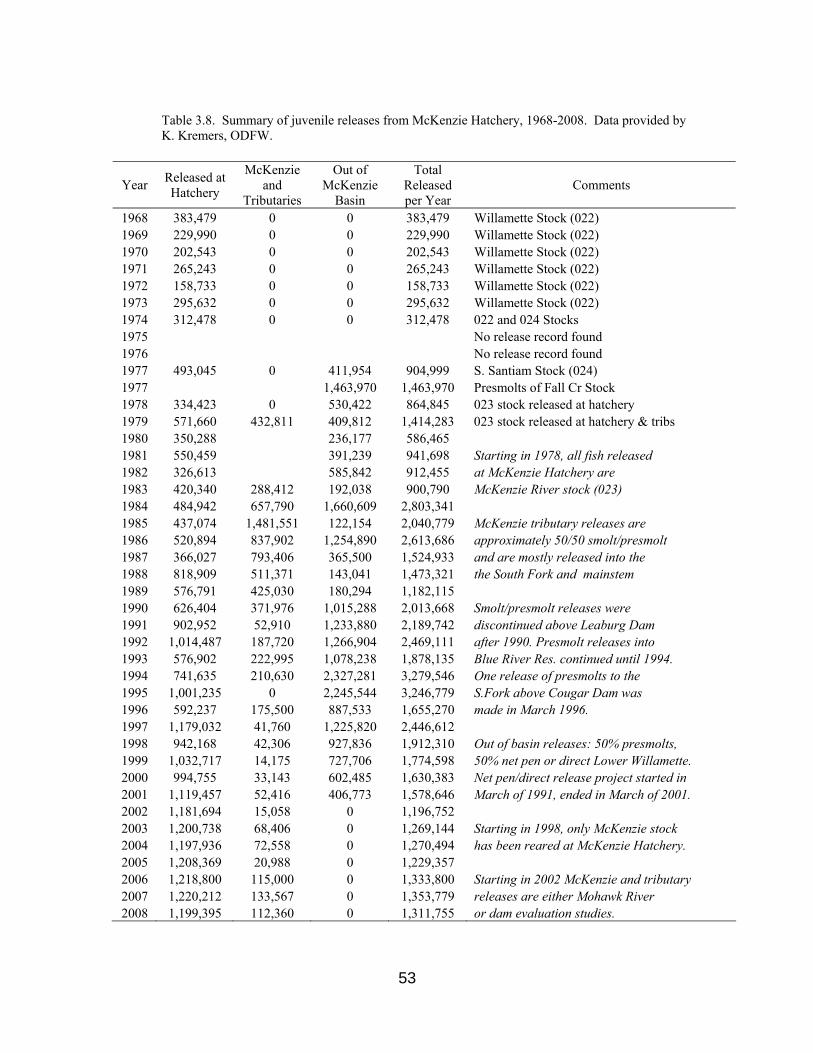
53
Table 3.8. Summary of juvenile releases from McKenzie Hatchery, 1968-2008. Data provided by K. Kremers, ODFW.
Year Released at Hatchery
McKenzie and
Tributaries
Out of McKenzie
Basin
Total Released per Year
Comments
1968 383,479 0 0 383,479 Willamette Stock (022) 1969 229,990 0 0 229,990 Willamette Stock (022) 1970 202,543 0 0 202,543 Willamette Stock (022) 1971 265,243 0 0 265,243 Willamette Stock (022) 1972 158,733 0 0 158,733 Willamette Stock (022) 1973 295,632 0 0 295,632 Willamette Stock (022) 1974 312,478 0 0 312,478 022 and 024 Stocks 1975 No release record found 1976 No release record found 1977 493,045 0 411,954 904,999 S. Santiam Stock (024) 1977 1,463,970 1,463,970 Presmolts of Fall Cr Stock 1978 334,423 0 530,422 864,845 023 stock released at hatchery 1979 571,660 432,811 409,812 1,414,283 023 stock released at hatchery & tribs 1980 350,288 236,177 586,465 1981 550,459 391,239 941,698 Starting in 1978, all fish released 1982 326,613 585,842 912,455 at McKenzie Hatchery are 1983 420,340 288,412 192,038 900,790 McKenzie River stock (023) 1984 484,942 657,790 1,660,609 2,803,341 1985 437,074 1,481,551 122,154 2,040,779 McKenzie tributary releases are 1986 520,894 837,902 1,254,890 2,613,686 approximately 50/50 smolt/presmolt 1987 366,027 793,406 365,500 1,524,933 and are mostly released into the 1988 818,909 511,371 143,041 1,473,321 the South Fork and mainstem 1989 576,791 425,030 180,294 1,182,115 1990 626,404 371,976 1,015,288 2,013,668 Smolt/presmolt releases were 1991 902,952 52,910 1,233,880 2,189,742 discontinued above Leaburg Dam 1992 1,014,487 187,720 1,266,904 2,469,111 after 1990. Presmolt releases into 1993 576,902 222,995 1,078,238 1,878,135 Blue River Res. continued until 1994. 1994 741,635 210,630 2,327,281 3,279,546 One release of presmolts to the 1995 1,001,235 0 2,245,544 3,246,779 S.Fork above Cougar Dam was 1996 592,237 175,500 887,533 1,655,270 made in March 1996. 1997 1,179,032 41,760 1,225,820 2,446,612 1998 942,168 42,306 927,836 1,912,310 Out of basin releases: 50% presmolts, 1999 1,032,717 14,175 727,706 1,774,598 50% net pen or direct Lower Willamette. 2000 994,755 33,143 602,485 1,630,383 Net pen/direct release project started in 2001 1,119,457 52,416 406,773 1,578,646 March of 1991, ended in March of 2001. 2002 1,181,694 15,058 0 1,196,752 2003 1,200,738 68,406 0 1,269,144 Starting in 1998, only McKenzie stock 2004 1,197,936 72,558 0 1,270,494 has been reared at McKenzie Hatchery. 2005 1,208,369 20,988 0 1,229,357 2006 1,218,800 115,000 0 1,333,800 Starting in 2002 McKenzie and tributary 2007 1,220,212 133,567 0 1,353,779 releases are either Mohawk River 2008 1,199,395 112,360 0 1,311,755 or dam evaluation studies.
54
3.8.1 PIT Tags Schroeder et al. (2001) used PIT tags to track the downstream migration of juvenile spring Chinook from the McKenzie and Middle Fork Willamette rivers. In 2000-2001, a total of 5,600 natural origin smolts were tagged, in addition to 1,000 hatchery origin fish from the McKenzie Hatchery. Both active recapture (by screwtrap and tag interrogation) and fixed station passive interrogation methods were used to detect downstream migration of tagged fish. All tagging data were uploaded into the Pacific States Marine Fisheries Commission’s PIT tag database. Growth was also estimated, using data from recaptures. The results of this study suggested that hatchery Chinook released into the McKenzie River in the fall outmigrate much faster than wild fish from any tagging group (Schroeder et al. 2001). Wild fish tagged at Leaburg Dam in March and April were typically detected at Willamette Falls 46 days later (median), whereas natural origin fish tagged in the late summer and fall were typically not detected at Willamette Falls until the following spring. These finding were partially corroborated by subsequent studies (Schroeder et al. 2003), though equipment failures resulted in a dearth of data during key periods. 3.8.2 Acoustic Tags Schreck et al. (1994) used acoustic tags in the UWR to study the effects of oxygen supplemented high-density rearing conditions on Willamette Hatchery juvenile spring Chinook outmigration behavior and physiology. By tracking a total of 120 outmigrating juvenile Chinook over the course of six years (1989-1994), coupled with histology assays and morphometric analyses, they observed and recorded a wide range of movement behaviors and physiological changes associated with smoltification, outmigration and alternate hatchery rearing treatments. Principle among their findings were: 1) low rates of residualism by (large) hatchery spring Chinook smolts, 2) significantly elevated plasma cortisol levels after liberation, 3) prolonged delays in downstream movement upon arriving at Willamette Falls, and 4) migration rate was positively correlated with river velocity. Among years, hatchery rearing conditions did not appear to be consistently associated with any particular migratory behavior or physiological response (Schreck et al. 1994). Acoustic tags have also been used to study adult spring Chinook movements in the UWR (M. Hogansen, ODFW, personal communication), evaluate tagging stress (Jepsen et al. 2001), track juvenile movements in the lower Willamette River (Ward et al. 1994, Friesen et al. 2007) and assess avian predation on juvenile Chinook in the lower Columbia River (Schreck et al. 2006). 3.8.3 Genetic Tags Although genetic tags (e.g. microsatellite genotypes) have not been used in routine UWR hatchery RM&E, tissue samples have been collected from all UWR spring Chinook hatchery populations. Microsatellite genotypes have been obtained from some populations (Myers et al. 2006) and incorporated into genetic baselines used for mixed-stock analyses (Seeb et al. 2007, Teel et al. 2009). The South Santiam hatchery population has not been genetically characterized.
55
Teel et al. (2009) used microsatellites to discriminate juvenile Willamette River spring Chinook from other stocks occupying riverine and flooded wetland habitats of the lower Willamette River. Their results suggested that natural origin spring Chinook from the UWR utilize flooded wetland habitats of the lower Willamette River during winter and spring. In a previous study, Teel et al. (2002) used microsatellite data to provide evidence for introduced Tule fall Chinook in the Santiam and Willamette rivers in 2002. Releases of fall Chinook into UWR sub-basins had been discontinued in 1996, indicating that these samples represented self-sustaining, relict populations. These populations apparently persist today, based on ODFW fish passage monitoring at Willamette Falls. Additional sampling and analysis would be required to develop a baseline of genetic data that would allow sub-basin stock-specific genetic identification for UWR spring Chinook. 3.9 Estuary and Plume Studies Estuary and plume studies of spring Chinook have typically fallen outside the scope of routine UWR hatchery operations. Nevertheless, UWR hatcheries have provided support to studies carrying some focus on spring Chinook biology in these environments. These include investigations of juvenile survivorship, size at ocean entry (Ewing and Ewing 2002), and genetics based mixed-stock analyses (Lundrigan et al. 2004). Roegner et al. (2008) and Fresh et al. (2005) also used genetic mixed stock analyses to identify juvenile UWR spring Chinook from samples collected in the lower Columbia River estuary. Roegner et al. (2008) found UWR spring Chinook to occur in higher abundance along forested areas (as compared to shrub/scrub vegetation) and in greater numbers during May than July. Nevertheless, in view of the perceived importance of estuary and plume habitats, relatively few studies have focused on UWR spring Chinook in these environments. A recent study of juvenile Chinook and steelhead (PNNL 2010) demonstrated the potential of the Juvenile Salmon Acoustic Telemetry System (JSATS) for collecting salmonid passage route, behavioral and survivorship data in the lower Columbia River. This technology could prove useful for future studies of UWR spring Chinook in the estuary environment. 3.10 Adult Ocean Distribution UWR hatcheries have not been directly involved with efforts to elucidate patterns of marine distributions of adult spring Chinook. However, by providing genetic samples and CWT data to collaborating organizations, UWR hatcheries have assisted other state, Federal and private entities in their efforts to better understand this facet of Chinook life history. In response to broad-scale Chinook harvest moratoriums and the need for a better understanding of marine distributions for threatened and endangered salmon populations, a collaborative effort was established between multiple state and Federal agencies and the
56
commercial salmon fishing industry. Project CROOS (http://projectcroos.com/) coordinated ocean sampling efforts, initially performed by specially-permitted commercial fishing vessels, with laboratories performing genetics based mixed-stock analyses. The goal of this effort was to describe the temporospatially dynamic stock structure of Chinook salmon along the Oregon coast. UWR spring Chinook genotypes were included among the 166 populations of the GAPS microsatellite (genetic) baseline, used to make population assignments (Seeb et al. 2007). Accordingly, estimates were made for the relative abundance of Willamette spring Chinook within the total sample of fish collected. Initial results from Project CROOS indicated that, in 2006, UWR Chinook were harvested at relatively low levels along the Oregon coast, accounting for <0.12% of total catch (Oregon Salmon Commission 2007). Samples collected in 2007 indicated that UWR spring Chinook again comprised only a small fraction (≤0.5%) of total catch (Oregon Salmon Commission 2008). This project has now expanded to incorporate samples collected from California and Washington, and operates as Westcoast GSI. Future studies carry the potential to provide ocean distribution information for UWR spring Chinook over a much broader scale than previous efforts. Analyses of marine-based CWT recovery data have also provided insight toward the ocean distributions of UWR hatchery spring (and other) Chinook populations. The low cost of CWTs has made it possible for UWR hatcheries to tag large numbers of juvenile spring Chinook. Large data sets gleaned from ongoing CWT efforts have facilitated analyses of Chinook ecology over broad temporal and spatial scales. For example, Weitkamp (2010) used the RMPC’s prodigious CWT database (RMIS) to analyze marine distributions of west coast Chinook populations (including UWR spring Chinook) from 25 years of tag recovery data. These findings indicated that significant spatial structuring of Chinook populations exists in the marine environment, and that UWR spring Chinook tend to be recovered (harvested) from more northerly marine locations (southeast Alaska and British Columbia) than (introduced) fall Chinook from the Willamette River, which were typically harvested along the Washington State coast. Weitkamp (2010) also found that Chinook tended to be recovered from more remote locations with increased “ocean age”. 3.11 Harvest For over a century, UWR spring Chinook have been harvested by multiple fisheries in the marine, lower Columbia and Willamette rivers. Harvest is intensively regulated through season, location and allowable gear for sport, commercial, and tribal fisheries. Adipose fin clips have not been used as a management tool in marine Chinook fisheries and both hatchery and natural origin UWR spring Chinook are harvested by commercial and recreational fisheries. Ocean harvest impacts on natural origin UWR spring Chinook are difficult to quantify and largely unknown. Although, as discussed in the previous section, the majority of ocean catch of UWR hatchery spring Chinook occurs in southeast Alaska and British Columbia, Canada.
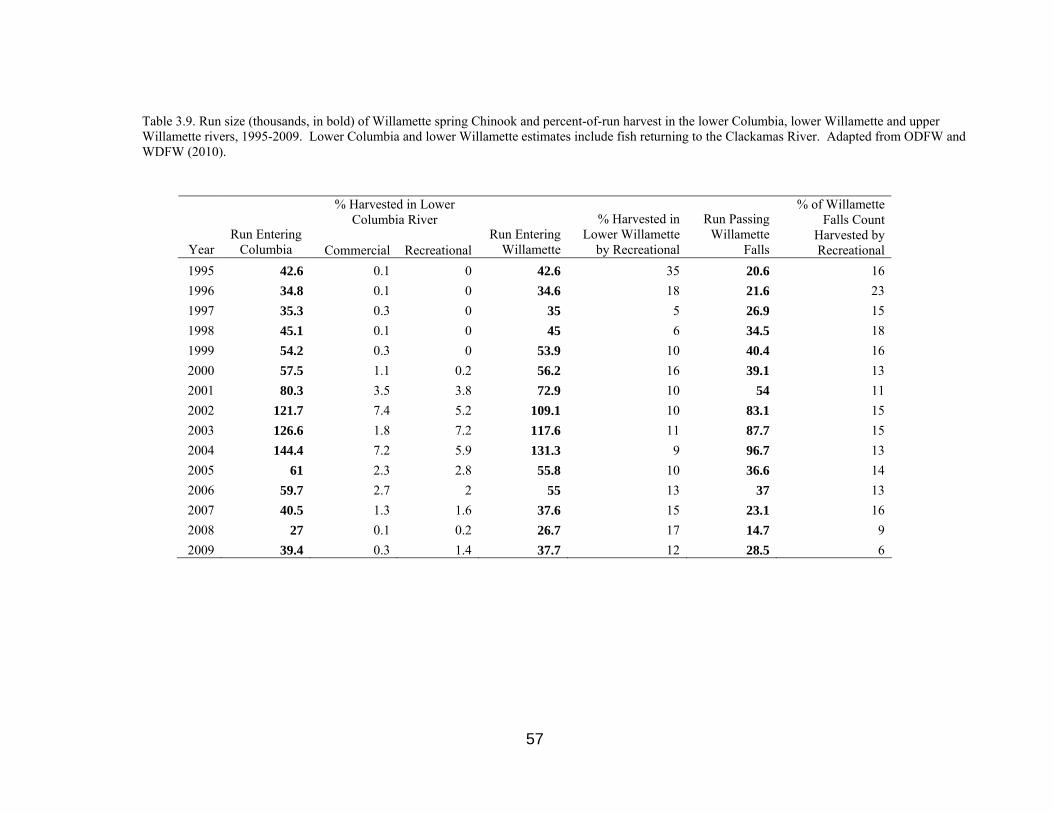
57
Table 3.9. Run size (thousands, in bold) of Willamette spring Chinook and percent-of-run harvest in the lower Columbia, lower Willamette and upper Willamette rivers, 1995-2009. Lower Columbia and lower Willamette estimates include fish returning to the Clackamas River. Adapted from ODFW and WDFW (2010).
% Harvested in Lower Columbia River
Year Run Entering
Columbia Commercial Recreational Run Entering
Willamette
% Harvested in Lower Willamette
by Recreational
Run Passing Willamette
Falls
% of Willamette Falls Count
Harvested by Recreational
1995 42.6 0.1 0 42.6 35 20.6 16 1996 34.8 0.1 0 34.6 18 21.6 23 1997 35.3 0.3 0 35 5 26.9 15 1998 45.1 0.1 0 45 6 34.5 18 1999 54.2 0.3 0 53.9 10 40.4 16 2000 57.5 1.1 0.2 56.2 16 39.1 13 2001 80.3 3.5 3.8 72.9 10 54 11 2002 121.7 7.4 5.2 109.1 10 83.1 15 2003 126.6 1.8 7.2 117.6 11 87.7 15 2004 144.4 7.2 5.9 131.3 9 96.7 13 2005 61 2.3 2.8 55.8 10 36.6 14 2006 59.7 2.7 2 55 13 37 13 2007 40.5 1.3 1.6 37.6 15 23.1 16 2008 27 0.1 0.2 26.7 17 14.7 9 2009 39.4 0.3 1.4 37.7 12 28.5 6
58
The 2010 Joint Staff Report (ODFW and WDFW 2010) summarized extensive data for UWR spring Chinook fisheries. This report presented run size and harvest numbers, as well as percent-of-run harvest estimates for the lower Columbia, lower Willamette and upper Willamette commercial and recreational fisheries. A portion of these data are presented in Table 3.9. Historical harvest data of Willamette spring Chinook have also been presented in the Fisheries Management and Evaluation for 2006 Willamette River Spring Chinook report (ODFW 2007). Included in this report are lower Willamette harvest estimates dating to 1946, harvest data for individual sub-basins, as well as recent estimates for harvest impacts to natural origin populations. These impact estimates range from 2.1-14%, declining sharply after year 2000. Catch records may represent the most abundant data source available to researchers and managers. Many ad hoc analyses could be performed with harvest data, which are often associated with tag and release record information. However, conclusions made from such analyses should not ignore the often variable regulatory and environmental contexts from which harvest data have been collected. Moreover, analyses should be performed through well defined inquiry and employ appropriate statistical approaches.
59
CHAPTER 4 Relating Available Data to Research, Management and Evaluation 4.1 Context of Analysis The previous chapter provided a review of data collected by UWR hatcheries and collaborating researchers, as well as the means used to collect and store them. In this chapter, we assess the degree to which these data and current data management strategies address key RM&E information needs. Peven and Keefe (2010) presented a suite of variables that they stated would be “needed to evaluate each hatchery program or subbasin”. These variables are presented as Table 7.1 of the Willamette Hatchery Mitigation Program Research, Monitoring, and Evaluation Plan (Peven & Keefe 2010), and include measures of both hatchery and natural origin spring Chinook populations of the UWR basin. 4.2 Approach With the aim of assessing existing UWR spring Chinook data and data management, in view of their applicability to address variables of Table 7.1 of Peven & Keefe (2010), we developed an Information Quality (IQ) Index for each variable, calculated as the sum of scores for five IQ metrics (Table 4.1). Each IQ metric describes an aspect of data collection or storage, and has been scored in a binary fashion. Accordingly, an IQ Index score of five for a given variable represents the highest possible score, with zero being the lowest possible score. We performed this analysis independently for each UWR hatchery, and present all scores in Appendices A1-4.
Table 4.1. Information quality metrics used to calculate IQ Index scores for relating UWR spring Chinook hatchery data to RM&E variables identified by Peven and Keefe (2010).
# Metric Scoring Min Max 1 Data have been collected Yes = 1, No = 0 0 1 2 Data have been collected regularly (e.g. annually) Yes = 1, No = 0 0 1 3 A standardized data collection template exists Yes = 1, No = 0 0 1 4 Data collection is currently ongoing Yes = 1, No = 0 0 1 5 Data stored in HMIS or other centralized database Yes = 1, No = 0 0 1
Total Score 0 5 4.3 Results A total of 93 variables were considered in this analysis. Variables tended to score at either the low or high extremes of the IQ Index, with few scores ranging between one and three (Figure 4.1). Of the 93 variables considered, 34 variables received a maximum IQ Index score of five for all sub-basins, yet a score of zero was the second most common IQ Index score in all sub-basins. Variables that addressed juvenile migration, hatchery-wild
interactions, or aspects of natural origin populations comprised the majority of zero IQ Index scores for all hatcheries/sub-basins. The vast majority of variables scored equally among sub-basins (Appendices A1-4). Differences in scores were attributable to data collection for genetics and mortality of natural origin adult outplants. In all sub-basins, 22 variables received IQ Index scores equal to four, yet all of these would have received maximum scores if data had been stored in a centralized database (IQ metric 5).
IQ Index Score
0 1 2 3 4 5
Num
ber o
f Var
iabl
es
0
10
20
30
40
Figure 4.1 Histogram of the number of RM&E variables (Peven and Keefe 2010) receiving IQ Index scores 0 through 5 for Willamette Hatchery and the Middle Fork Willamette spring Chinook populations.
4.4 Implications Our findings suggest both strengths and shortcomings of past and present hatchery RM&E. activities. First, it appears that information collected by UWR hatcheries and collaborating researchers may adequately address the majority of variables identified by Peven & Keefe (2010). Second, there is a clear need for centralized data management for much of the information collected through UWR RM&E. This issue is currently being addressed by ODFW, as alternate data management systems are now being considered. Finally, our findings suggest that past and present RM&E activities have provided little information on juvenile migration patterns, hatchery-wild interactions or the ecology of natural origin UWR spring Chinook populations.
60
The cause for apparent information gaps may stem from long-standing UWR hatchery goals. For example, the Cooperative Agreement makes no statement addressing research needs associated with natural origin populations, hatchery-wild interactions or the study of juvenile outmigration patterns. Nevertheless, numerous RPAs of the 2008 Willamette River Biological Opinion (NMFS 2008) recommend maintaining hatchery populations as similar

61
to wild stocks as possible, suggesting that future RM&E activities should involve an increased focus on natural origin populations, the biological templates after which hatchery populations are to be modeled.
62
CHAPTER 5 Critical Uncertainties and Recommended Actions 5.1 Critical Uncertainties Throughout this document, we have identified a number of critical uncertainties associated with UWR hatchery programs. The sources of uncertainties associated with UWR spring Chinook hatchery programs range from prioritization of program goals, to the effects of specific management actions. Here we review those information gaps which we perceived as most evident and potentially threatening to program success. 5.1.1 Hatchery Program Goals and Objectives As discussed in Chapter 2, the Willamette Project Biological Opinion presents inconsistencies with respect to identifying primary goals of UWR spring Chinook hatcheries (NMFS 2008). Without clearly defined goals, universally recognized among action agencies, there can be no objective basis for program evaluation. Consequently, any modifications to program management in absence of established goals would lack justification. Inconsistencies among stated program goals may therefore represent the most fundamental and potentially debilitating critical uncertainty affecting UWR hatchery management. 5.1.2 Population Characteristics A sound understanding of the biology and ecology of both hatchery and natural origin populations should form the basis for UWR hatchery management. Unfortunately, major information gaps exist for a number of biological characteristics of both hatchery and wild UWR spring Chinook populations. These information gaps could potentially encumber efforts to manage hatchery populations in accordance with existing goals. 5.1.2.1 Hatchery Origin Populations Few or no data have been collected which describe hatchery spring Chinook:
• Population genetic structure – Although genetic analyses have been conducted with North Santiam and McKenzie population samples, no analysis of the South Santiam hatchery population has been performed. Furthermore, juvenile samples from the Middle Fork Willamette have likely contributed to misleading population divergence estimates (Myers et al. 2006).
• Effective population sizes – No estimates of effective population size have been made for any hatchery population. Analyses typically require genetic samples from multiple generations.
63
• Juvenile outmigration patterns – Few data have been collected that elucidate the rates and patterns of juvenile spring Chinook migrations in the UWR. Data for fry releases are conspicuously absent.
• Use of estuary and plume environments – Although Chinook salmon survivorship can be greatly affected by residency and passage through the Columbia River estuary and plume (PNNL 2010), few data have been collected for UWR spring Chinook in these environments.
5.1.2.2 Natural Origin Populations Few or no data have been collected which describe natural origin spring Chinook:
• Straying rates – No reliable estimates of straying rates by natural origin populations have been made. Admittedly, such data can be particularly difficult to collect, as large tagging and recovery projects involving natural origin populations can be costly, relatively inefficient and involve otherwise unnecessary handling of ESA-listed species. Nevertheless, indirect estimates of migration rates could be made from population genetic data (Wilson and Rannala 2003).
• Population genetic structure – Myers et al. (2006) presented some information on
the population genetic structure of UWR spring Chinook. However, these data appear to be biased by the inclusion of juvenile samples.
• Effective population sizes – No estimates of effective population sizes have been
made for any natural origin UWR spring Chinook population. • Juvenile outmigration patterns – Schroeder et al. (2001, 2003) and Friesen et al.
(2007) provided some information on outmigration patterns of juvenile natural origin spring Chinook. However, these data were limited to relatively large Chinook smolts. Natural origin spring Chinook are believed to present a wide range of life histories associated with outmigration patterns, yet few supporting quantitative data have been collected.
• Relative reproductive success –Relative reproductive successes of spring Chinook
from different age and size classes, as well as life histories, have not been examined in the UWR basin.
• Use of estuary and plume environments – Despite the perceived importance of these
habitats with respect to survivorship, few studies document the use of estuary or plume environments by UWR natural origin spring Chinook.
5.1.2.3 Interactions among Populations Although spawning surveys provide some indication for the level of interaction among hatchery and natural origin adult spring Chinook, few studies have focused on interactions among juveniles. Hatchery populations could present a number of threats to natural origin
64
spring Chinook, through the effects of competition, displacement, predation, and disease transmission. However, few data have been collected to evaluate the nature of interactions among juvenile UWR spring Chinook populations. 5.1.3 Effects of Hatchery Practices Throughout this report we have aimed to identify how alternate UWR hatchery management practices have influenced spring Chinook populations in the Willamette basin. For example, we have examined or cited evidence for associations between juvenile release strategies and straying rates, egg transfers and fry loss, and adult condition and pre-spawn mortality. Although these findings do not substantiate causal relationships, they do provide a basis for directed management. Other changes in hatchery practices have resulted in improved data collection and population monitoring. For example, mass marking protocols have allowed managers to quantify differences between hatchery and natural origin adult returns. However, the effects of many current and past hatchery practices remain unknown. Listed below are a number of critical uncertainties associated with UWR spring Chinook hatchery practices:
• Contribution to natural production resulting from adult outplanting – Adult outplanting programs have been in effect for over a decade. However, efforts to quantify juvenile production or smolt to adult recruitment (SAR) associated with these programs has only recently begun. Uncertainties related to adult outplanting success may manifest particularly serious consequences as natural origin spring Chinook are incorporated into these programs.
• Survivorship associated with fry and fingerling liberations – Although liberations of
fry and fingerling stage spring Chinook have been reduced considerably in recent years, the relative survivorships and contributions to adult returns associated with these juvenile releases are largely unknown. Such questions may remain entirely academic, however, as (unmarked) fry releases typically violate the objectives of mass marking programs.
• Alternate spawning protocols – The population fitness consequences of alternate
spawning protocols have gone largely untested. Numerous changes to UWR spawning protocols have been made in recent decades, yet no experiments to evaluate the effects of these changes have been performed. Effects that 1:1 spawning, natural origin integration or utilization of jacks might have over fitness or genetic diversity have gone undocumented for UWR populations. Carefully designed experiments, with appropriate treatments, controls and replication would be required to resolve these critical uncertainties.
• Rearing densities – Few data have been collected to evaluate the impacts that
alternate rearing densities might have over hatchery spring Chinook populations. Schreck et al. (1994) provided some information relating rearing densities to outmigration behavior and physiology. However, this work was conducted under
65
atypical experimental conditions, and the effects that practical, alternate rearing densities might have on juvenile UWR spring Chinook disease contraction, development, survivorship, and demography have not been carefully examined. Studies designed to evaluate the effects of rearing densities should be carefully designed, with adequate samples sizes and replication, so as to confidently detect differences among treatment groups (Palmisano and Elder 2001).
In addition to these specific examples of critical uncertainties, the impacts of alternate hatchery practices on natural origin spring Chinook populations are rarely quantified. Indeed, innumerous questions could be raised as to the potential effects of hatchery operations on natural origin populations. Accordingly, a prioritization of concerns must be invoked to avoid unstructured and inconsequential inquiry. Existing documents (e.g. HSRG 2009, Peven and Keefe 2010, HGMPs, Cooperative Agreement) could serve to help guide such a prioritization process. 5.1.4 Causes of Observed Phenomena Whereas the specific effects of alternate hatchery practices can sometimes be directly identified through careful experimentation, more difficult questions are often posed by observed phenomena without known cause. Such issues involve investigations aimed to identify the source(s) of variation for the variable of interest. We list two examples that represent critical uncertainties for some UWR spring Chinook hatcheries:
• Increased percent egg loss – As discussed in Section 3.4.3, numerous UWR hatcheries appear to be experiencing trends of increased percent egg loss. These trends might be explained by increased egg takes associated with disease culling initiated in the 1990s. However, this aspect of UWR hatchery operation appears to merit improved monitoring and analysis.
• Pre-spawn mortality of adult outplants – The work of Keefer et al. (2010) provided valuable insights toward potential causes for high pre-spawn mortality in adult outplanting programs. However, high variation in pre-spawn mortality rates among years and locations raises additional questions as to the underlying causes of this phenomenon. Continued efforts should be made to identify major sources of pre-spawn mortality in adult spring Chinook.
5.2 Recommended Actions Success of UWR spring Chinook hatchery programs will depend upon:
1) the clarity of program goals 2) the ability to recognize obstacles to achieving those goals, and 3) adaptive management aimed to overcome major obstacles
66
5.2.1 Hatchery Program Goals The success of any hatchery program relies upon clearly established and attainable goals (Waples 1999, HSRG 2009). Evidence suggests that various agencies and organizations maintain diverse perceptions of UWR spring Chinook hatchery goals (as discussed in Section 2.3). This finding underscores the need for a re-examination of UWR spring Chinook hatchery goals. It is our view that hatchery goals should be identified by pertinent action agencies and be reflected in clearly defined objectives with measurable outcomes. The practicality of simultaneously operating UWR spring Chinook hatcheries for mitigation, production and conservation purposes should be carefully considered, as program goals are reconsidered. Existing contradictions within management guidelines should be resolved, such that managers are presented with compatible and attainable objectives. 5.2.2 Expand Baseline Knowledge An expanded knowledge of both hatchery and natural origin spring Chinook populations will be necessary to develop management that reduces negative impacts of hatchery practices on natural origin populations. If future hatchery goals aim to either generate hatchery populations that mimic natural populations, or manage hatchery populations so as to avoid all interaction with natural populations, baseline biological knowledge of hatchery and wild populations will be needed. Fundamental aspects of UWR spring Chinook biology, including juvenile outmigration timing, age/stage at outmigration, growth, habitat use, survivorship and stock structure all warrant improved research efforts. This work should be executed through carefully designed scientific studies, conducted over temporal and spatial scales that will provide useful information to biologists and managers. 5.2.3 Evaluate Effects of Hatchery Practices The effects of changes in hatchery management practices should be examined through carefully designed scientific studies, whenever possible. Such studies should involve appropriate treatment and control groups, with adequate sample sizes and replication such to provide sufficient statistical power for analyses aimed at detecting effects. Although this approach will sometimes delay adaptive management processes, it will serve to inform managers as to the effects of their actions. This information could then be used to guide future management decisions with predictable outcomes. Throughout this report we have aimed to evaluate the effects of changes in hatchery management practices from archived data. Continued application of this approach would likely elucidate correlations and effects not yet recognized by UWR hatchery managers. Accordingly, we recommend that focused analyses continue to be made with historic data, so as to better understand the effects of past hatchery practices. Such analyses should not be considered “academic exercises”, but instead investigations aimed to identify potential tools for future management.
67
5.2.4 Identify Sources of Variation Concerted efforts should be made to identify sources of variation influencing hatchery spring Chinook survival, productivity and other key biological parameters. This process should involve clearly stated hypotheses and rigorous tests aimed to isolate those practices and factors that correlate with variable performances. Clear communication among hatchery managers, biologists, researchers and technicians would facilitate implementation and coordination of the measures we have proposed. We recommend that an open forum of communication be maintained among all parties involved with UWR spring Chinook hatchery management, such that novel information might be shared and applied among hatcheries. Acknowledgments The authors would like to thank the many individuals that made this report possible. In particular, ODFW hatchery managers B. Boyd, G. Grenbemer, K. Kremers and D. Peck provided much of the data presented in this review. Additional information and insight were provided by K. Schroeder, M. Farinas, F. Monzyk and M. Hogansen. HMIS queries were performed by C. Templen and S. Beals. T. Amandi provided fish health services information. Constructive reviews were provided by C. Tinus, K. Kenaston, K. Kremers, D. Leonhardt (USACE), L. Kruzic (NOAA), and C. Peven (Peven Consulting, Inc.).
68
References Alcorn, S. W., R. J. Pascho, A.L. Murray, and K.D. Shearer. 2003. Effects of ration level
on immune function in Chinook salmon (Oncorhynchus tshawytscha) Aquaculture 217: 529-545.
Allendorf, F.W., and S.R. Phelps. 1981. Use of allelic frequencies to describe population
structure. Canadian Journal of Fisheries and Aquatic Sciences. 38:150-1514. Araki, H., B. Cooper, and M. Blouin. 2009. Carry-over effects of captive breeding reduces
reproductive fitness of wild-born descendants in the wild. Biology Letters 5:621-624.
Altman, B., C. M. Henson, and I. R. Waite. 1997. Summary of information on aquatic biota
and their habitats in the Willamette basin, Oregon, through 1995. USGS Water-Resources Investigations Report 9-4023. 188 p.
Baldwin, D. H., J. A. Spromberg, T. K. Collier, and N. L. Scholz. 2009. A fish of many
scales: extrapolating sublethal pesticide exposures to the productivity of wild salmon populations. Ecological Applications 19: 2004-2015.
Beacham, T. D., K. L. Jonsen, J. Supernault, M. Wetklo, and L. Deng. 2006. Pacific rim
population structure of Chinook salmon as determined from microsatellite analysis. Transactions of the American Fisheries Society 135: 1604-1621.
Beckman, B. R., and D. A. Larsen. 2005. Upstream migration of minijack (age-2) Chinook
salmon in the Columbia River: Behavior, abundance distribution, and origin. Transactions of the American Fisheries Society 134:1520-1541.
Boatner, R., and C. Foster. 2001. Willamette River Basin Spring Chinook Hatchery
Sampling, 1995-2000. Oregon Department of Fish and Wildlife Technical Report. 21 p.
Cannon, B., R. Emig, T. A. Friesen, F. Monzyk, R. K. Schroeder, and C. A. Tinus. 2010.
Work completed for compliance with the 2008 Willamette Project Biological Opinion, USACE funding 2009. Oregon Department of Fish and Wildlife Annual Report to USACE. 56 p.
Dittman, A. H., T. P. Quinn, W.W. Dickhoff, and D. A. Larsen. 1994. Interactions
between novel water, thyroxine and olfactory imprinting in underyearling coho salmon (Oncorhynchus kisutch, Walbaum). Aquaculture and Fisheries Management 25 (Suppl. 2):157-169.
Dittman, A. H., T. P. Quinn, and G. A. Nevitt. 1996. Timing of imprinting to natural and
artificial odors by coho salmon (Oncorhynchus kisutch). Canadian Journal of Fisheries and Aquatic Sciences 53:434-442.
69
Elliot D. G., and R. J. Pascho. 2001. Evidence that coded-wire-tagging procedures can enhance transmission of Renibacterium salmoninarum in Chinook salmon. Journal of Aquatic Animal Health 13:181-193.
Firman, J., R. Schroeder, R. Lindsay, K. Kenaston, and M. Hogansen. 2004. Work
completed for compliance with the Biological Opinion for hatchery programs in the Willamette Basin, USACE funding: 2003. Oregon Department of Fish and Wildlife Technical Report. 48 p.
FitzGerald, J. L., T. F. Sheehan, and J. F. Kocik. 2004. Visibility of visual implant
elastomer tags in Atlantic salmon reared for two years in marine net-pens. North American Journal of Fisheries Management 24:222-227.
Fresh, K. L., E. Casillas, L. L. Johnson, and D. L. Bottom. 2005. Role of the estuary in the
recovery of Columbia River basin salmon and steelhead: an evaluation of the effects of selected factors on salmonid population viability. U.S. Dept. Commerce, NOAA Technical Memorandum NMFS-NWFSC-69, 105 pgs.
Friesen, T. A., J. S. Vile, and A. L. Pribyl. 2007. Outmigration of juvenile Chinook salmon
in the lower Willamette River, Oregon. Northwest Science 81:173-190. Gallagher, S. P., P. K. Hahn, and D. H. Johnson. 2007. Redd counts. Pp 197-234 in D.H.
Johnson, B.M. Shrier, J.S. ONeal, J.A. Knutzen, X Augerot and T.A. O’Neil (eds) Salmonid Field Protocols Handbook: Techniques for Assessing Status and Trends in Salmon and Trout Populations. American Fisheries Society, 478 pages.
Geist, D. R., J. Jones, C. J. Murray, and D. D. Dauble. 2000. Suitability criteria analyzed at
the spatial scale of redd clusters improved estimates of fall chinook salmon (Oncorhynchus tshawytscha) spawning habitat use in the Hanford Reach, Columbia River. Canadian Journal of Fisheries and Aquatic Sciences 57:1636-1646.
Gregory, S. 2007. 29 Historical channel modification and floodplain forest decline:
implications for conservation and restoration of a large floodplain river – Willamette River, Oregon. Developments in Earth Surface Processes 11:763-777.
Haeseker, S. L., B. Dorner, R. M. Peterman, and Z Su. 2007. An improved sibling model
for forecasting chum salmon and sockeye salmon abundance. Journal of Fisheries Management 27: 634-642.
Hasler, A. D., and W. J. Wisby. 1951. Discrimination of stream odors by fishes and its
relation to parent stream behavior. American Naturalist 85:223-238. HSRG (Hatchery Scientific Review Group). 2009. Columbia River hatchery reform
system-wide report. 278 p. HSRG (Hatchery Scientific Review Group). 2005. Hatchery reform in Washington State:
Principles and emerging issues. Fisheries 30:11-23.
70
Hughes, R. M., and J. R Gammon. 1987. Longitudinal changes in fish assemblages and
water quality in the Willamette River, Oregon. Transactions of the American Fisheries Society 116:196-209.
Jepsen, N., L. E. Davis, C. B. Schreck, and B. Siddens. 2001. The physiological response
of Chinook salmon smolts to two methods of radio-tagging. Transactions of the American Fisheries Society 130:495-500.
Johnson, E. L., T. S. Clabough, C. A. Peery, D. H. Bennett, T. C. Bjornn, C. C. Caudill,
and M. C. Richardson. 2007. Estimating adult Chinook salmon exposure to dissolved supersaturation downstream of hydroelectric dams with telemetry and hydrodynamic models. River Research and Applications 23:963-978.
Keefer, M. L., G. A. Taylor, D. F. Garletts, G. A. Gauthier, T. M. Pierce, and C. C. Caudill.
2010. Prespawn mortality in adult spring Chinook salmon outplanted above barrier dams. Ecology of Freshwater Fish (doi: 10.1111/j.1600-0633.2010.00418.x)
Kenaston, K., K. Schroeder, F. Monzyk, and B. Cannon. 2009. Interim activities for
monitoring impacts associated with hatchery programs in the Willamette Basin, USACE funding: 2008. Oregon Department of Fish and Wildlife Technical Report. 48 p.
Kostow, K. 2009. Factors that contribute to the ecological risks of salmon and steelhead
hatchery programs and some mitigating strategies. Fisheries 19:9-13. Kostow, K. E. 2004. Differences in juvenile phenotypes and survival between hatchery
stocks and a natural population provide evidence for modified selection due to captive breeding. Canadian Journal of Fisheries and Aquatic Sciences 61:577–589
Kostow, K. E., A. R. Marshall, and S. R. Phelps. 2003. Naturally spawning hatchery
steelhead contribute to smolt production but experience low reproductive success. Transactions of the American Fisheries Society 132:780–790
Lundigren, T. A., P. Moran, D. J. Teel, A. R. Marshall, S. F. Young, and D. L. Bottom.
2004. Conservation and genetic stock identification: A study investigating stock-specific distribution and performance of juvenile Chinook salmon in the Columbia River estuary. NPAFC Technical Report No. 5:70-71.
Mattson, C. R. 1948. Spawning ground studies of Willamette River spring chinook salmon.
Fish Commission Research Briefs, Fish Comm. Ore. 1(2):21–32. McDowall, R. M. 2001. Anadromy and homing: two life-history traits with adaptive
synergies in salmonid fishes? Fish and Fisheries 2:78-85. McElhany, P., T. Backman, C. Busack, S. Kolmes, J. Myers, D. Rawding, A. Steel, C.
Steward, T. Whitesel, and C. Willis. 2004. Status evaluation of salmon and
71
steelhead populations in the Willamette and lower Columbia River basins. NOAA Report. 121 p.
McHugh, P., and P. Budy. 2004. Patterns of spawning habitat selection and suitability for
two populations of spring Chinook salmon, with an evaluation of generic versus site-specific suitability criteria. Transactions of the American Fisheries Society 133: 89-97.
McLaughlin, L., K. Schroeder, K. Kenaston. 2008. Interim activities for monitoring
impacts associated with hatchery programs in the Willamette Basin, USACE funding: 2007. 26 p.
Moyer, G. R., M. S. Blouin, and M. A. Banks. 2007. The influence of family-correlated
survival on Nb/N for progeny from integrated multi- and single-generation hatchery stocks of coho salmon (Oncorhynchus kisutch). Canadian Journal of Fisheries and Aquatic Sciences 64:1258-1265.
Moyle, P. B. and J. F. Mount. 2007. Homogenous rivers, homogenous faunas. Proceedings
of the National Academy of Sciences 104:5711-5712 Myers, J., C. Busack, D. Rawding, A. Marshall, D. Teel, D. M. Van Doornik, and M. T.
Maher. 2006. Historical population structure of Pacific salmonids in the Willamette River and lower Columbia River basins. U.S. Department of Commerce., NOAA Tech. Memo. NMFS-NWFSC-73, 311 p.
NMFS. 2008. Endangered Species Act Section 7(a)(2) Consultation Biological Opinion and
Magnuson-Stevens Fishery Conservation and Management Act Essential Fish Habitat Consultation: Consultation on the “Willamette River Basin Flood Control Project”.
NMFS. 2005. Endangered and threatened species: Final listing determinations for 16 ESUs
of west coast salmon, and final 4(d) protective regulations for threatened salmonid ESUs. Federal Register 70(123): 37160-37204.
Nordeide, J. T. 2007. Is there more in ‘gamete quality’ than quality of the gametes? A
review of effects of female mate choice and genetic compatibility on offspring quality. Aquaculture Research 38:1-16.
O’Connor, G., and T. L. Hoffnagle. 2007. Use of ELISA to monitor bacterial kidney
disease in naturally spawning chinook salmon. Diseases of Aquatic Organisms 77:137-142.
ODFW. 2007. Fisheries management and evaluation for 2006: Willamette River spring
Chinook. ODFW Oregon Salmon and Columbia River Program report. 26 p. At: http://www.dfw.state.or.us/fish/CRSFVP/docs/2006%20Fisheries%20Willamette%20Spring%20Chinook%20FINAL%20DRAFT%20edits%207-07.pdf
72
ODFW. 2010 public draft. Upper Willamette River Conservation and Recovery Plan for Chinook Salmon and Steelhead. Prepared by the State of Oregon for the National Marine Fisheries Service, Silver Springs, Maryland.
ODFW and WDFW. 2010. Stock status and fisheries for spring Chinook, summer
Chinook, sockeye, steelhead, and other species, and miscellaneous regulations. Joint Columbia River Management Staff report. 89 pgs. Available at: http://www.dfw.state.or.us/fish/OSCRP/CRM/reports/10_reports/2010springjsr.pdf
Oregon Salmon Commission. 2008. Project CROOS Collaborative Research on Oregon
Ocean Salmon, 2007. Final Report to the Oregon Watershed Enhancement Board, 214 pages. Available at http://www.pacificfishtrax.org/resources/reports-and-publications
Oregon Salmon Commission. 2007. Project CROOS Collaborative Research on Oregon
Ocean Salmon, 2006. Final Report to the Oregon Watershed Enhancement Board. Available at http://projectcroos.com/reports-and-publications
Palmisano A. N. and N. E. Elder. 2001. Standardized seawater rearing of Chinook salmon
smolts to evaluate hatchery practices showed low statistical power. Transactions of the American Fisheries Society 130:409-416.
Peven, C. and M. Keefe. 2010. Willamette hatchery mitigation program research,
monitoring, and evaluation plan. Final Plan prepared for USACE, Portland District. 172 pages.
PNNL (Pacific Northwest National Laboratory). 2010. Migratory behavior and survival of
juvenile salmonids in the lower Columbia River and estuary in 2009. Draft Report. 170 pages. Available at http://www.nwp.usace.army.mil/pm/e/draftreports.asp
Quinn, T. P. 2005. Homing and patterns of straying. Pp 85-104 in T. P. Quinn, The
Behavior and Ecology of Pacific Salmon and Trout. University of Washington Press, Seattle, WA. 378 pages.
Quinn, T. P. 1997. Homing, Straying and Colonization. in W.S. Grant (ed.) Genetic
Effects of Straying of Non-Native Hatchery Fish into Natural Populations. NOAA Tech Memo NMFS-NWFSC-30. 157 pages.
R2 Resource Consultants. 2006. Willamette Valley anadromous fish hatchery coded wire
tag evaluation. Draft Final Report to the U.S. Army Corps of Engineers. 35 p. Roegner, G. C., A. Baptista, D. L. Bottom, J. Burke, L. Campbell, C. Elliot, S. Hinton, D.
Jay, M.-A. Lott, T. Lundrigan, R. McNatt, P. Moran, C. A. Simenstad, D. Teel, E. Volk, J. Zamon, E. Casillas. 2008. Estuarine Habitat and Juvenile Salmon: Current and Historical Linkages in the Lower Columbia River and Estuary, 2002-2004. Research Report by the Fish Ecology Division, Northwest Fisheries Science Center to the U.S. Army Corps of Engineers. 139 pgs.
73
Schreck, C. B., J. C. Snelling, R. D. Ewing, C. S. Bradford, L. E. Davis, and C. H. Slater.
1994. Migratory characteristics of juvenile spring Chinook salmon in the Willamette River. Final Report for U.S. Dept. of Energy, Bonneville Power Administration, Portland, OR. 121 p.
Schreck, C.B., T. P. Stahl, L. E. Davis, D. D. Roby, and B. J. Clemens. 2006. Mortality
estimates of juvenile spring-summer Chinook salmon in the lower Columbia River and estuary, 1992-1998: Evidence for delayed mortality? Transactions of the American Fisheries Society 135:45-475.
Schroeder, R., M. Buckman, B. Cannon, M. Hogansen, K. Kenaston, L. Krentz, and M.
Wade. 2006. Compliance with the Biological Opinion for hatchery programs in the Willamette Basin. Oregon Department of Fish and Wildlife Annual Progress Report for Project F-163-R-11. 50 p.
Schroeder, R. K., K. Kenaston, and L. K. Krentz. 2005. Spring Chinook salmon in the
Willamette and Sandy rivers. Oregon Department of Fish and Wildlife Annual Progress Report for Project F-163-R-10. 98 p.
Schroeder, R. K., and K. Kenaston. 2004. Spring Chinook salmon in the Willamette and
Sandy rivers. Oregon Department of Fish and Wildlife Annual Progress Report for Project F-163-R-09. 72 p.
Schroeder, R. K., K. Kenaston, and R. B. Lindsay. 2003. Spring Chinook salmon in the
Willamette and Sandy rivers. Oregon Department of Fish and Wildlife Annual Progress Report for Project F-163-R-08. 50 p.
Schroeder, R. K., K. Kenaston, and R. B. Lindsay. 2002. Spring Chinook salmon in the
Willamette and Sandy rivers. Oregon Department of Fish and Wildlife Annual Progress Report for Project F-163-R-07. 41 p.
Schroeder, R. K., K. Kenaston, and R. B. Lindsay. 2001. Spring Chinook salmon in the
Willamette and Sandy rivers. Oregon Department of Fish and Wildlife Annual Progress Report for Project F-163-R-06. 38 p.
Seeb, L. W. A. Antonovich, M. A. Banks, T. D. Beacham, M. R. Bellinger, S. M.
Blankenship, M. R. Campbell, N. A. Decovich, J. C. Garza, C. M. Guthrie III, T. A. Lundrigan, P. Moran, S. R. Narum, J. J. Stephenson, K. J. Supernault, D. J. Teel, W. D. Templin, J. K. Wenburg, S. F. Young, and C. T. Smith (2007. Development of a standardized DNA database for Chinook salmon. Fisheries 32:540-552
SHAG (Salmon Hatchery Assessment Group) 2003. Hatchery broodstock summaries and
assessments for chum, coho, and Chinook salmon and steelhead stocks within Evolutionarily Significant Units listed under the Endangered Species Act. NOAA Technical Report. 326 p.
74
Shearer, K., P. Parkins, B. Gadberry, B. Beckman, P. Swanson. 2006. Effects of growth rate/body size and a low lipid diet on the incidence of early sexual maturation in juvenile male spring Chinook salmon (Oncorhynchus tshawytscha). Aquaculture 252:545-556.
Sheer, M. B., and E. A. Steel. 2006. Lost watersheds: Barriers, aquatic habitat connectivity,
and salmon persistence in the Willamette and lower Columbia River basins. Transactions of the American Fisheries Society 135:1654-1669
Smith, J. M. 1982. Evolution and the Theory of Games. Cambridge University Press,
Cambridge, U.K. 224 pages. Taylor, E. B. 1991. A review of local adaptation in Salmonidae, with particular reference to
Pacific and Atlantic salmon. Aquaculture 98:185-207. Teel, D. J., C. Baker, D. R. Kuligowski, T. A. Friesen, B. Shields. 2009. Genetic stock
composition of subyearling Chinook in seasonal floodplain wetlands of the lower Willamette River, Oregon. Transactions of the American Fisheries Society 138:211-217.
Teel, D., P. Moran, T. Lundrigan, and K. Kenaston. 2002. Preliminary genetic analysis of
Chinook salmon juveniles sampled in the upper Willamette River during the summer of 2002. National Marine Fisheries Service, Northwest Fisheries Science Center, Research Progress Report, Seattle.
Twibell, R. G., A. L. Gannam, S. L. Ostrand, J. S. A. Holmes, and J. B. Poole. 2009.
Evaluation of commercial diets for first-feeding spring Chinook salmon. North American Journal of Aquaculture 71:116-121.
Vander Haegen, G. E., H. L. Blankenship, A. Hoffman, and D. A. Thompson. 2005. The
effect of adipose fin clipping and coded wire tagging on the survival and growth of spring Chinook salmon. North American Journal of Fisheries Management 25:1161-1170.
Waples, R. S. 2002. Effective size of fluctuating salmon populations. Genetics 161:783-791 Waples, R. S. 1999. Dispelling some myths about hatcheries. Fisheries 24:12-21. Ward, D. L., A. A. Nigro, R. A. Farr, and C. J. Knutsen. 1994. Influence of waterway
development on migrational characteristics of juvenile salmonids in the lower Willamette River, Oregon. North American Journal of Fisheries Management 14:362-371.
WCCSBRT (West Coast Chinook Salmon Biological Review Team). 1997. Review of the
status of Chinook salmon (Oncorhynchus tshawytscha) form Washington, Oregon, California, and Idaho under the U.S. Endangered Species Act. 480 p.
75
Wedekind, C., G. Rudolfsen, A. Jacob, D. Urbach, and R. Müller. 2007. The genetic consequences of hatchery-induced sperm competition in a salmonid. Biological Conservation 137:180-188.
Wiese, F. K., J. K. Parrish, C. W. Thompson, C. Maranto. 2008. Ecosystem-based
management of predator-prey relationships: piscivorous birds and salmonids. Ecological Applications 18:681-700.
Wilson, G. A. and B. Rannala. 2003. Bayesian inference of recent migration rates using
multilocus genotypes. Genetics 163:1177-1191. Wisby, W. J., and A. D. Hasler 1954. Effect of olfactory occlusion on migrating silver
salmon (O. kisutch). Journal of the Fisheries Research Board of Canada 11:472-478. WRI (Willamette Restoration Initiative). 2004. Draft Willamette subbasin plan. Northwest
Power and Conservation Council, Portland, OR.
76
APPENDICES Appendix A1. Scoring table of Information Quality (IQ), measured through metrics described in Table 4.1, used to calculate the IQ index (sum of metrics scores) for variables related to North Santiam (Marion Forks Hatchery and Minto Ponds) RM&E.
IQ Metric Variable 1 2 3 4 5
IQ Index
Number of naturally produced fish spawned 1 1 1 1 0 4 Number of hatchery fish spawned 1 1 1 1 1 5 Morphometrics 1 1 1 1 1 5 Run timing 1 1 1 1 1 5 Spawn timing (broodstock) 1 1 1 1 1 5 Age 1 1 1 1 1 5 Microsatellite genotypes 1 0 0 0 1 2 Fecundity 1 1 1 1 1 5 Sex 1 1 1 1 1 5 Broodstock numbers 1 1 1 1 1 5 Origin 1 1 1 1 1 5 Number of fish released 1 1 1 1 1 5 Total number of unclipped fish sampled 1 1 1 1 1 5 Total number of unclipped fish with an otolith mark sampled 1 1 1 1 1 5 Size periodically through rearing 1 1 1 1 1 5 Size-at-release 1 1 1 1 1 5 Size of naturally produced fish at migration 1 1 1 0 0 3 Release timing 1 1 1 1 1 5 Juvenile migration timing 1 1 0 0 0 2 Number of hatchery juveniles that do not migrate after release 0 0 0 0 0 0 Number of mini-jacks in run 1 1 1 1 1 5 Total number of fish in run 1 1 1 1 1 5 Number of hatchery fish that are sexually mature at release 0 0 0 0 0 0 Number of fish migrating per day 1 1 0 0 0 2 Hormone sampling 0 0 0 0 0 0 Acclimation time 1 1 1 1 1 5 Life stage at migration of naturally produced fish 1 0 0 0 0 1 Life stage at migration of hatchery produced fish 1 1 1 1 1 5 Number of adult Hatchery produced fish returning per release strategy 1 1 1 1 1 5 Number of fish harvested 1 1 1 1 1 5 Number of juvenile fish reaching the estuary 0 0 0 0 0 0 Number of fish consumed by Hatchery produced fish 0 0 0 0 0 0 Number of Hatchery and Naturally produced fish consumed (by all predators)
1 0 0 0 0 1
Number of Naturally produced fish emigrating from feeding stations after hatchery release
0 0 0 0 0 0
77
Appendix A1 (Continued)
IQ Metric Variable
1 2 3 4 5 IQ
Index Size of Naturally produced fish prior to H release and after 0 0 0 0 0 0 Habitat use by Naturally produced fish prior to and after H release 0 0 0 0 0 0 Habitat use by Hatchery produced fish 1 1 0 0 0 2 Pathogen occurrence in hatchery fish 1 1 1 1 1 5 Pathogen occurrence in the naturally produced fish 1 1 1 1 1 5 Number of Hatchery produced fish required for reintroduction efforts 0 0 0 0 0 0 Number of Hatchery produced fish removed 1 1 1 1 0 4 Number of Hatchery and Naturally produced fish on spawning grounds 1 1 1 1 0 4 Composition (hatchery/wild) 1 1 1 1 0 4 Number of fish passed upstream into target areas 1 1 1 1 0 4 Egg retention 1 1 1 1 0 4 Spawning location (by origin) 1 1 1 1 0 4 Number of Hatchery produced fish recaptured 1 1 1 1 0 4 Number of redds 1 1 1 1 0 4 Number of carcasses sampled 1 1 1 1 0 4 Number of naturally produced fish caught and released 1 1 1 1 0 4 Number of Hatchery and Naturally produced fish in holding areas 1 1 1 1 0 4 Pathogen level of hatchery and naturally produced (potentially from broodstock or carcasses)
1 1 1 1 1 5
pNOB (proportion of natural origin Chinook in the hatchery broodstock) 1 1 1 1 0 4 pHOB (proportion of hatchery origin fish in the hatchery broodstock) 1 1 1 1 0 4 Genetic diversity 1 0 0 0 1 2 Sex ratio 1 1 1 1 0 4 Age structure 1 1 1 1 1 5 Average number of eggs per female by age class 0 0 0 0 0 0 Adult migration and spawn timing 1 1 1 1 0 4 Average size (POH and fork length) per age class 1 1 1 1 1 5 Percentage of fish released 1 1 1 1 0 4 Percentage of broodstock used 1 1 1 1 0 4 Percentage of unclipped hatchery origin fish 1 1 1 1 1 5 In-hatchery life stage survival 1 1 1 1 1 5 Rearing density 1 1 1 1 0 4 Growth rate 1 1 1 1 0 4 Residualism rates 0 0 0 0 0 0 Mini-jack rate (per release) 0 0 0 0 0 0
78
Appendix A1 (Continued)
IQ Metric Variable 1 2 3 4 5
IQ Index
Percentage of mini-jacks in run 1 1 1 1 1 5 Rates of outmigration 1 1 0 0 0 2 Precocial rates 0 0 0 0 0 0 Proportion of fish that migrate per day 0 0 0 0 0 0 Freshwater survival 0 0 0 0 0 0 Predation rates (Hatchery produced fish on Naturally produced fish, effects of hatchery releases)
0 0 0 0 0 0
Competition (space and food) 0 0 0 0 0 0 Premature emigration rate (displacement rates) 0 0 0 0 0 0 Growth rate of Naturally produced fish 0 0 0 0 0 0 Pathogen transference from hatchery to naturally produced fish 0 0 0 0 0 0 Revised numeric release goal based on outcome of analysis 0 0 0 0 0 0 pHOS (proportion of hatchery origin fish on natural spawning grounds) 1 1 1 1 1 5 Stray rate 1 1 1 1 1 5 Abundance 1 1 1 1 0 4 Productivity 1 1 1 1 1 5 Sampling rate Harvest rate 1 1 1 1 1 5 Post release mortality (impacts on naturally produced fish) 0 0 0 0 0 0 Relative reproductive success 0 0 0 0 0 0 Adult spawner spatial distribution 1 1 1 1 1 5 Emigrants per redd 0 0 0 0 0 0 Density of fish in holding areas and on spawning grounds 0 0 0 0 0 0 Age at smoltification 1 0 0 0 0 1 Number of juvenile fish emigrating from spawning areas 1 1 0 1 0 3 Spawning success (including PSM) 1 1 1 1 0 4 Effective population size (Ne) 0 0 0 0 0 0
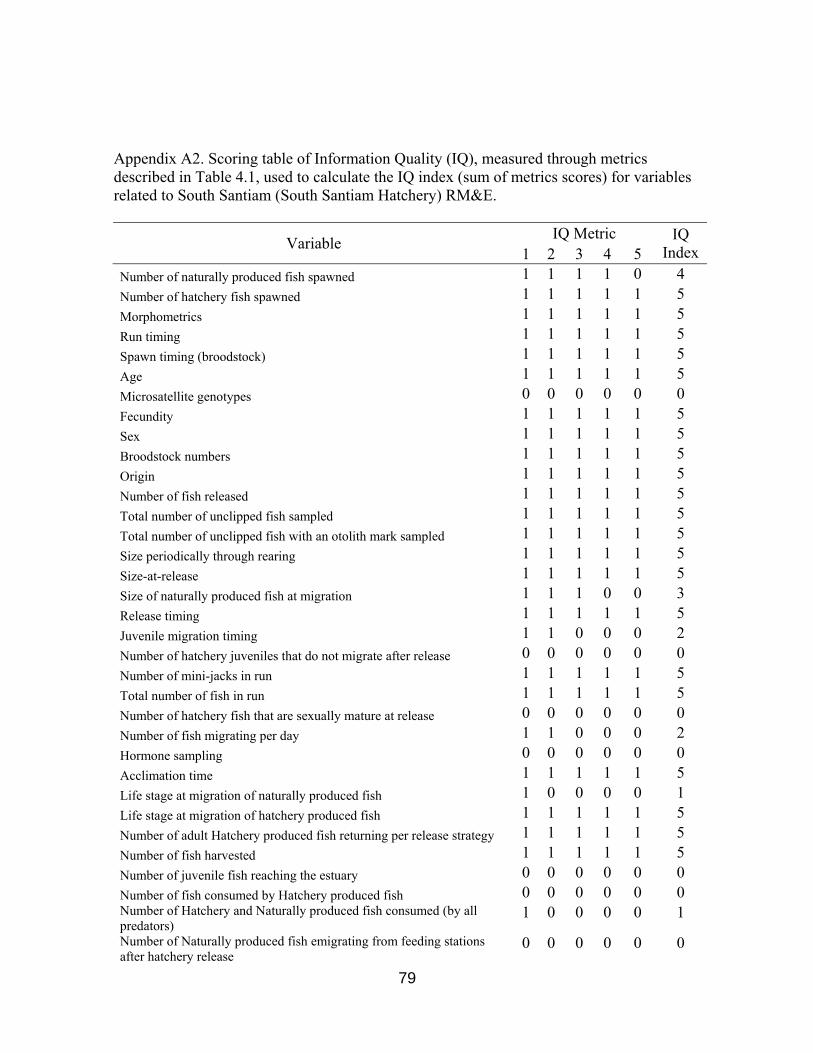
79
Appendix A2. Scoring table of Information Quality (IQ), measured through metrics described in Table 4.1, used to calculate the IQ index (sum of metrics scores) for variables related to South Santiam (South Santiam Hatchery) RM&E.
IQ Metric Variable 1 2 3 4 5
IQ Index
Number of naturally produced fish spawned 1 1 1 1 0 4 Number of hatchery fish spawned 1 1 1 1 1 5 Morphometrics 1 1 1 1 1 5 Run timing 1 1 1 1 1 5 Spawn timing (broodstock) 1 1 1 1 1 5 Age 1 1 1 1 1 5 Microsatellite genotypes 0 0 0 0 0 0 Fecundity 1 1 1 1 1 5 Sex 1 1 1 1 1 5 Broodstock numbers 1 1 1 1 1 5 Origin 1 1 1 1 1 5 Number of fish released 1 1 1 1 1 5 Total number of unclipped fish sampled 1 1 1 1 1 5 Total number of unclipped fish with an otolith mark sampled 1 1 1 1 1 5 Size periodically through rearing 1 1 1 1 1 5 Size-at-release 1 1 1 1 1 5 Size of naturally produced fish at migration 1 1 1 0 0 3 Release timing 1 1 1 1 1 5 Juvenile migration timing 1 1 0 0 0 2 Number of hatchery juveniles that do not migrate after release 0 0 0 0 0 0 Number of mini-jacks in run 1 1 1 1 1 5 Total number of fish in run 1 1 1 1 1 5 Number of hatchery fish that are sexually mature at release 0 0 0 0 0 0 Number of fish migrating per day 1 1 0 0 0 2 Hormone sampling 0 0 0 0 0 0 Acclimation time 1 1 1 1 1 5 Life stage at migration of naturally produced fish 1 0 0 0 0 1 Life stage at migration of hatchery produced fish 1 1 1 1 1 5 Number of adult Hatchery produced fish returning per release strategy 1 1 1 1 1 5 Number of fish harvested 1 1 1 1 1 5 Number of juvenile fish reaching the estuary 0 0 0 0 0 0 Number of fish consumed by Hatchery produced fish 0 0 0 0 0 0 Number of Hatchery and Naturally produced fish consumed (by all predators)
1 0 0 0 0 1
Number of Naturally produced fish emigrating from feeding stations after hatchery release
0 0 0 0 0 0

80
Appendix A2 (Continued)
IQ Metric Variable
1 2 3 4 5 IQ
Index Size of Naturally produced fish prior to H release and after 0 0 0 0 0 0 Habitat use by Naturally produced fish prior to and after H release 0 0 0 0 0 0 Habitat use by Hatchery produced fish 1 1 0 0 0 2 Pathogen occurrence in hatchery fish 1 1 1 1 1 5 Pathogen occurrence in the naturally produced fish 1 1 1 1 1 5 Number of Hatchery produced fish required for reintroduction efforts 0 0 0 0 0 0 Number of Hatchery produced fish removed 1 1 1 1 0 4 Number of Hatchery and Naturally produced fish on spawning grounds 1 1 1 1 0 4 Composition (hatchery/wild) 1 1 1 1 0 4 Number of fish passed upstream into target areas 1 1 1 1 0 4 Egg retention 1 1 1 1 0 4 Spawning location (by origin) 1 1 1 1 0 4 Number of Hatchery produced fish recaptured 1 1 1 1 0 4 Number of redds 1 1 1 1 0 4 Number of carcasses sampled 1 1 1 1 0 4 Number of naturally produced fish caught and released 1 1 1 1 0 4 Number of Hatchery and Naturally produced fish in holding areas 1 1 1 1 0 4 Pathogen level of hatchery and naturally produced (potentially from broodstock or carcasses)
1 1 1 1 1 5
pNOB (proportion of natural origin Chinook in the hatchery broodstock) 1 1 1 1 0 4 pHOB (proportion of hatchery origin fish in the hatchery broodstock) 1 1 1 1 0 4 Genetic diversity 0 0 0 0 0 0 Sex ratio 1 1 1 1 0 4 Age structure 1 1 1 1 1 5 Average number of eggs per female by age class 0 0 0 0 0 0 Adult migration and spawn timing 1 1 1 1 0 4 Average size (POH and fork length) per age class 1 1 1 1 1 5 Percentage of fish released 1 1 1 1 0 4 Percentage of broodstock used 1 1 1 1 0 4 Percentage of unclipped hatchery origin fish 1 1 1 1 1 5 In-hatchery life stage survival 1 1 1 1 1 5 Rearing density 1 1 1 1 0 4 Growth rate 1 1 1 1 0 4 Residualism rates 0 0 0 0 0 0 Mini-jack rate (per release) 0 0 0 0 0 0

81
Appendix A2 (Continued)
IQ Metric Variable 1 2 3 4 5
IQ Index
Percentage of mini-jacks in run 1 1 1 1 1 5 Rates of outmigration 1 1 0 0 0 2 Precocial rates 0 0 0 0 0 0 Proportion of fish that migrate per day 0 0 0 0 0 0 Freshwater survival 0 0 0 0 0 0 Predation rates (Hatchery produced fish on Naturally produced fish, effects of hatchery releases)
0 0 0 0 0 0
Competition (space and food) 0 0 0 0 0 0 Premature emigration rate (displacement rates) 0 0 0 0 0 0 Growth rate of Naturally produced fish 0 0 0 0 0 0 Pathogen transference from hatchery to naturally produced fish 0 0 0 0 0 0 Revised numeric release goal based on outcome of analysis 0 0 0 0 0 0 pHOS (proportion of hatchery origin fish on natural spawning grounds) 1 1 1 1 1 5 Stray rate 1 1 1 1 1 5 Abundance 1 1 1 1 0 4 Productivity 1 1 1 1 1 5 Sampling rate Harvest rate 1 1 1 1 1 5 Post release mortality (impacts on naturally produced fish) 0 0 0 0 0 0 Relative reproductive success 0 0 0 0 0 0 Adult spawner spatial distribution 1 1 1 1 1 5 Emigrants per redd 0 0 0 0 0 0 Density of fish in holding areas and on spawning grounds 0 0 0 0 0 0 Age at smoltification 1 0 0 0 0 1 Number of juvenile fish emigrating from spawning areas 1 1 0 1 0 3 Spawning success (including PSM) 1 1 1 1 0 4 Effective population size (Ne) 0 0 0 0 0 0
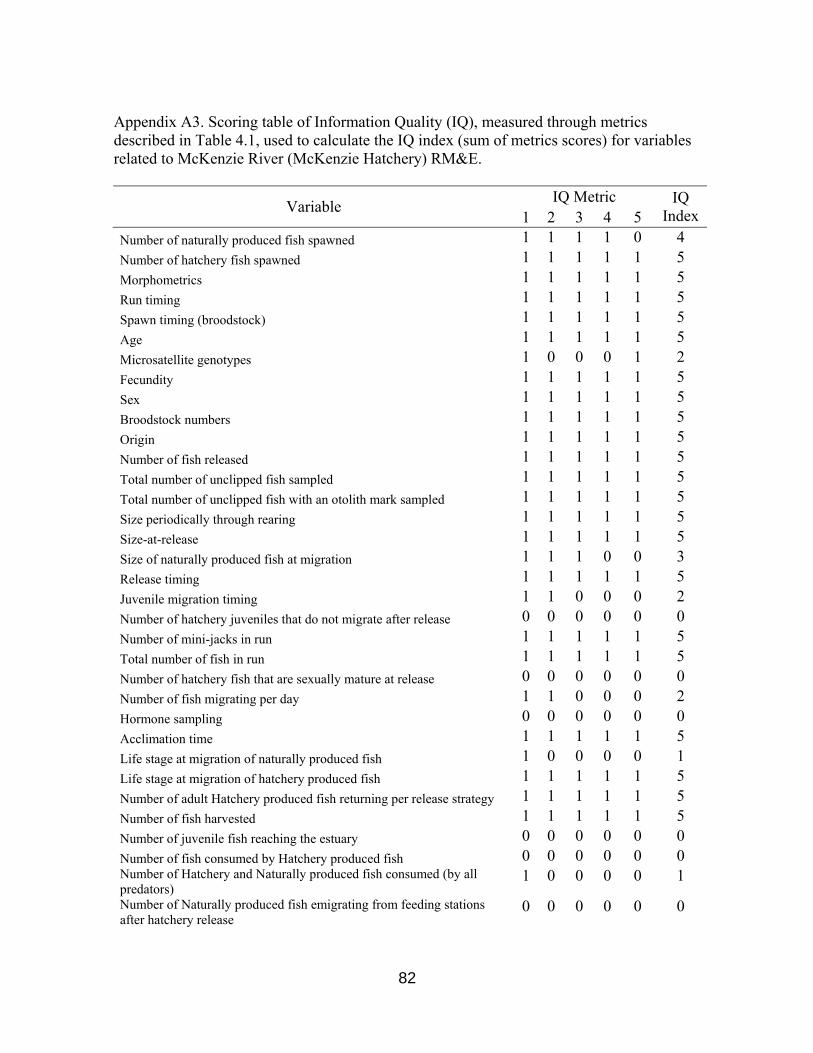
82
Appendix A3. Scoring table of Information Quality (IQ), measured through metrics described in Table 4.1, used to calculate the IQ index (sum of metrics scores) for variables related to McKenzie River (McKenzie Hatchery) RM&E.
IQ Metric Variable 1 2 3 4 5
IQ Index
Number of naturally produced fish spawned 1 1 1 1 0 4 Number of hatchery fish spawned 1 1 1 1 1 5 Morphometrics 1 1 1 1 1 5 Run timing 1 1 1 1 1 5 Spawn timing (broodstock) 1 1 1 1 1 5 Age 1 1 1 1 1 5 Microsatellite genotypes 1 0 0 0 1 2 Fecundity 1 1 1 1 1 5 Sex 1 1 1 1 1 5 Broodstock numbers 1 1 1 1 1 5 Origin 1 1 1 1 1 5 Number of fish released 1 1 1 1 1 5 Total number of unclipped fish sampled 1 1 1 1 1 5 Total number of unclipped fish with an otolith mark sampled 1 1 1 1 1 5 Size periodically through rearing 1 1 1 1 1 5 Size-at-release 1 1 1 1 1 5 Size of naturally produced fish at migration 1 1 1 0 0 3 Release timing 1 1 1 1 1 5 Juvenile migration timing 1 1 0 0 0 2 Number of hatchery juveniles that do not migrate after release 0 0 0 0 0 0 Number of mini-jacks in run 1 1 1 1 1 5 Total number of fish in run 1 1 1 1 1 5 Number of hatchery fish that are sexually mature at release 0 0 0 0 0 0 Number of fish migrating per day 1 1 0 0 0 2 Hormone sampling 0 0 0 0 0 0 Acclimation time 1 1 1 1 1 5 Life stage at migration of naturally produced fish 1 0 0 0 0 1 Life stage at migration of hatchery produced fish 1 1 1 1 1 5 Number of adult Hatchery produced fish returning per release strategy 1 1 1 1 1 5 Number of fish harvested 1 1 1 1 1 5 Number of juvenile fish reaching the estuary 0 0 0 0 0 0 Number of fish consumed by Hatchery produced fish 0 0 0 0 0 0 Number of Hatchery and Naturally produced fish consumed (by all predators)
1 0 0 0 0 1
Number of Naturally produced fish emigrating from feeding stations after hatchery release
0 0 0 0 0 0
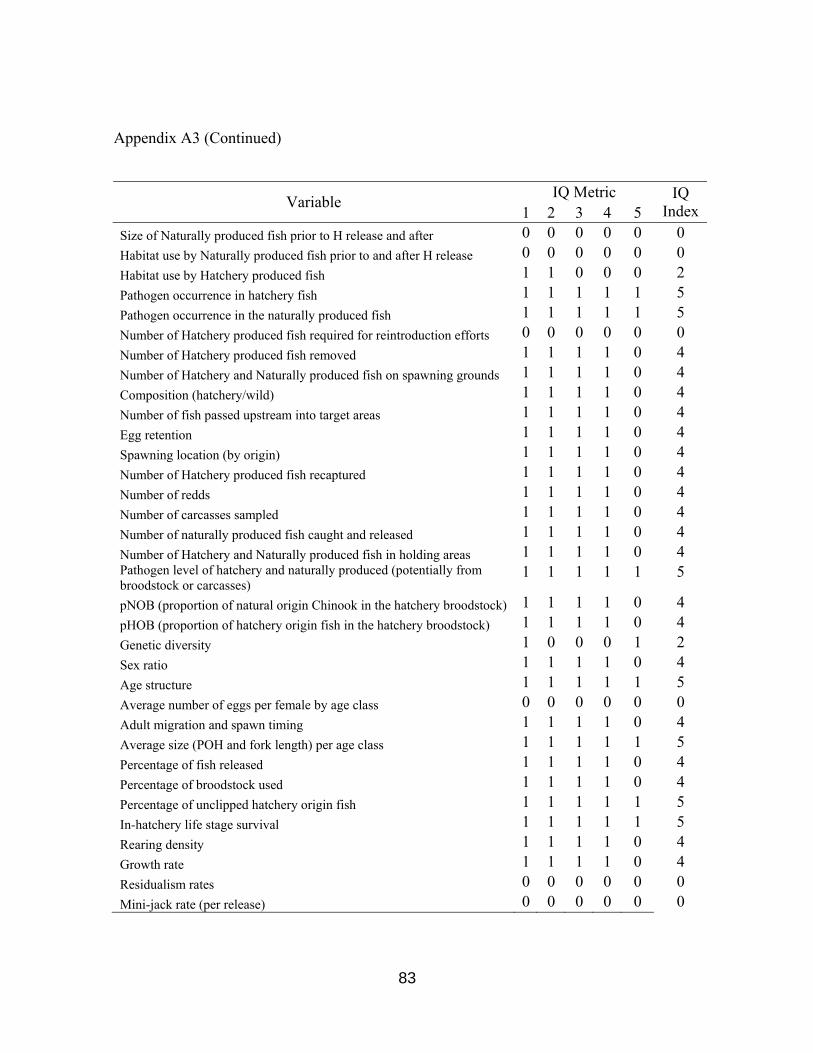
83
Appendix A3 (Continued)
IQ Metric Variable
1 2 3 4 5 IQ
Index Size of Naturally produced fish prior to H release and after 0 0 0 0 0 0 Habitat use by Naturally produced fish prior to and after H release 0 0 0 0 0 0 Habitat use by Hatchery produced fish 1 1 0 0 0 2 Pathogen occurrence in hatchery fish 1 1 1 1 1 5 Pathogen occurrence in the naturally produced fish 1 1 1 1 1 5 Number of Hatchery produced fish required for reintroduction efforts 0 0 0 0 0 0 Number of Hatchery produced fish removed 1 1 1 1 0 4 Number of Hatchery and Naturally produced fish on spawning grounds 1 1 1 1 0 4 Composition (hatchery/wild) 1 1 1 1 0 4 Number of fish passed upstream into target areas 1 1 1 1 0 4 Egg retention 1 1 1 1 0 4 Spawning location (by origin) 1 1 1 1 0 4 Number of Hatchery produced fish recaptured 1 1 1 1 0 4 Number of redds 1 1 1 1 0 4 Number of carcasses sampled 1 1 1 1 0 4 Number of naturally produced fish caught and released 1 1 1 1 0 4 Number of Hatchery and Naturally produced fish in holding areas 1 1 1 1 0 4 Pathogen level of hatchery and naturally produced (potentially from broodstock or carcasses)
1 1 1 1 1 5
pNOB (proportion of natural origin Chinook in the hatchery broodstock) 1 1 1 1 0 4 pHOB (proportion of hatchery origin fish in the hatchery broodstock) 1 1 1 1 0 4 Genetic diversity 1 0 0 0 1 2 Sex ratio 1 1 1 1 0 4 Age structure 1 1 1 1 1 5 Average number of eggs per female by age class 0 0 0 0 0 0 Adult migration and spawn timing 1 1 1 1 0 4 Average size (POH and fork length) per age class 1 1 1 1 1 5 Percentage of fish released 1 1 1 1 0 4 Percentage of broodstock used 1 1 1 1 0 4 Percentage of unclipped hatchery origin fish 1 1 1 1 1 5 In-hatchery life stage survival 1 1 1 1 1 5 Rearing density 1 1 1 1 0 4 Growth rate 1 1 1 1 0 4 Residualism rates 0 0 0 0 0 0 Mini-jack rate (per release) 0 0 0 0 0 0

84
Appendix A3 (Continued)
IQ Metric Variable 1 2 3 4 5
IQ Index
Percentage of mini-jacks in run 1 1 1 1 1 5 Rates of outmigration 1 1 0 0 0 2 Precocial rates 0 0 0 0 0 0 Proportion of fish that migrate per day 0 0 0 0 0 0 Freshwater survival 0 0 0 0 0 0 Predation rates (Hatchery produced fish on Naturally produced fish, effects of hatchery releases)
0 0 0 0 0 0
Competition (space and food) 0 0 0 0 0 0 Premature emigration rate (displacement rates) 0 0 0 0 0 0 Growth rate of Naturally produced fish 0 0 0 0 0 0 Pathogen transference from hatchery to naturally produced fish 0 0 0 0 0 0 Revised numeric release goal based on outcome of analysis 0 0 0 0 0 0 pHOS (proportion of hatchery origin fish on natural spawning grounds) 1 1 1 1 1 5 Stray rate 1 1 1 1 1 5 Abundance 1 1 1 1 0 4 Productivity 1 1 1 1 1 5 Sampling rate Harvest rate 1 1 1 1 1 5 Post release mortality (impacts on naturally produced fish) 0 0 0 0 0 0 Relative reproductive success 0 0 0 0 0 0 Adult spawner spatial distribution 1 1 1 1 1 5 Emigrants per redd 0 0 0 0 0 0 Density of fish in holding areas and on spawning grounds 0 0 0 0 0 0 Age at smoltification 1 0 0 0 0 1 Number of juvenile fish emigrating from spawning areas 1 1 0 1 0 3 Spawning success (including PSM) 1 1 1 1 0 4 Effective population size (Ne) 0 0 0 0 0 0
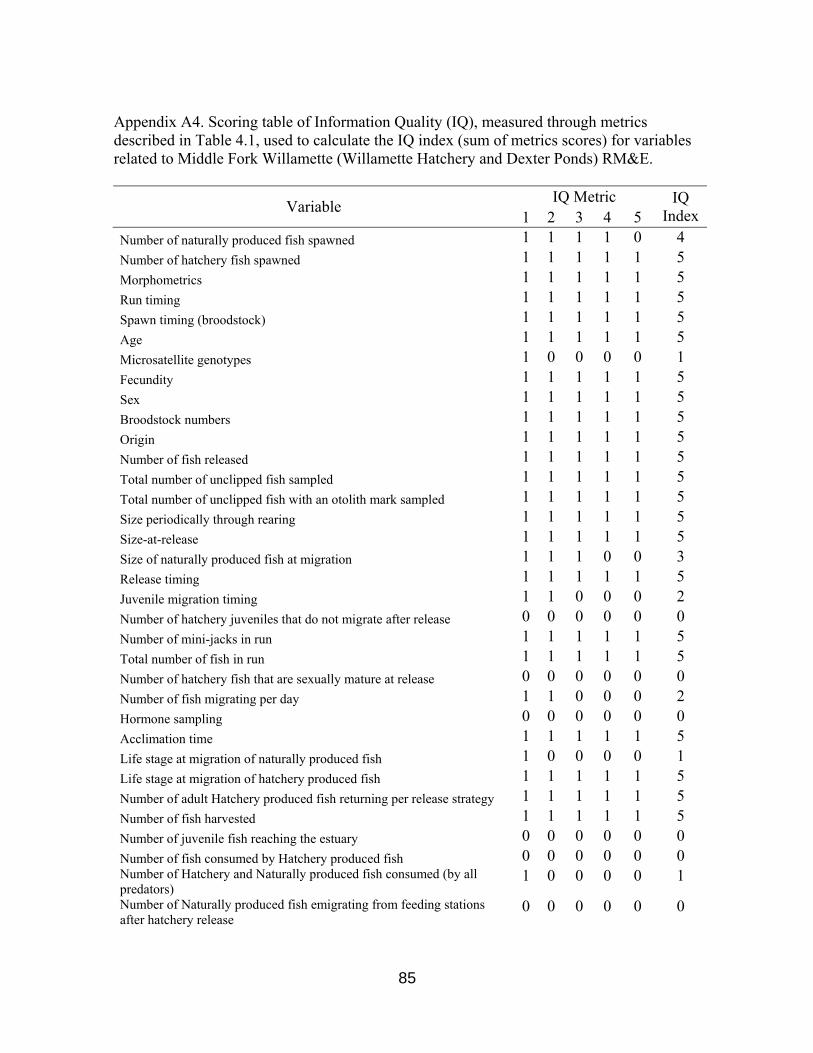
85
Appendix A4. Scoring table of Information Quality (IQ), measured through metrics described in Table 4.1, used to calculate the IQ index (sum of metrics scores) for variables related to Middle Fork Willamette (Willamette Hatchery and Dexter Ponds) RM&E.
IQ Metric Variable 1 2 3 4 5
IQ Index
Number of naturally produced fish spawned 1 1 1 1 0 4 Number of hatchery fish spawned 1 1 1 1 1 5 Morphometrics 1 1 1 1 1 5 Run timing 1 1 1 1 1 5 Spawn timing (broodstock) 1 1 1 1 1 5 Age 1 1 1 1 1 5 Microsatellite genotypes 1 0 0 0 0 1 Fecundity 1 1 1 1 1 5 Sex 1 1 1 1 1 5 Broodstock numbers 1 1 1 1 1 5 Origin 1 1 1 1 1 5 Number of fish released 1 1 1 1 1 5 Total number of unclipped fish sampled 1 1 1 1 1 5 Total number of unclipped fish with an otolith mark sampled 1 1 1 1 1 5 Size periodically through rearing 1 1 1 1 1 5 Size-at-release 1 1 1 1 1 5 Size of naturally produced fish at migration 1 1 1 0 0 3 Release timing 1 1 1 1 1 5 Juvenile migration timing 1 1 0 0 0 2 Number of hatchery juveniles that do not migrate after release 0 0 0 0 0 0 Number of mini-jacks in run 1 1 1 1 1 5 Total number of fish in run 1 1 1 1 1 5 Number of hatchery fish that are sexually mature at release 0 0 0 0 0 0 Number of fish migrating per day 1 1 0 0 0 2 Hormone sampling 0 0 0 0 0 0 Acclimation time 1 1 1 1 1 5 Life stage at migration of naturally produced fish 1 0 0 0 0 1 Life stage at migration of hatchery produced fish 1 1 1 1 1 5 Number of adult Hatchery produced fish returning per release strategy 1 1 1 1 1 5 Number of fish harvested 1 1 1 1 1 5 Number of juvenile fish reaching the estuary 0 0 0 0 0 0 Number of fish consumed by Hatchery produced fish 0 0 0 0 0 0 Number of Hatchery and Naturally produced fish consumed (by all predators)
1 0 0 0 0 1
Number of Naturally produced fish emigrating from feeding stations after hatchery release
0 0 0 0 0 0

86
Appendix A4 (Continued)
IQ Metric Variable
1 2 3 4 5 IQ
Index Size of Naturally produced fish prior to H release and after 0 0 0 0 0 0 Habitat use by Naturally produced fish prior to and after H release 0 0 0 0 0 0 Habitat use by Hatchery produced fish 1 1 0 0 0 2 Pathogen occurrence in hatchery fish 1 1 1 1 1 5 Pathogen occurrence in the naturally produced fish 1 1 1 1 1 5 Number of Hatchery produced fish required for reintroduction efforts 0 0 0 0 0 0 Number of Hatchery produced fish removed 1 1 1 1 0 4 Number of Hatchery and Naturally produced fish on spawning grounds 1 1 1 1 0 4 Composition (hatchery/wild) 1 1 1 1 0 4 Number of fish passed upstream into target areas 1 1 1 1 0 4 Egg retention 1 1 1 1 0 4 Spawning location (by origin) 1 1 1 1 0 4 Number of Hatchery produced fish recaptured 1 1 1 1 0 4 Number of redds 1 1 1 1 0 4 Number of carcasses sampled 1 1 1 1 0 4 Number of naturally produced fish caught and released 1 1 1 1 0 4 Number of Hatchery and Naturally produced fish in holding areas 1 1 1 1 0 4 Pathogen level of hatchery and naturally produced (potentially from broodstock or carcasses)
1 1 1 1 1 5
pNOB (proportion of natural origin Chinook in the hatchery broodstock) 1 1 1 1 0 4 pHOB (proportion of hatchery origin fish in the hatchery broodstock) 1 1 1 1 0 4 Genetic diversity 1 0 0 0 0 1 Sex ratio 1 1 1 1 0 4 Age structure 1 1 1 1 1 5 Average number of eggs per female by age class 0 0 0 0 0 0 Adult migration and spawn timing 1 1 1 1 0 4 Average size (POH and fork length) per age class 1 1 1 1 1 5 Percentage of fish released 1 1 1 1 0 4 Percentage of broodstock used 1 1 1 1 0 4 Percentage of unclipped hatchery origin fish 1 1 1 1 1 5 In-hatchery life stage survival 1 1 1 1 1 5 Rearing density 1 1 1 1 0 4 Growth rate 1 1 1 1 0 4 Residualism rates 0 0 0 0 0 0 Mini-jack rate (per release) 0 0 0 0 0 0

87
Appendix A4 (Continued)
IQ Metric Variable 1 2 3 4 5
IQ Index
Percentage of mini-jacks in run 1 1 1 1 1 5 Rates of outmigration 1 1 0 0 0 2 Precocial rates 0 0 0 0 0 0 Proportion of fish that migrate per day 0 0 0 0 0 0 Freshwater survival 1 0 0 0 0 1 Predation rates (Hatchery produced fish on Naturally produced fish, effects of hatchery releases)
0 0 0 0 0 0
Competition (space and food) 0 0 0 0 0 0 Premature emigration rate (displacement rates) 0 0 0 0 0 0 Growth rate of Naturally produced fish 0 0 0 0 0 0 Pathogen transference from hatchery to naturally produced fish 0 0 0 0 0 0 Revised numeric release goal based on outcome of analysis 0 0 0 0 0 0 pHOS (proportion of hatchery origin fish on natural spawning grounds) 1 1 1 1 1 5 Stray rate 1 1 1 1 1 5 Abundance 1 1 1 1 0 4 Productivity 1 1 1 1 1 5 Sampling rate Harvest rate 1 1 1 1 1 5 Post release mortality (impacts on naturally produced fish) 1 1 0 1 0 3 Relative reproductive success 0 0 0 0 0 0 Adult spawner spatial distribution 1 1 1 1 1 5 Emigrants per redd 0 0 0 0 0 0 Density of fish in holding areas and on spawning grounds 0 0 0 0 0 0 Age at smoltification 1 0 0 0 0 1 Number of juvenile fish emigrating from spawning areas 1 1 0 1 0 3 Spawning success (including PSM) 1 1 1 1 0 4 Effective population size (Ne) 0 0 0 0 0 0


![Fishing and Hatcheries · Fall Chinook Spring Chinook Winter Steelhead Summer Steelhead Coho iddle Rogue/Applegate Hatcheries Above William Jess Da Cole ivers Hatche Skunk]Greens](https://img.pdfslide.net/doc/110x75/5f98aafb2a473200456716ee/fishing-and-hatcheries-fall-chinook-spring-chinook-winter-steelhead-summer-steelhead.jpg)