Embed Size (px)
Citation preview
Spring Dispersal and Breeding Ecology of Northern Bobwhite in Southwest Ohio
THESIS
Presented in Partial Fulfillment of the Requirements for the Degree Master of Science in
the Graduate School of The Ohio State University
By
Marjorie R. Liberati
Graduate Program in Environment and Natural Resources
The Ohio State University
2013
Master's Examination Committee:
Robert J. Gates (advisor)
Paul G. Rodewald
Elizabeth A. Marschall
Copyrighted by
Marjorie R. Liberati
2013
ii
ABSTRACT
Northern bobwhites are a popular upland game bird species with economic and
social importance. Despite nearly a century of research, population declines continue at
state and national scales. Precipitous population declines and range-contractions in the
Midwest have been caused by land-use changes and suppression of natural disturbance
regimes. Reproduction that meets or exceeds annual mortality is essential to sustain
viable populations and poor reproductive success is also implicated in declines of
grassland bird populations. This study fills an information gap in knowledge of spring
dispersal, breeding ecology and behavior, and breeding vital rates of Midwestern
bobwhites near the northern limit of their range. It is unclear if recovery of Midwestern
bobwhite populations is limited by spring dispersal capabilities and/or breeding vital
rates.
Radio-telemetry was used to investigate breeding vital rates during 2010 and 2011
on 4 private-lands study sites in southwest Ohio. Bobwhites were outfitted with radio-
transmitters with an 8-hr mortality sensor and tracked daily with homing to within ≤ 20
m. Spring dispersal and breeding season vital rates were evaluated and compared to
other bobwhite populations to identify potential population-limiting factors associated
with spring dispersal and reproduction. Vital rates that met or exceeded range-wide
means included spring dispersal distance (1.54 km), nesting effort (re-nest = 26%, double

iii
clutch = 65%), male incubation (43% of nests), clutch size (14.4 eggs), egg success
(96.9%), and nesting phenology. The mean hatch date for first nest attempts was 1 July,
21 July for male incubated nests, 28 July for renests, 31 July for backdated fall-juveniles,
and 24 Aug for double clutches. Breeding season (Apr-Sep) survival (28%) and nest
success (27.9%) were lower in southwestern Ohio compared to range-wide averages.
Relatively low nest success and breeding season survival indicates that
reproduction may limit population growth in this region and that availability of quality
breeding habitat is below the threshold needed to offset annual mortality. Providing early
successional woody cover within landscapes could improve annual survival and reverse
bobwhite population declines in the Midwest. Early successional woody habitat was
highly selected at multiple spatial scales during the breeding season. Bobwhites with
higher proportions of early succession woody habitat in their nonbreeding home ranges
were less likely to disperse or dispersed shorter distance in spring (P = 0.006). Although
woody cover was an important component of spring-summer habitat for bobwhites, nest
success declined with increasing amounts of woody cover near nest sites (P = 0.05).
Continuing support for programs like the Conservation Reserve Program (CRP)
that establish permanent, managed grasslands remain important for bobwhite
conservation in the Midwest. Vegetation succession coupled with anticipated declines in
CRP enrollment would likely diminish usable space for bobwhites in the Midwest during
the breeding season and negatively impact nest success. Bobwhites in the agricultural
Midwest would benefit from having woody cover in proximity to grassland habitats

iv
during the breeding season but woody encroachment within grassland habitats where
bobwhites nest should be managed.

v
Dedicated to my family,
with love and gratitude.
vi
ACKNOWLEDGMENTS
This project would not have been possible without funding from the Federal Aid
in Wildlife Restoration Program (W-134-P, Wildlife Management in Ohio), jointly
administered by the U.S. Fish & Wildlife Service and the Ohio Division of Wildlife
(ODW). Additional funding was provided by the Ohio Agricultural Research and
Development Center and the School of Environment and Natural Resources (SENR) at
The Ohio State University.
I would like to thank the numerous landowners that allowed access to their
property. Landowner participation was invaluable and those within our study sites were
incredible generous, accommodating, and patient with year-round research activities
during this multi-year project. I would personally like to thank those landowners who
allowed access during the breeding season. Dispersing and nesting bobwhites often
moved outside our study sites and many landowners allowed us access to their properties
with no prior knowledge of the project. Special thanks go to the Roehm and Fee families
who were incredibly welcoming and hospitable throughout my time in Hillsboro, OH.
Carla and George Fee were especially generous with their time and knowledge, and their
enthusiasm for quail and wildlife conservation was inspirational. I would particularly
like to thank George for his support during my personal and canine crises.
vii
Numerous people contributed to this project during development and data
collection. Jessica Radabaugh, Les Murray, and Bret Graves contributed to the
development of this project. Marc Peugeot, Laura Jenkins, Matt Crowell assisted in
collection of field data during the pilot years of this study. I personally enjoyed working
with Chris Grimm, Jay Jordan, Bryce Adams, Hannah Plumpton, Brett Graves, Adam
Janke, and Mark Wiley who assisted in collecting field data. I particularly value my
friendships and time spent with fellow Team Quail members; Adam Janke and Mark
Wiley. Guys, I still think the summer season is the best!
I would like to thank Amy Schmidt and all of the SENR front office staff. I
would have been lost in the realms of graduate school paperwork and deadlines without
Amy Schmidt and her chocolate stash. Dennis Hull also supplied essential daily support
and coordination for this project. Thanks to the other graduate students in SENR for their
aid and friendship: Kate Batdorf, Liz Braaten, Erin Cashion, Angela Chongpinitchai,
Patrick Johnson, Ben Kahler, Laura Kearns, Jenn Malpass, Desiree Narango, Keith
Norris, Linnea Rowse, Devyani Singh, Dave Slager, Jen Thieme, Jason Tucker, and Evan
Wilson. Laura Kearns and Steve Matthews gave valuable advice and input during
candidate model development and Matt Shumar helped put bobwhites on the map for the
Ohio Breeding Bird Atlas II. I also enjoyed working with Kate Batdorf, Patrick Johnson,
Ben Kahler, and Linnea Rowse during SENR teaching appointments.
I would like to thank Dr. Paul Rodewald and Dr. Elizabeth Marschall for serving
on my examination committee. My research and thesis have benefited from their insight
and knowledge. I would chiefly like to thank my advisor, Dr. Bob Gates, for the

viii
opportunity to work on this research project. I feel I have grown as a researcher, teacher,
and professional under his tutelage.
My friends and family have been an incredible support system during my time in
Ohio. My love and gratitude for them knows no bounds. My brother, Ross, has always
championed me with unwavering loyalty. My parents have been pillars of love, support,
and encouragement my entire life. It was from them that my interest in the sciences and
outdoors was instilled. I am particularly grateful for the strong educational and ethical
foundations they provided me and my brother. They are incredible role models and I
aspire to emulate them.

ix
VITA
Aug-May 2006-2007 .....................................Laboratory Assistant, Wildlife
Ecotoxicology & Physiological Ecology
Lab, Virginia Tech
May-Aug 2007 ...............................................Undergraduate Research, South River
Research Project, University of Delaware
Aug-May 2007-2008 .....................................Research Technician, Walter’s Avian
Ecology Lab, Virginia Tech
May-Aug 2008 ...............................................Internship, Tristate Bird Rescue & Research
Mar 2008 ........................................................Laboratory Technician, Conjunctivitis
Research, Virginia Tech
May 2009 .......................................................B.S. Biology, Virginia Tech
May-Aug 2009 ...............................................Senior Intern, Tristate Bird Rescue &
Research;
Field Technician, Swamp Sparrow
Research, University of Delaware and the
Smithsonian Migratory Bird Research
Center
x
Sep 2009 to present .......................................Graduate Associate, School of Environment
& Natural Resources, Ohio State University
Jan-Mar 2012 .................................................Instructor of Record, School of Environment
& Natural Resources, Ohio State University
Publications
Liberati, M. R., and R. J. Gates. 2012. Spring dispersal of northern bobwhites in
southwestern Ohio. Proceedings of the National Quail Symposium 7: in press.
Gates, R. J., A. K. Janke, M. R. Liberati, and M. J. Wiley. 2012. Population ecology and
habitat relationships of northern bobwhite in southwestern Ohio. Proceedings of
the National Quail Symposium 7: in press.
Fields of Study
Major Field: Environment and Natural Resources

xi
TABLE OF CONTENTS
Abstract ............................................................................................................................... ii
Acknowledgments.............................................................................................................. vi
Vita ..................................................................................................................................... ix
Table of Contents ............................................................................................................... xi
List of Tables ................................................................................................................... xiv
List of Figures ................................................................................................................. xvii
Chapter 1 : Introduction ..................................................................................................... 1
Study Design ............................................................................................................... 4
Thesis Content ........................................................................................................... 11
Literature Cited .......................................................................................................... 17
Chapter 2 : Spring Dispersal of Northern Bobwhite in Southwest Ohio ......................... 21
Abstract ..................................................................................................................... 21
Introduction ............................................................................................................... 22
Study Area ................................................................................................................. 24
Methods ..................................................................................................................... 27
Results ....................................................................................................................... 31
Discussion ................................................................................................................. 33
Management Implications ......................................................................................... 37
xii
Literature Cited .......................................................................................................... 48
Chapter 3 : Breeding Ecology of Northern Bobwhites in Southwest Ohio ..................... 53
Abstract ..................................................................................................................... 53
Introduction ............................................................................................................... 54
Study Area ................................................................................................................. 57
Methods ..................................................................................................................... 60
Results ....................................................................................................................... 64
Discussion ................................................................................................................. 67
Management Implications ......................................................................................... 74
Literature Cited .......................................................................................................... 84
Chapter 4 : Microhabitat Influences on Nest Site Selection and Success for Northern
Bobwhites in Southwest Ohio ........................................................................................... 92
Abstract ..................................................................................................................... 92
Introduction ............................................................................................................... 93
Study Area ................................................................................................................. 96
Methods ..................................................................................................................... 99
Results ..................................................................................................................... 105
Discussion ............................................................................................................... 107
Management Implications ....................................................................................... 112
Literature Cited ........................................................................................................ 127
Chapter 5 : Home Range and Habitat Selection of Northern Bobwhites during the
Breeding Season in Southwest Ohio ............................................................................... 135
Abstract ................................................................................................................... 135
Introduction ............................................................................................................. 136

xiii
Study Area ............................................................................................................... 139
Methods ................................................................................................................... 142
Results ..................................................................................................................... 146
Discussion ............................................................................................................... 149
Management Implications ....................................................................................... 152
Literature Cited ........................................................................................................ 172
Bibliography ................................................................................................................... 180
xiv
LIST OF TABLES
Table 1.1. Physical and land-cover characteristics of 4 study sites in southwest Ohio
where northern bobwhites were captured during April- September 2010-2011. .............. 13
Table 2.1. First phase of spring dispersal analysis and ranked models evaluating the
influence of design variables on dispersal distances of radio-marked northern bobwhite at
4 study sites in southwest Ohio during 2010-2011. .......................................................... 39
Table 2.2. Final candidate model set for spring dispersal analysis and ranked models
evaluating the influence of habitat and design variables on dispersal distances of radio-
marked northern bobwhite at 4 study sites in southwest Ohio during 2010-2011............ 40
Table 2.3. Dispersal classifications and mean movements (km) for radio-marked
northern bobwhites in southwest Ohio during spring (Apr-May) 2010 and 2011.
Dispersal classifications were based on the average covey home-range size for the
preceding winters (26.1 ha, 0.58 km diameter; Janke and Gates 2012). .......................... 41
Table 2.4. Mean dispersal distances ± 95% confidence intervals (km) and dispersal
classification percentages for radio-marked northern bobwhites in southwest Ohio during
spring 2010 and 2011. ....................................................................................................... 42
Table 2.5. Dispersal classification percentages and average distances for radio-marked
northern bobwhite based on study sites in southwest Ohio during spring (Apr-May) 2010
and 2011. ........................................................................................................................... 43
Table 3.1. Distribution of nests and nest success by generalized habitat types for
northern bobwhites in southwest Ohio during April-September 2010-2011. ................... 76
Table 3.2. Ranking of candidate models hypothesized to explain variation in daily nest
survival estimated with logistic exposure methods for radio-marked northern bobwhite at
4 study sites in southwest Ohio during 2010-2011. .......................................................... 77
xv
Table 4.1. Summary of microhabitat vegetation at northern bobwhite nest and random
plots in southwest Ohio during 2010-2011. Low percent densiometer readings
correspond to low overhead canopy coverage. ............................................................... 114
Table 4.2. Microhabitat was recorded along measurement transects oriented with habitat
edges at northern bobwhite nests in southwest Ohio during 2010-2011. The differences
between the parallel and perpendicular transects were calculated and then evaluated with
principle component analysis (PCA). The principle components retained after analysis
are presented and their eigenvalues and eigenvectors reported. ..................................... 115
Table 4.3. Model selection results from the edge-association candidate models which
examine the relationship of principle components (PC) to nest success of northern
bobwhite in southwest Ohio during 2010-2011. ............................................................. 116
Table 4.4. Model selection results from the vertical vegetation candidate model set
which examines the relationship of microhabitat variables for percent shrub (> 2 m),
densiometer reading, and bare ground cover to nest success of northern bobwhite in
southwest Ohio during 2010-2011. ................................................................................. 117
Table 4.5. Model selection results from the live vegetation candidate model set which
examines the relationship of microhabitat variables for shrub (≤ 2 m), forb, and
grass/sedge cover to nest success of northern bobwhite in southwest Ohio during 2010-
2011................................................................................................................................. 118
Table 4.6. Model selection results from the residual vegetation candidate model set
which examines the relationship of microhabitat variables for upright and ground litter
cover to nest success of northern bobwhite in southwest Ohio during 2010-2011. ....... 119
Table 4.7. Model selection results from the final model set examining nest success and
the influence of nest plot edge-association, distance to nearest edge, and vertical, live,
and residual vegetative cover for nests of northern bobwhite in southwest Ohio during
2010-2011. ...................................................................................................................... 120
Table 4.8. Coefficients (β), standard errors (SE), and p-values (P) for variables in top
models (∆AICc < 2) in the final model set (Table 4.7) which investigates the influence of
microhabitat categories and edge-association on nest success for northern bobwhite. .. 121
xvi
Table 5.1. Comparison of radio-marked northern bobwhite mean core use and home
range areas during the breeding season (~10 May- 30 Sep) in southwest Ohio during
2010-2011 broken down by sex, age, study site, and year. ............................................ 154
Table 5.2. Habitat composition of core use areas, home ranges, and telemetry locations
for radio-marked bobwhites in southwest Ohio during ~10 May - 30 Sep 2010-2011. . 155
Table 5.3. Ranking matrix for second order (available = study site area, used =
individual home range) habitat selection by radio-marked northern bobwhite during the
2010 and 2011 breeding seasons (~10 May – 30 September) in southwest Ohio. ......... 156
Table 5.4. Ranking matrix for third order core (available = individual home range, used
= core use area) habitat selection by radio-marked northern bobwhite during breeding
seasons (~10 May – 30 Sep) in southwest Ohio during 2010- 2011. ............................. 157
Table 5.5. Ranking matrix for third order point (available = individual home range, used
= radio-telemetry locations) habitat selection by radio-marked northern bobwhite at 4
study sites during the breeding season (~10 May – 30 Sep) in southwest Ohio during
2010- 2011. ..................................................................................................................... 158
Table 5.6. Ranking matrix for third order point (available = individual home range, used
= radio-telemetry locations) habitat selection based on the age of radio-marked northern
bobwhite in southwest Ohio during ~10 May – 30 Sep 2010-2011. .............................. 160

xvii
LIST OF FIGURES
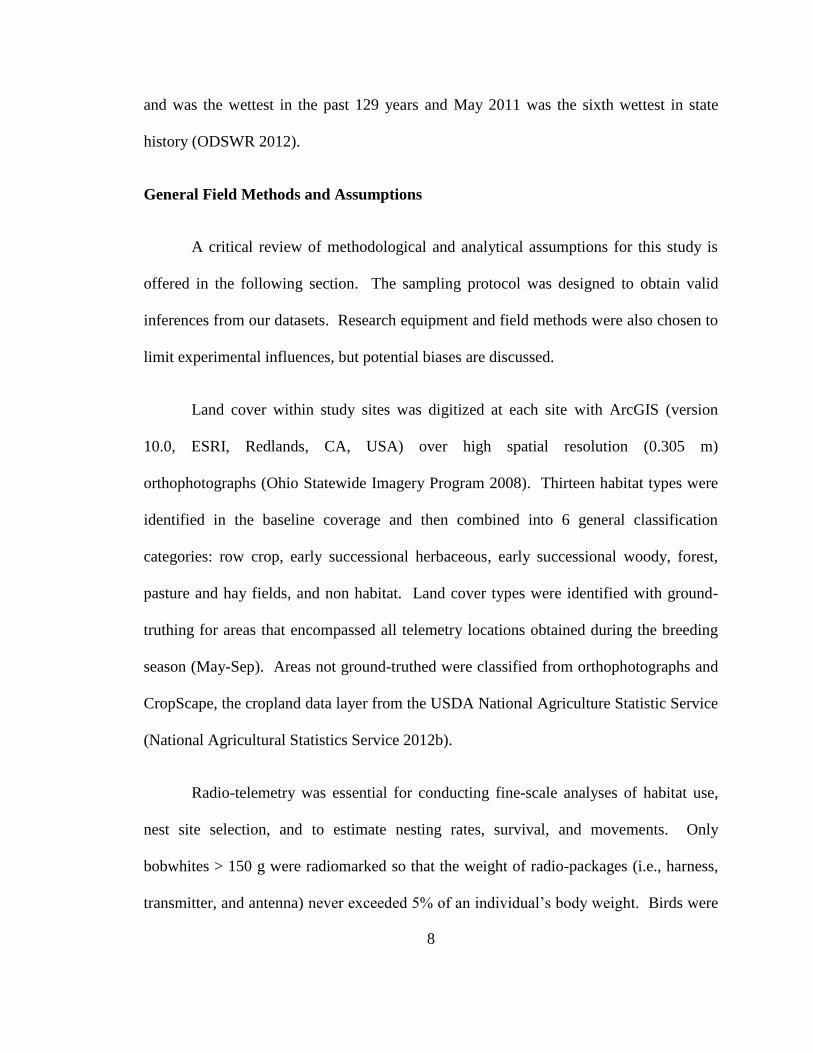
Figure 1.1. Geographic distribution and population trends of northern bobwhites from
the Breeding Bird Survey during 1966-2010 (Sauer et al. 2011). The trend at any map
point was estimated as a weighted average of trend information from nearby survey
routes where bobwhites were detected (Sauer et al. 2011). .............................................. 14
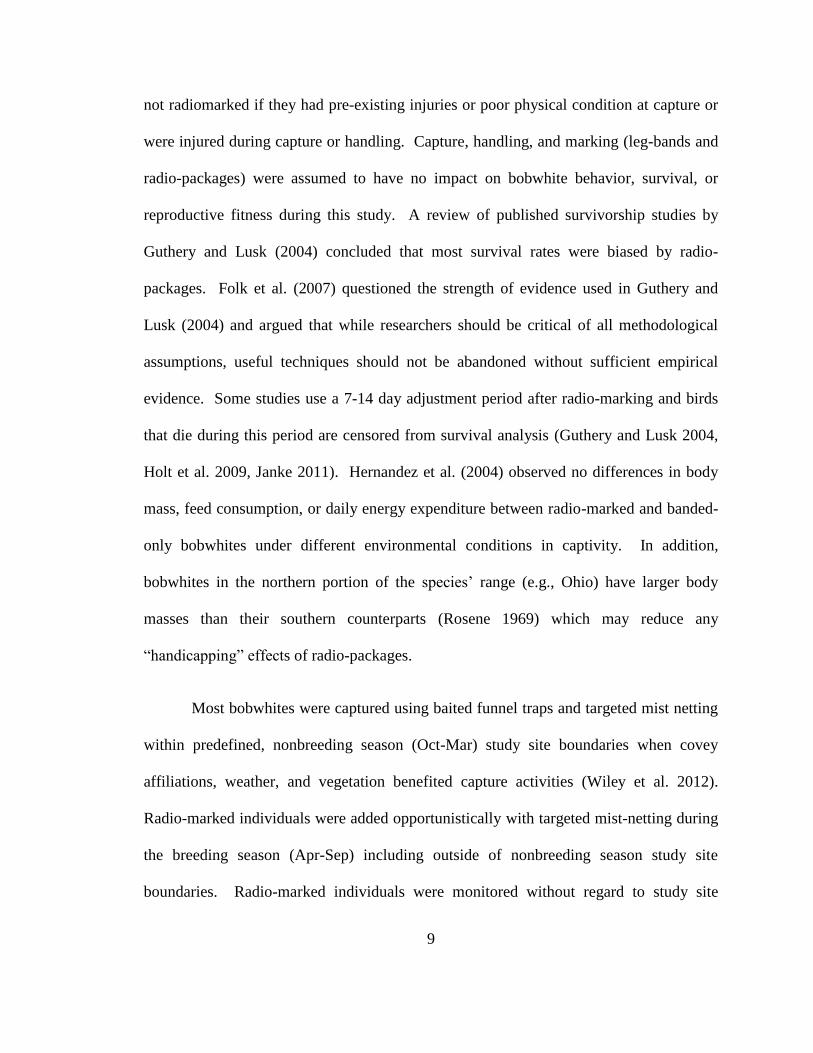
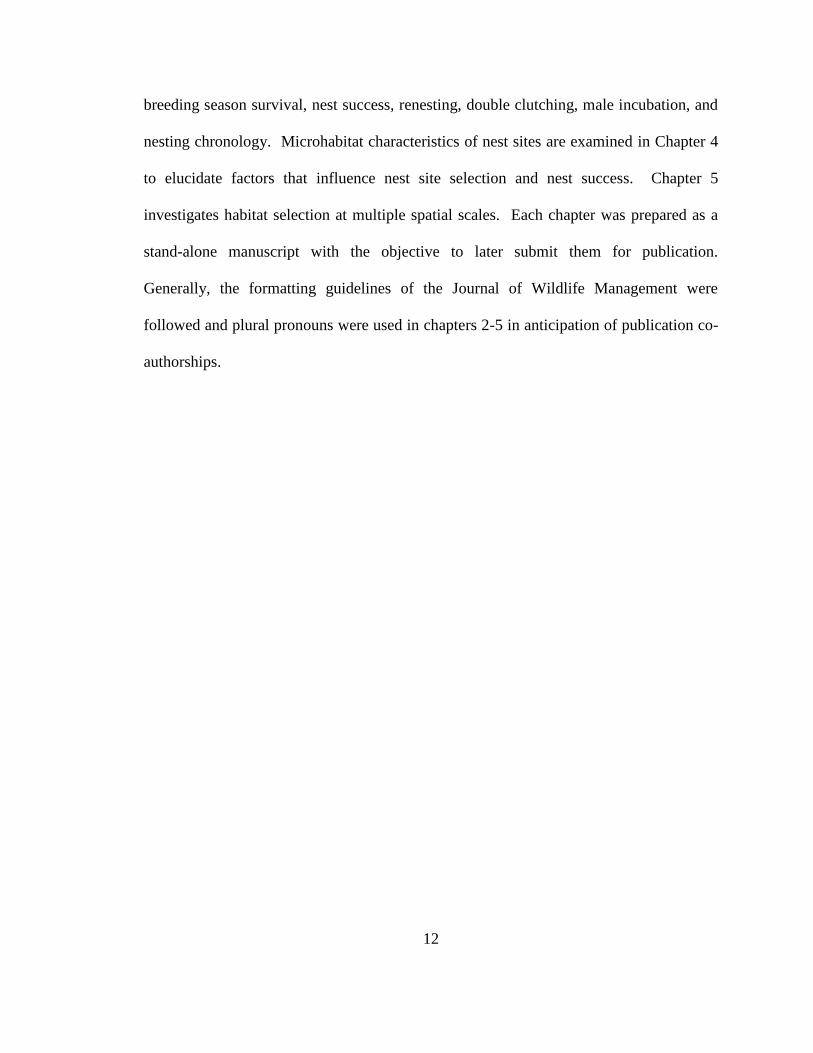
Figure 1.2. Population trend of northern bobwhites in Ohio based on long-term
monitoring by the Breeding Bird Survey (left; Sauer et al. 2011) during the breeding
season (late May – early June) and the Christmas Bird Count (right; National Audubon
Society 2012) during the nonbreeding season (mid December – early January). ............ 15
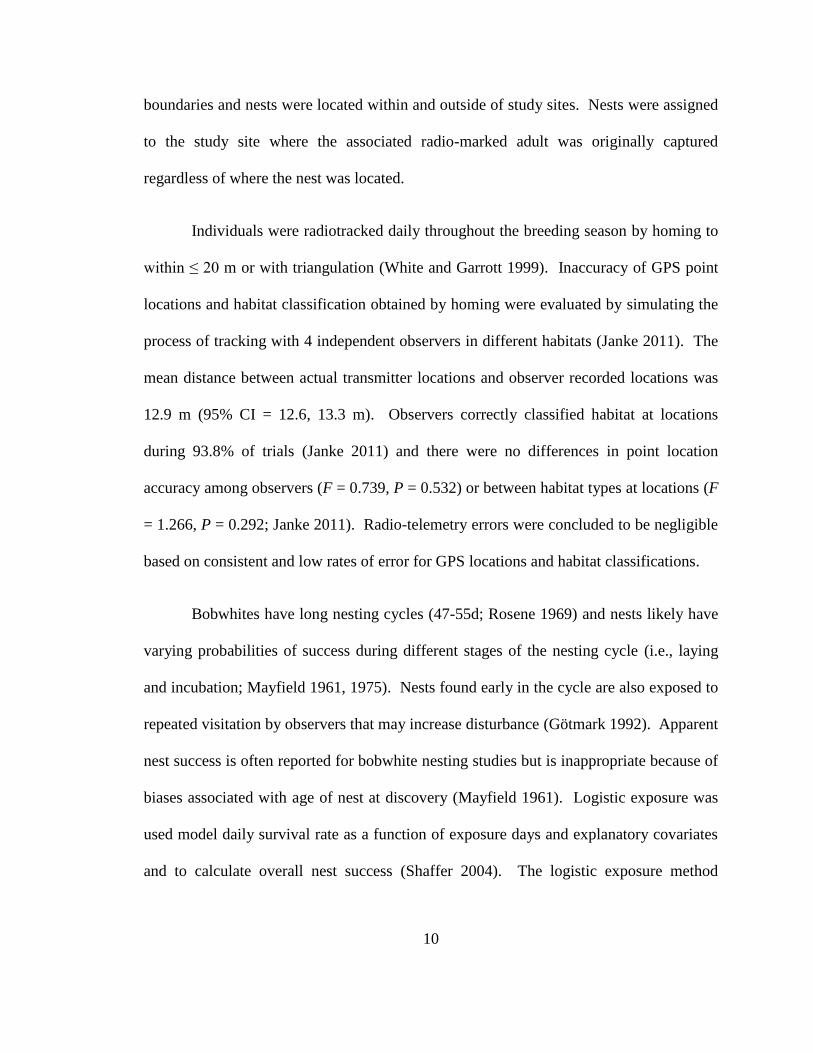
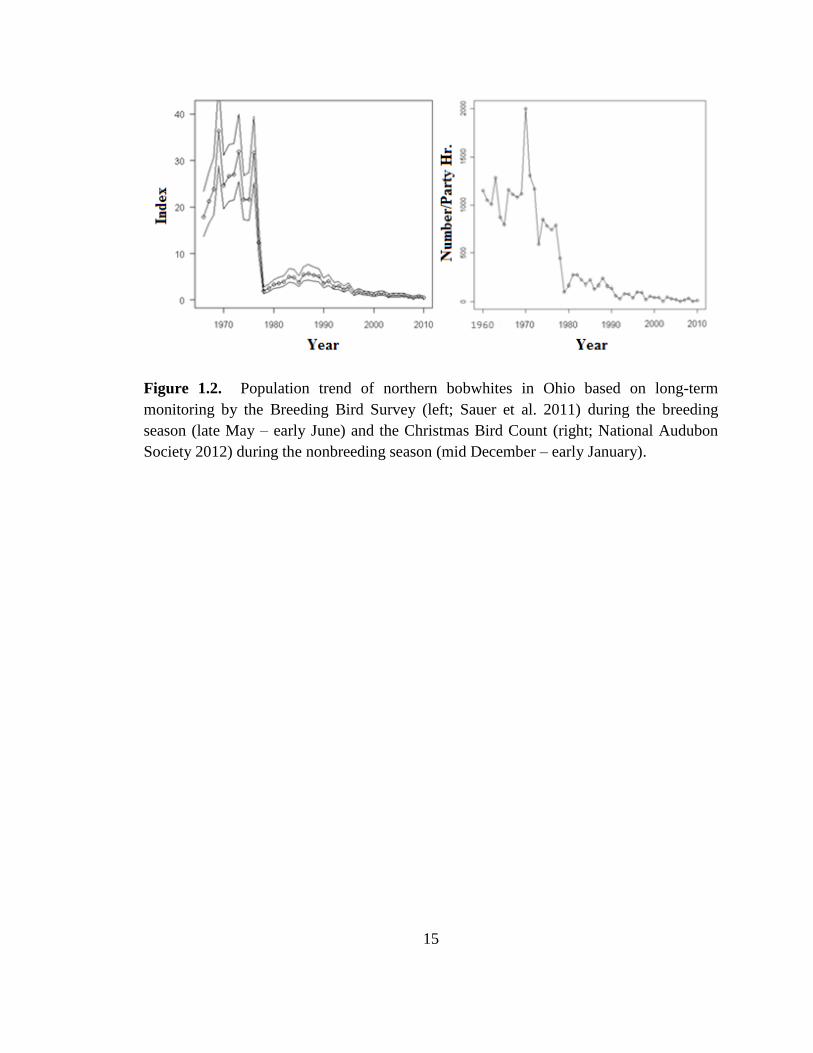
Figure 1.3. Locations of 4 study sites used to investigate dispersal and breeding ecology
of northern bobwhites during Apr-Sept 2010-2011 overlaid on National Land Cover Data
(Homer et al. 2004). Inset map of Ohio shows the distribution and relative abundance
(darker shading indicates higher densities) of bobwhite populations in 2002 from Ohio
Division of Wildlife call-count surveys (Spinola and Gates 2008). ................................. 16
Figure 2.1. Mean spring dispersal distances 95% confidence intervals for radio-marked
bobwhites in southwest Ohio during 2010 and 2011 based on age (A = adult, J = juvenile)
and sex (F = female, M = male). ....................................................................................... 44
Figure 2.2. Spring dispersal distances with 95% confidence intervals versus the
proportion of early successional woody habitat in winter home ranges by study site for
radio-marked bobwhites in southwest Ohio during 2009-2011. ....................................... 45
Figure 2.3. Spring dispersal distances versus the proportion of early successional woody
habitat in winter home ranges by study site for radio-marked bobwhites in southwest
Ohio during 2009-2011. .................................................................................................... 46

xviii
Figure 2.4. Mean spring dispersal distances with 95% confidence intervals by study site
for radio-marked bobwhites in southwest Ohio during 2009-2011. ................................. 47
Figure 3.1. Proportions of habitats with nests from radio-marked northern bobwhites in
southwest Ohio during April-September 2010-2011. ....................................................... 78
Figure 3.2. Distribution of nest initiation dates by year for radio-marked northern
bobwhites in southwest Ohio during April-September 2010-2011. ................................. 79
Figure 3.3. Distributions of hatch dates for first nests, renests, double broods, and male
incubated nests of radio-marked northern bobwhite in southwest Ohio during 2010-2011.
Vertical, dashed lines indicate the mean hatch date for each nest type. ........................... 80
Figure 3.4. Distribution of hatch dates estimated by backdating of primary feather molts
from fall-captured juvenile bobwhites (Rosene 1969) in southwest Ohio during 2010-
2011. The vertical, dashed line indicates the mean hatch date for backdated juveniles. . 81
Figure 3.5. Linear regression of clutch size and nest initiation dates for northern
bobwhite nests in southwest Ohio during 2010-2011. ...................................................... 82
Figure 3.6. Linear regression of percent egg success and nest initiation dates for
northern bobwhite nests in southwest Ohio during 2010-2011. ....................................... 83
Figure 4.1. Vegetation measurement plot used for evaluating microhabitat at northern
bobwhite nests in southwest Ohio during 2010-2011. Transects were oriented parallel
and perpendicular to the nearest habitat edge. ................................................................ 122
Figure 4.2. Comparison of microhabitat covariates for the 3 principle components (PC)
which best represent the differences between nest plot transects at northern bobwhite
nests in southwest Ohio during 2010- 2011. The length and direction of each vector
corresponds to the strength of the association with each component. ............................ 123
Figure 4.3. Two-dimensional scatterplots of the 3 principle components (PC) which best
represent the differences between nest plot transects at northern bobwhite nests in
southwest Ohio during 2010- 2011. Scatterplots correspond to the sides of the three-
dimensional scatterplot in Figure 4.4. ............................................................................. 124
xix
Figure 4.4. Three-dimensional scatterplot of the 3 principle components (PC) which best
represent the differences between nest plot transects at northern bobwhites in southwest
Ohio during 2010-2011. .................................................................................................. 125
Figure 4.5. Logistic regression of microhabitat variables from the top-ranked AICc
model (Percent shrub + Bare ground + Shrub + Upright litter) to daily nest survival
calculated with logistic exposure and averaged across the final candidate models (Table
4.7). ................................................................................................................................. 126
Figure 5.1. Habitat composition of 4 study sites in southwest Ohio where bobwhites
were captured and radiomarked. Early successional (ES) herbaceous land-cover included
grasslands, waterways, and roadsides. Early successional woody cover was primarily
fencerows and drainage ditches < 50 m. Other habitats included water, residential areas,
and paved surfaces. ......................................................................................................... 161
Figure 5.2. Habitat composition of home ranges (95% kernel utilization distributions)
for radio-marked northern bobwhite during the 2010 and 2011 breeding seasons (~10
May-30 Sep) in southwest Ohio. .................................................................................... 162
Figure 5.3. Percent of radio-telemetry locations in each habitat type for radio-marked
northern bobwhite at 4 study sites in southwest Ohio during ~10 May-30 Sep 2010-2011.
......................................................................................................................................... 163
Figure 5.4. Percent of radio-telemetry locations in each habitat based on the age of the
radio-marked northern bobwhite in southwest Ohio during ~10 May-30 Sep 2010-2011.
......................................................................................................................................... 164
Figure 5.5. Comparison of selection ratios for habitat types that significantly differed
between study years during compositional analysis (Aebischer et al. 1993) of home
ranges at the second order spatial scale for radio-marked northern bobwhite in southwest
Ohio during the breeding season (~10 May-30 Sep). ..................................................... 165
Figure 5.6. Comparison of selection ratios for habitat types that significantly differed
between study sites during compositional analysis (Aebischer et al. 1993) of telemetry
location and core used areas at the third order point spatial scale for radio-marked
northern bobwhite in southwest Ohio during the breeding season (~10 May-30 Sep). . 166

xx
Figure 5.7. Comparison of selection ratios for habitat types that significantly differed
between age classes during compositional analysis (Aebischer et al. 1993) of telemetry
location and core used areas at the third order point spatial scale for radio-marked
northern bobwhite in southwest Ohio during the breeding season (~10 May-30 Sep). . 167
Figure 5.8. Manly’s (2002) standardized selection ratios calculated as the geometric
mean of selection ratios for each habitat type at 3 spatial scales during the 2010 and 2011
breeding season (~10 May-30 Sep) for northern bobwhites in southwest Ohio. Dotted
lines represent the inverse number of resources (n = 6) where ratios greater than the line
indicate selection for that habitat. ................................................................................... 168
Figure 5.9. Manly’s (2002) standardized selection ratios calculated as the geometric
mean of Manly’s selection ratios for each habitat type at 3 spatial scales for northern
bobwhites in southwest Ohio during ~10 May-30 Sep 2010-2011. Dotted lines represent
the inverse number of resources (n = 6) where ratios greater than the line indicate
selection for that habitat. ................................................................................................. 169
Figure 5.10. Manly’s (2002) standardized selection ratios calculated as the geometric
mean of Manly’s selection ratios for each habitat type at 3 spatial scales from 4 study
sites in southwest Ohio with radio-marked northern bobwhites during ~10 May-30 Sep
2010-2011. Dotted lines represent the inverse number of resources (n = 6) where ratios
greater than the line indicate selection for that habitat. .................................................. 170
Figure 5.11. Manly’s (2002) standardized selection ratios calculated as the geometric
mean of Manly’s selection ratios for each habitat type at 3 spatial scales for adult and
juvenile radio-marked northern bobwhites in southwest Ohio during ~10 May-30 Sep
2010-2011. Dotted lines represent the inverse number of resources (n = 6) where ratios
greater than the line indicate selection for that habitat. .................................................. 171
1
CHAPTER 1 : INTRODUCTION
Northern bobwhites (Colinus virginianus, hereafter bobwhites) are described as
an “edge” species because of their affinity for early successional habitats and ecotones
(Peterjohn 2001). They occupy a diverse range of landscapes-- from the desert
southwest, to eastern rangelands, and pine-plantations of the southeast-- but are an iconic
bird of the agricultural eastern and Midwestern United States. They are an economically
important upland game species (Burger et al. 1999) and are one of the few hunted bird
species that is a resident and non-migratory. Bobwhite form wintering groups called
coveys and individuals and pairs typically disperse within localized areas begin breeding
when coveys break-up in spring. Most quail species are short lived, and 70-80% of
bobwhites die each year (Rosene 1969). Large clutches of eggs and re-nesting provide
bobwhite opportunities to maximize reproduction and compensate for low annual
survival.
Bobwhite populations peaked in the United States during the early 1800’s when
land use changes and expanding agriculture provided abundant early successional
habitats. Farms at this time were characterized by small fields, high crop diversity,
numerous fencerows, and un-tillable “odd areas” (Trautman 1977). Fields were often left
fallow and herbicides were applied less frequently and in lower quantities than in the
present. These farming practices provided habitat that satisfied all elements of the
2
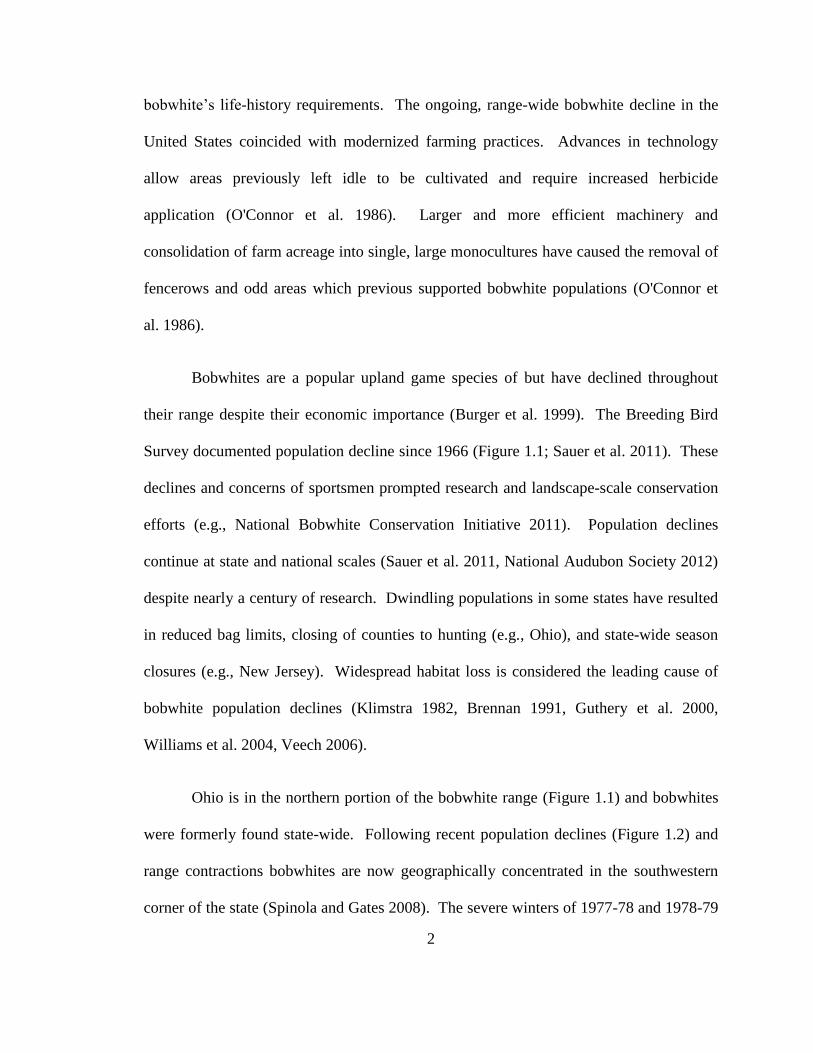
bobwhite’s life-history requirements. The ongoing, range-wide bobwhite decline in the
United States coincided with modernized farming practices. Advances in technology
allow areas previously left idle to be cultivated and require increased herbicide
application (O'Connor et al. 1986). Larger and more efficient machinery and
consolidation of farm acreage into single, large monocultures have caused the removal of
fencerows and odd areas which previous supported bobwhite populations (O'Connor et
al. 1986).
Bobwhites are a popular upland game species of but have declined throughout
their range despite their economic importance (Burger et al. 1999). The Breeding Bird
Survey documented population decline since 1966 (Figure 1.1; Sauer et al. 2011). These
declines and concerns of sportsmen prompted research and landscape-scale conservation
efforts (e.g., National Bobwhite Conservation Initiative 2011). Population declines
continue at state and national scales (Sauer et al. 2011, National Audubon Society 2012)
despite nearly a century of research. Dwindling populations in some states have resulted
in reduced bag limits, closing of counties to hunting (e.g., Ohio), and state-wide season
closures (e.g., New Jersey). Widespread habitat loss is considered the leading cause of
bobwhite population declines (Klimstra 1982, Brennan 1991, Guthery et al. 2000,
Williams et al. 2004, Veech 2006).
Ohio is in the northern portion of the bobwhite range (Figure 1.1) and bobwhites
were formerly found state-wide. Following recent population declines (Figure 1.2) and
range contractions bobwhites are now geographically concentrated in the southwestern
corner of the state (Spinola and Gates 2008). The severe winters of 1977-78 and 1978-79

3
are often blamed for the decline, but Ohio’s bobwhite population was already declining
before these winters (Figure 1.2). Although bobwhite populations are capable of
recovering after catastrophic weather events (Roseberry and Klimstra 1984), populations
in Ohio have not recovered even with implementation of the Conservation Reserve
Program (CRP) that was designed to convert erodible cropland into permanent
herbaceous and wooded cover types. In fact, bobwhite populations in Ohio declined
more rapidly from 1966-2010 (7.6% annually, 95% CI = 3.6-4.1; Sauer et al. 2011) than
the national average decline of 3.8% annually (95% CI = 6.5-8.6; Sauer et al. 2011).
This study was conducted in Ohio primarily on privately owned, agricultural
lands with no active bobwhite habitat management. The National Bobwhite
Conservation Initiative (NBCI) identified landscapes with high potential for bobwhite
conservation as being primarily agricultural (National Bobwhite Conservation Initiative
2011). Numerous studies of bobwhite ecology have been conducted on public areas and
areas where habitat is managed specifically for bobwhites. A disproportionate share of
our knowledge of bobwhite ecology comes from these areas despite the vast majority of
the bobwhite range occurring on privately-owned and largely unmanaged properties.
This study fills important knowledge gaps and aims to identify opportunities and make
recommendation for managing breeding habitat in southwestern Ohio.
The overarching aim of this research project was to evaluate the viability of
bobwhite populations in the geographic core of their Ohio range. Reproductive rates that
balance annual mortality are vital to sustain viable bobwhite populations, but it is unclear
if recovery of Ohio’s bobwhite population is limited by reproduction. Our understanding

4
of bobwhite breeding ecology has expanded in recent decades but remains limited for
populations in the northern Midwest.
STUDY DESIGN
Study Sites
The study area was located within the Eastern Tall Grass Prairie Bird
Conservation Region of the NBCI (National Bobwhite Conservation Initiative 2011).
Study sites were randomly selected from private lands thought to contain suitable habitat
within the geographic core of Ohio bobwhites (Gates et al. 2012). Random selection of
study sites allows generalization of research findings from the study site populations to
the larger regional population of bobwhites. Bobwhites were captured in Highland and
Brown counties at 4 study sites: Fee, Wildcat, Peach Orchard (or Peach), and Thurner
(Figure 1.3). These sites were located along the Illinoian Glacial boundary of the Till
Plains physiographic region of Ohio (Ohio Division of Geologic Survey 1998).
Glaciation produced gently undulating topography with moderately low relief (~15 m)
and pronounced hills with moderate relief (~ 60 m) along the eastern glacial boundary
(Ohio Division of Geologic Survey 1998). This topography was not as favorable for
modern, large-scale agricultural production techniques. Highland and Brown counties
had lower proportions of row crop agriculture compared to other counties in Ohio
(National Agricultural Statistics Service 2012a).
Highland and Brown Counties were primarily classified as rural (6.1% developed)
and the dominant land-cover was agriculture with interspersed grassland (3%), forest
5
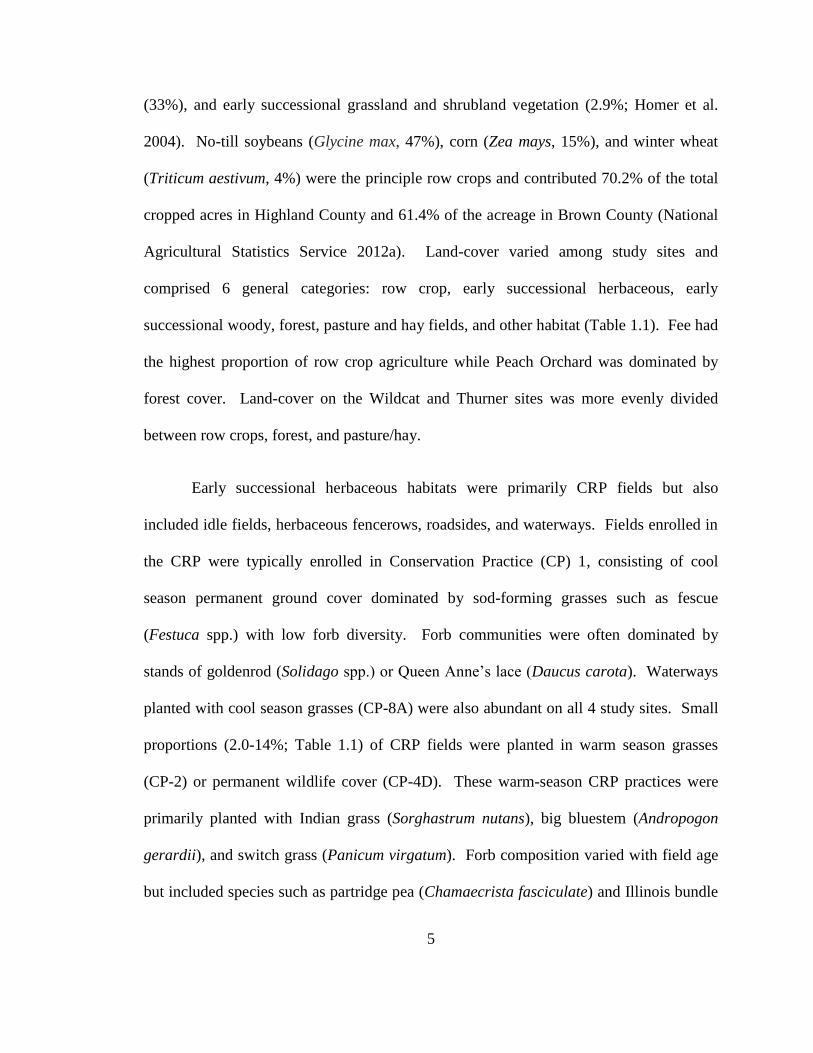
(33%), and early successional grassland and shrubland vegetation (2.9%; Homer et al.
2004). No-till soybeans (Glycine max, 47%), corn (Zea mays, 15%), and winter wheat
(Triticum aestivum, 4%) were the principle row crops and contributed 70.2% of the total
cropped acres in Highland County and 61.4% of the acreage in Brown County (National
Agricultural Statistics Service 2012a). Land-cover varied among study sites and
comprised 6 general categories: row crop, early successional herbaceous, early
successional woody, forest, pasture and hay fields, and other habitat (Table 1.1). Fee had
the highest proportion of row crop agriculture while Peach Orchard was dominated by
forest cover. Land-cover on the Wildcat and Thurner sites was more evenly divided
between row crops, forest, and pasture/hay.
Early successional herbaceous habitats were primarily CRP fields but also
included idle fields, herbaceous fencerows, roadsides, and waterways. Fields enrolled in
the CRP were typically enrolled in Conservation Practice (CP) 1, consisting of cool
season permanent ground cover dominated by sod-forming grasses such as fescue
(Festuca spp.) with low forb diversity. Forb communities were often dominated by
stands of goldenrod (Solidago spp.) or Queen Anne’s lace (Daucus carota). Waterways
planted with cool season grasses (CP-8A) were also abundant on all 4 study sites. Small
proportions (2.0-14%; Table 1.1) of CRP fields were planted in warm season grasses
(CP-2) or permanent wildlife cover (CP-4D). These warm-season CRP practices were
primarily planted with Indian grass (Sorghastrum nutans), big bluestem (Andropogon
gerardii), and switch grass (Panicum virgatum). Forb composition varied with field age
but included species such as partridge pea (Chamaecrista fasciculate) and Illinois bundle
6
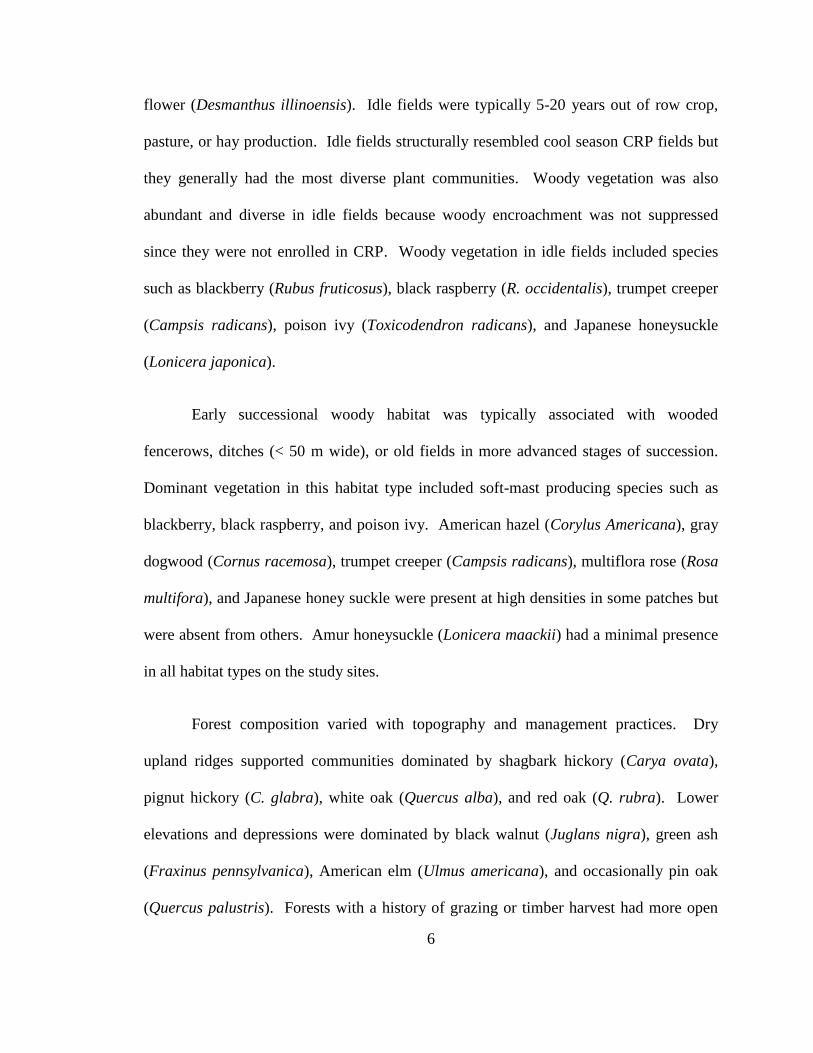
flower (Desmanthus illinoensis). Idle fields were typically 5-20 years out of row crop,
pasture, or hay production. Idle fields structurally resembled cool season CRP fields but
they generally had the most diverse plant communities. Woody vegetation was also
abundant and diverse in idle fields because woody encroachment was not suppressed
since they were not enrolled in CRP. Woody vegetation in idle fields included species
such as blackberry (Rubus fruticosus), black raspberry (R. occidentalis), trumpet creeper
(Campsis radicans), poison ivy (Toxicodendron radicans), and Japanese honeysuckle
(Lonicera japonica).
Early successional woody habitat was typically associated with wooded
fencerows, ditches (< 50 m wide), or old fields in more advanced stages of succession.
Dominant vegetation in this habitat type included soft-mast producing species such as
blackberry, black raspberry, and poison ivy. American hazel (Corylus Americana), gray
dogwood (Cornus racemosa), trumpet creeper (Campsis radicans), multiflora rose (Rosa
multifora), and Japanese honey suckle were present at high densities in some patches but
were absent from others. Amur honeysuckle (Lonicera maackii) had a minimal presence
in all habitat types on the study sites.
Forest composition varied with topography and management practices. Dry
upland ridges supported communities dominated by shagbark hickory (Carya ovata),
pignut hickory (C. glabra), white oak (Quercus alba), and red oak (Q. rubra). Lower
elevations and depressions were dominated by black walnut (Juglans nigra), green ash
(Fraxinus pennsylvanica), American elm (Ulmus americana), and occasionally pin oak
(Quercus palustris). Forests with a history of grazing or timber harvest had more open
7
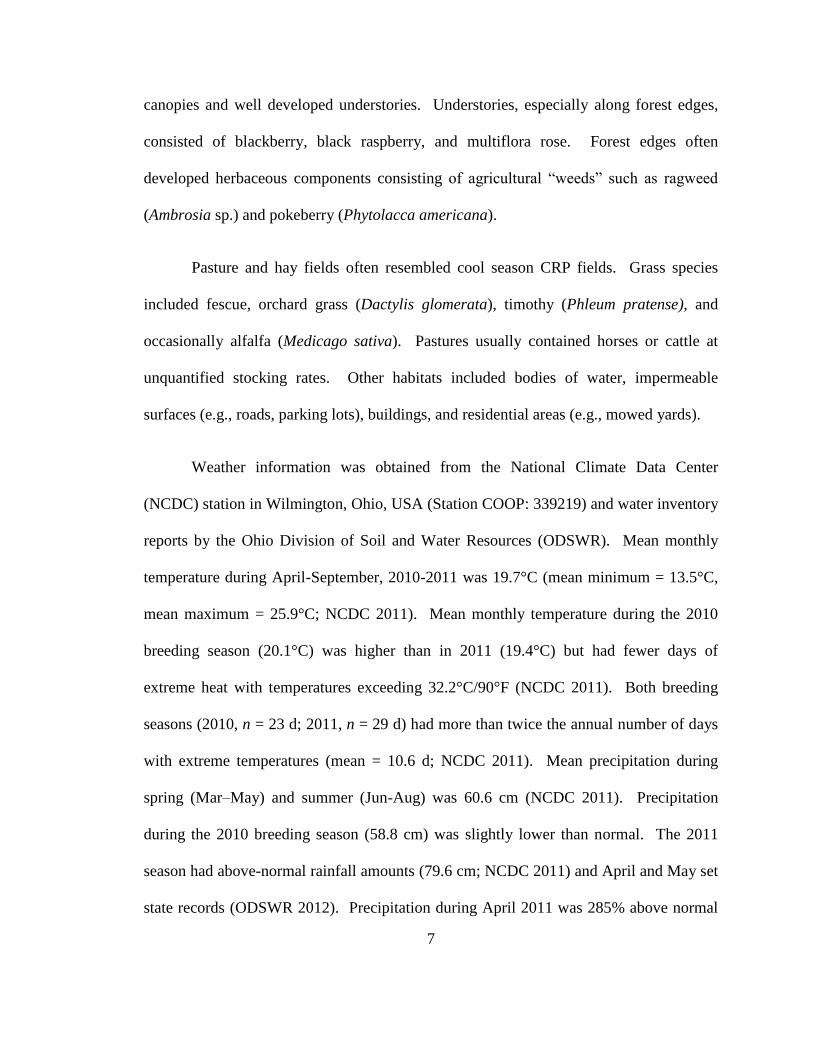
canopies and well developed understories. Understories, especially along forest edges,
consisted of blackberry, black raspberry, and multiflora rose. Forest edges often
developed herbaceous components consisting of agricultural “weeds” such as ragweed
(Ambrosia sp.) and pokeberry (Phytolacca americana).
Pasture and hay fields often resembled cool season CRP fields. Grass species
included fescue, orchard grass (Dactylis glomerata), timothy (Phleum pratense), and
occasionally alfalfa (Medicago sativa). Pastures usually contained horses or cattle at
unquantified stocking rates. Other habitats included bodies of water, impermeable
surfaces (e.g., roads, parking lots), buildings, and residential areas (e.g., mowed yards).
Weather information was obtained from the National Climate Data Center
(NCDC) station in Wilmington, Ohio, USA (Station COOP: 339219) and water inventory
reports by the Ohio Division of Soil and Water Resources (ODSWR). Mean monthly
temperature during April-September, 2010-2011 was 19.7°C (mean minimum = 13.5°C,
mean maximum = 25.9°C; NCDC 2011). Mean monthly temperature during the 2010
breeding season (20.1°C) was higher than in 2011 (19.4°C) but had fewer days of
extreme heat with temperatures exceeding 32.2°C/90°F (NCDC 2011). Both breeding
seasons (2010, n = 23 d; 2011, n = 29 d) had more than twice the annual number of days
with extreme temperatures (mean = 10.6 d; NCDC 2011). Mean precipitation during
spring (Mar–May) and summer (Jun-Aug) was 60.6 cm (NCDC 2011). Precipitation
during the 2010 breeding season (58.8 cm) was slightly lower than normal. The 2011
season had above-normal rainfall amounts (79.6 cm; NCDC 2011) and April and May set
state records (ODSWR 2012). Precipitation during April 2011 was 285% above normal
8
and was the wettest in the past 129 years and May 2011 was the sixth wettest in state
history (ODSWR 2012).
General Field Methods and Assumptions
A critical review of methodological and analytical assumptions for this study is
offered in the following section. The sampling protocol was designed to obtain valid
inferences from our datasets. Research equipment and field methods were also chosen to
limit experimental influences, but potential biases are discussed.
Land cover within study sites was digitized at each site with ArcGIS (version
10.0, ESRI, Redlands, CA, USA) over high spatial resolution (0.305 m)
orthophotographs (Ohio Statewide Imagery Program 2008). Thirteen habitat types were
identified in the baseline coverage and then combined into 6 general classification
categories: row crop, early successional herbaceous, early successional woody, forest,
pasture and hay fields, and non habitat. Land cover types were identified with ground-
truthing for areas that encompassed all telemetry locations obtained during the breeding
season (May-Sep). Areas not ground-truthed were classified from orthophotographs and
CropScape, the cropland data layer from the USDA National Agriculture Statistic Service
(National Agricultural Statistics Service 2012b).
Radio-telemetry was essential for conducting fine-scale analyses of habitat use,
nest site selection, and to estimate nesting rates, survival, and movements. Only
bobwhites > 150 g were radiomarked so that the weight of radio-packages (i.e., harness,
transmitter, and antenna) never exceeded 5% of an individual’s body weight. Birds were
9
not radiomarked if they had pre-existing injuries or poor physical condition at capture or
were injured during capture or handling. Capture, handling, and marking (leg-bands and
radio-packages) were assumed to have no impact on bobwhite behavior, survival, or
reproductive fitness during this study. A review of published survivorship studies by
Guthery and Lusk (2004) concluded that most survival rates were biased by radio-
packages. Folk et al. (2007) questioned the strength of evidence used in Guthery and
Lusk (2004) and argued that while researchers should be critical of all methodological
assumptions, useful techniques should not be abandoned without sufficient empirical
evidence. Some studies use a 7-14 day adjustment period after radio-marking and birds
that die during this period are censored from survival analysis (Guthery and Lusk 2004,
Holt et al. 2009, Janke 2011). Hernandez et al. (2004) observed no differences in body
mass, feed consumption, or daily energy expenditure between radio-marked and banded-
only bobwhites under different environmental conditions in captivity. In addition,
bobwhites in the northern portion of the species’ range (e.g., Ohio) have larger body
masses than their southern counterparts (Rosene 1969) which may reduce any
“handicapping” effects of radio-packages.
Most bobwhites were captured using baited funnel traps and targeted mist netting
within predefined, nonbreeding season (Oct-Mar) study site boundaries when covey
affiliations, weather, and vegetation benefited capture activities (Wiley et al. 2012).
Radio-marked individuals were added opportunistically with targeted mist-netting during
the breeding season (Apr-Sep) including outside of nonbreeding season study site
boundaries. Radio-marked individuals were monitored without regard to study site
10
boundaries and nests were located within and outside of study sites. Nests were assigned
to the study site where the associated radio-marked adult was originally captured
regardless of where the nest was located.
Individuals were radiotracked daily throughout the breeding season by homing to
within ≤ 20 m or with triangulation (White and Garrott 1999). Inaccuracy of GPS point
locations and habitat classification obtained by homing were evaluated by simulating the
process of tracking with 4 independent observers in different habitats (Janke 2011). The
mean distance between actual transmitter locations and observer recorded locations was
12.9 m (95% CI = 12.6, 13.3 m). Observers correctly classified habitat at locations
during 93.8% of trials (Janke 2011) and there were no differences in point location
accuracy among observers (F = 0.739, P = 0.532) or between habitat types at locations (F
= 1.266, P = 0.292; Janke 2011). Radio-telemetry errors were concluded to be negligible
based on consistent and low rates of error for GPS locations and habitat classifications.
Bobwhites have long nesting cycles (47-55d; Rosene 1969) and nests likely have
varying probabilities of success during different stages of the nesting cycle (i.e., laying
and incubation; Mayfield 1961, 1975). Nests found early in the cycle are also exposed to
repeated visitation by observers that may increase disturbance (Götmark 1992). Apparent
nest success is often reported for bobwhite nesting studies but is inappropriate because of
biases associated with age of nest at discovery (Mayfield 1961). Logistic exposure was
used model daily survival rate as a function of exposure days and explanatory covariates
and to calculate overall nest success (Shaffer 2004). The logistic exposure method
11
assumes constant daily survival which may not be appropriate for bobwhite nests since
bobwhites exhibit different behaviors during egg-laying and incubation (Rosene 1969).
Nests with no eggs and those abandoned < 1 day after discovery were excluded to
minimize bias caused by investigator-caused nest failure. Biases in nest success may still
have occurred if nests were not found prior to failure or natural abandonment. Failure to
find bobwhite nests that fail early in the nesting period would also influence how first
nests, re-nests, and double clutch attempts were classified. Additional nest attempts were
termed renests if they occurred after a previous nest failed and double clutches if they
occurred after a known successful nest. Misclassifications of bobwhite nesting attempts
would cascade through nesting analysis (Garcia and Conway 2009) including
investigations of breeding strategies and peaks in nesting activity.
THESIS CONTENT
The purpose of this thesis is to contribute to understanding of bobwhite ecology
and management during the breeding season in the northern portion of the range with
particular relevance for management of private working lands in Ohio. The following 4
chapters focus on research pertaining to the breeding season (1 April - 30 September) and
investigate behavioral aspects and factors limiting bobwhite reproduction in southwestern
Ohio. Chapter 2 investigates movements and survival during spring dispersal and
explores characteristics of winter home range composition that influence dispersal
behavior. Bobwhite nesting biology and behavior are addressed in Chapter 3 and
compared to other populations within North America. Vital rates of interest included
12
breeding season survival, nest success, renesting, double clutching, male incubation, and
nesting chronology. Microhabitat characteristics of nest sites are examined in Chapter 4
to elucidate factors that influence nest site selection and nest success. Chapter 5
investigates habitat selection at multiple spatial scales. Each chapter was prepared as a
stand-alone manuscript with the objective to later submit them for publication.
Generally, the formatting guidelines of the Journal of Wildlife Management were
followed and plural pronouns were used in chapters 2-5 in anticipation of publication co-
authorships.

13
Fee Peach Wildcat Thurner
Area (ha) 1,284 398 838 739
Mean slope (%) 5.0 9.7 5.1 4.5
Mean covey density (coveys/km2) 0.59 0.45 1.47 0.72
Mean row crop field size (ha) 12.6 7.6 7.6 10.0
CRP area (ha) 124 75 137 26
CRP composition (%) a
Cool-season grasses 87 98 89 87
Warm-season grasses 13 2.0 11 14
Landscape composition (%) b
Row crop 62 18 35 32
Developed 6.4 4.1 5.2 6.3
Forest 21 50 32 28
Grassland / Shrub 0.6 6.8 5.7 6.2
Pasture / Hay 10 21 22 27
Other 0.3 0.1 0.2 0.6
Site composition (%) c
ES herbaceous d 13 212 20 12
ES woody d 3.4 7.2 3.2 4.9
Forest 8.1 28 10 15
Other 4.0 4.7 3.9 9.3
Pasture / Hay 2.6 2.3 23.6 6.7
Row Crop 70 36 40 52 a Proportion of area of all CRP fields in respective categories
b Proportion NLCD habitat within 10 km buffer around the centroid of the study
site c Proportion of the maximum extent of the site boundaries from 2 nonbreeding
seasons (Oct-Mar, 2009-2011) in each habitat type d ES = early successional
Table 1.1. Physical and land-cover characteristics of 4 study sites in southwest Ohio
where northern bobwhites were captured during April- September 2010-2011.

14
Figure 1.1. Geographic distribution and population trends of northern bobwhites from
the Breeding Bird Survey during 1966-2010 (Sauer et al. 2011). The trend at any map
point was estimated as a weighted average of trend information from nearby survey
routes where bobwhites were detected (Sauer et al. 2011).
15
Figure 1.2. Population trend of northern bobwhites in Ohio based on long-term
monitoring by the Breeding Bird Survey (left; Sauer et al. 2011) during the breeding
season (late May – early June) and the Christmas Bird Count (right; National Audubon
Society 2012) during the nonbreeding season (mid December – early January).
16
Figure 1.3. Locations of 4 study sites used to investigate dispersal and breeding ecology
of northern bobwhites during Apr-Sept 2010-2011 overlaid on National Land Cover Data
(Homer et al. 2004). Inset map of Ohio shows the distribution and relative abundance
(darker shading indicates higher densities) of bobwhite populations in 2002 from Ohio
Division of Wildlife call-count surveys (Spinola and Gates 2008).

17
LITERATURE CITED
Brennan, L. A. 1991. How can we reverse the northern bobwhite population decline?
Wildlife Society Bulletin 19:544-555.
Burger, L. W., D. A. Miller, and R. I. Southwick. 1999. Economic impact of northern
bobwhite hunting in the southeastern United States. Wildlife Society Bulletin
27:1010-1018.
Folk, T. H., J. B. Grand, W. E. Palmer, J. P. Carroll, D. C. Sisson, T. M. Terhune, S. D.
Wellendorf, and H. L. Stribling. 2007. Estimates of survival from radiotelemetry:
a response to Guthery and Lusk. Journal of Wildlife Management 71:1027-1033.
Garcia, V., and C. J. Conway. 2009. What constitutes a nesting attempt? variation in
criteria causes bias and hinders comparisons across studies. The Auk 126:31-40.
Gates, R. J., A. K. Janke, M. R. Liberati, and M. J. Wiley. 2012. Population ecology and
habitat relationships of northern bobwhite in southwestern Ohio. Proceedings of
the National Quail Symposium 7: in press.
Götmark, F. 1992. The effects of investigator disturbance on nesting birds. Current
Ornithology 9:63-104.
Guthery, F. S., and J. J. Lusk. 2004. Radiotelemetry studies: are we radio-handicapping
northern bobwhites? Wildlife Society Bulletin 32:194-201.
Guthery, F. S., M. J. Peterson, and R. R. George. 2000. Viability of northern bobwhite
populations. Journal of Wildlife Management 64:646-662.
Hernández, F., J. A. Arredondo, F. Hernandez, D. G. Hewitt, S. J. DeMaso, and R. L.
Bingham. 2004. Effects of radiotransmitters on body mass, feed consumption, and
energy expenditure of northern bobwhites. Wildlife Society Bulletin 32:394-400.
Holt, R. D., L. W. Burger, S. J. Dinsmore, M. D. Smith, S. J. Szukaitis, and K. D.
Godwin. 2009. Estimating duration of short-term acute effects of capture handling
and radiomarking. Journal of Wildlife Management 73:989-995.
18
Homer, C., C. Huang, C. Yang, B. Wylie, and M. Coan. 2004. Development of a 2001
national land-cover database for the United States. Photogrammetric Engineering
and Remote Sensing 70:829-840.
Janke, A. K. 2011. Survival and habitat use of non-breeding northern bobwhites on
private lands in Ohio. Thesis, The Ohio State University, Columbus, Ohio, USA.
Klimstra, W. D. 1982. Bobwhite quail and changing land use. Pages 1-5 in F. Schitoskey,
Jr , E. C. Shitoskey, and L. G. Talent, eds. Proceedings of the Second National
Bobwhite Quail Symposium. Oklahoma State University, Stillwater, Oklahoma,
USA.
Mayfield, H. F. 1975. Suggestions for calculating nest success. Wilson Bulletin 87:456-
466.
Mayfield, H. F. 1961. Nesting success calculated from exposure. Wilson Bulletin 73:255-
261.
National Agricultural Statistics Service. 2012a. County estimates. United States
Department of Agriculture.
<http://www.nass.usda.gov/Statistics_by_State/Ohio/index.asp>. Accessed Apr
2012.
National Agricultural Statistics Service. 2012b. Published crop-specific data layer
[Online]. USDA-NASS, Washington, District of Columbiad, USA.
<http://nassgeodata.gmu.edu/CropScape/>. Accessed May 2012.
National Audubon Society. 2012. The Christmas bird count historical results [Online].
<http://www.audubon.org/bird/cbc>. Accessed Apr 2012.
National Bobwhite Conservation Initiative. 2011. The national bobwhite conservation
initiative: a range-wide plan for recovering bobwhites. in W. E. Palmer, T. M.
Terhune, and D. F. McKenzie, eds. National Bobwhite Technical Committee
Publication, ver 2.0. Knoxville, Tennessee, USA.
National Climate Data Center [NCDC]. 2011. Quality Controlled Local Climatological
Data. Hillsboro, Ohio, USA. <http://www.ncdc.noaa.gov/oa/ncdc/html>.
Accessed Dec 2011.

19
O'Connor, R. J., M. Shrubb, and D. Watson. 1986. Farming & birds. Cambridge
University Press, Cambridge, New York, USA.
Ohio Division of Geologic Survey. 1998. Physiographic regions of Ohio. Ohio
Department of Natural Resources. Report page-size map with text, 2p., scale
1:2,100,000.
Ohio Division of Soil and Water Resources [ODSWR]. 2012. Monthly Water Inventory
Report for Ohio, Apr-Sept 2010-2011. Ohio Department of Natural Resources.
Columbus, Ohio, USA. <http://www.ohiodnr.gov/tabid/4191/Default.aspx>.
Accessed Nov 2012.
Ohio Statewide Imagery Program. 2008. OSIP 1 Foot Color Orthophotography.
<http://gis3.oit.ohio.gov/geodata/>. Accessed Oct 2009.
Peterjohn, B. G. 2001. The birds of Ohio. Wooster Book Co., Woster, Ohio, USA.
Roseberry, J. L., and W. D. Klimstra. 1984. Population ecology of the bobwhite.
Southern Illinois University Press, Carbondale, Illinois, USA.
Rosene, W. 1969. The bobwhite quail: its life and management. Rutgers University Press,
New Brunswick, New Jersey, USA.
Sauer, J. R., J. E. Hines, J. E. Fallon, K. L. Pardieck, D. J. Ziolkowski, Jr., and W. A.
Link. 2011. The North American Breeding Bird Survey, summary and analysis
1966-2010, Version 12.07.2011. USGS Patuxent Wildlife Research Center,
Laurel, Maryland, USA.
Shaffer, T. L. 2004. A unified approach to analyzing nest success. The Auk 121:526-540.
Spinola, R. M., and R. J. Gates. 2008. Population status and trends of northern bobwhite
(Colinus virginianus) in Ohio: 1984-2004. Ohio Journal of Science 108:26-30.
Trautman, M. 1977. The Ohio country from 1750 to 1977: a naturalist's view. Ohio State
University, Columbus, Ohio, USA.
Veech, J. A. 2006. Increasing and declining populations of northern bobwhites inhabit
different types of landscapes. Journal of Wildlife Management 70:922-930.
20
White, G. C., and R. A. Garrott. 1999. Analysis of wildlife radio-tracking data. Academic
Press, San Diego, California, USA.
Wiley, M. J., R. J. Gates, and A. K. Janke. 2012. Efficacy of targeted mist netting to
capture northern bobwhites during the non-breeding season. Proceedings of the
National Quail Symposium 7: in press.
Williams, C. K., F. S. Guthery, R. D. Applegate, and M. J. Peterson. 2004. The northern
bobwhite decline: scaling our management for the twenty-first century. Wildlife
Society Bulletin 32:861-869.
21
CHAPTER 2 : SPRING DISPERSAL OF NORTHERN BOBWHITE
IN SOUTHWEST OHIO
ABSTRACT
Northern bobwhites (Colinus virginianus) historically occurred throughout Ohio
but their core range has contracted to 18 southwestern counties. The Ohio Division of
Wildlife has used trapping and transplanting to reintroduce wild bobwhites to unoccupied
habitats within the species’ historic range. Bobwhite dispersal information is necessary
to understand population dynamics and the species’ capacity to recolonize unoccupied
habitats. Bobwhites were captured and radiomarked on 4 private-land study sites in
southwest Ohio. Radio-marked bobwhites (n = 66) were tracked by homing or
triangulation during spring 2010 and 2011 to ascertain dispersal distances between winter
and breeding ranges. The spring dispersal period was defined by break-up of coveys and
subsequent occupation of breeding season home ranges. The dispersal period, defined by
non-affiliation with coveys, long directional daily movements, and observed breeding
activity, varied among individuals and ranged from 2 April to 26 May. Dispersal
distances were measured as the net Euclidean distance between locations recorded at the
beginning and end of the dispersal period. Dispersers were defined as birds that moved >
2x the diameter of the mean home-range size (26.1 ha) observed during October-March
22
2010 and 2011. Movements of 1-2 home range diameters were classified as home range
shifts. Non-dispersing bobwhites traveled < 1 home range diameter. Mean movement
for all birds was 1.54 km. Twenty-eight (42.4%) radio-marked bobwhites were non-
dispersers, 15 (22.7%) shifted home ranges, and 23 (34.8%) dispersed. Non-dispersers
moved a mean of 0.31 km (range = 0.03–0.56 km), home range shifts averaged 0.78 km
(range = 0.60–0.99 km), and dispersers traveled a mean distance of 3.6 km (range =
1.18–11.5 km). Dispersal distance was lowest for adult females and increased in order
for adult males, juvenile females, and juvenile males. Dispersal distance decreased as the
proportion of early successional wooded habitat within winter home ranges increased.
Sex, age, and dispersal distance did not affect survival. Our results suggest Ohio
bobwhites are capable of expanding their range into historically-populated areas.
INTRODUCTION
Habitat loss is considered the primary cause of range-wide population declines of
northern bobwhite (Colinus virginianus; Klimstra 1982, Brennan 1991, Guthery et al.
2000, Williams et al. 2004, Veech 2006). Bobwhite habitat in Ohio has been lost to
intensification of agricultural practices and land-use changes that leave residual usable
habitats in a fragmented matrix. Habitat losses were compounded by severe winters
experienced by populations on the northern fringe of the bobwhite range. The bobwhite
range in Ohio contracted concurrent with a state population decline of 76% between 1984
and 2004 (Spinola and Gates 2008). Formerly distributed state-wide, the current
geographic core range is now largely confined to southwestern Ohio (Spinola and Gates
2008, Ohio Breeding Bird Atlas II 2012). There is some evidence that bobwhites are
23
patchily distributed even in the core of the species range in southwest Ohio (Gates et al.
2012).
Avian dispersal provides important ecological and evolutionary benefits such as
outbreeding and gene flow (Howard 1960, Greenwood and Harvey 1982, Walters 2000).
The ability to colonize vacant habitats and establish new populations may be the most
important aspect of this behavior for bobwhites. Dispersal rescue (Townsend et al. 2003)
has potential to supplement declining populations or re-establish bobwhite populations in
historically occupied areas (Martin et al. 2000). Dispersal has been viewed as costly for
avian species (Bélichon et al. 1996) because individuals were thought to increase risk of
mortality after moving into novel areas (Yoder et al. 2004) and miss breeding
opportunities by moving into areas without conspecifics or by expending time and energy
to search for mates and nest sites (Danchin and Cam 2002). Their limited flight
capabilities may make bobwhites particularly susceptible to risks associated with
dispersal behavior. They are primarily terrestrial and their movements are mostly on foot
rather than in flight (Kassinis and Guthery 1996, Guthery 2000). Bobwhites have
traditionally been considered a sedentary species because of limited mobility.
The ability of bobwhites to travel and disperse in fragmented agricultural
landscapes is unclear and previous studies are not necessarily applicable to Ohio.
Opportunistic and anecdotal observations of marked birds provide conservative estimates
of dispersal distances and do not effectively capture long-distance movements (Stoddard
1931, Lehmann 1946, Murphy and Baskett 1952, Lewis 1954, Smith et al. 1982).
Dispersal studies that use radio-telemetry have been conducted either in areas managed

24
exclusively for bobwhites (Liu et al. 2002, Terhune et al. 2006, Terhune et al. 2010) or in
ecosystems that differ from the agricultural landscape of Ohio (Liu et al. 2002, Townsend
et al. 2003, Cook et al. 2006, Terhune et al. 2006). Application of dispersal information
from continuous landscapes dominated by rangelands (Townsend et al. 2003), pine
(Pinus spp.) plantations (Cook et al. 2006, Terhune et al. 2006, Terhune et al. 2010), or
forested habitats (Fies et al. 2002, Liu et al. 2002) to fragmented Ohio landscapes
dominated by row crops is tenuous at best. In addition, areas managed specifically for
bobwhites may not require birds to travel as far to find suitable breeding habitat or mates
and may not accurately reflect the cost of dispersal in less hospitable or unmanaged
landscapes.
Dispersal is essential to recolonizing historically-occupied areas in Ohio that are
now fragmented and isolated. Radio-telemetry was used to study spring dispersal of
bobwhites on 4 private-land study sites in southwest Ohio. Dispersal distances, survival
during dispersal, and habitat influences on dispersal distances were evaluated during
spring 2010 and 2011. Our objectives were to (1) ascertain the proportion of dispersing
individuals in the population, (2) compare spring dispersal distances among age-sex
classes, study sites, and years, (3) examine the effect of dispersal distance on survival of
dispersing birds, and (4) and investigate the influence of winter home-range composition
on spring dispersal distance.
STUDY AREA
This study was conducted on 4 study sites in southwestern Ohio in the current
geographic core of the bobwhite range (Spinola and Gates 2008). Sites were in Highland
25
and Brown counties (39°04’59”, 83°39’10”) within the Till Plains and Illinois Till Plains
regions of Ohio (Ohio Division of Geologic Survey 1998) and the Eastern Tall Grass
Prairie Bird Conservation Region of the National Bobwhite Conservation Initiative
(NBCI 2011). Agriculture was the primary land use (39% row crops, 17% pasture/hay)
in this rural region (6% of land-cover developed; Homer et al. 2004) with interspersed
grassland (3%) and forest (33%). The gently undulating topography resulting from
glaciation in these counties is less favorable for modern, large-scale agricultural
production and cropping; land-use limitations (e.g., small field sizes) along the glacial
boundary benefited bobwhite populations where it occurred.
The 4 study sites (Fee, Peach, Wildcat, and Thurner) represented a gradient from
agriculture- to forest-dominated landscapes (Table 2.1). Land-use at each study site was
evaluated using National Land Cover Data (NLCD) within a 10-km buffer around the site
centroids. Nesting habitat was considered to be any early successional herbaceous
habitat (i.e., grassland/shrub, pasture/hay). The Fee site had the highest proportion of
row crops and the lowest proportions of nesting habitat (11.0%) and forests. Wildcat and
Thurner were intermediate along the agricultural-forest gradient and had 27.6 and 33.3%
nesting habitat, respectively. Peach was the most forested site due to its location on the
glacial boundary and also had the lowest proportion of row crops and the second lowest
proportion of nesting habitat (28.2%). High proportions of row crops (range = 38.5–
72.1%) and large field sizes (range = 7.6–12.6 ha) were considered indicators of reduced
habitat connectivity at study sites; these areas were considered fragmented.

26
Row crop fields were predominantly in non-till soybeans, corn, and winter wheat.
Forest composition varied with topography. Dry upland ridges supported communities
dominated by shagbark (Carya ovata) and pignut hickory (C. glabra) and white (Quercus
alba) and red oak (Q. rubra). Lower elevations and depressional areas were dominated
by black walnut (Juglans nigra), green ash (Fraxinus pennsylvanica), American elm
(Ulmus americana), and occasionally pin oak (Quercus palustris). Early successional
land cover types in our study sites included fields enrolled in the Conservation Reserve
Program (CRP), idle fields, fencerows, agricultural drainage ditches, and roadsides.
Early successional grass fields were dominated by cool season grasses such as fescue
(Festuca spp.) and forbs such as goldenrod (Solidago spp.) and Queen Anne’s lace
(Daucus carota). Small proportions of the study sites were in warm season CRP fields,
primarily planted with Indiangrass (Sorghastrum nutans), big bluestem (Andropogon
gerardii), switchgrass (Panicum virgatum), and partridge pea (Chamaecrista fasciculata).
Early successional woody habitats included fencerows, ditches (< 50 m in width), and
patches of advanced successional growth. Early successional vegetation included woody
species such as blackberry (Rubus fruticosus), black raspberry (R. occidentalis), trumpet
creeper (Campsis radicans), poison ivy (Toxicodendron radicans), and Japanese
honeysuckle (Lonicera japonica).
The long-term mean temperature for this region was 11.1 °C and the mean
monthly temperature during the study period (Apr-Sep 2010-2011) was 20.2 °C (range =
12.2 – 26.6°C; NCDC 2011). The long-term mean annual precipitation was 1,102 mm
and the mean monthly precipitation during the study period was 277 mm (range = 64 –
27
1775 mm; NCDC 2011). The mean departure from normal during the study period was
97 mm (range = -64 – 528 mm; NCDC 2011). The 2010 breeding season began with the
fourth driest April in Ohio history followed by the third wettest May and slightly below
average rainfall through September (NCDC 2011). This area also experienced
unprecedented rainfall in spring 2011 with amounts in April that were 285% of normal
and higher than the previous total rainfall record set in 1882 (NCDC 2011).
METHODS
Data collection
Bobwhites were captured and outfitted with radio-transmitters between fall 2009
and summer 2011. Individuals were captured using baited funnel traps and targeted mist
netting (Wiley et al. 2012). Captured individuals were weighed, classified to age and sex
(Rosene 1969), and banded with uniquely-numbered aluminum leg bands (size 3 or 3B)
that included a phone number for band recoveries. Most individuals were also fitted with
an Advanced Telemetry Systems (ATS, Isanti, MN, USA) radio-transmitter with an 8-hr
mortality sensor. Individuals were radiomarked during the 2010 field season with bib-
mounted or necklace-style transmitters; zip-tie style necklace transmitters were used on
individuals captured or recaptured after 1 September 2010. The switch to zip-tie attached
transmitters significantly improved retention of radio-transmitters during the 2011
breeding season and seemed to be the best compromise between transmitter weight and
attachment durability. Radio-transmitters (6.6 g) were placed only on individuals
weighing > 150 g. All trapping, handling, and marking procedures were consistent with
28
guidelines approved by the Ohio State University Institutional Animal Care and Use
Committee (# 2007A0228).
Individuals were tracked daily throughout spring dispersal (Apr-May) by homing
to within 15-20 m with ATS or Telonics (Mesa, AZ, USA) receivers and a hand-held 3-
element yagi antenna. A truck-mounted, null-peak system was used for triangulations
when property access was restricted or to avoid disturbing spring wild turkey (Meleagris
gallopavo) hunters. Global Positioning System (GPS) coordinates were recorded with
handheld GPS units (Garmin, Olathe, KS, USA) in the field and later loaded into ArcMap
9.3 (ESRI, Redlands, CA, USA).
The dispersal period was defined by non-affiliation with coveys, long directional
daily movements, and observed breeding activity. It concluded with earliest nest
initiation dates and a cutoff date of 10 May was used for individuals whose dispersal
termination was uncertain. Individuals were assumed to have initiated breeding activity,
unless movement patterns or nesting indicated otherwise, even if a nest for that individual
had not yet been found. Individuals that died after 1 April while still associated with
their winter covey were excluded from analyses. Individuals captured after 1 April while
not associated with a covey were excluded from distance analyses because they may have
already dispersed. Individuals that lost their transmitters, died during dispersal, or with
whom radio contact was lost were excluded from distance analysis because they did not
have equal opportunity to complete movement during the period. We searched for radio-
marked individuals in the area surrounding their last known location for at least 2 hrs
with a truck-mounted, whip-antenna and periodic scans with a truck-mounted, null-peak

29
system when radio contact was lost. Attempts to relocate individuals were discontinued
after failing to find birds for 3 consecutive days. Missing individuals could have been
lost due to transmitter failure or because they dispersed outside our search area. Radio
contact was most likely lost due to transmitter failures rather than an inability to relocate
dispersing individuals.
Analysis
Locate III (Nams 2006) was used to calculate location points from triangulations.
Telemetry locations were analyzed using Hawthe’s Tools in ArcMap 9.3 (Beyer et al.
2010). Dispersal distances were measured by the net Euclidean distance moved between
start and end dates of spring dispersal. A modified method for classifying dispersal
behavior was used as described by Townsend et al. (2003) and used in other bobwhite
dispersal studies (Fies et al. 2002). Dispersers were defined as birds that moved > 2x the
diameter of their mean winter home-range size. Non-dispersing bobwhites traveled < 1
winter home-range diameter and intermediate movements (1-2 winter home-range
diameters) were classified as a home range shift. The Townsend et al. (2003) method
uses a somewhat arbitrary winter home range diameter of 1 km. Spring dispersal was
classified by comparing dispersal movements to a population-specific, mean home range
for radio-marked coveys at the study sites during October-March 2010 and 2011 (26.1 ha,
0.58-km diameter; Janke and Gates 2012).
There were 104 radio-marked bobwhites during the 2010 and 2011 breeding
seasons. Six bobwhites were not included in any analyses because they were associated
30
with coveys until death or at last known location. Twenty-four individuals were excluded
from dispersal analyses because they were either marked after covey break-up, died
during the dispersal period, or were not relocated during the dispersal period. Dates of
covey break-up and dispersal distances were compared between years with analysis of
variance and linear regression using program R (R Development Core Team 2012).
Influences of sex, age, and dispersal distances of individuals on survival during spring
dispersal were evaluated with known-fates analysis in Program MARK (White and
Garrott 1999).
Sixty-three individuals used in our analyses were members of 29 individual
coveys. Linear mixed models were used to examine the influence of design and habitat
covariates on spring dispersal distances. All models were specified a priori and included
a constant intercept term and covey as a random effect. The distribution of dispersal
distances was heavily right-skewed so the dependent variable was logn-transformed
before analysis. Information theoretic methods (Burnham and Anderson 2002) were used
to evaluate the models. Estimated means and confidence intervals were back-
transformed (antilog) for graphical presentation of results.
The first candidate model set investigated design variables and included models
effects of year, age, and sex (with 2-way interactions) on dispersal distance (Table 2.1).
Covariates from the top-ranked model in the first step (Table 2.1) were added to evaluate
a second set of 16 candidate models (Table 2.2) that included the null model and
combinations and interactions of habitat covariates. Effects (singly and in combination)
of sex, age, study site, early successional woody and grassland habitat composition of
31
covey home ranges were tested on dispersal distance with a minimum number of
candidate models. It was hypothesized that early successional woody habitat associated
with winter home ranges would facilitate (i.e., increase) dispersal while higher
proportions of early successional herbaceous habitats would inhibit movements by
providing nesting habitat near where birds wintered.
The package lme4 in Program R (R Development Core Team 2012) was used to
fit candidate models. Support for each model was compared based on Akaike
Information Criterion adjusted for small sample sizes (AICc; Burnham and Anderson
2002). Models with ΔAICc ≤ 2.0 were considered to have equivalent support (Burnham
and Anderson 2002). The difference in AICc values between the best model and each of
the other models (ΔAICc) and Akaike weights (wi) were used to identify the relative
support for each candidate model.
RESULTS
Results were based on 63 bobwhites (females = 30, males = 36) in 29 coveys
during the 2010 and 2011 breeding seasons. Observed dispersal periods for individual
birds occurred between 4 April and 26 May and lasted a mean of 21.0 day ± 1.94 SE
(range = 7-35 days). There were no differences between years for date of covey break-up
(F = 0.23, P = 0.634) or length of the dispersal period (F = 2.435, P = 0.124), so radio-
marked individuals were pooled across years for survival analyses. There was no
evidence of differences in survival associated with dispersal distance. Survival models
for age, sex, age*sex, and dispersal distance all had ∆AICc > 2.
32
Mean dispersal for all individuals was 1.55 km (Table 2.4). We classified 28
birds (42.4%) as non-dispersers, 15 (22.7%) as having a range shift, and 23 (34.8%) as
dispersers. Non-dispersers averaged net movements of 0.31 km, range shifts averaged
0.78 km, and dispersal distances averaged 3.56 km. The 2 highest-ranked candidate
models for design variables were within 2 ∆AICc units of the null model (Table 2.2),
offering no statistical support for differences in dispersal among age, sex, classes, or
years. However, dispersal differed substantially among age-sex classes (Figure 2.1) with
significant regression coefficients for age (P = 0.038) but not sex (P = 0.073). Adult
females dispersed the shortest distanced, followed in increasing order by adult males,
juvenile females, and juvenile males (Table 2.5, Figure 2.1).
Top models in the final candidate model set were within 2 ∆AICc units of the null
model (Table 2.3) and contained significant variable coefficients. The highest ranked
model included covariates for sex and age and was the only one to rank above the null.
The third ranked model contained variables for study site and the proportion of early
successional woody habitat in covey home ranges (HRESW). The coefficient for
HRESW was highly significant (P = 0.006) and indicated dispersal distance declined
with increasing amounts of early successional woody habitat in covey home ranges
(Figures 2.2 and 2.3). Mean dispersal distance was greater on the Peach site (P = 0.073)
and did not differ among the other 3 sites (Figure 2.4). The Thurner site had the lowest
proportion of dispersing individuals (27.3%; Table 2.6) and the lowest mean dispersal
distances (0.58 km; Figure 2.4). The Thurner and Wildcat sites had intermediate values
but were more similar to the Peach site which had the highest proportion of dispersing

33
individuals (44.4%) and the highest mean dispersal distances (2.84 km). Proportion of
grass within covey home ranges had no relationship to dispersal distance (P > 0.91; Table
2.3).
The longest spring dispersal distance documented was recorded for a radio-
marked bobwhite during this study. One juvenile male made an initial spring dispersal
movement of 3.8 km that ended on 10 May 2010 after which he was observed to be
paired with a female. He then made a second movement of 13.9 km, an apparent second
breeding season dispersal during 19-24 May 2010 after which he settled and was heard
whistling. This bird traveled a net distance of 18.9 km from initial spring location before
his transmitter failed on 7 June 2010.
DISCUSSION
Dispersal can rescue declining populations or re-establish them after extinction
events (Howard 1960) but dispersing individuals must often traverse unfamiliar areas
where their survival is at risk (Bélichon et al. 1996). Dispersal may be particularly
important for states like Ohio that are on the northern periphery of the bobwhite range
where populations are in decline and extirpation of local populations is common
(Williams et al. 2003). Early bobwhite research reported individuals were relatively
sedentary (Lehmann 1946, Murphy and Baskett 1952, Lewis 1954). These studies
generally used capture-mark-recapture methods that were limited by study site
boundaries, low recovery of marked individuals, and anecdotal or opportunistic reporting
34
of longer dispersal movements. Studies that use radio-telemetry provide more complete
evaluations of spring movements and dispersal (White and Garrott 1999).
Our results provide additional evidence that bobwhites are highly mobile and
regularly travel long distances during spring (Fies et al. 2002, Townsend et al. 2003,
Cook et al. 2006). Radio-marked individuals traveled farther between nonbreeding and
breeding season ranges compared to those in other bobwhite populations (Fies et al.
2002, Townsend et al. 2003, Cook et al. 2006).
Proportions of individuals classified as range shifts and dispersers during our
study (Table 2.4) were comparable to other bobwhite populations (Fies et al. 2002,
Townsend et al. 2003, Cook et al. 2006). Our criteria were based on winter home range
diameters observed in our population (Janke and Gates 2012); only Cook et al. (2006)
used a biologically-based dispersal criterion. Only 19% (not 35%) of individuals in our
study population would have been classified as dispersers if we used the 1-km cutoff
proposed by Townsend et al. (2003). Individuals in our study classified as dispersers after
Townsend et al. (2003) dispersed further on average (5.23 km) than those in other
bobwhite populations. Bobwhite breeding habitats on our study areas were often
separated from winter ranges by croplands or other areas lacking suitable nesting habitat.
Thus, it may have been necessary for individuals in our study to move long distances to
find mates or suitable nesting habitat (Fies et al. 2002).
Studies have found that both translocated and resident bobwhites both have strong
site fidelity and limited dispersal movements in areas receiving active bobwhite

35
management (Liu et al. 2002, Terhune et al. 2006, Terhune et al. 2010). The proportions
of dispersing individuals and dispersal distances during these studies (Liu et al. 2002,
Terhune et al. 2006, Terhune et al. 2010) are considerably lower than those from other
bobwhite dispersal studies (this study, Fies et al. 2002, Townsend et al. 2003, Cook et al.
2006). Translocation management targets areas that cannot be reached by natural
dispersal, have low population densities, and typically occur in areas with managed
habitat. Habitat management seems to have dramatic influences on dispersal behavior
and underscores the importance of evaluating bobwhite populations in the array of
landscapes found in its range, especially those that receive limited management.
Average distances and proportions of range shifts and dispersals (Table 2.4) may
have been higher without above average spring rainfall during our study, especially
during 2011 (NCDC 2011). April 2011 had the highest amount of precipitation in the
past 129 years and May 2011 was the sixth wettest in Ohio history. High rainfall and
flooding during spring can negatively affect bobwhite survival (Applegate et al. 2002) or
delay covey break-up, thereby diminishing length of the dispersal period (Roseberry and
Klimstra 1984). There was no evidence of differences between years for date of covey
break-up or dispersal distances, but the comparison may be constrained by high rainfall
during May 2010 which may have limited dispersal.
Age and sex of dispersing individuals were the best predictors of spring dispersal
distances for bobwhite in Ohio (Table 2.3) and juveniles and males traveled furthest
(Figure 2.1). Juvenile-biased dispersal is common for avian species and likely is an
adaptation to avoid inbreeding with related individuals (Howard 1960). The juvenile-
36
biased dispersal during our study supports results from other bobwhite dispersal studies
(Urban 1972, Smith et al. 1982, Fies et al. 2002, Townsend et al. 2003). Density-
dependence within breeding habitats may also bias juvenile dispersal, particularly if
dominant adults keep juveniles from preferred breeding areas (Murphy and Baskett 1952,
Howard 1960). Female-biased dispersal is the pattern displayed by most avian species,
but male-biased dispersal is occasionally reported especially for species with polygamous
breeding systems (Greenwood and Harvey 1982, Curtis et al. 1993). Other bobwhite
studies have documented male-biased dispersal (Hood 1955, Urban 1972, Terhune et al.
2010) while others documented female-biased dispersal (Fies et al. 2002) or no sex-
specific differences (Smith et al. 1982, Townsend et al. 2003, Cook et al. 2006, Terhune
et al. 2010). Our results for dispersal distances support the conclusions of Clarke et al.
(1997) that dispersal biases tend to be facultative and should not be assumed to be an
unvarying species characteristic.
We hypothesized that early successional woody habitats with generally linear
arrangements (i.e., fencerows, ditches, riparian) would facilitate dispersal by providing
travel corridors. Cook et al. (2006) reported early successional habitats had negligible
effect on dispersal probabilities for radio-marked bobwhites in Georgia but both early
successional herbaceous and woody vegetation were included in this category. We
separated early successional herbaceous and woody habitat types because we suspected
they may differentially affect dispersal. We found that dispersal distances declined with
amounts of early succession woody habitat in covey home ranges (Figures 2.2 and 2.3).

37
Woody vegetation provides year-round benefits to bobwhites by providing cover
from predators and thermal extremes. Vegetation structure of woody habitat can also
create preferred foraging conditions by shading sod-forming grasses and increasing
patches of bare ground (Collins et al. 2009). Woody habitats were preferred by coveys at
our study sites during the nonbreeding season (Janke and Gates 2012) and this may have
continued through during spring despite the need for bobwhites to find suitable nesting
areas provided by early succession herbaceous habitats. Nest sites (i.e., habitat patches
and nesting substrates) may be sufficient in our study to not limit reproduction as they do
for bobwhite populations in arid regions (Rader et al. 2011).
MANAGEMENT IMPLICATIONS
Bobwhites in Ohio do not appear to be dispersal-limited yet they have failed to
expand their range into historically-occupied areas. Gates et al. (2012) found that local
populations of bobwhites in southwest Ohio were not producing sufficient individuals to
rescue local populations or to recolonize historically-populated areas, despite their
dispersal capabilities. Dispersal rates were also too low to compensate for high mortality
rates in these areas (Gates et al. 2012).
Trap and transplant programs in Ohio should focus on providing quality bobwhite
habitat within the dispersal range of extant populations. Target areas should contain early
successional woody habitats and be in proximity to extant populations to connect locally
isolated subpopulations and, if successful, supplement extant populations. We
recommend areas within 0.73-1.41 km (50th
to 75th
percentiles of dispersal distances) of

38
existing populations in southwest Ohio be targeted to avoid creating isolated
subpopulations. Habitat management will likely be necessary to create conditions that
support sufficiently high survival rates to allow populations to produce surplus
individuals.
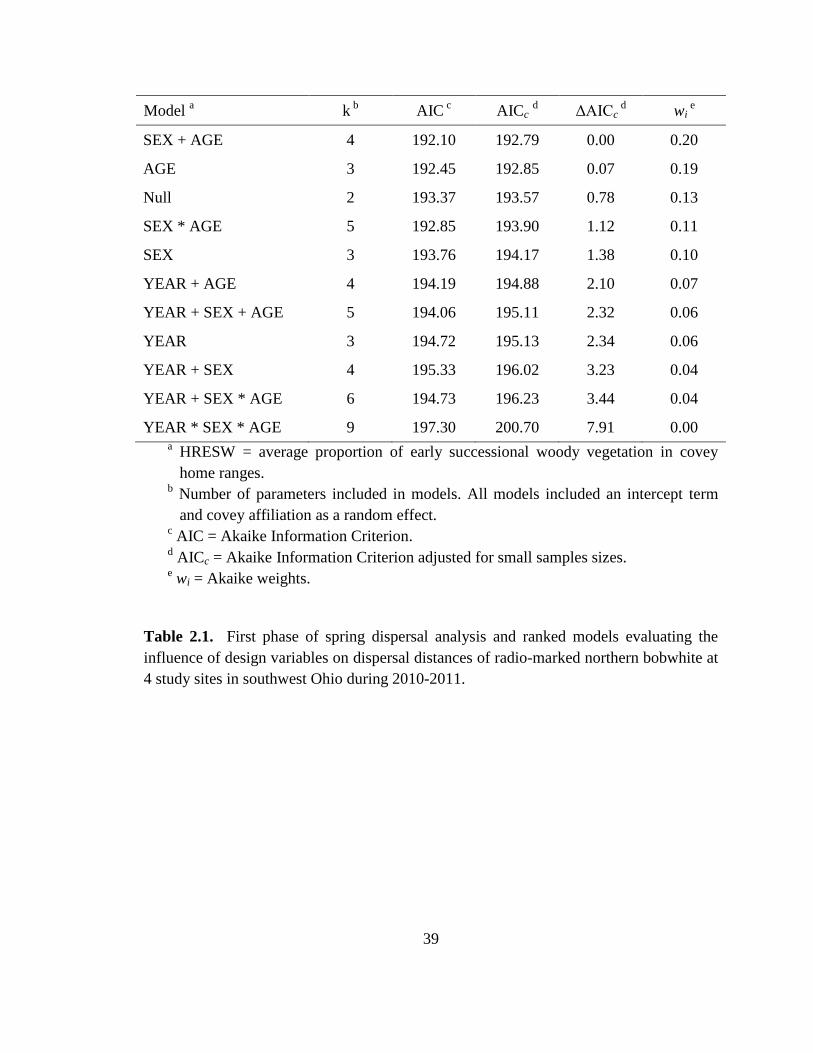
39
Model a
k b
AIC c
AICc d
ΔAICc d
wi e
SEX + AGE 4 192.10 192.79 0.00 0.20
AGE 3 192.45 192.85 0.07 0.19
Null 2 193.37 193.57 0.78 0.13
SEX * AGE 5 192.85 193.90 1.12 0.11
SEX 3 193.76 194.17 1.38 0.10
YEAR + AGE 4 194.19 194.88 2.10 0.07
YEAR + SEX + AGE 5 194.06 195.11 2.32 0.06
YEAR 3 194.72 195.13 2.34 0.06
YEAR + SEX 4 195.33 196.02 3.23 0.04
YEAR + SEX * AGE 6 194.73 196.23 3.44 0.04
YEAR * SEX * AGE 9 197.30 200.70 7.91 0.00 a HRESW = average proportion of early successional woody vegetation in covey
home ranges.
b Number of parameters included in models. All models included an intercept term
and covey affiliation as a random effect. c AIC = Akaike Information Criterion.
d AICc = Akaike Information Criterion adjusted for small samples sizes.
e wi = Akaike weights.
Table 2.1. First phase of spring dispersal analysis and ranked models evaluating the
influence of design variables on dispersal distances of radio-marked northern bobwhite at
4 study sites in southwest Ohio during 2010-2011.
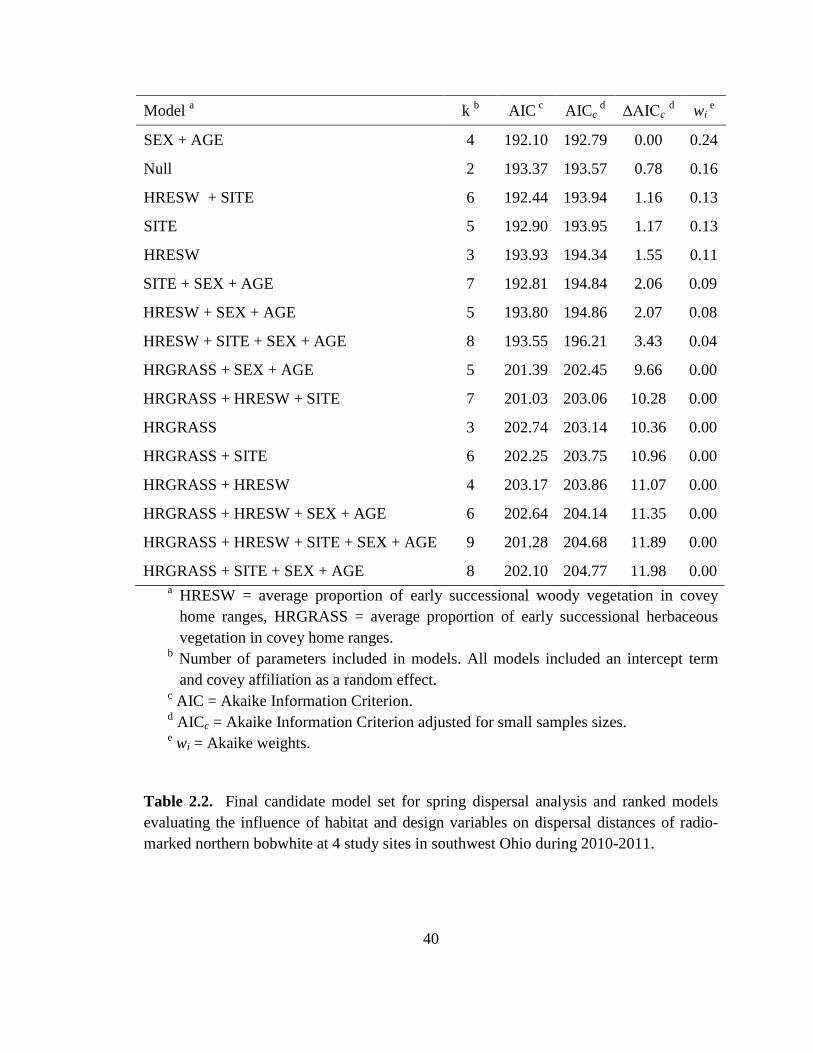
40
Model a
k b
AIC c
AICc d
ΔAICc d
wi e
SEX + AGE 4 192.10 192.79 0.00 0.24
Null 2 193.37 193.57 0.78 0.16
HRESW + SITE 6 192.44 193.94 1.16 0.13
SITE 5 192.90 193.95 1.17 0.13
HRESW
3 193.93 194.34 1.55 0.11
SITE + SEX + AGE 7 192.81 194.84 2.06 0.09
HRESW + SEX + AGE 5 193.80 194.86 2.07 0.08
HRESW + SITE + SEX + AGE 8 193.55 196.21 3.43 0.04
HRGRASS + SEX + AGE 5 201.39 202.45 9.66 0.00
HRGRASS + HRESW + SITE 7 201.03 203.06 10.28 0.00
HRGRASS 3 202.74 203.14 10.36 0.00
HRGRASS + SITE 6 202.25 203.75 10.96 0.00
HRGRASS + HRESW 4 203.17 203.86 11.07 0.00
HRGRASS + HRESW + SEX + AGE 6 202.64 204.14 11.35 0.00
HRGRASS + HRESW + SITE + SEX + AGE 9 201.28 204.68 11.89 0.00
HRGRASS + SITE + SEX + AGE 8 202.10 204.77 11.98 0.00 a HRESW = average proportion of early successional woody vegetation in covey
home ranges, HRGRASS = average proportion of early successional herbaceous
vegetation in covey home ranges.
b Number of parameters included in models. All models included an intercept term
and covey affiliation as a random effect. c AIC = Akaike Information Criterion.
d AICc = Akaike Information Criterion adjusted for small samples sizes.
e wi = Akaike weights.
Table 2.2. Final candidate model set for spring dispersal analysis and ranked models
evaluating the influence of habitat and design variables on dispersal distances of radio-
marked northern bobwhite at 4 study sites in southwest Ohio during 2010-2011.
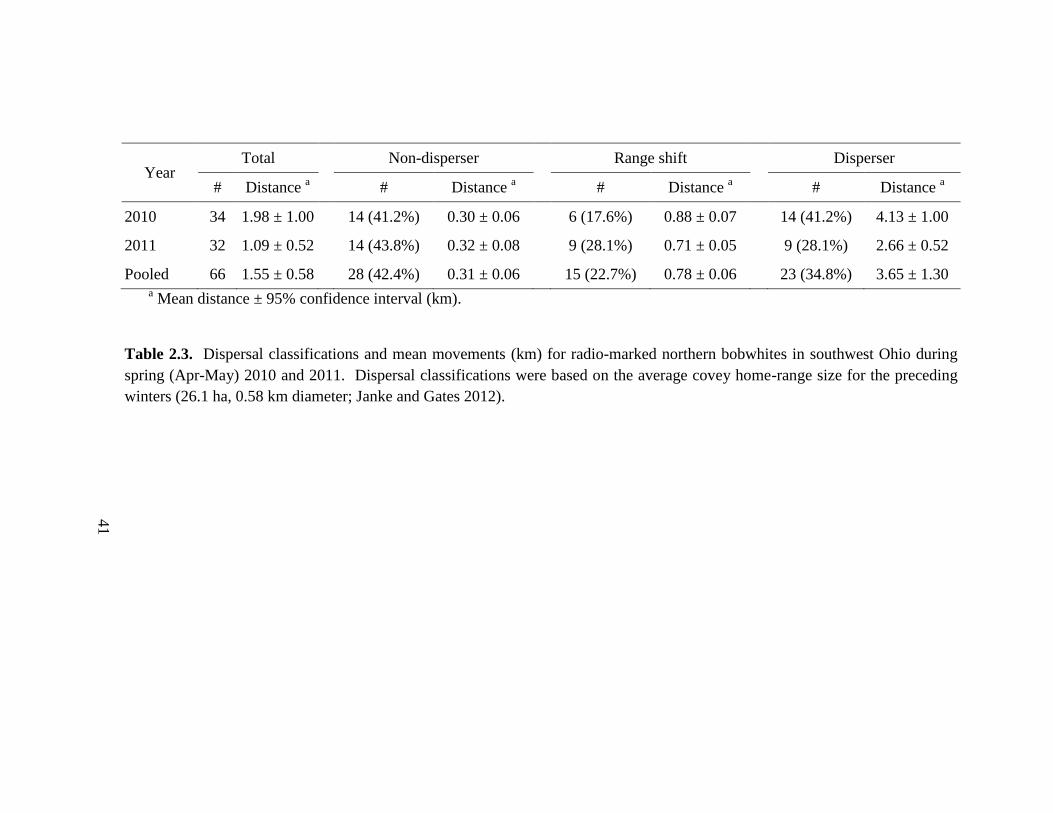
41
Year Total
Non-disperser
Range shift
Disperser
# Distance a
# Distance
a
# Distance
a
# Distance
a
2010 34 1.98 ± 1.00
14 (41.2%) 0.30 ± 0.06
6 (17.6%) 0.88 ± 0.07
14 (41.2%) 4.13 ± 1.00
2011 32 1.09 ± 0.52
14 (43.8%) 0.32 ± 0.08
9 (28.1%) 0.71 ± 0.05
9 (28.1%) 2.66 ± 0.52
Pooled 66 1.55 ± 0.58
28 (42.4%) 0.31 ± 0.06
15 (22.7%) 0.78 ± 0.06
23 (34.8%) 3.65 ± 1.30 a Mean distance ± 95% confidence interval (km).
Table 2.3. Dispersal classifications and mean movements (km) for radio-marked northern bobwhites in southwest Ohio during
spring (Apr-May) 2010 and 2011. Dispersal classifications were based on the average covey home-range size for the preceding
winters (26.1 ha, 0.58 km diameter; Janke and Gates 2012).

42
Dispersal classification (%)
a Distance (km)
n ND RS D Mean Range
Female Juvenile 21 23.8 38.1 38.1 1.82 ± 1.17 0.03–11.49
Adult 9 100.0 0.0 0.0 0.29 ± 0.09 0.07–0.42
Pooled 30 46.7 26.7 26.7 1.36 ± 0.85 0.03–11.49
Male Juvenile 20 25.0 30.0 45.0 2.21 ± 1.29 0.06–11.09
Adult 16 56.3 6.30 37.5 1.08 ± 0.72 0.18–6.13
Pooled 36 38.9 19.4 41.7 1.71 ± 0.80 0.06–11.09
Pooled Juvenile 41 24.4 34.1 41.5 2.01 ± 0.86 0.03–11.49
Adult 25 52.0 4.00 44.0 0.79 ± 0.48 0.07–6.13
Pooled 66 34.8 22.7 42.4 1.55 ± 0.58 0.03–11.49 a ND = non-dispersal; RS = range shift; D = dispersal.
Table 2.4. Mean dispersal distances ± 95% confidence intervals (km) and dispersal
classification percentages for radio-marked northern bobwhites in southwest Ohio during
spring 2010 and 2011.
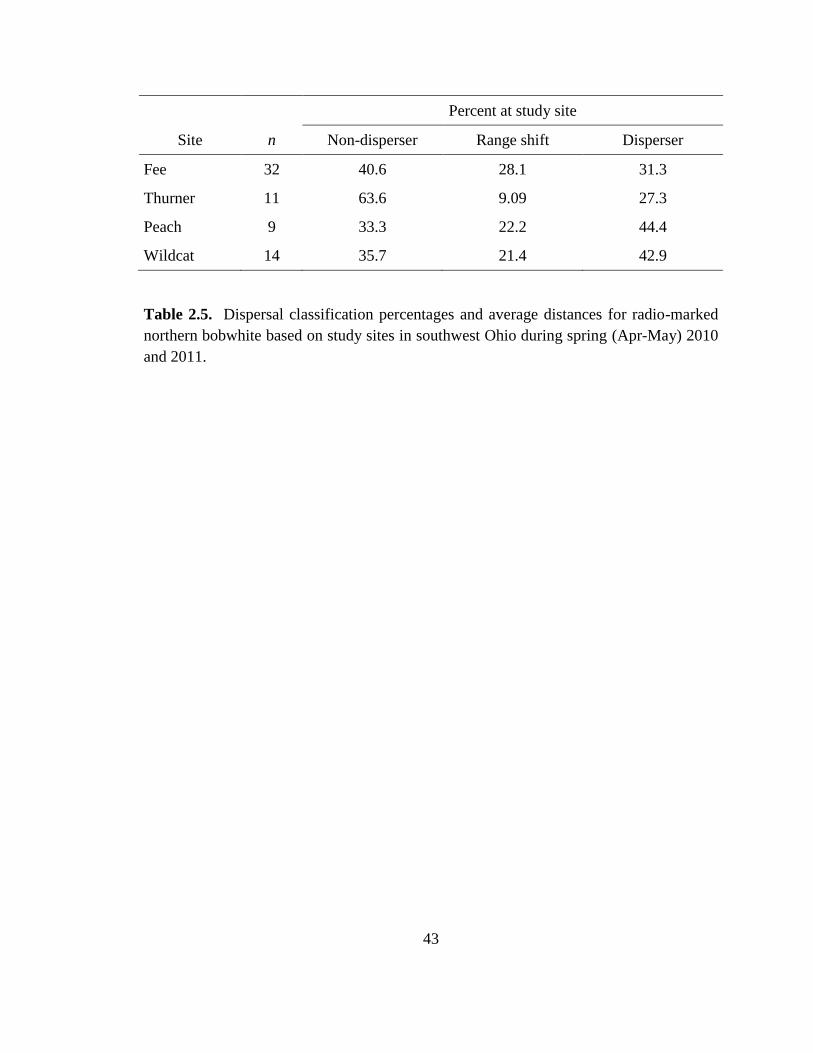
43
Percent at study site
Site n Non-disperser Range shift Disperser
Fee 32 40.6 28.1 31.3
Thurner 11 63.6 9.09 27.3
Peach 9 33.3 22.2 44.4
Wildcat 14 35.7 21.4 42.9
Table 2.5. Dispersal classification percentages and average distances for radio-marked
northern bobwhite based on study sites in southwest Ohio during spring (Apr-May) 2010
and 2011.
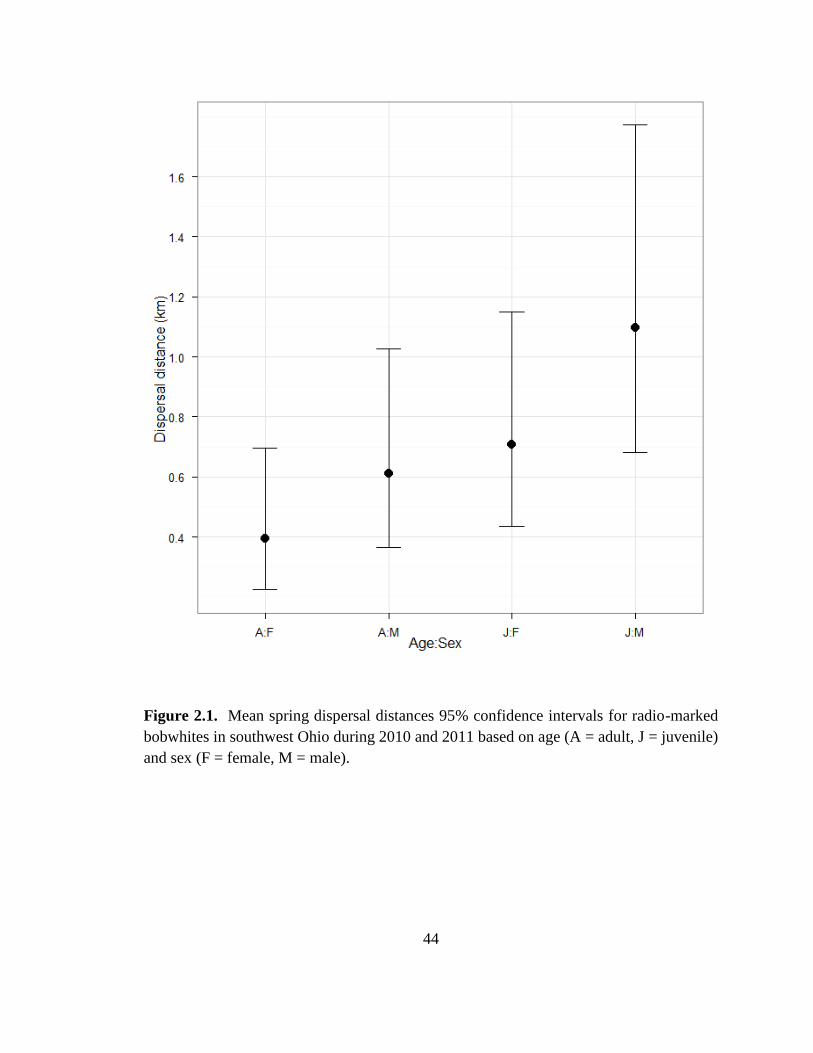
44
Figure 2.1. Mean spring dispersal distances 95% confidence intervals for radio-marked
bobwhites in southwest Ohio during 2010 and 2011 based on age (A = adult, J = juvenile)
and sex (F = female, M = male).
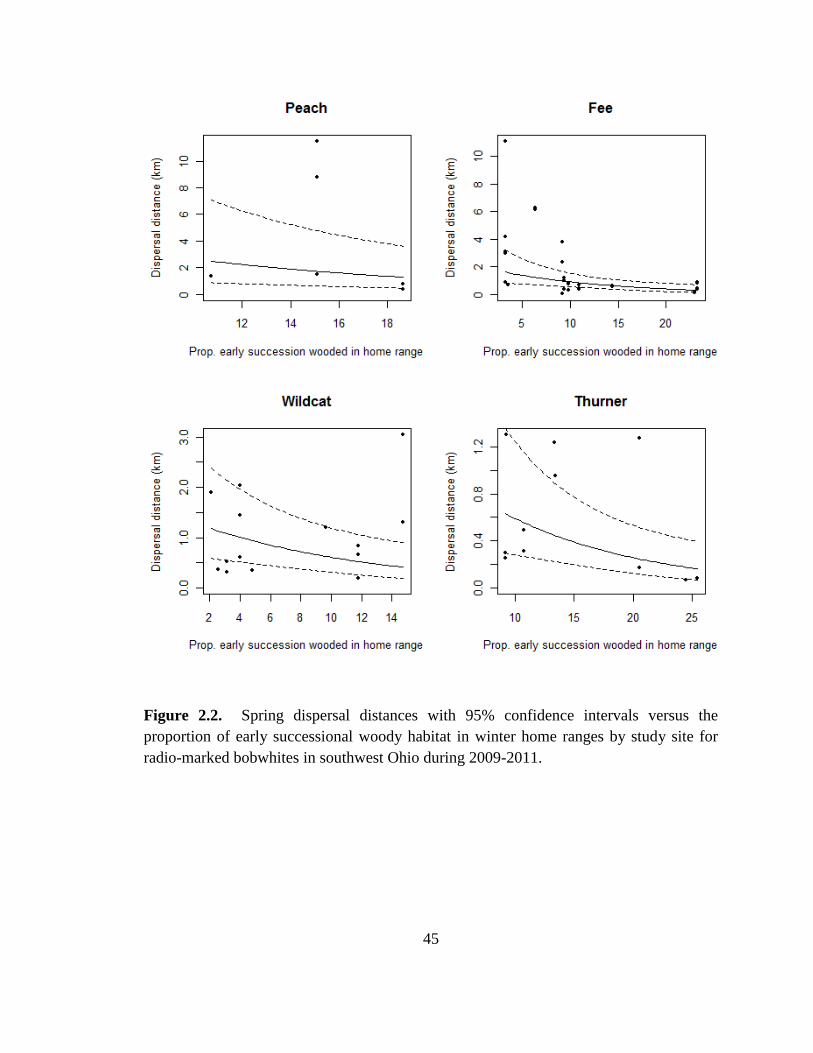
45
Figure 2.2. Spring dispersal distances with 95% confidence intervals versus the
proportion of early successional woody habitat in winter home ranges by study site for
radio-marked bobwhites in southwest Ohio during 2009-2011.
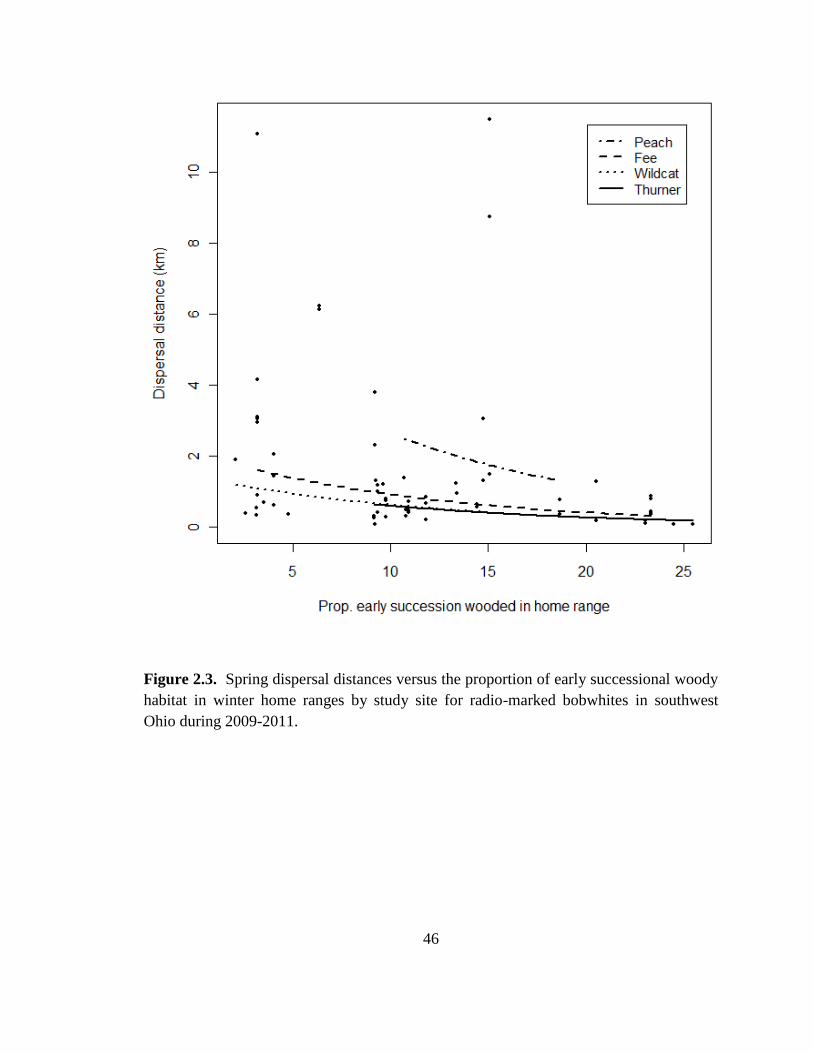
46
Figure 2.3. Spring dispersal distances versus the proportion of early successional woody
habitat in winter home ranges by study site for radio-marked bobwhites in southwest
Ohio during 2009-2011.
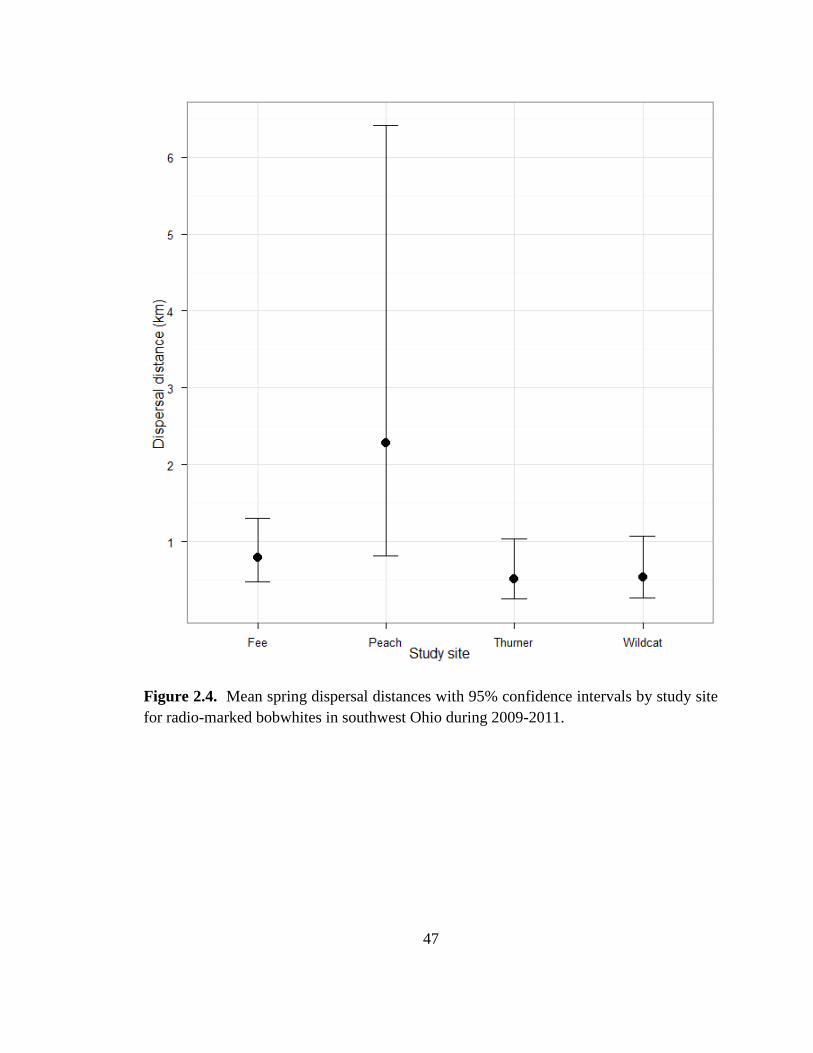
47
Figure 2.4. Mean spring dispersal distances with 95% confidence intervals by study site
for radio-marked bobwhites in southwest Ohio during 2009-2011.
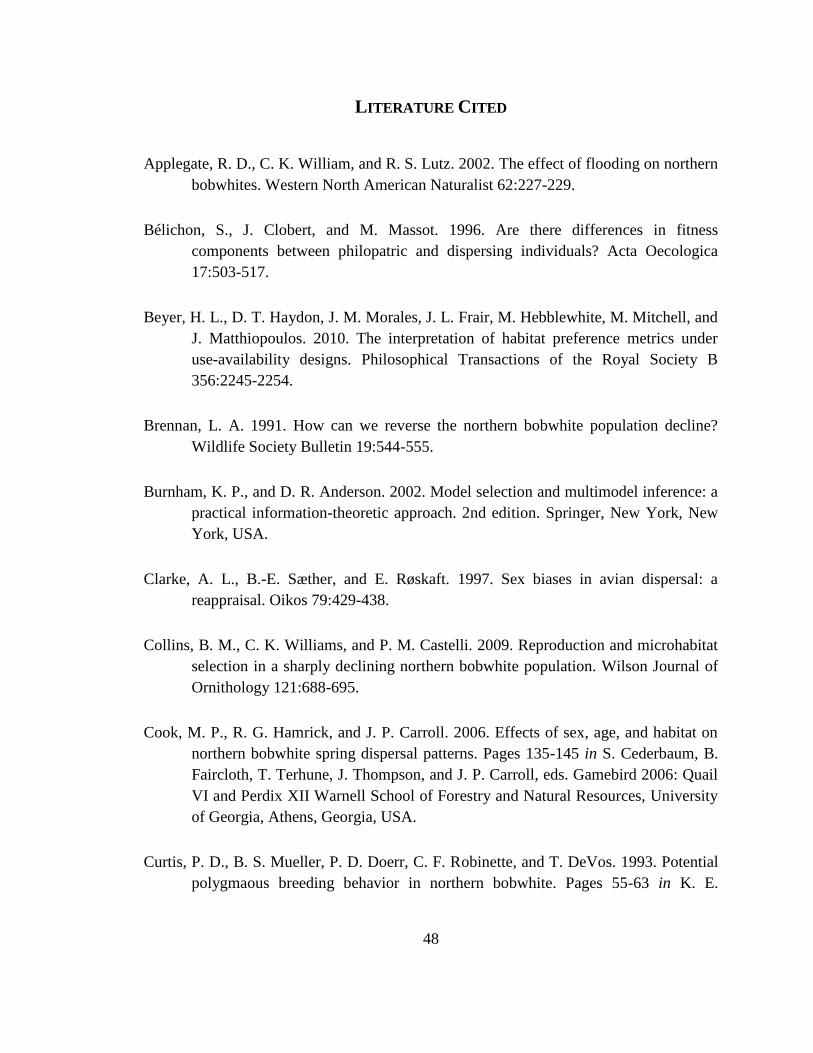
48
LITERATURE CITED
Applegate, R. D., C. K. William, and R. S. Lutz. 2002. The effect of flooding on northern
bobwhites. Western North American Naturalist 62:227-229.
Bélichon, S., J. Clobert, and M. Massot. 1996. Are there differences in fitness
components between philopatric and dispersing individuals? Acta Oecologica
17:503-517.
Beyer, H. L., D. T. Haydon, J. M. Morales, J. L. Frair, M. Hebblewhite, M. Mitchell, and
J. Matthiopoulos. 2010. The interpretation of habitat preference metrics under
use-availability designs. Philosophical Transactions of the Royal Society B
356:2245-2254.
Brennan, L. A. 1991. How can we reverse the northern bobwhite population decline?
Wildlife Society Bulletin 19:544-555.
Burnham, K. P., and D. R. Anderson. 2002. Model selection and multimodel inference: a
practical information-theoretic approach. 2nd edition. Springer, New York, New
York, USA.
Clarke, A. L., B.-E. Sæther, and E. Røskaft. 1997. Sex biases in avian dispersal: a
reappraisal. Oikos 79:429-438.
Collins, B. M., C. K. Williams, and P. M. Castelli. 2009. Reproduction and microhabitat
selection in a sharply declining northern bobwhite population. Wilson Journal of
Ornithology 121:688-695.
Cook, M. P., R. G. Hamrick, and J. P. Carroll. 2006. Effects of sex, age, and habitat on
northern bobwhite spring dispersal patterns. Pages 135-145 in S. Cederbaum, B.
Faircloth, T. Terhune, J. Thompson, and J. P. Carroll, eds. Gamebird 2006: Quail
VI and Perdix XII Warnell School of Forestry and Natural Resources, University
of Georgia, Athens, Georgia, USA.
Curtis, P. D., B. S. Mueller, P. D. Doerr, C. F. Robinette, and T. DeVos. 1993. Potential
polygmaous breeding behavior in northern bobwhite. Pages 55-63 in K. E.

49
Church, and T. V. Dailey, eds. Quail III: National Quail Symposium. Kansas
Department of Wildlife and Parks, Pratt, Kansas, USA.
Danchin, E., and E. Cam. 2002. Can non-breeding be a cost of breeding dispersal?
Behavioral Ecology and Sociobiology 51:153-163.
Fies, M. L., K. M. Puckett, and B. Larson-Brogdon. 2002. Breeding season movements
and dispersal of northern bobwhites in fragmented habitats of Virginia. Pages
173-179 in S. J. DeMaso, W. P. Kuvlesky, Jr., F. Hernández, and M. E. Berger,
eds. Quail V: The Fifth National Quail Symposium. Texas Parks and Wildlife
Department, Austin, Texas, USA.
Gates, R. J., A. K. Janke, M. R. Liberati, and M. J. Wiley. 2012. Population ecology and
habitat relationships of northern bobwhite in southwestern Ohio. Proceedings of
the National Quail Symposium 7: in press.
Greenwood, P., and P. Harvey. 1982. The natal and breeding dispersal of birds. Annual
Review of Ecology and Systematics 13:1-21.
Guthery, F. S. 2000. On bobwhites. 1st edition. Texas A&M University Press, College
Station, Texas, USA.
Guthery, F. S., M. J. Peterson, and R. R. George. 2000. Viability of northern bobwhite
populations. Journal of Wildlife Management 64:646-662.
Homer, C., C. Huang, C. Yang, B. Wylie, and M. Coan. 2004. Development of a 2001
national land-cover database for the United States. Photogrammetric Engineering
and Remote Sensing 70:829-840.
Hood, M. R. 1955. Mississippi quail investigation. Proceeding of the Annual Conferences
of the Southeastern Association of Fish and Wildlife Agencies 9:157-163.
Howard, W. 1960. Innate and environmental dispersal of individual vertebrates.
American Midland Naturalist 61:895-901.
Janke, A. K., and R. J. Gates. 2012. Home range and habitat selection of northern
bobwhite coveys in an agricultural landscape. Journal of Wildlife Management
online.
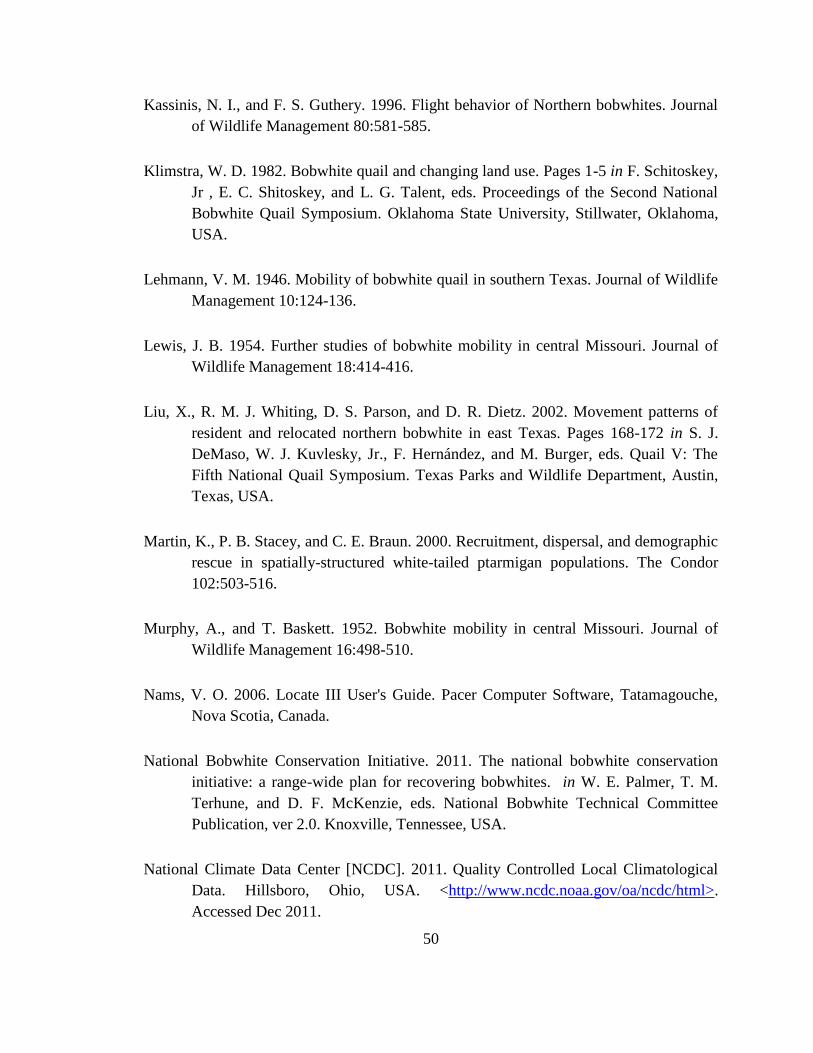
50
Kassinis, N. I., and F. S. Guthery. 1996. Flight behavior of Northern bobwhites. Journal
of Wildlife Management 80:581-585.
Klimstra, W. D. 1982. Bobwhite quail and changing land use. Pages 1-5 in F. Schitoskey,
Jr , E. C. Shitoskey, and L. G. Talent, eds. Proceedings of the Second National
Bobwhite Quail Symposium. Oklahoma State University, Stillwater, Oklahoma,
USA.
Lehmann, V. M. 1946. Mobility of bobwhite quail in southern Texas. Journal of Wildlife
Management 10:124-136.
Lewis, J. B. 1954. Further studies of bobwhite mobility in central Missouri. Journal of
Wildlife Management 18:414-416.
Liu, X., R. M. J. Whiting, D. S. Parson, and D. R. Dietz. 2002. Movement patterns of
resident and relocated northern bobwhite in east Texas. Pages 168-172 in S. J.
DeMaso, W. J. Kuvlesky, Jr., F. Hernández, and M. Burger, eds. Quail V: The
Fifth National Quail Symposium. Texas Parks and Wildlife Department, Austin,
Texas, USA.
Martin, K., P. B. Stacey, and C. E. Braun. 2000. Recruitment, dispersal, and demographic
rescue in spatially-structured white-tailed ptarmigan populations. The Condor
102:503-516.
Murphy, A., and T. Baskett. 1952. Bobwhite mobility in central Missouri. Journal of
Wildlife Management 16:498-510.
Nams, V. O. 2006. Locate III User's Guide. Pacer Computer Software, Tatamagouche,
Nova Scotia, Canada.
National Bobwhite Conservation Initiative. 2011. The national bobwhite conservation
initiative: a range-wide plan for recovering bobwhites. in W. E. Palmer, T. M.
Terhune, and D. F. McKenzie, eds. National Bobwhite Technical Committee
Publication, ver 2.0. Knoxville, Tennessee, USA.
National Climate Data Center [NCDC]. 2011. Quality Controlled Local Climatological
Data. Hillsboro, Ohio, USA. <http://www.ncdc.noaa.gov/oa/ncdc/html>.
Accessed Dec 2011.
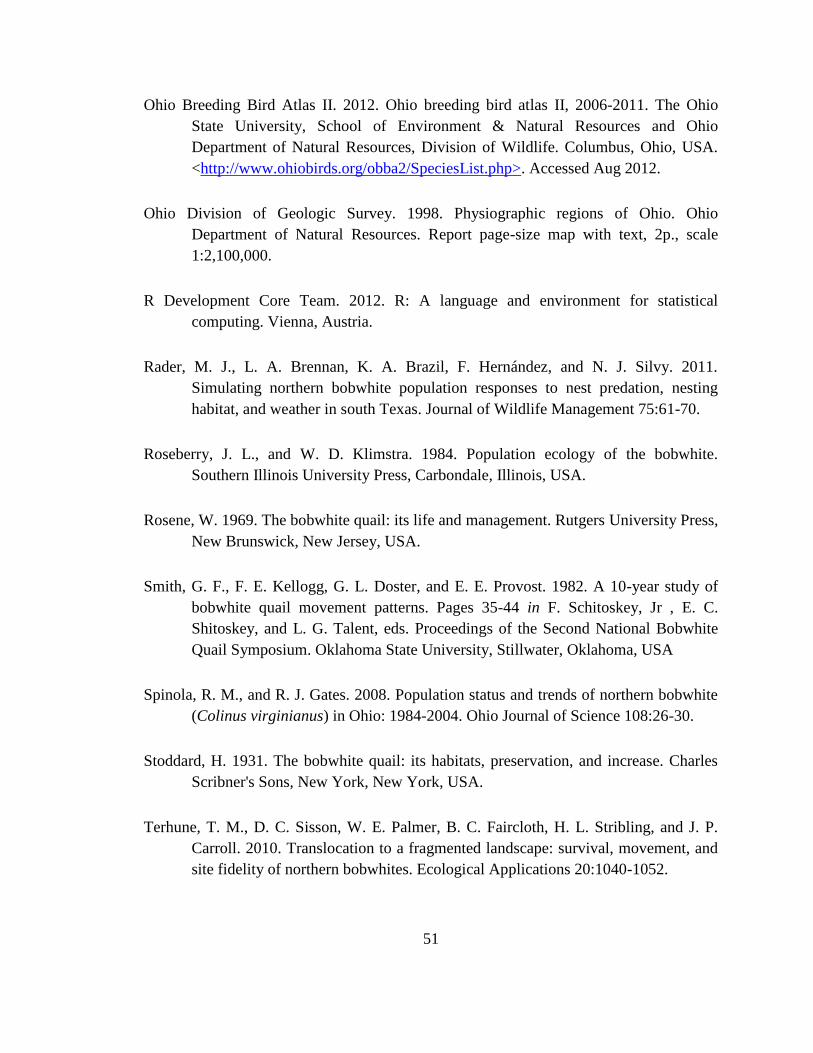
51
Ohio Breeding Bird Atlas II. 2012. Ohio breeding bird atlas II, 2006-2011. The Ohio
State University, School of Environment & Natural Resources and Ohio
Department of Natural Resources, Division of Wildlife. Columbus, Ohio, USA.
<http://www.ohiobirds.org/obba2/SpeciesList.php>. Accessed Aug 2012.
Ohio Division of Geologic Survey. 1998. Physiographic regions of Ohio. Ohio
Department of Natural Resources. Report page-size map with text, 2p., scale
1:2,100,000.
R Development Core Team. 2012. R: A language and environment for statistical
computing. Vienna, Austria.
Rader, M. J., L. A. Brennan, K. A. Brazil, F. Hernández, and N. J. Silvy. 2011.
Simulating northern bobwhite population responses to nest predation, nesting
habitat, and weather in south Texas. Journal of Wildlife Management 75:61-70.
Roseberry, J. L., and W. D. Klimstra. 1984. Population ecology of the bobwhite.
Southern Illinois University Press, Carbondale, Illinois, USA.
Rosene, W. 1969. The bobwhite quail: its life and management. Rutgers University Press,
New Brunswick, New Jersey, USA.
Smith, G. F., F. E. Kellogg, G. L. Doster, and E. E. Provost. 1982. A 10-year study of
bobwhite quail movement patterns. Pages 35-44 in F. Schitoskey, Jr , E. C.
Shitoskey, and L. G. Talent, eds. Proceedings of the Second National Bobwhite
Quail Symposium. Oklahoma State University, Stillwater, Oklahoma, USA
Spinola, R. M., and R. J. Gates. 2008. Population status and trends of northern bobwhite
(Colinus virginianus) in Ohio: 1984-2004. Ohio Journal of Science 108:26-30.
Stoddard, H. 1931. The bobwhite quail: its habitats, preservation, and increase. Charles
Scribner's Sons, New York, New York, USA.
Terhune, T. M., D. C. Sisson, W. E. Palmer, B. C. Faircloth, H. L. Stribling, and J. P.
Carroll. 2010. Translocation to a fragmented landscape: survival, movement, and
site fidelity of northern bobwhites. Ecological Applications 20:1040-1052.
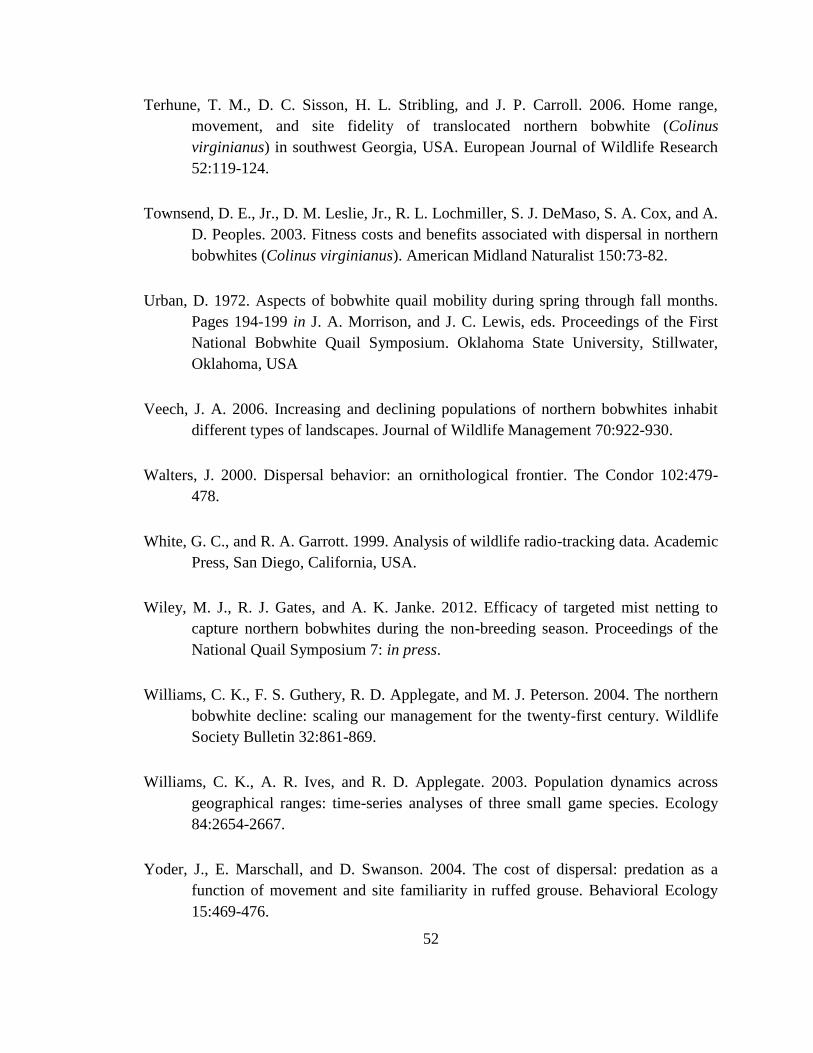
52
Terhune, T. M., D. C. Sisson, H. L. Stribling, and J. P. Carroll. 2006. Home range,
movement, and site fidelity of translocated northern bobwhite (Colinus
virginianus) in southwest Georgia, USA. European Journal of Wildlife Research
52:119-124.
Townsend, D. E., Jr., D. M. Leslie, Jr., R. L. Lochmiller, S. J. DeMaso, S. A. Cox, and A.
D. Peoples. 2003. Fitness costs and benefits associated with dispersal in northern
bobwhites (Colinus virginianus). American Midland Naturalist 150:73-82.
Urban, D. 1972. Aspects of bobwhite quail mobility during spring through fall months.
Pages 194-199 in J. A. Morrison, and J. C. Lewis, eds. Proceedings of the First
National Bobwhite Quail Symposium. Oklahoma State University, Stillwater,
Oklahoma, USA
Veech, J. A. 2006. Increasing and declining populations of northern bobwhites inhabit
different types of landscapes. Journal of Wildlife Management 70:922-930.
Walters, J. 2000. Dispersal behavior: an ornithological frontier. The Condor 102:479-
478.
White, G. C., and R. A. Garrott. 1999. Analysis of wildlife radio-tracking data. Academic
Press, San Diego, California, USA.
Wiley, M. J., R. J. Gates, and A. K. Janke. 2012. Efficacy of targeted mist netting to
capture northern bobwhites during the non-breeding season. Proceedings of the
National Quail Symposium 7: in press.
Williams, C. K., F. S. Guthery, R. D. Applegate, and M. J. Peterson. 2004. The northern
bobwhite decline: scaling our management for the twenty-first century. Wildlife
Society Bulletin 32:861-869.
Williams, C. K., A. R. Ives, and R. D. Applegate. 2003. Population dynamics across
geographical ranges: time-series analyses of three small game species. Ecology
84:2654-2667.
Yoder, J., E. Marschall, and D. Swanson. 2004. The cost of dispersal: predation as a
function of movement and site familiarity in ruffed grouse. Behavioral Ecology
15:469-476.
53
CHAPTER 3 : BREEDING ECOLOGY OF NORTHERN
BOBWHITES IN SOUTHWEST OHIO
ABSTRACT
Breeding vital rates of northern bobwhite (Colinus virginianus) reproduction are
poorly known for northern and Midwest populations of the species but may be
particularly important due to environmental conditions that cause high mortality in
northern areas of the species’ range. Radio-marked adult bobwhites were monitored
during the breeding season (1 May – 30 Sep) 2010-2011 in an agricultural landscape in
southwest Ohio during which 52 nests were located. Breeding season survival was
relatively low (28%). Forty-four nests were initiated by radio-marked females of which
26 (59.1%) were first nests, 14 (31.8%) were renests, and 4 (9.1%) were double broods.
Mean hatch date for first nest attempts was 1 Jul (SE = 4.06 d), 21 July (SE = 7.86 d) for
male-incubated nests, 28 Jul (SE = 7.66 d) for renests, 31 Jul (SE = 2.80 d, n = 184) for
backdated fall-juveniles, and 24 Aug (SE = 5.12 d) for double clutches. There was a 0.29
probability that a radio-marked male would incubate ≥ 1 nest and an estimated 43% of
nests were incubated by males. Mean clutch size was 14.4 ± 2.4 eggs (range = 9-18, n =
37) and mean egg success was 91.2 ± 1.66% (range = 35.7-100%, n = 20). Forty nests
were included in logistic exposure survival analysis and had a mean daily nest survival of
54
96.9% and 27.9% nest success. Most estimates of fecundity and reproductive vital rates
during this study were comparable or exceeded published range-wide values for
bobwhites but nest success and survival were low. Nest success was not influenced by
clutch size, nesting habitat, year, nest initiation date, nest type (e.g., first nest, renest,
double clutch), or age, sex, or site-affiliation of the incubating adult. Low bobwhite nest
success indicates that the availability of quality nesting habitat in Ohio is below the
threshold needed to offset predation pressure. Estimates of fecundity and reproductive
vital rates are essential for developing effective regional management strategies and
accurate modeling of population growth rates. Programs that establish permanent
grassland habitats and regulate disturbance activities remain important for conservation
of bobwhite populations in this region.
INTRODUCTION
Reproduction is an important component of individual fitness and population
growth for species characterized by early maturity and high fecundity (Stahl and Oli
2006). Poor reproductive success is implicated in declines of grassland bird populations
(Herkert et al. 1996) and may be a factor in the long term, range-wide declines of
northern bobwhites. Reproductive success is often determined by nest survival for avian
species with short life-spans and high annual reproductive output (Clark and Martin
2007) but it is also influenced by other components of fecundity (e.g., clutch size, hatch
success). The influence of reproduction on population dynamics and persistence cannot
be fully evaluated without a comprehensive understanding of all components of
reproduction. The relative influences of these components on overall reproductive
55
success are poorly understood for most species, as are the consequences of their spatial
and temporal variation. Accurate and population-specific estimates of reproductive
components are essential for developing effective regional management strategies like
those advocated by the National Bobwhite Conservation Initiative (National Bobwhite
Conservation Initiative 2011).
Bobwhites were originally considered a monogamous species that re-nests after
failure of initial nests (Stoddard 1931, Rosene 1969, Klimstra and Roseberry 1975,
Roseberry and Klimstra 1984). Technological advances in monitoring techniques have
allowed researchers to study free-ranging bobwhites and have provided evidence that
bobwhites employ complex breeding strategies (e.g., Sermon and Speake 1987, Curtis et
al. 1993, Burger et al. 1995). Alternative strategies such as re-nesting, double brooding
and male incubation have been documented with radio-telemetry in populations
throughout the bobwhite range (e.g., DeVos and Mueller 1993, Cox et al. 2005, Collins et
al. 2009, Rolland et al. 2011).
Bobwhites exhibit reproductive characteristics that typify complex breeding
systems such as ambisexual polygamy (Persson and Öhrström 1989, Curtis et al. 1993,
Burger et al. 1995). Breeding behaviors in this system have been proposed as means for
bobwhite to enhance reproductive success in the face of high mortality (Suchy and
Munkel 1993). Models investigating the importance and influence of alternative
breeding behaviors (e.g., re-nests, double clutches) on bobwhite reproductive success
have suggested that they contribute little to overall reproduction under typical
probabilities of nest success (Guthery and Kuvlesky 1998, Sandercock et al. 2008).

56
However, a disproportionate number of studies included in these models were conducted
in areas with active bobwhite habitat management and do not necessarily represent all
bobwhite populations. Reproductive vital rates (i.e., re-nests, double clutches, and male
incubation) are some of the least studied in bobwhite literature (Sandercock et al. 2008)
and are particularly lacking for northern populations.
Breeding strategies such as multiple broods and male-incubation are
advantageous for northern populations of bobwhites that encounter strong environmental
seasonality and high annual mortality (Suchy and Munkel 1993). Maximizing
reproductive potential in these areas may be particularly important because long-term
population declines have been particularly severe in the northern fringe of the bobwhite
range. Ohio bobwhites had an average annual population decline of 7.6% (95% CI = 6.5
- 8.6%) during 1966-2010, nearly twice the annual range-wide decline of 3.8% (95% CI
= 3.6 - 4.1; Sauer et al. 2011). Peripheral populations of bobwhites, like those in Ohio,
are especially susceptible to extinction (Williams et al. 2003) yet have received limited
research attention. Estimates of fecundity and reproductive vital rates are essential for
accurate modeling of population growth rates for these populations (Sandercock et al.
2008, Gates et al. 2012).
This study fills a gap in our knowledge of breeding ecology, behavior, and
reproductive vital rates of Midwestern bobwhites near the northern limit of their range.
Wild, radio-marked bobwhites were monitored during the breeding season (April-
September) in southwest Ohio during 2010-2011. The landscape was dominated by
privately owned, row crop agricultural with limited habitat management. Nesting
57
phenology for this population is reported and discussed but the main objective of this
study was to estimate bobwhite fecundity and reproductive vital rates for bobwhites in
Ohio. Reproductive rate estimates from this study are compared to range-wide averages
compiled by Sandercock et al. (2008) and later publications on northern populations of
bobwhites (Collins et al. 2009, Lohr et al. 2011, Potter et al. 2011). Relatively low
estimates of reproductive rates would indicate that bobwhites in Ohio may be limited by
reproduction. Estimates that are comparable or exceed range-wide averages would then
indicate mechanisms other than reproduction may be limiting population growth. Given
Ohio’s declining bobwhite populations (Spinola and Gates 2008), it is essential for the
development of effective conservation strategies to determine if population dynamics and
persistence are influenced by reproduction in this region.
STUDY AREA
Study sites were in Highland and Brown counties in the Till Plains and Illinois
Till Plains regions of Ohio (Ohio Division of Geologic Survey 1998) and the Eastern Tall
Grass Prairie Bird Conservation Region of the National Bobwhite Conservation Initiative
(National Bobwhite Conservation Initiative 2011). The region is mostly rural (6%
developed; Homer et al. 2004) and the primary land use is agriculture (39% row crops,
17% pasture/hay) with interspersed grassland (3%) and forest (33%). Research was
conducted on 4 study sites (Fee, Wildcat, Peach Orchard, and Thurner) in southwestern
Ohio within the current geographic core of the bobwhite range (Spinola and Gates 2008).
58
Available nesting habitats included early successional habitats such as CRP-
enrolled fields, idle fields, “odd areas”, waterways, roadsides, pastures, and hay fields.
Fields enrolled in the CRP were typically enrolled in Conservation Practice (CP) 1,
consisting of cool season permanent ground cover with low diversity of forbs and
dominated by sod-forming grasses such as fescue (Festuca spp.). A small proportion of
CRP fields were planted in warm season grasses (CP-2) or permanent wildlife cover (CP-
4D). Areas identified as idle fields were functionally similar to CRP fields but were not
enrolled in the program. These idle, non-CRP fields were often hayed but not necessarily
every year, which allowed early successional vegetation growth to accumulate. Odd
areas included un-mowed garden edges, yards of unoccupied trailer homes, and private
recreational areas maintained for off-road vehicle operation. Most nesting habitats were
dominated by cool-season grasses such as fescue and forbs such as goldenrod (Solidago
spp.) and Queen Anne’s lace (Daucus carota). A small proportion of the study sites were
warm season CRP fields primarily planted with Indian grass (Sorghastrum nutans), big
bluestem (Andropogon gerardii), switch grass (Panicum virgatum), and partridge pea
(Chamaecrista fasciculate).
Additional habitat types at study sites included early successional woody habitat,
row crop fields, woodlots, and other habitat. Early successional woody habitats were
ditches (< 50 m wide), fencerows, or old fields in more advanced stages of succession
and included plant species such as blackberry (Rubus fruticosus), black raspberry (R.
occidentalis), trumpet creeper (Campsis radicans), poison ivy (Toxicodendron radicans),
and Japanese honeysuckle (Lonicera japonica). No-till soybeans (Glycine max, 47%),
59
corn (Zea mays, 15%), and winter wheat (Triticum aestivum, 4%) were the principle row
crops within study site boundaries. Woodlot composition varied with topography and
management practices. Dry upland ridges supported communities dominated by
shagbark hickory (Carya ovata), pignut hickory (C. glabra), white oak (Quercus alba),
and red oak (Q. rubra). Lower elevations and depressions were dominated by black
walnut (Juglans nigra), green ash (Fraxinus pennsylvanica), American elm (Ulmus
americana), and occasionally pin oak (Quercus palustris). Other habitats included
bodies of water, impermeable surfaces (e.g., roads, parking lots), buildings, and
residential areas.
Weather information was obtained from the National Climate Data Center
(NCDC) station in Wilmington, Ohio, USA (Station COOP: 339219) and water inventory
reports by the Ohio Division of Soil and Water Resources (ODSWR). Mean monthly
temperature during April-September, 2010-2011 was 19.7°C (mean minimum = 13.5°C,
mean maximum = 25.9°C; NCDC 2011). Mean monthly temperature during the 2010
breeding season (20.1°C) was higher than in 2011 (19.4°C) but had fewer days of
extreme heat with temperatures exceeding 32.2°C/90°F (NCDC 2011). Both breeding
seasons (2010, n = 23 d; 2011, n = 29 d) had more than twice the annual number of days
with extreme temperatures (mean = 10.6 d; NCDC 2011). Mean precipitation during
spring (Mar–May) and summer (Jun-Aug) was 60.6 cm (NCDC 2011). Precipitation
during the 2010 breeding season (58.8 cm) was slightly lower than normal. The 2011
season had above-normal rainfall amounts (79.6 cm; NCDC 2011) and April and May set
state records (ODSWR 2012). Precipitation during April 2011 was 285% above normal
60
and was the wettest in the past 129 years and May 2011 was the sixth wettest in state
history (ODSWR 2012).
METHODS
Bobwhites were captured, leg-banded, and radiomarked during Oct 2009- Sep
2011. Captured individuals were weighed, aged, sexed, and tagged with uniquely
numbered aluminum leg bands (Size 3 or 3B) with a phone number for band returns.
Individuals > 150 g were outfitted with an Advanced Telemetry Systems (ATS, Isanti,
Minnesota, USA) necklace-style radio-transmitter (6.6 g) with an 8-hr mortality sensor.
All trapping, handling, and marking procedures followed guidelines approved by The
Ohio State University, Institutional Animal Care and Use Committee (Protocol
#2007A0228).
Individuals were radio tracked daily throughout the breeding season by homing to
within ≤ 20m (White and Garrott 1999) with an ATS or Telonics (Impala, Arizona, USA)
receiver and a hand-held, 3-element yagi antenna. Breeding season survival (Apr-Sep)
from radio-tracking encounter histories was estimated with the Kaplan-Meier estimator
adjusted for staggered entry (Pollock et al. 1989) in Program MARK (White and
Burnham 1999). Nesting activity (i.e., incubation) was suspected when a radio-marked
individual was recorded at the same location for at least 2 consecutive days. Nests were
confirmed by searching the location when the adult was absent, visual confirmation of the
incubating adult on the nest, or after flushing the attending adult from the nest. Radio-
marked adults were not intentionally flushed from nests to avoid observer-caused

61
abandonment. Located nests were flagged > 5 m away with orange flagging and
coordinates were recorded with handheld Global Positioning System (GPS) units
(Garmin, Olathe, Kansas, USA). The study site for each nest was based on the site where
each bird was captured during the nonbreeding season.
Breeding habitats at study sites were classified as grass/shrub and pasture/hay
from the National Land Cover Database (Homer et al. 2004). The habitat type used to
describe the nest site was based on the land-cover type within the nest’s habitat patch.
Nest site preference and nesting success rates were not compared among CRP practices
due to limited sample sizes. Nesting habitat was evaluated by collapsing habitat types
into 4 general categories (Table 3.1); CRP-enrolled fields (warm- and cool-season), idle
fields, agricultural fields (pastures, hay, row crops, and waterways), and others (odd
areas, ditches, fencerows, and woodlots).
Nest initiation dates were estimated as (onset of incubation) - (1.2 x clutch size)
and nest hatch dates were estimated based on (1.2 x known or mean clutch size) + (23-d
incubation) (Rosene 1969, Roseberry and Klimstra 1984). Successful bobwhite nests
require 47-55 days from nest construction to hatching (Rosene 1969). Nest construction
takes about 5 days, eggs are laid at a rate of roughly 1 per day, completed clutches are
incubated for approximately 23 days, and the precocial chicks are then lead from the nest
within a day of hatching (Rosene 1969). The incubation period for bobwhites was
determined by the attending adult’s continual presence at the nest. The age and sex of the
incubating adult could only be determined after the initiation of incubation. Nest fate
was ascertained by examining shell fragments or from association of radio-marked adults
62
with chicks after hatching. Nests with no eggs and those abandoned < 1 day after
discovery due to research activities were excluded to minimize bias caused by
investigator-caused nest failure. Egg success was the percent of eggs that hatched from a
successful nest and only nests with complete clutches were considered in analysis. The
influence of year on clutch size and egg success was evaluated with linear regression.
Linear regression was also used to investigate the effects of nest initiation and hatch date
on clutch size and egg success.
Re-nesting rate was the proportion of radio-marked females that initiated clutches
after a failed nesting attempt, while double-brooding rate was the proportion of radio-
marked females that initiated new nests after a successful nest. Male nesting effort
reported by Sandercock et al. (2008) was based on the ratio of male- to female-incubated
nests. Few radio-marked individuals during this study had known fates for the entire
breeding season so nesting rates for each sex were determined with a modified version of
Trent and Rongstad’s (1974) survival estimator as described in Collins et al. (2009). The
probability that a male or female would incubate ≥ 1 nest was calculated based on the
total numbers of radio-days for each sex during the breeding season, numbers of each sex
observed incubating during the breeding season, and the number of days during the
breeding season (153 d, 30 May – 30 Sep; Collins et al. 2009).
Nesting phenology was compared among backdated fall juveniles, first nests, re-
nests, double clutches, and male-incubated nests. Juvenile bobwhites < 150-days old
were backdated to their estimated hatch dates based on lengths of their primary feathers
at capture (Rosene 1969). Juvenile bobwhites older than 150 days cannot be accurately
63
backdated but this method is effective at capturing late season nesting effort when
numbers of radio-marked individuals declines due to adult mortalities and radio failures.
Nest success was calculated using the logistic exposure method described by
Schaffer (2004). This method uses generalized linear models with binomial response
distributions, logistic predictor functions, and a logit-link function to determine daily nest
survival (Shaffer 2004). Nest success was then calculated from the inverse logit of daily
nest survival raised to a power of 40-- the average number of days in the nesting cycle.
The nesting cycle length was calculated by adding the periods for egg laying (mean
clutch size * 1.2) and incubation (23d; Roseberry and Klimstra 1984). The logistic
exposure method is advantageous for nest success analysis because it requires no
assumptions about when nest losses occur and allows easy investigation of explanatory
variables (Schaffer 2004). However, this method also assumes that daily survival
probabilities are homogeneous among nest-days (Shaffer 2004) which may not be an
appropriate assumption for bobwhites (Roseberry and Klimstra 1984).
Information theoretic methods (Burnham and Anderson 2002) were used to
evaluate 1 null and 10 candidate models to investigate the influence of design and
reproduction variables on nest success. Design variables included in models were year,
study site, and age and sex of the incubating adult. Models with reproduction variables
investigated the influences of nest initiation dates, total clutch size, and nest type (i.e.,
first nest, re-nest, or double clutch) on nest success. All models were specified a priori
and included an intercept term. The package lme4 in Program R (R Development Core
Team 2012) was used to fit candidate models. Support for each model was compared
64
with Akaike Information Criterion (AIC) adjusted for small sample sizes (AICc) and
models with ΔAICc ≤ 2.0 were considered to have equivalent support (Burnham and
Anderson 2002). The differences (ΔAICc) between the AICc from the highest ranked
model and other candidate models and the Akaike weight (wi) from each model were
used to determine the relative support for each candidate model.
RESULTS
The Kaplan-Meier estimate of breeding season survival was 0.286 (95% CI =
0.177-0.462) based on encounter histories of 99 radio-marked bobwhite during April-
September 2010-2011. Fifty-three nests of radio-marked bobwhites were located during
the 2010 (n = 19) and 2011 (n = 34) breeding seasons. Most nests were initiated by
bobwhites originally captured on the Fee (n = 18, 34%) and Wildcat (n = 18, 34%) sites,
followed by Thurner (n = 13, 25%), and Peach Orchard (n = 4, 7.5%). The Fee site had
the lowest proportion of breeding habitat (11.0%) followed by Wildcat (27.6%), Peach
Orchard (28.2%), and Thurner (33.3%). Most nests were located in grassland habitats
such as CRP fields (n = 30), old fields (n = 9), pastures (n = 3), hay fields (n = 3), odd
areas (n = 3), and an agricultural waterway (n = 1; Figure 3.1). Other nesting habitats
included a corn field (n = 1), fencerow (n = 1), woodlot (n = 1), and woody ditch (n = 1;
Figure 3.1). Warm- and cool-season CRP practices were combined into a general CRP
category which had the largest number of nests (n = 22, 55.0%) and equal numbers of
nests (n = 6, 15.0%) were in the categories for idle, other, and agricultural habitat types
(Table 3.1).

65
Fifty-two active nests were located during this study of which 20 (38.5%)
hatched, 15 (28.8%) were predated, 10 (19.2%) were abandoned due to research
activities, 4 (7.7%) were abandoned due to natural causes, and 3 (5.8%) were mowed. Of
those nests abandoned due to natural causes, 2 were abandoned after death of the
incubating adult, 1 was abandoned during construction due to vehicular activity, and 1
was abandoned with 15 eggs from an unknown cause. Flushing radio-marked individuals
during research activities apparently caused abandonment of 6 nests during construction
(no eggs) and at 4 nests with partial or completed clutches. Of those nests with eggs, 2
had 1 egg, 1 had 3 eggs, and 1 was a complete clutch of 17.
Forty-four nests were initiated by radio-marked females of which 26 (59.1%)
were first nests, 14 (31.8%) were re-nests, and 4 (9.1%) were double broods. Eleven of
17 (64.7%) females initiated new nests after losing a clutch and 3 of 12 (25.0%) females
initiated new nests after successful clutches (Table 1). Only 1 radio-marked female had 2
consecutive successful clutches during this study. The mean hatch date for first nest
attempts was 1 July (SE = 4.06 d), 28 July (SE = 7.66 d) for renests, 21 July (SE = 7.86
d) for male incubated nests, and 24 Aug (SE = 5.12 d) for double clutches (Figure 3.3).
The earliest nest was initiated 28 Apr 2010 and the latest nest was initiated 4 Aug 2010.
The latest nest would have hatched on 30 Aug 2010 had it succeeded and chicks would
have been 50 d old on 4 Nov 2010 which was the opening day of the Ohio bobwhite
hunting season (Ohio Division of Wildlife 2010). Initiation dates for nests of radio-
marked individuals (Figure 3.2) indicated peaks in nesting activity during May and July.
Hatch dates for captured juvenile bobwhites were estimated from backdating wing molts
66
and compared to hatch dates for nests of radio-marked individuals (Figure 3.4). The
mean hatch date for fall-captured juvenile bobwhites (n = 184) backdated based on
primary wing-molts was 31 July (SE = 2.80 d; Figure 3.4). Backdated, juvenile hatch
dates and the hatch dates of nests of radio-marked bobwhite indicated multiple peaks in
nesting activity.
Sex of the incubating adult was ascertained at 38 nests. Twenty-eight (73.6%)
nests were incubated by females, 9 (23.6%) by males, and only 1 (2.60%) nest was
incubated by both sexes. Radio-marked individuals were monitored over 4,011 radio-
days (males) and 3,848 radio-days (females) during the nesting season. There was a
0.291 probability that a radio-marked male would incubate ≥ 1 nest during the breeding
season and the male to female ratio of incubation probability was 0.432 (95% CI = 0.361-
0.517). Therefore, an estimated 43% of nests in this population would have been
incubated by males if nests were not incubated by both sexes and all females made > 1
nest attempt.
Incubated clutch size was determined for 37 nests and did not differ between
years (F = -1.12, P = 0.27). The mean clutch size was 14.4 ± 2.4 eggs (range = 9-18
eggs) and declined during the breeding season at a rate of 0.058 eggs per day (F = 24.59,
p < 0.001; Figure 3.5). Egg success by clutch was determined at 20 nests and also did not
differ between years (F = 1.55, P = 0.23). Mean percent egg success (91.2 ± 1.66%,
range = 35.7-100.0%) was consistent throughout the breeding season (r2 = 0.004, F =
0.28, p = 0.78; Figure 3.6).

67
Twelve nests were excluded from logistic exposure analysis because they had no
eggs or were abandoned ≤ 1 d after discovery. Daily nest survival was 0.969 (n = 40, SE
= 0.50) and nest success was 27.9% assuming the mean observed clutch size (14.4 eggs),
1.2 eggs laid/day (Klimstra and Roseberry 1975), and a 23-day incubation period (Rosene
1969). There was no evidence that design variables, nesting habitat, or nest phenology
influenced nest success (Table 3.2). The model with the most support (wi = 0.40)
contained a term for age but lacked statistical support (P = 0.55). The model with age
and sex had the next highest rank and was the only other with a ∆AICc < 2.0 but its terms
also lacked statistical support (P ≥ 0.20). All other models had ∆AICc > 2.0 or were
below the null model (Table 3.2).
DISCUSSION
Depressed reproduction is usually implicated during population declines of
grassland birds (Herkert et al. 1996) but it was unclear if this was occurring in bobwhite
populations in southwest Ohio. The majority of nests during this study were located in
fields enrolled in CRP (Table 3.1), although individuals also nested in a variety of other
habitats, suggesting some flexibility in selection of nest sites (Figure 3.1). Bobwhite
studies have indicated that survival of adult bobwhites decreases with proximity to
anthropogenic habitats (e.g. buildings, roads, residential areas; Flock 2006, Lohr et al.
2011) and that bobwhites avoid these habitat types during the breeding season (Lohr et al.
2011). However, 19 (36.5%) nests were placed < 15 m from anthropogenic habitats.
Higher number of nests located during the 2011 breeding season did not necessarily
indicate higher bobwhite densities or nesting rates. Radio-transmitter retention and

68
greater familiarity with study sites and bobwhite nesting behavior during the second field
season were believed to be the primary reason for the larger sample size of nests in 2011.
This study elucidates the breeding ecology of bobwhites in southwest Ohio by
comparing estimates of fecundity and reproductive vital rates to other range-wide
populations. Most estimates from this study were comparable or exceeded the range-
wide values compiled by Sandercock et al. (2008) and values reported in more recent
studies (Collins et al. 2009, Lohr et al. 2011, Potter et al. 2011). Low adult survival and
nest success raises concerns that breeding season vital rates may limit population growth.
However, clutch size, egg success, nesting effort (i.e., re-nests, double clutches), and
male incubation were comparable to or exceeded range-wide estimates of vital rates.
Mean incubated clutch size exceeded the range-wide median (12.8 eggs;
Sandercock et al. 2008) and was most similar to other northern populations (Roseberry
and Klimstra 1984, Burger et al. 1995, Collins et al. 2009). Larger clutches are common
for avian populations at northern latitudes and are an adaptation to shorter breeding
seasons and high winter mortality (Lack 1947, Lack 1968, Böhning-Gaese et al. 2000).
Egg hatchability also tends to increase with latitude (Böhning-Gaese et al. 2000) but Ohio
bobwhites had slightly lower egg hatchability than was found range-wide (median =
92%; Sandercock et al. 2008). Record-breaking rainfall during the 2011 breeding season
(ODSWR 2012) may have reduced egg hatchability. Of greater concern was the potential
for the inclement weather to negatively influence chick survival. Nest hatch dates
occasionally coincided with severe thunderstorm activity and rainfall (M.R. Liberati
personal observation) and despite their thermoregulatory capabilities and mobility,
69
precocial chicks may still incur high mortality rates when exposed to extreme
temperatures and precipitations (Cantu and Everett 1982, Moss 1982).
Low age ratios (juvenile/adult) of fall-captured bobwhites suggest that chick
survival could be limiting fall recruitment in Ohio. Our age ratio was below the range of
mean estimates across the species’ range (4.4-5.2; Guthery 2000). Age ratios of < 4 are
generally considered inadequate to support viable bobwhite populations (Speake 1960,
Roseberry and Klimstra 1984, Guthery et al. 2000). Empirical measures of bobwhite
chick survival between hatching and fledging were not documented for this population
but advances in marking and monitoring techniques (Dreitz et al. 2011) may provide
opportunities in the future to clarify this aspect of bobwhite breeding ecology.
The proportions of re-nests (65%) and double broods (25%) during this study
were comparable to or exceeded range-wide medians (32% and 25%, respectively;
Sandercock et al. 2008). Additional nesting attempts can maximize fitness for species
with low nest survival (Lack 1968) and were thought to be particularly important to
bobwhite populations in northern regions and those in landscapes with high levels of
disturbance (Stanford 1972, Suchy and Munkel 1993, Burger et al. 1995).
Documentation of additional nest attempts in this region was encouraging but recent
studies have indicated that variations in re-nesting and double clutching rates have
limited influence on population growth (Sandercock et al. 2008, Gates et al. 2012).
The second peak in nesting activity was depressed for our population despite high
rates of addition nests (Figure 3.2 and 3.3). Nest phenology of bobwhites usually has
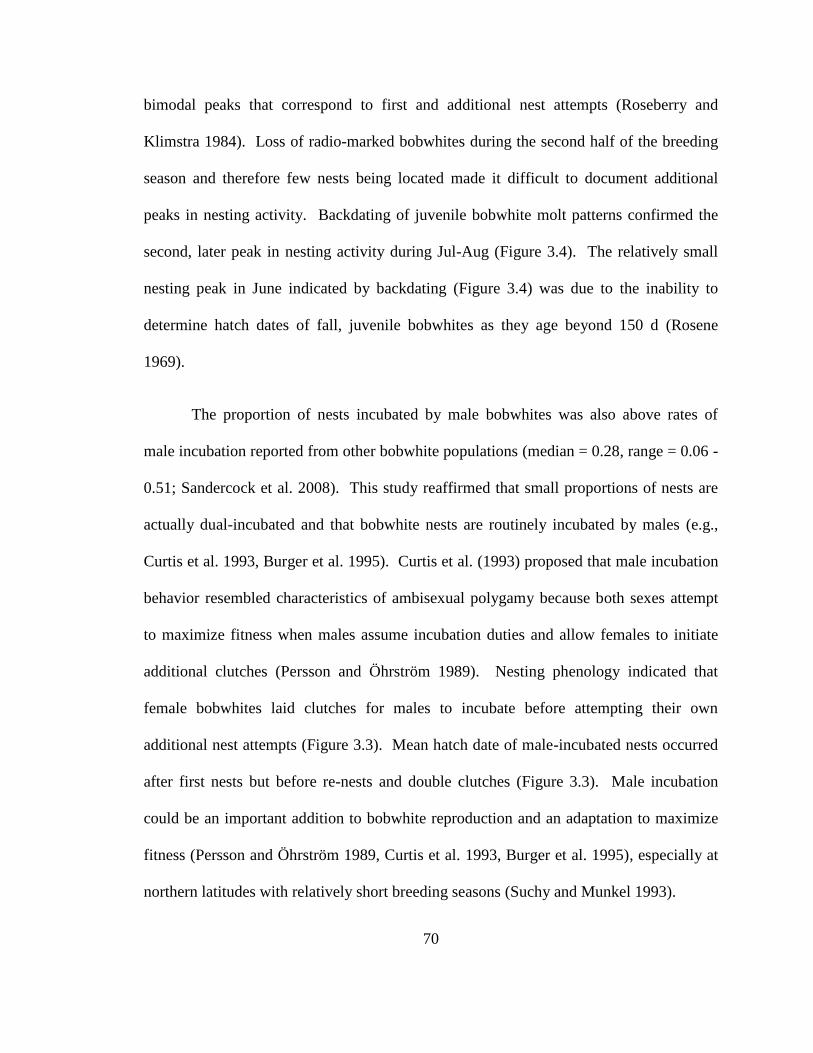
70
bimodal peaks that correspond to first and additional nest attempts (Roseberry and
Klimstra 1984). Loss of radio-marked bobwhites during the second half of the breeding
season and therefore few nests being located made it difficult to document additional
peaks in nesting activity. Backdating of juvenile bobwhite molt patterns confirmed the
second, later peak in nesting activity during Jul-Aug (Figure 3.4). The relatively small
nesting peak in June indicated by backdating (Figure 3.4) was due to the inability to
determine hatch dates of fall, juvenile bobwhites as they age beyond 150 d (Rosene
1969).
The proportion of nests incubated by male bobwhites was also above rates of
male incubation reported from other bobwhite populations (median = 0.28, range = 0.06 -
0.51; Sandercock et al. 2008). This study reaffirmed that small proportions of nests are
actually dual-incubated and that bobwhite nests are routinely incubated by males (e.g.,
Curtis et al. 1993, Burger et al. 1995). Curtis et al. (1993) proposed that male incubation
behavior resembled characteristics of ambisexual polygamy because both sexes attempt
to maximize fitness when males assume incubation duties and allow females to initiate
additional clutches (Persson and Öhrström 1989). Nesting phenology indicated that
female bobwhites laid clutches for males to incubate before attempting their own
additional nest attempts (Figure 3.3). Mean hatch date of male-incubated nests occurred
after first nests but before re-nests and double clutches (Figure 3.3). Male incubation
could be an important addition to bobwhite reproduction and an adaptation to maximize
fitness (Persson and Öhrström 1989, Curtis et al. 1993, Burger et al. 1995), especially at
northern latitudes with relatively short breeding seasons (Suchy and Munkel 1993).
71
Adult survival and nest success were relatively low and could impact population
growth in this region. Gates et al. (2012) evaluated vital rates from throughout the year
with life stage simulation analysis and found that survival and nest success were below
that required to sustain bobwhite populations. Breeding season survival for this
population was lower than standardized breeding season survival rates (median = 0.39,
range = 0.01-0.92) reported by Sandercock et al.’s (2008). Breeding season survival in
Ohio was identical to that in New Jersey (0.28; Lohr et al. 2011), a state that is also
located on the northern edge of the bobwhite range. The highest documented bobwhite
breeding survival occurred during a long-term study in Illinois (Roseberry and Klimstra
1984) but current land-cover composition in many bobwhite ranges are unlikely to
support 0.63 breeding season survival. This is certainly evident in the agricultural
Midwest where breeding season survival estimates from more recent bobwhite studies
have ranged from 0.17 to 0.35 (Burger et al. 1995, Taylor et al. 1999b, Suchy and
Munkel 2000). Low survival estimates are of concern because Sandercock et al. (2008)
determined that a nonbreeding season survival rate of 0.47 or a breeding season survival
rate of 0.82 would be necessary to maintain a stable population.
Bobwhite nest success was below the range-wide median but within the lower
range of published values (median = 42%, range = 19 – 70%; Sandercock et al. 2008).
This was unsurprising given that the studies compiled by Sandercock et al. (2008) were
often conducted in areas managed specifically for bobwhites and unmanaged areas have
low nest success rates (Potter et al. 2011). However, nest success during this study was
also low compared to other grassland, ground-nesting avian species which have relatively
72
low nest success rates compared to other avian guilds (Martin 1993, Best et al. 1997).
Avian nest success declines as the proportion of grassland habitat decreases in the
landscape (Horn et al. 2005) and breeding birds and predators become concentrated in
remnant nesting habitats. Availability of nesting habitats in this region may be below the
threshold needed to dissipate predation pressure (Greenwood et al. 1995, Phillips et al.
2003, Potter et al. 2011). Diminished availability of grasslands and altered composition
and structure of remnant habitats affects the predator communities and predator activity
patterns (Phillips et al. 2003). Predation was the predominant cause of nest failures in
this study but mowed nests may have been more prevalent than was revealed by the data.
At least 3 nests hatched during this study after landowners delayed mowing because they
were aware of the breeding ecology study. These events may also have positively biased
nest success in this study areas which is concerning given that it is already relatively low.
The influences of grassland plantings and CRP practices (i.e., warm- versus cool-
season grasses) on bobwhite nest success were not investigated during this study, but
warrants further investigation. Warm-season grassland habitat within study sites was
almost exclusively limited to CRP-enrolled fields and contributed only a small proportion
(2.0–13.5%) of that enrollment. The majority of study site grasslands were dominated by
cool-season, sod-forming grasses that are thought to provide limited benefits for
bobwhites and other wildlife (Klimstra and Roseberry 1975). Barnes et al. (1995)
surveyed cool-season fescue fields in Kentucky and found that they lacked seed resources
and that dense ground cover would limit access to food resources, especially for chicks.
Pennsylvania agricultural fields with cool-season plantings had lower bird abundance,
73
bird species diversity, and overall reproductive success compared to warm-season
plantings (Giuliano and Daves 2002). Bobwhites were nearly twice as abundant in native
grass rangelands in Texas compared to those with exotic grasses and were preferred by
other ground-foraging avian species (Flanders et al. 2006). The full influence of cool-
season and other non-native plantings on bobwhite reproduction is unclear but certainly
warrants additional investigation (Kuvlesky et al. 2000).
Estimates of fecundity and breeding vital rates for Ohio bobwhites should
enhance understanding of range-wide variation in fecundity. Previous modeling of
bobwhite populations lacked data from northern populations, especially those on private-
owned lands (Sandercock et al. 2008). Using life-stage simulation analysis and estimates
of reproduction from this study, Gates et al. (2012) found that annual breeding vital rates
in southwest Ohio were inadequate to support sustainable bobwhite populations. Gates et
al. (2012) corroborated results from Sandercock et al. (2008) that renests, double broods,
male incubation, clutch size, and egg success did not significantly influence population
growth. Unlike the results from Sandercock et al. (2008), nest success in Ohio was the
second most limiting vital rate limiting population growth although improvement would
not stabilize population growth unless annual survival rates also increased (Gates et al.
2012).
The variety of nesting habitats used by northern bobwhites in Ohio (Figure 3.1)
emphasized the importance of encouraging managers and landowners to plan disturbance
activities outside of peak nesting periods. The majority of nests during this study were
located in CRP fields where mid-contract management activities (i.e., disturbance) are

74
required to be performed outside of nesting periods. The other 41.5% of nests were
located in other grassland habitats where disturbances were not contractually obligated.
Nest success can decline in grassland habitats with agricultural uses due to high stocking
rates of livestock or hay harvesting (Herkert et al. 1996, Perlut et al. 2006). Hay harvests
result in severe declines in reproductive success (Bollinger et al. 1990, Herkert et al.
1996) because mowed nests are either crushed by mowing equipment or the nest canopy
and surrounding vegetation are completely removed, leaving no vegetation to conceal
eggs or the incubating adult (Bollinger et al. 1990). Early mowing (prior to 20 Jul;
Herkert et al. 1996) is particularly detrimental to grassland birds because it occurs during
most species’ peak nesting period (Bollinger et al. 1990, Frawley and Best 1991). Even
mowing along roadsides (Camp and Best 1994), waterways (Bryan and Best 1992), or to
create recreational trails has the potential to negatively impact grassland bird nesting
success. These areas can provide valuable nesting habitats, especially in areas with
expansive agriculture, but are frequently mowed throughout the nesting season (Warner
1992). Roadside nests during this study (n = 9, 17.0%) could have been destroyed if the
roadsides had been mowed or if the mowing had occurred earlier in the breeding season
(Warner 1992, Camp and Best 1994).
MANAGEMENT IMPLICATIONS
Estimates of breeding vital rates from Ohio improves our understanding of
bobwhite breeding ecology across the species’ range and will better inform population
models that previously lacked vital rates from northern populations and private-owned
lands. Chick survival was not empirically measured during this study but may be a

75
critical vital rate for bobwhites in Ohio given the low fall age ratio and continuing
population decline (Sauer et al. 2011). Nest success and breeding season survival for this
population are relatively low compared to other bobwhite populations and likely impact
population growth in the region (Gates et al. 2012). Programs like the CRP that establish
permanent grassland breeding habitats remain important for conservation of bobwhites
and other declining grassland species in the Midwest (Swanson et al. 1999, Ryan 2000,
Farrand and Ryan 2005, Riffell et al. 2008). Increased amounts of grassland habitats
within the landscape may improve bobwhite nest success by dissipating predation
pressures. Bobwhites will be increasingly reliant on unregulated grassland habitats as
CRP enrollment decreases which may result in further declines of nesting success.
Mowing in any nesting habitat should be limited when possible (e.g., immediate
shoulder of the road) and should be delayed until after peak nesting periods (mean hatch
dates-- first nests = 1 Jul, re-nests = 28 Jul, double clutches = 24 Aug). Delaying mowing
until after 20 July (Herkert 1995) would protect first nest attempts by bobwhites in this
region and delaying until after 1 August would accommodate most additional nest
attempts. Given bobwhite renesting capabilities, it is valuable to provide grasslands with
disturbance-free, season-long nesting opportunities. Management opportunities also exist
to provide nesting habitat in additional to fulfilling other conservation purposes (e.g., soil
conservation) by limiting disturbances in areas such as roadsides (Warner 1992, Camp
and Best 1994) and waterways (Bryan and Best 1992).

76
CRP Idle Other Agricultural Total
Fate
Failed 10 3 4 2 19
Hatched 12 3 2 4 21
Total 22 (55%) 6 (15%) 6 (15%) 6 (15%) 40 (100%)
Table 3.1. Distribution of nests and nest success by generalized habitat types for
northern bobwhites in southwest Ohio during April-September 2010-2011.
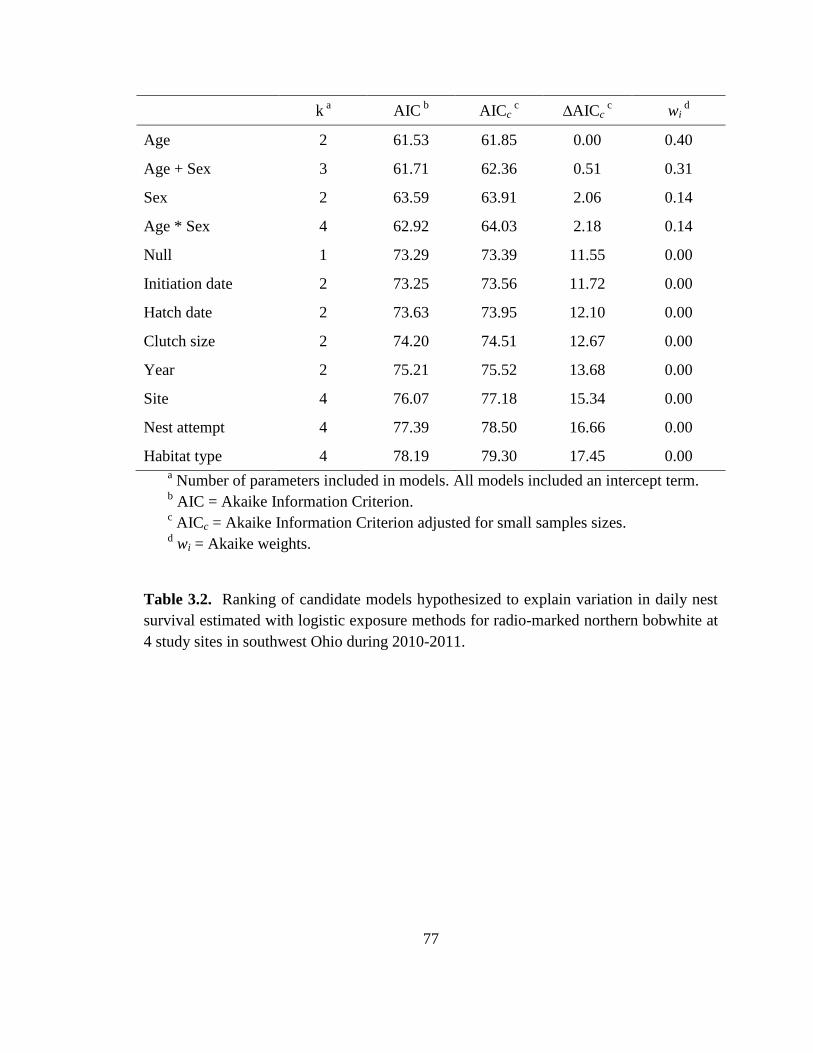
77
k
a AIC
b AICc
c ∆AICc c wi
d
Age 2 61.53 61.85 0.00 0.40
Age + Sex 3 61.71 62.36 0.51 0.31
Sex 2 63.59 63.91 2.06 0.14
Age * Sex 4 62.92 64.03 2.18 0.14
Null 1 73.29 73.39 11.55 0.00
Initiation date 2 73.25 73.56 11.72 0.00
Hatch date 2 73.63 73.95 12.10 0.00
Clutch size 2 74.20 74.51 12.67 0.00
Year 2 75.21 75.52 13.68 0.00
Site 4 76.07 77.18 15.34 0.00
Nest attempt 4 77.39 78.50 16.66 0.00
Habitat type 4 78.19 79.30 17.45 0.00 a Number of parameters included in models. All models included an intercept term.
b AIC = Akaike Information Criterion.
c AICc = Akaike Information Criterion adjusted for small samples sizes.
d wi = Akaike weights.
Table 3.2. Ranking of candidate models hypothesized to explain variation in daily nest
survival estimated with logistic exposure methods for radio-marked northern bobwhite at
4 study sites in southwest Ohio during 2010-2011.

78
Figure 3.1. Proportions of habitats with nests from radio-marked northern bobwhites in
southwest Ohio during April-September 2010-2011.
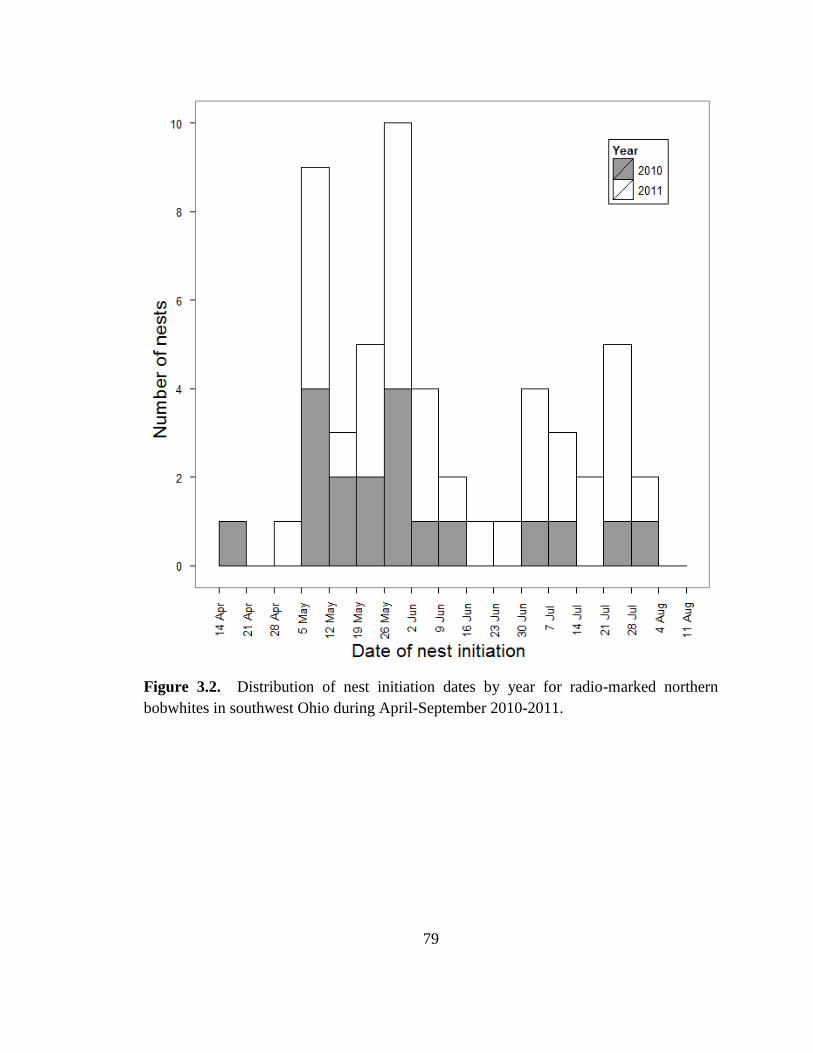
79
Figure 3.2. Distribution of nest initiation dates by year for radio-marked northern
bobwhites in southwest Ohio during April-September 2010-2011.
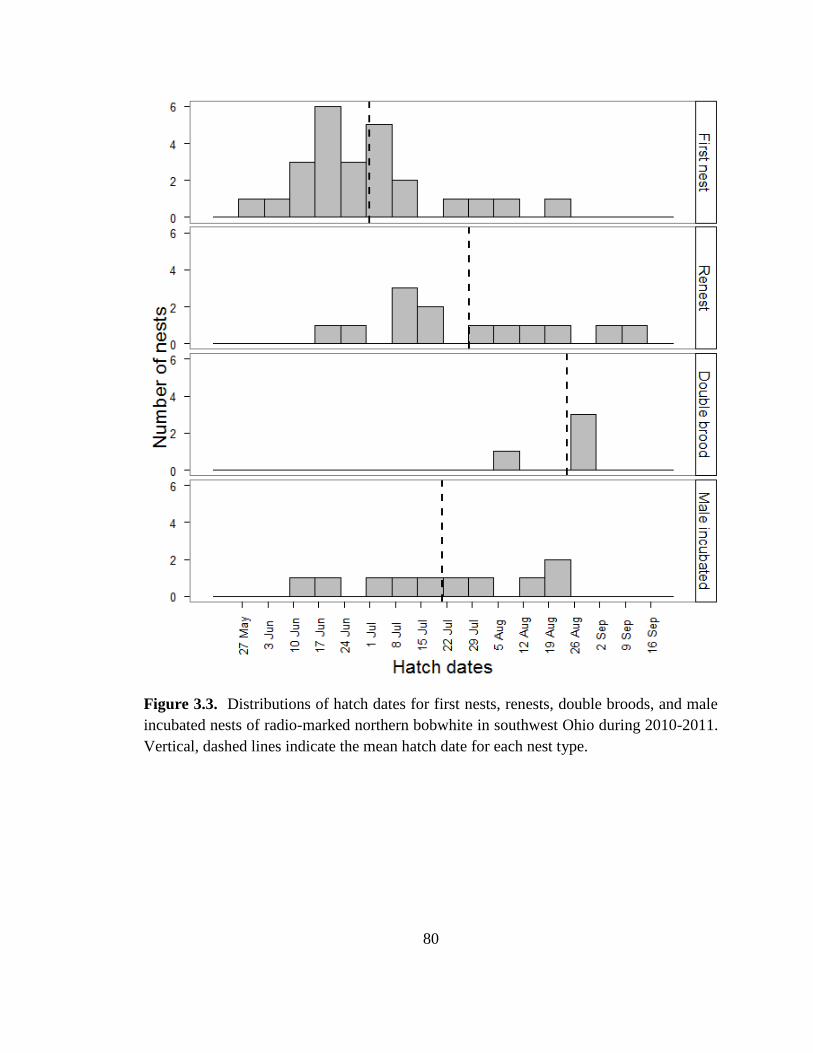
80
Figure 3.3. Distributions of hatch dates for first nests, renests, double broods, and male
incubated nests of radio-marked northern bobwhite in southwest Ohio during 2010-2011.
Vertical, dashed lines indicate the mean hatch date for each nest type.

81
Figure 3.4. Distribution of hatch dates estimated by backdating of primary feather molts
from fall-captured juvenile bobwhites (Rosene 1969) in southwest Ohio during 2010-
2011. The vertical, dashed line indicates the mean hatch date for backdated juveniles.
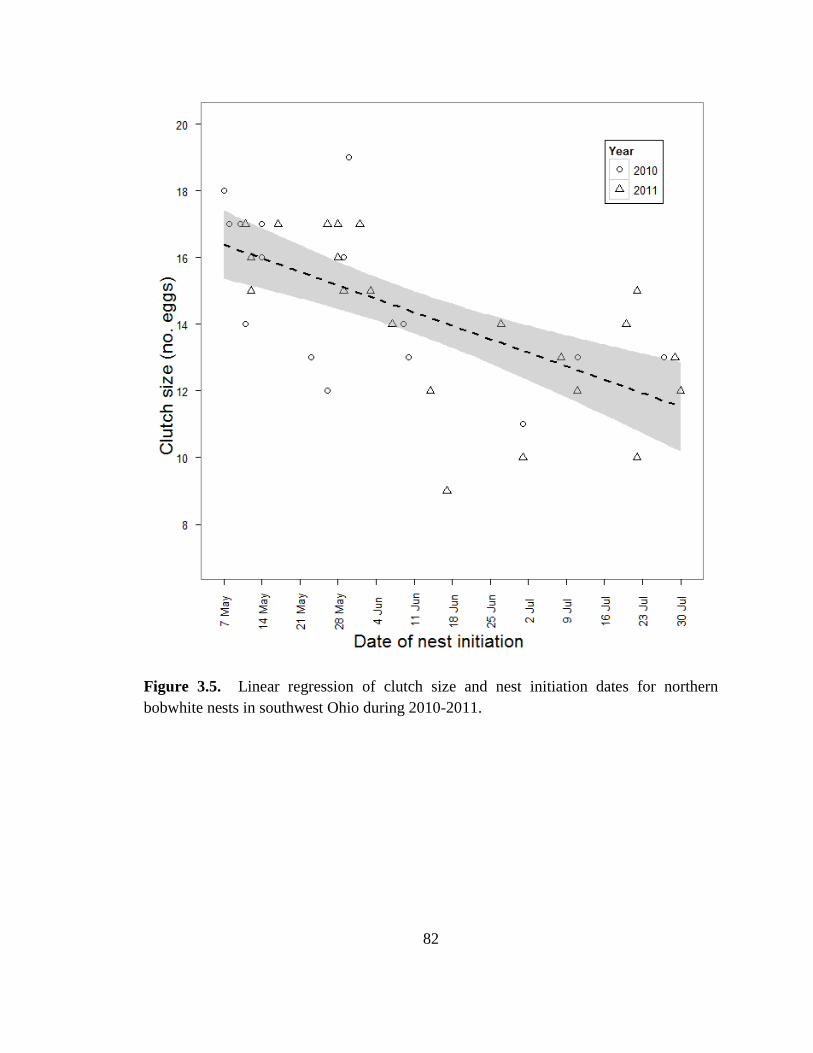
82
Figure 3.5. Linear regression of clutch size and nest initiation dates for northern
bobwhite nests in southwest Ohio during 2010-2011.
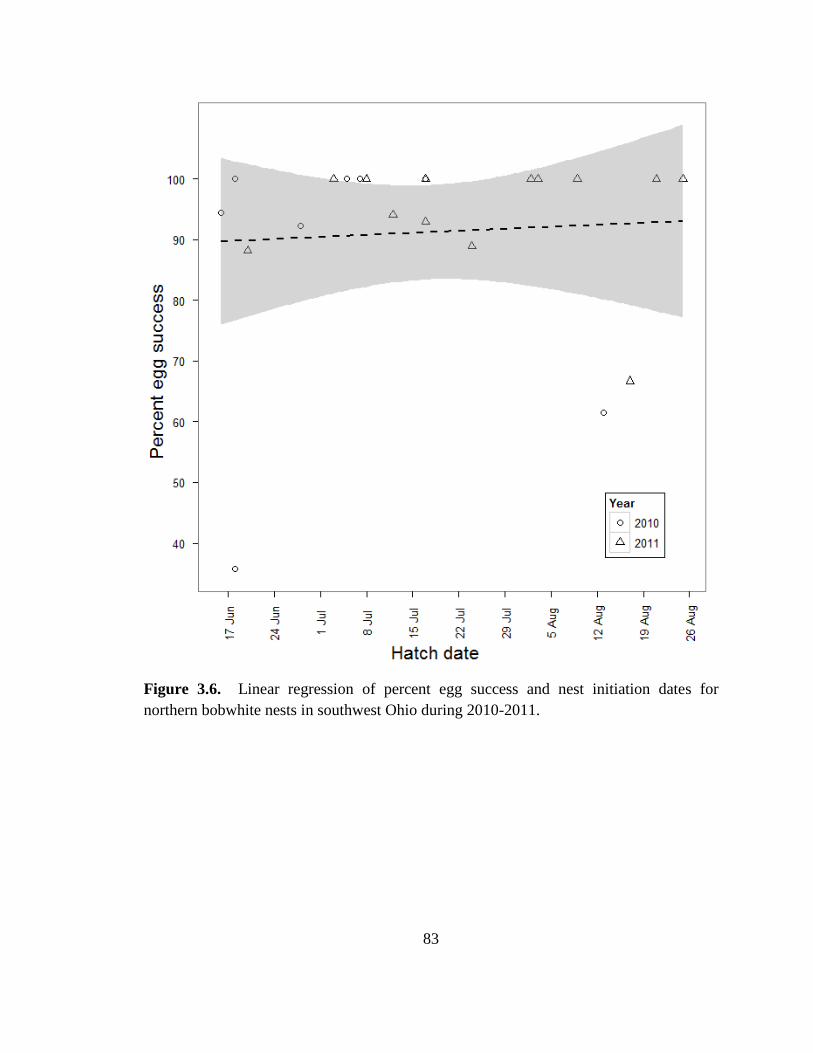
83
Figure 3.6. Linear regression of percent egg success and nest initiation dates for
northern bobwhite nests in southwest Ohio during 2010-2011.
84
LITERATURE CITED
Barnes, T. G., L. A. Madison, J. D. Sole, and M. J. Lacki. 1995. An assessment of habitat
quality for northern bobwhite in tall fescue-dominated fields. Wildlife Society
Bulletin 23:231-237.
Best, L. B., H. Campa, III, D. E. Kemp, R. J. Robel, M. R. Ryan, J. A. Savidge, H. P.
Weeks, Jr., and S. R. Winterstein. 1997. Bird abundance and nesting in CRP
fields and cropland in the Midwest: a regional approach. Wildlife Society Bulletin
25:864-877.
Böhning-Gaese, K., B. Halbe, N. Lemoine, and R. Oberrath. 2000. Factors influencing
the clutch size, number of broods and annual fecundity of North American and
European land birds. Evolutionary Ecology Research 2:823-839.
Bollinger, E. K., P. B. Bollinger, and T. A. Gavin. 1990. Effects of hay-cropping on
eastern populations of the bobolink. Wildlife Society Bulletin 18:142-150.
Bryan, G. G., and L. B. Best. 1992. Avian nest density and success in grassed waterways
in Iowa rowcrop fields. Wildlife Society Bulletin 22:583-592.
Burger, L. W., M. R. Ryan, T. V. Dailey, and E. W. Kurzejeski. 1995. Reproductive
strategies, success, and mating systems of northern bobwhite in Missouri. Journal
of Wildlife Management 59:417-426.
Burnham, K. P., and D. R. Anderson. 2002. Model selection and multimodel inference: a
practical information-theoretic approach. 2nd edition. Springer, New York, New
York, USA.
Camp, M., and L. B. Best. 1994. Nest density and nesting success of birds in roadsides
adjacent to rowcrop fields. American Midland Naturalist 131:347-358.
Cantu, T., and D. D. Everett. 1982. Reproductive success and brood survival of bobwhite
quail as effected by grazing practices. Pages 79-83 in F. Schitoskey, Jr , E. C.
Shitoskey, and L. G. Talent, eds. Proceedings of the Second National Bobwhite
Quail Symposium. Oklahoma State University, Stillwater, Oklahoma, USA.
85
Clark, M. E., and T. E. Martin. 2007. Modeling tradeoffs in avian life history traits and
consequences for population growth. Ecological Modelling 209:110-120.
Collins, B. M., C. K. Williams, and P. M. Castelli. 2009. Reproduction and microhabitat
selection in a sharply declining northern bobwhite population. Wilson Journal of
Ornithology 121:688-695.
Cox, S. A., F. S. Guthery, J. J. Lusk, A. D. Peoples, S. J. DeMaso, and M. Sams. 2005.
Reproduction by northern bobwhites in western Oklahoma. Journal of Wildlife
Management 69:133-139.
Curtis, P. D., B. S. Mueller, P. D. Doerr, C. F. Robinette, and T. DeVos. 1993. Potential
polygmaous breeding behavior in northern bobwhite. Pages 55-63 in K. E.
Church, and T. V. Dailey, eds. Quail III: National Quail Symposium. Kansas
Department of Wildlife and Parks, Pratt, Kansas, USA.
DeVos, T., and B. S. Mueller. 1993. Reproductive ecology of northern bobwhite in north
Florida. Pages 83-90 in K. E. Church, and T. V. Dailey, eds. Quail III: National
Quail Symposium. Kansas Department of Wildlife and Parks, Pratt, Kansas, USA.
Dreitz, V. J., L. A. Baeten, T. Davis, and M. M. Riordan. 2011. Testing radiotransmitter
attachment techniques on northern bobwhite and chukar chicks. Wildlife Society
Bulletin 35:475-480.
Farrand, D. T., and M. R. Ryan. 2005. Impact of the Conservation Reserve Program on
wildlife conservation in the Midwest. in J. B. Haufler, editor. Fish and wildlife
benefits of Farm Bill programs: 2000-2005 update, Technical Review 05-2. The
Wildlife Society, Bethesda, Maryland, USA.
Flanders, A. A., W. P. Kuvlesky, D. C. Ruthven, R. E. Zaiglin, R. L. Bingham, T. E.
Fulbright, F. Hernández, L. A. Brennan, and J. H. Vega Rivera. 2006. Effects of
invasive exotic grasses on south Texas rangeland breeding birds. The Auk
123:171-182.
Flock, B. E. 2006. Effects of landscape configuration on northern bobwhite in
southeastern Kansas. Dissertation, Kansas State University, Manhattan, Kansas,
USA.
86
Frawley, B. J., and L. B. Best. 1991. Effects of mowing on breeding bird abundance and
species composition in alfalfa fields. Wildlife Society Bulletin 19:135-142.
Gates, R. J., A. K. Janke, M. R. Liberati, and M. J. Wiley. 2012. Population ecology and
habitat relationships of northern bobwhite in southwestern Ohio. Proceedings of
the National Quail Symposium 7: in press.
Giuliano, W. M., and S. E. Daves. 2002. Avian response to warm-season grass use in
pasture and hayfield management. Biological Conservation 106:1-9.
Greenwood, R. J., A. B. Sargeant, D. H. Johnson, L. M. Cowardin, and T. L. Shaffer.
1995. Factors associated with duck nest success in the prairie pothole region of
Canada. Wildlife Monographs:3-57.
Guthery, F. S. 2000. On bobwhites. 1st edition. Texas A&M University Press, College
Station, Texas, USA.
Guthery, F. S., and W. P. Kuvlesky. 1998. The effect of multiple-brooding on age ratios
of quail. Journal of Wildlife Management 62:540-549.
Guthery, F. S., M. J. Peterson, and R. R. George. 2000. Viability of northern bobwhite
populations. Journal of Wildlife Management 64:646-662.
Herkert, J. R. 1995. An analysis of midwestern breeding bird population trends: 1966-
1993. American Midland Naturalist 134:41-50.
Herkert, J. R., D. W. Sample, and R. E. Warner. 1996. Management of midwestern
grassland landscapes for the conservation of migratory birds. Pages 89-116 in F.
R. Thompson, III, editor. Management of midwestern landscapes for the
conservation of neotropical migratory birds, general technical report NC-187. US
Department of Agriculture Forest Service, North Central Forest Experiment
Station.
Homer, C., C. Huang, C. Yang, B. Wylie, and M. Coan. 2004. Development of a 2001
national land-cover database for the United States. Photogrammetric Engineering
and Remote Sensing 70:829-840.
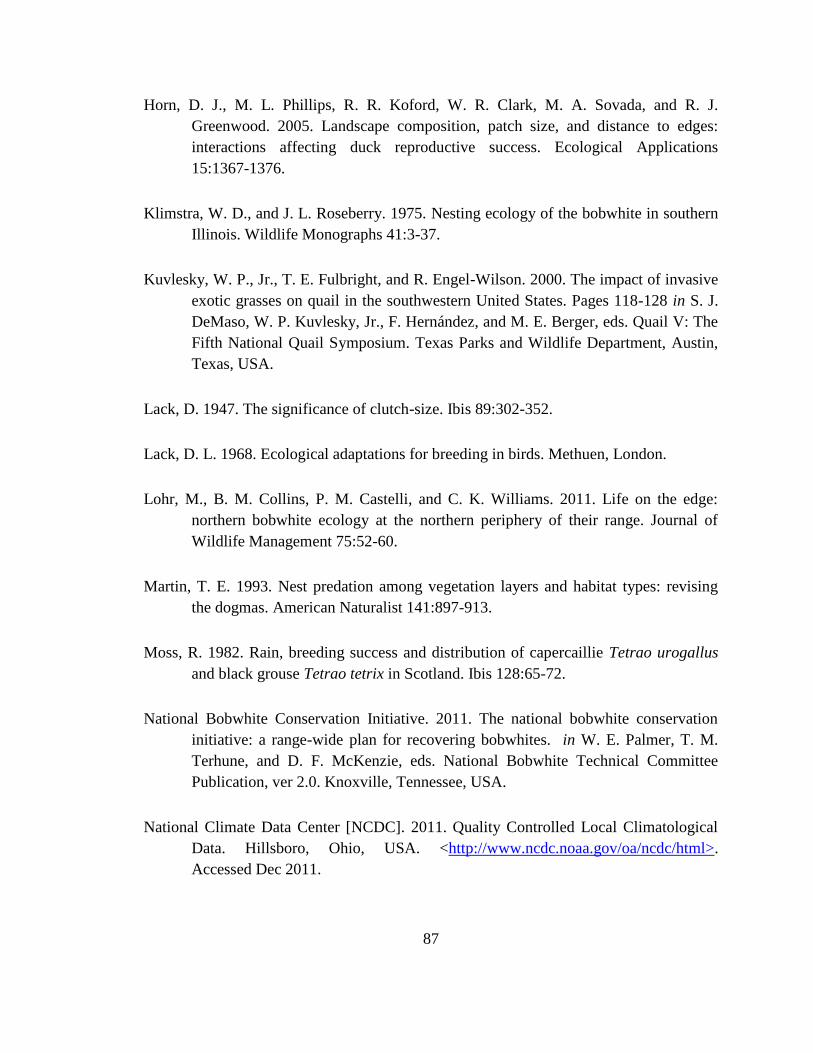
87
Horn, D. J., M. L. Phillips, R. R. Koford, W. R. Clark, M. A. Sovada, and R. J.
Greenwood. 2005. Landscape composition, patch size, and distance to edges:
interactions affecting duck reproductive success. Ecological Applications
15:1367-1376.
Klimstra, W. D., and J. L. Roseberry. 1975. Nesting ecology of the bobwhite in southern
Illinois. Wildlife Monographs 41:3-37.
Kuvlesky, W. P., Jr., T. E. Fulbright, and R. Engel-Wilson. 2000. The impact of invasive
exotic grasses on quail in the southwestern United States. Pages 118-128 in S. J.
DeMaso, W. P. Kuvlesky, Jr., F. Hernández, and M. E. Berger, eds. Quail V: The
Fifth National Quail Symposium. Texas Parks and Wildlife Department, Austin,
Texas, USA.
Lack, D. 1947. The significance of clutch-size. Ibis 89:302-352.
Lack, D. L. 1968. Ecological adaptations for breeding in birds. Methuen, London.
Lohr, M., B. M. Collins, P. M. Castelli, and C. K. Williams. 2011. Life on the edge:
northern bobwhite ecology at the northern periphery of their range. Journal of
Wildlife Management 75:52-60.
Martin, T. E. 1993. Nest predation among vegetation layers and habitat types: revising
the dogmas. American Naturalist 141:897-913.
Moss, R. 1982. Rain, breeding success and distribution of capercaillie Tetrao urogallus
and black grouse Tetrao tetrix in Scotland. Ibis 128:65-72.
National Bobwhite Conservation Initiative. 2011. The national bobwhite conservation
initiative: a range-wide plan for recovering bobwhites. in W. E. Palmer, T. M.
Terhune, and D. F. McKenzie, eds. National Bobwhite Technical Committee
Publication, ver 2.0. Knoxville, Tennessee, USA.
National Climate Data Center [NCDC]. 2011. Quality Controlled Local Climatological
Data. Hillsboro, Ohio, USA. <http://www.ncdc.noaa.gov/oa/ncdc/html>.
Accessed Dec 2011.
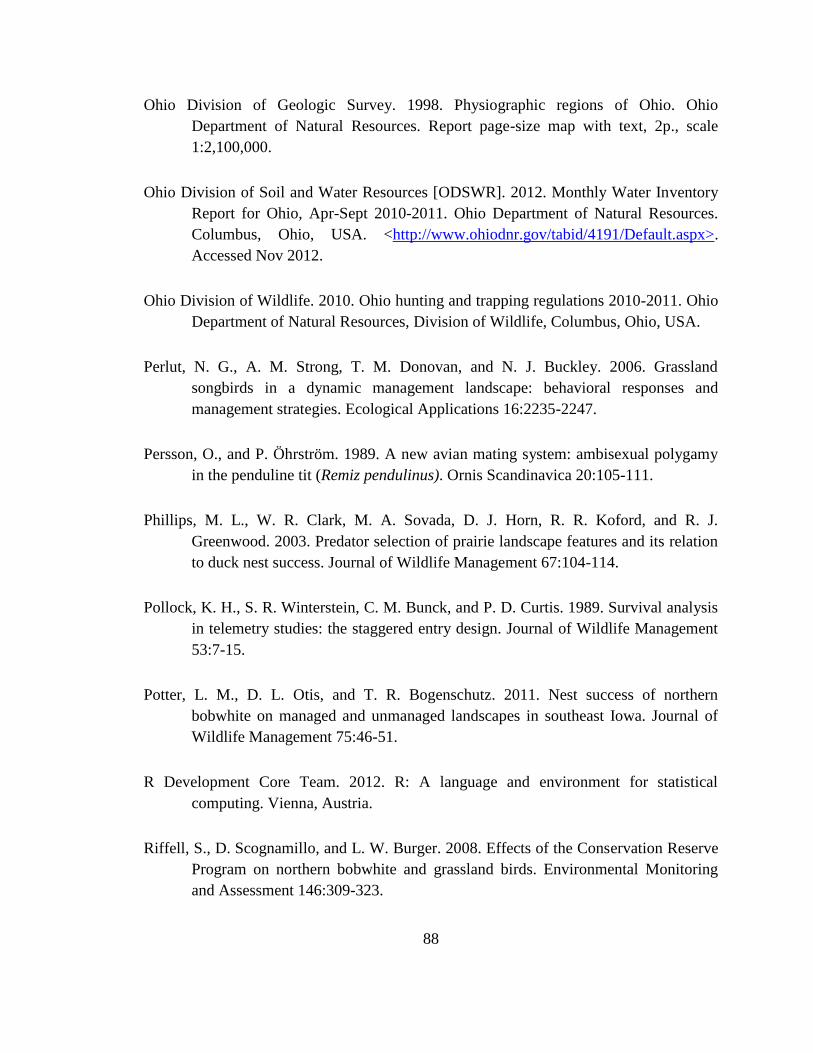
88
Ohio Division of Geologic Survey. 1998. Physiographic regions of Ohio. Ohio
Department of Natural Resources. Report page-size map with text, 2p., scale
1:2,100,000.
Ohio Division of Soil and Water Resources [ODSWR]. 2012. Monthly Water Inventory
Report for Ohio, Apr-Sept 2010-2011. Ohio Department of Natural Resources.
Columbus, Ohio, USA. <http://www.ohiodnr.gov/tabid/4191/Default.aspx>.
Accessed Nov 2012.
Ohio Division of Wildlife. 2010. Ohio hunting and trapping regulations 2010-2011. Ohio
Department of Natural Resources, Division of Wildlife, Columbus, Ohio, USA.
Perlut, N. G., A. M. Strong, T. M. Donovan, and N. J. Buckley. 2006. Grassland
songbirds in a dynamic management landscape: behavioral responses and
management strategies. Ecological Applications 16:2235-2247.
Persson, O., and P. Öhrström. 1989. A new avian mating system: ambisexual polygamy
in the penduline tit (Remiz pendulinus). Ornis Scandinavica 20:105-111.
Phillips, M. L., W. R. Clark, M. A. Sovada, D. J. Horn, R. R. Koford, and R. J.
Greenwood. 2003. Predator selection of prairie landscape features and its relation
to duck nest success. Journal of Wildlife Management 67:104-114.
Pollock, K. H., S. R. Winterstein, C. M. Bunck, and P. D. Curtis. 1989. Survival analysis
in telemetry studies: the staggered entry design. Journal of Wildlife Management
53:7-15.
Potter, L. M., D. L. Otis, and T. R. Bogenschutz. 2011. Nest success of northern
bobwhite on managed and unmanaged landscapes in southeast Iowa. Journal of
Wildlife Management 75:46-51.
R Development Core Team. 2012. R: A language and environment for statistical
computing. Vienna, Austria.
Riffell, S., D. Scognamillo, and L. W. Burger. 2008. Effects of the Conservation Reserve
Program on northern bobwhite and grassland birds. Environmental Monitoring
and Assessment 146:309-323.
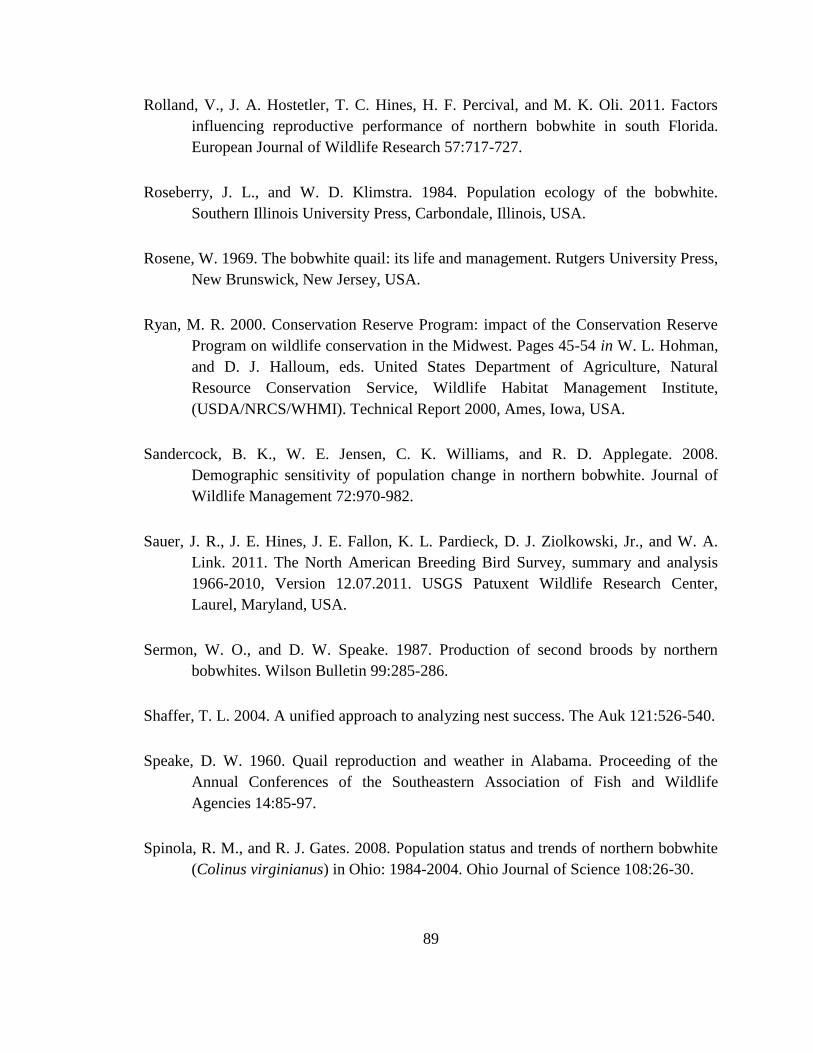
89
Rolland, V., J. A. Hostetler, T. C. Hines, H. F. Percival, and M. K. Oli. 2011. Factors
influencing reproductive performance of northern bobwhite in south Florida.
European Journal of Wildlife Research 57:717-727.
Roseberry, J. L., and W. D. Klimstra. 1984. Population ecology of the bobwhite.
Southern Illinois University Press, Carbondale, Illinois, USA.
Rosene, W. 1969. The bobwhite quail: its life and management. Rutgers University Press,
New Brunswick, New Jersey, USA.
Ryan, M. R. 2000. Conservation Reserve Program: impact of the Conservation Reserve
Program on wildlife conservation in the Midwest. Pages 45-54 in W. L. Hohman,
and D. J. Halloum, eds. United States Department of Agriculture, Natural
Resource Conservation Service, Wildlife Habitat Management Institute,
(USDA/NRCS/WHMI). Technical Report 2000, Ames, Iowa, USA.
Sandercock, B. K., W. E. Jensen, C. K. Williams, and R. D. Applegate. 2008.
Demographic sensitivity of population change in northern bobwhite. Journal of
Wildlife Management 72:970-982.
Sauer, J. R., J. E. Hines, J. E. Fallon, K. L. Pardieck, D. J. Ziolkowski, Jr., and W. A.
Link. 2011. The North American Breeding Bird Survey, summary and analysis
1966-2010, Version 12.07.2011. USGS Patuxent Wildlife Research Center,
Laurel, Maryland, USA.
Sermon, W. O., and D. W. Speake. 1987. Production of second broods by northern
bobwhites. Wilson Bulletin 99:285-286.
Shaffer, T. L. 2004. A unified approach to analyzing nest success. The Auk 121:526-540.
Speake, D. W. 1960. Quail reproduction and weather in Alabama. Proceeding of the
Annual Conferences of the Southeastern Association of Fish and Wildlife
Agencies 14:85-97.
Spinola, R. M., and R. J. Gates. 2008. Population status and trends of northern bobwhite
(Colinus virginianus) in Ohio: 1984-2004. Ohio Journal of Science 108:26-30.
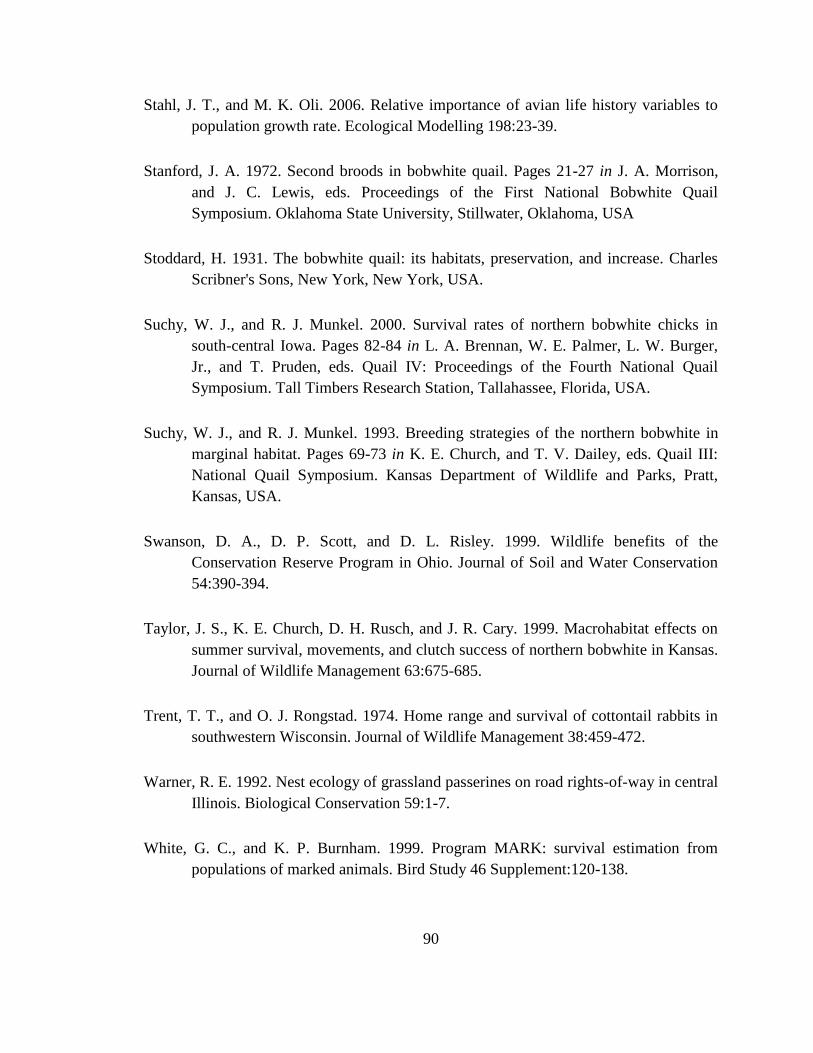
90
Stahl, J. T., and M. K. Oli. 2006. Relative importance of avian life history variables to
population growth rate. Ecological Modelling 198:23-39.
Stanford, J. A. 1972. Second broods in bobwhite quail. Pages 21-27 in J. A. Morrison,
and J. C. Lewis, eds. Proceedings of the First National Bobwhite Quail
Symposium. Oklahoma State University, Stillwater, Oklahoma, USA
Stoddard, H. 1931. The bobwhite quail: its habitats, preservation, and increase. Charles
Scribner's Sons, New York, New York, USA.
Suchy, W. J., and R. J. Munkel. 2000. Survival rates of northern bobwhite chicks in
south-central Iowa. Pages 82-84 in L. A. Brennan, W. E. Palmer, L. W. Burger,
Jr., and T. Pruden, eds. Quail IV: Proceedings of the Fourth National Quail
Symposium. Tall Timbers Research Station, Tallahassee, Florida, USA.
Suchy, W. J., and R. J. Munkel. 1993. Breeding strategies of the northern bobwhite in
marginal habitat. Pages 69-73 in K. E. Church, and T. V. Dailey, eds. Quail III:
National Quail Symposium. Kansas Department of Wildlife and Parks, Pratt,
Kansas, USA.
Swanson, D. A., D. P. Scott, and D. L. Risley. 1999. Wildlife benefits of the
Conservation Reserve Program in Ohio. Journal of Soil and Water Conservation
54:390-394.
Taylor, J. S., K. E. Church, D. H. Rusch, and J. R. Cary. 1999. Macrohabitat effects on
summer survival, movements, and clutch success of northern bobwhite in Kansas.
Journal of Wildlife Management 63:675-685.
Trent, T. T., and O. J. Rongstad. 1974. Home range and survival of cottontail rabbits in
southwestern Wisconsin. Journal of Wildlife Management 38:459-472.
Warner, R. E. 1992. Nest ecology of grassland passerines on road rights-of-way in central
Illinois. Biological Conservation 59:1-7.
White, G. C., and K. P. Burnham. 1999. Program MARK: survival estimation from
populations of marked animals. Bird Study 46 Supplement:120-138.

91
White, G. C., and R. A. Garrott. 1999. Analysis of wildlife radio-tracking data. Academic
Press, San Diego, California, USA.
Williams, C. K., A. R. Ives, and R. D. Applegate. 2003. Population dynamics across
geographical ranges: time-series analyses of three small game species. Ecology
84:2654-2667.
92
CHAPTER 4 : MICROHABITAT INFLUENCES ON NEST SITE
SELECTION AND SUCCESS FOR NORTHERN BOBWHITES IN
SOUTHWEST OHIO
ABSTRACT
Northern bobwhite (Colinus virginianus) populations in Ohio have had long-term
declines and population growth is at least partially limited by low nest success.
Understanding factors that influence nest success in this region is important for effective
management. It is unclear if landscape- or micro-scale habitat features are affecting nest
placement or if nest success is being influenced by quantity or quality of nesting habitats.
Nests of radio-marked bobwhites were located and vegetation at nests and 2 random
locations were measured during 1 May – 30 September 2010-2011 in a row crop
agriculture landscape in southwest Ohio. Vegetation did not differ between plots at nest
and random points (P = 0.53). Microhabitat differences indicated that bobwhites selected
nest sites along linear woody cover with nesting substrates and surrounding forb cover
that provided concealment. Nest success was negatively influenced by bare ground (P =
0.05), upright litter (P = 0.05), and shrub cover (≤ 2 m; P = 0.05). Quality bobwhite
nesting habitat in Ohio will be limited in areas with excessive disturbance (high bare
ground cover) or vegetation succession (high litter or shrub cover). The negative
93
influences of woody vegetation and upright litter on nest success in southwest Ohio
indicates that habitat in this region may be aging past the disturbance interval needed to
maintain quality bobwhite nesting habitat. Management of habitat disturbances and
restriction of advanced woody succession will be important for providing long-term,
productive bobwhite nesting habitat in Ohio.
INTRODUCTION
Long-term northern bobwhite declines have been documented throughout the
United States (Sauer et al. 2011) with particularly steep declines for populations in
northern areas of the species’ range (Spinola and Gates 2008). These declines have been
attributed to loss and degradation of grassland and early succession habitats (e.g.,
Roseberry and Klimstra 1984, Brennan 1991, Williams et al. 2004). Grassland habitats
are important throughout the life history of bobwhites (Lohr et al. 2011) but availability
and quality during the breeding season have particular ramifications for grassland nesting
species. Reproduction is one of the most important vital rates affecting population
growth of bobwhite (Stahl and Oli 2006) and it is affected by the availability of suitable
nesting habitat in a landscape (Riffell et al. 2008). Ground-nesting bird species like
bobwhite have relatively low nest success rates that are further depressed in areas with
low quantity (Horn et al. 2005) or quality (Mankin and Warner 1992) of nesting habitat.
Identifying habitat characteristics that influence nest success is an important step to
address bobwhite declines.
94
Understanding of bobwhite nesting ecology in the United States has grown in
recent decades but there has been limited work on northern populations. Collins et al.
(2009) in New Jersey and Potter et al. (2011) in Iowa have contributed to the current
knowledge base but their research may not apply to the row crop-dominated landscape of
the upper Midwest. Roseberry and Klimstra’s (1974, 1984) long-term research in Illinois
also provided valuable information for the region but also have limited applicability as
land-cover and agricultural practices have changed. Our research was conducted in
southwest Ohio on privately-owned, unmanaged lands that characterize most of the
bobwhite range in the upper Midwestern United States. Study sites were dominated by
row crop agriculture; a landscape that has been underrepresented in bobwhite breeding
ecology studies. Investigating factors that influence nest site selection and success in this
region can fill knowledge gaps and guide conservation and management of bobwhite
breeding habitats.
Suitable nesting habitat may become limiting (see Chapter 3) if the available
nesting habitat in this region is left unmanaged or there is a decline in CRP enrollment.
High quality bobwhite nesting habitats are generally those areas with grass cover that
provide suitable nesting substrate and locations with more concealment (e.g., shrubs) than
found at random (Townsend et al. 2001, Lusk et al. 2006, Collins et al. 2009, Potter et al.
2011). Grasslands and woody habitats will eventually succeed to young forests which
generally do not support populations of bobwhites without active management (Lohr et
al. 2011). The decline of early succession habitat has already occurred in Ohio in the
form of vegetation succession and land-use changes (Askins 2001, Trani et al. 2001).
95
The low availability of early succession woody habitats in landscapes is thought to be
particularly limiting for bobwhite population recoveries (Guthery 1997, Taylor and
Burger 2000, Hiller et al. 2007, Janke 2011, Wiley 2012).
Life-stage simulation analysis indicated that low annual survival was the primary
vital rate limiting population growth in Ohio, but low nest success was also a contributing
factor (Gates et al. 2012). Based on these results, Gates et al. (2012) suggested that
increasing early successional woody cover in Ohio may reverse bobwhite declines by
improving annual survival. However, the influence of woody cover on nest success
documented by other bobwhite studies has been inconclusive. Woody vegetation at nest
sites has been shown to enhance nest success in some areas (Townsend et al. 2001) and to
be detrimental in others (Taylor et al. 1999a, Lusk et al. 2006). Woody habitats in
agricultural landscapes usually have linear configurations (e.g., fencerows, ditches) and
may create detrimental edge effects by providing cover and travel lanes for predators.
Edge effects on nest selection and success are not well understood but can negatively
influence avian nest success, albeit inconsistently (Paton 1994, Winter et al. 2000,
Larivière 2003). Encroachment of woody growth, if left unchecked, may diminish the
quality and quantity of suitable nesting habitats for bobwhites in Ohio.
Management of early successional habitats is both time consuming and financially
taxing so management strategies need to be guided by the best available science.
Microhabitat characteristics of nesting habitat have been studied in other regions of the
bobwhite range but there are few recent studies in the rapidly changing northern and
Midwestern landscapes. Therefore, this study was conducted to identify habitat features
96
that bobwhites use to select nest sites and evaluate other microhabitat characteristics of
cover and vegetation that affect nest placement and success. Attention was given to
microhabitat measurements at nests that represented not only woody edges but also
vegetation differences associated with various stages of woody succession. Study goals
were to determine whether 1) bobwhite nest sites were associated with specific
microhabitat characteristics, 2) nest sites were characterized by microhabitat features
(e.g., woody vegetation) that represented edge associations, and 3) vegetation
composition or structure was associated with nest success.
STUDY AREA
Research was conducted on 4 study sites within the current geographic core of the
bobwhite range in southwest Ohio (Spinola and Gates 2008). Study sites were randomly
selected based on a habitat suitability model using National Land Cover Data (Homer et
al. 2004) and previously published bobwhite literature. Four study sites were selected
(see Chapter 1) in Highland and Brown counties within the Till Plains and Illinois Till
Plains regions of Ohio (Ohio Division of Geologic Survey 1998) and the Eastern Tall
Grass Prairie Bird Conservation Region of the National Bobwhite Conservation Initiative
(National Bobwhite Conservation Initiative 2011). The region was mostly rural (6%
developed; Homer et al. 2004) and agriculture was the primary land use (39% row crops,
17% pasture/hay) with interspersed grassland (3%) and forest (33%; see Table 1.1).
Available nesting habitats included early successional habitats such as CRP-
enrolled fields, idle fields, “odd areas”, waterways, roadsides, pastures, and hay fields.
97
Fields enrolled in the CRP were typically enrolled in Conservation Practice (CP) 1,
consisting of cool season permanent ground cover with low forb diversity and dominated
by sod-forming grasses such as fescue (Festuca spp.). A small proportion of CRP fields
were planted in warm season grasses (CP-2) or permanent wildlife cover (CP-4D). Areas
identified as idle fields were functionally similar to CRP fields but were not enrolled in
the program. These idle, non-CRP fields were often hayed but not necessarily every
year, which allowed early successional vegetation growth to accumulate. Odd areas
included un-mowed garden edges, yards of unoccupied trailer homes, and private
recreational areas maintained for off-road vehicle operation. Most nesting habitats were
dominated by cool-season grasses such as fescue (Festuca spp.) and forbs such as
goldenrod (Solidago spp.) and Queen Anne’s lace (Daucus carota). A small proportion
of the study sites were warm season CRP fields primarily planted with Indian grass
(Sorghastrum nutans), big bluestem (Andropogon gerardii), switch grass (Panicum
virgatum), and partridge pea (Chamaecrista fasciculate).
Additional habitat types at study sites included early successional woody habitat,
row crop fields, woodlots, and other habitat. Early successional woody habitats were
ditches (< 50 m wide), fencerows, or old fields in more advanced stages of succession
and included plant species such as blackberry (Rubus fruticosus), black raspberry (R.
occidentalis), trumpet creeper (Campsis radicans), poison ivy (Toxicodendron radicans),
and Japanese honeysuckle (Lonicera japonica). No-till soybeans (Glycine max, 47%),
corn (Zea mays, 15%), and winter wheat (Triticum aestivum, 4%) were the principle row
crops within study site boundaries. Woodlot composition varied with topography and
98
management practices. Dry upland ridges supported communities dominated by
shagbark hickory (Carya ovata), pignut hickory (C. glabra), white oak (Quercus alba),
and red oak (Q. rubra). Lower elevations and depressions were dominated by black
walnut (Juglans nigra), green ash (Fraxinus pennsylvanica), American elm (Ulmus
americana), and occasionally pin oak (Quercus palustris). Other habitats included
bodies of water, impermeable surfaces (e.g., roads, parking lots), buildings, and
residential areas.
Weather information was obtained from the National Climate Data Center
(NCDC) station in Wilmington, Ohio, USA (Station COOP: 339219) and water inventory
reports by the Ohio Division of Soil and Water Resources (ODSWR). Mean monthly
temperature during April-September, 2010-2011 was 19.7°C (mean minimum = 13.5°C,
mean maximum = 25.9°C; NCDC 2011). Mean monthly temperature during the 2010
breeding season (20.1°C) was higher than in 2011 (19.4°C) but had fewer days of
extreme heat with temperatures exceeding 32.2°C/90°F (NCDC 2011). Both breeding
seasons (2010, n = 23 d; 2011, n = 29 d) had more than twice the annual number of days
with extreme temperatures (mean = 10.6 d; NCDC 2011). Mean precipitation during
spring (Mar–May) and summer (Jun-Aug) was 60.6 cm (NCDC 2011). Precipitation
during the 2010 breeding season (58.8 cm) was slightly lower than normal. The 2011
season had above-normal rainfall amounts (79.6 cm; NCDC 2011) and April and May set
state records (ODSWR 2012). Precipitation during April 2011 was 285% above normal
and was the wettest in the past 129 years and May 2011 was the sixth wettest in state
history (ODSWR 2012).
99
METHODS
Bobwhites were captured and radiomarked during October 2009- September
2011. Most individuals were captured and marked within study area boundaries that
were defined by bobwhite movements during the nonbreeding season (Oct-Mar; Janke
2011, Wiley et al. 2012). Study sites boundaries were expanded during the breeding
season to accommodate radio-marked individuals that dispersed beyond the boundaries of
the nonbreeding season study sites. The sample of radio-marked bobwhites was
supplemented with opportunistic captures during the breeding season (Apr-Sep) as the
birds died, dispersed, or radio-transmitters failed.
Bobwhites were captured using baited funnel traps (Stoddard 1931) and targeted
mist-netting (Wiley et al. 2012). Captured individuals were weighed, aged, sexed, and
marked with uniquely numbered aluminum leg bands (Size 3 or 3B) with a phone number
for band returns. Most individuals also were outfitted with an Advanced Telemetry
Systems (ATS, Isanti, Minnesota, USA) necklace- or bib-mounted radio with an 8-hr
mortality sensor. Radios (6.6 g) were deployed on individuals weighing > 150 g.
Bobwhites were radiomarked during the 2010 field season with bib-mounted or necklace-
style transmitters and zip-tie-style necklace transmitters were deployed after 1 September
2010. The conversion to zip-tie attached transmitters improved retention of radio-
transmitters and optimally balanced weight and durability. All trapping, handling, and
marking procedures were consistent with guidelines set by The Ohio State University,
Institutional Animal Care and Use Committee (# 2007A0228).
100
Radio-marked bobwhites were located ≥ 5 d per week throughout the breeding
season. Locations were identified by homing to within ≤ 20 m of a radio-marked
individual with an ATS or Telonics (Impala, Arizona, USA) receiver and a hand-held, 3-
element yagi antenna. Nesting activity was suspected when radio-marked individuals
were recorded in the same location for 2 consecutive days. Nests were often discovered
after flushing an incubating adult but intentional flushing was avoided when possible to
avoid causing nest abandonment. Nests were flagged with orange surveyors tape at
distances > 5 m and location coordinates were recorded with a handheld Global
Positioning System (GPS) unit (Garmin, Olathe, Kansas, USA).
Nest status was determined by monitoring the incubating radio-marked adult.
Incubation was assumed to commence when a radio-marked bobwhite was consistently
present at a known or potential nest site. Nests status (i.e. presence, condition, and
number of eggs) was checked whenever the incubating bird was away from the nest.
Successful nests were those that hatched ≥ 1 egg and were identified from egg remains or
by observing the incubating adult with chicks. Nests were considered to have failed from
natural causes by evidence of egg remains at nest sites or when abandonment occurred >
2 days after discovery. Nests abandoned ≤ 1 d after discovery were assumed to be caused
by observers and censored from analyses of nest success. Specific causes of depredation
were not identified at failed nests due to the unreliability of diagnosing nest fate from
nest remains (Larivière 1999).
101
Nest Vegetation Measurement
Vegetation composition and structure was measured for each nest ≤ 7 days after
hatching. Vegetation at failed or abandoned nests was measured ≤ 7 days after expected
hatch dates (Rosene 1969). Plots centered on nests sites were paired with two additional
plots randomly selected from within the same habitat patch. Random plots were located
by traveling a random distance (10-50 m) in a random direction (1-360°) from the nest
bowl.
Distance to the nearest habitat edge (Distance) was measured from the center of
each nest and random location to the nearest change in macrohabitat edge (e.g. pasture to
row crop, hay field to woodlot, etc). Vegetation plots were centered over the nest site or
random plot and 10-m transects were oriented perpendicular and parallel to apparent
edges such as field borders, fence lines, deer trails, mowed paths, wooded edges, etc
(Figure 4.1). Two transect (10-m length) were perpendicular to each other and radiated
from the nest bowl or random point at 4 bearings (5-m length) separated by 90° angles
(Figure 4.1). A 50 x 50 cm Daubenmire frame (Daubenmire 1959) was placed over the
nest bowl or random point and along each bearing at 1, 3, and 5 m (Figure 4.1). Canopy
cover of plant taxa was measured and assigned to percent cover intervals that were later
converted to midpoints for analysis (Daubenmire 1959). Percent cover measurements
included bare ground, ground litter, upright litter, grasses and sedges, forbs, and shrubs.
Areas devoid of vegetation or litter were classified as bare ground. Ground litter was any
organic debris on the soil surface and upright litter was any standing residual grasses or
sedges that were still rooted in soil (Fisher and Davis 2010). Live grasses and sedges
102
were combined and forb cover included herbaceous dicots and all vining species (e.g.
wild grape (Vitis spp.), bindweed (Convolvulus spp.), poison ivy). Shrub cover included
all live woody vegetation ≤ 2 m height.
Visual obstruction was measured along each transect with a Robel pole (Robel;
Robel et al. 1970) placed at the intersection of transects and observed at distances of 5 m
and 1 m above-ground. Overhead canopy cover was measured at a height of 1 m with a
convex spherical densitometer (Densiometer; Lemmon 1956) at the same locations where
horizontal visual obstruction was recorded. Shrub density was also evaluated along each
transect with percent shrub line intercept (Percent shrub; Piper 1973).
Analysis
Vegetation composition and structure was evaluated at distances 0, 1, 3, and 5 m
along plot bearings. Ground cover variables included percent bare ground, ground litter,
upright litter, grasses and sedges, forb, and shrub cover. Percent shrub intercept, Robel,
and densiometer readings were also recorded along each transect. Variables were first
tested for normality and non-normal variables were transformed. Percent cover
measurements were arcsine-square root transformed when appropriate. Log
transformations improved normality of distance measurements. Wilk’s lambda and
multivariate analysis of variance (MANOVA) were used to test the significance of
discrimination between measurement distances along transects (1, 3, and 5 m) and
variables were averaged between distances in the absence of significant differences.

103
Principal component analysis (PCA) was used to create a variable to represented
edge-association of bobwhite nests. First, differences between all microhabitat values
along parallel and perpendicular transects were calculated. Measurements at plot
intersections (0 m) were excluded to avoid pseudo-replication. Microhabitats differences
between edge-aligned and edge-perpendicular transects indicated that bobwhite nests
were placed in areas where vegetation cover occurred in linear, edge-like patterns (i.e.,
parallel transect) compared to the surrounding vegetation (i.e., perpendicular transect).
Positive values occurred when more cover was provided by the microhabitat parameter
along the edge-associated (i.e., parallel) transect. The microhabitat differences were then
analyzed with PCA to find a lower-dimensional summary of edge-association. The PCA
was based on eigenanalysis of the correlation matrix from which variable loadings and
eigenvalues were generated. Principle components with eigenvalues > 1.0 were included
in further analysis (Kaiser 1958) and interpreted based on their highest variable loadings.
These principle components were also included in the candidate model set to investigate
the effect of edge-association on nest success.
Effects of microhabitat covariates on daily nest survival were investigated using
logistic exposure (Shaffer 2004) and information-theoretic methods (Burnham and
Anderson 2004). Percent shrub intercept measurement and Robel and densiometer
readings were considered in addition to the microhabitat variables recorded within
Daubenmire frames (bare ground, ground litter, upright litter, grasses and sedges, forb,
and shrub cover). Pair-wise correlations of vegetation cover covariates were inspected
and one covariate was eliminated from each pair whose r-value exceeded 0.70 (Jolliffe
104
1972, Everitt 2005). Mowed nests and those abandoned ≤ 1 d after discovery were
excluded from analyses. Mowed nests were excluded because measurement of
vegetation after mowing would not accurately portray cover characteristics of active nest
sites.
Microhabitat variables were screened with candidate model sets to determine
which covariates representing nest edge-association, vertical cover, live vegetation, and
residual vegetation had the most influence on nest success. Candidate models in each of
the 4 categories were determined a priori, included intercept terms, and were used to
inform construction of a final candidate model set. Vegetation categories were identified
based on field observations and published literature on bobwhites and other grassland
nesting avian species. Nest edge-association was considered because nests associated
with edges might incur higher depredation rates (Winter et al. 2000, Larivière 2003).
Models representing edge-association had combinations and interactions of principle
components (e.g., PC1, PC2, etc) that were screened for their influence on nest success.
Vertical nesting cover is consistently selected for by bobwhites presumably because it
provides concealment from predators. The models in the vertical cover category included
covariates for bare ground cover, percent shrub intercept, and Robel and densiometer
readings. Live vegetation also provides concealment from predators and is an important
nesting substrate that limits reproduction in some bobwhite populations (Rader et al.
2011). The live vegetation category included models with terms for shrub, grass, and
forb cover. Residual vegetation provides nesting material, potentially early during the
105
breeding season when emergent vegetation may be limited and this category was
evaluated by comparing models with ground and upright litter cover.
The highest ranked model (∆AICc = 0) for each vegetation category and a model
for nest distance to nearest habitat were included in the final model set. The final model
set also included combinations of the highest-ranked models from edge-association,
vertical cover, live vegetation, and residual vegetation categories. Support for each
model was evaluated with Akaike’s Information Criterion (AIC) adjusted for small
sample sizes (AICc; Burnham and Anderson 2002). Models within 2 ΔAICc units of the
top model were considered to be equally supported by the data (Burnham and Anderson
2002). Differences between the AICc value of a model and the top (∆AICc values) and
Akaike weights (wi) were used to rank the relative support for each candidate model.
Program R was used for all statistical analyses (Program R 2012).
RESULTS
There was no evidence that vegetation parameters measured at plot intersections
(centered on the nest bowl or random point) differed from more distant points (1, 3, and 5
m) along transects (λ = 0.838, F = 1.82, df = 7, p = 0.098). Therefore, nest plot
microhabitat values were determined by averaging all plot distances (0-5 m). Bobwhite
nest site selection and success were evaluated based on microhabitat variables at nest
locations and in corresponding random locations. There was no evidence that vegetation
cover differed at nest and random plot intersections (λ = 0.668, F = 0.71, df = 7, p = 0.67)
or between the surrounding nest and random plots (λ = 0.483, F = 0.95, df = 9, p = 0.53).

106
The most prevalent cover-types at nest sites were forbs (40.9%, range = 8-83%),
grasses/sedges (29.7%, range = 5-79%), and ground litter (14.9%, 1-41%; Table 4.1).
Mean distance to the nearest habitat edge was 21 m (range = 0.1 – 117 m; Table 4.1).
Microhabitat differences between parallel and perpendicular transects at nest plots
were analyzed with PCA to develop an edge-association score for each plot. The first 3
principle components were retained because they had eigenvalues > 1 and comparison of
broken stick eigenvalues suggested that they were the most meaningful. The first 3
components explained 63% of total variance (Table 4.2). Four variables loaded on the
first component (Table 4.2). Differences in shrub cover, densiometer readings, and
percent shrub intercepts all had positive loadings and forb cover had a negative loading
so the first component was interpreted as the woody edge with forb concealment
component. The second component was interpreted as the nesting substrate component
based on the positive loading for grass cover and the negative loading for bare ground.
Differences in upright litter and Robel readings positively loaded on the third component
so it was interpreted as the residual vegetation component.
Models with microhabitat variables representing edge-association (Table 4.3),
vertical cover (Table 4.4), live vegetation (Table 4.5), and residual vegetation (Table 4.6)
were tested for their influence on bobwhite nest success. Those with the most support
were included in a final candidate model set. The model with interactions for all 3
principle components was the highest ranked and best represented the influence of edge-
association on nest success (Table 4.3). The influence of vertical cover on nest success
was best represented by percent shrub (P = 0.003) and bare ground (P = 0.07; Table 4.4),

107
although percent shrub was the only significant coefficient. Shrub cover (P = 0.02) was
the highest ranked candidate model for the live vegetation category and upright litter
received the most support for the residual vegetation category (P = 0.03).
The final model set investigated effects of microhabitat covariate categories on
nest success. The final set included a null model, a model representing nest edge-
association, and combinations of models representing the 3 vegetation covariate
categories (i.e., vertical cover, live vegetation, and residual vegetation). The model that
best explained bobwhite nest success (wi = 0.35, ∆AICc = 0.00) included the combination
of all 3 vegetation covariate categories (Table 4.7). This model included covariate terms
representing vertical cover (percent shrub, P = 0.14; bare ground, P = 0.05), live
vegetation (shrub, P = 0.05), and residual vegetation (upright litter, P = 0.05; Table 4.8).
The second and third ranked models also had ∆AICc ≤ 2.0. The second ranked model (wi
= 0.21, ∆AICc = 1.06) included the vertical cover (percent shrub, P = 0.002; bare ground,
P = 0.17) and residual vegetation covariate categories (upright litter, P = 0.05; Table 4.8).
The third ranked model (wi = 0.16, ∆AICc = 1.57) contained covariates representing live
(shrub, P = 0.002) and residual vegetation (upright litter, P = 0.005; Table 4.8). All
remaining models had ∆AICc > 2 (Table 4.7).
DISCUSSION
There was no evidence from this study that microhabitat characteristics differed
between nest and random locations. Many bobwhite nesting studies have found
significant differences between nest and random sites (Taylor et al. 1999a, Townsend et

108
al. 2001, Lusk et al. 2006, Collins et al. 2009, Singh et al. 2010). Nest sites generally had
higher structural complexity and were more concealed than random locations. Bobwhites
during this study seemed to select nest locations with little or no discrimination for
microhabitat variations within the habitat patch. Macro (patch-level) characteristic of
study areas may drive nest site selection (Taylor and Burger 2000, Staller et al. 2002) or
characteristics used to select nest sites may not have been captured by the vegetation
measurements used during this study. The method of plot transect orientation also
differed from the random-orientation method used by other bobwhite studies. Our
method seemed the most appropriate for documenting vegetation at nest locations in an
agricultural landscape where woody cover tended to occurred in linear patters (e.g.,
fencerows, ditches). The influence of woody vegetation on nest site selection and
success may have been overlooked if nest plot transects had been oriented randomly.
Bobwhites are traditionally described as an edge-associated species but it is
unclear how they select nest sites in relation to habitat edges. Bobwhites may not have
selected nest sites based on microhabitat variables within habitat patches patches but
there appeared to be an association of nests with linear woody features. Nests were
constructed along vegetated edges with greater woody cover (positive values for percent
shrub intercept, densiometer readings, and shrub cover; Table 4.3) and residual
vegetation (positive values for ground and upright litter; Table 4.2 and Figures 4.2, 4.3,
and 4.4). Nest locations also had greater surrounding forb cover (Table 4.2) which may
have provided concealment and foraging opportunities near nests (Barnes et al. 1995).
Nest locations near woody vegetation were presumably selected because they provide
109
structural protection and concealment at nest locations (Townsend et al. 2001, Lusk et al.
2006). Woody growth occurs in areas with limited disturbances which also
accommodates the accumulation of nesting materials like ground and upright litter.
However, increases in vertical cover (percent shrub intercept), live vegetation (shrub
cover), and residual vegetation (upright litter) were associated with lower daily nest
survival during this study (Figure 4.5). Preference for nesting locations with linear
woody features and residual cover may be maladaptive for this bobwhite population
because daily survival rates for nests in southwest Ohio declined with increases in these
types of vegetation cover. However, nest concealment was still important because nest
success also decreased as bare ground increase and vegetative cover decreased (Figure
4.5).
Bare ground and other vegetation cover measurements are inversely related and
form a gradient from un-vegetated (i.e., high bare ground cover) to densely vegetated.
Nests with vegetation composition at the extreme upper or lower ends of this gradient had
lower nest success rates that those with intermediate values. This is not surprising
because avian nest success has been shown to be negatively impacted by excessive
disturbances (e.g., too-frequent mowing, overgrazing) and vegetation succession (Klug et
al. 2010). Short disturbance intervals disrupt nesting activities and inhibit development
of residual and live vegetation used for nest building (e.g., Simpson 1972, Perlut et al.
2006). Grasslands are quickly overtaken by woody encroachment and advancing
succession without regular disturbance activities that can also decrease nest success
(Harper 2007). Birds that nest in areas with more concealment generally have higher nest

110
success but concealment provided by woody vegetation may be detrimental. The
negative influences of woody vegetation and upright litter on nest success in southwest
Ohio indicates that nesting habitat in this region may be succeeding past the disturbance
interval needed to maintain quality bobwhite nesting habitat.
The negative influence of woody encroachment on nest success is not unique to
bobwhites in Ohio (e.g., With 1994, McKee et al. 1998), especially as height and age of
woody vegetation increases (Guthery 2000, Grant et al. 2004). Woody habitats like
riparian corridors, woodlots, and fencerows are suspected to provide travel corridors for
predators (Larivière 2003) and create edge effects (i.e., decreased nest success, increased
predator abundance; Winter et al. 2000). Woody succession in grassland habitats
supports communities of mesopredators (Chamberlain et al. 2003, Atwood et al. 2004)
and excludes herbaceous cover that would otherwise conceal nests (With 1994, Renfrew
and Ribic 2003). Nests located in areas with shrub cover are more likely to be
depredated by snakes and other mesopredators (Staller et al. 2002, Klug et al. 2010). Tall
trees and shrubs also attract diurnal raptors by providing perches (Kay et al. 1994). Even
just the presence of predators could alter bobwhite nesting behavior (Ibanez-Alamo and
Soler 2012) and have secondary influences on nesting success. Avian predators have not
been documented predating bobwhite nests (Fies and Puckett 2000, Staller et al. 2005,
Lusk et al. 2006, Rader et al. 2007) but they do prey on adult bobwhites. There may have
been even stronger evidence for the effect of woody vegetation on nest success if
vegetation at mowed nests could have been documented prior to being disturbed.
111
Nests in areas with woody encroachment may face increased risk of failure from
mowing. Mowing is effective at preventing woody encroachment and was a common
management practice at our study sites. However, mowing during the breeding season
destroys nests and young wildlife and does not create favorable breeding habitats (Harper
2007). Mowing produces thatch which suppresses seed banks and limits bobwhite
mobility and foraging abilities (McCoy et al. 2001, Harper 2007). Cool-season
grasslands are prevalent in the Midwest region and thatch is particularly detrimental
because it leads to accelerated grass succession and litter accumulation (Walk and
Warner 2000, McCoy et al. 2001, Greenfield et al. 2002). No matter the method used,
habitat management in areas dominated by cool-season grasses will be challenging
because management gains in these habitats are difficult and generally short-lived
(Greenfield et al. 2002).
The effects of shrub cover on nest success have been variable for other bobwhite
studies. Successful bobwhite nests in Kansas had less shrub cover (≤ 2 m) within habitat
patches (Taylor et al. 1999a). Lusk et al. (2006) also reported that successful bobwhite
nests in the Texas panhandle contained less shrub cover, although they did not specify
shrub height. Successful and unsuccessful nests in Georgia had an average of 86% and
56% less area of woody ditches within 16-ha circular buffers compared to random
locations and nests in proximity to woody ditches were particularly susceptible to snake
predation (Staller et al. 2002). Townsend et al. (2001) found that bobwhites selected nest
sites in Oklahoma with more woody cover and that nest success was not impacted.
Collins et al. (2009) in New Jersey and Singh et al. (2010) in Florida found no

112
relationships between any microhabitat parameters and bobwhite nest success. The
variable influence of shrub cover on bobwhite nest success demonstrates the benefit of
region-specific management objectives like those developed by the National Bobwhite
Conservation Initiative (NBCI 2011). The effect of woody vegetation on nest success in
the row crop-dominated landscape of southwest Ohio differs from other landscapes
which support bobwhite populations.
This study also highlights the need for critical thinking when developing
vegetation measurement protocols in order to accurately document habitat attributes that
occur in a study area (Fisher and Davis 2010). Variables that influenced nest success in
Ohio would have been overlooked if vegetation measurement protocols had not been
tailored to capture aspects of woody habitats and succession in the landscape.
MANAGEMENT IMPLICATIONS
Quality nesting habitat for bobwhites in southwest Ohio can be achieved with
management that that sets back vegetation succession. The value of early successional
habitat for wildlife declines in the absence of management activities (McCoy et al. 2001).
Avian species diversity is higher (Negus et al. 2010) and bobwhites are more abundant
(Osborne et al. 2012) in grasslands with active management. Early successional habitats
provided by the CRP are particularly effective because habitat management activities are
contractually obligated and long-term nesting habitats are thereby maintained. Declines
in CRP enrollment would force bobwhite to rely more on privately-owned grasslands that
often lack active management or are not managed based on the best available science
113
(e.g., mowing) for nesting habitats. Continued woody succession coupled with
anticipated declines in Conservation Reserve Program (CRP) enrollment would likely
diminish usable space for bobwhites (Guthery 1997, Wiley 2012) in Ohio during the
breeding season. Continued support for CRP practices and habitat management that sets
back succession of woody vegetation will be vital for maintaining bobwhite nesting
habitats in this region. In order to provide the highest quality nesting habitat in Ohio, it
will also be important to identifying management activities and disturbance-intervals that
maximize habitat management efforts. Disturbance techniques such as prescribed fire
(Simpson 1972, Guthery 2000), grazing (Walk and Warner 2000, Hernández and Guthery
2012), mechanical methods (e.g., roller chopping, chaining, and discing; Guthery 2000,
Hernández and Guthery 2012, Osborne et al. 2012), and herbicide applications
(Hernández and Guthery 2012, Osborne et al. 2012) have yielded better habitat results for
bobwhites and would be more effective in the Midwest.

114
Variable Unit
Nest plots
Random plots
Mean Standard
error Minimum Maximum
Mean
Standard
error Minimum Maximum
Distance m 21 3.2 0.1 117
23.8 2.3 0.3 113
Robel reading cm 69.6 4.1 25 150
67.2 3.1 11 150
Densiometer reading % 91.6 2.9 6 100
8.3 1.9 0 94
Shrub intercept (> 2 m) % 5.8 2.2 0 78
4.6 1.2 0 73
Daubenmire cover types
Bare ground % 3.2 0.6 0 14
4.5 0.6 0 29
Ground litter % 14.9 1.4 1 41
13.9 1.1 1 63
Upright litter % 3.3 0.7 0 21
2.7 0.3 0 16
Grass/sedge % 29.7 2.1 5 79
32.5 1.8 0 89
Forb % 40.9 2.9 8 83
36.7 2.0 3 90
Shrub (≤ 2 m) % 7.8 1.5 0 47
4.6 1.2 0 73
Table 4.1. Summary of microhabitat vegetation at northern bobwhite nest and random plots in southwest Ohio during 2010-
2011. Low percent densiometer readings correspond to low overhead canopy coverage.
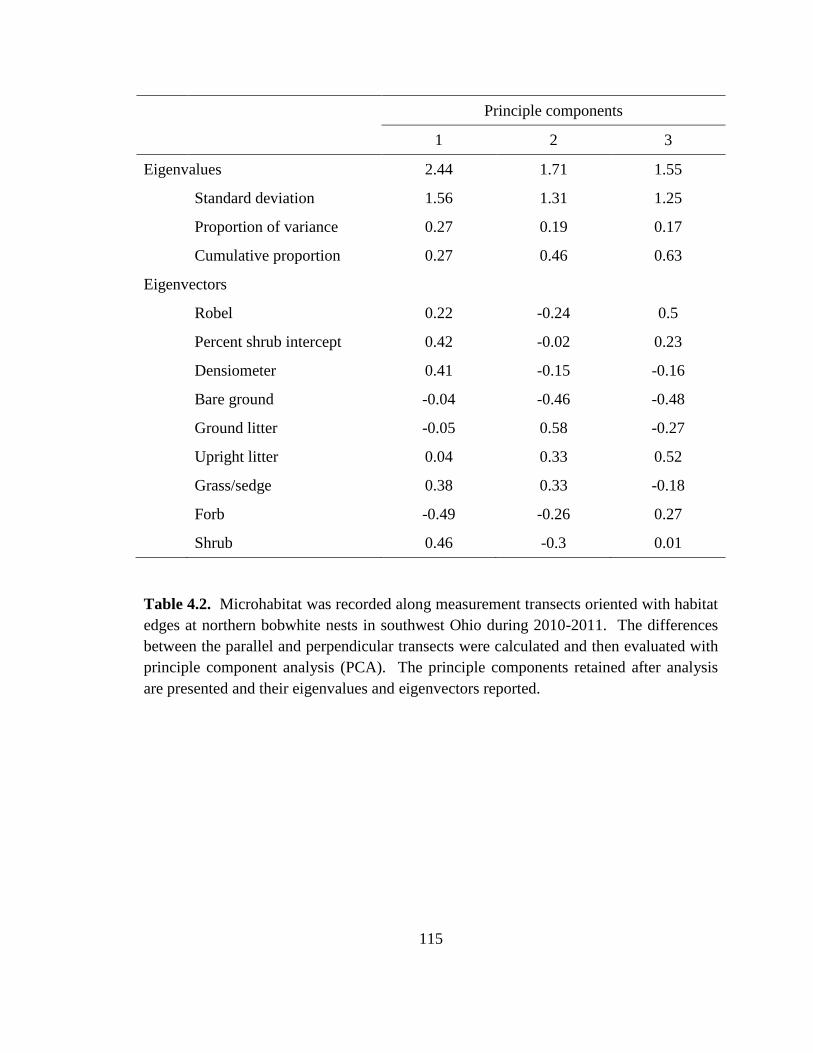
115
Principle components
1 2 3
Eigenvalues 2.44 1.71 1.55
Standard deviation 1.56 1.31 1.25
Proportion of variance 0.27 0.19 0.17
Cumulative proportion 0.27 0.46 0.63
Eigenvectors
Robel 0.22 -0.24 0.5
Percent shrub intercept 0.42 -0.02 0.23
Densiometer 0.41 -0.15 -0.16
Bare ground -0.04 -0.46 -0.48
Ground litter -0.05 0.58 -0.27
Upright litter 0.04 0.33 0.52
Grass/sedge 0.38 0.33 -0.18
Forb -0.49 -0.26 0.27
Shrub 0.46 -0.3 0.01
Table 4.2. Microhabitat was recorded along measurement transects oriented with habitat
edges at northern bobwhite nests in southwest Ohio during 2010-2011. The differences
between the parallel and perpendicular transects were calculated and then evaluated with
principle component analysis (PCA). The principle components retained after analysis
are presented and their eigenvalues and eigenvectors reported.

116
Model a
k b
AIC c
AICc d
∆AICc d
wi e
PC1 * PC2 * PC3 8 54.30 59.10 0.00 0.58
PC2 2 61.41 61.75 2.64 0.15
PC2 + PC3 3 62.59 63.28 4.17 0.07
PC1 + PC2 3 63.39 64.08 4.97 0.05
PC1 * PC2 4 63.13 64.31 5.21 0.04
PC1 * PC3 4 64.35 65.53 6.43 0.02
PC2 * PC3 4 64.45 65.62 6.52 0.02
PC1 + PC2 + PC3 4 64.58 65.75 6.65 0.02
PC3 2 65.65 65.98 6.88 0.02
PC1 2 66.66 67.00 7.90 0.01
PC1 + PC3 3 67.59 68.27 9.17 0.01 a PC = principle component (see Table 4.2).
b Number of parameters included in models including the intercept.
c AIC = Akaike Information Criterion.
d AICc = Akaike Information Criterion adjusted for small samples size.
e wi = Akaike weights.
Table 4.3. Model selection results from the edge-association candidate models which
examine the relationship of principle components (PC) to nest success of northern
bobwhite in southwest Ohio during 2010-2011.
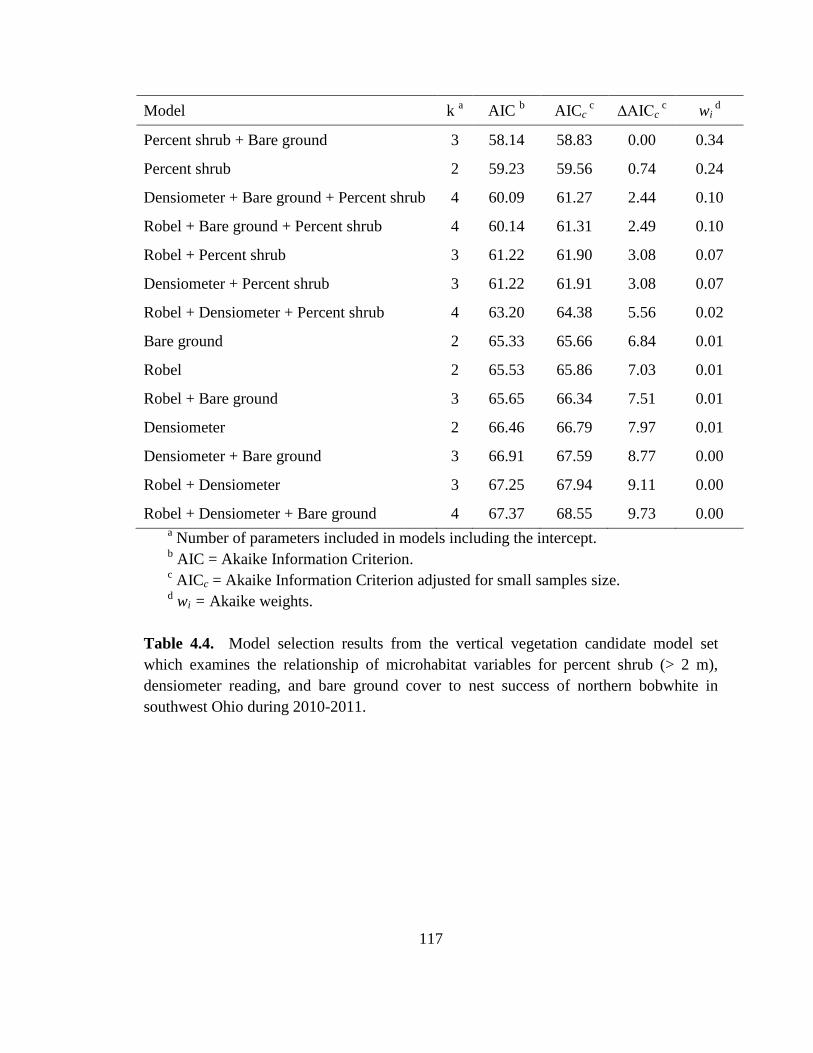
117
Model k a
AIC b
AICc c
∆AICc c
wi d
Percent shrub + Bare ground 3 58.14 58.83 0.00 0.34
Percent shrub 2 59.23 59.56 0.74 0.24
Densiometer + Bare ground + Percent shrub 4 60.09 61.27 2.44 0.10
Robel + Bare ground + Percent shrub 4 60.14 61.31 2.49 0.10
Robel + Percent shrub 3 61.22 61.90 3.08 0.07
Densiometer + Percent shrub 3 61.22 61.91 3.08 0.07
Robel + Densiometer + Percent shrub 4 63.20 64.38 5.56 0.02
Bare ground 2 65.33 65.66 6.84 0.01
Robel 2 65.53 65.86 7.03 0.01
Robel + Bare ground 3 65.65 66.34 7.51 0.01
Densiometer 2 66.46 66.79 7.97 0.01
Densiometer + Bare ground 3 66.91 67.59 8.77 0.00
Robel + Densiometer 3 67.25 67.94 9.11 0.00
Robel + Densiometer + Bare ground 4 67.37 68.55 9.73 0.00 a Number of parameters included in models including the intercept.
b AIC = Akaike Information Criterion.
c AICc = Akaike Information Criterion adjusted for small samples size.
d wi = Akaike weights.
Table 4.4. Model selection results from the vertical vegetation candidate model set
which examines the relationship of microhabitat variables for percent shrub (> 2 m),
densiometer reading, and bare ground cover to nest success of northern bobwhite in
southwest Ohio during 2010-2011.
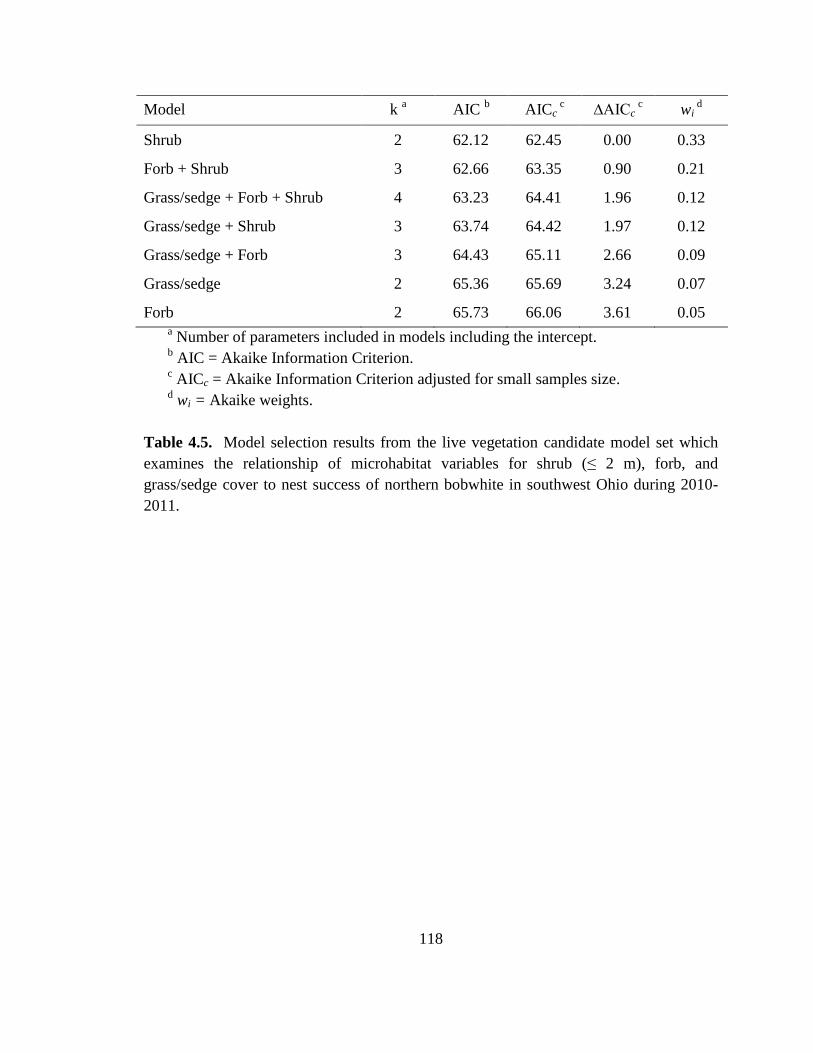
118
Model k a
AIC b
AICc c
∆AICc c
wi d
Shrub 2 62.12 62.45 0.00 0.33
Forb + Shrub 3 62.66 63.35 0.90 0.21
Grass/sedge + Forb + Shrub 4 63.23 64.41 1.96 0.12
Grass/sedge + Shrub 3 63.74 64.42 1.97 0.12
Grass/sedge + Forb 3 64.43 65.11 2.66 0.09
Grass/sedge 2 65.36 65.69 3.24 0.07
Forb 2 65.73 66.06 3.61 0.05 a Number of parameters included in models including the intercept.
b AIC = Akaike Information Criterion.
c AICc = Akaike Information Criterion adjusted for small samples size.
d wi = Akaike weights.
Table 4.5. Model selection results from the live vegetation candidate model set which
examines the relationship of microhabitat variables for shrub (≤ 2 m), forb, and
grass/sedge cover to nest success of northern bobwhite in southwest Ohio during 2010-
2011.
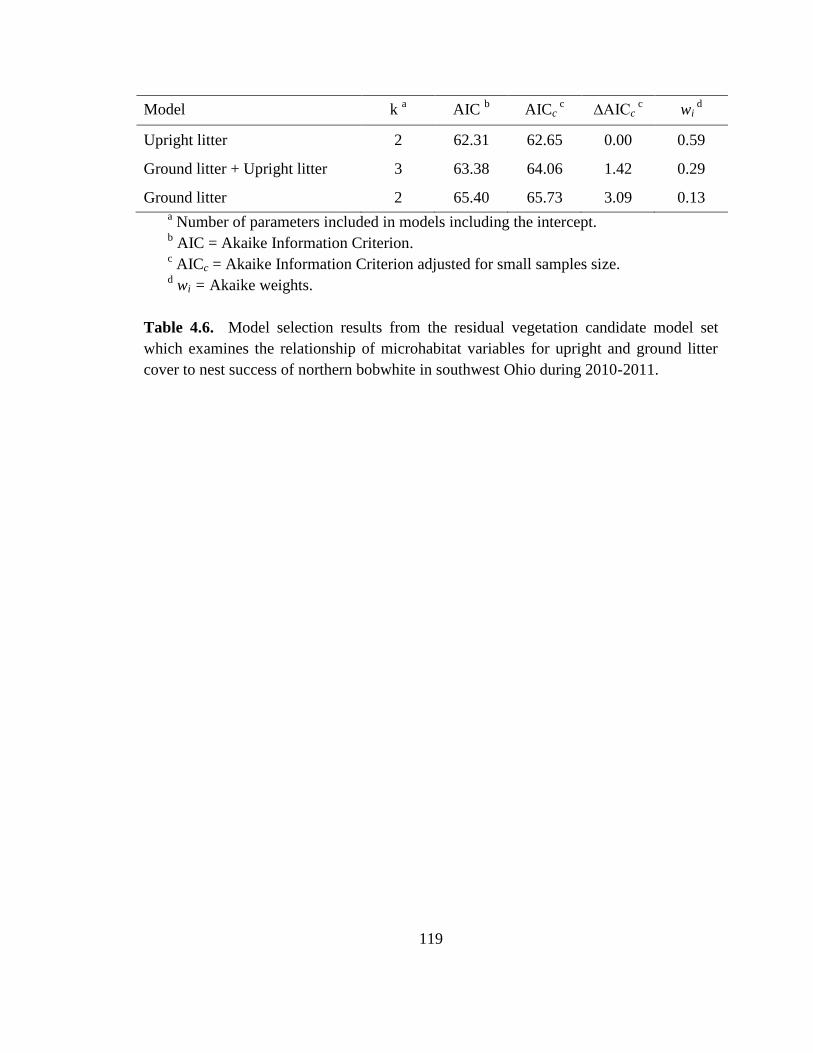
119
Model k a
AIC b
AICc c
∆AICc c
wi d
Upright litter 2 62.31 62.65 0.00 0.59
Ground litter + Upright litter 3 63.38 64.06 1.42 0.29
Ground litter 2 65.40 65.73 3.09 0.13 a Number of parameters included in models including the intercept.
b AIC = Akaike Information Criterion.
c AICc = Akaike Information Criterion adjusted for small samples size.
d wi = Akaike weights.
Table 4.6. Model selection results from the residual vegetation candidate model set
which examines the relationship of microhabitat variables for upright and ground litter
cover to nest success of northern bobwhite in southwest Ohio during 2010-2011.
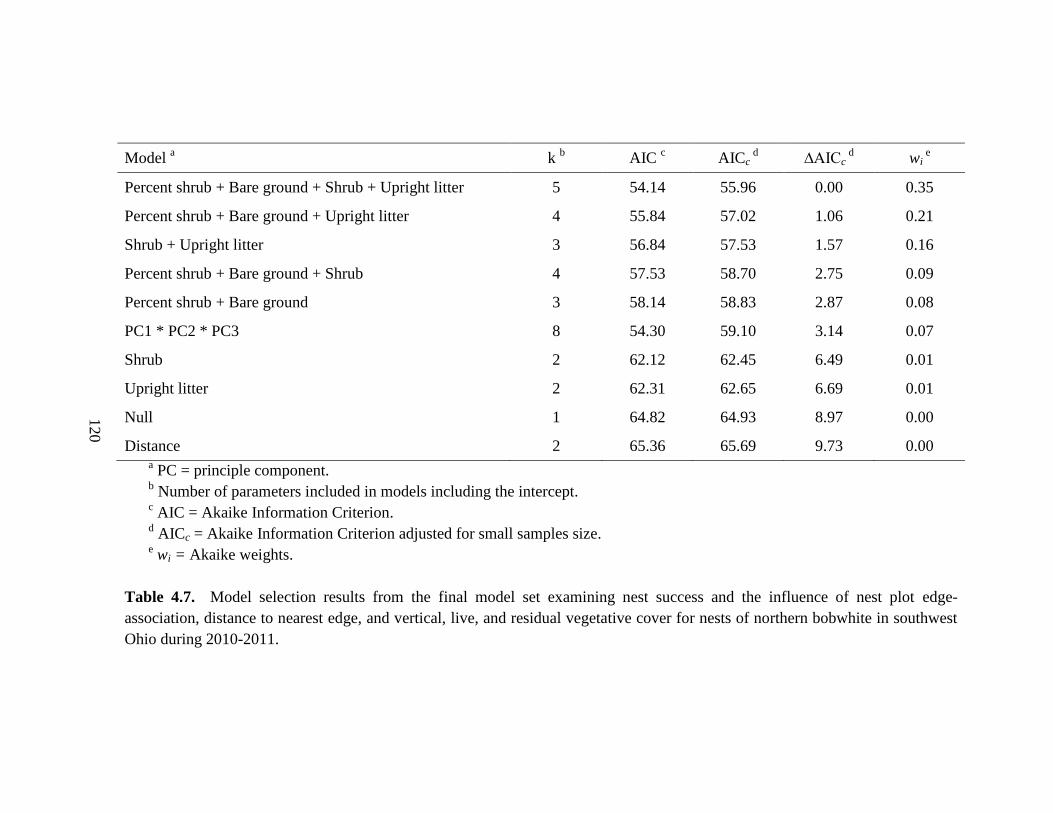
120
Model a
k b
AIC c
AICc d
∆AICc d
wi e
Percent shrub + Bare ground + Shrub + Upright litter 5 54.14 55.96 0.00 0.35
Percent shrub + Bare ground + Upright litter 4 55.84 57.02 1.06 0.21
Shrub + Upright litter 3 56.84 57.53 1.57 0.16
Percent shrub + Bare ground + Shrub 4 57.53 58.70 2.75 0.09
Percent shrub + Bare ground 3 58.14 58.83 2.87 0.08
PC1 * PC2 * PC3 8 54.30 59.10 3.14 0.07
Shrub 2 62.12 62.45 6.49 0.01
Upright litter 2 62.31 62.65 6.69 0.01
Null 1 64.82 64.93 8.97 0.00
Distance 2 65.36 65.69 9.73 0.00 a PC = principle component.
b Number of parameters included in models including the intercept.
c AIC = Akaike Information Criterion.
d AICc = Akaike Information Criterion adjusted for small samples size.
e wi = Akaike weights.
Table 4.7. Model selection results from the final model set examining nest success and the influence of nest plot edge-
association, distance to nearest edge, and vertical, live, and residual vegetative cover for nests of northern bobwhite in southwest
Ohio during 2010-2011.
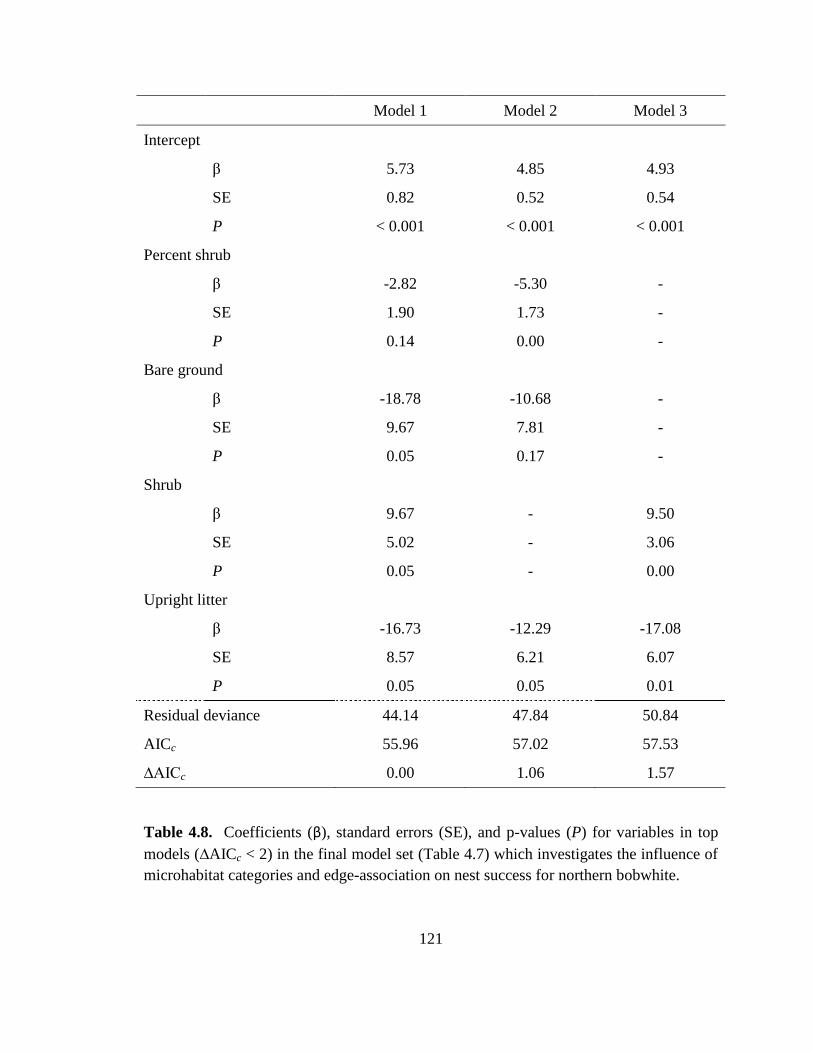
121
Model 1 Model 2 Model 3
Intercept
β 5.73 4.85 4.93
SE 0.82 0.52 0.54
P < 0.001 < 0.001 < 0.001
Percent shrub
β -2.82 -5.30 -
SE 1.90 1.73 -
P 0.14 0.00 -
Bare ground
β -18.78 -10.68 -
SE 9.67 7.81 -
P 0.05 0.17 -
Shrub
β 9.67 - 9.50
SE 5.02 - 3.06
P 0.05 - 0.00
Upright litter
β -16.73 -12.29 -17.08
SE 8.57 6.21 6.07
P 0.05 0.05 0.01
Residual deviance 44.14 47.84 50.84
AICc 55.96 57.02 57.53
∆AICc 0.00 1.06 1.57
Table 4.8. Coefficients (β), standard errors (SE), and p-values (P) for variables in top
models (∆AICc < 2) in the final model set (Table 4.7) which investigates the influence of
microhabitat categories and edge-association on nest success for northern bobwhite.

122
Figure 4.1. Vegetation measurement plot used for evaluating microhabitat at northern
bobwhite nests in southwest Ohio during 2010-2011. Transects were oriented parallel
and perpendicular to the nearest habitat edge.
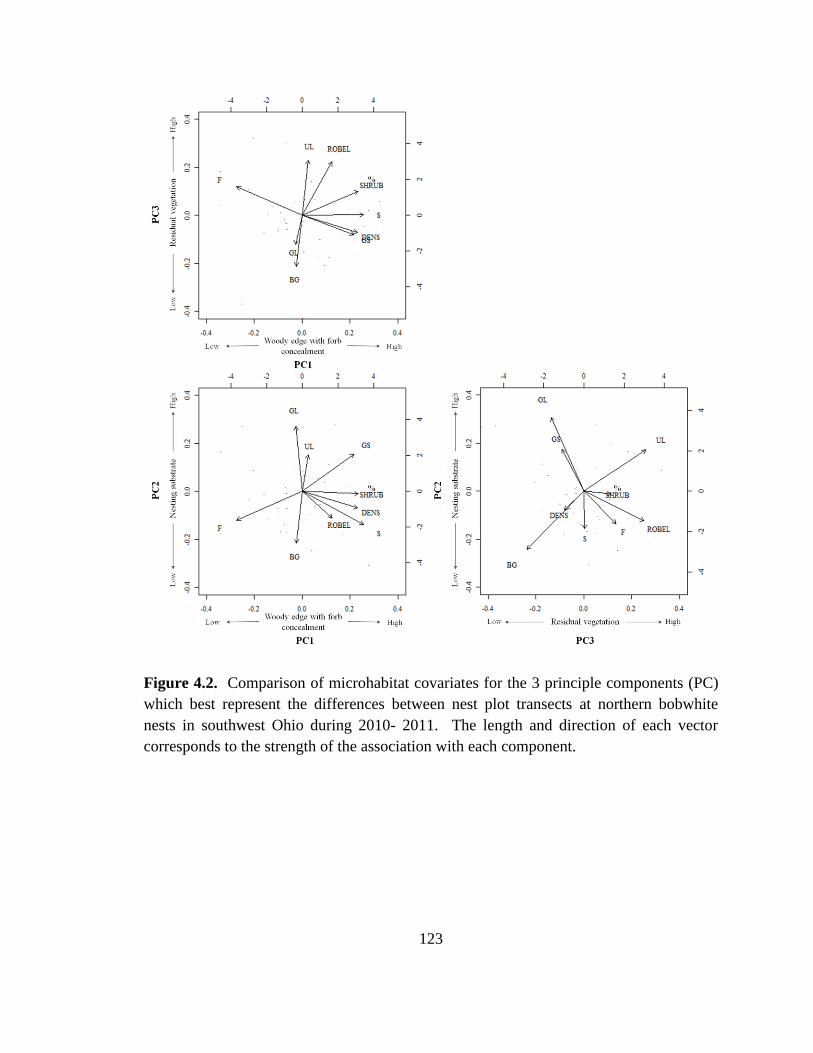
123
Figure 4.2. Comparison of microhabitat covariates for the 3 principle components (PC)
which best represent the differences between nest plot transects at northern bobwhite
nests in southwest Ohio during 2010- 2011. The length and direction of each vector
corresponds to the strength of the association with each component.

124
Figure 4.3. Two-dimensional scatterplots of the 3 principle components (PC) which best
represent the differences between nest plot transects at northern bobwhite nests in
southwest Ohio during 2010- 2011. Scatterplots correspond to the sides of the three-
dimensional scatterplot in Figure 4.4.

125
Figure 4.4. Three-dimensional scatterplot of the 3 principle components (PC) which best
represent the differences between nest plot transects at northern bobwhites in southwest
Ohio during 2010-2011.
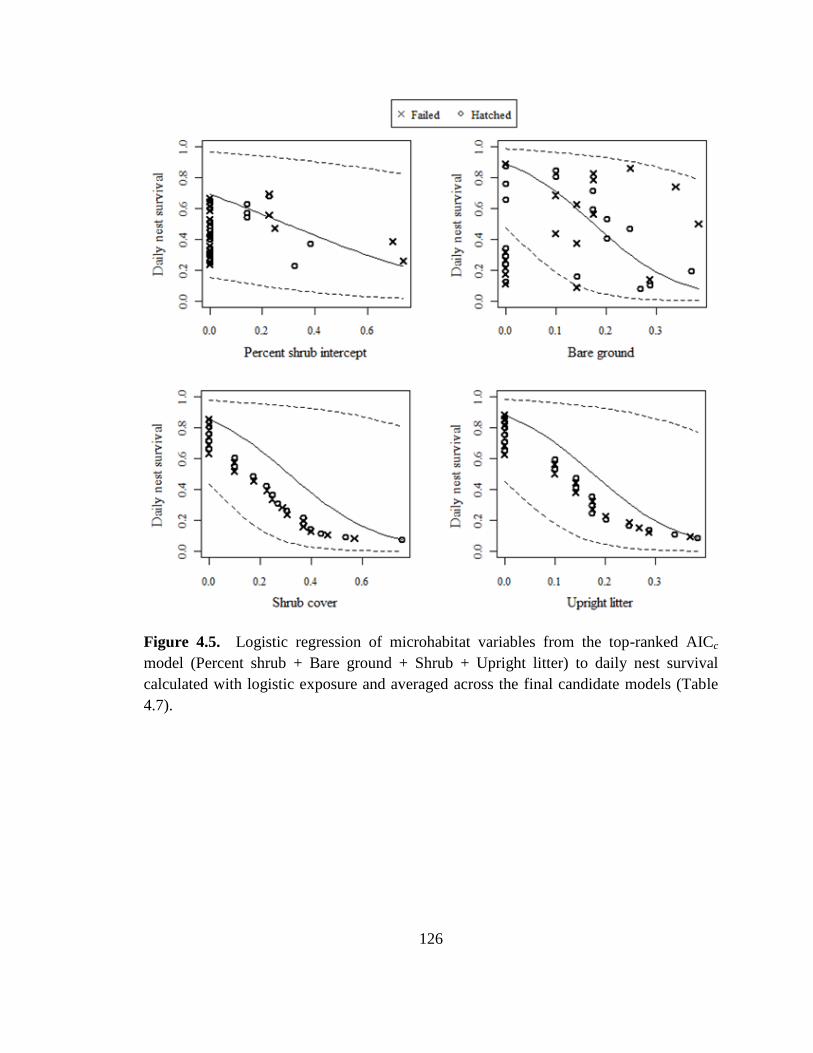
126
Figure 4.5. Logistic regression of microhabitat variables from the top-ranked AICc
model (Percent shrub + Bare ground + Shrub + Upright litter) to daily nest survival
calculated with logistic exposure and averaged across the final candidate models (Table
4.7).
127
LITERATURE CITED
Askins, R. A. 2001. Sustaining biological diversity in early successional communities:
the challenge of managing unpopular habitats. Wildlife Society Bulletin 29:407-
412.
Atwood, T. C., H. P. Weeks, and T. M. Gehring. 2004. Spatial ecology of coyotes along a
suburban-to-rural gradient. Journal of Wildlife Management 68:1000-1009.
Barnes, T. G., L. A. Madison, J. D. Sole, and M. J. Lacki. 1995. An assessment of habitat
quality for northern bobwhite in tall fescue-dominated fields. Wildlife Society
Bulletin 23:231-237.
Brennan, L. A. 1991. How can we reverse the northern bobwhite population decline?
Wildlife Society Bulletin 19:544-555.
Burnham, K. P., and D. R. Anderson. 2002. Model selection and multimodel inference: a
practical information-theoretic approach. 2nd edition. Springer, New York, New
York, USA.
Chamberlain, M. J., L. M. Conner, B. D. Leopold, and K. M. Hodges. 2003. Space use
and multi-scale habitat selection of adult raccoons in central Mississippi. Journal
of Wildlife Management 67:334-340.
Collins, B. M., C. K. Williams, and P. M. Castelli. 2009. Reproduction and microhabitat
selection in a sharply declining northern bobwhite population. Wilson Journal of
Ornithology 121:688-695.
Daubenmire, R. 1959. A canopy-coverage method of vegetational analysis. Northwest
Science 33:43-64.
Everitt, B. S. 2005. An R and S-plus companion to multivariate analysis. Springer-
Verlag, London, UK.
Fies, M. L., and K. M. Puckett. 2000. Depredation patterns of northern bobwhite nest
predators in Virginia. Pages 96-102 in L. A. Brennan, W. E. Palmer, L. W.
128
Burger, Jr., and T. Pruden, eds. Quail IV: Proceedings of the Fourth National
Quail Symposium. Tall Timbers Research Station, Tallahassee, Florida, USA.
Fisher, R. J., and S. K. Davis. 2010. From Wiens to Robel: a review of grassland-bird
habitat selection. Journal of Wildlife Management 74:265-273.
Gates, R. J., A. K. Janke, M. R. Liberati, and M. J. Wiley. 2012. Population ecology and
habitat relationships of northern bobwhite in southwestern Ohio. Proceedings of
the National Quail Symposium 7: in press.
Grant, T. A., E. Madden, and G. B. Berkey. 2004. Tree and shrub invasion in northern
mixed-grass prairie: implications for breeding grassland birds. Wildlife Society
Bulletin 32:807-818.
Greenfield, K. C., L. W. Burger, M. J. Chamberlain, and E. W. Kurzejeski. 2002.
Vegetation management practices on Conservation Reserve Program fields to
improve northern bobwhite habitat quality. Wildlife Society Bulletin 30:527-538.
Guthery, F. S. 2000. On bobwhites. 1st edition. Texas A&M University Press, College
Station, Texas, USA.
Guthery, F. S. 1997. A philosophy of habitat management for northern bobwhites.
Journal of Wildlife Management 61:291-301.
Harper, C. A. 2007. Strategies for managing early succession habitat for wildlife. Weed
Technology 21:932-937.
Hernández, F., and F. S. Guthery. 2012. Beef, brush, and bobwhites: quail management
in cattle country. Texas A&M University Press, College Station.
Hiller, T. L., F. S. Guthery, A. R. Rybak, S. D. Fuhlendorf, S. G. Smith, W. H. Puckett,
Jr., and R. A. Baker. 2007. Management implications of cover selection data:
northern bobwhite example. Journal of Wildlife Management 71:195-201.
Homer, C., C. Huang, C. Yang, B. Wylie, and M. Coan. 2004. Development of a 2001
national land-cover database for the United States. Photogrammetric Engineering
and Remote Sensing 70:829-840.
129
Horn, D. J., M. L. Phillips, R. R. Koford, W. R. Clark, M. A. Sovada, and R. J.
Greenwood. 2005. Landscape composition, patch size, and distance to edges:
interactions affecting duck reproductive success. Ecological Applications
15:1367-1376.
Ibanez-Alamo, J. D., and M. Soler. 2012. Predator-induced female behavior in the
absence of male incubation feeding: an experimental study. Behavioral Ecology
and Sociobiology 66:1067-1073.
Janke, A. K. 2011. Survival and habitat use of non-breeding northern bobwhites on
private lands in Ohio. Thesis, The Ohio State University, Columbus, Ohio, USA.
Jolliffe, I. T. 1972. Discarding variables in a principle component analysis. I: artificial
data. Applied Statistics 21:160-173.
Kaiser, H. 1958. The varimax criterion for analytic rotation in factor analysis.
Psychometrika 23:187-200.
Kay, B. J., L. E. Twigg, T. J. Korn, and H. I. Nicol. 1994. The use of artificial perches to
increase predation on house mice (Mus domesticus) by raptors. Wildlife Research
21:95-106.
Klug, P. E., S. L. Jackrel, and K. A. With. 2010. Linking snake habitat use to nest
predation risk in grassland birds: the dangers of shrub cover. Oecologia 162:803-
813.
Larivière, S. 2003. Edge effects, predator movements, and the travel-lane paradox.
Wildlife Society Bulletin 31:315-320.
Larivière, S. 1999. Reasons why predators cannot be inferred from nest remains. The
Condor 101:718-721.
Lemmon, P. E. 1956. A spherical densiometer for estimating forest overstory density.
Forest Science 2:314-320.
Lohr, M., B. M. Collins, P. M. Castelli, and C. K. Williams. 2011. Life on the edge:
northern bobwhite ecology at the northern periphery of their range. Journal of
Wildlife Management 75:52-60.
130
Lusk, J. J., S. G. Smith, S. D. Fuhlendorf, and F. S. Guthery. 2006. Factors influencing
northern bobwhite nest-site selection and fate. Journal of Wildlife Management
70:564-571.
Mankin, P. C., and R. E. Warner. 1992. Vulnerability of ground nests to predation on an
agricultural habitat island in east-central Illinois. American Midland Naturalist
128:281-291.
McCoy, T. D., E. W. Kurzejeski, L. W. Burger, and M. R. Ryan. 2001. Effects of
conservation practice, mowing, and temporal changes on vegetation structure on
CRP fields in northern Missouri. Wildlife Society Bulletin 29:979-987.
McKee, G. W., M. R. Ryan, and L. M. Mechlin. 1998. Predicting greater prairie-chicken
nest success from vegetation and landscape characteristics. Journal of Wildlife
Management 62:314-321.
National Bobwhite Conservation Initiative. 2011. The national bobwhite conservation
initiative: a range-wide plan for recovering bobwhites. in W. E. Palmer, T. M.
Terhune, and D. F. McKenzie, eds. National Bobwhite Technical Committee
Publication, ver 2.0. Knoxville, Tennessee, USA.
National Climate Data Center [NCDC]. 2011. Quality Controlled Local Climatological
Data. Hillsboro, Ohio, USA. <http://www.ncdc.noaa.gov/oa/ncdc/html>.
Accessed Dec 2011.
Negus, L. P., C. A. Davis, and S. E. Wessel. 2010. Avian response to mid-contract
management of Conservation Reserve Program fields. American Midland
Naturalist 164:296-310.
Ohio Division of Geologic Survey. 1998. Physiographic regions of Ohio. Ohio
Department of Natural Resources. Report page-size map with text, 2p., scale
1:2,100,000.
Ohio Division of Soil and Water Resources [ODSWR]. 2012. Monthly Water Inventory
Report for Ohio, Apr-Sept 2010-2011. Ohio Department of Natural Resources.
Columbus, Ohio, USA. <http://www.ohiodnr.gov/tabid/4191/Default.aspx>.
Accessed Nov 2012.

131
Osborne, D. C., D. W. Sparling, and R. L. Hopkins, II. 2012. Influence of conservation
reserve program mid-contract management and landscape composition on
northern bobwhite in tall fescue monocultures. Journal of Wildlife Management
76:566-574.
Paton, P. W. C. 1994. The effect of edge on avian nest success: how strong is the
evidence? Conservation Biology 8:17-26.
Perlut, N. G., A. M. Strong, T. M. Donovan, and N. J. Buckley. 2006. Grassland
songbirds in a dynamic management landscape: behavioral responses and
management strategies. Ecological Applications 16:2235-2247.
Piper, R. D. 1973. Measurement techniques for herbaceous and shrubby vegetation. New
Mexico State University Press, Las Cruces, New Mexico, USA.
Potter, L. M., D. L. Otis, and T. R. Bogenschutz. 2011. Nest success of northern
bobwhite on managed and unmanaged landscapes in southeast Iowa. Journal of
Wildlife Management 75:46-51.
R Development Core Team. 2012. R: A language and environment for statistical
computing. Vienna, Austria.
Rader, M. J., L. A. Brennan, K. A. Brazil, F. Hernández, and N. J. Silvy. 2011.
Simulating northern bobwhite population responses to nest predation, nesting
habitat, and weather in south Texas. Journal of Wildlife Management 75:61-70.
Rader, M. J., T. W. Teinert, L. A. Brennan, F. Hernández, N. J. Silvy, and X. Ben Wu.
2007. Identifying predators and nest fates of bobwhites in southern Texas. Journal
of Wildlife Management 71:1626-1630.
Renfrew, R. B., and C. A. Ribic. 2003. Grassland passerine nest predators near pasture
edges identified on videotape. The Auk 120:371-383.
Riffell, S., D. Scognamillo, and L. W. Burger. 2008. Effects of the Conservation Reserve
Program on northern bobwhite and grassland birds. Environmental Monitoring
and Assessment 146:309-323.
132
Robel, R. J., J. N. Briggs, A. D. Dayton, and L. C. Hulbert. 1970. Relationships between
visual obstruction measurements and weight of grassland vegetation. Journal of
Range Management 23:295-297.
Roseberry, J. L., and W. D. Klimstra. 1984. Population ecology of the bobwhite.
Southern Illinois University Press, Carbondale, Illinois, USA.
Rosene, W. 1969. The bobwhite quail: its life and management. Rutgers University Press,
New Brunswick, New Jersey, USA.
Sauer, J. R., J. E. Hines, J. E. Fallon, K. L. Pardieck, D. J. Ziolkowski, Jr., and W. A.
Link. 2011. The North American Breeding Bird Survey, summary and analysis
1966-2010, Version 12.07.2011. USGS Patuxent Wildlife Research Center,
Laurel, Maryland, USA.
Shaffer, T. L. 2004. A unified approach to analyzing nest success. The Auk 121:526-540.
Simpson, R. C. 1972. Relationship of postburn intervals to the incidence and success of
bobwhite nesting in southwest Georgia. Pages 150-158 in J. A. Morrison, and J.
C. Lewis, eds. Proceedings of the First National Bobwhite Quail Symposium.
Oklahoma State University, Stillwater, Oklahoma, USA.
Singh, A., T. C. Hines, H. F. Percival, and M. K. Oli. 2010. Does nest-site selection
influence bobwhite nesting success in south Florida? Wildlife Research 37:489-
496.
Spinola, R. M., and R. J. Gates. 2008. Population status and trends of northern bobwhite
(Colinus virginianus) in Ohio: 1984-2004. Ohio Journal of Science 108:26-30.
Stahl, J. T., and M. K. Oli. 2006. Relative importance of avian life history variables to
population growth rate. Ecological Modelling 198:23-39.
Staller, E. L., W. E. Palmer, and J. P. Carroll. 2002. Macrohabitat composition
surrounding successful and depredated northern bobwhite nests. Pages 61-64 in S.
J. DeMaso, W. P. Kuvlesky, Jr., F. Hernández, and M. E. Berger, eds. Quail V:
The Fifth National Quail Symposium. Texas Parks and Wildlife, Austin, Texas,
USA
133
Staller, E. L., W. E. Palmer, J. P. Carroll, R. P. Thornton, and D. C. Sisson. 2005.
Identifying predators at northern bobwhite nests. Journal of Wildlife Management
69:124-132.
Stoddard, H. 1931. The bobwhite quail: its habitats, preservation, and increase. Charles
Scribner's Sons, New York, New York, USA.
Taylor, J. D., II , and L. W. Burger, Jr. . 2000. Habitat use by breeding northern
bobwhites in managed old-field habitats in Mississippi. Pages 7-15 in L. A.
Brennan, W. E. Palmer, L. W. Burger, Jr. , and T. L. Pruden, eds. Quail IV:
Proceedings of the Fourth National Quail Symposium. Tall Timbers Research
Station, Tallahassee, Florida, USA
Taylor, J. S., K. E. Church, and D. H. Rusch. 1999. Microhabitat selection by nesting and
brood-rearing northern bobwhite in Kansas. Journal of Wildlife Management
63:686-694.
Townsend, D. E., Jr., R. E. Masters, R. L. Lochmiller, D. M. Leslie, Jr., S. J. DeMaso,
and A. D. Peoples. 2001. Characteristics of nest sites of northern bobwhites in
western Oklahoma. Journal of Range Management 54:260-264.
Trani, M. K., R. T. Brooks, T. L. Schmidt, V. A. Rudis, and C. M. Gabbard. 2001.
Patterns and trends of early-successional forests in the eatern United States.
Wildlife Society Bulletin 29:413-424.
Walk, J. W., and R. E. Warner. 2000. Grassland management for the conservation of
songbirds in the Midwestern USA. Biological Conservation 94:165-172.
Wiley, M. J. 2012. Multi-scale assessment of usable space for northern bobwhites in
Ohio. Thesis, The Ohio State University, Columbus, Ohio, USA.
Wiley, M. J., R. J. Gates, and A. K. Janke. 2012. Efficacy of targeted mist netting to
capture northern bobwhites during the non-breeding season. Proceedings of the
National Quail Symposium 7: in press.
Williams, C. K., F. S. Guthery, R. D. Applegate, and M. J. Peterson. 2004. The northern
bobwhite decline: scaling our management for the twenty-first century. Wildlife
Society Bulletin 32:861-869.
134
Winter, M., D. H. Johnson, and J. Faaborg. 2000. Evidence for edge effects on multiple
levels in tallgrass prairie. The Condor 102:256-266.
With, K. A. 1994. The hazards of nesting near shrubs for a grassland bird, the McCown's
longspur. The Condor 96:1009-1019.
135
CHAPTER 5 : HOME RANGE AND HABITAT SELECTION OF
NORTHERN BOBWHITES DURING THE BREEDING SEASON IN
SOUTHWEST OHIO
ABSTRACT
Conservation efforts for northern bobwhites in the agricultural Midwest have
generally focused on creating large, contiguous tracts of grassland cover. Local
abundance of breeding bobwhites has increased with grasslands created through the
Conservation Reserve Program but grassland conservation efforts have not resulted in
positive range-wide population growth. Bobwhites rely on grassland habitat for nesting
but it is unclear whether they select grassland cover throughout the breeding season or
only during nesting. Compositional analysis was used to investigate hierarchical habitat
selection by radio-marked bobwhite during the breeding season (May-Sep) in a landscape
dominated by agricultural land-uses in southwest Ohio during 2010-2011. Selection was
compared between years, age-sex cohorts of radio-marked individuals, and among 4
private-land study sites. Mean home range (95% fixed kernel) was 124.9 ± 22.4 ha
(range = 4.3 – 1076.8 ha) and mean core use (50% fixed kernel) area was 33.2 ± 4.14 ha
(range = 0.3 – 205.6 ha). Bobwhites used habitats in proportions that differed from
percent habitat composition of study areas (P ≤ 0.012). Early successional (ES) woody
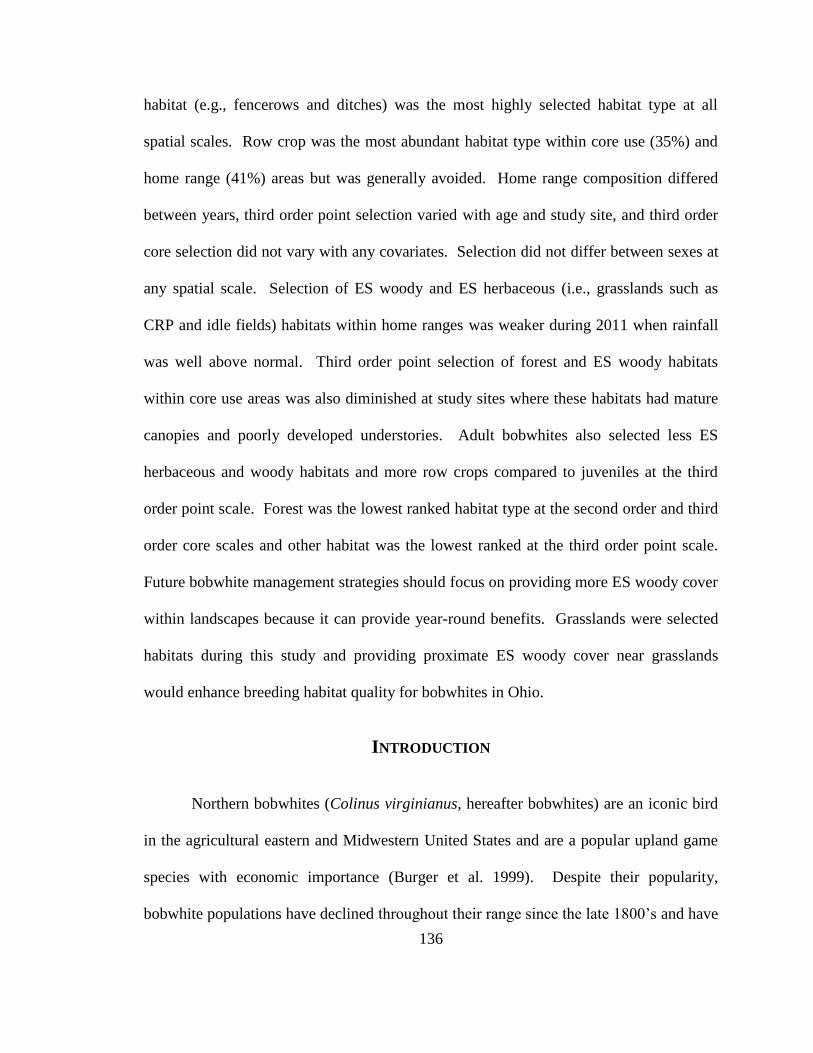
136
habitat (e.g., fencerows and ditches) was the most highly selected habitat type at all
spatial scales. Row crop was the most abundant habitat type within core use (35%) and
home range (41%) areas but was generally avoided. Home range composition differed
between years, third order point selection varied with age and study site, and third order
core selection did not vary with any covariates. Selection did not differ between sexes at
any spatial scale. Selection of ES woody and ES herbaceous (i.e., grasslands such as
CRP and idle fields) habitats within home ranges was weaker during 2011 when rainfall
was well above normal. Third order point selection of forest and ES woody habitats
within core use areas was also diminished at study sites where these habitats had mature
canopies and poorly developed understories. Adult bobwhites also selected less ES
herbaceous and woody habitats and more row crops compared to juveniles at the third
order point scale. Forest was the lowest ranked habitat type at the second order and third
order core scales and other habitat was the lowest ranked at the third order point scale.
Future bobwhite management strategies should focus on providing more ES woody cover
within landscapes because it can provide year-round benefits. Grasslands were selected
habitats during this study and providing proximate ES woody cover near grasslands
would enhance breeding habitat quality for bobwhites in Ohio.
INTRODUCTION
Northern bobwhites (Colinus virginianus, hereafter bobwhites) are an iconic bird
in the agricultural eastern and Midwestern United States and are a popular upland game
species with economic importance (Burger et al. 1999). Despite their popularity,
bobwhite populations have declined throughout their range since the late 1800’s and have
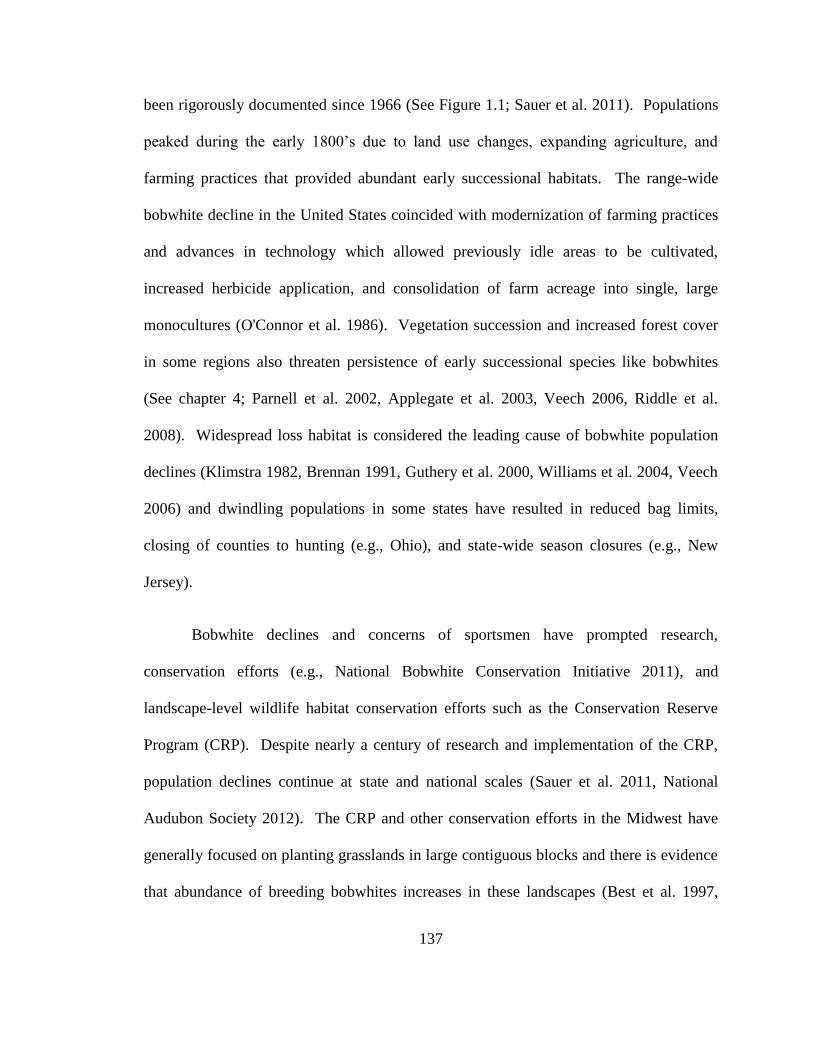
137
been rigorously documented since 1966 (See Figure 1.1; Sauer et al. 2011). Populations
peaked during the early 1800’s due to land use changes, expanding agriculture, and
farming practices that provided abundant early successional habitats. The range-wide
bobwhite decline in the United States coincided with modernization of farming practices
and advances in technology which allowed previously idle areas to be cultivated,
increased herbicide application, and consolidation of farm acreage into single, large
monocultures (O'Connor et al. 1986). Vegetation succession and increased forest cover
in some regions also threaten persistence of early successional species like bobwhites
(See chapter 4; Parnell et al. 2002, Applegate et al. 2003, Veech 2006, Riddle et al.
2008). Widespread loss habitat is considered the leading cause of bobwhite population
declines (Klimstra 1982, Brennan 1991, Guthery et al. 2000, Williams et al. 2004, Veech
2006) and dwindling populations in some states have resulted in reduced bag limits,
closing of counties to hunting (e.g., Ohio), and state-wide season closures (e.g., New
Jersey).
Bobwhite declines and concerns of sportsmen have prompted research,
conservation efforts (e.g., National Bobwhite Conservation Initiative 2011), and
landscape-level wildlife habitat conservation efforts such as the Conservation Reserve
Program (CRP). Despite nearly a century of research and implementation of the CRP,
population declines continue at state and national scales (Sauer et al. 2011, National
Audubon Society 2012). The CRP and other conservation efforts in the Midwest have
generally focused on planting grasslands in large contiguous blocks and there is evidence
that abundance of breeding bobwhites increases in these landscapes (Best et al. 1997,
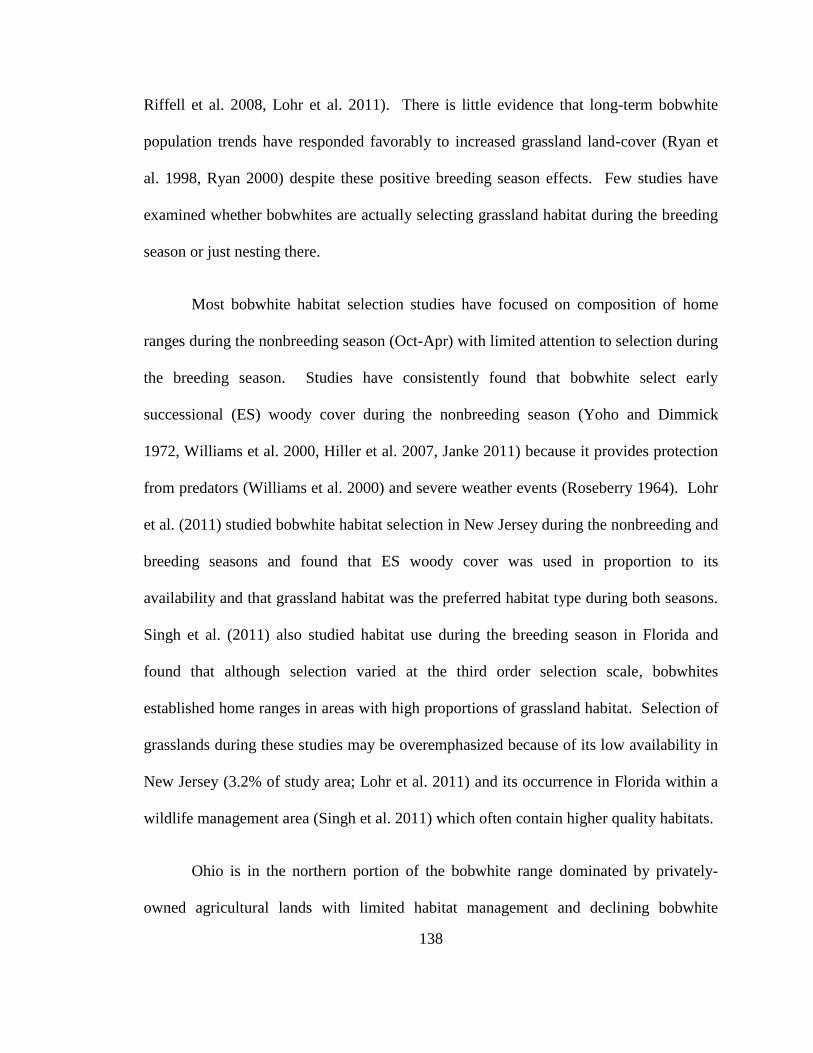
138
Riffell et al. 2008, Lohr et al. 2011). There is little evidence that long-term bobwhite
population trends have responded favorably to increased grassland land-cover (Ryan et
al. 1998, Ryan 2000) despite these positive breeding season effects. Few studies have
examined whether bobwhites are actually selecting grassland habitat during the breeding
season or just nesting there.
Most bobwhite habitat selection studies have focused on composition of home
ranges during the nonbreeding season (Oct-Apr) with limited attention to selection during
the breeding season. Studies have consistently found that bobwhite select early
successional (ES) woody cover during the nonbreeding season (Yoho and Dimmick
1972, Williams et al. 2000, Hiller et al. 2007, Janke 2011) because it provides protection
from predators (Williams et al. 2000) and severe weather events (Roseberry 1964). Lohr
et al. (2011) studied bobwhite habitat selection in New Jersey during the nonbreeding and
breeding seasons and found that ES woody cover was used in proportion to its
availability and that grassland habitat was the preferred habitat type during both seasons.
Singh et al. (2011) also studied habitat use during the breeding season in Florida and
found that although selection varied at the third order selection scale, bobwhites
established home ranges in areas with high proportions of grassland habitat. Selection of
grasslands during these studies may be overemphasized because of its low availability in
New Jersey (3.2% of study area; Lohr et al. 2011) and its occurrence in Florida within a
wildlife management area (Singh et al. 2011) which often contain higher quality habitats.
Ohio is in the northern portion of the bobwhite range dominated by privately-
owned agricultural lands with limited habitat management and declining bobwhite
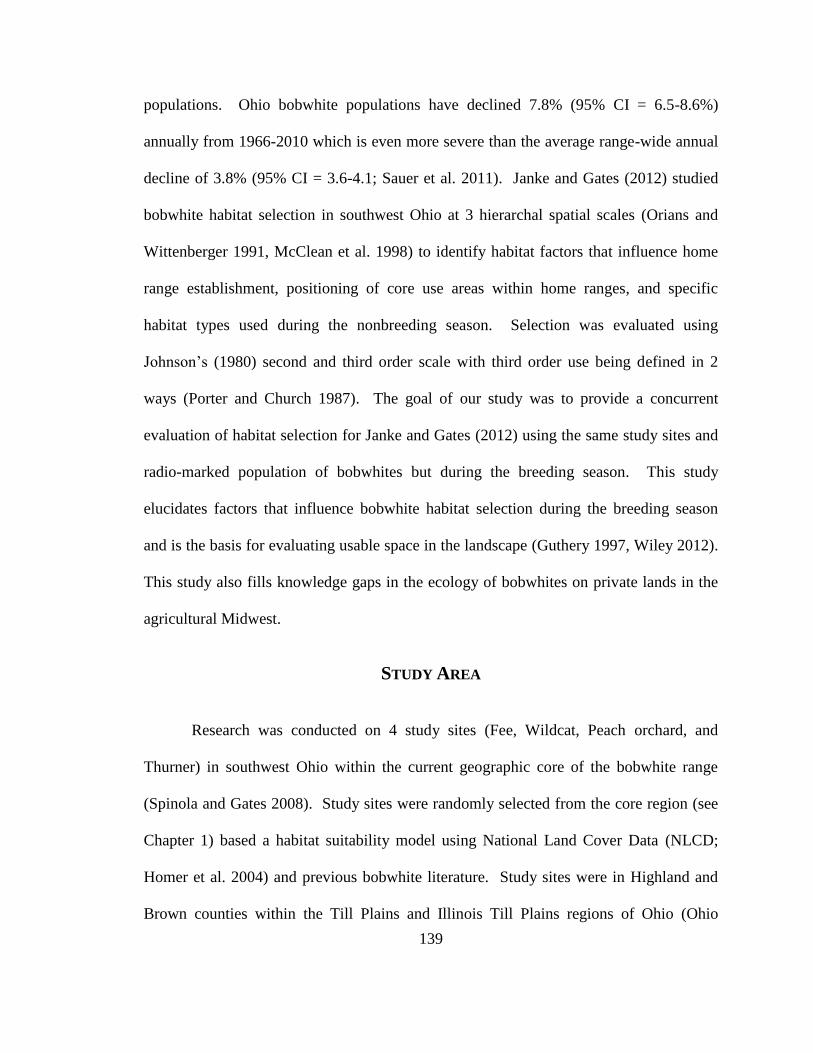
139
populations. Ohio bobwhite populations have declined 7.8% (95% CI = 6.5-8.6%)
annually from 1966-2010 which is even more severe than the average range-wide annual
decline of 3.8% (95% CI = 3.6-4.1; Sauer et al. 2011). Janke and Gates (2012) studied
bobwhite habitat selection in southwest Ohio at 3 hierarchal spatial scales (Orians and
Wittenberger 1991, McClean et al. 1998) to identify habitat factors that influence home
range establishment, positioning of core use areas within home ranges, and specific
habitat types used during the nonbreeding season. Selection was evaluated using
Johnson’s (1980) second and third order scale with third order use being defined in 2
ways (Porter and Church 1987). The goal of our study was to provide a concurrent
evaluation of habitat selection for Janke and Gates (2012) using the same study sites and
radio-marked population of bobwhites but during the breeding season. This study
elucidates factors that influence bobwhite habitat selection during the breeding season
and is the basis for evaluating usable space in the landscape (Guthery 1997, Wiley 2012).
This study also fills knowledge gaps in the ecology of bobwhites on private lands in the
agricultural Midwest.
STUDY AREA
Research was conducted on 4 study sites (Fee, Wildcat, Peach orchard, and
Thurner) in southwest Ohio within the current geographic core of the bobwhite range
(Spinola and Gates 2008). Study sites were randomly selected from the core region (see
Chapter 1) based a habitat suitability model using National Land Cover Data (NLCD;
Homer et al. 2004) and previous bobwhite literature. Study sites were in Highland and
Brown counties within the Till Plains and Illinois Till Plains regions of Ohio (Ohio

140
Division of Geologic Survey 1998) and the Eastern Tall Grass Prairie Bird Conservation
Region of the National Bobwhite Conservation Initiative (National Bobwhite
Conservation Initiative 2011). Glaciation in this region produced a gently undulating
topography with more pronounced hills along the eastern glacial boundary (Ohio
Division of Geologic Survey 1998). The region is mostly rural (6% developed; Homer et
al. 2004) and agriculture is the primary land use (39% row crops, 17% pasture/hay) with
interspersed grassland (3%) and forest (33%).
Land-cover varied among study sites (Figure 5.1) and included 6 general
categories: ES herbaceous, ES woody, pastures and hay fields, row crop, forest, and other
habitats. The Fee site had the highest proportion of row crop agriculture while Peach
orchard was more dominated by forest cover. Land-cover on the Wildcat and Thurner
sites was more evenly divided among row crops, forest, and pasture/hay.
Early successional herbaceous habitats were primarily CRP fields but also
included idle fields, herbaceous fencerows, roadsides, and waterways. Fields enrolled in
the CRP were typically enrolled in Conservation Practice (CP) 1, consisting of cool
season permanent ground cover with low forb diversity and dominated by sod-forming
grasses such as fescue (Festuca spp.). A small proportion of CRP fields were planted in
warm season grasses (CP-2) or permanent wildlife cover (CP-4D) which primarily
consisted of Indian grass (Sorghastrum nutans), big bluestem (Andropogon gerardii), and
switch grass (Panicum virgatum). Forb communities were often monotypic stands of
goldenrod (Solidago spp.) or Queen Anne’s lace (Daucus carota) but warm-season fields
included species such as partridge pea (Chamaecrista fasciculate) and Illinois bundle
141
flower (Desmanthus illinoensis). Idle fields were typically 5-20 years out of row crop,
pasture, or hay production and while they structurally resembled cool season CRP fields
they often had more diverse plant communities. Pastures and hay fields had similar
floristic composition and vegetation structure to ES herbaceous habitats and were grazed
to varying degrees. Early successional woody habitats included fencerows, ditches (< 50
m), and areas with woody successional plants including species such as blackberry
(Rubus fruticosus), black raspberry (R. occidentalis), trumpet creeper (Campsis
radicans), poison ivy (Toxicodendron radicans), and Japanese honeysuckle (Lonicera
japonica).
No-till Soybeans (Glycine max, 47%), corn (Zea mays, 15%), and winter wheat
(Triticum aestivum, 4%) were the principle row crops and contributed 70.2% of the total
cropped acres in Highland County and 61.4% of crop acreage in Brown County (National
Agricultural Statistics Service 2012a). Forest composition varied with topography and
management practices. Dry upland ridges supported communities dominated by
shagbark hickory (Carya ovata), pignut hickory (C. glabra), white oak (Quercus alba),
and red oak (Q. rubra). Lower elevations and depressional areas were dominated by
black walnut (Juglans nigra), green ash (Fraxinus pennsylvanica), American elm (Ulmus
americana), and occasionally pin oak (Quercus palustris). Forests with a history of
grazing or timber harvest had more open canopies and developed understories.
Understories, especially along forest edges, consisted of blackberry, black raspberry, and
multiflora rose (Rosa multifora) and often developed herbaceous components of their
neighboring habitat type during the growing season. The herbaceous component often
142
consisted of agricultural “weeds” such as ragweed (Ambrosia sp.) and pokeberry
(Phytolacca americana). Other habitats included bodies of water, impermeable surfaces
(e.g., roads, parking lots), buildings, and residential areas).
Weather information was obtained from the National Climate Data Center
(NCDC) station in Wilmington, Ohio, USA (Station COOP: 339219) and water inventory
reports by the Ohio Division of Soil and Water Resources (ODSWR). Mean monthly
temperature during April-September, 2010-2011 was 19.7°C (mean minimum = 13.5°C,
mean maximum = 25.9°C; NCDC 2011). Mean monthly temperature during the 2010
breeding season (20.1°C) was higher than in 2011 (19.4°C) but had fewer days of
extreme heat with temperatures exceeding 32.2°C/90°F (NCDC 2011). Both breeding
seasons (2010, n = 23 d; 2011, n = 29 d) had more than twice the annual number of days
with extreme temperatures (mean = 10.6 d; NCDC 2011). Mean precipitation during
spring (Mar–May) and summer (Jun-Aug) was 60.6 cm (NCDC 2011). Precipitation
during the 2010 breeding season (58.8 cm) was slightly lower than normal. The 2011
season had above-normal rainfall amounts (79.6 cm; NCDC 2011) and April and May set
state records (ODSWR 2012). Precipitation during April 2011 was 285% above normal
and was the wettest in the past 129 years and May 2011 was the sixth wettest in state
history (ODSWR 2012).
METHODS
Bobwhites were captured, leg-banded, and radiomarked during October 2009-
September 2011. Captured individuals were weighed, aged, sexed, and tagged with
143
uniquely numbered aluminum leg bands (Size 3 or 3B) with a phone number for band
returns. Individuals > 150 g were outfitted with an Advanced Telemetry Systems (ATS,
Isanti, Minnesota, USA) radio-transmitter (6.6 g) with an 8-hr mortality sensor. All
trapping, handling, and marking procedures followed guidelines approved by The Ohio
State University, Institutional Animal Care and Use Committee (Protocol #2007A0228).
Individuals were radiotracked daily throughout the breeding season (Apr-Sep) by homing
to within ≤ 20m (White and Garrott 1999) with an ATS or Telonics (Impala, Arizona,
USA) receiver and a hand-held, 3-element yagi antenna. Habitat type and coordinates
were recorded each location and documented with handheld Global Positioning System
(GPS) units (Garmin, Olathe, Kansas, USA). Data was later uploaded to ArcGIS
(version 10.0, ESRI, Redlands, CA, USA) and analyzed over digitized, high spatial
resolution (0.305 m) orthophotographs (Ohio Statewide Imagery Program 2008).
Telemetry locations were used to determine home range and habitat use of
bobwhites during the breeding seasons of 2010-2011. Breeding season home ranges
included all radio-telemetry points obtained after spring dispersal and before fall covey
formations (30 Sept). Dispersal start and end dates were identified individually for each
radio-marked bobwhite based on timing of covey break-up, observations of breeding
behavior, and occupation of breeding habitats (see Chapter 2). Covey formation typically
occurs during October (Rosene 1969) so telemetry locations after 30 September were not
included in breeding season home range calculations. Only one telemetry location for a
nest was included in analysis even if the radio-marked individual was located at the nest
during multiple days of incubation.

144
Fixed kernel density estimation (Silverman 1986, Worton 1989) was used to
estimate home ranges during the breeding season. Kernel density estimation (KDE)
consistently performs well and generally provides less biased home range area
estimations when locations are clumped and disjointed (Downs and Horner 2008, Lichti
and Swihart 2011). The KDE method still overestimates home ranges and is sensitive to
the choice of bandwidth or smoothing parameter (Gitzen et al. 2006) but it is less
sensitive to the underlying shape of the point pattern than data driven convex hull
methods (Downs and Horner 2008, Lichti and Swihart 2011). Three smoothing
parameters for home ranges were evaluated: reference bandwidth (Worton 1989), least-
squares cross-validation (LSCV; Lichti and Swihart 2011), and likelihood cross-
validation (LCV; Horne and Garton 2006). Smoothing parameters apply a distance
weighted function to create a continuous surface by smoothing point patterns to represent
utilization distribution (Silverman 1986, Worton 1987;1989). Sample sizes (Seaman et
al. 1999) and choice of smoothing parameter (Worton 1995) can influence results. The
amount of smoothing is controlled by a bandwidth that maximizes home range precision
while minimizing bias (Boulanger and White 1990). Density estimates using LCV
bandwidths were the most appropriate for representing variation in location patterns
between individual bobwhites during this study. Kullback-Leibler distances between the
true and estimated distributions are minimized with LCV which produces estimates with
better fit and less variability (Horne and Garton 2006). Only radio-marked bobwhites
with > 30 telemetry locations were included in home range analysis and most individuals
had ≥ 50 locations which is preferred (Seaman et al. 1999, Horne and Garton 2006).
145
The LCV bandwidths for each radio-marked bobwhite were generated using
Animal Space Use software (Horne and Garton 2009). Home ranges (95% utilization
distribution [UD]) and core use areas (50% UD) for each individual (White and Garrott
1999) were estimated using LCV bandwidths and the kernelUD function in the
ADEHABITAT package (Calenge 2006) in Program R (Program R 2012). The effect of
sample sizes on core and home range areas was compared with linear regression.
Differences in core use and home range areas were investigated with multiple analyses of
variance (MANOVA) between study sites, years, age, and sex were analyzed.
Compositional analysis was used to evaluate bobwhite habitat selection and
preference (Aebischer et al. 1993). Evidence for habitat selection or avoidance was
based on differences in proportional composition of habitat between the use and
availability of a habitat type in the landscape (Manly et al. 2002). Second-order habitat
selection (Johnson 1980) was tested by defining availability as the composition of the
breeding season study site areas and use as the composition of the home ranges for each
individual. The area of available habitat at each study site was defined by the 95% UD of
radio-marked bobwhite locations during the breeding season pooled between years. Third
order selection (Johnson 1980) was evaluated at 2 scales (Porter and Church 1987) to allow
comparison of focused activities (core area) and use of specific habitats within core use areas.
Habitat used within core use areas (hereafter third order core) and specific locations of the
radio-marked individual (hereafter third order point) were compared to available habitat
within home ranges.
146
Wilk’s lambda (λ) was used to test habitat selection at each scale and t-tests were
used to form ranking matrices of preferred habitats (Aebischer et al. 1993). Selection of a
habitat type was considered significant when the selection or avoidance of that habitat
deviated from random use (α=0.05; Aebischer et al. 1993). Habitat types were ranked from
high to low based on their relative preference. Standardized selection ratios were calculated
to graphically characterize habitat preference among sites and selection scales (Manly et al.
2002). Selection ratios are calculated as the proportion of the habitat type used relatively to
its availability in the home range and are then standardized by dividing the mean ratio in each
habitat type by the sum of all the ratios for that scale (Manly et al. 2002). Values of zero
were replaced with 0.3% (Bingham and Brennan 2004) and observations with any habitat
availabilities of 0 were excluded from the mean selection ratio calculations. Zero values at
the third core used scale were replaced with 0.1% so they were below the minimum habitat
value documented at that scale. Habitat preference was evaluated by comparing standardized
selection ratios for each habitat type to the inverse of the total number of habitat types (i.e.
1/5=0.2). Larger values indicated that a habitat type was preferentially selected and lower
values indicated avoidance.
RESULTS
We monitored 103 radio-marked bobwhite during this study of which 52 (2010 n
= 26, 2011 n = 26) had ≥ 30 telemetry locations and were included in analysis. Study site
area based on the 95% utilization distribution encompassing all radiolocations was
highest at Fee (4,225 ha), followed by Thurner (698 ha), Wildcat (697 ha), and Peach
Orchard (386 ha). Bobwhites had a mean of 61.1 locations (range = 31 - 104) available
147
for calculating individual fixed kernel utilization distributions. The mean core area (50%
UD) for all radio-marked individuals was 33.2 ± 4.14 ha (range = 0.3 – 205.6 ha) and the
mean home range (95% UD) was 124.9 ± 22.4 ha (range = 4.3 – 1076.8 ha; Table 5.1).
Sample size did not influence core use (P = 0.153, r2 = .0212) or home range (P = 0.149,
r2 = 0.022) area estimates.
There was no evidence that habitat composition of core use (λ = 0.87, F = 1.75, df
= 4, P = 0.16) and home range areas (λ = 0.87, F = 1.63, df = 4, P = 0.18) differed by sex,
age, study site, or study year. Male bobwhites used larger areas (50%UD = 29.4 ± 16.7
ha, 95%UD = 156.6 ± 88.8 ha) than females (50%UD = 18.1 ± 6.0 ha, 95%UD = 97.4 ±
36.4 ha) and juvenile core use and home range areas (50%UD = 24.2 ± 14.4 ha, 95%UD
= 133.1 ± 78.0 ha) were larger than adults’ (50% UD = 22.4 ± 7.6 ha, 95% UD = 115.7 ±
40.9 ha; Table 5.1). Individuals had larger home ranges during the 2011 breeding season
(50%UD = 26.6 ± 15.5 ha, 95%UD = 141.4 ± 81.4 ha) compared to 2010 (50%UD = 20.1
± 7.0 ha, 95%UD = 108.5± 42.8 ha; Table 5.1). Bobwhites on the Fee site had the largest
core use and home range areas among study sites (50%UD = 31.2 ± 17.2 ha, 95%UD =
169.1± 93.2 ha; Table 5.1). The next largest core and home range areas were
documented at Thurner (50% UD = 23.1 ± 10.8 ha, 95%UD = 130.1 ± 47.1 ha), followed
by Peach Orchard (50%UD = 15.8 ± 3.8 ha, 95%UD = 75.3 ± 11.7 ha), and Wildcat
(50%UD = 13.1 ± 4.7 ha, 95%UD = 64.4 ± 26.1 ha; Table 5.1). Mean core use and home
range areas at Fee were likely biased due to one radio-marked male with a particularly
large location distribution and while still larger, the Fee UD more closely resembled
those at the other study sites when that individual was excluded (50%UD = 23.6 ± 8.5 ha,

148
95%UD = 128.9 ± 49.2 ha). Row crop was the most abundant habitat type in core
(34.9%) and home range (HR) areas (40.7%; Table 5.2). The next most abundant habitat
types were ES herbaceous (core = 27.8%, HR = 22.3%) and pasture/hay (core = 15.9%,
HR = 14.7%; Table 5.2).
Habitat use was non-random at the second order (λ = 0.449, P = 0.002), third
order core (λ = 0.731, P = 0.012), and third order point spatial scales (λ = 0.127, P <
0.001). The 3 spatial scales did not differ between sexes of radio-marked individuals
(second order P = 0.770; third order core P = 0.442; third order point P = 0.524).
Selection differed between study years at the second order (P < 0.001) but not the third
order core (P = 0.888) or point scales (P = 0.777). Second order selection ratios for ES
herbaceous (F = 27.6, p < 0.001) and ES woody (F = 4.50, p = 0.039) habitats decreased
from the 2010 to the 2011 breeding season (Figure 5.2). Selection differed between study
sites and age class at the third order point spatial scale (site P = 0.039; age P = 0.050) but
not the second order (site P = 0.719; age P = 0.134) or third order core (site P = 0.318;
age P = 0.470) scales. The third order point scale differed among sites based on selection
ES woody (F = 5.25, p = 0.003) and forest (F = 2.82, p = 0.049) habitats. Bobwhites at
Peach orchard selected less ES woody (p < 0.001) and forest (p = 0.017) habitats than
individuals at the other study sites (Figure 5.6). Habitat selection also varied between
ages of radio-marked individuals at the third order point scale because juvenile bobwhites
selected more ES herbaceous (P = 0.013) and ES woody (P = 0.015) habitats than adults
(Figure 5.7).

149
Forest habitat was the lowest ranked cover type and was avoided relative to the
other 5 habitat types at the second order and third order core scales (Tables 5.3 and 5.4).
Other habitat was the least selected habitat type at the third order point selection scale
(Tables 5.5 and 5.6). Early successional woody habitat was selected over all other habitat
types at every scale except during 2010 at the second order selection scale when it was
selected second to ES herbaceous habitats (Tables 5.3-5.6). Manly selection ratios were
consistent with ranking matrices at each spatial scale (Figures 5.8-5.10). Row crops and
pasture/hay habitats were generally used in proportion to their availability at the second
order and third order core scales but avoided during third order point selection (Figures
5.8- 5.10). This was true except when comparing third order point selection based on age
when row crop habitat was used in proportion to its availability by both adults and
juveniles (Figure 5.10).
DISCUSSION
Hierarchal composition analysis revealed that radio-marked bobwhites used
habitat non-randomly at 3 levels of selection in southwest Ohio. Selection of home
ranges at the second order spatial scale differed between study years while selection of
core use areas within the home ranges at the third order core scale was consistent
throughout the study. Third order point selection of habitats within core use areas varied
among study sites and age class. Mean home range during this study (124.9 ha) was
larger than previous bobwhite breeding season studies (Liu et al. 2002, Terhune et al.
2006, Singh et al. 2011) and substantially larger than covey home ranges during the
nonbreeding season (Bell et al. 1985, Madison et al. 2000, Hiller et al. 2007, Lohr et al.

150
2011, Janke and Gates 2012). Larger home ranges may have resulted from low habitat
quality (Bell et al. 1985, Madison et al. 2000, Lohr et al. 2011).
The primary difference in home range composition between years was the
selection of ES herbaceous and woody habitats (Figure 5.5). Home ranges during the
2010 study year were established in areas with more ES herbaceous and woody habitats
then during 2011 (Figure 5.8). Early successional herbaceous habitat was the most
selected habitat type in 2010 home ranges but was avoided during establishment of 2011
home ranges and although selection for ES woody habitat also declined it was still
preferred relative to the other 4 habitat types during 2011 (Figure 5.8). The decreased
selection and avoidance of ES habitats was likely related to high rainfall during the 2011
breeding season which supported dense vegetation growth (Sala et al. 1988).
Precipitation improves bobwhite habitat in more arid regions (Hernández et al. 2005) but
excess amounts in the Midwest may spur primary productivity and make vegetation in
early successional habitats impassible. Study sites were dominated by cool-season
grasslands (see Table 1.1) which already have low value for bobwhites due to their dense,
sod-forming growth structure (Klimstra and Roseberry 1975, Barnes et al. 1995) and may
lose further value with rain-induced succession (Sparling and Osborne 2009). Forests
were likely avoided within home ranges (Figure 5.8) because they lack ES understories to
support bobwhite use (Yoho and Dimmick 1972, Parnell et al. 2002, Cook 2004, Riddle
et al. 2008, Wiley 2012).
Composition of core use areas did not differ during this study despite differences
in home range composition between years. Bobwhites selected core use areas with more
151
ES woody and herbaceous habitat, they avoided forests, and included row crops,
pasture/hay, and other habitat in proportion to their availability (Table 5.4, Figure 5.9).
The consistency of core area composition indicates that habitat composition at this spatial
scale fulfilled basic life-history requirements for bobwhites regardless of year, study site,
or the age or sex. Bobwhite preference for ES herbaceous habitat during the breeding
season is not surprising given its importance for nesting (See Chapter 3; Lohr et al.
2011). The value of woody cover for bobwhites during the nonbreeding season has been
recognized (Yoho and Dimmick 1972, Roseberry and Klimstra 1984, Hiller et al. 2007,
Janke and Gates 2012) but its importance during the breeding season may be
underappreciated. Woody vegetation provides protection and is thermodynamically
advantageous throughout the year (Guthery et al. 2005) and can also provide soft-mast
food resources (e.g. Rubus spp., poison ivy) during the breeding season (Wood et al.
1986). The growth structure of woody vegetation can also provide microhabitat (i.e.
aerial cover and bare understory) preferred by brood-tending adults (Collins et al. 2009)
and enables bobwhite chicks to access food resources (Doxon and Carroll 2010).
Bobwhite preference for ES woody habitat was particularly evident at the third order
point spatial scale where it was most strongly selected relative to the other 5 habitat types
(Figures 5.10 and 5.11).
Third order point habitat selection varied among study sites (Table 5.5) and ages
of radio-marked individuals (Table 5.6). Peach orchard was the most distinct study site
because forest habitat was strongly avoided despite its availability (Figure 5.1) and
selection of early succession woody habitat was lower than the other 3 sites (Figure 5.10).
152
Bobwhites are known to utilize forest habitats but those at Peach orchard and the other
study sites were mostly characterized by mature overstories that do not support
understory vegetation preferred by bobwhites (Wiley 2012). Forest habitat was used in
proportion to its availability or it was avoided (Figure 5.10) despite its higher ranking at
the third order point scale (Table 5.5 and 5.6). Selection for ES woody habitats at Peach
orchard may also be low due to succession of woody vegetation because this site had the
highest availability of ES woody habitat but it often consisted of ditches and riparian
corridors with mature canopies and limited understories. Juvenile and adult bobwhites
also varied in their habitat use at the third order point scale based on their selection of ES
herbaceous and woody habitats. Selection of ES woody habitat was higher for adults but
the overwhelming preference by both age classes for this habitat type makes the
difference ecologically negligible. It is unclear why adult bobwhites’ second ranked
habitat selection was for row crops while juveniles preferred ES herbaceous habitats
(Figure 5.11). Row crop habitat was highly avoided by coveys at the third order point
scale during the nonbreeding season (Janke and Gates 2012) so perhaps juveniles
continued to view row crop habitats as deleterious whereas adults had found them
advantageous. Soybean fields in particular seemed to have the bare ground and vertical
concealment (M.R. Liberati personal observation) that breeding bobwhites prefer (Taylor
et al. 1999a, Collins et al. 2009).
MANAGEMENT IMPLICATIONS
Bobwhites use a variety of habitat types during the breeding season but primarily
center their activities in ES woody and herbaceous habitats while avoiding forest and
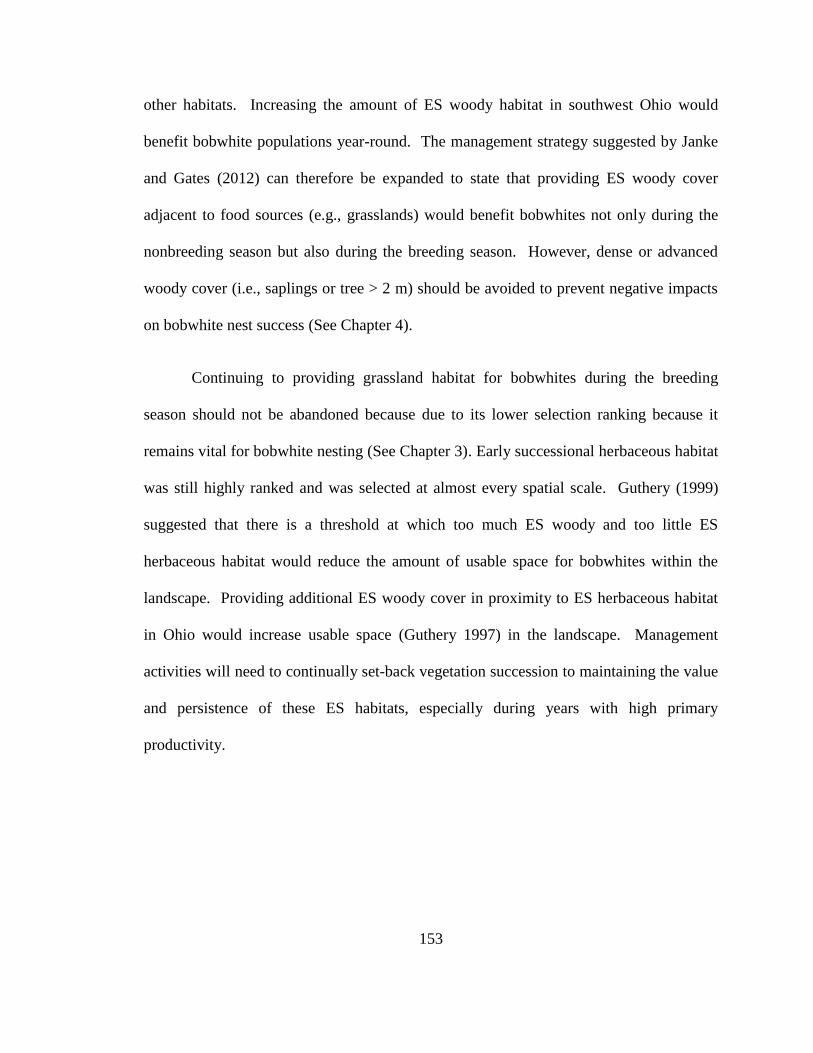
153
other habitats. Increasing the amount of ES woody habitat in southwest Ohio would
benefit bobwhite populations year-round. The management strategy suggested by Janke
and Gates (2012) can therefore be expanded to state that providing ES woody cover
adjacent to food sources (e.g., grasslands) would benefit bobwhites not only during the
nonbreeding season but also during the breeding season. However, dense or advanced
woody cover (i.e., saplings or tree > 2 m) should be avoided to prevent negative impacts
on bobwhite nest success (See Chapter 4).
Continuing to providing grassland habitat for bobwhites during the breeding
season should not be abandoned because due to its lower selection ranking because it
remains vital for bobwhite nesting (See Chapter 3). Early successional herbaceous habitat
was still highly ranked and was selected at almost every spatial scale. Guthery (1999)
suggested that there is a threshold at which too much ES woody and too little ES
herbaceous habitat would reduce the amount of usable space for bobwhites within the
landscape. Providing additional ES woody cover in proximity to ES herbaceous habitat
in Ohio would increase usable space (Guthery 1997) in the landscape. Management
activities will need to continually set-back vegetation succession to maintaining the value
and persistence of these ES habitats, especially during years with high primary
productivity.
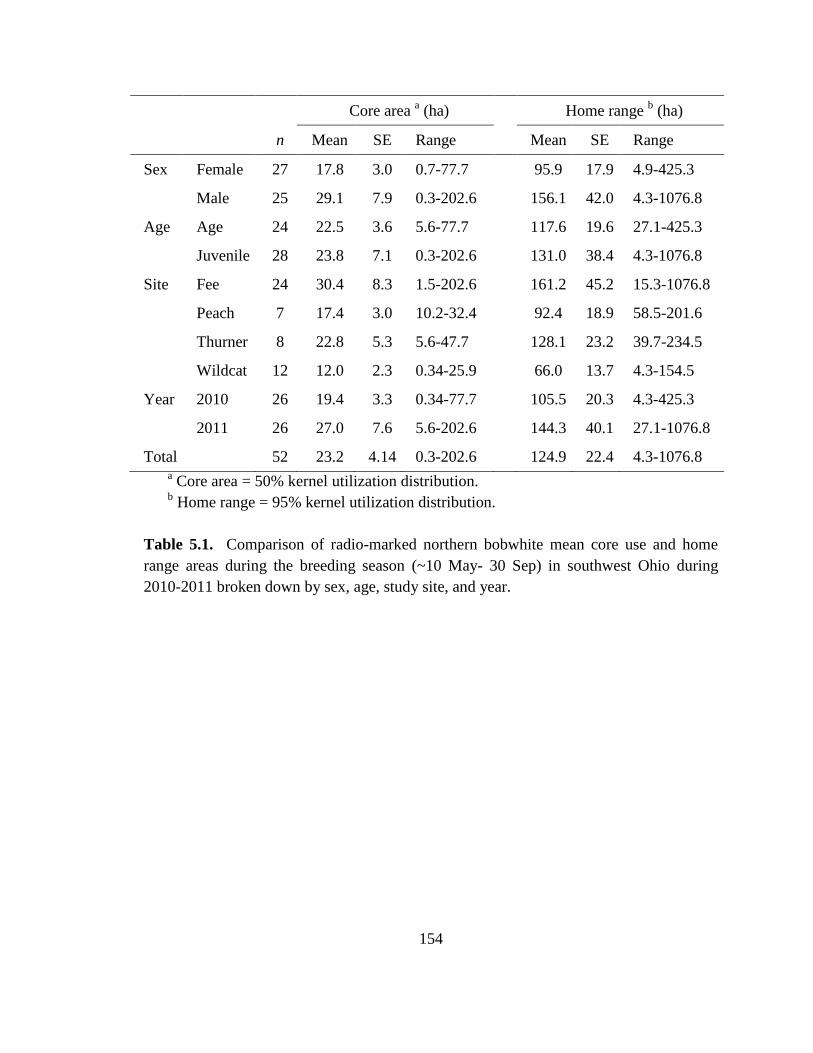
154
Core area a (ha) Home range
b (ha)
n Mean SE Range
Mean SE Range
Sex Female 27 17.8 3.0 0.7-77.7
95.9 17.9 4.9-425.3
Male 25 29.1 7.9 0.3-202.6
156.1 42.0 4.3-1076.8
Age Age 24 22.5 3.6 5.6-77.7
117.6 19.6 27.1-425.3
Juvenile 28 23.8 7.1 0.3-202.6
131.0 38.4 4.3-1076.8
Site Fee 24 30.4 8.3 1.5-202.6
161.2 45.2 15.3-1076.8
Peach 7 17.4 3.0 10.2-32.4
92.4 18.9 58.5-201.6
Thurner 8 22.8 5.3 5.6-47.7
128.1 23.2 39.7-234.5
Wildcat 12 12.0 2.3 0.34-25.9
66.0 13.7 4.3-154.5
Year 2010 26 19.4 3.3 0.34-77.7
105.5 20.3 4.3-425.3
2011 26 27.0 7.6 5.6-202.6
144.3 40.1 27.1-1076.8
Total 52 23.2 4.14 0.3-202.6 124.9 22.4 4.3-1076.8 a Core area = 50% kernel utilization distribution.
b Home range = 95% kernel utilization distribution.
Table 5.1. Comparison of radio-marked northern bobwhite mean core use and home
range areas during the breeding season (~10 May- 30 Sep) in southwest Ohio during
2010-2011 broken down by sex, age, study site, and year.
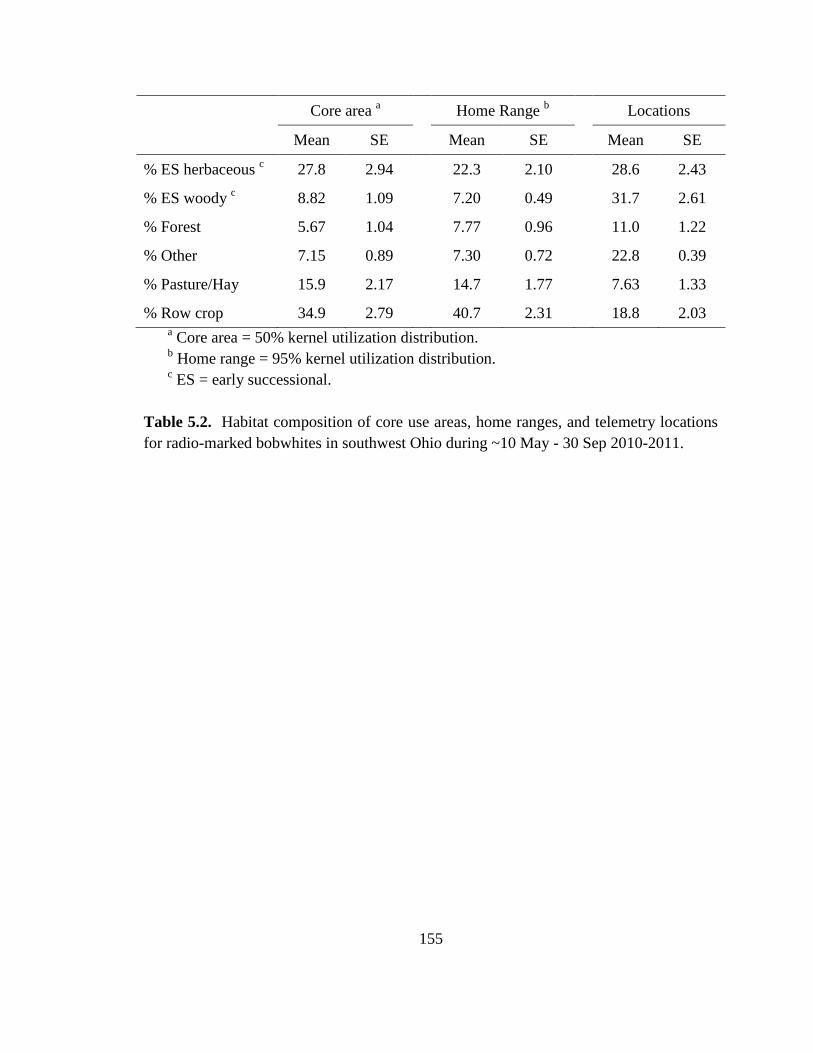
155
Core area
a
Home Range
b
Locations
Mean SE
Mean SE
Mean SE
% ES herbaceous c
27.8 2.94
22.3 2.10
28.6 2.43
% ES woody c
8.82 1.09
7.20 0.49
31.7 2.61
% Forest 5.67 1.04
7.77 0.96
11.0 1.22
% Other 7.15 0.89
7.30 0.72
22.8 0.39
% Pasture/Hay 15.9 2.17
14.7 1.77
7.63 1.33
% Row crop 34.9 2.79
40.7 2.31
18.8 2.03 a Core area = 50% kernel utilization distribution.
b Home range = 95% kernel utilization distribution.
c ES = early successional.
Table 5.2. Habitat composition of core use areas, home ranges, and telemetry locations
for radio-marked bobwhites in southwest Ohio during ~10 May - 30 Sep 2010-2011.
156
Study year Cover type a
Rank Cover type
a,b
ES herbaceous ES woody Forest Other Pasture/Hay Row crop
2010
ES herbaceous 1 . +++ +++ +++ +++ +++
ES woody 2 --- . +++ +++ +++ +++
Row crop 3 --- --- +++ +++ + .
Pasture/Hay 4 --- --- +++ + . -
Other 5 --- --- +++ . - ---
Forest 6 --- --- . --- --- ---
2011
ES woody 1 +++ . +++ + +++ +++
Other 2 +++ - +++ . + +
Row crop 3 + --- +++ - + .
Pasture/Hay 4 + --- +++ - . -
ES herbaceous 5 . --- +++ --- - -
Forest 6 --- --- . --- --- ---
a ES = early successional;
b (+) indicates row habitat type is preferred over column habitat type; (-) indicates column habitat type is
preferred over row habitat type; sign is tripled (e.g., +++) if relationship is significant (α = 0.05).
Table 5.3. Ranking matrix for second order (available = study site area, used = individual home range) habitat selection by radio-
marked northern bobwhite during the 2010 and 2011 breeding seasons (~10 May – 30 September) in southwest Ohio.
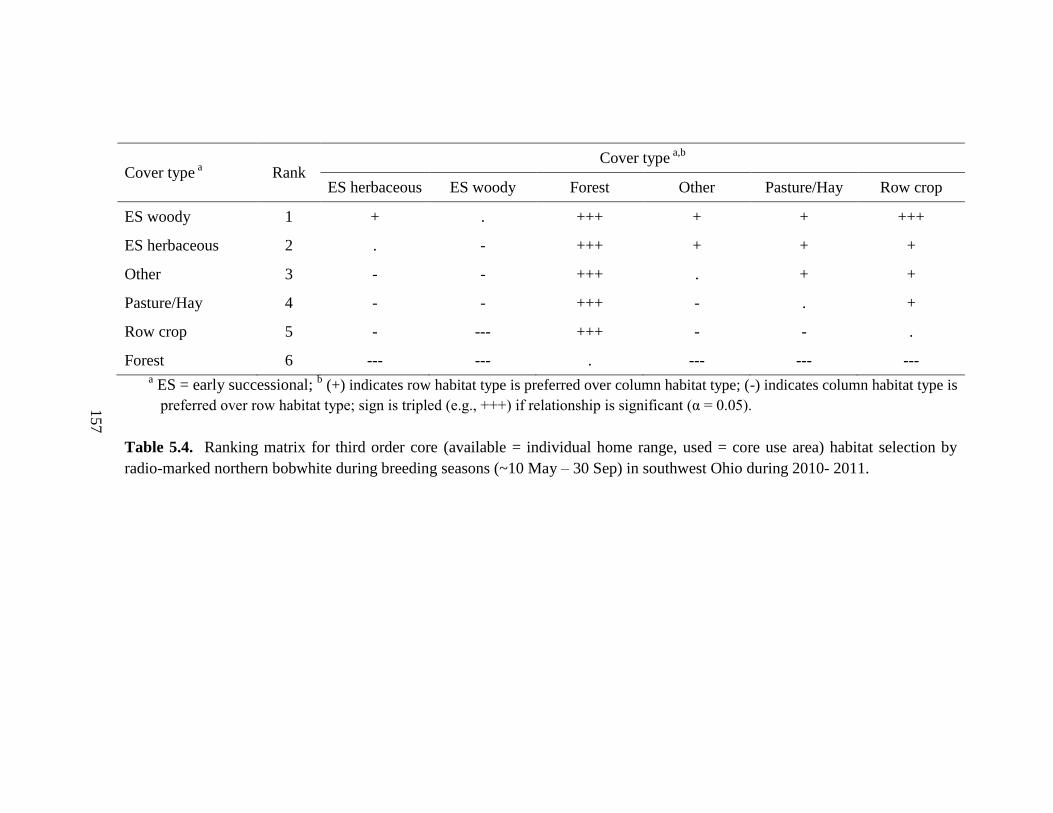
157
Cover type a
Rank Cover type
a,b
ES herbaceous ES woody Forest Other Pasture/Hay Row crop
ES woody 1 + . +++ + + +++
ES herbaceous 2 . - +++ + + +
Other 3 - - +++ . + +
Pasture/Hay 4 - - +++ - . +
Row crop 5 - --- +++ - - .
Forest 6 --- --- . --- --- --- a ES = early successional;
b (+) indicates row habitat type is preferred over column habitat type; (-) indicates column habitat type is
preferred over row habitat type; sign is tripled (e.g., +++) if relationship is significant (α = 0.05).
Table 5.4. Ranking matrix for third order core (available = individual home range, used = core use area) habitat selection by
radio-marked northern bobwhite during breeding seasons (~10 May – 30 Sep) in southwest Ohio during 2010- 2011.
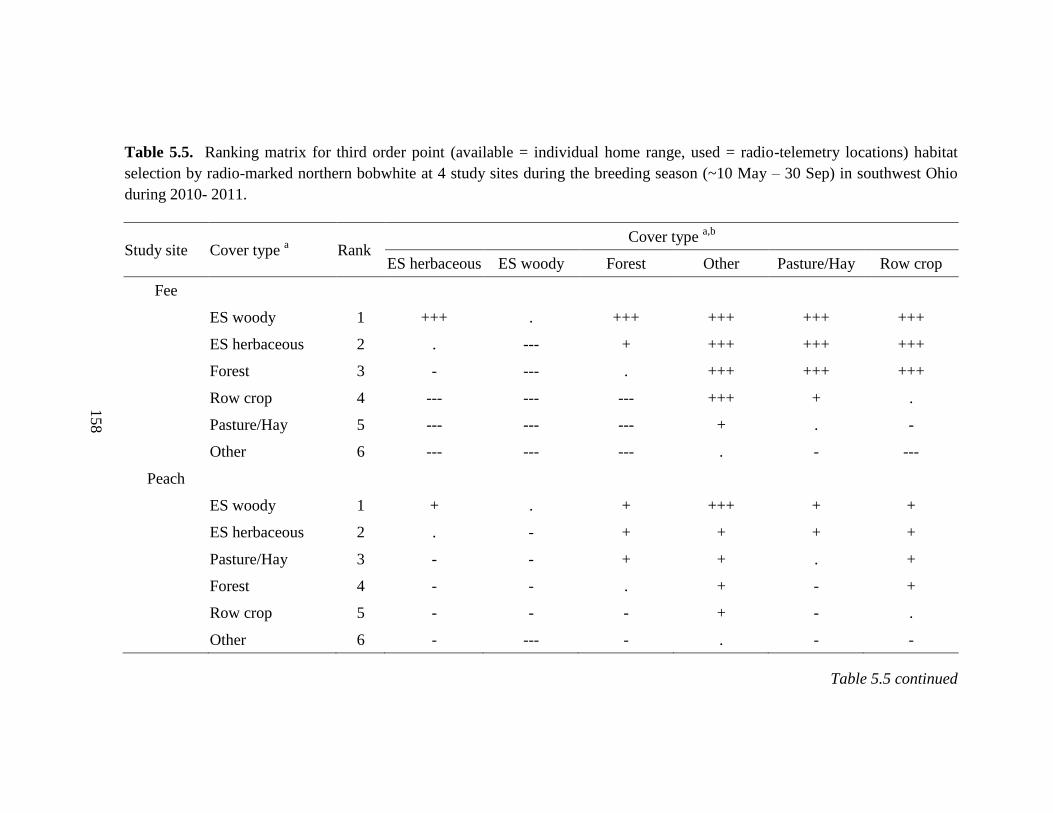
158
Table 5.5. Ranking matrix for third order point (available = individual home range, used = radio-telemetry locations) habitat
selection by radio-marked northern bobwhite at 4 study sites during the breeding season (~10 May – 30 Sep) in southwest Ohio
during 2010- 2011.
Study site Cover type a Rank
Cover type a,b
ES herbaceous ES woody Forest Other Pasture/Hay Row crop
Fee
ES woody 1 +++ . +++ +++ +++ +++
ES herbaceous 2 . --- + +++ +++ +++
Forest 3 - --- . +++ +++ +++
Row crop 4 --- --- --- +++ + .
Pasture/Hay 5 --- --- --- + . -
Other 6 --- --- --- . - ---
Peach
ES woody 1 + . + +++ + +
ES herbaceous 2 . - + + + +
Pasture/Hay 3 - - + + . +
Forest 4 - - . + - +
Row crop 5 - - - + - .
Other 6 - --- - . - -
Table 5.5 continued

159
Table 5.5 continued
Study site Cover type
a Rank
Cover type a,b
ES herbaceous ES woody Forest Other Pasture/Hay Row crop
Thurner
ES woody 1 +++ . +++ +++ +++ +++
ES herbaceous 2 . --- + +++ + +++
Forest 3 - --- . +++ +++ +++
Pasture/Hay 4 - --- --- +++ . +++
Other 5 --- --- --- . --- +
Row crop 6 --- --- --- - --- .
Wildcat
ES woody 1 +++ . +++ +++ +++ +++
Forest 2 + --- . +++ +++ +++
ES herbaceous 3 . --- - + +++ +++
Row crop 4 --- --- --- + + .
Pasture/Hay 5 --- --- --- + . -
Other 6 - --- --- . - - a ES = early successional;
b (+) indicates row habitat type is preferred over column habitat type; (-) indicates column habitat
type is preferred over row habitat type; sign is tripled (e.g., +++) if relationship is significant (α = 0.05).

160
Age Cover type a
Rank Cover type
a,b
ES herbaceous ES woody Forest Other Pasture/Hay Row crop
Adult
ES woody 1 +++ . +++ +++ +++ +++
ES herbaceous 2 . --- + +++ +++ +++
Forest 3 - --- . +++ +++ +++
Pasture/Hay 4 --- --- --- +++ . +
Row crop 5 --- --- --- + - .
Other 6 --- --- --- . --- -
Juvenile
ES woody 1 +++ . +++ +++ +++ +++
Forest 2 + --- . +++ +++ +++
ES herbaceous 3 . --- - +++ +++ +++
Row crop 4 --- --- --- + + .
Pasture/Hay 5 --- --- --- + . -
Other 6 --- --- --- . - -
a ES = early successional;
b (+) indicates row habitat type is preferred over column habitat type; (-) indicates column habitat type is
preferred over row habitat type; sign is tripled (e.g., +++) if relationship is significant (α = 0.05).
Table 5.6. Ranking matrix for third order point (available = individual home range, used = radio-telemetry locations) habitat
selection based on the age of radio-marked northern bobwhite in southwest Ohio during ~10 May – 30 Sep 2010-2011.
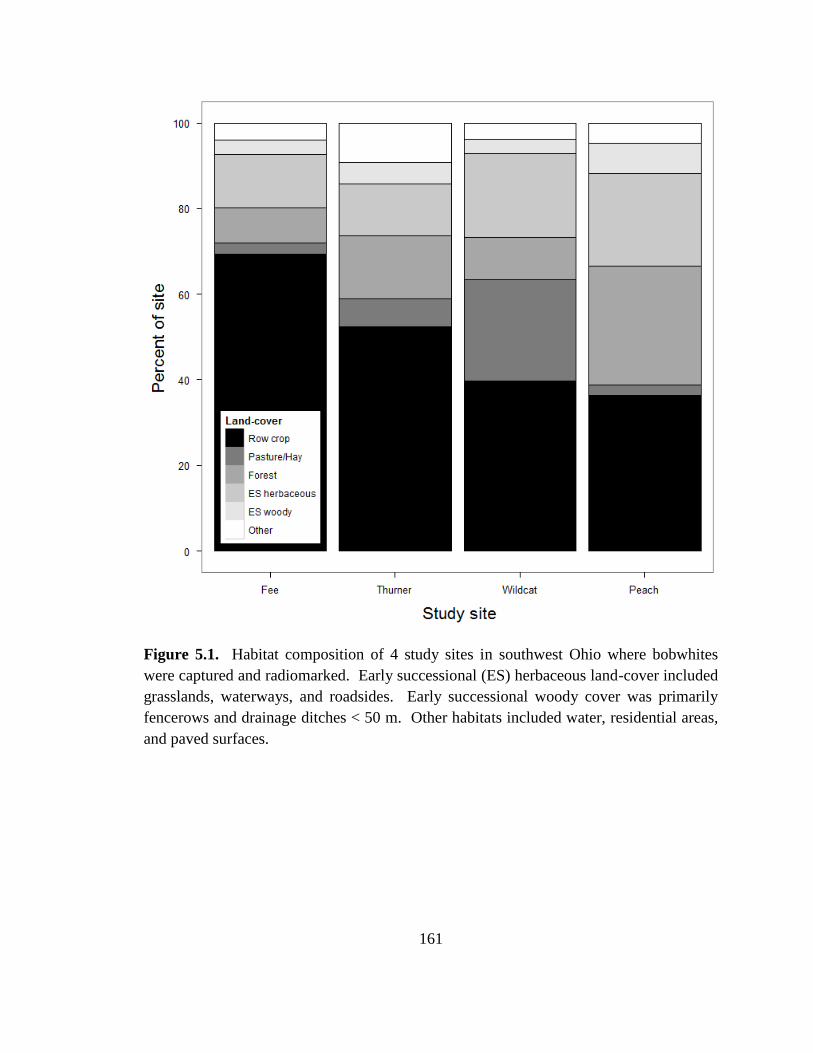
161
Figure 5.1. Habitat composition of 4 study sites in southwest Ohio where bobwhites
were captured and radiomarked. Early successional (ES) herbaceous land-cover included
grasslands, waterways, and roadsides. Early successional woody cover was primarily
fencerows and drainage ditches < 50 m. Other habitats included water, residential areas,
and paved surfaces.

162
Figure 5.2. Habitat composition of home ranges (95% kernel utilization distributions)
for radio-marked northern bobwhite during the 2010 and 2011 breeding seasons (~10
May-30 Sep) in southwest Ohio.
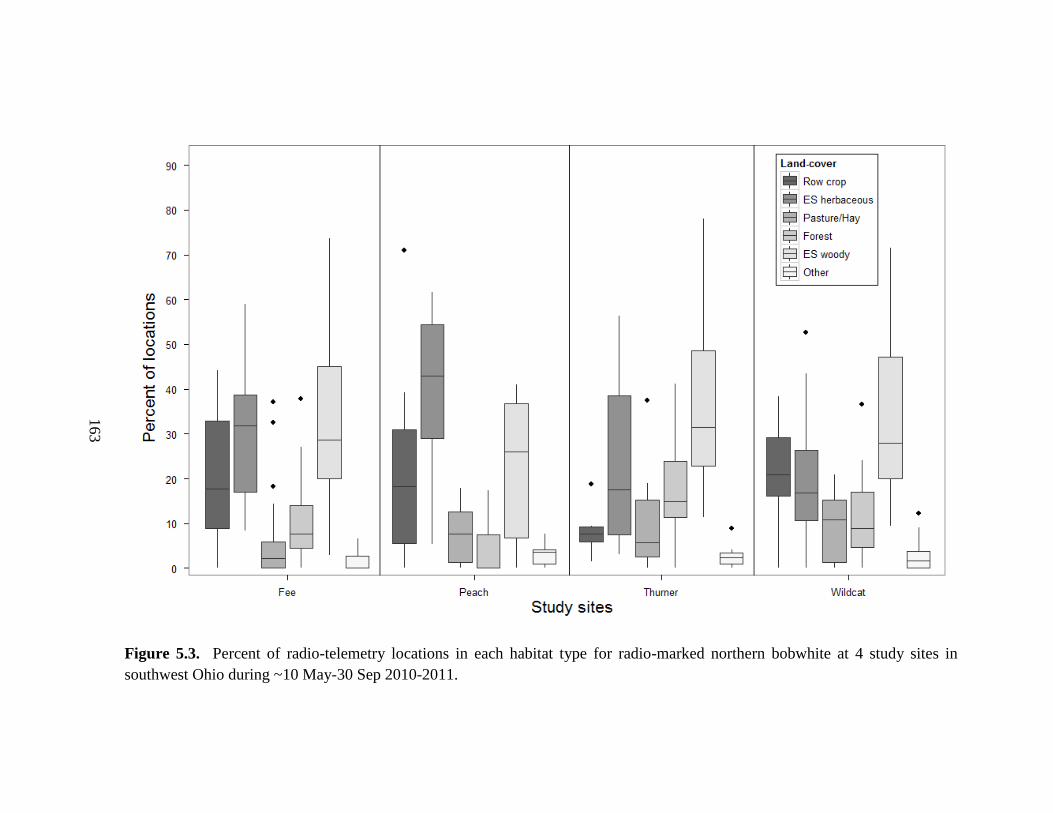
163
Figure 5.3. Percent of radio-telemetry locations in each habitat type for radio-marked northern bobwhite at 4 study sites in
southwest Ohio during ~10 May-30 Sep 2010-2011.
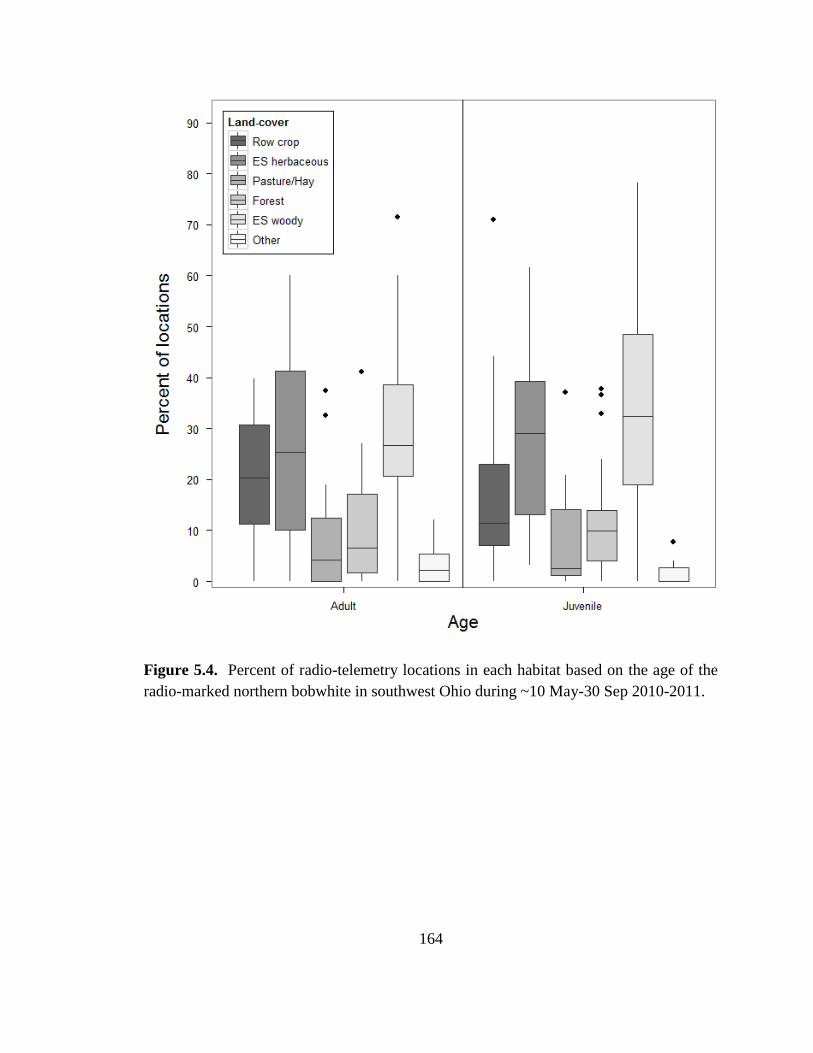
164
Figure 5.4. Percent of radio-telemetry locations in each habitat based on the age of the
radio-marked northern bobwhite in southwest Ohio during ~10 May-30 Sep 2010-2011.

165
Figure 5.5. Comparison of selection ratios for habitat types that significantly differed
between study years during compositional analysis (Aebischer et al. 1993) of home
ranges at the second order spatial scale for radio-marked northern bobwhite in southwest
Ohio during the breeding season (~10 May-30 Sep).

166
Figure 5.6. Comparison of selection ratios for habitat types that significantly differed
between study sites during compositional analysis (Aebischer et al. 1993) of telemetry
location and core used areas at the third order point spatial scale for radio-marked
northern bobwhite in southwest Ohio during the breeding season (~10 May-30 Sep).
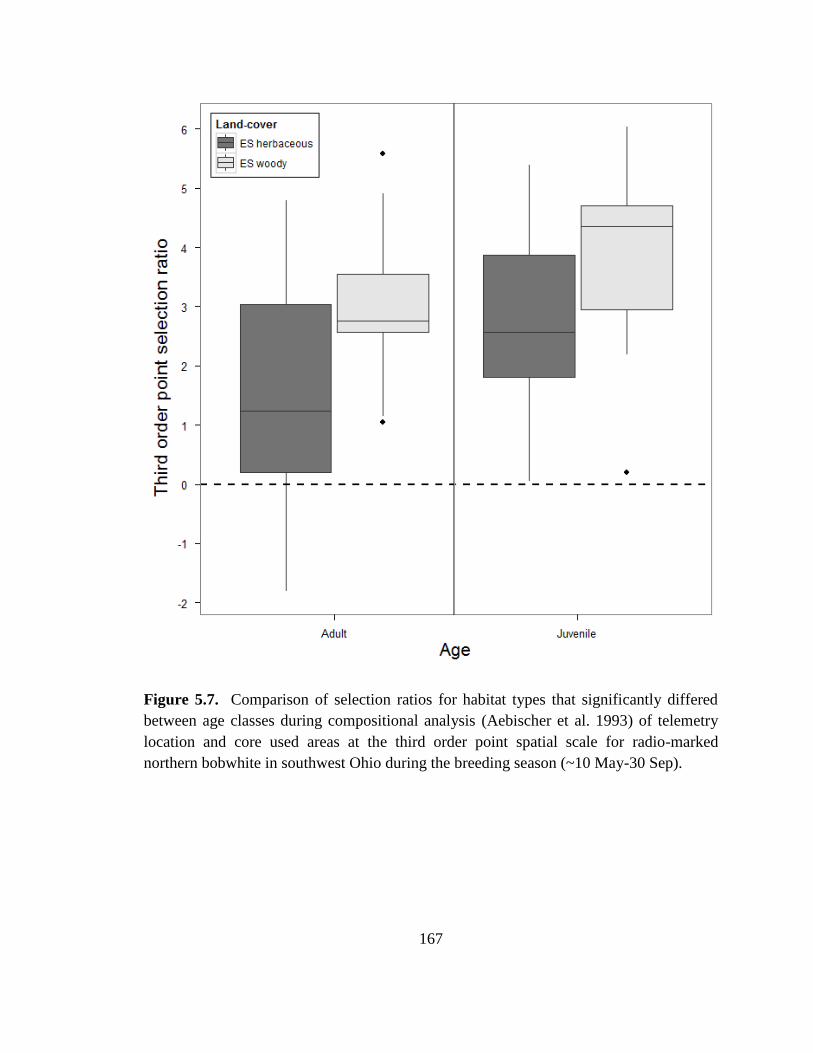
167
Figure 5.7. Comparison of selection ratios for habitat types that significantly differed
between age classes during compositional analysis (Aebischer et al. 1993) of telemetry
location and core used areas at the third order point spatial scale for radio-marked
northern bobwhite in southwest Ohio during the breeding season (~10 May-30 Sep).
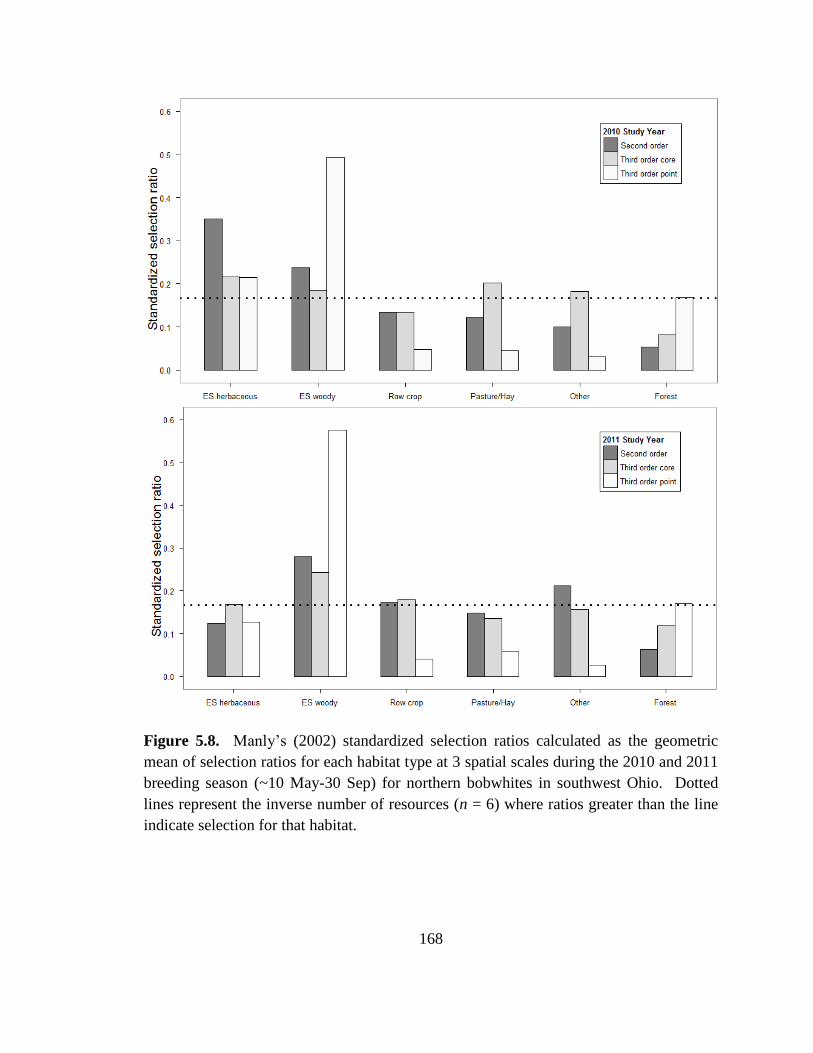
168
Figure 5.8. Manly’s (2002) standardized selection ratios calculated as the geometric
mean of selection ratios for each habitat type at 3 spatial scales during the 2010 and 2011
breeding season (~10 May-30 Sep) for northern bobwhites in southwest Ohio. Dotted
lines represent the inverse number of resources (n = 6) where ratios greater than the line
indicate selection for that habitat.
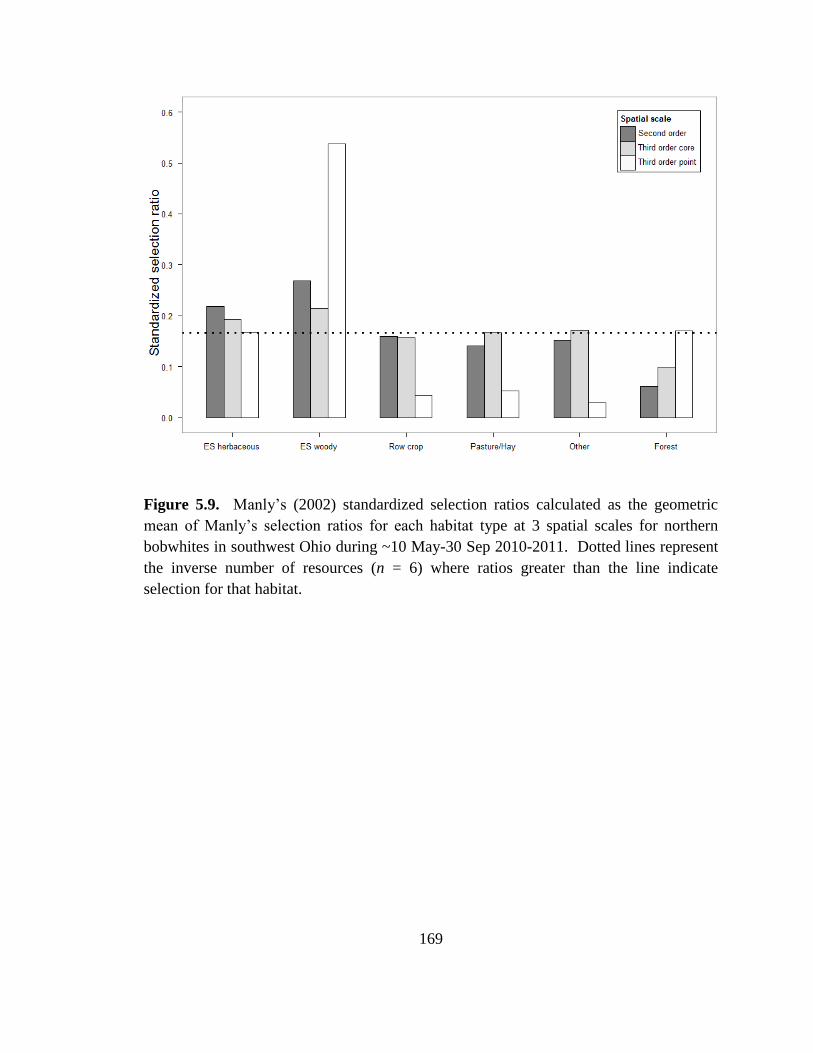
169
Figure 5.9. Manly’s (2002) standardized selection ratios calculated as the geometric
mean of Manly’s selection ratios for each habitat type at 3 spatial scales for northern
bobwhites in southwest Ohio during ~10 May-30 Sep 2010-2011. Dotted lines represent
the inverse number of resources (n = 6) where ratios greater than the line indicate
selection for that habitat.
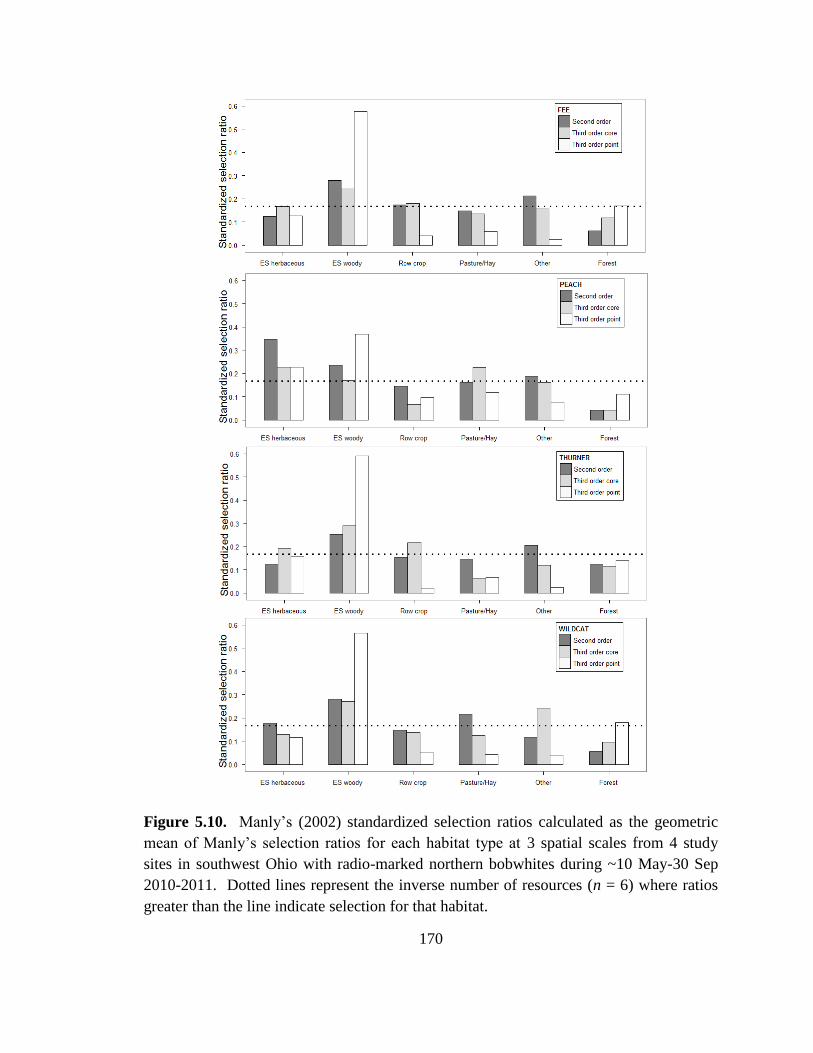
170
Figure 5.10. Manly’s (2002) standardized selection ratios calculated as the geometric
mean of Manly’s selection ratios for each habitat type at 3 spatial scales from 4 study
sites in southwest Ohio with radio-marked northern bobwhites during ~10 May-30 Sep
2010-2011. Dotted lines represent the inverse number of resources (n = 6) where ratios
greater than the line indicate selection for that habitat.

171
Figure 5.11. Manly’s (2002) standardized selection ratios calculated as the geometric
mean of Manly’s selection ratios for each habitat type at 3 spatial scales for adult and
juvenile radio-marked northern bobwhites in southwest Ohio during ~10 May-30 Sep
2010-2011. Dotted lines represent the inverse number of resources (n = 6) where ratios
greater than the line indicate selection for that habitat.
172
LITERATURE CITED
Aebischer, N. J., P. A. Robertson, and R. E. Kenward. 1993. Compositional analysis of
habitat use from animal radio-tracking data. Ecology 74:1313-1325.
Applegate, R. D., B. E. Flock, and E. J. Finck. 2003. Changes in land use in eastern
Kansas, 1984-2000. Transactions of the Kansas Academy of Science 106:192-
197.
Barnes, T. G., L. A. Madison, J. D. Sole, and M. J. Lacki. 1995. An assessment of habitat
quality for northern bobwhite in tall fescue-dominated fields. Wildlife Society
Bulletin 23:231-237.
Bell, B., K. Dancak, and P. J. Zwank. 1985. Range, movements and habitat use by
bobwhites in southeastern Louisiana pinelands. Proceeding of the Annual
Conferences of the Southeastern Association of Fish and Wildlife Agencies
39:512-519.
Best, L. B., H. Campa, III, D. E. Kemp, R. J. Robel, M. R. Ryan, J. A. Savidge, H. P.
Weeks, Jr., and S. R. Winterstein. 1997. Bird abundance and nesting in CRP
fields and cropland in the Midwest: a regional approach. Wildlife Society Bulletin
25:864-877.
Bingham, R. L., and L. A. Brennan. 2004. Comparison of type I error rates for statistical
analyses of resource selection. Journal of Wildlife Management 68:206-212.
Boulanger, J. G., and G. C. White. 1990. A comparison of home-range estimators using
Monte Carlo simulation. Journal of Wildlife Management 54:310-315.
Brennan, L. A. 1991. How can we reverse the northern bobwhite population decline?
Wildlife Society Bulletin 19:544-555.
Burger, L. W., D. A. Miller, and R. I. Southwick. 1999. Economic impact of northern
bobwhite hunting in the southeastern United States. Wildlife Society Bulletin
27:1010-1018.
173
Calenge, C. 2006. The package "adehabitat" for the R software: a tool for the analysis of
space and habitat use by animals. Ecological Modelling 197:516-519.
Collins, B. M., C. K. Williams, and P. M. Castelli. 2009. Reproduction and microhabitat
selection in a sharply declining northern bobwhite population. Wilson Journal of
Ornithology 121:688-695.
Cook, M. P. 2004. Northern bobwhite breeding season dispersal, habitat use, and survival
in a southeastern agricultural landscape. Thesis, University of Georgia, Athens,
Georgia, USA.
Downs, J. A., and M. W. Horner. 2008. Effects of point pattern shape on home-range
estimates. Journal of Wildlife Management 72:1813-1818.
Doxon, E. D., and J. P. Carroll. 2010. Feeding ecology of ring-necked pheasant and
northern bobwhite chicks in conservation reserve program fields. Journal of
Wildlife Management 74:249-256.
Gitzen, R. A., J. J. Millspaugh, and B. J. Kernohan. 2006. Bandwidth selection for fixed-
kernel analysis of animal utilization distributions. Journal of Wildlife
Management 70:1334-1344.
Guthery, F. S. 1999. Slack in the configuration of habitat patches for northern bobwhites.
Journal of Wildlife Management 63:245-250.
Guthery, F. S. 1997. A philosophy of habitat management for northern bobwhites.
Journal of Wildlife Management 61:291-301.
Guthery, F. S., M. J. Peterson, and R. R. George. 2000. Viability of northern bobwhite
populations. Journal of Wildlife Management 64:646-662.
Guthery, F. S., A. R. Rybak, S. D. Fuhlendorf, T. L. Hiller, S. G. Smith, W. H. Puckett,
Jr., and R. A. Baker. 2005. Aspects of the thermal ecology of bobwhites in north
Texas. Wildlife Monographs:1-36.
Hernández, F., J. A. Arredondo, F. C. Bryant, L. A. Brennan, and R. L. Bingham. 2005.
Influence of precipitation on demographics of northern bobwhites in southern
Texas. Wildlife Society Bulletin 33.
174
Hiller, T. L., F. S. Guthery, A. R. Rybak, S. D. Fuhlendorf, S. G. Smith, W. H. Puckett,
Jr., and R. A. Baker. 2007. Management implications of cover selection data:
northern bobwhite example. Journal of Wildlife Management 71:195-201.
Homer, C., C. Huang, C. Yang, B. Wylie, and M. Coan. 2004. Development of a 2001
national land-cover database for the United States. Photogrammetric Engineering
and Remote Sensing 70:829-840.
Horne, J. S., and E. O. Garton. 2009. Animal Space Use 1.3.
<http://www.cnr.uidaho.edu/population_ecology/animal_space_use>. Accessed
Jun 2012.
Horne, J. S., and E. O. Garton. 2006. Likelihood cross-validation versus least squares
cross-validation for choosing the smoothing parameter in kernal home-range
analysis. Journal of Wildlife Management 70:641-648.
Janke, A. K. 2011. Survival and habitat use of non-breeding northern bobwhites on
private lands in Ohio. Thesis, The Ohio State University, Columbus, Ohio, USA.
Janke, A. K., and R. J. Gates. 2012. Home range and habitat selection of northern
bobwhite coveys in an agricultural landscape. Journal of Wildlife Management
online.
Johnson, D. H. 1980. The comparison of usage and availability measurements for
evaluating resource preference. Ecology 61:65-71.
Klimstra, W. D. 1982. Bobwhite quail and changing land use. Pages 1-5 in F. Schitoskey,
Jr , E. C. Shitoskey, and L. G. Talent, eds. Proceedings of the Second National
Bobwhite Quail Symposium. Oklahoma State University, Stillwater, Oklahoma,
USA.
Klimstra, W. D., and J. L. Roseberry. 1975. Nesting ecology of the bobwhite in southern
Illinois. Wildlife Monographs 41:3-37.
Lichti, N. I., and R. K. Swihart. 2011. Estimating utilization distributions with kernel
versus local convex hull methods. Journal of Wildlife Management 75:413-422.
175
Liu, X., R. M. J. Whiting, D. S. Parson, and D. R. Dietz. 2002. Movement patterns of
resident and relocated northern bobwhite in east Texas. Pages 168-172 in S. J.
DeMaso, W. J. Kuvlesky, Jr., F. Hernández, and M. Burger, eds. Quail V: The
Fifth National Quail Symposium. Texas Parks and Wildlife Department, Austin,
Texas, USA.
Lohr, M., B. M. Collins, P. M. Castelli, and C. K. Williams. 2011. Life on the edge:
northern bobwhite ecology at the northern periphery of their range. Journal of
Wildlife Management 75:52-60.
Madison, L. A., R. J. Robel, and D. P. Jones. 2000. Influence of food plots on northern
bobwhite movements, habitat use, and home range. Pages 36-41 in L. A. Brennan,
W. E. Palmer, L. W. Burger, Jr., and T. Pruden, eds. Quail IV: Proceedings of the
Fourth National Quail Symposium. Tall Timbers Research Station, Tallahassee,
Florida, USA.
Manly, B. F. J., L. L. McDonald, D. L. Thomas, T. L. McDonald, and W. P. Erickson.
2002. Resource selection by animals: statistical design and analysis for field
studies. 2nd edition. Kluwer Academic Publishers, Dordrecht, Netherlands.
McClean, S. A., M. A. Rumble, R. M. King, and W. L. Baker. 1998. Evaluation of
resource selection methods with different definitions of availability. Journal of
Wildlife Management 62:793-801.
National Agricultural Statistics Service. 2012. County estimates. United States
Department of Agriculture.
<http://www.nass.usda.gov/Statistics_by_State/Ohio/index.asp>. Accessed Apr
2012.
National Audubon Society. 2012. The Christmas bird count historical results [Online].
<http://www.audubon.org/bird/cbc>. Accessed Apr 2012.
National Bobwhite Conservation Initiative. 2011. The national bobwhite conservation
initiative: a range-wide plan for recovering bobwhites. in W. E. Palmer, T. M.
Terhune, and D. F. McKenzie, eds. National Bobwhite Technical Committee
Publication, ver 2.0. Knoxville, Tennessee, USA.
176
National Climate Data Center [NCDC]. 2011. Quality Controlled Local Climatological
Data. Hillsboro, Ohio, USA. <http://www.ncdc.noaa.gov/oa/ncdc/html>.
Accessed Dec 2011.
O'Connor, R. J., M. Shrubb, and D. Watson. 1986. Farming & birds. Cambridge
University Press, Cambridge, New York, USA.
Ohio Division of Geologic Survey. 1998. Physiographic regions of Ohio. Ohio
Department of Natural Resources. Report page-size map with text, 2p., scale
1:2,100,000.
Ohio Division of Soil and Water Resources [ODSWR]. 2012. Monthly Water Inventory
Report for Ohio, Apr-Sept 2010-2011. Ohio Department of Natural Resources.
Columbus, Ohio, USA. <http://www.ohiodnr.gov/tabid/4191/Default.aspx>.
Accessed Nov 2012.
Ohio Statewide Imagery Program. 2008. OSIP 1 Foot Color Orthophotography.
<http://gis3.oit.ohio.gov/geodata/>. Accessed Oct 2009.
Orians, G. H., and J. F. Wittenberger. 1991. Spatial and temporal scales in habitat
selection. American Naturalist 137:S29-S49.
Parnell, I. B., III, S. H. Schweitzer, C. G. White, and J. A. Lewis. 2002. Northern
bobwhite habitat use in a forest dominated system. in S. J. DeMaso, W. J.
Kuvlesky, Jr., F. Hernández, and M. E. Berger, eds. Quail V: The Fifth National
Quail Symposium. Texas Parks and Wildlife Department, Austin, Texas, USA.
Porter, W. F., and K. E. Church. 1987. Effects of environmental pattern on habitat
preference analysis. Journal of Wildlife Management 51:681-685.
R Development Core Team. 2012. R: A language and environment for statistical
computing. Vienna, Austria.
Riddle, J. D., C. E. Moorman, and K. H. Pollock. 2008. The importance of habitat shape
and landscape context to northern bobwhite populations. Journal of Wildlife
Management 72:1376-1382.
177
Riffell, S., D. Scognamillo, and L. W. Burger. 2008. Effects of the Conservation Reserve
Program on northern bobwhite and grassland birds. Environmental Monitoring
and Assessment 146:309-323.
Roseberry, J. L. 1964. Responses of bobwhites to snow cover in southern Illinois. Journal
of Wildlife Management 28:244-249.
Roseberry, J. L., and W. D. Klimstra. 1984. Population ecology of the bobwhite.
Southern Illinois University Press, Carbondale, Illinois, USA.
Rosene, W. 1969. The bobwhite quail: its life and management. Rutgers University Press,
New Brunswick, New Jersey, USA.
Ryan, M. R. 2000. Conservation Reserve Program: impact of the Conservation Reserve
Program on wildlife conservation in the Midwest. Pages 45-54 in W. L. Hohman,
and D. J. Halloum, eds. United States Department of Agriculture, Natural
Resource Conservation Service, Wildlife Habitat Management Institute,
(USDA/NRCS/WHMI). Technical Report 2000, Ames, Iowa, USA.
Ryan, M. R., L. W. Burger, and E. W. Kurzejeski. 1998. The impact of CRP on avian
wildlife: a review. Journal of Production Agriculture 11:61-66.
Sala, O. E., W. J. Parton, L. A. Joyce, and W. K. Lauenroth. 1988. Primary production of
the central grassland region of the United States. Ecology 69:40-45.
Sauer, J. R., J. E. Hines, J. E. Fallon, K. L. Pardieck, D. J. Ziolkowski, Jr., and W. A.
Link. 2011. The North American Breeding Bird Survey, summary and analysis
1966-2010, Version 12.07.2011. USGS Patuxent Wildlife Research Center,
Laurel, Maryland, USA.
Seaman, D. E., J. J. Millspaugh, B. J. Kernohan, G. C. Brundige, K. J. Raedeke, and R.
A. Gitzen. 1999. Effects of sample size on kernel home range estimates. Journal
of Wildlife Management 63:739-747.
Silverman, B. W. 1986. Density estimation for statistics and data analysis. Chapman and
Hall, London, UK.
178
Singh, A., T. C. Hines, J. A. Hostetler, H. F. Percival, and M. K. Oli. 2011. Patterns of
space and habitat use by northern bobwhites in South Florida, USA. European
Journal of Wildlife Research 57:15-26.
Sparling, D. W., and D. C. Osborne. 2009. Responses of bobwhite, vegetation, and
invertebrates to three methods of renovating monotypic conservation reserve
program grasslands in south-central Illinois. United States Department of
Agriculture, Natural Resources Conservation Service.
Spinola, R. M., and R. J. Gates. 2008. Population status and trends of northern bobwhite
(Colinus virginianus) in Ohio: 1984-2004. Ohio Journal of Science 108:26-30.
Taylor, J. S., K. E. Church, and D. H. Rusch. 1999. Microhabitat selection by nesting and
brood-rearing northern bobwhite in Kansas. Journal of Wildlife Management
63:686-694.
Terhune, T. M., D. C. Sisson, H. L. Stribling, and J. P. Carroll. 2006. Home range,
movement, and site fidelity of translocated northern bobwhite (Colinus
virginianus) in southwest Georgia, USA. European Journal of Wildlife Research
52:119-124.
Veech, J. A. 2006. Increasing and declining populations of northern bobwhites inhabit
different types of landscapes. Journal of Wildlife Management 70:922-930.
White, G. C., and R. A. Garrott. 1999. Analysis of wildlife radio-tracking data. Academic
Press, San Diego, California, USA.
Wiley, M. J. 2012. Multi-scale assessment of usable space for northern bobwhites in
Ohio. Thesis, The Ohio State University, Columbus, Ohio, USA.
Williams, C. K., F. S. Guthery, R. D. Applegate, and M. J. Peterson. 2004. The northern
bobwhite decline: scaling our management for the twenty-first century. Wildlife
Society Bulletin 32:861-869.
Williams, C. K., R. S. Lutz, R. D. Applegate, and D. H. Rusch. 2000. Habitat use and
survival of northern bobwhite (Colinus virginianus) in cropland and rangeland
ecosystems during the hunting season. Canadian Journal of Zoology 78:1562-
1566.
179
Wood, K. N., F. S. Guthery, and N. E. Koerth. 1986. Spring-summer nutrition and
condition of northern bobwhites in south Texas. Journal of Wildlife Management
50:84-88.
Worton, B. J. 1995. Using Monte Carlo simulation to evaluate kernel-based home range
estimators. Journal of Wildlife Management 59:794-800.
Worton, B. J. 1989. Kernel methods for estimating the utilization distribution in home-
range studies. Ecology 70:164-168.
Worton, B. J. 1987. A review of models of home range for animal movement. Ecological
Modelling 38:277-298.
Yoho, N. S., and R. W. Dimmick. 1972. Habitat utilization by bobwhite quail during
winter. Pages 90-99 in J. A. Morrison, and J. C. Lewis, eds. Proceedings of the
First National Bobwhite Quail Symposium. Oklahoma State University,
Stillwater, Oklahoma, USA.
180
BIBLIOGRAPHY
Aebischer, N. J., P. A. Robertson, and R. E. Kenward. 1993. Compositional analysis of
habitat use from animal radio-tracking data. Ecology 74:1313-1325.
Applegate, R. D., B. E. Flock, and E. J. Finck. 2003. Changes in land use in eastern
Kansas, 1984-2000. Transactions of the Kansas Academy of Science 106:192-
197.
Applegate, R. D., C. K. William, and R. S. Lutz. 2002. The effect of flooding on northern
bobwhites. Western North American Naturalist 62:227-229.
Askins, R. A. 2001. Sustaining biological diversity in early successional communities:
the challenge of managing unpopular habitats. Wildlife Society Bulletin 29:407-
412.
Atwood, T. C., H. P. Weeks, and T. M. Gehring. 2004. Spatial ecology of coyotes along a
suburban-to-rural gradient. Journal of Wildlife Management 68:1000-1009.
Barnes, T. G., L. A. Madison, J. D. Sole, and M. J. Lacki. 1995. An assessment of habitat
quality for northern bobwhite in tall fescue-dominated fields. Wildlife Society
Bulletin 23:231-237.
Bélichon, S., J. Clobert, and M. Massot. 1996. Are there differences in fitness
components between philopatric and dispersing individuals? Acta Oecologica
17:503-517.
Bell, B., K. Dancak, and P. J. Zwank. 1985. Range, movements and habitat use by
bobwhites in southeastern Louisiana pinelands. Proceeding of the Annual
Conferences of the Southeastern Association of Fish and Wildlife Agencies
39:512-519.
181
Best, L. B., H. Campa, III, D. E. Kemp, R. J. Robel, M. R. Ryan, J. A. Savidge, H. P.
Weeks, Jr., and S. R. Winterstein. 1997. Bird abundance and nesting in CRP
fields and cropland in the Midwest: a regional approach. Wildlife Society Bulletin
25:864-877.
Beyer, H. L., D. T. Haydon, J. M. Morales, J. L. Frair, M. Hebblewhite, M. Mitchell, and
J. Matthiopoulos. 2010. The interpretation of habitat preference metrics under
use-availability designs. Philosophical Transactions of the Royal Society B
356:2245-2254.
Bingham, R. L., and L. A. Brennan. 2004. Comparison of type I error rates for statistical
analyses of resource selection. Journal of Wildlife Management 68:206-212.
Böhning-Gaese, K., B. Halbe, N. Lemoine, and R. Oberrath. 2000. Factors influencing
the clutch size, number of broods and annual fecundity of North American and
European land birds. Evolutionary Ecology Research 2:823-839.
Bollinger, E. K., P. B. Bollinger, and T. A. Gavin. 1990. Effects of hay-cropping on
eastern populations of the bobolink. Wildlife Society Bulletin 18:142-150.
Boulanger, J. G., and G. C. White. 1990. A comparison of home-range estimators using
Monte Carlo simulation. Journal of Wildlife Management 54:310-315.
Brennan, L. A. 1991. How can we reverse the northern bobwhite population decline?
Wildlife Society Bulletin 19:544-555.
Bryan, G. G., and L. B. Best. 1992. Avian nest density and success in grassed waterways
in Iowa rowcrop fields. Wildlife Society Bulletin 22:583-592.
Burger, L. W., D. A. Miller, and R. I. Southwick. 1999. Economic impact of northern
bobwhite hunting in the southeastern United States. Wildlife Society Bulletin
27:1010-1018.
Burger, L. W., M. R. Ryan, T. V. Dailey, and E. W. Kurzejeski. 1995. Reproductive
strategies, success, and mating systems of northern bobwhite in Missouri. Journal
of Wildlife Management 59:417-426.
182
Burnham, K. P., and D. R. Anderson. 2002. Model selection and multimodel inference: a
practical information-theoretic approach. 2nd edition. Springer, New York, New
York, USA.
Calenge, C. 2006. The package "adehabitat" for the R software: a tool for the analysis of
space and habitat use by animals. Ecological Modelling 197:516-519.
Camp, M., and L. B. Best. 1994. Nest density and nesting success of birds in roadsides
adjacent to rowcrop fields. American Midland Naturalist 131:347-358.
Cantu, T., and D. D. Everett. 1982. Reproductive success and brood survival of bobwhite
quail as effected by grazing practices. Pages 79-83 in F. Schitoskey, Jr , E. C.
Shitoskey, and L. G. Talent, eds. Proceedings of the Second National Bobwhite
Quail Symposium. Oklahoma State University, Stillwater, Oklahoma, USA.
Chamberlain, M. J., L. M. Conner, B. D. Leopold, and K. M. Hodges. 2003. Space use
and multi-scale habitat selection of adult raccoons in central Mississippi. Journal
of Wildlife Management 67:334-340.
Clark, M. E., and T. E. Martin. 2007. Modeling tradeoffs in avian life history traits and
consequences for population growth. Ecological Modelling 209:110-120.
Clarke, A. L., B.-E. Sæther, and E. Røskaft. 1997. Sex biases in avian dispersal: a
reappraisal. Oikos 79:429-438.
Collins, B. M., C. K. Williams, and P. M. Castelli. 2009. Reproduction and microhabitat
selection in a sharply declining northern bobwhite population. Wilson Journal of
Ornithology 121:688-695.
Cook, M. P. 2004. Northern bobwhite breeding season dispersal, habitat use, and survival
in a southeastern agricultural landscape. Thesis, University of Georgia, Athens,
Georgia, USA.
Cook, M. P., R. G. Hamrick, and J. P. Carroll. 2006. Effects of sex, age, and habitat on
northern bobwhite spring dispersal patterns. Pages 135-145 in S. Cederbaum, B.
Faircloth, T. Terhune, J. Thompson, and J. P. Carroll, eds. Gamebird 2006: Quail
VI and Perdix XII Warnell School of Forestry and Natural Resources, University
of Georgia, Athens, Georgia, USA.
183
Cox, S. A., F. S. Guthery, J. J. Lusk, A. D. Peoples, S. J. DeMaso, and M. Sams. 2005.
Reproduction by northern bobwhites in western Oklahoma. Journal of Wildlife
Management 69:133-139.
Curtis, P. D., B. S. Mueller, P. D. Doerr, C. F. Robinette, and T. DeVos. 1993. Potential
polygmaous breeding behavior in northern bobwhite. Pages 55-63 in K. E.
Church, and T. V. Dailey, eds. Quail III: National Quail Symposium. Kansas
Department of Wildlife and Parks, Pratt, Kansas, USA.
Danchin, E., and E. Cam. 2002. Can non-breeding be a cost of breeding dispersal?
Behavioral Ecology and Sociobiology 51:153-163.
Daubenmire, R. 1959. A canopy-coverage method of vegetational analysis. Northwest
Science 33:43-64.
DeVos, T., and B. S. Mueller. 1993. Reproductive ecology of northern bobwhite in north
Florida. Pages 83-90 in K. E. Church, and T. V. Dailey, eds. Quail III: National
Quail Symposium. Kansas Department of Wildlife and Parks, Pratt, Kansas, USA.
Downs, J. A., and M. W. Horner. 2008. Effects of point pattern shape on home-range
estimates. Journal of Wildlife Management 72:1813-1818.
Doxon, E. D., and J. P. Carroll. 2010. Feeding ecology of ring-necked pheasant and
northern bobwhite chicks in conservation reserve program fields. Journal of
Wildlife Management 74:249-256.
Dreitz, V. J., L. A. Baeten, T. Davis, and M. M. Riordan. 2011. Testing radiotransmitter
attachment techniques on northern bobwhite and chukar chicks. Wildlife Society
Bulletin 35:475-480.
Everitt, B. S. 2005. An R and S-plus companion to multivariate analysis. Springer-
Verlag, London, UK.
Farrand, D. T., and M. R. Ryan. 2005. Impact of the Conservation Reserve Program on
wildlife conservation in the Midwest. in J. B. Haufler, editor. Fish and wildlife
benefits of Farm Bill programs: 2000-2005 update, Technical Review 05-2. The
Wildlife Society, Bethesda, Maryland, USA.

184
Fies, M. L., and K. M. Puckett. 2000. Depredation patterns of northern bobwhite nest
predators in Virginia. Pages 96-102 in L. A. Brennan, W. E. Palmer, L. W.
Burger, Jr., and T. Pruden, eds. Quail IV: Proceedings of the Fourth National
Quail Symposium. Tall Timbers Research Station, Tallahassee, Florida, USA.
Fies, M. L., K. M. Puckett, and B. Larson-Brogdon. 2002. Breeding season movements
and dispersal of northern bobwhites in fragmented habitats of Virginia. Pages
173-179 in S. J. DeMaso, W. P. Kuvlesky, Jr., F. Hernández, and M. E. Berger,
eds. Quail V: The Fifth National Quail Symposium. Texas Parks and Wildlife
Department, Austin, Texas, USA.
Fisher, R. J., and S. K. Davis. 2010. From Wiens to Robel: a review of grassland-bird
habitat selection. Journal of Wildlife Management 74:265-273.
Flanders, A. A., W. P. Kuvlesky, D. C. Ruthven, R. E. Zaiglin, R. L. Bingham, T. E.
Fulbright, F. Hernández, L. A. Brennan, and J. H. Vega Rivera. 2006. Effects of
invasive exotic grasses on south Texas rangeland breeding birds. The Auk
123:171-182.
Flock, B. E. 2006. Effects of landscape configuration on northern bobwhite in
southeastern Kansas. Dissertation, Kansas State University, Manhattan, Kansas,
USA.
Folk, T. H., J. B. Grand, W. E. Palmer, J. P. Carroll, D. C. Sisson, T. M. Terhune, S. D.
Wellendorf, and H. L. Stribling. 2007. Estimates of survival from radiotelemetry:
a response to Guthery and Lusk. Journal of Wildlife Management 71:1027-1033.
Frawley, B. J., and L. B. Best. 1991. Effects of mowing on breeding bird abundance and
species composition in alfalfa fields. Wildlife Society Bulletin 19:135-142.
Garcia, V., and C. J. Conway. 2009. What constitutes a nesting attempt? variation in
criteria causes bias and hinders comparisons across studies. The Auk 126:31-40.
Gates, R. J., A. K. Janke, M. R. Liberati, and M. J. Wiley. 2012. Population ecology and
habitat relationships of northern bobwhite in southwestern Ohio. Proceedings of
the National Quail Symposium 7: in press.

185
Gitzen, R. A., J. J. Millspaugh, and B. J. Kernohan. 2006. Bandwidth selection for fixed-
kernel analysis of animal utilization distributions. Journal of Wildlife
Management 70:1334-1344.
Giuliano, W. M., and S. E. Daves. 2002. Avian response to warm-season grass use in
pasture and hayfield management. Biological Conservation 106:1-9.
Götmark, F. 1992. The effects of investigator disturbance on nesting birds. Current
Ornithology 9:63-104.
Grant, T. A., E. Madden, and G. B. Berkey. 2004. Tree and shrub invasion in northern
mixed-grass prairie: implications for breeding grassland birds. Wildlife Society
Bulletin 32:807-818.
Greenfield, K. C., L. W. Burger, M. J. Chamberlain, and E. W. Kurzejeski. 2002.
Vegetation management practices on Conservation Reserve Program fields to
improve northern bobwhite habitat quality. Wildlife Society Bulletin 30:527-538.
Greenwood, P., and P. Harvey. 1982. The natal and breeding dispersal of birds. Annual
Review of Ecology and Systematics 13:1-21.
Greenwood, R. J., A. B. Sargeant, D. H. Johnson, L. M. Cowardin, and T. L. Shaffer.
1995. Factors associated with duck nest success in the prairie pothole region of
Canada. Wildlife Monographs:3-57.
Guthery, F. S. 2000. On bobwhites. 1st edition. Texas A&M University Press, College
Station, Texas, USA.
Guthery, F. S. 1999. Slack in the configuration of habitat patches for northern bobwhites.
Journal of Wildlife Management 63:245-250.
Guthery, F. S. 1997. A philosophy of habitat management for northern bobwhites.
Journal of Wildlife Management 61:291-301.
Guthery, F. S., and W. P. Kuvlesky. 1998. The effect of multiple-brooding on age ratios
of quail. Journal of Wildlife Management 62:540-549.
186
Guthery, F. S., and J. J. Lusk. 2004. Radiotelemetry studies: are we radio-handicapping
northern bobwhites? Wildlife Society Bulletin 32:194-201.
Guthery, F. S., M. J. Peterson, and R. R. George. 2000. Viability of northern bobwhite
populations. Journal of Wildlife Management 64:646-662.
Guthery, F. S., A. R. Rybak, S. D. Fuhlendorf, T. L. Hiller, S. G. Smith, W. H. Puckett,
Jr., and R. A. Baker. 2005. Aspects of the thermal ecology of bobwhites in north
Texas. Wildlife Monographs:1-36.
Harper, C. A. 2007. Strategies for managing early succession habitat for wildlife. Weed
Technology 21:932-937.
Herkert, J. R. 1995. An analysis of midwestern breeding bird population trends: 1966-
1993. American Midland Naturalist 134:41-50.
Herkert, J. R., D. W. Sample, and R. E. Warner. 1996. Management of midwestern
grassland landscapes for the conservation of migratory birds. Pages 89-116 in F.
R. Thompson, III, editor. Management of midwestern landscapes for the
conservation of neotropical migratory birds, general technical report NC-187. US
Department of Agriculture Forest Service, North Central Forest Experiment
Station.
Hernández, F., J. A. Arredondo, F. C. Bryant, L. A. Brennan, and R. L. Bingham. 2005.
Influence of precipitation on demographics of northern bobwhites in southern
Texas. Wildlife Society Bulletin 33.
Hernández, F., J. A. Arredondo, F. Hernandez, D. G. Hewitt, S. J. DeMaso, and R. L.
Bingham. 2004. Effects of radiotransmitters on body mass, feed consumption, and
energy expenditure of northern bobwhites. Wildlife Society Bulletin 32:394-400.
Hernández, F., and F. S. Guthery. 2012. Beef, brush, and bobwhites: quail management
in cattle country. Texas A&M University Press, College Station.
Hiller, T. L., F. S. Guthery, A. R. Rybak, S. D. Fuhlendorf, S. G. Smith, W. H. Puckett,
Jr., and R. A. Baker. 2007. Management implications of cover selection data:
northern bobwhite example. Journal of Wildlife Management 71:195-201.
187
Holt, R. D., L. W. Burger, S. J. Dinsmore, M. D. Smith, S. J. Szukaitis, and K. D.
Godwin. 2009. Estimating duration of short-term acute effects of capture handling
and radiomarking. Journal of Wildlife Management 73:989-995.
Homer, C., C. Huang, C. Yang, B. Wylie, and M. Coan. 2004. Development of a 2001
national land-cover database for the United States. Photogrammetric Engineering
and Remote Sensing 70:829-840.
Hood, M. R. 1955. Mississippi quail investigation. Proceeding of the Annual Conferences
of the Southeastern Association of Fish and Wildlife Agencies 9:157-163.
Horn, D. J., M. L. Phillips, R. R. Koford, W. R. Clark, M. A. Sovada, and R. J.
Greenwood. 2005. Landscape composition, patch size, and distance to edges:
interactions affecting duck reproductive success. Ecological Applications
15:1367-1376.
Horne, J. S., and E. O. Garton. 2009. Animal Space Use 1.3.
<http://www.cnr.uidaho.edu/population_ecology/animal_space_use>. Accessed
Jun 2012.
Horne, J. S., and E. O. Garton. 2006. Likelihood cross-validation versus least squares
cross-validation for choosing the smoothing parameter in kernal home-range
analysis. Journal of Wildlife Management 70:641-648.
Howard, W. 1960. Innate and environmental dispersal of individual vertebrates.
American Midland Naturalist 61:895-901.
Ibanez-Alamo, J. D., and M. Soler. 2012. Predator-induced female behavior in the
absence of male incubation feeding: an experimental study. Behavioral Ecology
and Sociobiology 66:1067-1073.
Janke, A. K. 2011. Survival and habitat use of non-breeding northern bobwhites on
private lands in Ohio. Thesis, The Ohio State University, Columbus, Ohio, USA.
Janke, A. K., and R. J. Gates. 2012. Home range and habitat selection of northern
bobwhite coveys in an agricultural landscape. Journal of Wildlife Management
online.
188
Johnson, D. H. 1980. The comparison of usage and availability measurements for
evaluating resource preference. Ecology 61:65-71.
Jolliffe, I. T. 1972. Discarding variables in a principle component analysis. I: artificial
data. Applied Statistics 21:160-173.
Kaiser, H. 1958. The varimax criterion for analytic rotation in factor analysis.
Psychometrika 23:187-200.
Kassinis, N. I., and F. S. Guthery. 1996. Flight behavior of Northern bobwhites. Journal
of Wildlife Management 80:581-585.
Kay, B. J., L. E. Twigg, T. J. Korn, and H. I. Nicol. 1994. The use of artificial perches to
increase predation on house mice (Mus domesticus) by raptors. Wildlife Research
21:95-106.
Klimstra, W. D. 1982. Bobwhite quail and changing land use. Pages 1-5 in F. Schitoskey,
Jr , E. C. Shitoskey, and L. G. Talent, eds. Proceedings of the Second National
Bobwhite Quail Symposium. Oklahoma State University, Stillwater, Oklahoma,
USA.
Klimstra, W. D., and J. L. Roseberry. 1975. Nesting ecology of the bobwhite in southern
Illinois. Wildlife Monographs 41:3-37.
Klug, P. E., S. L. Jackrel, and K. A. With. 2010. Linking snake habitat use to nest
predation risk in grassland birds: the dangers of shrub cover. Oecologia 162:803-
813.
Kuvlesky, W. P., Jr., T. E. Fulbright, and R. Engel-Wilson. 2000. The impact of invasive
exotic grasses on quail in the southwestern United States. Pages 118-128 in S. J.
DeMaso, W. P. Kuvlesky, Jr., F. Hernández, and M. E. Berger, eds. Quail V: The
Fifth National Quail Symposium. Texas Parks and Wildlife Department, Austin,
Texas, USA.
Lack, D. 1947. The significance of clutch-size. Ibis 89:302-352.
Lack, D. L. 1968. Ecological adaptations for breeding in birds. Methuen, London.
189
Larivière, S. 2003. Edge effects, predator movements, and the travel-lane paradox.
Wildlife Society Bulletin 31:315-320.
Larivière, S. 1999. Reasons why predators cannot be inferred from nest remains. The
Condor 101:718-721.
Lehmann, V. M. 1946. Mobility of bobwhite quail in southern Texas. Journal of Wildlife
Management 10:124-136.
Lemmon, P. E. 1956. A spherical densiometer for estimating forest overstory density.
Forest Science 2:314-320.
Lewis, J. B. 1954. Further studies of bobwhite mobility in central Missouri. Journal of
Wildlife Management 18:414-416.
Lichti, N. I., and R. K. Swihart. 2011. Estimating utilization distributions with kernel
versus local convex hull methods. Journal of Wildlife Management 75:413-422.
Liu, X., R. M. J. Whiting, D. S. Parson, and D. R. Dietz. 2002. Movement patterns of
resident and relocated northern bobwhite in east Texas. Pages 168-172 in S. J.
DeMaso, W. J. Kuvlesky, Jr., F. Hernández, and M. Burger, eds. Quail V: The
Fifth National Quail Symposium. Texas Parks and Wildlife Department, Austin,
Texas, USA.
Lohr, M., B. M. Collins, P. M. Castelli, and C. K. Williams. 2011. Life on the edge:
northern bobwhite ecology at the northern periphery of their range. Journal of
Wildlife Management 75:52-60.
Lusk, J. J., S. G. Smith, S. D. Fuhlendorf, and F. S. Guthery. 2006. Factors influencing
northern bobwhite nest-site selection and fate. Journal of Wildlife Management
70:564-571.
Madison, L. A., R. J. Robel, and D. P. Jones. 2000. Influence of food plots on northern
bobwhite movements, habitat use, and home range. Pages 36-41 in L. A. Brennan,
W. E. Palmer, L. W. Burger, Jr., and T. Pruden, eds. Quail IV: Proceedings of the
Fourth National Quail Symposium. Tall Timbers Research Station, Tallahassee,
Florida, USA.
190
Mankin, P. C., and R. E. Warner. 1992. Vulnerability of ground nests to predation on an
agricultural habitat island in east-central Illinois. American Midland Naturalist
128:281-291.
Manly, B. F. J., L. L. McDonald, D. L. Thomas, T. L. McDonald, and W. P. Erickson.
2002. Resource selection by animals: statistical design and analysis for field
studies. 2nd edition. Kluwer Academic Publishers, Dordrecht, Netherlands.
Martin, K., P. B. Stacey, and C. E. Braun. 2000. Recruitment, dispersal, and demographic
rescue in spatially-structured white-tailed ptarmigan populations. The Condor
102:503-516.
Martin, T. E. 1993. Nest predation among vegetation layers and habitat types: revising
the dogmas. American Naturalist 141:897-913.
Mayfield, H. F. 1975. Suggestions for calculating nest success. Wilson Bulletin 87:456-
466.
Mayfield, H. F. 1961. Nesting success calculated from exposure. Wilson Bulletin 73:255-
261.
McClean, S. A., M. A. Rumble, R. M. King, and W. L. Baker. 1998. Evaluation of
resource selection methods with different definitions of availability. Journal of
Wildlife Management 62:793-801.
McCoy, T. D., E. W. Kurzejeski, L. W. Burger, and M. R. Ryan. 2001. Effects of
conservation practice, mowing, and temporal changes on vegetation structure on
CRP fields in northern Missouri. Wildlife Society Bulletin 29:979-987.
McKee, G. W., M. R. Ryan, and L. M. Mechlin. 1998. Predicting greater prairie-chicken
nest success from vegetation and landscape characteristics. Journal of Wildlife
Management 62:314-321.
Moss, R. 1982. Rain, breeding success and distribution of capercaillie Tetrao urogallus
and black grouse Tetrao tetrix in Scotland. Ibis 128:65-72.
Murphy, A., and T. Baskett. 1952. Bobwhite mobility in central Missouri. Journal of
Wildlife Management 16:498-510.
191
Nams, V. O. 2006. Locate III User's Guide. Pacer Computer Software, Tatamagouche,
Nova Scotia, Canada.
National Agricultural Statistics Service. 2012a. County estimates. United States
Department of Agriculture.
<http://www.nass.usda.gov/Statistics_by_State/Ohio/index.asp>. Accessed Apr
2012.
National Agricultural Statistics Service. 2012b. Published crop-specific data layer
[Online]. USDA-NASS, Washington, District of Columbiad, USA.
<http://nassgeodata.gmu.edu/CropScape/>. Accessed May 2012.
National Audubon Society. 2012. The Christmas bird count historical results [Online].
<http://www.audubon.org/bird/cbc>. Accessed Apr 2012.
National Bobwhite Conservation Initiative. 2011. The national bobwhite conservation
initiative: a range-wide plan for recovering bobwhites. in W. E. Palmer, T. M.
Terhune, and D. F. McKenzie, eds. National Bobwhite Technical Committee
Publication, ver 2.0. Knoxville, Tennessee, USA.
National Climate Data Center [NCDC]. 2011. Quality Controlled Local Climatological
Data. Hillsboro, Ohio, USA. <http://www.ncdc.noaa.gov/oa/ncdc/html>.
Accessed Dec 2011.
Negus, L. P., C. A. Davis, and S. E. Wessel. 2010. Avian response to mid-contract
management of Conservation Reserve Program fields. American Midland
Naturalist 164:296-310.
O'Connor, R. J., M. Shrubb, and D. Watson. 1986. Farming & birds. Cambridge
University Press, Cambridge, New York, USA.
Ohio Breeding Bird Atlas II. 2012. Ohio breeding bird atlas II, 2006-2011. The Ohio
State University, School of Environment & Natural Resources and Ohio
Department of Natural Resources, Division of Wildlife. Columbus, Ohio, USA.
<http://www.ohiobirds.org/obba2/SpeciesList.php>. Accessed Aug 2012.
192
Ohio Division of Geologic Survey. 1998. Physiographic regions of Ohio. Ohio
Department of Natural Resources. Report page-size map with text, 2p., scale
1:2,100,000.
Ohio Division of Soil and Water Resources [ODSWR]. 2012. Monthly Water Inventory
Report for Ohio, Apr-Sept 2010-2011. Ohio Department of Natural Resources.
Columbus, Ohio, USA. <http://www.ohiodnr.gov/tabid/4191/Default.aspx>.
Accessed Nov 2012.
Ohio Division of Wildlife. 2010. Ohio hunting and trapping regulations 2010-2011. Ohio
Department of Natural Resources, Division of Wildlife, Columbus, Ohio, USA.
Ohio Statewide Imagery Program. 2008. OSIP 1 Foot Color Orthophotography.
<http://gis3.oit.ohio.gov/geodata/>. Accessed Oct 2009.
Orians, G. H., and J. F. Wittenberger. 1991. Spatial and temporal scales in habitat
selection. American Naturalist 137:S29-S49.
Osborne, D. C., D. W. Sparling, and R. L. Hopkins, II. 2012. Influence of conservation
reserve program mid-contract management and landscape composition on
northern bobwhite in tall fescue monocultures. Journal of Wildlife Management
76:566-574.
Parnell, I. B., III, S. H. Schweitzer, C. G. White, and J. A. Lewis. 2002. Northern
bobwhite habitat use in a forest dominated system. in S. J. DeMaso, W. J.
Kuvlesky, Jr., F. Hernández, and M. E. Berger, eds. Quail V: The Fifth National
Quail Symposium. Texas Parks and Wildlife Department, Austin, Texas, USA.
Paton, P. W. C. 1994. The effect of edge on avian nest success: how strong is the
evidence? Conservation Biology 8:17-26.
Perlut, N. G., A. M. Strong, T. M. Donovan, and N. J. Buckley. 2006. Grassland
songbirds in a dynamic management landscape: behavioral responses and
management strategies. Ecological Applications 16:2235-2247.
Persson, O., and P. Öhrström. 1989. A new avian mating system: ambisexual polygamy
in the penduline tit (Remiz pendulinus). Ornis Scandinavica 20:105-111.

193
Peterjohn, B. G. 2001. The birds of Ohio. Wooster Book Co., Woster, Ohio, USA.
Phillips, M. L., W. R. Clark, M. A. Sovada, D. J. Horn, R. R. Koford, and R. J.
Greenwood. 2003. Predator selection of prairie landscape features and its relation
to duck nest success. Journal of Wildlife Management 67:104-114.
Piper, R. D. 1973. Measurement techniques for herbaceous and shrubby vegetation. New
Mexico State University Press, Las Cruces, New Mexico, USA.
Pollock, K. H., S. R. Winterstein, C. M. Bunck, and P. D. Curtis. 1989. Survival analysis
in telemetry studies: the staggered entry design. Journal of Wildlife Management
53:7-15.
Porter, W. F., and K. E. Church. 1987. Effects of environmental pattern on habitat
preference analysis. Journal of Wildlife Management 51:681-685.
Potter, L. M., D. L. Otis, and T. R. Bogenschutz. 2011. Nest success of northern
bobwhite on managed and unmanaged landscapes in southeast Iowa. Journal of
Wildlife Management 75:46-51.
R Development Core Team. 2012. R: A language and environment for statistical
computing. Vienna, Austria.
Rader, M. J., L. A. Brennan, K. A. Brazil, F. Hernández, and N. J. Silvy. 2011.
Simulating northern bobwhite population responses to nest predation, nesting
habitat, and weather in south Texas. Journal of Wildlife Management 75:61-70.
Rader, M. J., T. W. Teinert, L. A. Brennan, F. Hernández, N. J. Silvy, and X. Ben Wu.
2007. Identifying predators and nest fates of bobwhites in southern Texas. Journal
of Wildlife Management 71:1626-1630.
Renfrew, R. B., and C. A. Ribic. 2003. Grassland passerine nest predators near pasture
edges identified on videotape. The Auk 120:371-383.
Riddle, J. D., C. E. Moorman, and K. H. Pollock. 2008. The importance of habitat shape
and landscape context to northern bobwhite populations. Journal of Wildlife
Management 72:1376-1382.
194
Riffell, S., D. Scognamillo, and L. W. Burger. 2008. Effects of the Conservation Reserve
Program on northern bobwhite and grassland birds. Environmental Monitoring
and Assessment 146:309-323.
Robel, R. J., J. N. Briggs, A. D. Dayton, and L. C. Hulbert. 1970. Relationships between
visual obstruction measurements and weight of grassland vegetation. Journal of
Range Management 23:295-297.
Rolland, V., J. A. Hostetler, T. C. Hines, H. F. Percival, and M. K. Oli. 2011. Factors
influencing reproductive performance of northern bobwhite in south Florida.
European Journal of Wildlife Research 57:717-727.
Roseberry, J. L. 1964. Responses of bobwhites to snow cover in southern Illinois. Journal
of Wildlife Management 28:244-249.
Roseberry, J. L., and W. D. Klimstra. 1984. Population ecology of the bobwhite.
Southern Illinois University Press, Carbondale, Illinois, USA.
Rosene, W. 1969. The bobwhite quail: its life and management. Rutgers University Press,
New Brunswick, New Jersey, USA.
Ryan, M. R. 2000. Conservation Reserve Program: impact of the Conservation Reserve
Program on wildlife conservation in the Midwest. Pages 45-54 in W. L. Hohman,
and D. J. Halloum, eds. United States Department of Agriculture, Natural
Resource Conservation Service, Wildlife Habitat Management Institute,
(USDA/NRCS/WHMI). Technical Report 2000, Ames, Iowa, USA.
Ryan, M. R., L. W. Burger, and E. W. Kurzejeski. 1998. The impact of CRP on avian
wildlife: a review. Journal of Production Agriculture 11:61-66.
Sala, O. E., W. J. Parton, L. A. Joyce, and W. K. Lauenroth. 1988. Primary production of
the central grassland region of the United States. Ecology 69:40-45.
Sandercock, B. K., W. E. Jensen, C. K. Williams, and R. D. Applegate. 2008.
Demographic sensitivity of population change in northern bobwhite. Journal of
Wildlife Management 72:970-982.
195
Sauer, J. R., J. E. Hines, J. E. Fallon, K. L. Pardieck, D. J. Ziolkowski, Jr., and W. A.
Link. 2011. The North American Breeding Bird Survey, summary and analysis
1966-2010, Version 12.07.2011. USGS Patuxent Wildlife Research Center,
Laurel, Maryland, USA.
Seaman, D. E., J. J. Millspaugh, B. J. Kernohan, G. C. Brundige, K. J. Raedeke, and R.
A. Gitzen. 1999. Effects of sample size on kernel home range estimates. Journal
of Wildlife Management 63:739-747.
Sermon, W. O., and D. W. Speake. 1987. Production of second broods by northern
bobwhites. Wilson Bulletin 99:285-286.
Shaffer, T. L. 2004. A unified approach to analyzing nest success. The Auk 121:526-540.
Silverman, B. W. 1986. Density estimation for statistics and data analysis. Chapman and
Hall, London, UK.
Simpson, R. C. 1972. Relationship of postburn intervals to the incidence and success of
bobwhite nesting in southwest Georgia. Pages 150-158 in J. A. Morrison, and J.
C. Lewis, eds. Proceedings of the First National Bobwhite Quail Symposium.
Oklahoma State University, Stillwater, Oklahoma, USA.
Singh, A., T. C. Hines, J. A. Hostetler, H. F. Percival, and M. K. Oli. 2011. Patterns of
space and habitat use by northern bobwhites in South Florida, USA. European
Journal of Wildlife Research 57:15-26.
Singh, A., T. C. Hines, H. F. Percival, and M. K. Oli. 2010. Does nest-site selection
influence bobwhite nesting success in south Florida? Wildlife Research 37:489-
496.
Smith, G. F., F. E. Kellogg, G. L. Doster, and E. E. Provost. 1982. A 10-year study of
bobwhite quail movement patterns. Pages 35-44 in F. Schitoskey, Jr , E. C.
Shitoskey, and L. G. Talent, eds. Proceedings of the Second National Bobwhite
Quail Symposium. Oklahoma State University, Stillwater, Oklahoma, USA
Sparling, D. W., and D. C. Osborne. 2009. Responses of bobwhite, vegetation, and
invertebrates to three methods of renovating monotypic conservation reserve
196
program grasslands in south-central Illinois. United States Department of
Agriculture, Natural Resources Conservation Service.
Speake, D. W. 1960. Quail reproduction and weather in Alabama. Proceeding of the
Annual Conferences of the Southeastern Association of Fish and Wildlife
Agencies 14:85-97.
Spinola, R. M., and R. J. Gates. 2008. Population status and trends of northern bobwhite
(Colinus virginianus) in Ohio: 1984-2004. Ohio Journal of Science 108:26-30.
Stahl, J. T., and M. K. Oli. 2006. Relative importance of avian life history variables to
population growth rate. Ecological Modelling 198:23-39.
Staller, E. L., W. E. Palmer, and J. P. Carroll. 2002. Macrohabitat composition
surrounding successful and depredated northern bobwhite nests. Pages 61-64 in S.
J. DeMaso, W. P. Kuvlesky, Jr., F. Hernández, and M. E. Berger, eds. Quail V:
The Fifth National Quail Symposium. Texas Parks and Wildlife, Austin, Texas,
USA
Staller, E. L., W. E. Palmer, J. P. Carroll, R. P. Thornton, and D. C. Sisson. 2005.
Identifying predators at northern bobwhite nests. Journal of Wildlife Management
69:124-132.
Stanford, J. A. 1972. Second broods in bobwhite quail. Pages 21-27 in J. A. Morrison,
and J. C. Lewis, eds. Proceedings of the First National Bobwhite Quail
Symposium. Oklahoma State University, Stillwater, Oklahoma, USA
Stoddard, H. 1931. The bobwhite quail: its habitats, preservation, and increase. Charles
Scribner's Sons, New York, New York, USA.
Suchy, W. J., and R. J. Munkel. 2000. Survival rates of northern bobwhite chicks in
south-central Iowa. Pages 82-84 in L. A. Brennan, W. E. Palmer, L. W. Burger,
Jr., and T. Pruden, eds. Quail IV: Proceedings of the Fourth National Quail
Symposium. Tall Timbers Research Station, Tallahassee, Florida, USA.
Suchy, W. J., and R. J. Munkel. 1993. Breeding strategies of the northern bobwhite in
marginal habitat. Pages 69-73 in K. E. Church, and T. V. Dailey, eds. Quail III:
197
National Quail Symposium. Kansas Department of Wildlife and Parks, Pratt,
Kansas, USA.
Swanson, D. A., D. P. Scott, and D. L. Risley. 1999. Wildlife benefits of the
Conservation Reserve Program in Ohio. Journal of Soil and Water Conservation
54:390-394.
Taylor, J. D., II , and L. W. Burger, Jr. . 2000. Habitat use by breeding northern
bobwhites in managed old-field habitats in Mississippi. Pages 7-15 in L. A.
Brennan, W. E. Palmer, L. W. Burger, Jr. , and T. L. Pruden, eds. Quail IV:
Proceedings of the Fourth National Quail Symposium. Tall Timbers Research
Station, Tallahassee, Florida, USA
Taylor, J. S., K. E. Church, and D. H. Rusch. 1999a. Microhabitat selection by nesting
and brood-rearing northern bobwhite in Kansas. Journal of Wildlife Management
63:686-694.
Taylor, J. S., K. E. Church, D. H. Rusch, and J. R. Cary. 1999b. Macrohabitat effects on
summer survival, movements, and clutch success of northern bobwhite in Kansas.
Journal of Wildlife Management 63:675-685.
Terhune, T. M., D. C. Sisson, W. E. Palmer, B. C. Faircloth, H. L. Stribling, and J. P.
Carroll. 2010. Translocation to a fragmented landscape: survival, movement, and
site fidelity of northern bobwhites. Ecological Applications 20:1040-1052.
Terhune, T. M., D. C. Sisson, H. L. Stribling, and J. P. Carroll. 2006. Home range,
movement, and site fidelity of translocated northern bobwhite (Colinus
virginianus) in southwest Georgia, USA. European Journal of Wildlife Research
52:119-124.
Townsend, D. E., Jr., D. M. Leslie, Jr., R. L. Lochmiller, S. J. DeMaso, S. A. Cox, and A.
D. Peoples. 2003. Fitness costs and benefits associated with dispersal in northern
bobwhites (Colinus virginianus). American Midland Naturalist 150:73-82.
Townsend, D. E., Jr., R. E. Masters, R. L. Lochmiller, D. M. Leslie, Jr., S. J. DeMaso,
and A. D. Peoples. 2001. Characteristics of nest sites of northern bobwhites in
western Oklahoma. Journal of Range Management 54:260-264.
198
Trani, M. K., R. T. Brooks, T. L. Schmidt, V. A. Rudis, and C. M. Gabbard. 2001.
Patterns and trends of early-successional forests in the eatern United States.
Wildlife Society Bulletin 29:413-424.
Trautman, M. 1977. The Ohio country from 1750 to 1977: a naturalist's view. Ohio State
University, Columbus, Ohio, USA.
Trent, T. T., and O. J. Rongstad. 1974. Home range and survival of cottontail rabbits in
southwestern Wisconsin. Journal of Wildlife Management 38:459-472.
Urban, D. 1972. Aspects of bobwhite quail mobility during spring through fall months.
Pages 194-199 in J. A. Morrison, and J. C. Lewis, eds. Proceedings of the First
National Bobwhite Quail Symposium. Oklahoma State University, Stillwater,
Oklahoma, USA
Veech, J. A. 2006. Increasing and declining populations of northern bobwhites inhabit
different types of landscapes. Journal of Wildlife Management 70:922-930.
Walk, J. W., and R. E. Warner. 2000. Grassland management for the conservation of
songbirds in the Midwestern USA. Biological Conservation 94:165-172.
Walters, J. 2000. Dispersal behavior: an ornithological frontier. The Condor 102:479-
478.
Warner, R. E. 1992. Nest ecology of grassland passerines on road rights-of-way in central
Illinois. Biological Conservation 59:1-7.
White, G. C., and K. P. Burnham. 1999. Program MARK: survival estimation from
populations of marked animals. Bird Study 46 Supplement:120-138.
White, G. C., and R. A. Garrott. 1999. Analysis of wildlife radio-tracking data. Academic
Press, San Diego, California, USA.
Wiley, M. J. 2012. Multi-scale assessment of usable space for northern bobwhites in
Ohio. Thesis, The Ohio State University, Columbus, Ohio, USA.
199
Wiley, M. J., R. J. Gates, and A. K. Janke. 2012. Efficacy of targeted mist netting to
capture northern bobwhites during the non-breeding season. Proceedings of the
National Quail Symposium 7: in press.
Williams, C. K., F. S. Guthery, R. D. Applegate, and M. J. Peterson. 2004. The northern
bobwhite decline: scaling our management for the twenty-first century. Wildlife
Society Bulletin 32:861-869.
Williams, C. K., A. R. Ives, and R. D. Applegate. 2003. Population dynamics across
geographical ranges: time-series analyses of three small game species. Ecology
84:2654-2667.
Williams, C. K., R. S. Lutz, R. D. Applegate, and D. H. Rusch. 2000. Habitat use and
survival of northern bobwhite (Colinus virginianus) in cropland and rangeland
ecosystems during the hunting season. Canadian Journal of Zoology 78:1562-
1566.
Winter, M., D. H. Johnson, and J. Faaborg. 2000. Evidence for edge effects on multiple
levels in tallgrass prairie. The Condor 102:256-266.
With, K. A. 1994. The hazards of nesting near shrubs for a grassland bird, the McCown's
longspur. The Condor 96:1009-1019.
Wood, K. N., F. S. Guthery, and N. E. Koerth. 1986. Spring-summer nutrition and
condition of northern bobwhites in south Texas. Journal of Wildlife Management
50:84-88.
Worton, B. J. 1995. Using Monte Carlo simulation to evaluate kernel-based home range
estimators. Journal of Wildlife Management 59:794-800.
Worton, B. J. 1989. Kernel methods for estimating the utilization distribution in home-
range studies. Ecology 70:164-168.
Worton, B. J. 1987. A review of models of home range for animal movement. Ecological
Modelling 38:277-298.
200
Yoder, J., E. Marschall, and D. Swanson. 2004. The cost of dispersal: predation as a
function of movement and site familiarity in ruffed grouse. Behavioral Ecology
15:469-476.
Yoho, N. S., and R. W. Dimmick. 1972. Habitat utilization by bobwhite quail during
winter. Pages 90-99 in J. A. Morrison, and J. C. Lewis, eds. Proceedings of the
First National Bobwhite Quail Symposium. Oklahoma State University,
Stillwater, Oklahoma, USA.