Embed Size (px)
Citation preview
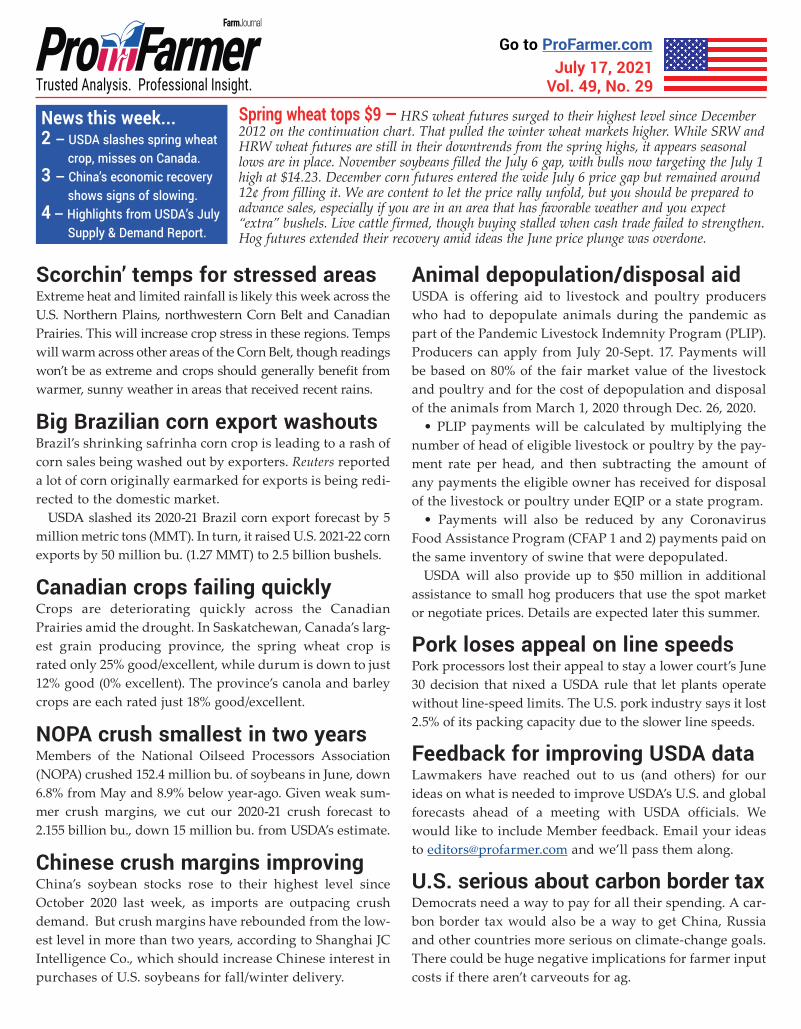
Scorchin’ temps for stressed areasExtreme heat and limited rainfall is likely this week across the U.S. Northern Plains, northwestern Corn Belt and Canadian Prairies. This will increase crop stress in these regions. Temps will warm across other areas of the Corn Belt, though readings won’t be as extreme and crops should generally benefit from warmer, sunny weather in areas that received recent rains.
Big Brazilian corn export washoutsBrazil’s shrinking safrinha corn crop is leading to a rash of corn sales being washed out by exporters. Reuters reported a lot of corn originally earmarked for exports is being redi-rected to the domestic market.
USDA slashed its 2020-21 Brazil corn export forecast by 5 million metric tons (MMT). In turn, it raised U.S. 2021-22 corn exports by 50 million bu. (1.27 MMT) to 2.5 billion bushels.
Canadian crops failing quicklyCrops are deteriorating quickly across the Canadian Prairies amid the drought. In Saskatchewan, Canada’s larg-est grain producing province, the spring wheat crop is rated only 25% good/excellent, while durum is down to just 12% good (0% excellent). The province’s canola and barley crops are each rated just 18% good/excellent.
NOPA crush smallest in two yearsMembers of the National Oilseed Processors Association (NOPA) crushed 152.4 million bu. of soybeans in June, down 6.8% from May and 8.9% below year-ago. Given weak sum-mer crush margins, we cut our 2020-21 crush forecast to 2.155 billion bu., down 15 million bu. from USDA’s estimate.
Chinese crush margins improvingChina’s soybean stocks rose to their highest level since October 2020 last week, as imports are outpacing crush demand. But crush margins have rebounded from the low-est level in more than two years, according to Shanghai JC Intelligence Co., which should increase Chinese interest in purchases of U.S. soybeans for fall/winter delivery.
Spring wheat tops $9 — HRS wheat futures surged to their highest level since December 2012 on the continuation chart. That pulled the winter wheat markets higher. While SRW and HRW wheat futures are still in their downtrends from the spring highs, it appears seasonal lows are in place. November soybeans filled the July 6 gap, with bulls now targeting the July 1 high at $14.23. December corn futures entered the wide July 6 price gap but remained around 12¢ from filling it. We are content to let the price rally unfold, but you should be prepared to advance sales, especially if you are in an area that has favorable weather and you expect “extra” bushels. Live cattle firmed, though buying stalled when cash trade failed to strengthen. Hog futures extended their recovery amid ideas the June price plunge was overdone.
Animal depopulation/disposal aidUSDA is offering aid to livestock and poultry producers who had to depopulate animals during the pandemic as part of the Pandemic Livestock Indemnity Program (PLIP). Producers can apply from July 20-Sept. 17. Payments will be based on 80% of the fair market value of the livestock and poultry and for the cost of depopulation and disposal of the animals from March 1, 2020 through Dec. 26, 2020.
• PLIP payments will be calculated by multiplying the number of head of eligible livestock or poultry by the pay-ment rate per head, and then subtracting the amount of any payments the eligible owner has received for disposal of the livestock or poultry under EQIP or a state program.
• Payments will also be reduced by any Coronavirus Food Assistance Program (CFAP 1 and 2) payments paid on the same inventory of swine that were depopulated.
USDA will also provide up to $50 million in additional assistance to small hog producers that use the spot market or negotiate prices. Details are expected later this summer.
Pork loses appeal on line speedsPork processors lost their appeal to stay a lower court’s June 30 decision that nixed a USDA rule that let plants operate without line-speed limits. The U.S. pork industry says it lost 2.5% of its packing capacity due to the slower line speeds.
Feedback for improving USDA dataLawmakers have reached out to us (and others) for our ideas on what is needed to improve USDA’s U.S. and global forecasts ahead of a meeting with USDA officials. We would like to include Member feedback. Email your ideas to [email protected] and we’ll pass them along.
U.S. serious about carbon border taxDemocrats need a way to pay for all their spending. A car-bon border tax would also be a way to get China, Russia and other countries more serious on climate-change goals. There could be huge negative implications for farmer input costs if there aren’t carveouts for ag.
News this week...2 — USDA slashes spring wheat crop, misses on Canada.3 — China’s economic recovery shows signs of slowing. 4 — Highlights from USDA’s July Supply & Demand Report.
July 17, 2021 Vol. 49, No. 29
Go to ProFarmer.com

July 17, 2021 / News page 2
Follow us on Twitter:@ProFarmer@BGrete
@ChipFlory@MeghanVick
@DavisMichaelsen@BruceBlythe
NWS: Hot, mixed precip for AugustThe 30-day forecast from the National Weather Service (NWS) suggests far western and north-western areas of the Corn Belt will con-tinue to face heat and moisture stress dur-ing August as crops are filling. There are also elevated odds of above-normal temps over the north-cen-tral and northeastern Corn Belt. Above-normal rains are
expected across southeastern areas of the region, with “equal chances” for August rainfall across the bulk of the Corn Belt.
Ratings signal slightly subtrend yieldsUSDA raised its “good” to “excellent” rating for the corn crop by one point to 65% as of July 11. The amount of crop rated “poor” to “very poor” edged a point lower to 8%. USDA made no changes to its weekly soybean ratings, with 59% of the crop rated “good” to “excellent” and 11% “poor” to “very poor.”
With corn starting to pollinate, crop conditions mean more to final yield. Since USDA began its national crop ratings in 1986, there have been 10 years when corn ratings were within three points of 65% “good” to “excellent” on July 11. The aver-age of the 10 years applied against USDA’s trendline of 179.5 bu. per acre would project a yield of 177.6 bu per acre this year.
There were 11 years soybean ratings were within three points of 59% “good” to “excellent” for this date. The aver-age of the 11 years applied against USDA’s trend of 50.8 bu. per acre would project a yield of 50.6 bu. per acre.
Cotton crop conditions improveCotton condition ratings improved notably during the week ended July 11, with the amount of crop USDA rated “good” to “excellent” jumping four points to 56% and the “poor” to “very poor” categories dropping a point to 9%. Reflecting the improved crop conditions over the past month, USDA raised harvested area by 870,000 acres and cut the national average yield by 33 lbs., as more low-yielding West Texas acres are expected to be harvested. There are four recent years (2014, 2015, 2016 and 2019) with condition ratings of plus or minus three points from 56% and the yield averaged 825 lbs. in those years. That seems like a more reasonable yield than the 814 lbs. USDA projected this month.
Spring wheat crop likely to get smallerUSDA estimated the U.S. wheat crop at 1.746 billion bu., 101 million bu. lower than anticipated, despite the winter wheat crop estimate being 33 million bu. bigger than expected. USDA’s national average all-wheat yield at 45.8 bu. per acre dropped 4.9 bu. per acre from last month.
USDA’s first estimate of the U.S. other spring wheat crop at 345 million bu. was 114 million bu. below the aver-age pre-report estimate and 241 million bu. lower
than last year. USDA estimated the other spring wheat yield at 30.7 bu. per acre. While USDA slashed U.S. spring wheat yields and production due to extreme drought in the Northern Plains, harvested acreage was left unchanged from the June 30 Acreage Report. Abandonment of 3.2% is too low given the drought struggles and reports of farmers baling spring wheat. Abandonment could rise significant-ly, though that would also raise the yield.
The durum wheat crop at 37 million bu. was 19 million bu. below expectations and 32 million bu. lower than last year.
Spring wheat ratings keep plungingUSDA’s spring wheat crop rating held at 16% “good” to “excellent,” though there was a one-point drop from the top category. The portion of crop rated “poor” to “very poor” increased five points to 55%.
On the weighted Pro Farmer Crop Condition Index (CCI; 0 to 500-point scale, with 500 representing perfect), the spring wheat crop plunged another 9.8 points to just 243.9 points. The CCI rating was 115.2 points below the five-year average.
USDA ‘out to lunch’ on Canadian cropsUSDA cut its Canadian all wheat estimate by just 500,000 met-ric tons (MT) to 31.5 million metric tons (MMT). Canada-based MarketsFarm estimates the country’s wheat production at 26.1 MMT. USDA trimmed just 200,000 MT from its Canadian canola crop forecast, lowering it to 20.2 MMT. Canadian exporters fear the crop will be 3 MMT to 5 MMT lower.
Mike Jubinville at MarketsFarm says, “In our view, USDA is out to lunch on Canada.”
U.S. wheat production (Mil. bu.)
NWS 30-day Temps
A: Above-normalB: Below-normalEC: Equal chances August
NWS 30-day Precip
A: Above-normalB: Below-normalEC: Equal chances August

July 17, 2021 / News page 3
China’s economic growth slowsChina’s gross domestic product (GDP) grew 7.9% in the second quarter, falling short of expectations and down sharply from the 18.3% expansion in the first quarter. Strong trade figures have supported China’s economic recovery. Its exports grew 32.2% versus year-ago in June and imports surged 36.7%. But Chinese officials warn trade growth will slow during the second half of this year. An official with China’s National Bureau of Statistics called the country’s economic recovery “uneven” and warned there are “many external instabilities and uncertain factors.”
Economists expect China will have to roll out additional monetary policy easing measures after cutting the amount of funds banks have to hold in reserve, as economic head-winds are likely to build in the months ahead.
China’s soy, grain imports stay strongChina imported 10.7 MMT of soybeans during June, an 11.6% jump from May but 3.9% less than last year’s record of 11.2 MMT. For the first half of this year, China imported nearly 49.0 MMT of soybeans, up 8.7% from the same period last year.
China also imported 15.3 MMT of corn and 5.4 MMT of wheat in the first half of 2021, surges of 318.5% and 60.1%, respectively, versus the first six months of last year.
China’s meat imports slowed in JuneChina imported 743,000 MT of meat in June, down 5.8% from May and a 17% retreat from year-ago levels. Falling domestic pork prices slowed China’s demand for imports. For the first half of 2021, China imported 5.1 MMT of meat, up 6.9% from the same period last year.
Resurgence of ASF in ChinaReports out of China signal African swine fever (ASF) cases are rising in the top hog-producing province Sichuan. Many small Chinese farmers are reportedly culling hogs out of fear they will lose their whole herd to the disease. This will put more pork on the domestic market short-term but would slow the country’s herd rebuilding efforts.
China will no longer require small hog farms to receive environmental approval before breeding pigs.
Surge in China’s Q2 pork outputChina’s pork production shot to a seven-year high of 13.5 MMT in the second quarter, up 40% from the same period last year and well above the usual 10 MMT produced for the quarter. Chinese pork output surged 35.9% versus year-ago in the first half of 2021 to 27.2 MMT. China slaughtered 337.42 million hogs the first half of this year, a 34% jump from last year. China’s hog herd stood at 439.1 million head at the end of June, up 29% from last year.
Producer Crop Comments...Please send crop comments to [email protected].
Black Hawk Co. (northeast) Iowa:“I traveled to Iowa City, across to Des Moines and back home July 9-11. There were spots with lighter soils that stood out in some of the fields and a few fields that didn’t look quite as good. But overall, crops were tall, dark green and should have strong yield potential.”
Black Hawk Co. (northeast) Iowa:“Drove from Chetek, Wisconsin, to Waterloo, Iowa. Wow, this past month has been good for crops. A month earlier along the same route, crops looked terri-ble and now they look great.”
Linn Co. (east-central) Iowa:“Drove to Destin, Florida. From the road, crops sure look promising pretty much the whole way. East and south of St. Louis is typically an area of the country where expectations aren’t always the biggest.”
Polk Co. (central) Iowa:“Took a 700- mile round trip from central Iowa up to south-central Minnesota, across to southwest Minnesota and then returned via I-90 and I-35. Des Moines to Albert Lea, crops look good to excellent. Crops are solid from Albert Lea to Fairmont. West of Fairmont to Worthington, crops become more variable. Prior stress is evident. There are pockets of both good and poor corn north of Worthington and east of Marshall. About 40 miles east of Marshall and south there are more uniformly good look-ing crops again. Crops looked better than expected for the majority, with some problem areas west.”
Cass Co. (west-central/southwest) Illinois:“We’ve had too much water the past couple weeks — 11 inches since June 24. Beans are dying from all the pon-ded water. Yellow soybeans are all around our area.”
Iroquois Co. (east-central) Illinois:“Soybeans aren’t looking too good after all this rain.”
Champaign Co. (east-central) Illinois:“Crops just south of Champaign probably look the best they ever have. We were dry early.”
Adams Co. (northeast) Indiana:“I drove from Rockville, Indiana to Assumption, Illinois. Every field I passed it wasn’t a question if water hurt it, but how much. The perfect crop isn’t perfect anymore.”
Allen Co. (northeast) Indiana:“I have corn fields that have had too much water; ground is saturated and oxygen deprived. Other fields look like a bumper crop. Crazy weather.”
Faribault Co. (south-central) Minnesota:“Ahead of July 4, corn leaves were curled and soybeans leaves were turned over from drought. After four inches of rain, it’s almost like you can’t believe how good the crops look. The beans are lush and the corn is the deep-est green color I can remember. There may be areas of some fields with lighter soil that may have been badly hurt by the drought, but it is amazing how heavy soils were able to sustain the crop until the rains came!”

July 17, 2021 / News page 4
Corn — USDA trimmed old-crop corn ending stocks by 25 million bu. to 1.082 billion bu. on a 25-million-bu. increase to feed and residual use.
For 2021-22, USDA raised projected ending stocks by 75 million bu. from last month to 1.432 billion bushels. It increased planted and harvested corn acre-age based on the June 30 Acreage Report. That added 150 million bu. to total projected new-crop supplies. Only partially offsetting that increase was a 75-million-bu. rise in projected use. USDA raised feed and residual use by 25 million bu. and increased projected exports by 50 million bushels.
Our corn ending stocks forecasts are 1.034 billion bu. for 2020-21 and 1.200 billion bu. for 2021-22.
• USDA 2020-21 price: $4.40, up a nickel from June; 2021-22: $5.60, down a dime.Global corn carryover: 279.9 million metric tons (MMT) for 2020-21, down
740,000 metric tons (MT) from June; 291.2 MMT for 2021-22, up 1.8 MMT.
Soybeans — USDA left its old-crop soybean ending stocks forecast unchanged at 135 million bushels. USDA lowered estimated imports by 15 million bu., which was offset by a 5-million-bu. cut to crush and a 10-million-bu. reduction to exports.
For 2021-22, USDA left projected ending stocks unchanged from last month at 155 million bu. and made no changes to the supply or demand projections.
Our soybean ending stocks forecasts are 140 million bu. for 2020-21 and 120 million bu. for 2021-22.
• USDA 2020-21 price: $11.05, down 20¢ from June; 2021-22: $13.70, down 15¢.Global soybean carryover: 91.5 MMT for 2020-21, up 3.5 MMT from last
month; 94.5 MMT for 2021-22, up 1.9 MMT.
Wheat — Wheat ending stocks for 2020-21 were set at 844 million bu. in the June 30 Grain Stocks Report. USDA made minor adjustments to supply and demand.
For 2021-22, USDA cut its wheat ending stocks projection by 105 million bu. to 665 million bushels. It lowered projected total supplies by 140 million bushels. On the demand side of the new-crop balance sheet, USDA lowered feed and residual use by 10 million bu. and projected exports by 25 million bushels.
Our wheat ending stocks forecast is 700 million bu. for 2021-22. • USDA 2020-21 price: $5.05, unchanged from June; 2021-22: $6.60, up a dime.Global wheat carryover: 290.2 MMT for 2020-21, down 3.3 MMT from June;
291.7 MMT for 2021-22, down 5.1 MMT.
Cotton — USDA made no changes to the old-crop cotton balance sheet.For 2021-22, USDA raised projected ending stocks by 400,000 bales from last
month to 3.3 million bales. It increased total supplies by 800,000 bales as har-vested acres were raised, which more than offset a 33-lb. cut to the projected yield. On the demand side, projected exports were raised 400,000 bales.
Our cotton ending stocks forecasts are 3.05 million bales for 2020-21 and 3.5 million bales for 2021-22.
• USDA 2020-21 price: 66.5¢, down 0.5¢ from last month; 2021-22: 75¢, unchanged.Global cotton carryover: 91.6 million bales for 2020-21, down 1.5 million bales
from June; 87.7 million bales for 2021-22, down 1.6 million bales.
Corn CarryoverU.S. (Bil. Bu.)/Global (MMT)
Soybean CarryoverU.S. (Mil. Bu.)/Global (MMT)
Wheat CarryoverU.S. (Mil. Bu.)/Global (MMT)
Cotton CarryoverU.S. (Mil. Bales)/Global (Mil. Bales)
New-crop corn ending stocks lower than expectedby Editor Brian Grete
News alert and analysis exclusively for Members of Professional Farmers of America® 402 1/2 Main St. Cedar Falls, Iowa 50613-9985General Manager Joel Jaeger • Editor Brian Grete • Editor Emeritus Chip Flory • Chief Economist Bill Nelson • Market Analyst Bruce Blythe • Washington Policy Analyst Jim Wiesemeyer
• Digital Managing Editor Meghan Vick • Technical Consultant Jim Wyckoff • Market Economist Consultant Dan Vaught • LandOwner Editor Davis MichaelsenSubscription Services: 1-800-772-0023 • Editorial: 1-888-698-0487
©2021 Professional Farmers of America, Inc. • E-mail address: [email protected] Journal CEO, Andrew Weber

Feed MonitorFEED
Corn Game Plan: Seasonals are price-negative during July, especially in years when post-Fourth prices are lower. We are targeting sub-$5.00 in December fu-tures to extend coverage.
Meal Game Plan: Make sure you are cur-rent with advised cash soybean meal cov-erage on a drop below $350.00 in Septem-ber futures. Seasonals are price-negative.
Corn III’21 67% IV’21 0% I’22 0% II’22 0%
Meal III’21 83% IV’21 25% I’22 0% II’22 0%
Analysis page 1
DAILY SEPTEMBER SOYBEAN MEAL
$379.20
DAILY AUGUST LEAN HOGS
Position Monitor
HOGS - Fundamental AnalysisPork production is running at its lowest levels of the year, but will likely rebound above summer 2019 rates in the near future. Meanwhile, elevated beef prices are apparently spurring consumer substitution demand for various pork grilling cuts, which has helped power the recent advance in pork cutout values. Futures reacted well to the emerging cash and wholesale strength last week and seem likely to remain relatively high through much of July. But the usual late summer-fall production surge will almost surely undercut markets, so seeking price protection is warranted.
Game Plan: On July 14, we ad-vised exiting the 25% third-quarter hedges in July hogs. Be prepared to add fourth-quarter hedges when the rebound in October hogs stalls.
BEEF PRODUCTION (MIL. LBS.)
PORK PRODUCTION (MIL. LBS.)
Position MonitorGame Plan:Fed cattle p r o d u c e r s should con-tinue to carry risk in the cash mar-ket. But be prepared to hedge if fu-tures stall around the highs.
Feds Feeders III’21 0% 0% IV’21 0% 0% I’22 0% 0% II’22 0% 0%
The July 15 setback re-established initialresistance at $104.60.
DAILY AUGUST LIVE CATTLECATTLE - Fundamental AnalysisThe Choice beef cutout has declined steadily since soaring to $338.56 in early June, but has since fallen over $65.00. Why, then, are cash cattle and futures prices rising? They are simply playing catch-up to the wholesale market. For example, the 2015 record for Choice beef values prior to last year’s Covid-driven spike was $263.19; cash cattle prices had peaked at $167.95 a few weeks earlier. Cattle and beef supplies are now much larger, which largely explains the price disparity. Ultimately, cash cattle prices have seldom topped $130 in recent years. Large deferred premiums will also tend to boost supplies.
$342.30
The recent downtrend places resistance around $123.00.
Initial support is marked by the 40-day moving average (green line) near $120.65.
Psychological support is at $100.00 (not shown). Support at
$97.80 should prove stronger.
$110.25
$125.775
$104.60
$97.80
$95.225
July 17, 2021ANALYSIS
Lean Hogs III’21 0% IV’21 0% I’22 0% II’22 0%
The 40-day moving average (green line) puts resistance around $377.00.
The extended trendline provides support near $345.65.

July 17, 2021 / Analysis page 2
$6.42 3/4
DAILY SEPTEMBER SRW WHEAT
WHEAT - Fundamental AnalysisSRW — Heavy early July rains over the eastern Corn Belt didn’t help the SRW harvest, although news of damage from excess moisture has been minimal. Still, spillover buying from rising HRS futures has clearly boosted SRW values as well. Seasonal corn weakness could undercut rallies.
Position Monitor
Game Plan: You should get current with ad-vised sales. There’s additional near-term upside potential on spring wheat crop concerns and as winter wheat harvest nears completion. But we want to use the rally to extend sales.
Last week’s advance made stiff resistance at $7.11 3/4 bulls’ next target. A push above
that level would put the contract high at $7.67 1/2 in their sights.
The rally flipped resistance at the 40-day moving average (green line) to initial support near $6.64 1/4.
Additional support is layered down to $6.15 1/2.
$7.11 3/4
$6.15 1/2
CORN EXPORT BOOKINGS (MMT)AVERAGE CORN BASIS (SEPTEMBER)
CORN - Fundamental AnalysisAlthough it looks as if the bulk of the U.S. corn crop will escape its critical pollination period relatively unscathed, the prospect of returning heat and dryness to areas of the Corn Belt boosted the market last week. This may partially reflect strength spilling over from the soybean market. The rally also came amid news export sales of several commodities to China declined substantially. This surprising strength seemingly bodes well for the price outlook, but the market’s historical tendency toward declines during mid-to-late summer routinely stems from “normal” production developments. Use rallies to build risk protection.
The 40-day moving average (green line) places resistance at $5.75 1/2.
The May 26 low at $5.25 represents solid support.
Additional support is likely to emerge around $5.05 (not marked).
DAILY SEPTEMBER 2021 CORN
$5.82
$5.25
DAILY DECEMBER CORN Position Monitor
Game Plan: Seasonals are price-negative dur-ing July, especially in years when prices are lower coming out of the Fourth of July holiday. December futures have recovered to our target of $5.50, but we want to let the price recovery from the July 9 low extend as far as it can. We still view rallies as selling opportunities, so be prepared to increase 2021-crop sales when the price rebound runs out of steam.
Bulls struggled to sustain last week’s push above 40-day moving average resistance (green line) near $5.58 1/2.
Solid support at $5.13 3/4 is loosely backed by psychological support at $5.00 and by the March 31 high of $4.77 1/2.
$5.13 3/4
$5.93
$4.77 1/2
$6.38 ’20 crop ’21 crop
Cash-only: 90% 30% Hedgers (cash sales): 90% 30% Futures/Options 0% 0%
’21 crop ’22 cropCash-only: 60% 10%
Hedgers (cash sales): 60% 10% Futures/Options 0% 0%
July 17, 2021 / Analysis page 3
DAILY SEPTEMBER HRS WHEATDAILY SEPTEMBER HRW WHEAT
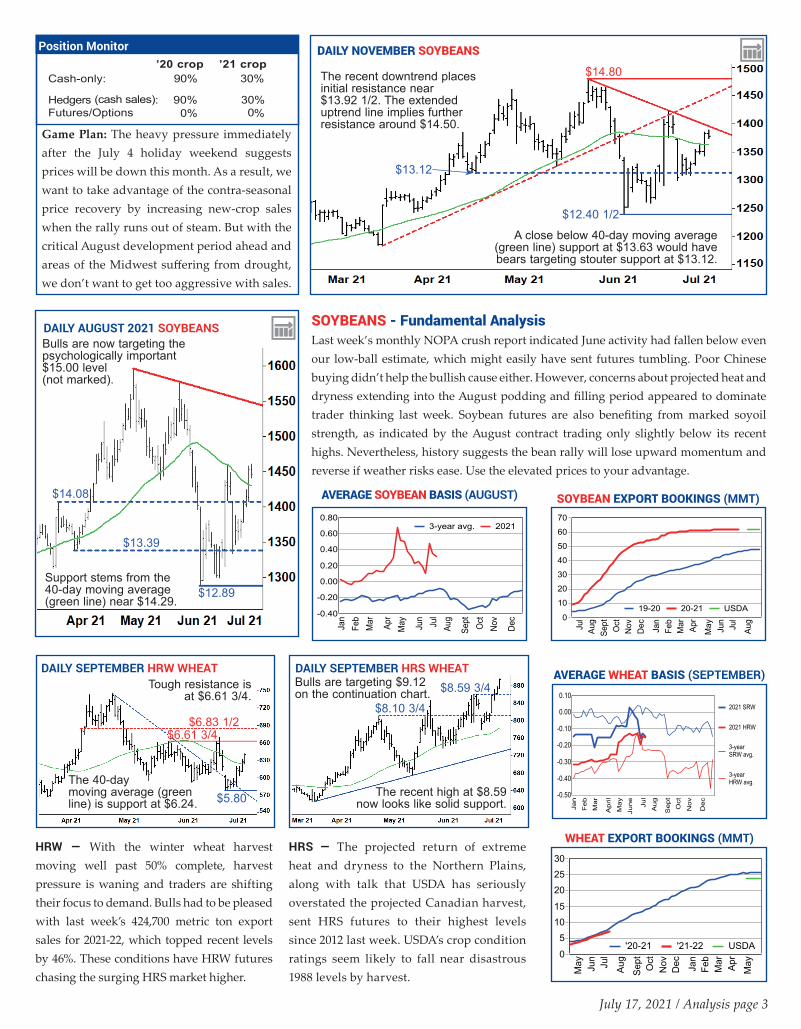
HRW — With the winter wheat harvest moving well past 50% complete, harvest pressure is waning and traders are shifting their focus to demand. Bulls had to be pleased with last week’s 424,700 metric ton export sales for 2021-22, which topped recent levels by 46%. These conditions have HRW futures chasing the surging HRS market higher.
DAILY AUGUST 2021 SOYBEANS
HRS — The projected return of extreme heat and dryness to the Northern Plains, along with talk that USDA has seriously overstated the projected Canadian harvest, sent HRS futures to their highest levels since 2012 last week. USDA’s crop condition ratings seem likely to fall near disastrous 1988 levels by harvest.
Tough resistance is at $6.61 3/4.
The 40-day moving average (green line) is support at $6.24.
Bulls are targeting $9.12 on the continuation chart.
The recent high at $8.59 now looks like solid support.
$14.08
$6.61 3/4
$8.59 3/4
$12.89
$13.39
$6.83 1/2$8.10 3/4
$5.80
Bulls are now targeting the psychologically important $15.00 level(not marked).
Support stems from the 40-day moving average (green line) near $14.29.
SOYBEAN EXPORT BOOKINGS (MMT)AVERAGE SOYBEAN BASIS (AUGUST)
WHEAT EXPORT BOOKINGS (MMT)
AVERAGE WHEAT BASIS (SEPTEMBER)
SOYBEANS - Fundamental AnalysisLast week’s monthly NOPA crush report indicated June activity had fallen below even our low-ball estimate, which might easily have sent futures tumbling. Poor Chinese buying didn’t help the bullish cause either. However, concerns about projected heat and dryness extending into the August podding and filling period appeared to dominate trader thinking last week. Soybean futures are also benefiting from marked soyoil strength, as indicated by the August contract trading only slightly below its recent highs. Nevertheless, history suggests the bean rally will lose upward momentum and reverse if weather risks ease. Use the elevated prices to your advantage.
A close below 40-day moving average (green line) support at $13.63 would have bears targeting stouter support at $13.12.
$14.80
$13.12
Position Monitor ’20 crop ’21 crop
Cash-only: 90% 30% Hedgers (cash sales): 90% 30% Futures/Options 0% 0%
Game Plan: The heavy pressure immediately after the July 4 holiday weekend suggests prices will be down this month. As a result, we want to take advantage of the contra-seasonal price recovery by increasing new-crop sales when the rally runs out of steam. But with the critical August development period ahead and areas of the Midwest suffering from drought, we don’t want to get too aggressive with sales.
DAILY NOVEMBER SOYBEANS
$12.40 1/2
The recent downtrend places initial resistance near $13.92 1/2. The extended uptrend line implies further resistance around $14.50.

July 17, 2021 / Analysis page 4
’20 crop ’21 cropCash-only: 100% 60% Hedgers (cash sales): 100% 60% Futures/Options 0% 0%
Pro Farmer on the GoDownload the Pro Farmer mobile app for easy access to daily news and reports while you’re on the go. Contact us if you need assistance at 1-800-772-0023.
USDA Cattle Inventory ReportU.S. beef herd contracted.
FRI 7/232:00 p.m. CT
5
USDA Cattle on Feed ReportAttention will be on placements.
FRI 7/232:00 p.m. CT
4
USDA Cold Storage ReportMeat stocks a gauge of demand.
THURS 7/222:00 p.m. CT
3
USDA Export Sales ReportDid the price break attract buying?
2
USDA Crop Progress ReportCorn ratings mean more in July
MON 7/193:00 p.m. CT
1
WATCH LIST
THURS 7/227:30 a.m. CT
news was impressive.Nevertheless, we advised Members
to boost sales of their anticipated 2021 crop to 60% on July 14. First and fore-most among our reasons was the cotton market’s marked history of struggling to find sustained buying above the 90.00¢ level. Second, our analysis of recent improvements in USDA’s cotton crop ratings and the elevated readings themselves suggest USDA is still under-estimating the size of the crop.
Strong demand certainly could continue to support cotton prices in the coming weeks, but pricing pro-duction around 90.00¢ cents should prove profitable and it is prudent risk management.
In its July 12 Supply & Demand Report, USDA boosted its 2021 U.S. harvested cotton acreage and crop production forecasts by 870,000 acres and 800,000 bales, respectively. Moreover, forecasts for a warm autumn over the main Texas cotton growing area suggest an extra boost to the cotton crop in that region.
Instead of reacting poorly to those developments, December cotton futures surged to fresh highs last week. The forces behind the advance weren’t obvi-ous, but one has to suspect the industry is anticipating stronger exports than the 400,000-bale rise (to 15.2 million bales) projected by USDA in the report. Whatever bulls were thinking, the push to fresh highs in the wake of bearish
By Market Economist Dan VaughtFROM THE BULLPEN
Fed policy: In our last issue we highlight-ed the latest discussion by the Federal Open Market Committee and its opinion the economy hasn’t fully recovered from the Covid-19 pandemic, though Fed offi-cials are watching inflation.
Last week’s consumer price index (CPI) indicated inflation may become a more serious problem than the Fed anticipates. The June CPI climbed 0.9% from May, the largest monthly increase
GENERAL OUTLOOKsince 2008. It also rose 5.4% annually.
Federal Reserve Chair Jerome Powell acknowledged the rise in inflation in his prepared testimony to the House Financial Services Committee but reit-erated the Fed’s view that it will “mod-erate” over time. He argued rising pric-es are being “temporarily boosted by base effects, as the sharp pandemic-related price declines from last spring drop out of the 12-month calculation.”
Game Plan: On July 14, we advised selling another 10% of expected 2021-crop production for harvest delivery. Get current with all advised sales.
Position Monitor AVERAGE COTTON BASIS (OCTOBER)
COTTON - Fundamental AnalysisAfter having surged to fresh highs last July 14, nearby cotton futures slid in response to weak USDA export sales data. The impressive early-week rally suggest-ed great underlying strength, but the U.S. crop is likely to get larger. For more see “From the Bullpen” below.
COTTON EXPORT BOOKINGS (’000 BALES)
MONTHLY U.S. CONSUMER PRICE INDEX
Continuation chart resistance is at 91.00¢ and 92.95¢ (neither shown).
The June high at 88.50¢ is now initial support.
Trendline support is near 86.00¢.
88.50¢
DAILY DECEMBER COTTON
83.25¢
The next level to watch is the June 2008 high at 1.0%.
The negative spikes came during the Great Recession
and the Covid-19 crisis.