Embed Size (px)
Citation preview
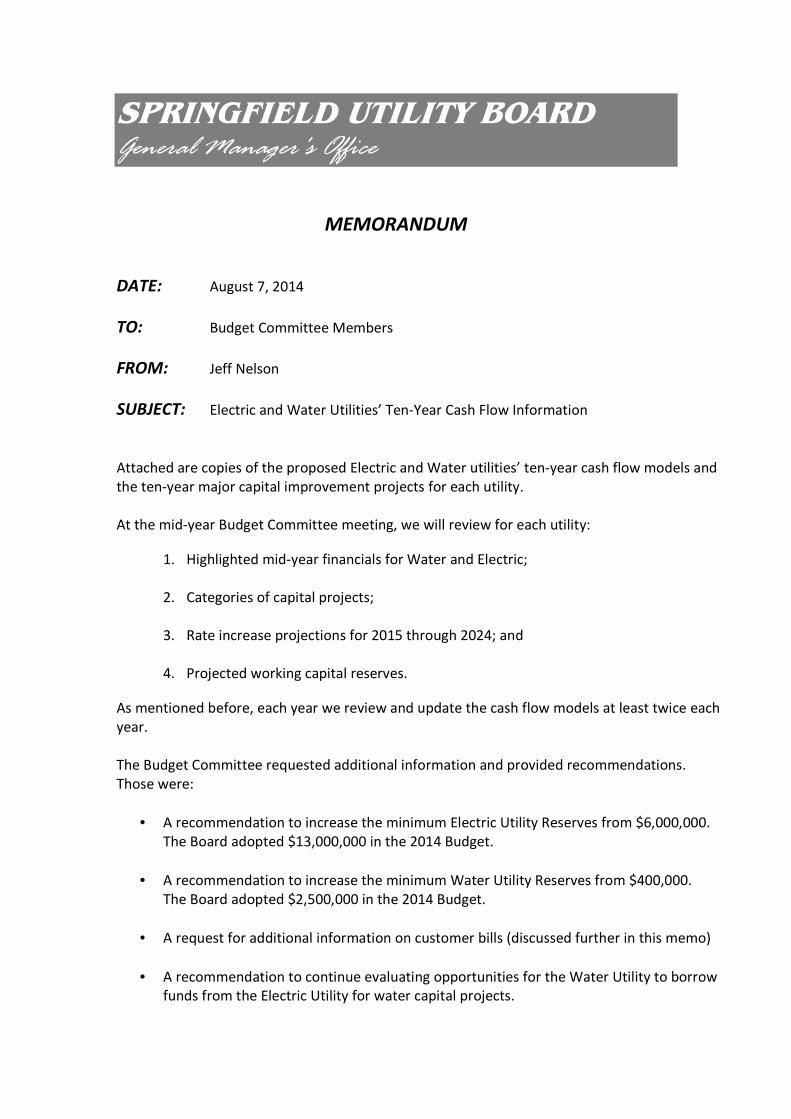
SPRINGFIELD UTILITY BOARD General Manager's Office
MEMORANDUM
DATE: August 7, 2014
TO: Budget Committee Members
FROM: Jeff Nelson
SUBJECT: Electric and Water Utilities’ Ten-Year Cash Flow Information
Attached are copies of the proposed Electric and Water utilities’ ten-year cash flow models and
the ten-year major capital improvement projects for each utility.
At the mid-year Budget Committee meeting, we will review for each utility:
1. Highlighted mid-year financials for Water and Electric;
2. Categories of capital projects;
3. Rate increase projections for 2015 through 2024; and
4. Projected working capital reserves.
As mentioned before, each year we review and update the cash flow models at least twice each
year.
The Budget Committee requested additional information and provided recommendations.
Those were:
• A recommendation to increase the minimum Electric Utility Reserves from $6,000,000.
The Board adopted $13,000,000 in the 2014 Budget.
• A recommendation to increase the minimum Water Utility Reserves from $400,000.
The Board adopted $2,500,000 in the 2014 Budget.
• A request for additional information on customer bills (discussed further in this memo)
• A recommendation to continue evaluating opportunities for the Water Utility to borrow
funds from the Electric Utility for water capital projects.
Memorandum to the Budget Committee
August 7, 2014
Page 2
Review
The Budget Committee met for a mid-year review on August 14, 2013 and again for the 2014
Budget process on November 25, 2013. The Board adopted the 2014 Budget at the December
11, 2013 regular Board meeting (Resolution 2013-6).
Power Cost Update
Over 60% of the Electric Utility’s expenses are associated with purchased power costs. SUB
currently purchases all of its power from the Bonneville Power Administration to serve SUB’s
retail customers. BPA raised its power rates in October 2011 and October 2013 and SUB’s
Board increased SUB’s electric retail rates effective April 1, 2012 to partially offset the BPA rate
increases. Ultimately, SUB adopted three electric rate increases from 2012 to 2013. 4% in April
2012, 4.5% in November 2012, and 4% in May 2013. Prior to 2012, SUB had not had a rate
increase since 2006.
BPA has a two year rate cycle with the next potential power and transmission rate changes
occurring effective October1, 2015. Staff has been following the BPA power and transmission
rate processes. BPA is projecting an 8.7% power rate increase as well as a 6.1% percent
increase in transmission rates. Each utility has a different rate impact and SUB’s models were
updated to reflect BPA’s actual rate schedules.
Water System Update
SUB has completed corrosion control facilities for our Willamette Treatment plant and Thurston
wellfield. This is related to the Environmental Protection Agencies Lead and Copper rule that
requires water utilities to have water delivered to end-users be of sufficient pH level to reduce
the likelihood of corrosion of pipes within structures (e.g. homes).
SUB’s water system has a number of plans, such as the Water Master Plan and the Water
Conservation Plan, and a new plan is near completion a Water Source Plan. The Water Source
Plan will expand the analysis on SUB’s water source options and identify recommendations
which will feed into the Water Master Plan and future capital improvement plans.
In my memo last year, I noted that the results of the new Water Source Plan could result in
significant changes in the longer term planning horizon and the 10-Year plan presented in 2014
may be materially different from 2013. The Water Source Plan and the Seismic Analysis of
SUB’s water facilities have increased projected capital spending for the Water Utility.
Regulatory requirements associated with both electric and water utilities are expected to
continue to put upward pressure on rates.
Memorandum to the Budget Committee
August 7, 2014
Page 3
Long Term Capital Funding
From 2004-2013, the Electric Division spent ~$20 million. From 2015-2024, the Electric Division
is proposing to spend ~$30 million
(~50% increase).
From 2004-2013, the Water Division spent ~$23 million. From 2015-2024, the Water Division is
proposing to spend ~$49 million (~100% increase).
These figures exclude planned property purchases for water and electric facilities. The budget
for property acquisition is ~1.3 million in 2015 and paid by the Electric division. As properties
are developed, the Water division may purchase or lease the property from the Electric
division.
Capital spending in the ten year horizon is due to updated cost projections for projects such as:
1) Seismic studies for SUB water storage facilities.
2) Additional work to optimize SUB’s electric distribution system to provide for distribution
service to be from at least two separate sources.
3) Replacement of structures and conductor along SUB’s Alvey-Springfield 115kV
transmission line.
Debt Forecast
The rate scenarios assume no additional debt for the Electric Utility. Consistent with prior 10-
year plans, it is assumed that the Water Utility would acquire additional debt to cover a portion
of the cost to develop a new surface water source.
The results presented do not assume that the Water Utility will borrow funds from the Electric
Utility. Staff would continue to evaluate this on an ongoing basis and provide a
recommendation on this option as SUB gets closer to the period where larger water projects
will trigger either larger rate increases or additional borrowing.
SUB Organizational Structure
The Board and I.B.E.W. Local Union 659 agreed upon a new 5-year labor-management contract
beginning May 1, 2012. Among other outcomes, this agreement provides additional planning
certainty around projected labor costs.
SUB has a succession planning process that is periodically reviewed. Retirement and transition
of long-term staff at SUB has created opportunities to evaluate a range of positions, from entry
level apprenticeships to management progression. As noted last year, two management
positions have been consolidated, a new Water Superintendent position and a new Customer
Service Supervisor position have been filled, and a modest increase in staffing was
implemented at the operational level. With the planned retirement of the Director of Electric
and Water Divisions, SUB will be transitioning back to two directors for these divisions.
Memorandum to the Budget Committee
August 7, 2014
Page 4
Customer Bills and Rates
The Budget Committee requested additional information on a typical customer bill. Staff have
put together typical bills for residential customers as well as representative samples of
commercial and industrial customers. These bills reflect both SUB’s current rates as well as bill
comparisons with other utility rates.
SUB bills customers for electric, water, sewer, and stormwater. SUB provides billing services for
the City of Springfield which establishes sewer and stormwater rates. Because customers may
call SUB to comment on how high their bills are, the annual trend of combined electric, water,
and sewer/stormwater is provided for your information.
For your information, attached is a copy of a rate comparison study for water and electric rates
performed by EWEB that includes SUB in the study. In addition, a recent EWEB projection of
EWEB rate increases for water and electric is included.
Utility Goal Setting
The proposed projections are designed to be consistent with SUB’s mission. I look forward to
continuing the collaborative goal setting process that the Board employs to provide additional
policy direction to the General Manager.
Memorandum to the Budget Committee
August 7, 2014
Page 5
WATER UTILITY:
Conditions since the beginning of the budget year:
1. Beginning Working Capital on January 1, 2014, was $3,267,580.
2. Year End 2014 Revenues from water sales are projected to be up by approximately
$340,286, or approximately a three and seven tenths (3.7) percent increase on an annual
basis for 2014 compared to budget. The revised Year End 2014 figure is now $9,633,252 for
General and Contract Sales compared to the original budget of $9,292,966.
3. Year End capital costs are up approximately $450,000 and labor is unchanged from budget.
4. The Water Utility is on a course to end the calendar year with expenses exceeding revenues
by $1,085,209. The budget assumed that expenses would exceed revenues by $1,064,327.
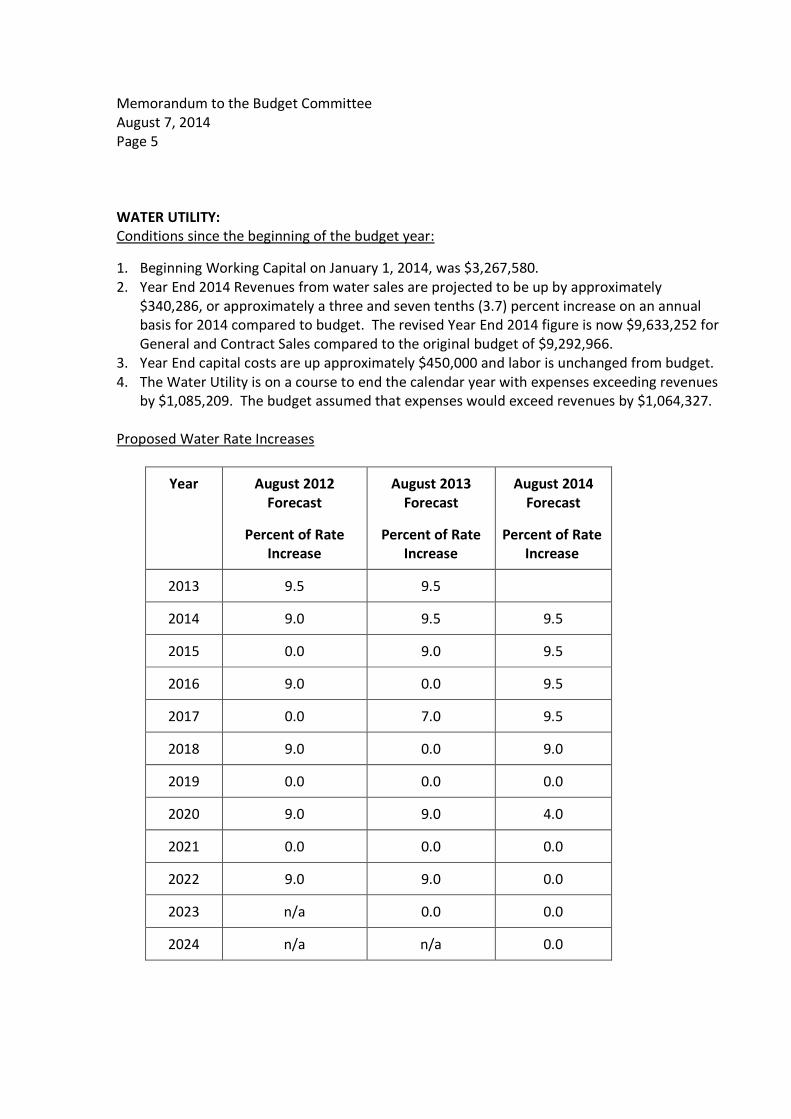
Proposed Water Rate Increases
Year August 2012
Forecast
Percent of Rate
Increase
August 2013
Forecast
Percent of Rate
Increase
August 2014
Forecast
Percent of Rate
Increase
2013 9.5 9.5
2014 9.0 9.5 9.5
2015 0.0 9.0 9.5
2016 9.0 0.0 9.5
2017 0.0 7.0 9.5
2018 9.0 0.0 9.0
2019 0.0 0.0 0.0
2020 9.0 9.0 4.0
2021 0.0 0.0 0.0
2022 9.0 9.0 0.0
2023 n/a 0.0 0.0
2024 n/a n/a 0.0
Memorandum to the Budget Committee
August 7, 2014
Page 6
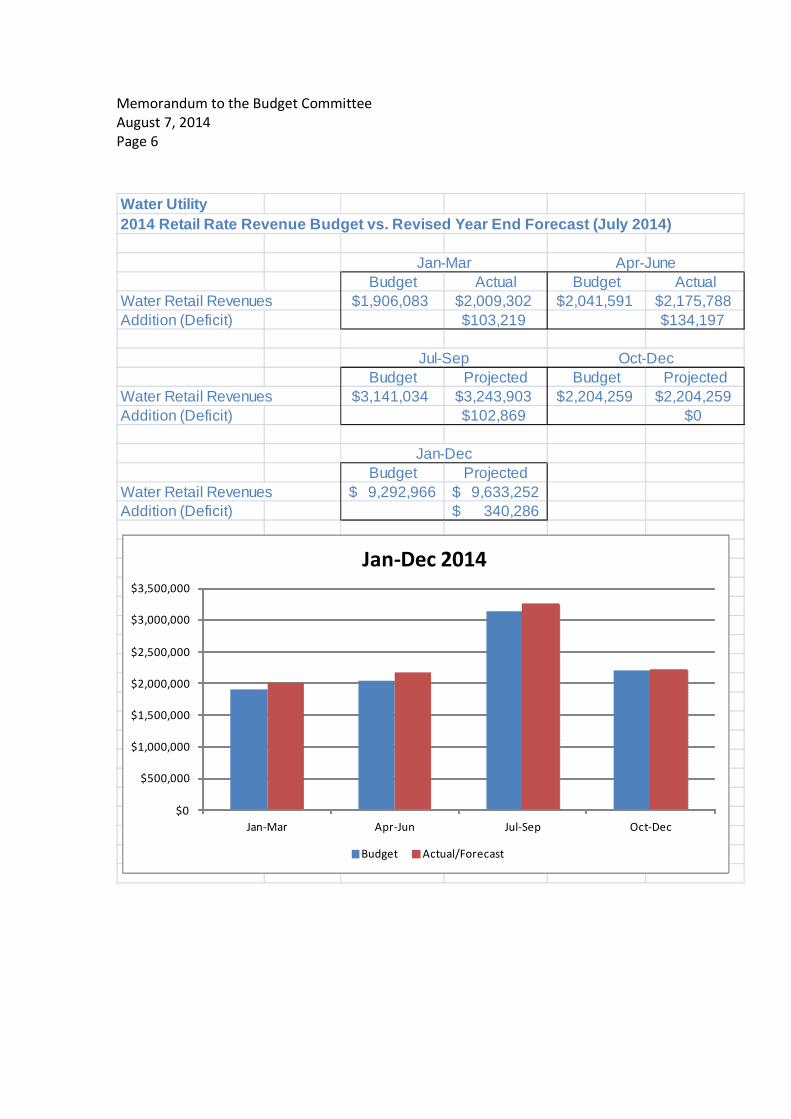
Water Utility2014 Retail Rate Revenue Budget vs. Revised Year End Forecast (July 2014)
Budget Actual Budget ActualWater Retail Revenues $1,906,083 $2,009,302 $2,041,591 $2,175,788Addition (Deficit) $103,219 $134,197
Budget Projected Budget ProjectedWater Retail Revenues $3,141,034 $3,243,903 $2,204,259 $2,204,259Addition (Deficit) $102,869 $0
Budget ProjectedWater Retail Revenues 9,292,966$ 9,633,252$ Addition (Deficit) 340,286$
Jan-Mar Apr-June
Jul-Sep Oct-Dec
Jan-Dec
$0
$500,000
$1,000,000
$1,500,000
$2,000,000
$2,500,000
$3,000,000
$3,500,000
Jan-Mar Apr-Jun Jul-Sep Oct-Dec
Jan-Dec 2014
Budget Actual/Forecast
Memorandum to the Budget Committee
August 7, 2014
Page 7
ELECTRIC UTILITY:
Conditions since the beginning of the budget year:
1. Beginning Working Capital as of January 1, 2014, was $29,741,302.
2. Year-to-Date (through July 2014) electric usage is ~2.9% lower than forecast. Year End rate
revenue is projected to be down approximately $1,642,085 compared to budget. Year End
Purchased Power costs are projected to be approximately $1,357,592 below budget. The
10-year model includes escalators for a variety of cost components, including projected
market prices and BPA rate changes.
3. The Electric Utility is on a course to end the calendar year with expenses exceeding
revenues by $1,753,821.
4. The Electric Utility is debt free.
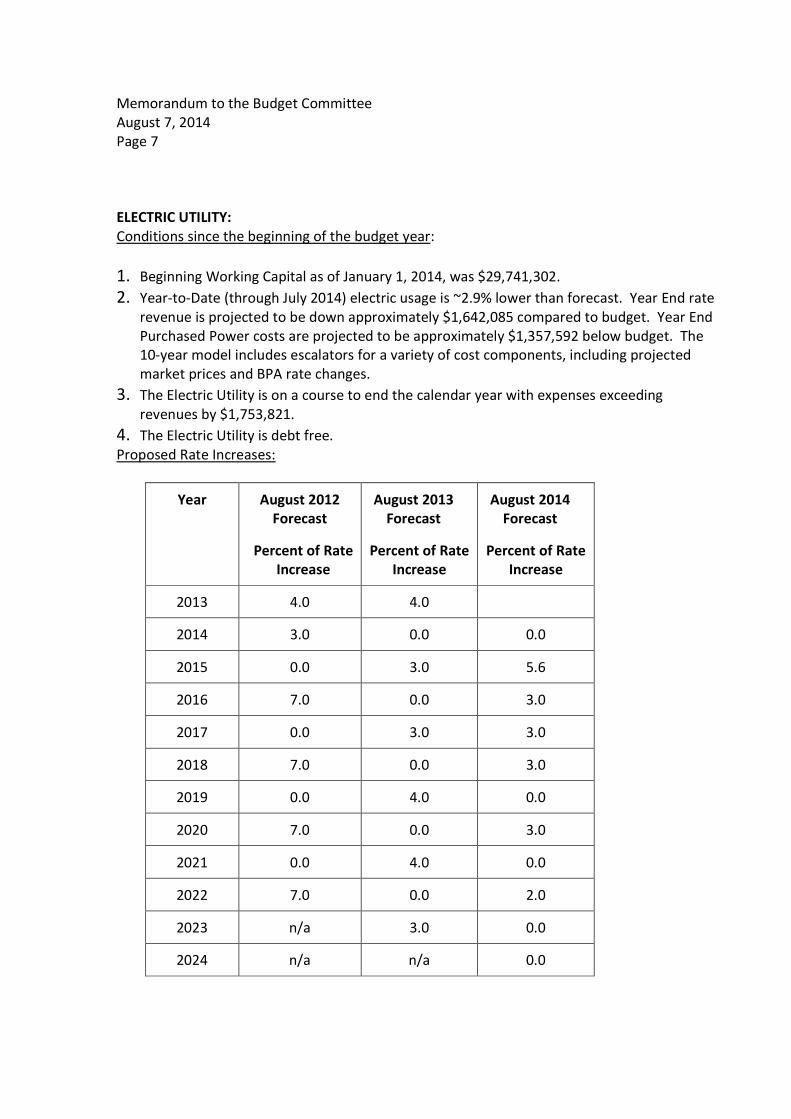
Proposed Rate Increases:
Year August 2012
Forecast
Percent of Rate
Increase
August 2013
Forecast
Percent of Rate
Increase
August 2014
Forecast
Percent of Rate
Increase
2013 4.0 4.0
2014 3.0 0.0 0.0
2015 0.0 3.0 5.6
2016 7.0 0.0 3.0
2017 0.0 3.0 3.0
2018 7.0 0.0 3.0
2019 0.0 4.0 0.0
2020 7.0 0.0 3.0
2021 0.0 4.0 0.0
2022 7.0 0.0 2.0
2023 n/a 3.0 0.0
2024 n/a n/a 0.0
Memorandum to the Budget Committee
August 7, 2014
Page 8
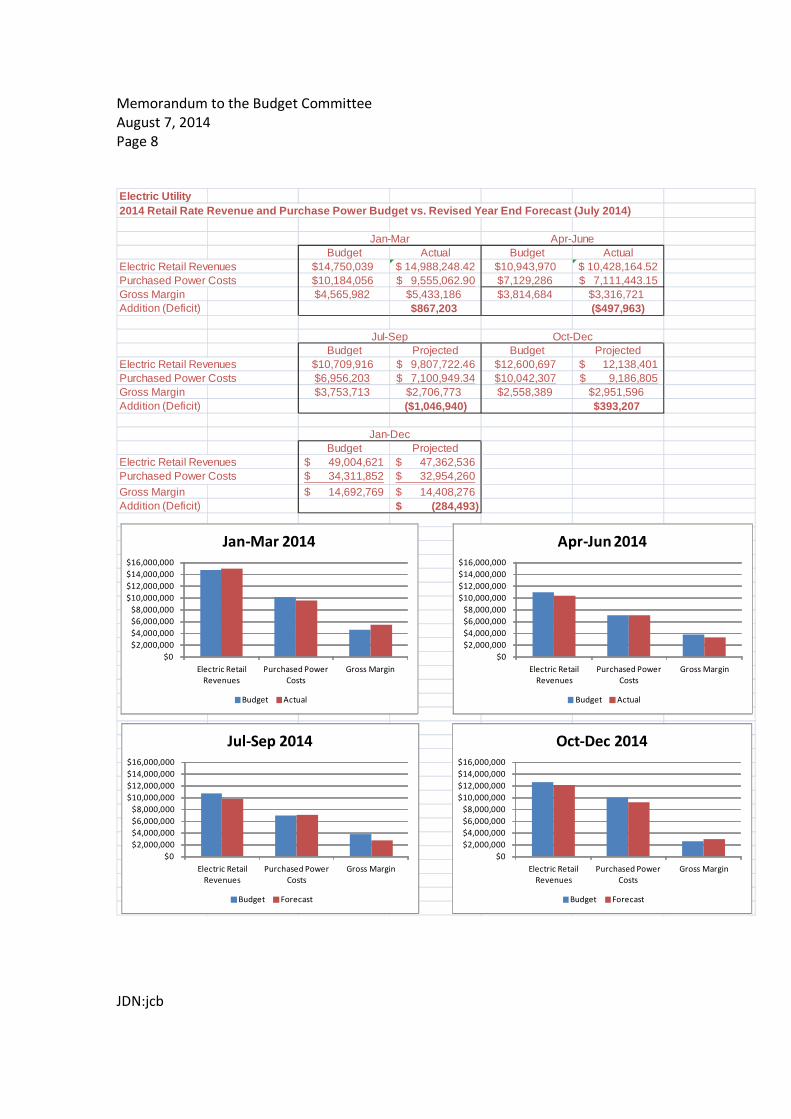
Electric Utility2014 Retail Rate Revenue and Purchase Power Budget vs. Revised Year End Forecast (July 2014)
Budget Actual Budget ActualElectric Retail Revenues $14,750,039 14,988,248.42$ $10,943,970 10,428,164.52$ Purchased Power Costs $10,184,056 9,555,062.90$ $7,129,286 7,111,443.15$ Gross Margin $4,565,982 $5,433,186 $3,814,684 $3,316,721Addition (Deficit) $867,203 ($497,963)
Budget Projected Budget ProjectedElectric Retail Revenues $10,709,916 9,807,722.46$ $12,600,697 12,138,401$ Purchased Power Costs $6,956,203 7,100,949.34$ $10,042,307 9,186,805$ Gross Margin $3,753,713 $2,706,773 $2,558,389 $2,951,596Addition (Deficit) ($1,046,940) $393,207
Budget ProjectedElectric Retail Revenues 49,004,621$ 47,362,536$ Purchased Power Costs 34,311,852$ 32,954,260$ Gross Margin 14,692,769$ 14,408,276$ Addition (Deficit) (284,493)$
Jan-Mar Apr-June
Jul-Sep Oct-Dec
Jan-Dec
$0
$2,000,000
$4,000,000
$6,000,000
$8,000,000
$10,000,000
$12,000,000
$14,000,000
$16,000,000
Electric Retail
Revenues
Purchased Power
Costs
Gross Margin
Jan-Mar 2014
Budget Actual
$0
$2,000,000
$4,000,000
$6,000,000
$8,000,000
$10,000,000
$12,000,000
$14,000,000
$16,000,000
Electric Retail
Revenues
Purchased Power
Costs
Gross Margin
Apr-Jun 2014
Budget Actual
$0
$2,000,000
$4,000,000
$6,000,000
$8,000,000
$10,000,000
$12,000,000
$14,000,000
$16,000,000
Electric Retail
Revenues
Purchased Power
Costs
Gross Margin
Jul-Sep 2014
Budget Forecast
$0
$2,000,000
$4,000,000
$6,000,000
$8,000,000
$10,000,000
$12,000,000
$14,000,000
$16,000,000
Electric Retail
Revenues
Purchased Power
Costs
Gross Margin
Oct-Dec 2014
Budget Forecast
JDN:jcb
Memorandum to the Budget Committee
August 7, 2014
Page 9
$-
$500,000
$1,000,000
$1,500,000
$2,000,000
$2,500,000
$3,000,000
$3,500,000
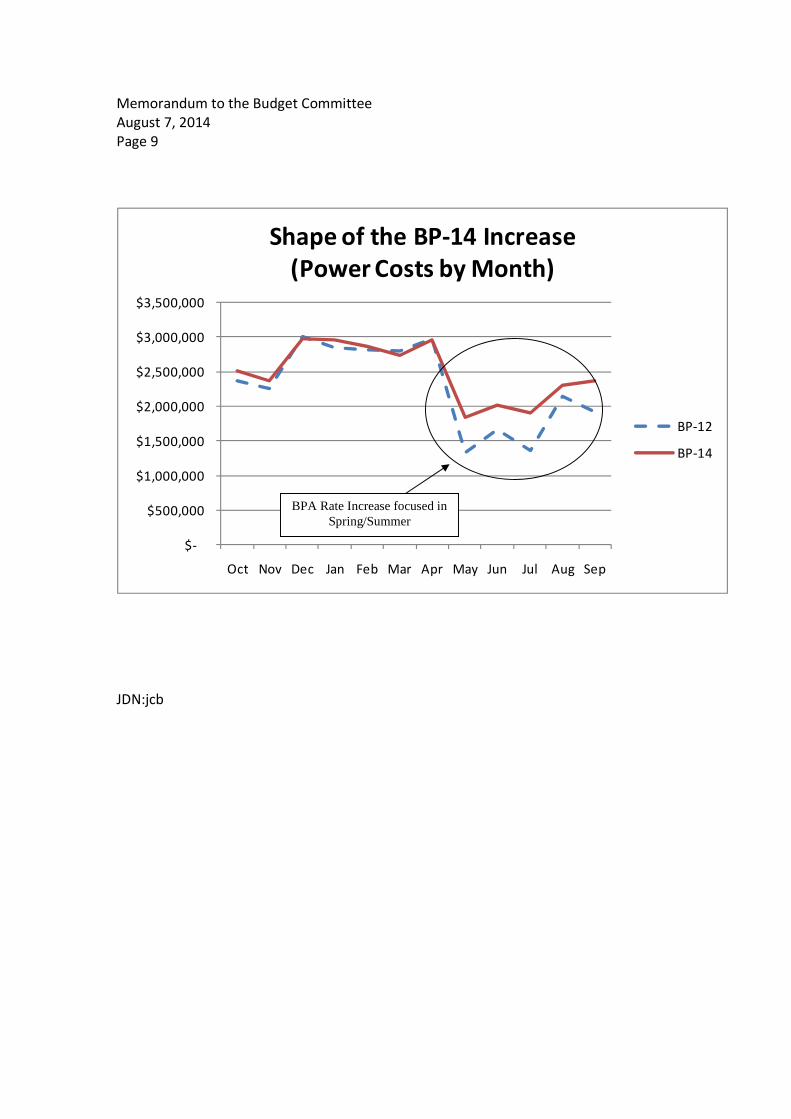
Oct Nov Dec Jan Feb Mar Apr May Jun Jul Aug Sep
Shape of the BP-14 Increase
(Power Costs by Month)
BP-12
BP-14
JDN:jcb
BPA Rate Increase focused in Spring/Summer
Electric and Water Utility
Major Capital Improvements and
Ten Year Cash Flow Presentation
2014 Update
Springfield Utility Board
August 13, 2014
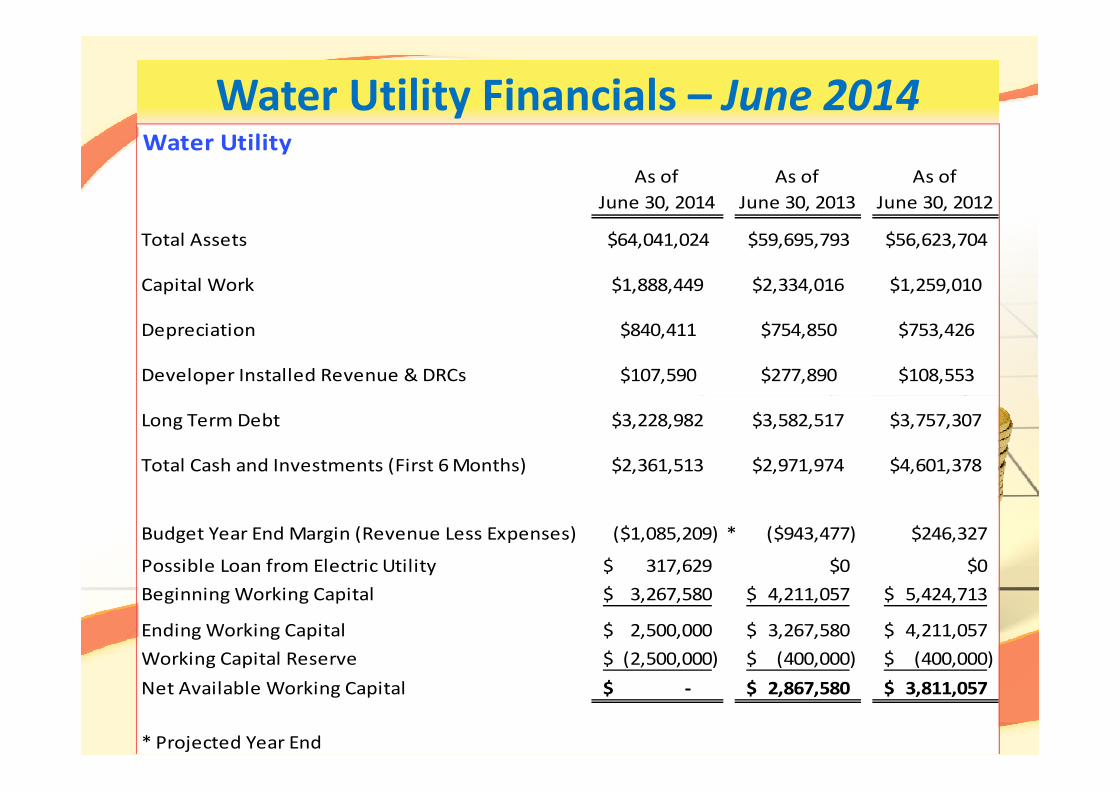
Water Utility Financials – June 2014
Water Utility
As of
June 30, 2014
As of
June 30, 2013
As of
June 30, 2012
Total Assets $64,041,024 $59,695,793 $56,623,704
Capital Work $1,888,449 $2,334,016 $1,259,010
Depreciation $840,411 $754,850 $753,426
$107,590 $277,890 $108,553Developer Installed Revenue & DRCs
Long Term Debt $3,228,982 $3,582,517 $3,757,307
$2,361,513 $2,971,974 $4,601,378
Budget Year End Margin (Revenue Less Expenses) ($1,085,209) * ($943,477) $246,327
Possible Loan from Electric Utility 317,629$ $0 $0
Beginning Working Capital 3,267,580$ 4,211,057$ 5,424,713$
Ending Working Capital 2,500,000$ 3,267,580$ 4,211,057$
Working Capital Reserve (2,500,000)$ (400,000)$ (400,000)$
Net Available Working Capital -$ 2,867,580$ 3,811,057$
* Projected Year End
Total Cash and Investments (First 6 Months)
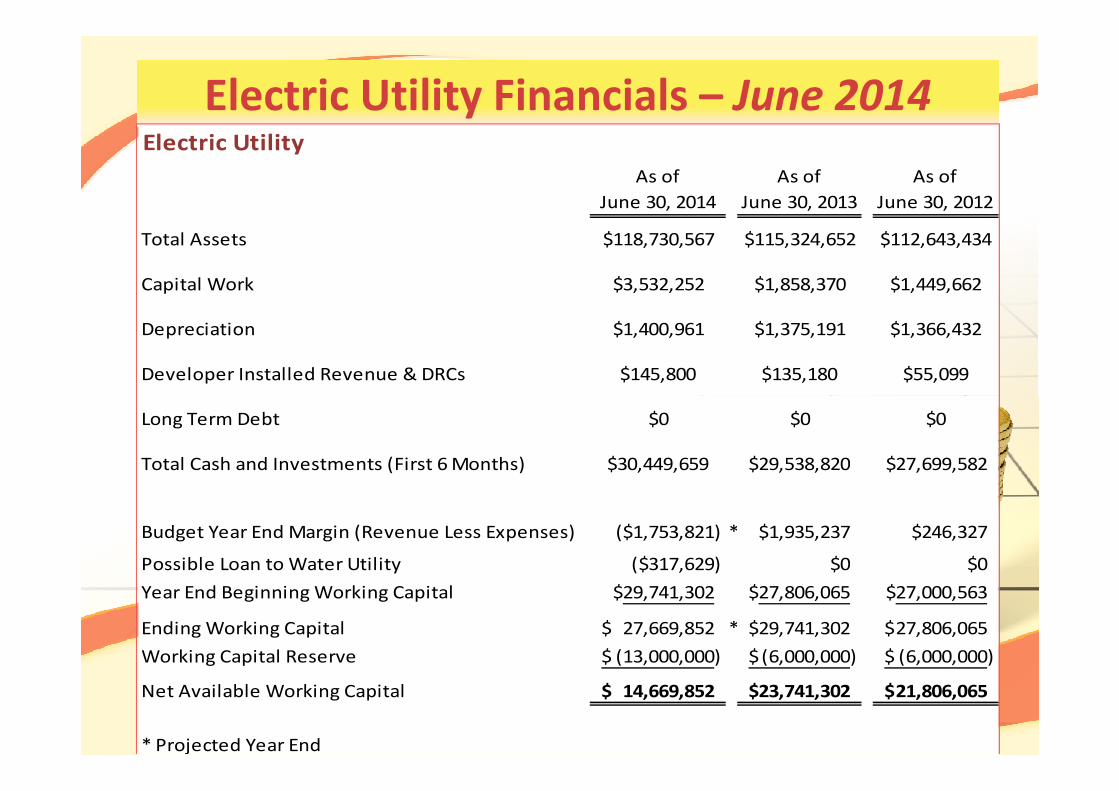
Electric Utility Financials – June 2014
Electric Utility
As of
June 30, 2014
As of
June 30, 2013
As of
June 30, 2012
Total Assets $118,730,567 $115,324,652 $112,643,434
Capital Work $3,532,252 $1,858,370 $1,449,662
Depreciation $1,400,961 $1,375,191 $1,366,432
$145,800 $135,180 $55,099Developer Installed Revenue & DRCs
Long Term Debt $0 $0 $0
$30,449,659 $29,538,820 $27,699,582
Budget Year End Margin (Revenue Less Expenses) ($1,753,821) * $1,935,237 $246,327
Possible Loan to Water Utility ($317,629) $0 $0
Year End Beginning Working Capital $29,741,302 $27,806,065 $27,000,563
Ending Working Capital 27,669,852$ * 29,741,302$ 27,806,065$
Working Capital Reserve (13,000,000)$ (6,000,000)$ (6,000,000)$
Net Available Working Capital 14,669,852$ 23,741,302$ 21,806,065$
* Projected Year End
Total Cash and Investments (First 6 Months)
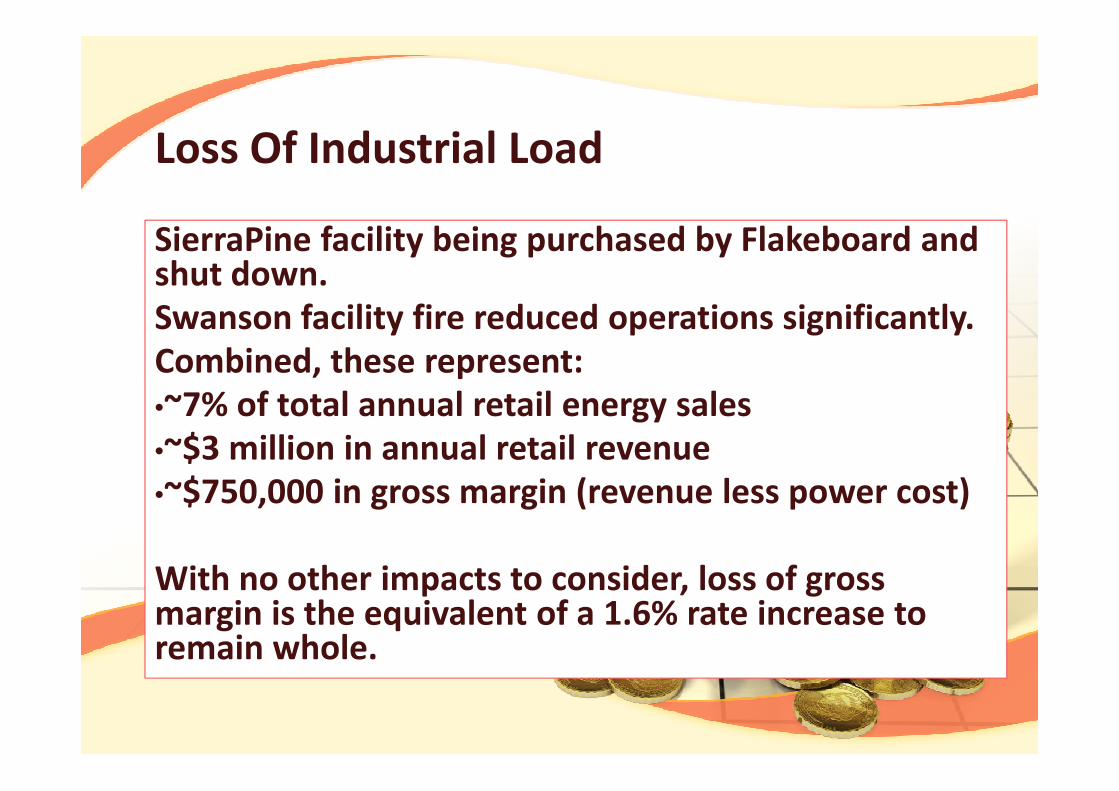
Loss Of Industrial Load
SierraPine facility being purchased by Flakeboard and shut down.
Swanson facility fire reduced operations significantly.
Combined, these represent:
•~7% of total annual retail energy sales•~7% of total annual retail energy sales
•~$3 million in annual retail revenue
•~$750,000 in gross margin (revenue less power cost)
With no other impacts to consider, loss of gross margin is the equivalent of a 1.6% rate increase to remain whole.
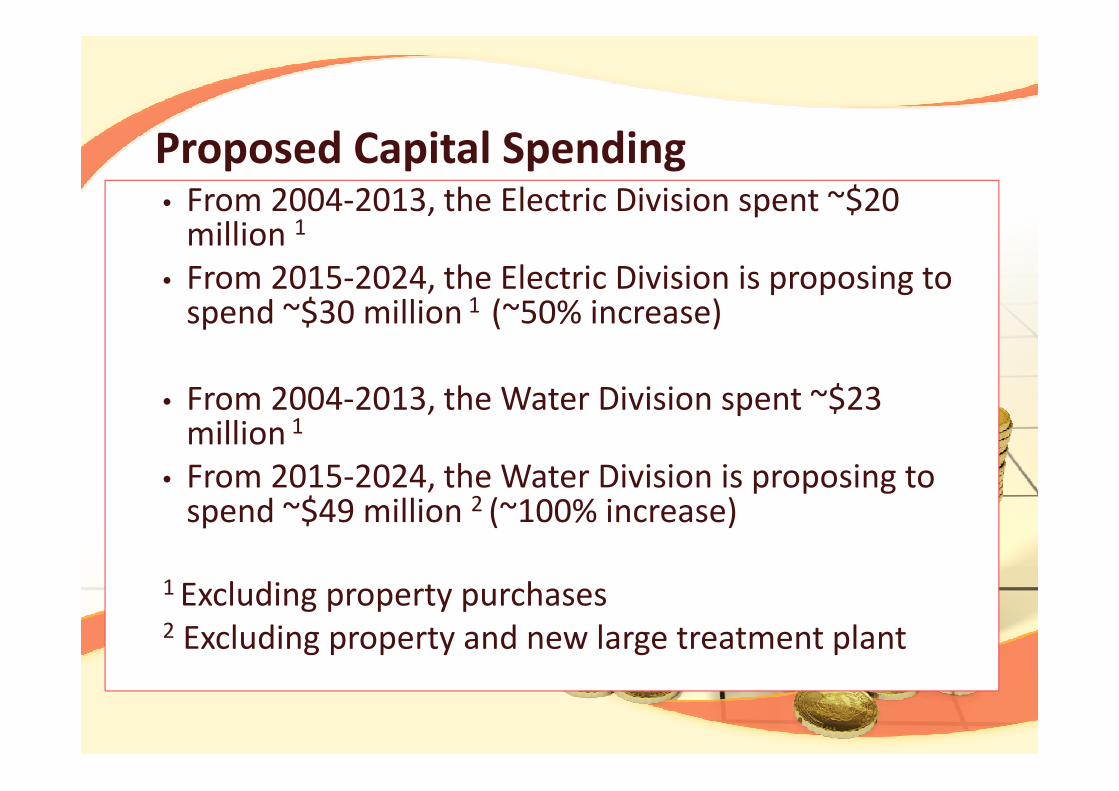
Proposed Capital Spending• From 2004-2013, the Electric Division spent ~$20
million 1
• From 2015-2024, the Electric Division is proposing to spend ~$30 million 1 (~50% increase)
• From 2004-2013, the Water Division spent ~$23 • From 2004-2013, the Water Division spent ~$23 million 1
• From 2015-2024, the Water Division is proposing to spend ~$49 million 2 (~100% increase)
1 Excluding property purchases2 Excluding property and new large treatment plant
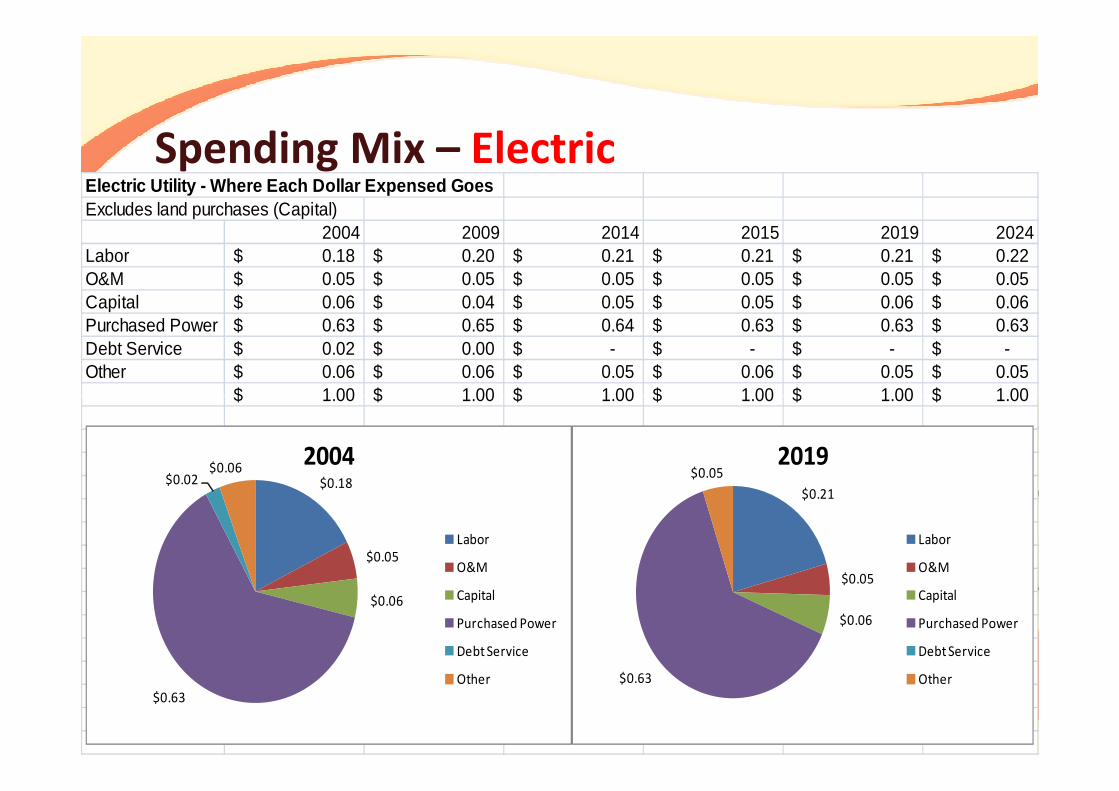
Spending Mix – ElectricElectric Utility - Where Each Dollar Expensed GoesExcludes land purchases (Capital)
2004 2009 2014 2015 2019 2024Labor 0.18$ 0.20$ 0.21$ 0.21$ 0.21$ 0.22$ O&M 0.05$ 0.05$ 0.05$ 0.05$ 0.05$ 0.05$ Capital 0.06$ 0.04$ 0.05$ 0.05$ 0.06$ 0.06$ Purchased Power 0.63$ 0.65$ 0.64$ 0.63$ 0.63$ 0.63$ Debt Service 0.02$ 0.00$ -$ -$ -$ -$ Other 0.06$ 0.06$ 0.05$ 0.06$ 0.05$ 0.05$
1.00$ 1.00$ 1.00$ 1.00$ 1.00$ 1.00$ 1.00$ 1.00$ 1.00$ 1.00$ 1.00$ 1.00$
$0.21
$0.05
$0.06
$0.63
$0.05 2019
Labor
O&M
Capital
Purchased Power
Debt Service
Other
$0.18
$0.05
$0.06
$0.63
$0.02 $0.06
2004
Labor
O&M
Capital
Purchased Power
Debt Service
Other
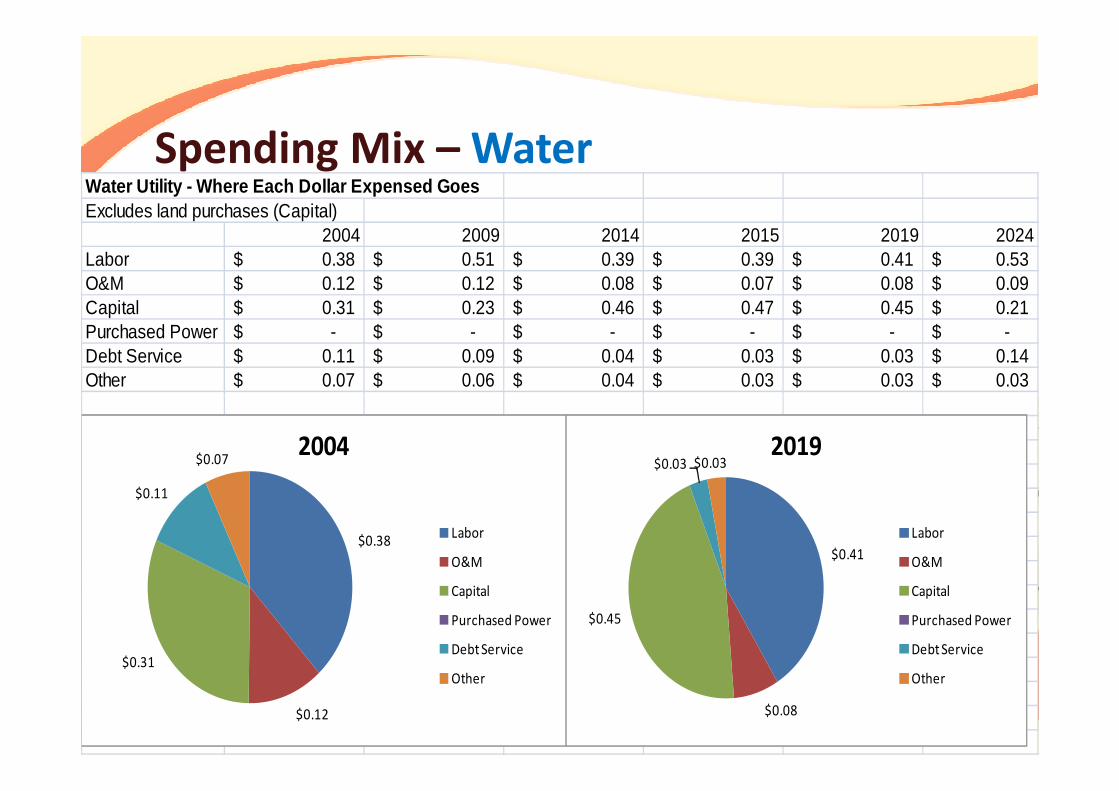
Spending Mix – WaterWater Utility - Where Each Dollar Expensed GoesExcludes land purchases (Capital)
2004 2009 2014 2015 2019 2024Labor 0.38$ 0.51$ 0.39$ 0.39$ 0.41$ 0.53$ O&M 0.12$ 0.12$ 0.08$ 0.07$ 0.08$ 0.09$ Capital 0.31$ 0.23$ 0.46$ 0.47$ 0.45$ 0.21$ Purchased Power -$ -$ -$ -$ -$ -$ Debt Service 0.11$ 0.09$ 0.04$ 0.03$ 0.03$ 0.14$ Other 0.07$ 0.06$ 0.04$ 0.03$ 0.03$ 0.03$
$0.38
$0.12
$0.31
$0.11
$0.07 2004
Labor
O&M
Capital
Purchased Power
Debt Service
Other
$0.41
$0.08
$0.45
$0.03 $0.03 2019
Labor
O&M
Capital
Purchased Power
Debt Service
Other
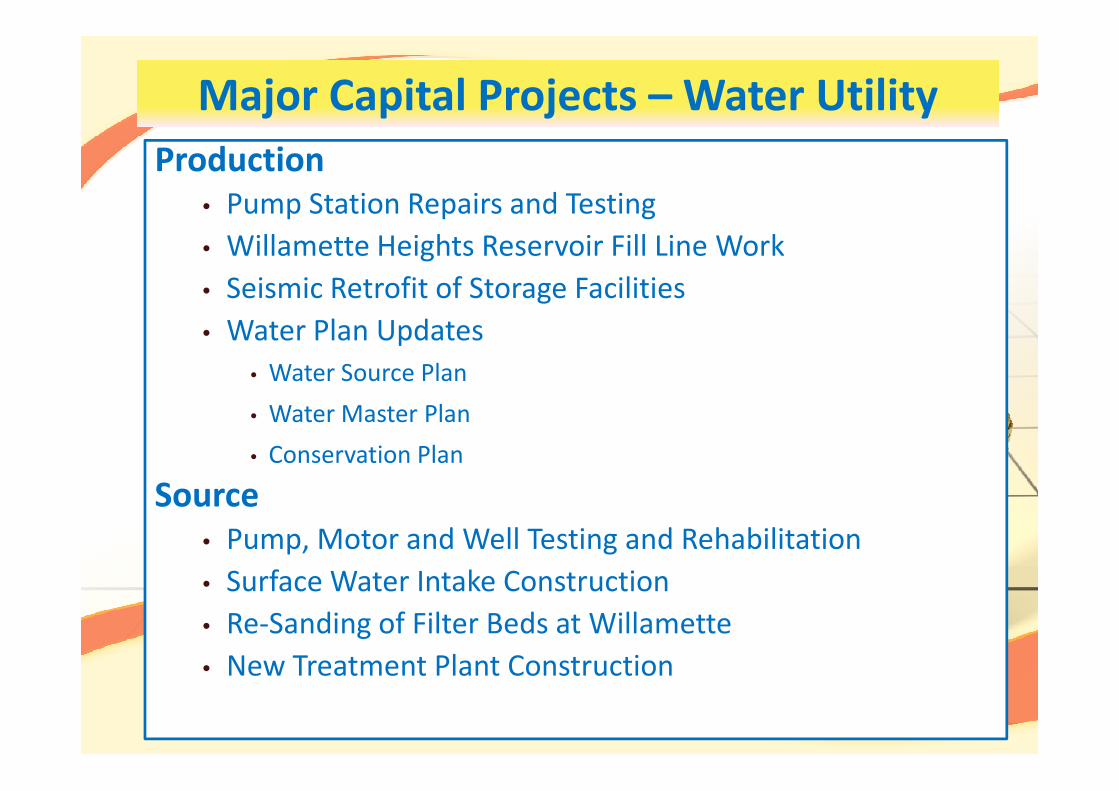
Production• Pump Station Repairs and Testing
• Willamette Heights Reservoir Fill Line Work
• Seismic Retrofit of Storage Facilities
• Water Plan Updates
• Water Source Plan
Major Capital Projects – Water Utility
• Water Master Plan
• Conservation Plan
Source• Pump, Motor and Well Testing and Rehabilitation
• Surface Water Intake Construction
• Re-Sanding of Filter Beds at Willamette
• New Treatment Plant Construction
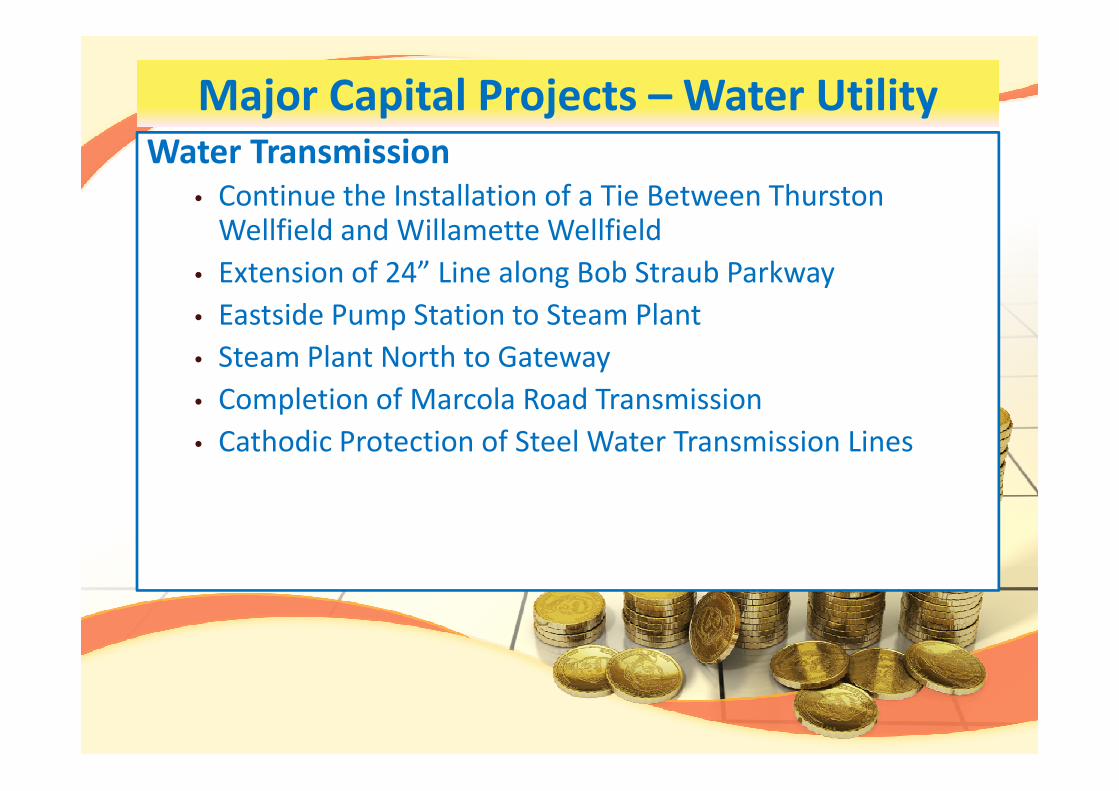
Water Transmission• Continue the Installation of a Tie Between Thurston
Wellfield and Willamette Wellfield
• Extension of 24” Line along Bob Straub Parkway
• Eastside Pump Station to Steam Plant
• Steam Plant North to Gateway
• Completion of Marcola Road Transmission
Major Capital Projects – Water Utility
• Completion of Marcola Road Transmission
• Cathodic Protection of Steel Water Transmission Lines
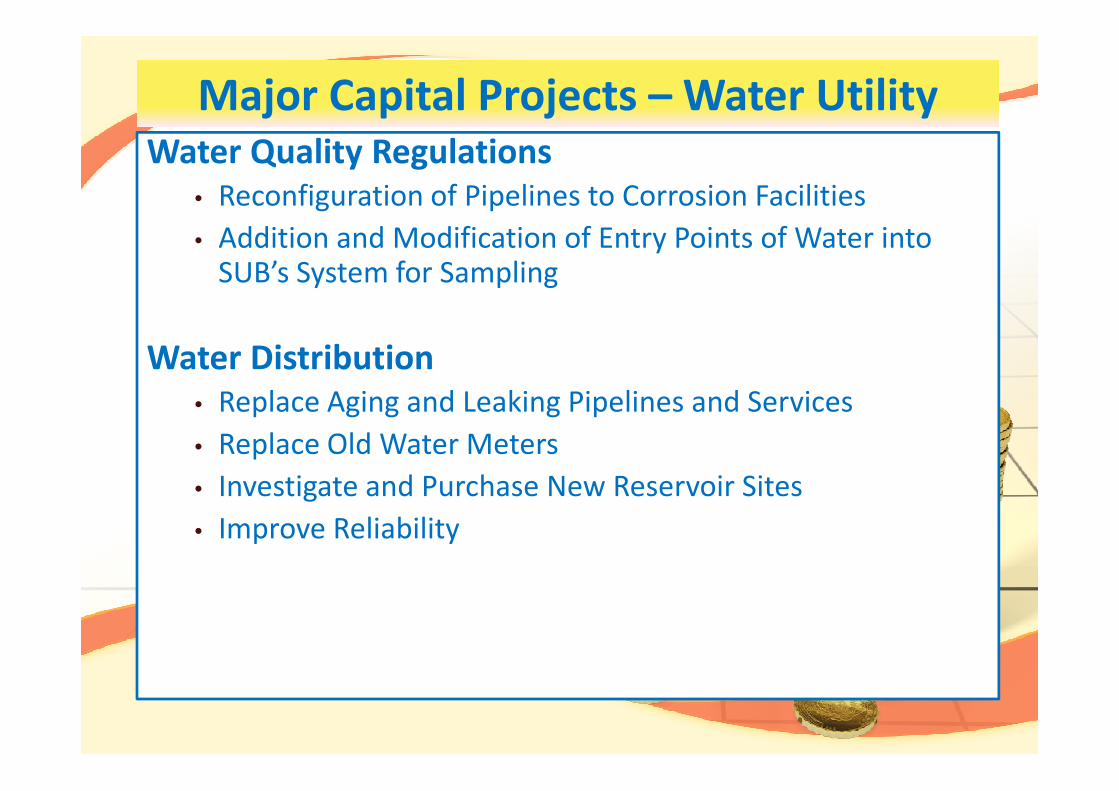
Major Capital Projects – Water UtilityWater Quality Regulations
• Reconfiguration of Pipelines to Corrosion Facilities
• Addition and Modification of Entry Points of Water into SUB’s System for Sampling
Water Distribution• Replace Aging and Leaking Pipelines and Services• Replace Aging and Leaking Pipelines and Services
• Replace Old Water Meters
• Investigate and Purchase New Reservoir Sites
• Improve Reliability
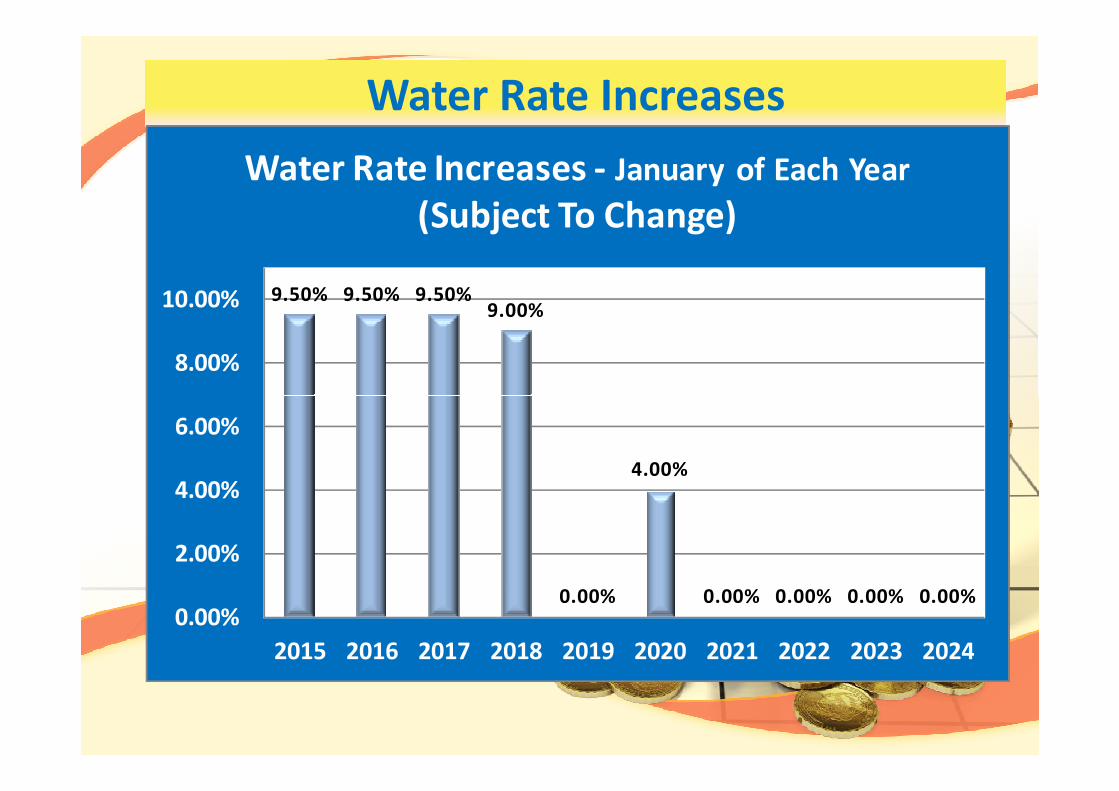
Water Rate Increases
9.50% 9.50% 9.50%9.00%
8.00%
10.00%
Water Rate Increases - January of Each Year
(Subject To Change)
0.00%
4.00%
0.00% 0.00% 0.00% 0.00%0.00%
2.00%
4.00%
6.00%
2015 2016 2017 2018 2019 2020 2021 2022 2023 2024
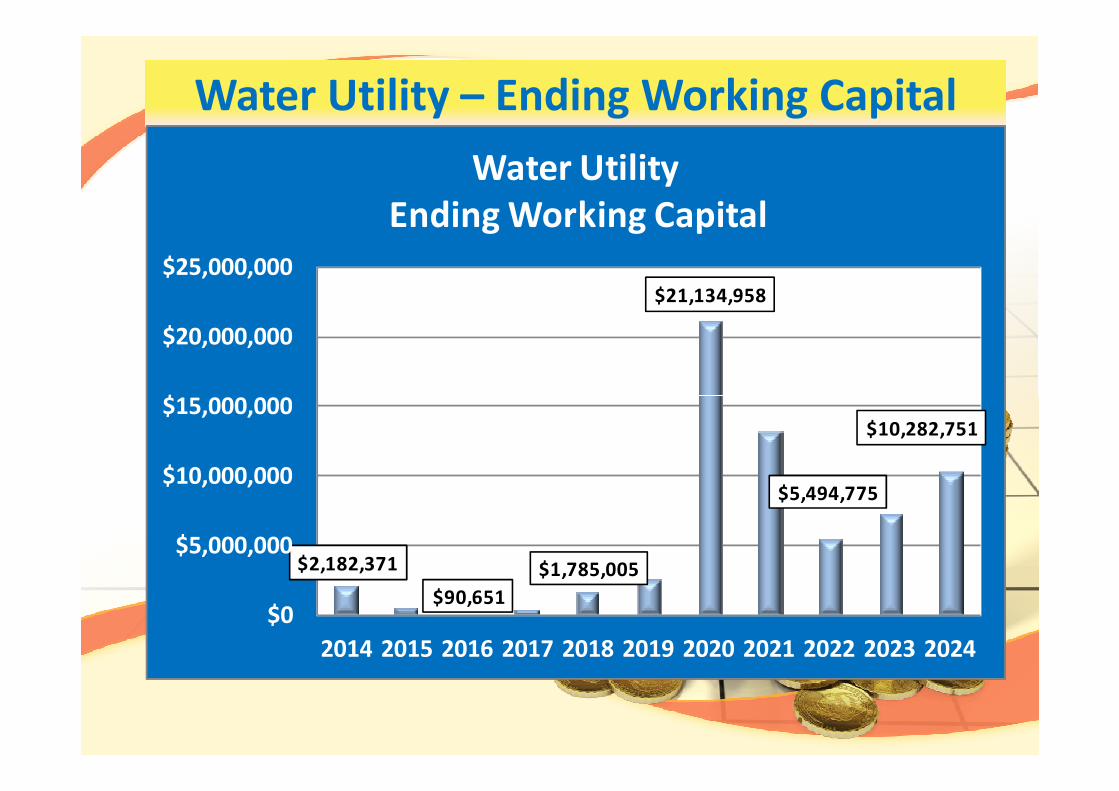
Water Utility – Ending Working Capital
$21,134,958
$15,000,000
$20,000,000
$25,000,000
Water Utility
Ending Working Capital
$2,182,371
$90,651
$1,785,005
$5,494,775
$10,282,751
$0
$5,000,000
$10,000,000
$15,000,000
2014 2015 2016 2017 2018 2019 2020 2021 2022 2023 2024
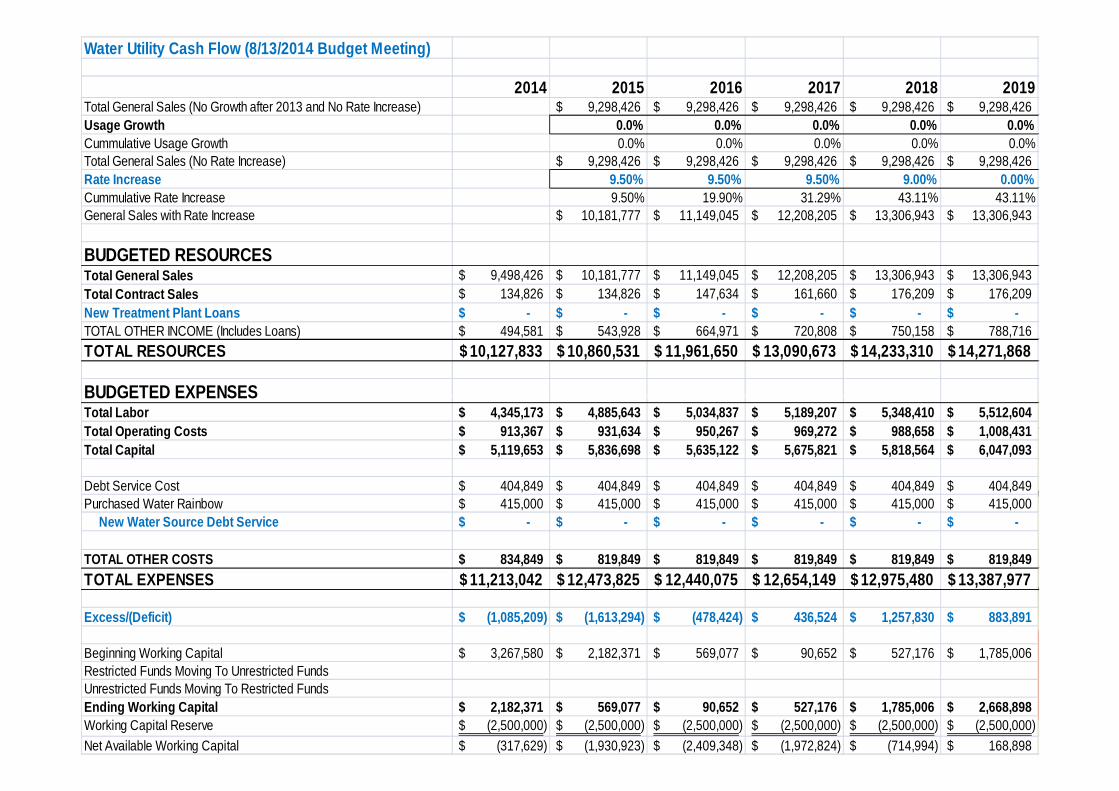
Water Utility Cash Flow (8/13/2014 Budget Meeting)
2014 2015 2016 2017 2018 2019Total General Sales (No Growth after 2013 and No Rate Increase) 9,298,426$ 9,298,426$ 9,298,426$ 9,298,426$ 9,298,426$ Usage Growth 0.0% 0.0% 0.0% 0.0% 0.0%Cummulative Usage Growth 0.0% 0.0% 0.0% 0.0% 0.0%Total General Sales (No Rate Increase) 9,298,426$ 9,298,426$ 9,298,426$ 9,298,426$ 9,298,426$ Rate Increase 9.50% 9.50% 9.50% 9.00% 0.00%Cummulative Rate Increase 9.50% 19.90% 31.29% 43.11% 43.11%General Sales with Rate Increase 10,181,777$ 11,149,045$ 12,208,205$ 13,306,943$ 13,306,943$
BUDGETED RESOURCESTotal General Sales 9,498,426$ 10,181,777$ 11,149,045$ 12,208,205$ 13,306,943$ 13,306,943$ Total Contract Sales 134,826$ 134,826$ 147,634$ 161,660$ 176,209$ 176,209$ New Treatment Plant Loans -$ -$ -$ -$ -$ -$ TOTAL OTHER INCOME (Includes Loans) 494,581$ 543,928$ 664,971$ 720,808$ 750,158$ 788,716$
TOTAL RESOURCES 10,127,833$ 10,860,531$ 11,961,650$ 13,090,673$ 14,233,310$ 14,271,868$
BUDGETED EXPENSESBUDGETED EXPENSESTotal Labor 4,345,173$ 4,885,643$ 5,034,837$ 5,189,207$ 5,348,410$ 5,512,604$ Total Operating Costs 913,367$ 931,634$ 950,267$ 969,272$ 988,658$ 1,008,431$ Total Capital 5,119,653$ 5,836,698$ 5,635,122$ 5,675,821$ 5,818,564$ 6,047,093$
Debt Service Cost 404,849$ 404,849$ 404,849$ 404,849$ 404,849$ 404,849$ Purchased Water Rainbow 415,000$ 415,000$ 415,000$ 415,000$ 415,000$ 415,000$ New Water Source Debt Service -$ -$ -$ -$ -$ -$
TOTAL OTHER COSTS 834,849$ 819,849$ 819,849$ 819,849$ 819,849$ 819,849$
TOTAL EXPENSES 11,213,042$ 12,473,825$ 12,440,075$ 12,654,149$ 12,975,480$ 13,387,977$
Excess/(Deficit) (1,085,209)$ (1,613,294)$ (478,424)$ 436,524$ 1,257,830$ 883,891$
Beginning Working Capital 3,267,580$ 2,182,371$ 569,077$ 90,652$ 527,176$ 1,785,006$ Restricted Funds Moving To Unrestricted FundsUnrestricted Funds Moving To Restricted FundsEnding Working Capital 2,182,371$ 569,077$ 90,652$ 527,176$ 1,785,006$ 2,668,898$ Working Capital Reserve (2,500,000)$ (2,500,000)$ (2,500,000)$ (2,500,000)$ (2,500,000)$ (2,500,000)$ Net Available Working Capital (317,629)$ (1,930,923)$ (2,409,348)$ (1,972,824)$ (714,994)$ 168,898$
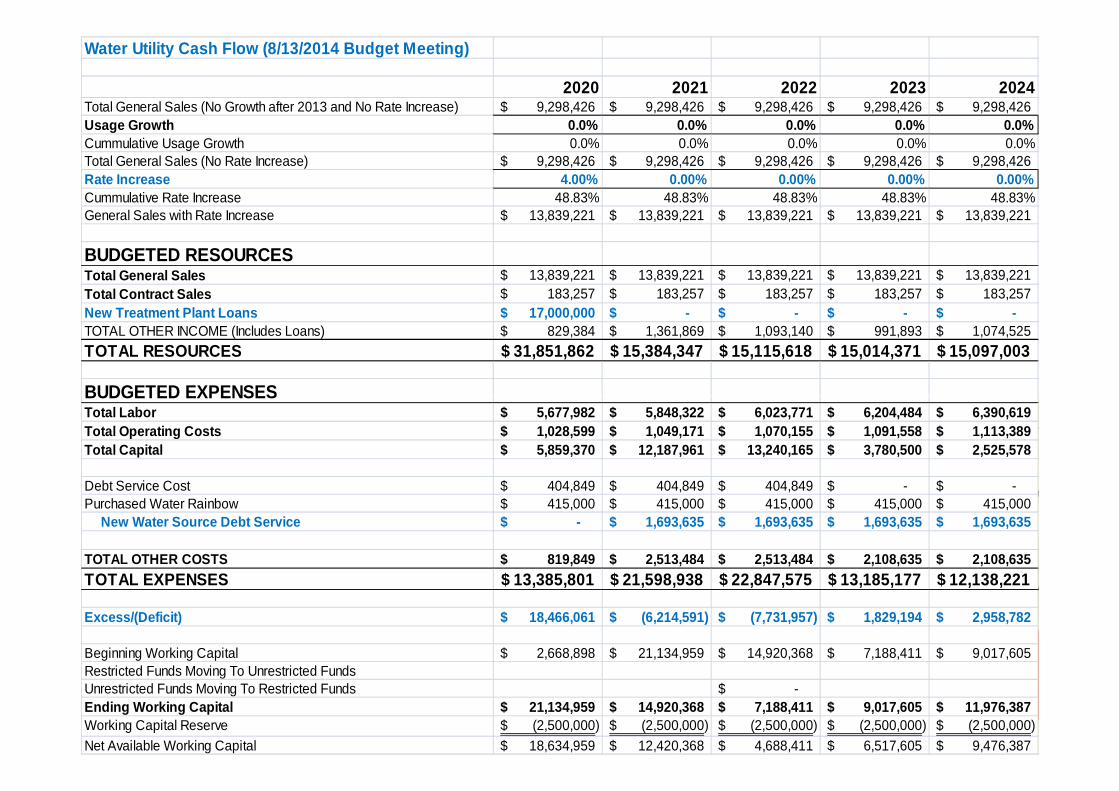
Water Utility Cash Flow (8/13/2014 Budget Meeting)
2020 2021 2022 2023 2024Total General Sales (No Growth after 2013 and No Rate Increase) 9,298,426$ 9,298,426$ 9,298,426$ 9,298,426$ 9,298,426$ Usage Growth 0.0% 0.0% 0.0% 0.0% 0.0%Cummulative Usage Growth 0.0% 0.0% 0.0% 0.0% 0.0%Total General Sales (No Rate Increase) 9,298,426$ 9,298,426$ 9,298,426$ 9,298,426$ 9,298,426$ Rate Increase 4.00% 0.00% 0.00% 0.00% 0.00%Cummulative Rate Increase 48.83% 48.83% 48.83% 48.83% 48.83%General Sales with Rate Increase 13,839,221$ 13,839,221$ 13,839,221$ 13,839,221$ 13,839,221$
BUDGETED RESOURCESTotal General Sales 13,839,221$ 13,839,221$ 13,839,221$ 13,839,221$ 13,839,221$ Total Contract Sales 183,257$ 183,257$ 183,257$ 183,257$ 183,257$ New Treatment Plant Loans 17,000,000$ -$ -$ -$ -$ TOTAL OTHER INCOME (Includes Loans) 829,384$ 1,361,869$ 1,093,140$ 991,893$ 1,074,525$
TOTAL RESOURCES 31,851,862$ 15,384,347$ 15,115,618$ 15,014,371$ 15,097,003$
BUDGETED EXPENSESBUDGETED EXPENSESTotal Labor 5,677,982$ 5,848,322$ 6,023,771$ 6,204,484$ 6,390,619$ Total Operating Costs 1,028,599$ 1,049,171$ 1,070,155$ 1,091,558$ 1,113,389$ Total Capital 5,859,370$ 12,187,961$ 13,240,165$ 3,780,500$ 2,525,578$
Debt Service Cost 404,849$ 404,849$ 404,849$ -$ -$ Purchased Water Rainbow 415,000$ 415,000$ 415,000$ 415,000$ 415,000$ New Water Source Debt Service -$ 1,693,635$ 1,693,635$ 1,693,635$ 1,693,635$
TOTAL OTHER COSTS 819,849$ 2,513,484$ 2,513,484$ 2,108,635$ 2,108,635$
TOTAL EXPENSES 13,385,801$ 21,598,938$ 22,847,575$ 13,185,177$ 12,138,221$
Excess/(Deficit) 18,466,061$ (6,214,591)$ (7,731,957)$ 1,829,194$ 2,958,782$
Beginning Working Capital 2,668,898$ 21,134,959$ 14,920,368$ 7,188,411$ 9,017,605$ Restricted Funds Moving To Unrestricted FundsUnrestricted Funds Moving To Restricted Funds -$ Ending Working Capital 21,134,959$ 14,920,368$ 7,188,411$ 9,017,605$ 11,976,387$ Working Capital Reserve (2,500,000)$ (2,500,000)$ (2,500,000)$ (2,500,000)$ (2,500,000)$ Net Available Working Capital 18,634,959$ 12,420,368$ 4,688,411$ 6,517,605$ 9,476,387$
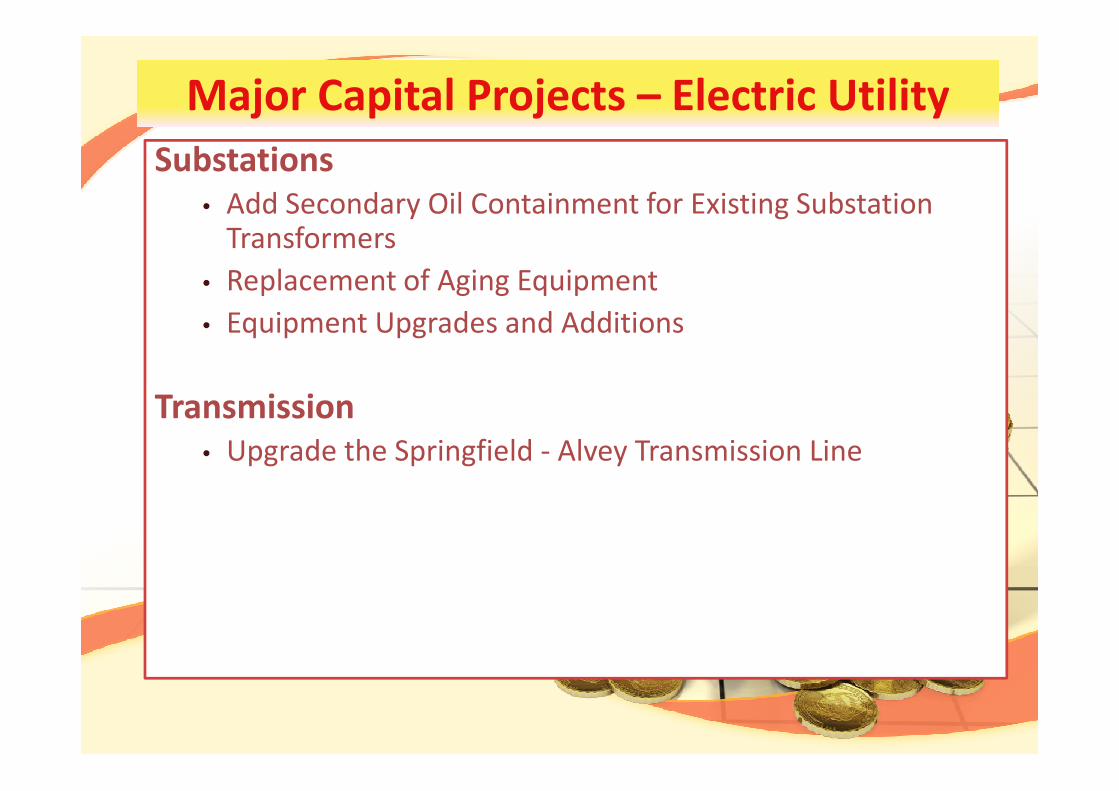
Substations• Add Secondary Oil Containment for Existing Substation
Transformers
• Replacement of Aging Equipment
• Equipment Upgrades and Additions
Transmission
Major Capital Projects – Electric Utility
Transmission• Upgrade the Springfield - Alvey Transmission Line
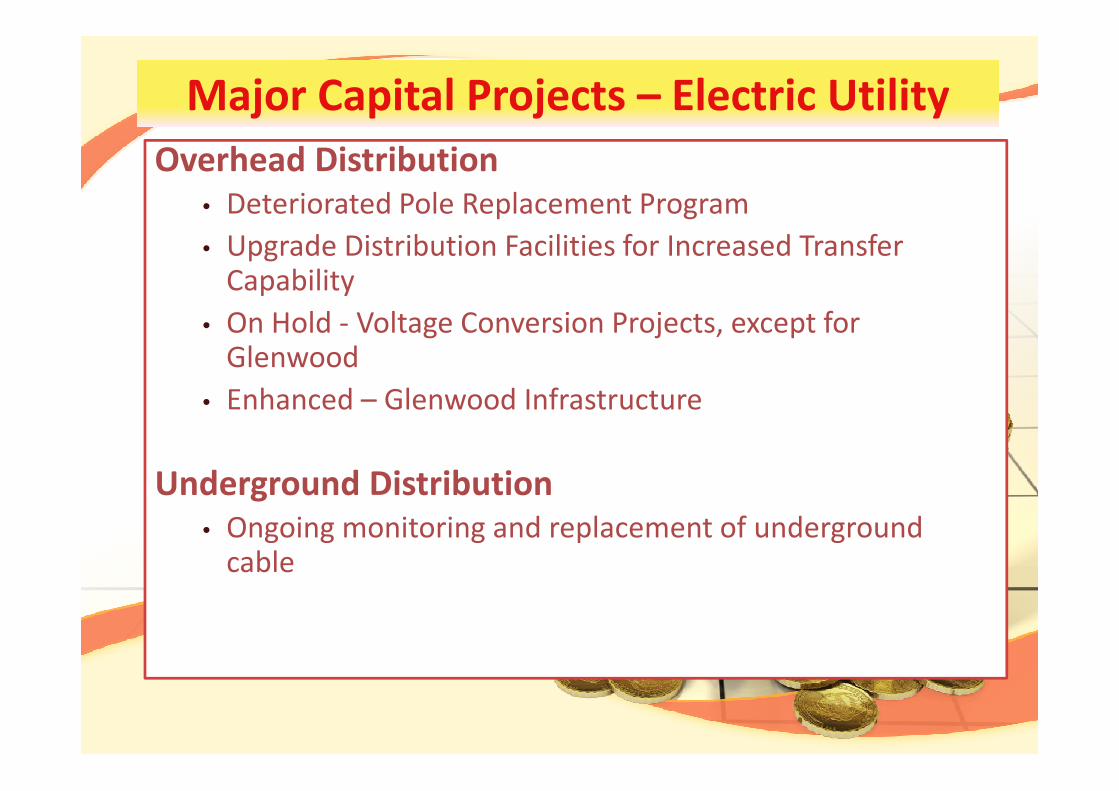
Overhead Distribution• Deteriorated Pole Replacement Program
• Upgrade Distribution Facilities for Increased Transfer Capability
• On Hold - Voltage Conversion Projects, except for Glenwood
• Enhanced – Glenwood Infrastructure
Major Capital Projects – Electric Utility
• Enhanced – Glenwood Infrastructure
Underground Distribution• Ongoing monitoring and replacement of underground
cable
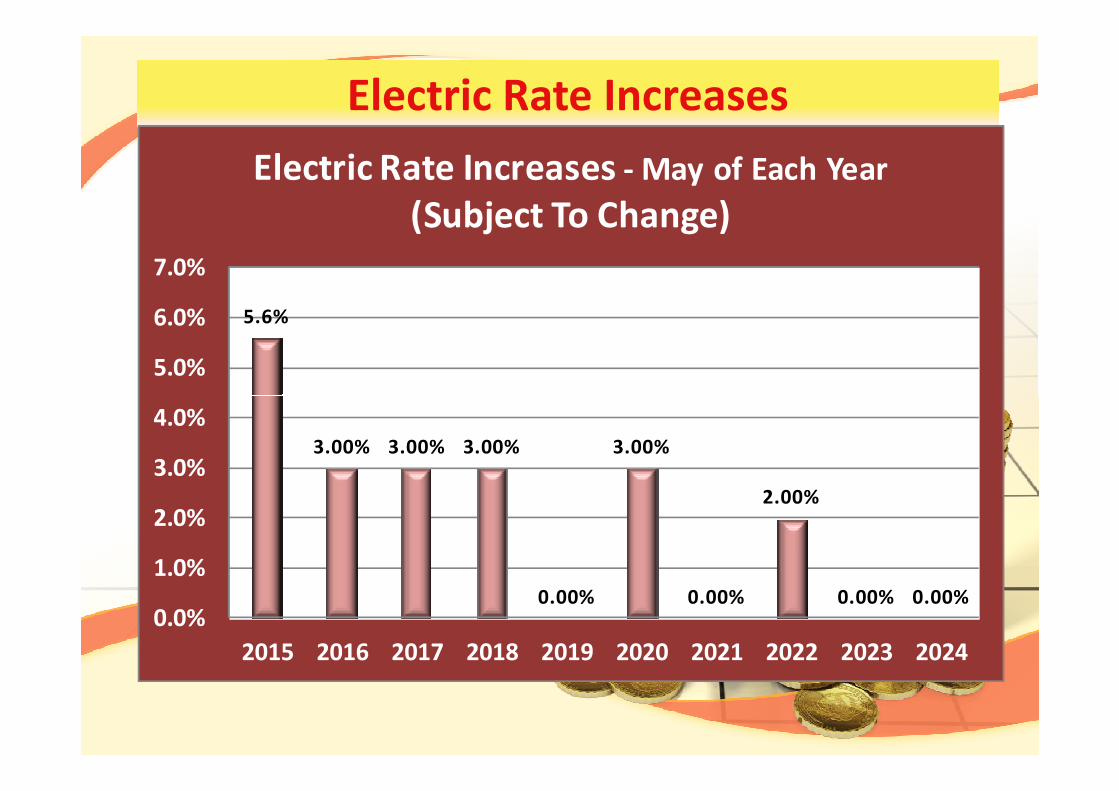
Electric Rate Increases
5.6%
5.0%
6.0%
7.0%
Electric Rate Increases - May of Each Year
(Subject To Change)
3.00% 3.00% 3.00%
0.00%
3.00%
0.00%
2.00%
0.00% 0.00%0.0%
1.0%
2.0%
3.0%
4.0%
2015 2016 2017 2018 2019 2020 2021 2022 2023 2024
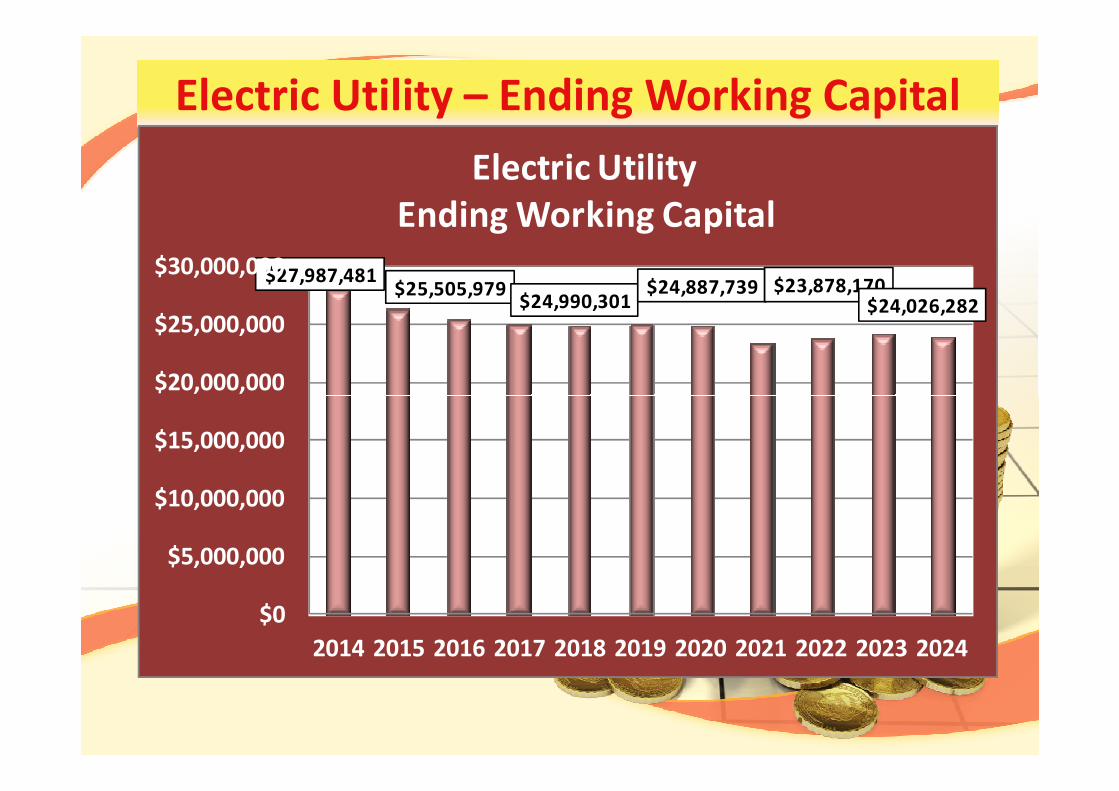
Electric Utility – Ending Working Capital
$27,987,481 $25,505,979
$24,990,301 $24,887,739 $23,878,170
$24,026,282
$20,000,000
$25,000,000
$30,000,000
Electric Utility
Ending Working Capital
$0
$5,000,000
$10,000,000
$15,000,000
$20,000,000
2014 2015 2016 2017 2018 2019 2020 2021 2022 2023 2024
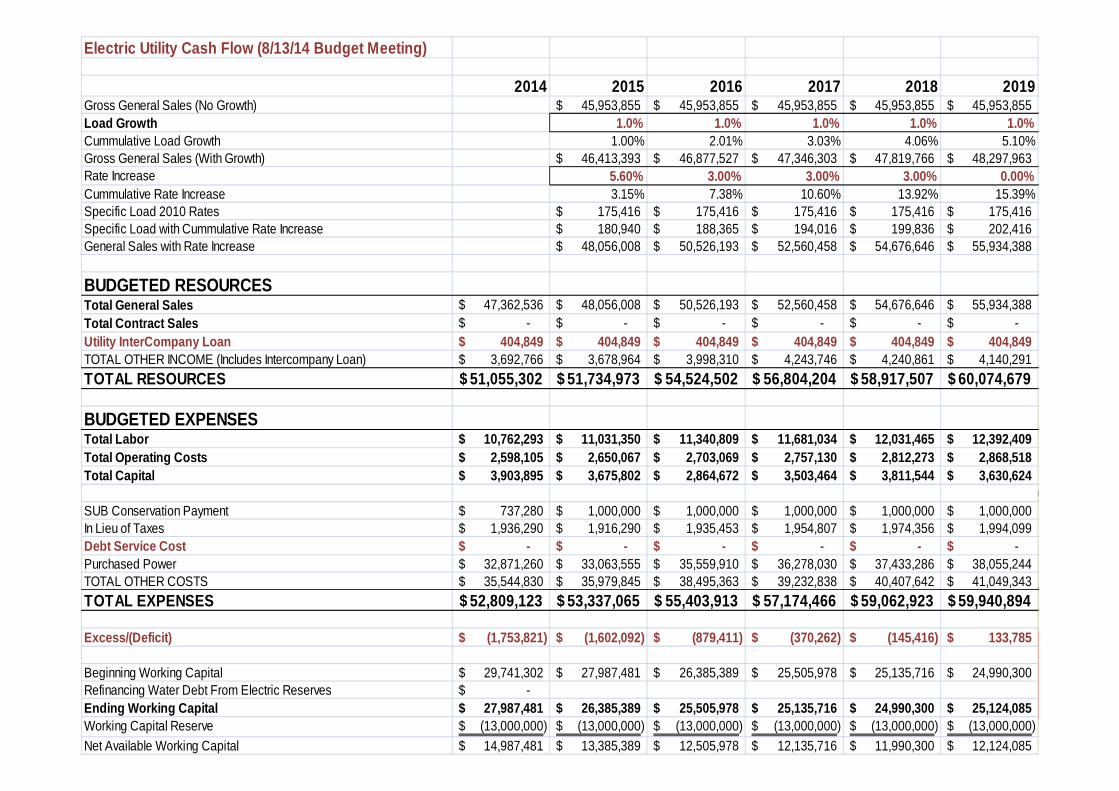
Electric Utility Cash Flow (8/13/14 Budget Meeting)
2014 2015 2016 2017 2018 2019Gross General Sales (No Growth) 45,953,855$ 45,953,855$ 45,953,855$ 45,953,855$ 45,953,855$ Load Growth 1.0% 1.0% 1.0% 1.0% 1.0%Cummulative Load Growth 1.00% 2.01% 3.03% 4.06% 5.10%Gross General Sales (With Growth) 46,413,393$ 46,877,527$ 47,346,303$ 47,819,766$ 48,297,963$ Rate Increase 5.60% 3.00% 3.00% 3.00% 0.00%Cummulative Rate Increase 3.15% 7.38% 10.60% 13.92% 15.39%Specific Load 2010 Rates 175,416$ 175,416$ 175,416$ 175,416$ 175,416$ Specific Load with Cummulative Rate Increase 180,940$ 188,365$ 194,016$ 199,836$ 202,416$ General Sales with Rate Increase 48,056,008$ 50,526,193$ 52,560,458$ 54,676,646$ 55,934,388$
BUDGETED RESOURCESTotal General Sales 47,362,536$ 48,056,008$ 50,526,193$ 52,560,458$ 54,676,646$ 55,934,388$ Total Contract Sales -$ -$ -$ -$ -$ -$ Utility InterCompany Loan 404,849$ 404,849$ 404,849$ 404,849$ 404,849$ 404,849$ TOTAL OTHER INCOME (Includes Intercompany Loan) 3,692,766$ 3,678,964$ 3,998,310$ 4,243,746$ 4,240,861$ 4,140,291$
TOTAL RESOURCES 51,055,302$ 51,734,973$ 54,524,502$ 56,804,204$ 58,917,507$ 60,074,679$
BUDGETED EXPENSESTotal Labor 10,762,293$ 11,031,350$ 11,340,809$ 11,681,034$ 12,031,465$ 12,392,409$ Total Operating Costs 2,598,105$ 2,650,067$ 2,703,069$ 2,757,130$ 2,812,273$ 2,868,518$ Total Capital 3,903,895$ 3,675,802$ 2,864,672$ 3,503,464$ 3,811,544$ 3,630,624$
SUB Conservation Payment 737,280$ 1,000,000$ 1,000,000$ 1,000,000$ 1,000,000$ 1,000,000$ In Lieu of Taxes 1,936,290$ 1,916,290$ 1,935,453$ 1,954,807$ 1,974,356$ 1,994,099$ Debt Service Cost -$ -$ -$ -$ -$ -$ Purchased Power 32,871,260$ 33,063,555$ 35,559,910$ 36,278,030$ 37,433,286$ 38,055,244$ TOTAL OTHER COSTS 35,544,830$ 35,979,845$ 38,495,363$ 39,232,838$ 40,407,642$ 41,049,343$
TOTAL EXPENSES 52,809,123$ 53,337,065$ 55,403,913$ 57,174,466$ 59,062,923$ 59,940,894$
Excess/(Deficit) (1,753,821)$ (1,602,092)$ (879,411)$ (370,262)$ (145,416)$ 133,785$
Beginning Working Capital 29,741,302$ 27,987,481$ 26,385,389$ 25,505,978$ 25,135,716$ 24,990,300$ Refinancing Water Debt From Electric Reserves -$ Ending Working Capital 27,987,481$ 26,385,389$ 25,505,978$ 25,135,716$ 24,990,300$ 25,124,085$ Working Capital Reserve (13,000,000)$ (13,000,000)$ (13,000,000)$ (13,000,000)$ (13,000,000)$ (13,000,000)$ Net Available Working Capital 14,987,481$ 13,385,389$ 12,505,978$ 12,135,716$ 11,990,300$ 12,124,085$
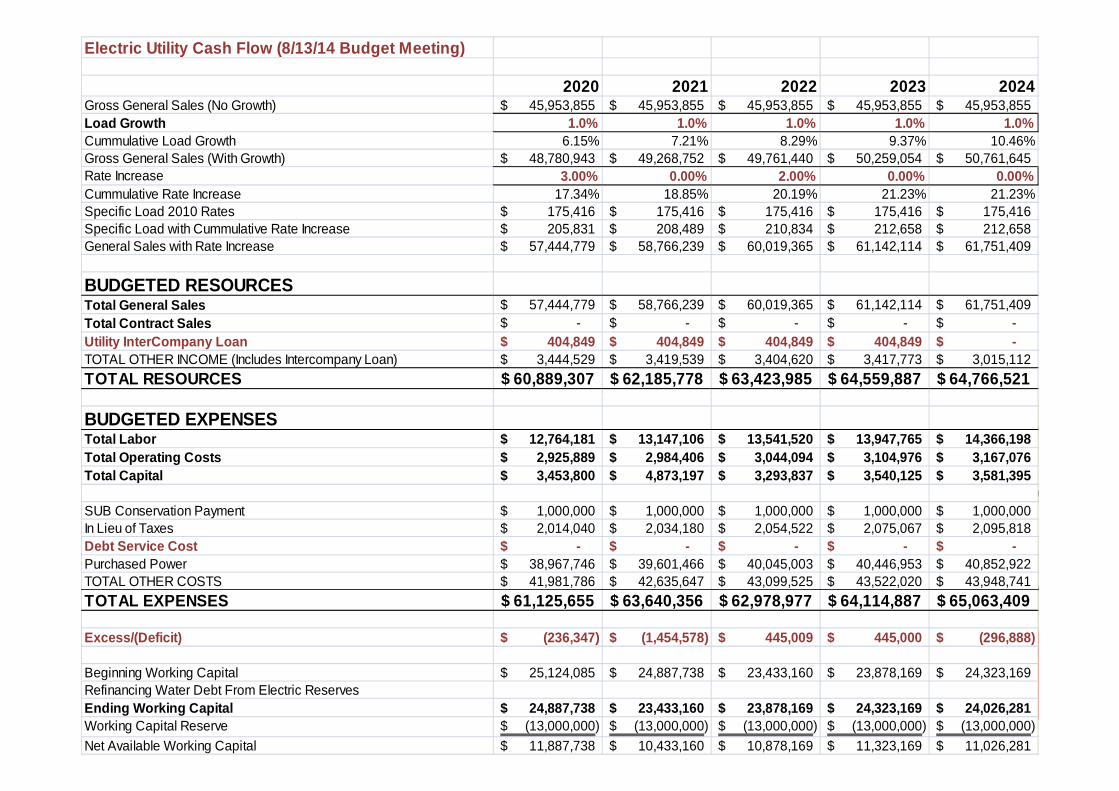
Electric Utility Cash Flow (8/13/14 Budget Meeting)
2020 2021 2022 2023 2024Gross General Sales (No Growth) 45,953,855$ 45,953,855$ 45,953,855$ 45,953,855$ 45,953,855$ Load Growth 1.0% 1.0% 1.0% 1.0% 1.0%Cummulative Load Growth 6.15% 7.21% 8.29% 9.37% 10.46%Gross General Sales (With Growth) 48,780,943$ 49,268,752$ 49,761,440$ 50,259,054$ 50,761,645$ Rate Increase 3.00% 0.00% 2.00% 0.00% 0.00%Cummulative Rate Increase 17.34% 18.85% 20.19% 21.23% 21.23%Specific Load 2010 Rates 175,416$ 175,416$ 175,416$ 175,416$ 175,416$ Specific Load with Cummulative Rate Increase 205,831$ 208,489$ 210,834$ 212,658$ 212,658$ General Sales with Rate Increase 57,444,779$ 58,766,239$ 60,019,365$ 61,142,114$ 61,751,409$
BUDGETED RESOURCESTotal General Sales 57,444,779$ 58,766,239$ 60,019,365$ 61,142,114$ 61,751,409$ Total Contract Sales -$ -$ -$ -$ -$ Utility InterCompany Loan 404,849$ 404,849$ 404,849$ 404,849$ -$ TOTAL OTHER INCOME (Includes Intercompany Loan) 3,444,529$ 3,419,539$ 3,404,620$ 3,417,773$ 3,015,112$
TOTAL RESOURCES 60,889,307$ 62,185,778$ 63,423,985$ 64,559,887$ 64,766,521$
BUDGETED EXPENSESTotal Labor 12,764,181$ 13,147,106$ 13,541,520$ 13,947,765$ 14,366,198$ Total Operating Costs 2,925,889$ 2,984,406$ 3,044,094$ 3,104,976$ 3,167,076$ Total Capital 3,453,800$ 4,873,197$ 3,293,837$ 3,540,125$ 3,581,395$
SUB Conservation Payment 1,000,000$ 1,000,000$ 1,000,000$ 1,000,000$ 1,000,000$ In Lieu of Taxes 2,014,040$ 2,034,180$ 2,054,522$ 2,075,067$ 2,095,818$ Debt Service Cost -$ -$ -$ -$ -$ Purchased Power 38,967,746$ 39,601,466$ 40,045,003$ 40,446,953$ 40,852,922$ TOTAL OTHER COSTS 41,981,786$ 42,635,647$ 43,099,525$ 43,522,020$ 43,948,741$
TOTAL EXPENSES 61,125,655$ 63,640,356$ 62,978,977$ 64,114,887$ 65,063,409$
Excess/(Deficit) (236,347)$ (1,454,578)$ 445,009$ 445,000$ (296,888)$
Beginning Working Capital 25,124,085$ 24,887,738$ 23,433,160$ 23,878,169$ 24,323,169$ Refinancing Water Debt From Electric ReservesEnding Working Capital 24,887,738$ 23,433,160$ 23,878,169$ 24,323,169$ 24,026,281$ Working Capital Reserve (13,000,000)$ (13,000,000)$ (13,000,000)$ (13,000,000)$ (13,000,000)$ Net Available Working Capital 11,887,738$ 10,433,160$ 10,878,169$ 11,323,169$ 11,026,281$
Project Labor Capital
1
Distribution: 2000 Of Main Replacement-Replacement
of failing galvanized and OD steel pipe. $ 65,000 $ 145,000
2 Transmission: Eastside - Steam Plant Transmission Phase 2 $ 97,500 $ 525,000
3
Production: Master and Water Conservation 5 year plan
update. $ 2,800 $ 60,000
4 Distribution: 36" pipeline at Millrace extension for path. $ 6,500 $ 20,000
5 Transmission: Eastside - Steam Plant Transmission Phase 3. $ 81,300 $ 505,000
6 Source: Surface Water Intake Design Phase 1. $ 3,500 $ 250,000
7 Production/Distribution: South 57th St Pump Station $ 42,900 $ 910,000
8 Transmission: Thurston Transmission Phase 1. $ 1,400 $ 620,000
9
Production: South 72nd St Pump Station Power & Control
Retrofit $ 7,000 $ 45,000
10
Transmission: Marcola Road Transmission
Design/Easements. $ 1,300 $ 10,000
11 Transmission: South 7th Railroad Crossing Design/Permit. $ 1,300 $ 5,000
12
Production: South 67th St Pump Station Meter & PRV
Facility. $ 10,400 $ 35,000
13
Production: Seismic Retrofit of South 57th Reservoirs -
piping. $ 7,000 $ 652,400
14 Production: Thurston Slough Pipeline Crossing $ 3,300 $ 160,000
15 Production: South Hills Reservoir Replacement Design $ 3,300 $ 460,000
16
Production: Pump Station Testing-Pumps & Motors-
Annual testing for efficiency and condition. $ 3,500 $ 5,000
17
Source: Pump & Motor Testing at Wells-Annual testing
for efficiency and condition. $ 10,400 $ 20,000
18 Source: Water Quality Monitoring Station. $ 1,400 $ 25,000
19
Source: Pump Test 2 Wells-Extended testing of wells for
condition and capacity. $ 3,500 $ 5,000
20
Source: Well Rehabilitation-Treatment and
reconditioning of 2 wells to recover lost capacity. $ 3,500 $ 75,000
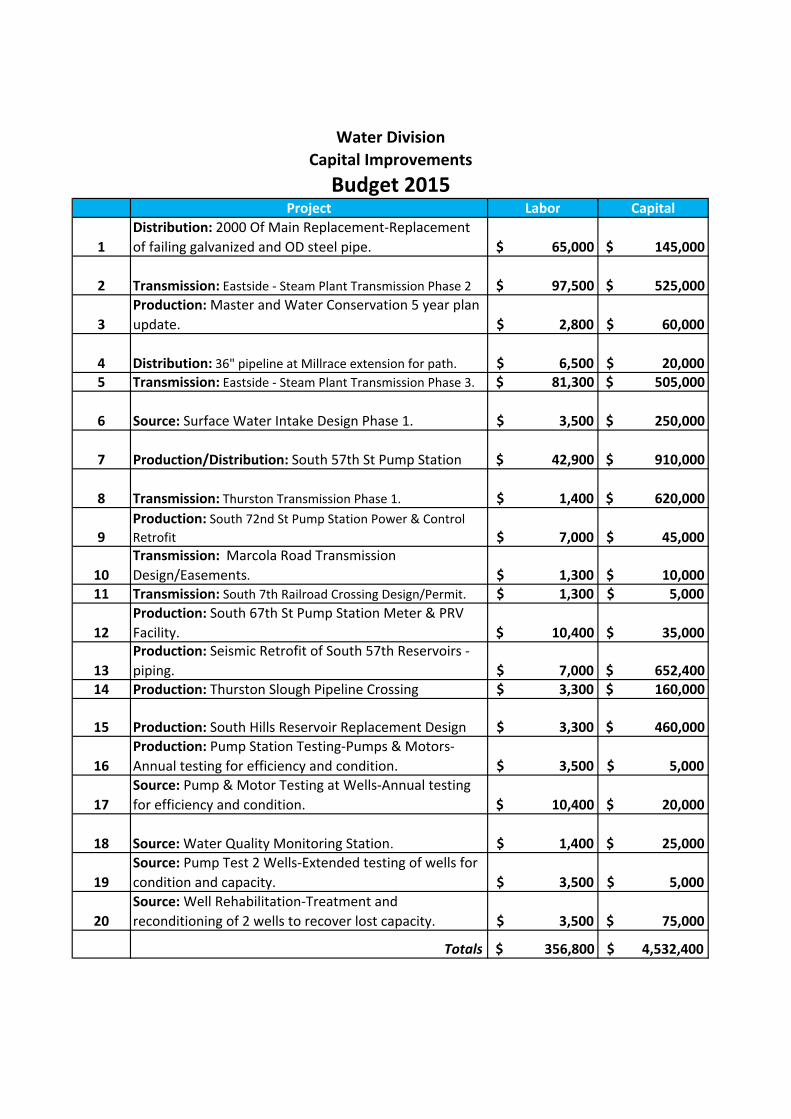
Totals $ 356,800 $ 4,532,400
Budget 2015
Water Division
Capital Improvements
Project Labor Capital
1
Distribution: 2000' Of Main Replacement-Replacement
of failing galvanized and OD steel pipe. $ 65,000 $ 145,000
2
Transmission: McVey Highway transmission pipeline
construction Phase 2 (E 19th Avenue to city limits) $ 52,000 $ 650,000
3 Production: Thurston wellfield access bridge construction $ 7,000 $ 370,000
4 Source: Surface water intake design Phase 2 $ 3,500 $ 250,000
5
Transmission: Natron transmission pepeline Phase 2 (Mt
Vernon Road - Quartz Avenue) $ 65,000 $ 350,000
6 Transmission: Thurston transmission Phase 2 $ - $ 455,000
7
Production: Replace South Hills reservoir Phase 1 - Access,
site work, utilities $ 7,000 $ 778,650
8
Source: Seismic retrofit of S. 67th Street reservoir -
design $ 3,500 $ 147,800
9
Distribution: Marcola Road transmission pipeline
construction Phase 1 (Peace Health) $ 39,000 $ 360,000
10
Transmission: Marcola Road transmission pipeline
construction Phase 2 (19th Street/Marcola Road - City
limits) (Complete in conjuntion with city sewer project) $ 48,800 $ 325,000
11 Source: Water Quality Monitoring Station $ 1,400 $ -
12
Distribution: Quartz Avenue pipeline (Bob Straub
Parkway to S. 60th Street) $ 13,000 $ 20,000
13
Transmission: Natron transmission pepeline Phase 3
(Bob Straub Pkwy/Quartz Avenue south 700') $ 22,800 $ 105,000
14 Source: Resand filter bed $ 13,500 $ 180,000
15 Production: Pump & montor testing at pump stations $ 3,500 $ 5,000
16 Source: Pump and motor testing at wells $ 10,400 $ 20,000
17
Source: Test two (2) production wells for capacity and
efficiency $ 3,500 $ 5,000
18 Source: Rehabilitate two (2) production wells $ 3,500 $ 75,000
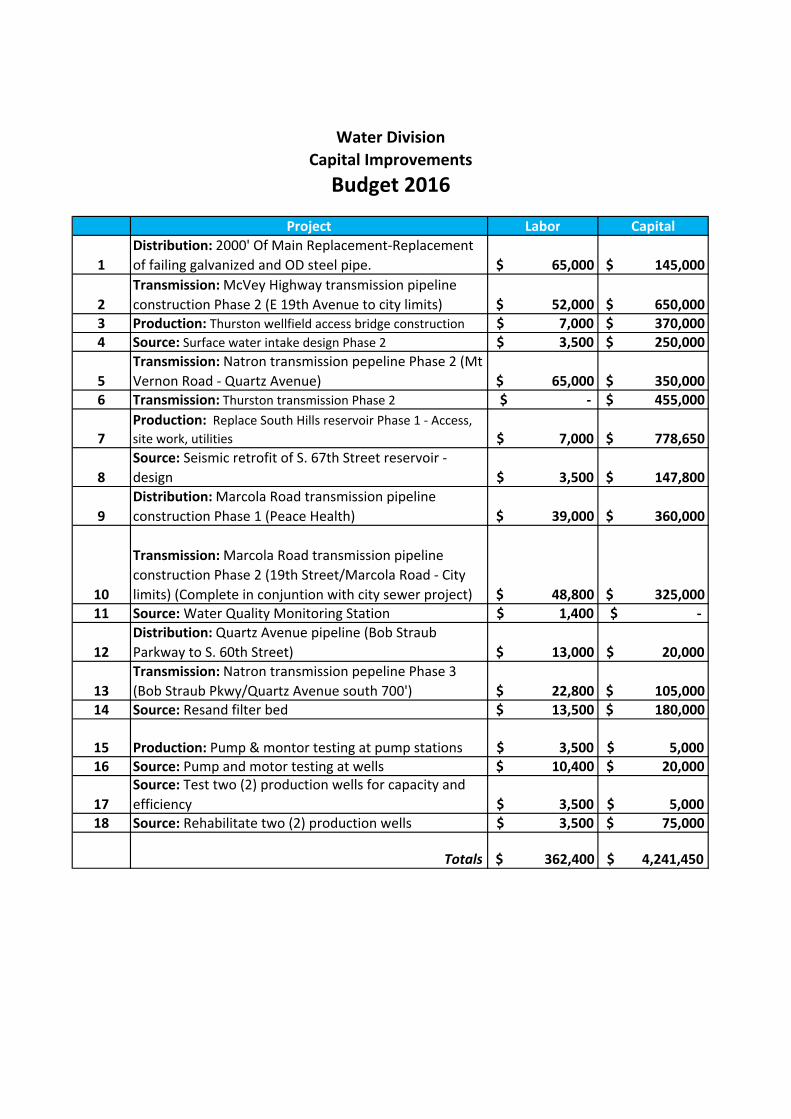
Totals $ 362,400 $ 4,241,450
Water Division
Capital Improvements
Budget 2016
Project Labor Capital
1
Distribution: 2000 Of Main Replacement-Replacement
of failing galvanized and OD steel pipe. $ 65,000 $ 145,000
2
Transmission: North System transmission pipeline
construction Phase 1 (Olympic St/5th-6th and 6th St/Olympic-
Centennial). $ 52,000 $ 360,000
3
Production: Replace South Hills reservoir Phase 2 - Pump
Station. $ 7,000 $ 785,700
4
Production: Seismic retrofit of Willamette Heights reservoir -
design $ 7,000 $ 189,400
5
Transmission: Eastside transmission pipeline Phase 4 (S
28th Street/Booth Kelly Road to Eastside Pump Station). $ 81,300 $ 510,000
6 Source: Surface water intake construction Phase 1 $ 7,000 $ 1,187,500
7
Transmission/Production: Thurston transmission
pipeline construction Phase 3 (School District property) $ 13,500 $ 511,000
8
Transmission: Marcola Road transmission pipeline Phase
3 (Marcola Road/19th St - Peace Health) $ 29,300 $ 210,000
9
Transmission: Cathodic protection OD steel transmission
pipeline Phase 1. $ 130,000 $ 150,000
10 Production: Pump and motor testing at pump stations $ 3,500 $ 5,000
11 Source: Pump and motor testing at wells $ 10,400 $ 20,000
12 Source: Test two (2) wells for capacity and efficiency $ 3,500 $ 5,000
13 Source: Rehabilitate two (2) production wells $ 3,500 $ 75,000
Totals $ 413,000 $ 4,153,600
Water Division
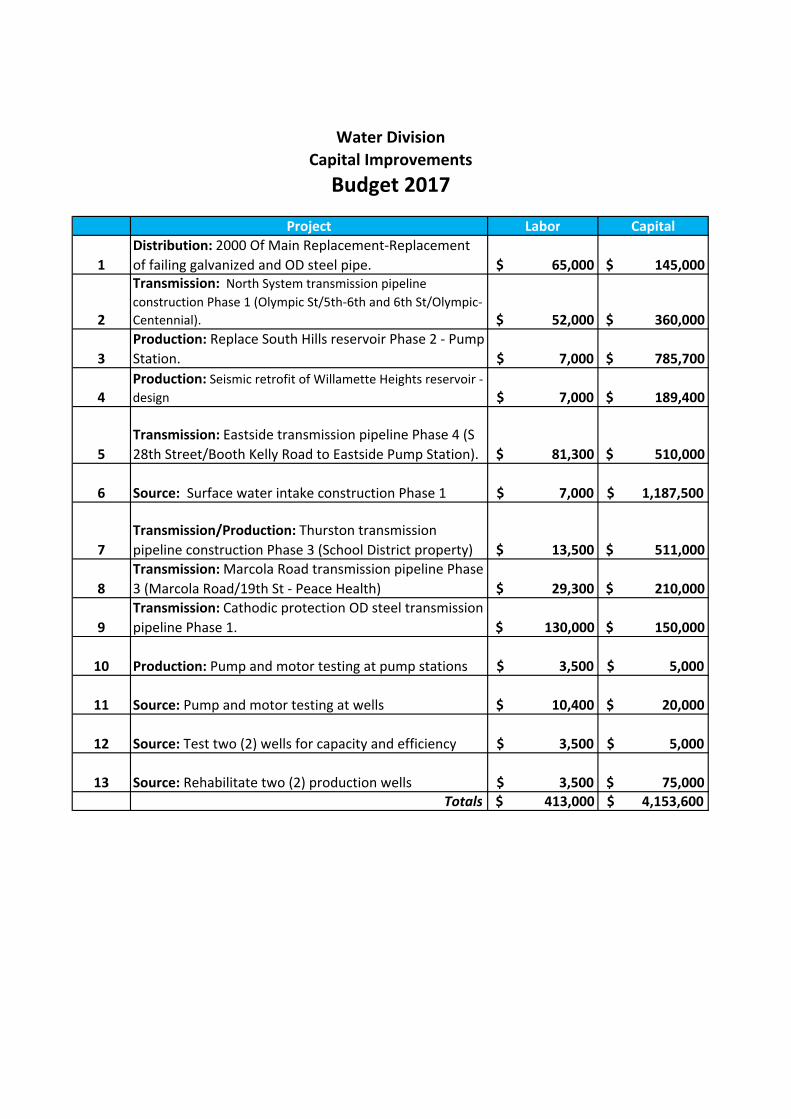
Capital Improvements
Budget 2017
Project Labor Capital
1
Distribution: 2000' Of Main Replacement-Replacement
of failing galvanized and OD steel pipe. $ 65,000 $ 145,000
2
Transmission: Thurston transmission pipeline
construction Phase 4 (School District property) $ 88,300 $ 785,000
3
Source: Willamette surface water intake construction Phase
2. $ 7,000 $ 1,187,500
4
Transmission: North System transmission pipeline
construction Phase 2 (Relocate intertie). $ 23,300 $ 150,000
5
Transmission: Cathodic Protection of OD steel pipelines
Phase 2. $ 130,000 $ 150,000
6
Production: Seismic Retrofit of Willamette Heights
reservoir $ 7,000 $ 372,650
7 Production: Replace South Hills reservoir Phase 3 - Tank $ 7,000 $ 835,700
8 Source: Resand Filter Bed-Resand filter bed to 36" depth. $ 13,500 $ 180,000
9 Production: Seismic Retrofit of S 67th Street reservoir $ 7,000 $ 261,250
10 Production: Pump & Motor Testing at pump stations $ 3,500 $ 5,000
11 Source: Pump and motor testing at wells $ 10,400 $ 20,000
12 Source: Test two (2) wells for capacity and efficiency $ 3,500 $ 5,000
13 Source: Rehabilitate two (2) production wells $ 3,500 $ 75,000
Totals $ 369,000 $ 4,172,100
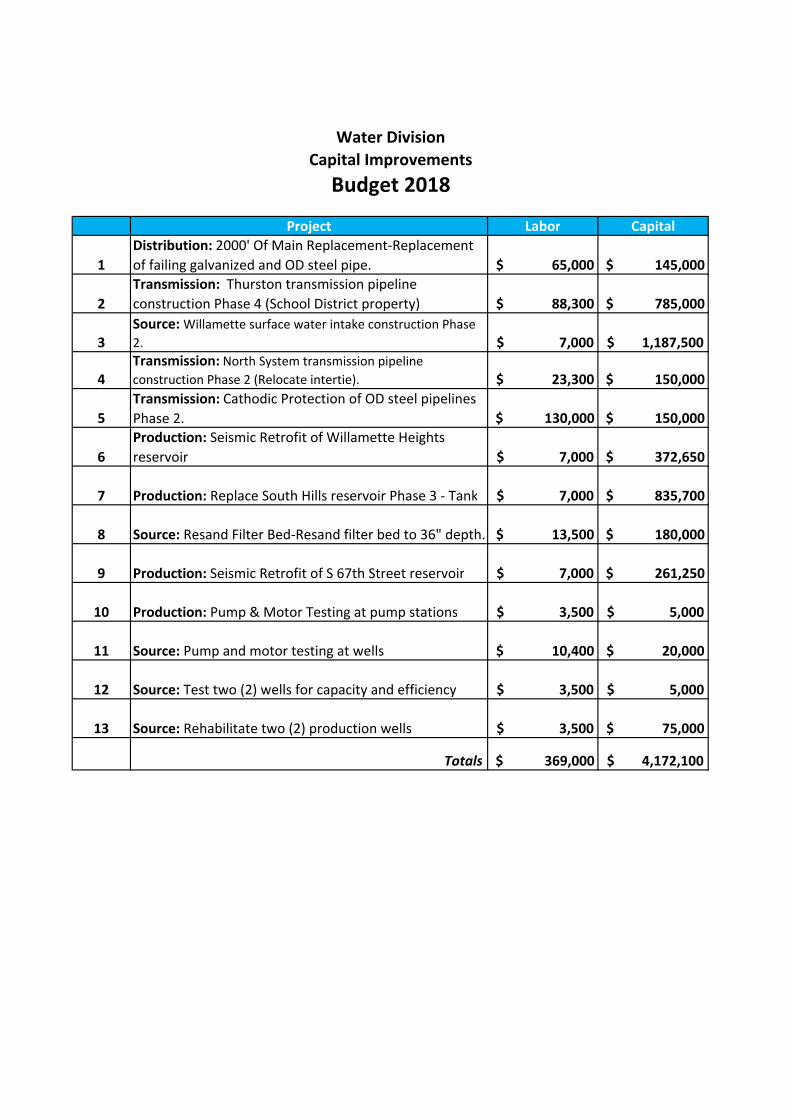
Water Division
Capital Improvements
Budget 2018
Project Labor Capital
1
Distribution: 2000 Of Main Replacement-Replacement
of failing galvanized and OD steel pipe. $ 65,000 $ 145,000
2
Transmission: North System transmission pipeline
construction Phase 3 (6th St/Centennial- G). $ 45,500 $ 365,000
3
Production: Seismic Retrofit and painting of 57th Street
reservoir #1 $ 7,000 $ 729,350
4 Source: Surface Water Plant design Phase 1. $ 17,400 $ 1,500,000
5
Transmission: Thurston transmission pipeline
construction Phase 5 $ 97,500 $ 650,000
6
Source: Pump & Motor Testing at Wells-Annual testing
for efficiency and condition. $ 700 $ 104,835
7 Production: Remove S 70th Street reservoir $ 3,500 $ 58,000
8 Production: Painting of S 67th Street reservoir $ 3,500 $ 656,500
9 Production: Pump and motor testing at pump stations $ 3,500 $ 5,000
10 Source: Pump and motor teting at wells $ 10,400 $ 20,000
11 Source: Test two (2) wells for capacity and efficiency $ 3,500 $ 5,000
12 Source: Rehabilitate two 2 wells to recover lost capacity. $ 3,500 $ 75,000
Totals $ 261,000 $ 4,313,685
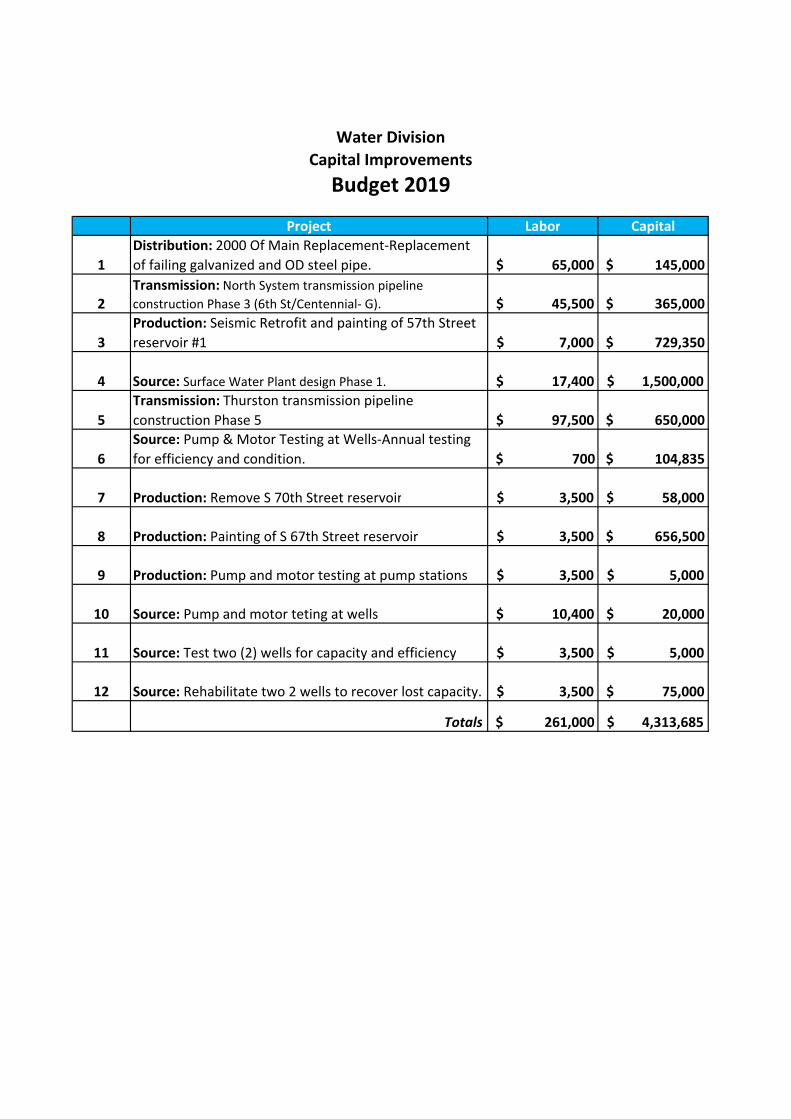
Budget 2019
Water Division
Capital Improvements
Project Labor Capital
1
Distribution: 2000 Of Main Replacement-Replacement
of failing galvanized and OD steel pipe. $ 65,000 $ 145,000
2
Transmission: North System transmission pipeline
construction Phase 4 (G - C). $ 48,800 $ 320,000
3
Production: Master Plan-5 year update of Water Master
Plan. $ 1,400 $ 50,000
4 Source: Surface Water Plant design Phase 2. $ 17,400 $ 1,500,000
5
Production: Thurston transmission pipeline construction
Phase 6 $ 97,500 $ 650,000
6
Production: Water Conservation & Management Plan
update $ 1,400 $ 25,000
7
Production: Seismic retrofit and painting of S 57t Street
reservoir #2 $ - $ 997,600
8 Distribution: Resand filter bed $ 13,500 $ 180,000
9 Production: Pump and motor testing at pump stations $ 3,500 $ 5,000
10 Source: Pump and motor testing at wells $ 10,400 $ 20,000
11 Source: Test two (2) wells for capacity and efficeincy $ 3,500 $ 5,000
12 Source: Rehabilitate two (2) production wells $ 3,500 $ 75,000
Totals $ 265,900 $ 3,972,600
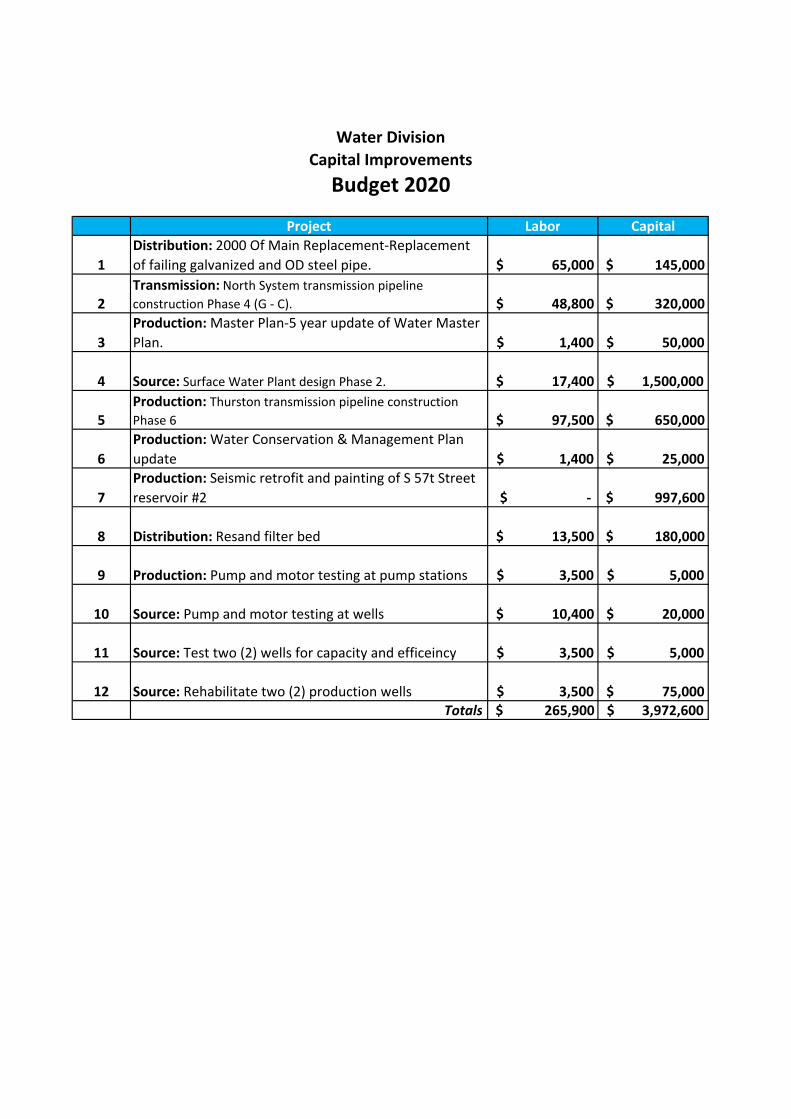
Water Division
Capital Improvements
Budget 2020
Project Labor Capital
1
Distribution: 2000 Of Main Replacement-Replacement
of failing galvanized and OD steel pipe. $ 65,000 $ 145,000
2
Transmission: North System transmission pipeline
construction Phase 5 (C/6th-4th and 4th/C-B). $ 55,800 $ 260,000
3 Source: Surface Water Plant construction Phase 1. $ 13,900 $ 8,220,000
4
Transmission: Thurston transmission pipeline
construction Phase 7 $ 97,500 $ 650,000
5 Production: Pump and motor testing at pump stations $ 3,500 $ 5,000
6 Source: Pump and motor testing at wells $ 10,400 $ 20,000
7 Source: Test two (2) wells for capacity and efficeincy $ 3,500 $ 5,000
8 Source: Rehabilitate two (2) production wells $ 3,500 $ 75,000
Totals $ 253,100 $ 9,380,000
Water Division
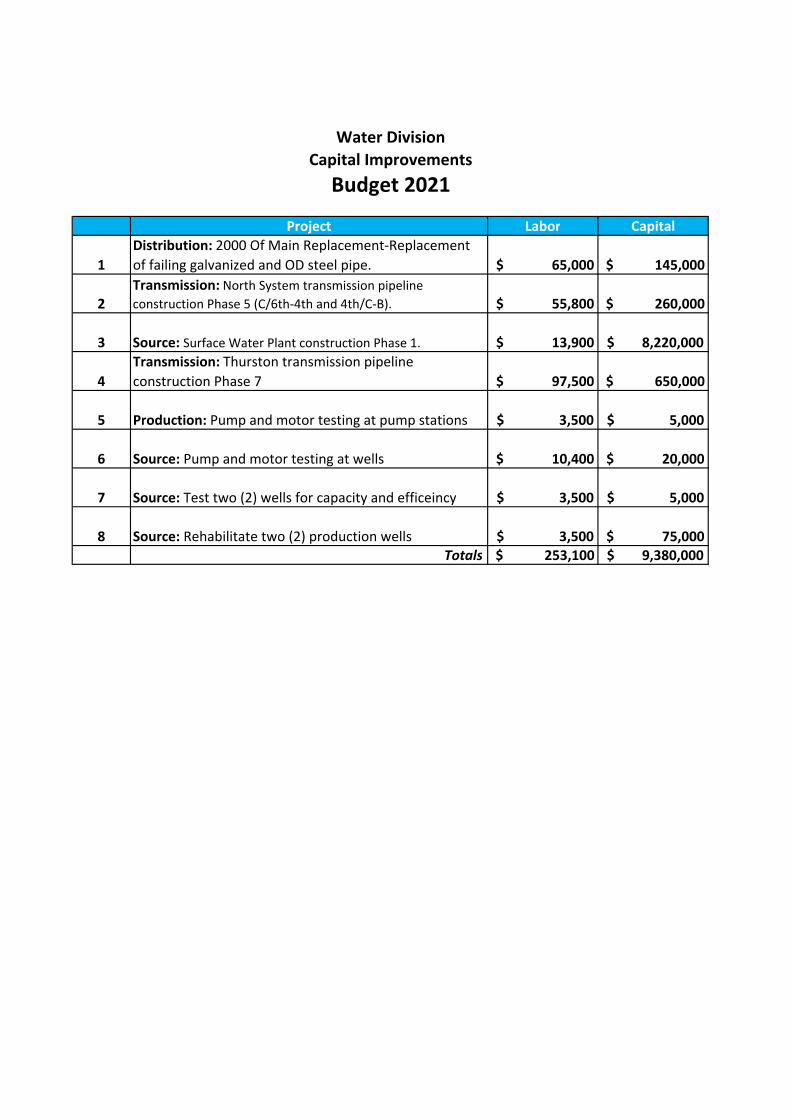
Capital Improvements
Budget 2021
Project Labor Capital
1
Distribution: 2000 Of Main Replacement-Replacement
of failing galvanized and OD steel pipe. $ 65,000 $ 145,000
2
Transmission: Henderson Avenue transmission pipeline
construction (14th Ave - 19th Ave). $ 55,300 $ 375,000
3 Production: SCADA System upgrade. $ 34,800 $ 100,000
4 Source: Surface Water Plant construction Phase 2 $ 13,900 $ 8,220,000
5
Transmission: 35th Street transmission pipeline
construction (Commercial - Industrial, includes new
railroad crossing) $ 32,500 $ 295,000
6
Transmission: Thurston transmission pipeline
construction Phase 8 $ 97,500 $ 650,000
7 Source/Transmission: Resand filter bed $ 13,500 $ 180,000
8 Production: Pump and motor testing at pump stations $ 3,500 $ 5,000
9 Source: Pump and motor testing at wells $ 10,400 $ 20,000
10 Source: Test two (2) wells for capacity and efficeincy $ 3,500 $ 5,000
11 Source: Rehabilitate two (2) production wells $ 3,500 $ 75,000
Totals $ 333,400 $ 10,070,000
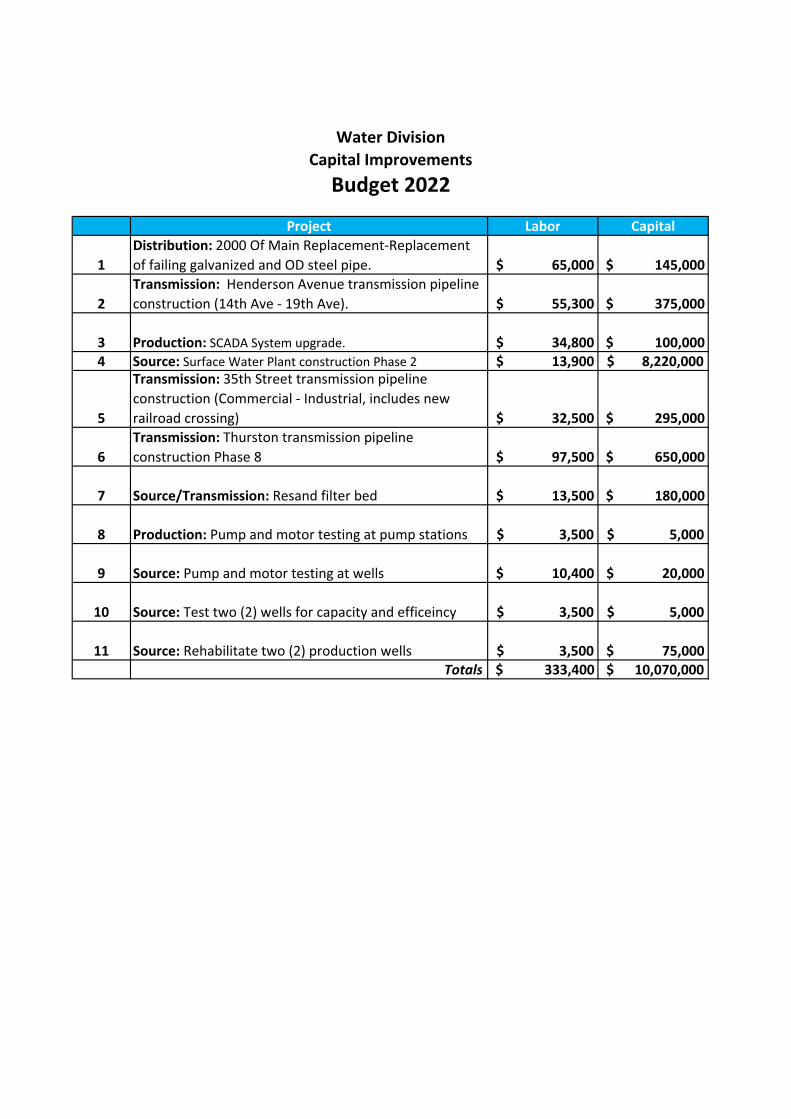
Water Division
Capital Improvements
Budget 2022
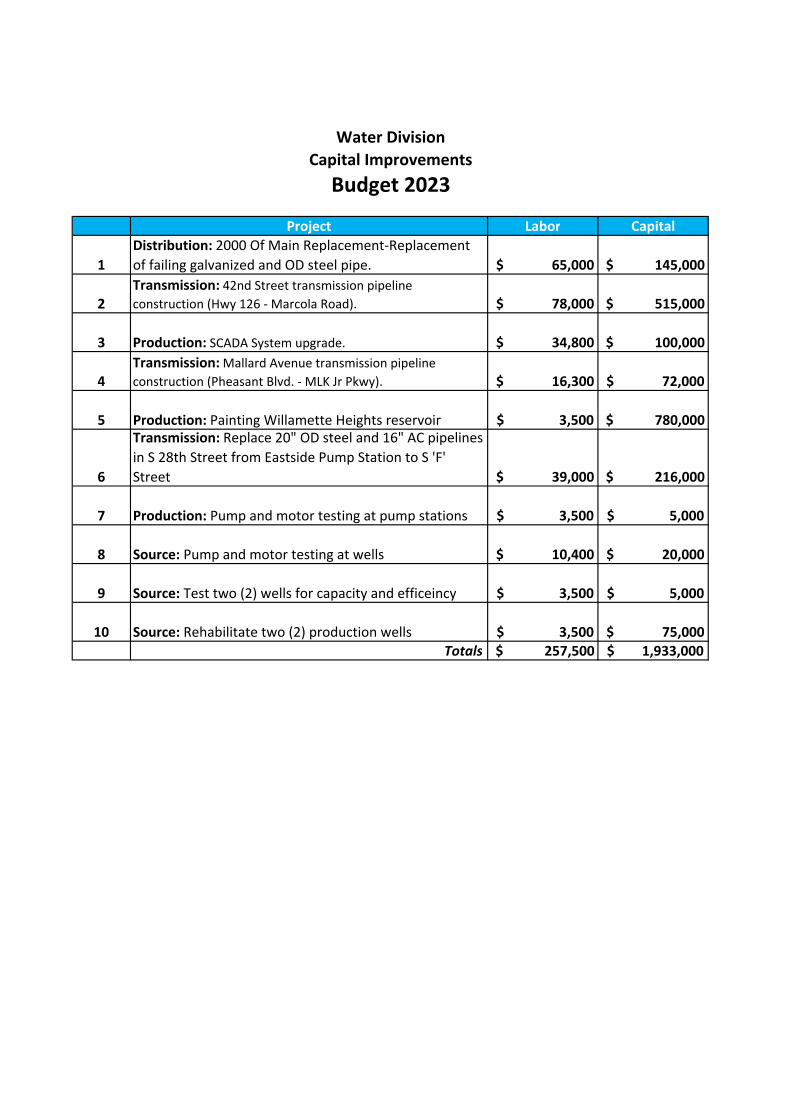
Project Labor Capital
1
Distribution: 2000 Of Main Replacement-Replacement
of failing galvanized and OD steel pipe. $ 65,000 $ 145,000
2
Transmission: 42nd Street transmission pipeline
construction (Hwy 126 - Marcola Road). $ 78,000 $ 515,000
3 Production: SCADA System upgrade. $ 34,800 $ 100,000
4
Transmission: Mallard Avenue transmission pipeline
construction (Pheasant Blvd. - MLK Jr Pkwy). $ 16,300 $ 72,000
5 Production: Painting Willamette Heights reservoir $ 3,500 $ 780,000
6
Transmission: Replace 20" OD steel and 16" AC pipelines
in S 28th Street from Eastside Pump Station to S 'F'
Street $ 39,000 $ 216,000
7 Production: Pump and motor testing at pump stations $ 3,500 $ 5,000
8 Source: Pump and motor testing at wells $ 10,400 $ 20,000
9 Source: Test two (2) wells for capacity and efficeincy $ 3,500 $ 5,000
10 Source: Rehabilitate two (2) production wells $ 3,500 $ 75,000
Totals $ 257,500 $ 1,933,000
Water Division
Capital Improvements
Budget 2023
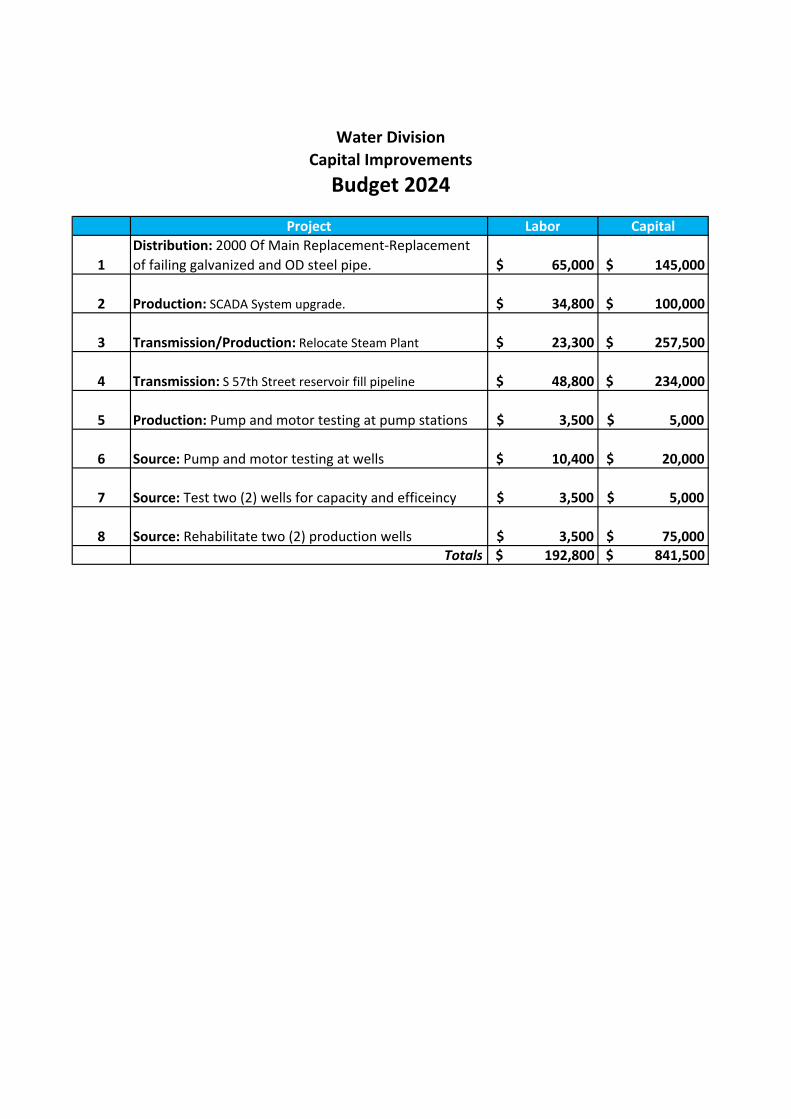
Project Labor Capital
1
Distribution: 2000 Of Main Replacement-Replacement
of failing galvanized and OD steel pipe. $ 65,000 $ 145,000
2 Production: SCADA System upgrade. $ 34,800 $ 100,000
3 Transmission/Production: Relocate Steam Plant $ 23,300 $ 257,500
4 Transmission: S 57th Street reservoir fill pipeline $ 48,800 $ 234,000
5 Production: Pump and motor testing at pump stations $ 3,500 $ 5,000
6 Source: Pump and motor testing at wells $ 10,400 $ 20,000
7 Source: Test two (2) wells for capacity and efficeincy $ 3,500 $ 5,000
8 Source: Rehabilitate two (2) production wells $ 3,500 $ 75,000
Totals $ 192,800 $ 841,500
Water Division
Capital Improvements
Budget 2024
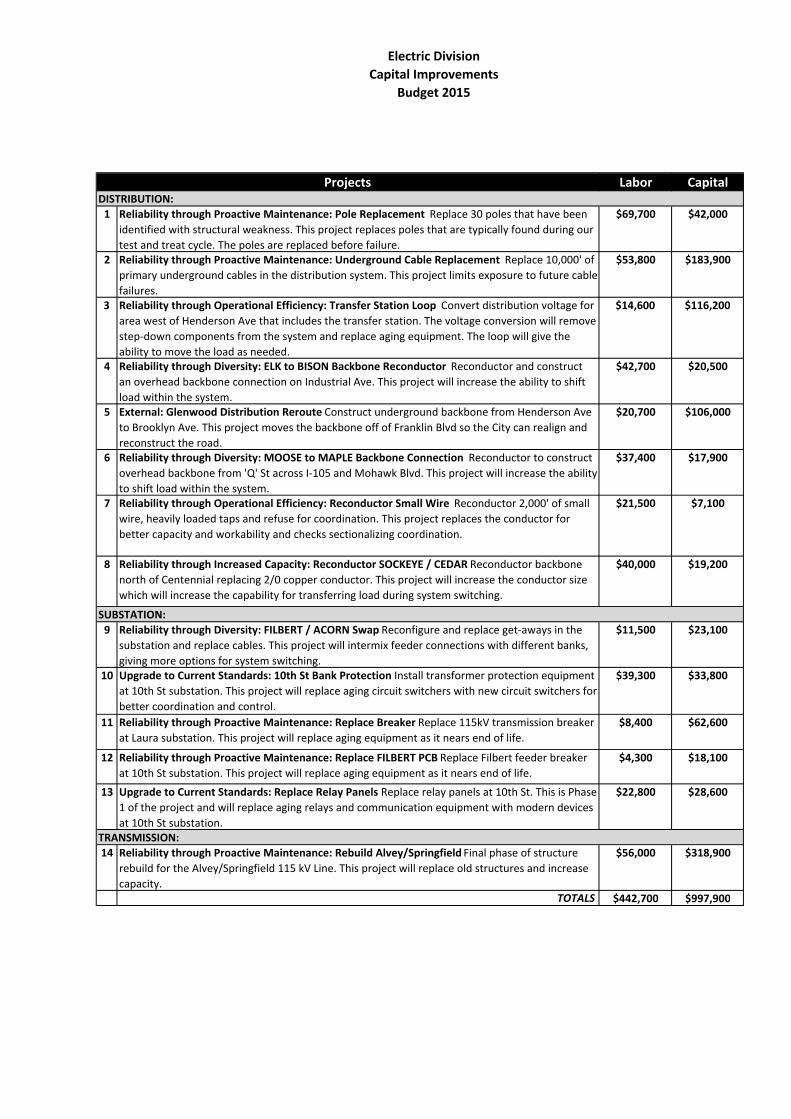
Electric Division
Capital Improvements
Budget 2015
Labor Capital
1 Reliability through Proactive Maintenance: Pole Replacement Replace 30 poles that have been
identified with structural weakness. This project replaces poles that are typically found during our
test and treat cycle. The poles are replaced before failure.
$69,700 $42,000
2 Reliability through Proactive Maintenance: Underground Cable Replacement Replace 10,000' of
primary underground cables in the distribution system. This project limits exposure to future cable
failures.
$53,800 $183,900
3 Reliability through Operational Efficiency: Transfer Station Loop Convert distribution voltage for
area west of Henderson Ave that includes the transfer station. The voltage conversion will remove
step-down components from the system and replace aging equipment. The loop will give the
ability to move the load as needed.
$14,600 $116,200
4 Reliability through Diversity: ELK to BISON Backbone Reconductor Reconductor and construct
an overhead backbone connection on Industrial Ave. This project will increase the ability to shift
load within the system.
$42,700 $20,500
5 External: Glenwood Distribution Reroute Construct underground backbone from Henderson Ave
to Brooklyn Ave. This project moves the backbone off of Franklin Blvd so the City can realign and
reconstruct the road.
$20,700 $106,000
6 Reliability through Diversity: MOOSE to MAPLE Backbone Connection Reconductor to construct
overhead backbone from 'Q' St across I-105 and Mohawk Blvd. This project will increase the ability
to shift load within the system.
$37,400 $17,900
7 Reliability through Operational Efficiency: Reconductor Small Wire Reconductor 2,000' of small
wire, heavily loaded taps and refuse for coordination. This project replaces the conductor for
better capacity and workability and checks sectionalizing coordination.
$21,500 $7,100
8 Reliability through Increased Capacity: Reconductor SOCKEYE / CEDAR Reconductor backbone
north of Centennial replacing 2/0 copper conductor. This project will increase the conductor size
which will increase the capability for transferring load during system switching.
$40,000 $19,200
9 Reliability through Diversity: FILBERT / ACORN Swap Reconfigure and replace get-aways in the
substation and replace cables. This project will intermix feeder connections with different banks,
giving more options for system switching.
$11,500 $23,100
10 Upgrade to Current Standards: 10th St Bank Protection Install transformer protection equipment
at 10th St substation. This project will replace aging circuit switchers with new circuit switchers for
better coordination and control.
$39,300 $33,800
11 Reliability through Proactive Maintenance: Replace Breaker Replace 115kV transmission breaker
at Laura substation. This project will replace aging equipment as it nears end of life.
$8,400 $62,600
12 Reliability through Proactive Maintenance: Replace FILBERT PCB Replace Filbert feeder breaker
at 10th St substation. This project will replace aging equipment as it nears end of life.
$4,300 $18,100
13 Upgrade to Current Standards: Replace Relay Panels Replace relay panels at 10th St. This is Phase
1 of the project and will replace aging relays and communication equipment with modern devices
at 10th St substation.
$22,800 $28,600
14 Reliability through Proactive Maintenance: Rebuild Alvey/Springfield Final phase of structure
rebuild for the Alvey/Springfield 115 kV Line. This project will replace old structures and increase
capacity.
$56,000 $318,900
TOTALS $442,700 $997,900
DISTRIBUTION:
SUBSTATION:
TRANSMISSION:
Projects
Electric Division
Capital Improvements
Budget 2016
Projects Labor Capital
1 Reliability through Proactive Maintenance: Pole Replacement
Replace 30 poles that have been identified with structural weakness. This project replaces poles
that are typically found during our test and treat cycle. The poles are replaced before failure.
$69,700 $42,000
2 Reliability through Proactive Maintenance: Underground Cable Replacement
Replace 10,000' of primary underground cables in the distribution system. This project limits
exposure to future cable failures.
$53,800 $183,900
3 Reliability through Proactive Maintenance: Emerald Upgrade
Replace old underground backbone with larger cable on S. 67th St. This project will remove 30+
year old cable with new cable that has higher capacity.
$23,200 $94,400
4 Reliability through Diversity: KING to SILVER Backbone Connection
Construct an underground backbone connection from Laura St to Dornoch St. This project will
support the KING circuit with the SILVER for increased reliability and load relief.
$62,800 $154,100
5 Reliability through Operational Efficiency: KOKANEE Northbound Tap to Backbone
Reconductor for an overhead backbone from 'L' St to Quinalt St. This phase replaces some heavily
loaded #6 copper line.
$50,700 $24,300
6 Reliability through Diversity: MOOSE/CARIBOU/MAPLE Backbone Connection
Construct overhead backbone connection along 19th St. It will increase the ability to shift load
within the system.
$11,800 $117,900
7 Reliability through Increased Capacity: Reconductor FIR
Reconductor backbone near 28th St and Main St replacing 2/0 copper conductor. This project will
increase the conductor size and ability to transfer load.
$72,300 $28,500
8 Reliability through Operational Efficiency: Reconductor Small Wire
Reconductor 2,000' of small wire, heavily loaded taps and refuse for coordination. This project
replaces the conductor for better capacity and workability and checks sectionalizing coordination.
$21,500 $7,100
9 Upgrade to Current Standards: Bank Protection Upgrade
Install transformer protection equipment for Bank #1 at Mt. Vernon substation. This project will
replace power transformer fuses with circuit switchers for better coordination and control.
$17,700 $76,000
10 Reliability through Proactive Maintenance: Replace QUARTZ PCB
Replace QUARTZ feeder breaker at Jasper substation, which replaces aging equipment as it nears
end of life.
$4,300 $18,100
11 Upgrade to Current Standards: Replace Relay Panels
Phase 2 of 2. This project will replace aging relays and communication equipment with modern
devices at 10th St substation.
$22,800 $28,600
12 Reliability through Proactive Maintenance: Replace SAPPHIRE PCB
Replace SAPPHIRE feeder breaker and control wire at Mt. Vernon substation Replaces aging
equipment as it nears end of life.
$7,500 $20,600
13 Upgrade to Current Standards: Sierra Pine Bank Protection and Support Install SUB's own 115kV
breaker and construct control house to improve safety and replace our oldest relay equipment.
$21,500 $196,500
Totals $439,600 $992,000
DISTRIBUTION:
SUBSTATION
Electric Division
Capital Improvements
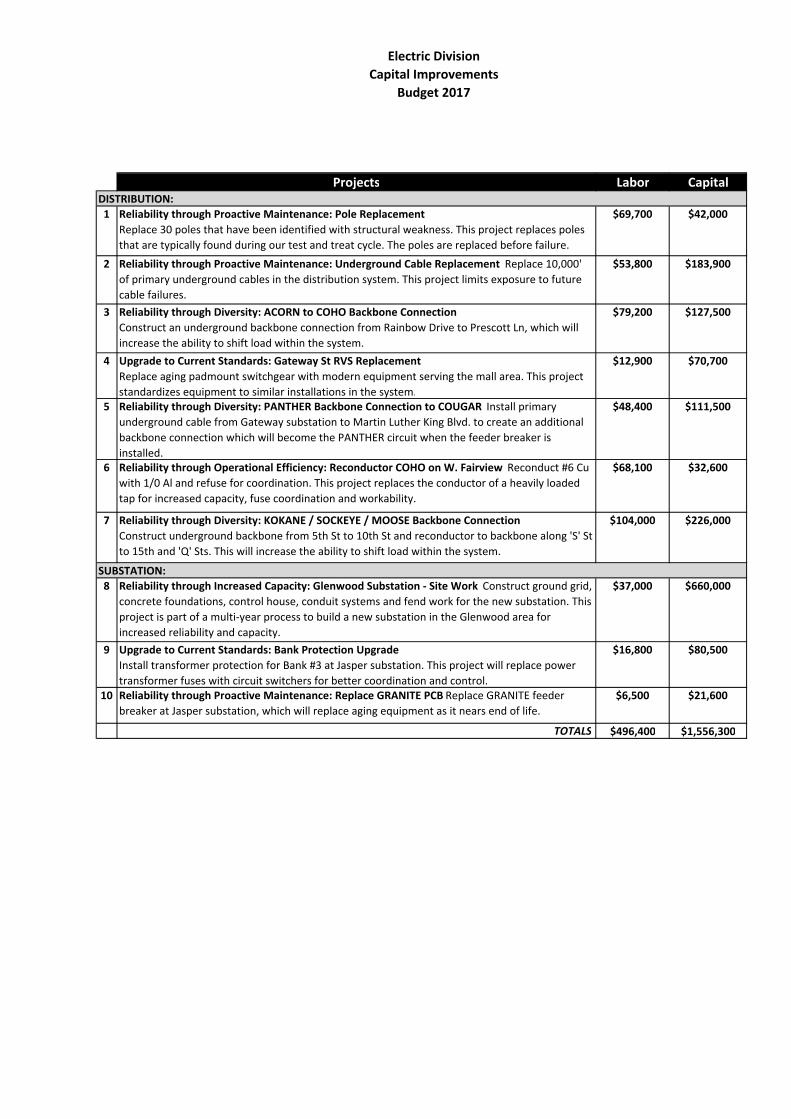
Budget 2017
Projects Labor Capital
1 Reliability through Proactive Maintenance: Pole Replacement
Replace 30 poles that have been identified with structural weakness. This project replaces poles
that are typically found during our test and treat cycle. The poles are replaced before failure.
$69,700 $42,000
2 Reliability through Proactive Maintenance: Underground Cable Replacement Replace 10,000'
of primary underground cables in the distribution system. This project limits exposure to future
cable failures.
$53,800 $183,900
3 Reliability through Diversity: ACORN to COHO Backbone Connection
Construct an underground backbone connection from Rainbow Drive to Prescott Ln, which will
increase the ability to shift load within the system.
$79,200 $127,500
4 Upgrade to Current Standards: Gateway St RVS Replacement
Replace aging padmount switchgear with modern equipment serving the mall area. This project
standardizes equipment to similar installations in the system.
$12,900 $70,700
5 Reliability through Diversity: PANTHER Backbone Connection to COUGAR Install primary
underground cable from Gateway substation to Martin Luther King Blvd. to create an additional
backbone connection which will become the PANTHER circuit when the feeder breaker is
installed.
$48,400 $111,500
6 Reliability through Operational Efficiency: Reconductor COHO on W. Fairview Reconduct #6 Cu
with 1/0 Al and refuse for coordination. This project replaces the conductor of a heavily loaded
tap for increased capacity, fuse coordination and workability.
$68,100 $32,600
7 Reliability through Diversity: KOKANE / SOCKEYE / MOOSE Backbone Connection
Construct underground backbone from 5th St to 10th St and reconductor to backbone along 'S' St
to 15th and 'Q' Sts. This will increase the ability to shift load within the system.
$104,000 $226,000
8 Reliability through Increased Capacity: Glenwood Substation - Site Work Construct ground grid,
concrete foundations, control house, conduit systems and fend work for the new substation. This
project is part of a multi-year process to build a new substation in the Glenwood area for
increased reliability and capacity.
$37,000 $660,000
9 Upgrade to Current Standards: Bank Protection Upgrade
Install transformer protection for Bank #3 at Jasper substation. This project will replace power
transformer fuses with circuit switchers for better coordination and control.
$16,800 $80,500
10 Reliability through Proactive Maintenance: Replace GRANITE PCB Replace GRANITE feeder
breaker at Jasper substation, which will replace aging equipment as it nears end of life.
$6,500 $21,600
TOTALS $496,400 $1,556,300
SUBSTATION:
DISTRIBUTION:
Electric Division
Capital Improvements
Budget 2018
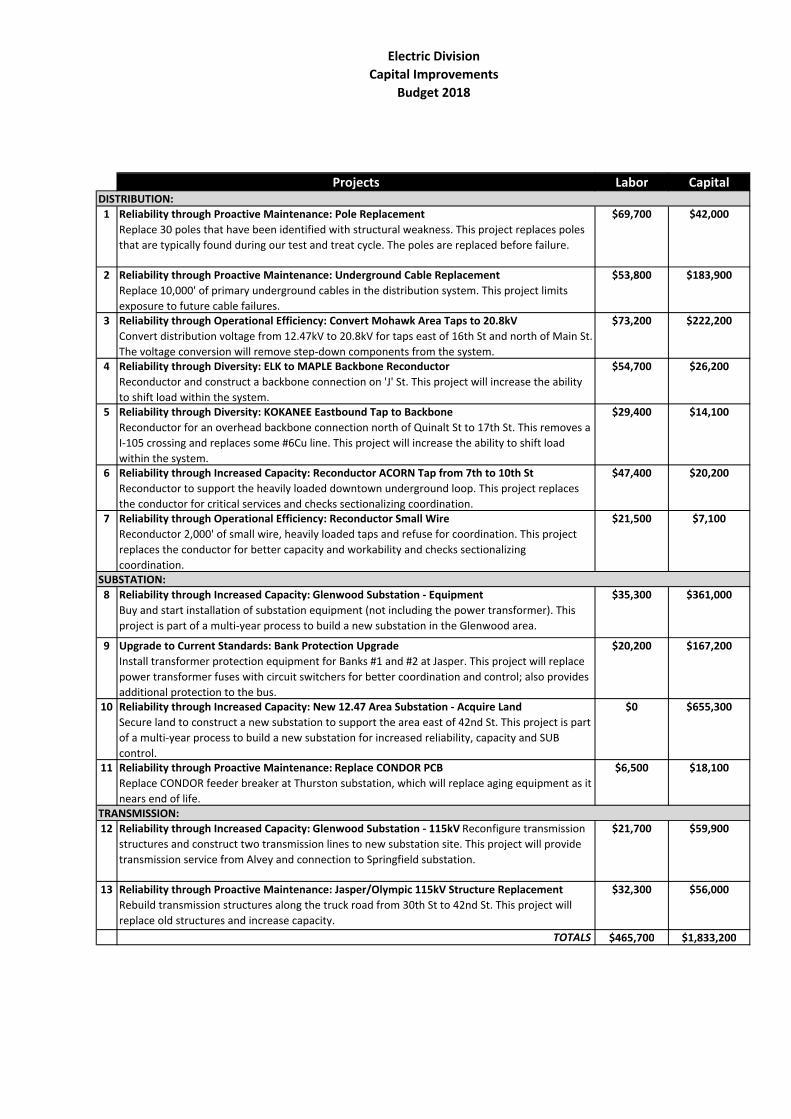
Projects Labor Capital
1 Reliability through Proactive Maintenance: Pole Replacement
Replace 30 poles that have been identified with structural weakness. This project replaces poles
that are typically found during our test and treat cycle. The poles are replaced before failure.
$69,700 $42,000
2 Reliability through Proactive Maintenance: Underground Cable Replacement
Replace 10,000' of primary underground cables in the distribution system. This project limits
exposure to future cable failures.
$53,800 $183,900
3 Reliability through Operational Efficiency: Convert Mohawk Area Taps to 20.8kV
Convert distribution voltage from 12.47kV to 20.8kV for taps east of 16th St and north of Main St.
The voltage conversion will remove step-down components from the system.
$73,200 $222,200
4 Reliability through Diversity: ELK to MAPLE Backbone Reconductor
Reconductor and construct a backbone connection on 'J' St. This project will increase the ability
to shift load within the system.
$54,700 $26,200
5 Reliability through Diversity: KOKANEE Eastbound Tap to Backbone
Reconductor for an overhead backbone connection north of Quinalt St to 17th St. This removes a
I-105 crossing and replaces some #6Cu line. This project will increase the ability to shift load
within the system.
$29,400 $14,100
6 Reliability through Increased Capacity: Reconductor ACORN Tap from 7th to 10th St
Reconductor to support the heavily loaded downtown underground loop. This project replaces
the conductor for critical services and checks sectionalizing coordination.
$47,400 $20,200
7 Reliability through Operational Efficiency: Reconductor Small Wire
Reconductor 2,000' of small wire, heavily loaded taps and refuse for coordination. This project
replaces the conductor for better capacity and workability and checks sectionalizing
coordination.
$21,500 $7,100
8 Reliability through Increased Capacity: Glenwood Substation - Equipment
Buy and start installation of substation equipment (not including the power transformer). This
project is part of a multi-year process to build a new substation in the Glenwood area.
$35,300 $361,000
9 Upgrade to Current Standards: Bank Protection Upgrade
Install transformer protection equipment for Banks #1 and #2 at Jasper. This project will replace
power transformer fuses with circuit switchers for better coordination and control; also provides
additional protection to the bus.
$20,200 $167,200
10 Reliability through Increased Capacity: New 12.47 Area Substation - Acquire Land
Secure land to construct a new substation to support the area east of 42nd St. This project is part
of a multi-year process to build a new substation for increased reliability, capacity and SUB
control.
$0 $655,300
11 Reliability through Proactive Maintenance: Replace CONDOR PCB
Replace CONDOR feeder breaker at Thurston substation, which will replace aging equipment as it
nears end of life.
$6,500 $18,100
12 Reliability through Increased Capacity: Glenwood Substation - 115kV Reconfigure transmission
structures and construct two transmission lines to new substation site. This project will provide
transmission service from Alvey and connection to Springfield substation.
$21,700 $59,900
13 Reliability through Proactive Maintenance: Jasper/Olympic 115kV Structure Replacement
Rebuild transmission structures along the truck road from 30th St to 42nd St. This project will
replace old structures and increase capacity.
$32,300 $56,000
TOTALS $465,700 $1,833,200
SUBSTATION:
TRANSMISSION:
DISTRIBUTION:

Electric Division
Capital Improvements
Budget 2019
Projects Labor Capital
1 Reliability through Proactive Maintenance: Pole Replacement
Replace 30 poles that have been identified with structural weakness. This project replaces poles
that are typically found during our test and treat cycle. The poles are replaced before failure.
$69,700 $42,000
2 Reliability through Proactive Maintenance: Underground Cable Replacement
Replace 10,000' of primary underground cables in the distribution system. This project limits
exposure to future cable failures.
$53,800 $183,900
3 Reliability through Diversity: BISON to MOOSE Backbone Connection
Construct a backbone connection and transfer about 1 MW of load on Olympic St, which will
increase the ability to shift load within the system.
$15,100 $33,400
4 Reliability through Operational Efficiency: Convert NUGGET to 20.8kV
Convert primary loop of distribution voltage along Nugget Way. The voltage conversion will
remove step-down components from the system. There will also be cable and transformer
replacements which will remove aging equipment.
$12,900 $167,300
5 Reliability through Increased Capacity: Glenwood Substation Distribution
Construct overhead and underground backbone connections from Glenwood substation site to
existing backbone.
$82,400 $212,000
6 Reliability through Increased Capacity: Reconductor LOCUST, 10th to 12th Reconductor
backbone from 10th Street to 12th St replacing 2/0 Cu conductor. This project will increase the
conductor size for transferring load during system switching.
$26,700 $12,800
7 Reliability through Operational Efficiency: Reconductor Small Wire
Reconductor 2,000' of small wire, heavily loaded taps and refuse for coordination. This project
replaces the conductor for better capacity and workability and checks sectionalizing
coordination.
$21,500 $7,100
8 Reliability through Diversity: Add PANTHER PCB
Add a distribution breaker at the Gateway substation to feed new PANTHER circuit. This project
will add a feeder position, allowing for more options to shift load within the system.
$9,000 $26,500
9 Reliability through Increased Capacity: Glenwood Substation-Equipment Continue installation
of substation equipment. Buy and install the power transformer. This project is part of a multi-
year process to build a new substation in the Glenwood area.
$35,300 $601,000
10 Upgrade to Current Standards: Bank Protection Upgrade
Finish installing transformer protection equipment for Jasper Bank #1 and #2. This project will
replace power transformer fuses with circuit switchers for better coordination and control.
$25,800 $41,000
11 Reliability through Proactive Maintenance: Circuit Switcher Replacement
Replace the circuit switcher for Bank #2 at Mt. Vernon substation. Replace aging equipment as it
nears end of life.
$6,500 $49,500
12 Reliability through Increased Capacity: Olympic to E Springfield 115kV This project is section
#1 of 4 and is a placeholder for bringing transmission to new substation. This project is part of a
multi-year process to build a new substation in the area east of 42nd St for increased reliability,
capacity and SUB control.
$70,500 $120,900
TOTALS $429,200 $1,497,400
SUBSTATION:
TRANSMISSION:
DISTRIBUTION:
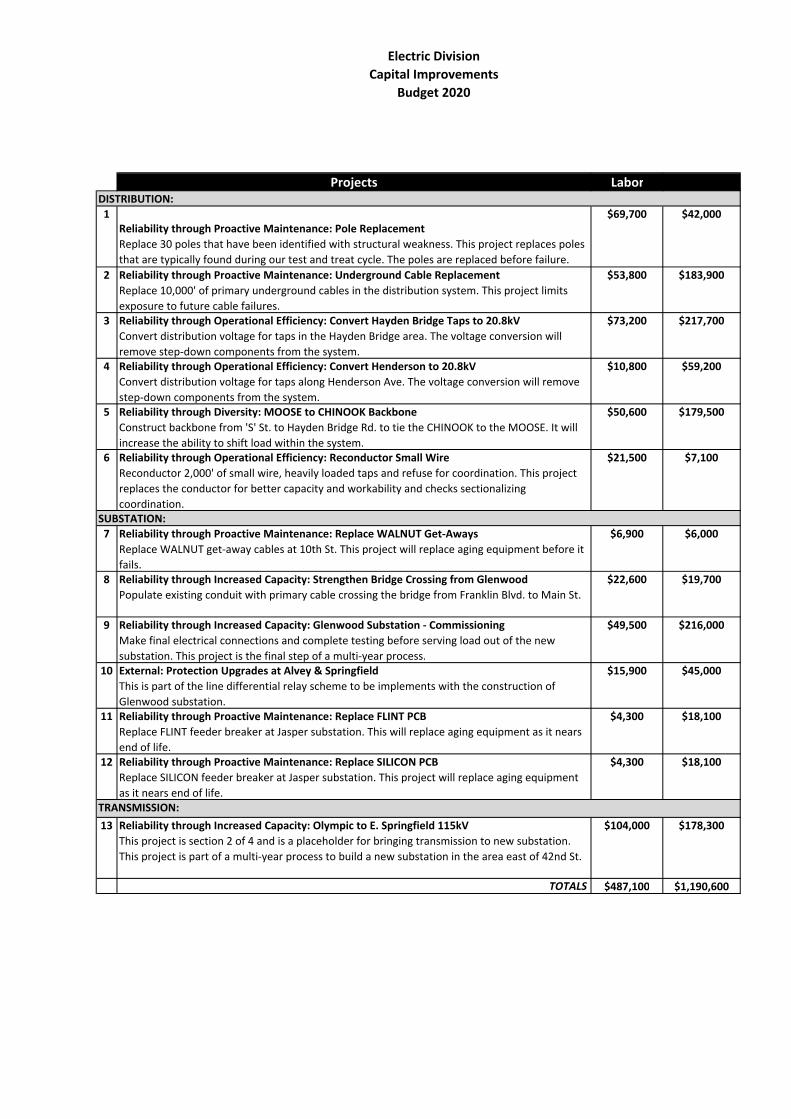
Electric Division
Capital Improvements
Budget 2020
Projects Labor Capital
1
Reliability through Proactive Maintenance: Pole Replacement
Replace 30 poles that have been identified with structural weakness. This project replaces poles
that are typically found during our test and treat cycle. The poles are replaced before failure.
$69,700 $42,000
2 Reliability through Proactive Maintenance: Underground Cable Replacement
Replace 10,000' of primary underground cables in the distribution system. This project limits
exposure to future cable failures.
$53,800 $183,900
3 Reliability through Operational Efficiency: Convert Hayden Bridge Taps to 20.8kV
Convert distribution voltage for taps in the Hayden Bridge area. The voltage conversion will
remove step-down components from the system.
$73,200 $217,700
4 Reliability through Operational Efficiency: Convert Henderson to 20.8kV
Convert distribution voltage for taps along Henderson Ave. The voltage conversion will remove
step-down components from the system.
$10,800 $59,200
5 Reliability through Diversity: MOOSE to CHINOOK Backbone
Construct backbone from 'S' St. to Hayden Bridge Rd. to tie the CHINOOK to the MOOSE. It will
increase the ability to shift load within the system.
$50,600 $179,500
6 Reliability through Operational Efficiency: Reconductor Small Wire
Reconductor 2,000' of small wire, heavily loaded taps and refuse for coordination. This project
replaces the conductor for better capacity and workability and checks sectionalizing
coordination.
$21,500 $7,100
7 Reliability through Proactive Maintenance: Replace WALNUT Get-Aways
Replace WALNUT get-away cables at 10th St. This project will replace aging equipment before it
fails.
$6,900 $6,000
8 Reliability through Increased Capacity: Strengthen Bridge Crossing from Glenwood
Populate existing conduit with primary cable crossing the bridge from Franklin Blvd. to Main St.
$22,600 $19,700
9 Reliability through Increased Capacity: Glenwood Substation - Commissioning
Make final electrical connections and complete testing before serving load out of the new
substation. This project is the final step of a multi-year process.
$49,500 $216,000
10 External: Protection Upgrades at Alvey & Springfield
This is part of the line differential relay scheme to be implements with the construction of
Glenwood substation.
$15,900 $45,000
11 Reliability through Proactive Maintenance: Replace FLINT PCB
Replace FLINT feeder breaker at Jasper substation. This will replace aging equipment as it nears
end of life.
$4,300 $18,100
12 Reliability through Proactive Maintenance: Replace SILICON PCB
Replace SILICON feeder breaker at Jasper substation. This project will replace aging equipment
as it nears end of life.
$4,300 $18,100
13 Reliability through Increased Capacity: Olympic to E. Springfield 115kV
This project is section 2 of 4 and is a placeholder for bringing transmission to new substation.
This project is part of a multi-year process to build a new substation in the area east of 42nd St.
$104,000 $178,300
TOTALS $487,100 $1,190,600
SUBSTATION:
TRANSMISSION:
DISTRIBUTION:
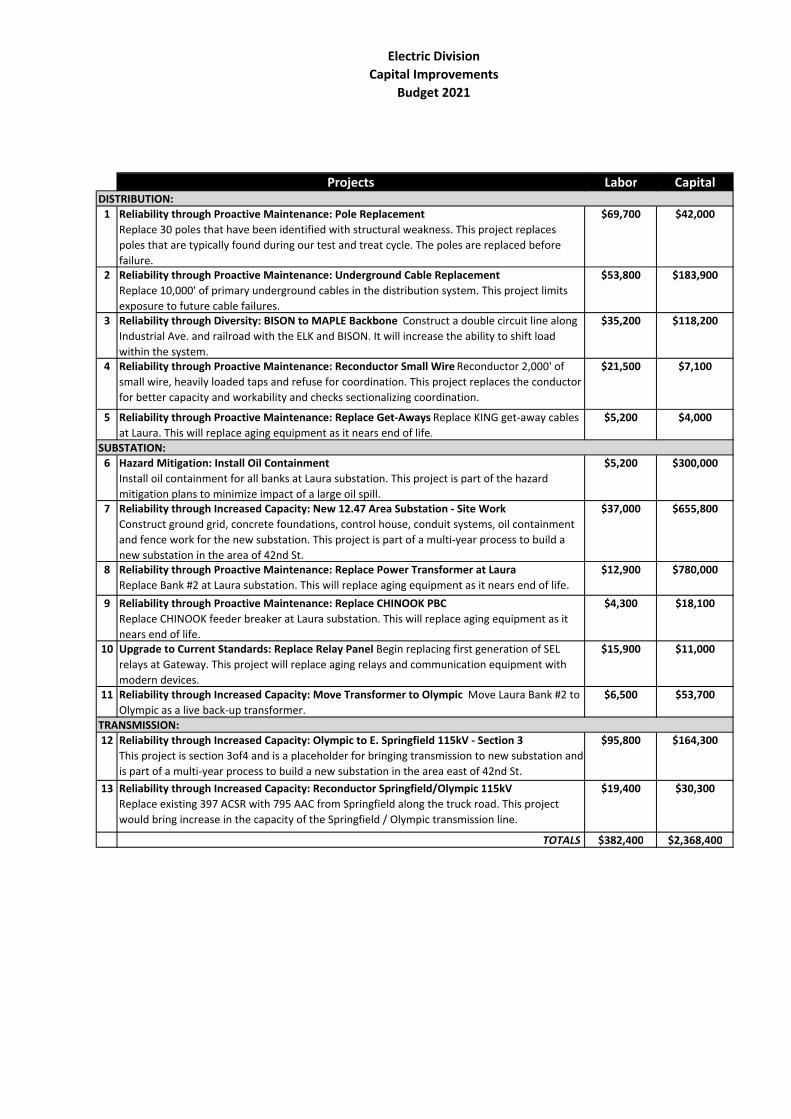
Electric Division
Capital Improvements
Budget 2021
Projects Labor Capital
1 Reliability through Proactive Maintenance: Pole Replacement
Replace 30 poles that have been identified with structural weakness. This project replaces
poles that are typically found during our test and treat cycle. The poles are replaced before
failure.
$69,700 $42,000
2 Reliability through Proactive Maintenance: Underground Cable Replacement
Replace 10,000' of primary underground cables in the distribution system. This project limits
exposure to future cable failures.
$53,800 $183,900
3 Reliability through Diversity: BISON to MAPLE Backbone Construct a double circuit line along
Industrial Ave. and railroad with the ELK and BISON. It will increase the ability to shift load
within the system.
$35,200 $118,200
4 Reliability through Proactive Maintenance: Reconductor Small Wire Reconductor 2,000' of
small wire, heavily loaded taps and refuse for coordination. This project replaces the conductor
for better capacity and workability and checks sectionalizing coordination.
$21,500 $7,100
5 Reliability through Proactive Maintenance: Replace Get-Aways Replace KING get-away cables
at Laura. This will replace aging equipment as it nears end of life.
$5,200 $4,000
6 Hazard Mitigation: Install Oil Containment
Install oil containment for all banks at Laura substation. This project is part of the hazard
mitigation plans to minimize impact of a large oil spill.
$5,200 $300,000
7 Reliability through Increased Capacity: New 12.47 Area Substation - Site Work
Construct ground grid, concrete foundations, control house, conduit systems, oil containment
and fence work for the new substation. This project is part of a multi-year process to build a
new substation in the area of 42nd St.
$37,000 $655,800
8 Reliability through Proactive Maintenance: Replace Power Transformer at Laura
Replace Bank #2 at Laura substation. This will replace aging equipment as it nears end of life.
$12,900 $780,000
9 Reliability through Proactive Maintenance: Replace CHINOOK PBC
Replace CHINOOK feeder breaker at Laura substation. This will replace aging equipment as it
nears end of life.
$4,300 $18,100
10 Upgrade to Current Standards: Replace Relay Panel Begin replacing first generation of SEL
relays at Gateway. This project will replace aging relays and communication equipment with
modern devices.
$15,900 $11,000
11 Reliability through Increased Capacity: Move Transformer to Olympic Move Laura Bank #2 to
Olympic as a live back-up transformer.
$6,500 $53,700
12 Reliability through Increased Capacity: Olympic to E. Springfield 115kV - Section 3
This project is section 3of4 and is a placeholder for bringing transmission to new substation and
is part of a multi-year process to build a new substation in the area east of 42nd St.
$95,800 $164,300
13 Reliability through Increased Capacity: Reconductor Springfield/Olympic 115kV
Replace existing 397 ACSR with 795 AAC from Springfield along the truck road. This project
would bring increase in the capacity of the Springfield / Olympic transmission line.
$19,400 $30,300
TOTALS $382,400 $2,368,400
TRANSMISSION:
SUBSTATION:
DISTRIBUTION:
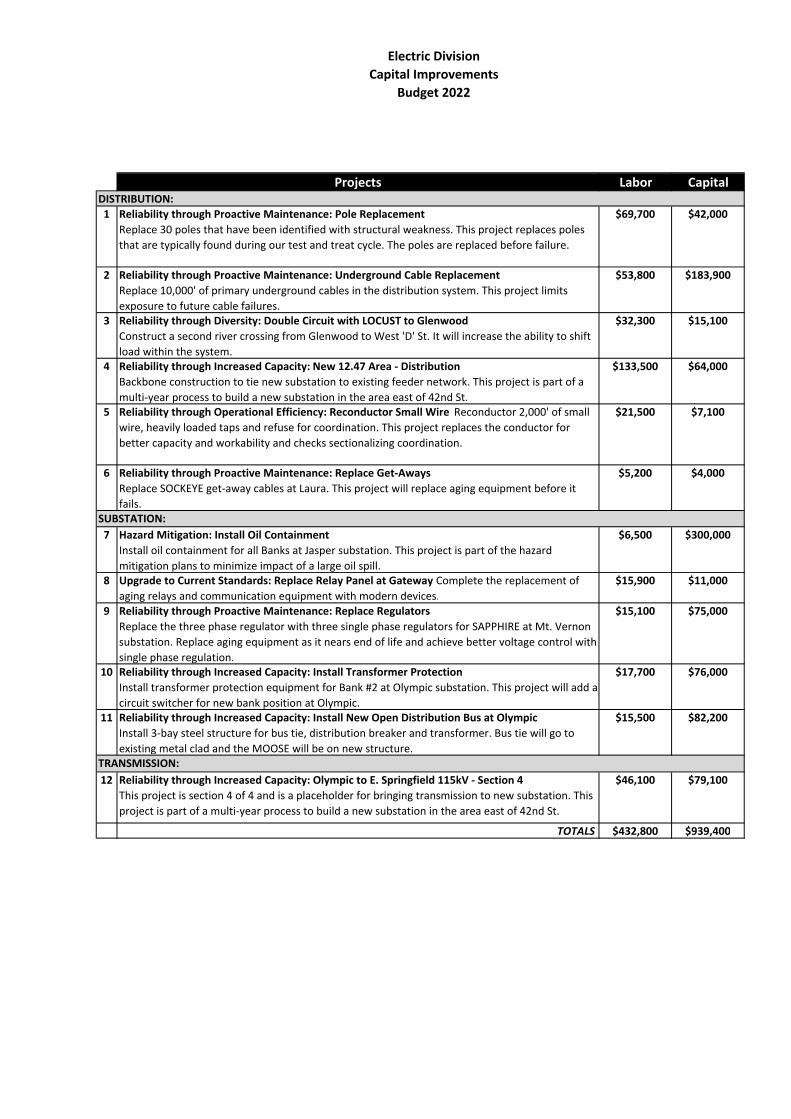
Electric Division
Capital Improvements
Budget 2022
Projects Labor Capital
1 Reliability through Proactive Maintenance: Pole Replacement
Replace 30 poles that have been identified with structural weakness. This project replaces poles
that are typically found during our test and treat cycle. The poles are replaced before failure.
$69,700 $42,000
2 Reliability through Proactive Maintenance: Underground Cable Replacement
Replace 10,000' of primary underground cables in the distribution system. This project limits
exposure to future cable failures.
$53,800 $183,900
3 Reliability through Diversity: Double Circuit with LOCUST to Glenwood
Construct a second river crossing from Glenwood to West 'D' St. It will increase the ability to shift
load within the system.
$32,300 $15,100
4 Reliability through Increased Capacity: New 12.47 Area - Distribution
Backbone construction to tie new substation to existing feeder network. This project is part of a
multi-year process to build a new substation in the area east of 42nd St.
$133,500 $64,000
5 Reliability through Operational Efficiency: Reconductor Small Wire Reconductor 2,000' of small
wire, heavily loaded taps and refuse for coordination. This project replaces the conductor for
better capacity and workability and checks sectionalizing coordination.
$21,500 $7,100
6 Reliability through Proactive Maintenance: Replace Get-Aways
Replace SOCKEYE get-away cables at Laura. This project will replace aging equipment before it
fails.
$5,200 $4,000
7 Hazard Mitigation: Install Oil Containment
Install oil containment for all Banks at Jasper substation. This project is part of the hazard
mitigation plans to minimize impact of a large oil spill.
$6,500 $300,000
8 Upgrade to Current Standards: Replace Relay Panel at Gateway Complete the replacement of
aging relays and communication equipment with modern devices.
$15,900 $11,000
9 Reliability through Proactive Maintenance: Replace Regulators
Replace the three phase regulator with three single phase regulators for SAPPHIRE at Mt. Vernon
substation. Replace aging equipment as it nears end of life and achieve better voltage control with
single phase regulation.
$15,100 $75,000
10 Reliability through Increased Capacity: Install Transformer Protection
Install transformer protection equipment for Bank #2 at Olympic substation. This project will add a
circuit switcher for new bank position at Olympic.
$17,700 $76,000
11 Reliability through Increased Capacity: Install New Open Distribution Bus at Olympic
Install 3-bay steel structure for bus tie, distribution breaker and transformer. Bus tie will go to
existing metal clad and the MOOSE will be on new structure.
$15,500 $82,200
12 Reliability through Increased Capacity: Olympic to E. Springfield 115kV - Section 4
This project is section 4 of 4 and is a placeholder for bringing transmission to new substation. This
project is part of a multi-year process to build a new substation in the area east of 42nd St.
$46,100 $79,100
TOTALS $432,800 $939,400
SUBSTATION:
TRANSMISSION:
DISTRIBUTION:
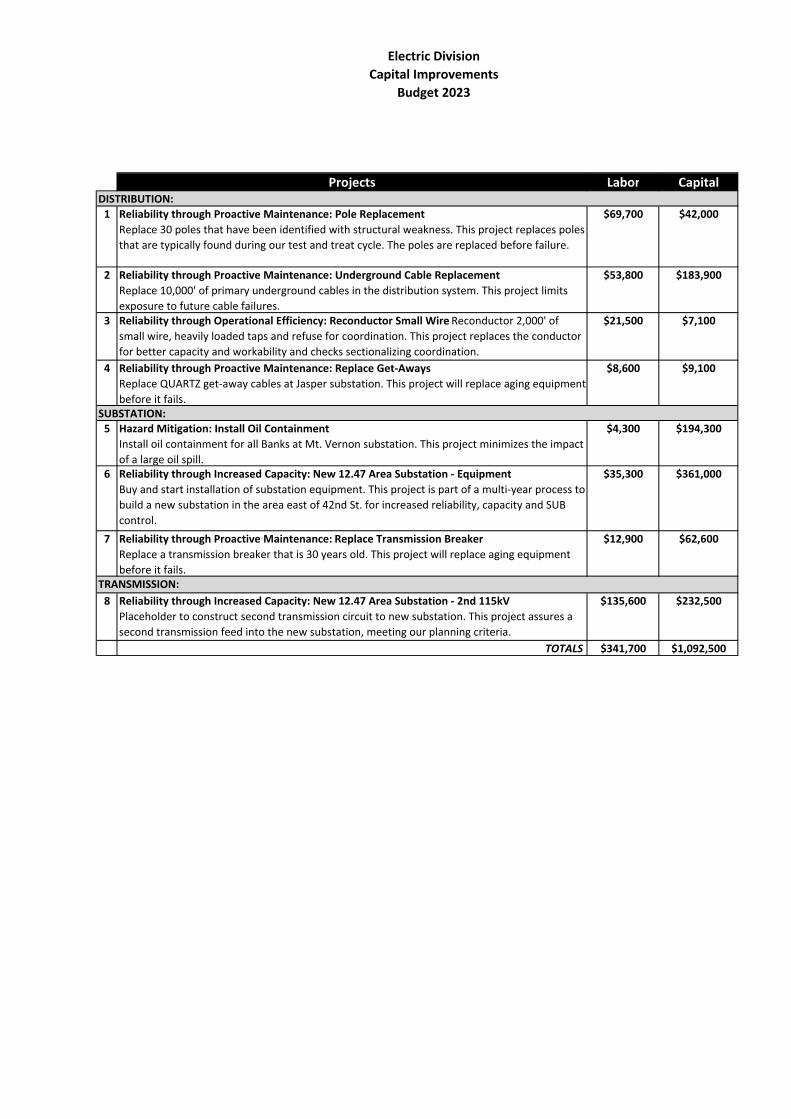
Electric Division
Capital Improvements
Budget 2023
Projects Labor Capital
1 Reliability through Proactive Maintenance: Pole Replacement
Replace 30 poles that have been identified with structural weakness. This project replaces poles
that are typically found during our test and treat cycle. The poles are replaced before failure.
$69,700 $42,000
2 Reliability through Proactive Maintenance: Underground Cable Replacement
Replace 10,000' of primary underground cables in the distribution system. This project limits
exposure to future cable failures.
$53,800 $183,900
3 Reliability through Operational Efficiency: Reconductor Small Wire Reconductor 2,000' of
small wire, heavily loaded taps and refuse for coordination. This project replaces the conductor
for better capacity and workability and checks sectionalizing coordination.
$21,500 $7,100
4 Reliability through Proactive Maintenance: Replace Get-Aways
Replace QUARTZ get-away cables at Jasper substation. This project will replace aging equipment
before it fails.
$8,600 $9,100
5 Hazard Mitigation: Install Oil Containment
Install oil containment for all Banks at Mt. Vernon substation. This project minimizes the impact
of a large oil spill.
$4,300 $194,300
6 Reliability through Increased Capacity: New 12.47 Area Substation - Equipment
Buy and start installation of substation equipment. This project is part of a multi-year process to
build a new substation in the area east of 42nd St. for increased reliability, capacity and SUB
control.
$35,300 $361,000
7 Reliability through Proactive Maintenance: Replace Transmission Breaker
Replace a transmission breaker that is 30 years old. This project will replace aging equipment
before it fails.
$12,900 $62,600
8 Reliability through Increased Capacity: New 12.47 Area Substation - 2nd 115kV
Placeholder to construct second transmission circuit to new substation. This project assures a
second transmission feed into the new substation, meeting our planning criteria.
$135,600 $232,500
TOTALS $341,700 $1,092,500
SUBSTATION:
TRANSMISSION:
DISTRIBUTION:
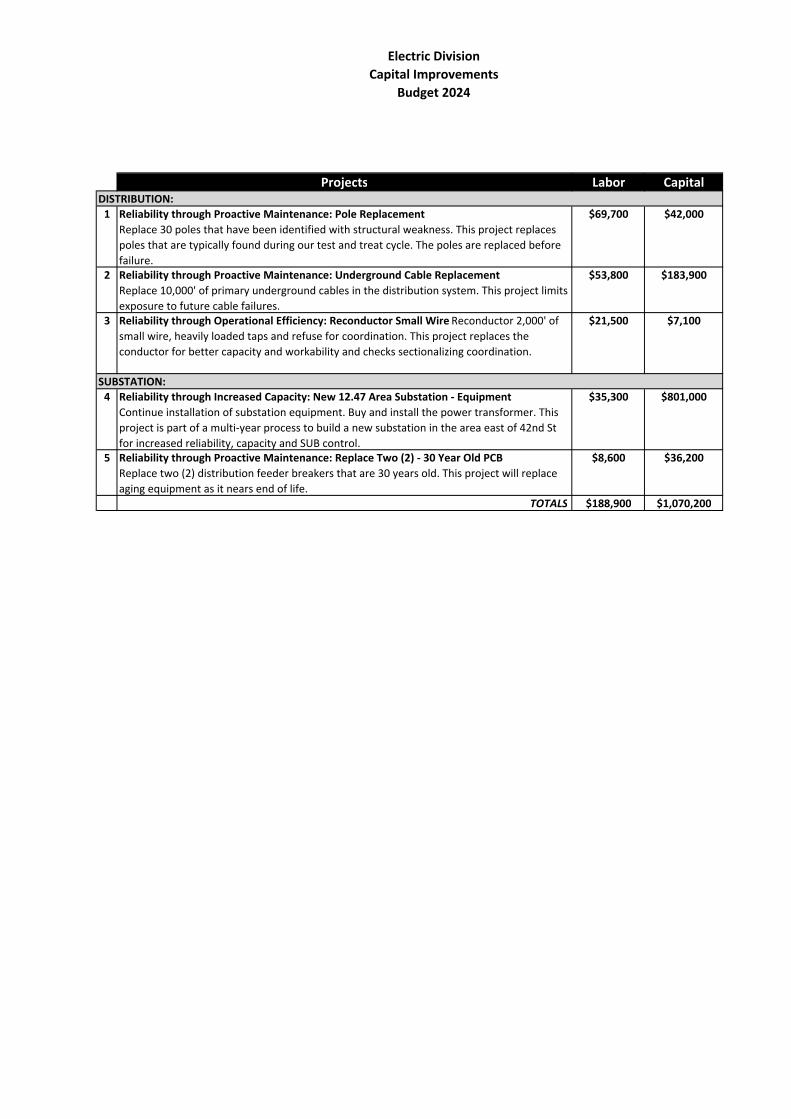
Electric Division
Capital Improvements
Budget 2024
Projects Labor Capital
1 Reliability through Proactive Maintenance: Pole Replacement
Replace 30 poles that have been identified with structural weakness. This project replaces
poles that are typically found during our test and treat cycle. The poles are replaced before
failure.
$69,700 $42,000
2 Reliability through Proactive Maintenance: Underground Cable Replacement
Replace 10,000' of primary underground cables in the distribution system. This project limits
exposure to future cable failures.
$53,800 $183,900
3 Reliability through Operational Efficiency: Reconductor Small Wire Reconductor 2,000' of
small wire, heavily loaded taps and refuse for coordination. This project replaces the
conductor for better capacity and workability and checks sectionalizing coordination.
$21,500 $7,100
4 Reliability through Increased Capacity: New 12.47 Area Substation - Equipment
Continue installation of substation equipment. Buy and install the power transformer. This
project is part of a multi-year process to build a new substation in the area east of 42nd St
for increased reliability, capacity and SUB control.
$35,300 $801,000
5 Reliability through Proactive Maintenance: Replace Two (2) - 30 Year Old PCB
Replace two (2) distribution feeder breakers that are 30 years old. This project will replace
aging equipment as it nears end of life.
$8,600 $36,200
TOTALS $188,900 $1,070,200
SUBSTATION:
DISTRIBUTION:
1
M E M O R A N D U M
EUGENE WATER & ELECTRIC BOARD
TO: Commissioners Brown, Mital, Helgeson, Manning and Simpson
FROM: Cathy Bloom, Finance Manager; Sue Fahey, Fiscal Services Supervisor; Harvey Hall, Deborah Hart & Edward Yan, Senior Financial Analysts DATE: July 15, 2014
SUBJECT: Long-Term Financial Plan Update and 2015 Budget Assumptions
OBJECTIVE: Direction on 2015 Budget Assumptions Issue Board Policy SD6 requires that staff prepare balanced budgets for the Electric and Water Utilities on an annual basis and that the Board approves those budgets by the end of the calendar year. Each summer the Board provides direction to staff on the assumptions used to develop the following year’s budget. Background In recent years both the Electric and Water Utilities have experienced financial challenges, albeit very different ones. Water consumption did not rebound as quickly as anticipated after the recession resulting in lower than projected revenues to support the high fixed cost nature of the business. Water Utility reserve levels and working cash were extremely low which was compounded by aging infrastructure replacement needs. While Electric loads remained comparatively stable, wholesale power prices plummeted. Power sales revenue budgets which had been used to support operations declined over $40 million in the last five years as a result of that wholesale price reduction and less resources available from the Bonneville Power Administration. Accordingly, the Electric Utility struggled to balance budgets and meet Board targets for debt service coverage. In June 2013, faced with the potential of over $20 million in 2014 operations and maintenance (O&M) budget reductions to meet Board financial targets, the Board approved financial policies that align with an “A” bond rating for the Electric Utility versus the prior ones that aligned with a “AA” bond rating. Shortly after that, the Electric Utility’s bond rating was reduced to “A” by rating agencies. In developing the 2013 and 2014 budgets, EWEB reduced over 70 positions and $7.7 million O&M dollars to increase the financial stability of both Utilities. In addition, capital budgets were reduced or deferred by $60 million and $20 million in 2013 and 2014, respectively. These reductions were made using a priority-based budgeting approach aligned with EWEB’s overarching strategy “To Deliver Value for Generations.” Discussion Over the last several months, management and staff have considered the Board’s feedback from strategic planning meetings to develop the long term financial plans (LTFP) and budget assumptions. The Strategic Plan approved by the Board included three cornerstone concepts to prepare EWEB for
2
the future: Be Flexible and Resilient, Enhance Customer Value, and Focus on People – both Customers and Employees. The plan also discusses trade-offs that are often required in order to achieve EWEB’s core mission to enhance our community’s vitality by providing water and electric services consistent with the values of our customer-owners. In assessing those trade-offs, Commissioners indicated that the Electric Utility should improve average bill competitiveness and in order to accomplish that, a slight reduction in Electric reliability would be acceptable given EWEB’s current extremely high reliability. The Water Utility primary trade off was to reduce risk by securing an alternative water source (AWS) and also reducing the average bill competitiveness given the fact that EWEB’s average residential water bill is in the bottom quartile of its comparators. Additional information on bill competitiveness will be provided at the meeting. Management believes that the assumptions used to develop the LTFP address those trade-offs. Overarching Forecast Assumptions The assumptions used in creating forecasts and budgets greatly influence the results. The following assumptions have been used in developing the current forecasts and are anticipated to be used in creating the 2015 budget. Both Utilities
2.5% non-labor CPI increase as per the US Bureau Labor and Statistics, Portland/Salem 10 year average
Labor/Benefits increases: o 2.4% salary escalation based on an average of the Portland/Salem CPI for All Urban
Consumers (CPI-U) and Wages (CPI-W) o PERS increase – 3 percentage points on July 1, 2015, 5 percentage points on July 1,
2017; 3 percentage points on July 1, 2019, 2021, and 2023 $45 million payment to reduce PERS unfunded actuarial liability in 2017
which results in projected total O&M savings of over $2.5 million starting in 2018
o Health insurance increase – 15% in 2015, 10% in subsequent years o Priority Based Budgeting Related O&M Net Change – Electric: $1.5 million increase;
Water: $500,000 increase Major items include:
Information technology major project assistance - $800,000 Harvest Wind warranty extension - $300,000 Regulatory Increases (NERC/Oregon Department of Energy) -
$125,000 System upgrades (Interagency radio system/Customer texting services
for outage management) - $150,000 o Net 3.0 FTE increase
Additions include Electric Distribution Tech, Water Meter Mechanic, Security Systems Coordinator, Work Asset Management Coordinator and Customer Service Specialists
Most positions were funded through reorganizations or other budget reductions
Rate changes effective February
3
Electric
Retail load approximately the same as 2014 budget – 2.5 million mWh 90% generation $36 melded mid-market price curve increasing to $58 in 2024 Use of reserves to pay off Harvest Wind note in 2015 Partial year Carmen-Smith generation outages in 2017 and 2023 Reduction in capital expenses from “business as usual” BPA rate increases of 6% in October of odd-numbered years which represents approximately
a 2.5% rate impact to EWEB customers. o BPA rate increases are assumed to be incorporated into February rate proposals
Bond issuances of $15 million and $53.5 million in 2017 and 2022, respectively Water
Consumption: 7.7 million kgals; 300,000 kgals higher than 2014 due to unrealized assumed sensitivity to prior rate changes
AWS major work begins in 2018 Bond issuances of $19 million in 2016; $58 million in 2018; and $21 million in 2021
Long-term Financial Plan Rate Assumptions and Outcomes Electric For the Electric Utility, both 1.5% and 0% February 2015 rate change scenarios are presented along with the resulting projected financial metrics and change in reserves.
Scenario 1 includes selective strategic capital work which is approximately 25% less than “business as usual” and assumes a 1.5% overall average rate change in 2015 and 2.5% to 5% rate increases in the out years of the LTFP.
Scenario 2 also assumes a 2015 1.5% overall average rate increase and the same expense assumptions as Scenario 1. Rate increases in the out years; however, have been reduced in order to make progress towards bringing EWEB’s average bill closer to the middle of our comparator utilities and range from 2.25% to 3.5%. Based on LTFP assumptions, in order to maintain the Board target for debt service coverage, approximately $2 million of reductions would need to occur by 2017.
Scenario 3 focuses on minimizing rate increases in the short term and further reduces capital work over the LTFP by $35 million and assumes a 0% rate increase in 2015, 1.5% rate increases in 2016-2018 with rate increases in the out years ranging from 3% to 6.5%. In order to meet board metrics, $14 million of O&M reductions would be required by 2018. The Electric LTFP outcomes are included in Attachment 1.
Water Water Utility scenarios include a 6.3% and a 5.2% February 2015 rate increase. Scenario 1 assumes a 6.3% overall average rate increase in 2015 and includes the financial impact of AWS construction beginning in 2018 with completion in 2020. Scenario 2 assumes a 5.2% 2015 overall average rate increase with the financial impact of AWS construction spread over 4 years beginning in 2018 with completion in 2021. Both options maintain Board targets for financial metrics for the length of the financial plan. The Water LTFP outcomes are included in Attachment 2.
4
Recommendation Management recommends that the Board direct staff to prepare the 2015 budget using the assumptions set forth in this document, a 1.5% February 2015 overall average Electric rate increase and the Selective Strategic Capital Plan which is approximately a 25% reduction from “business as usual”. For the Water Utility, management recommends that the Board direct staff to use a 5.2% February 2015 overall average Water rate increase. Requested Board Action Staff is not requesting Board action at the July 22nd meeting; however, staff is requesting that the Board provide clear direction on the assumptions to be used in developing the 2015 budget. Attachment 1 – Summary of Electric LTFP Rate Assumptions and Outcomes Attachment 2 – Summary of Water LTFP Rate Assumptions and Outcomes
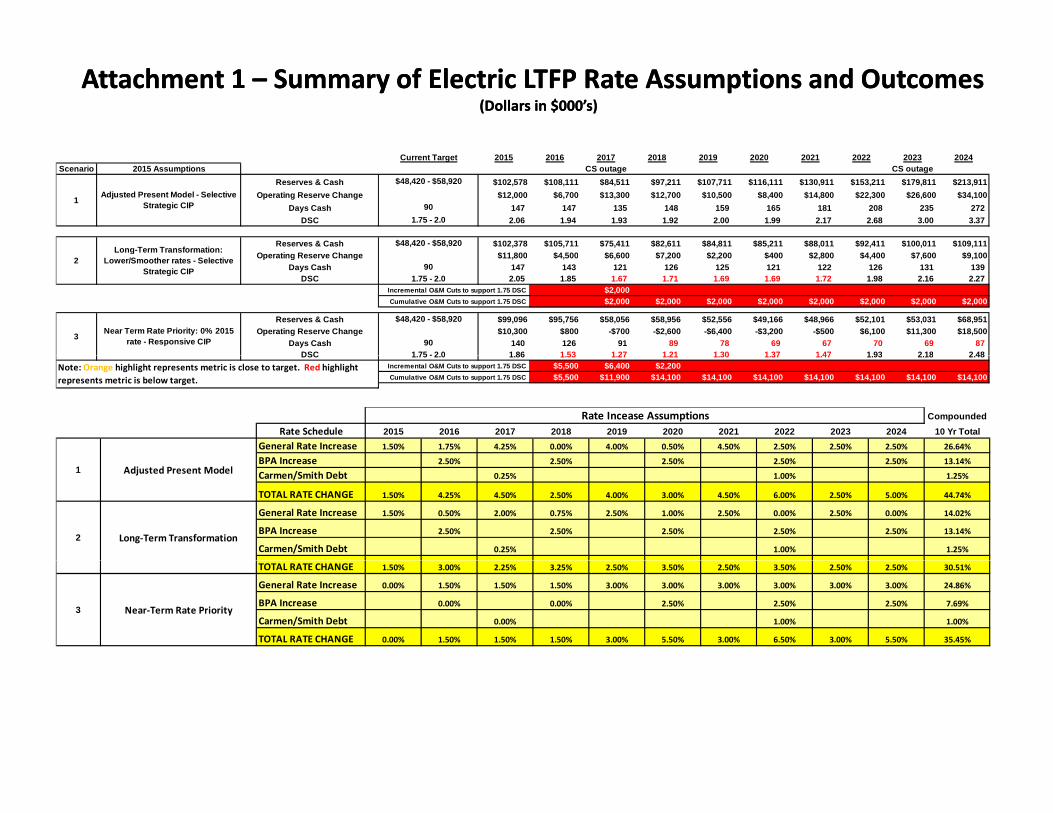
Attachment 1 Attachment 1 –– Summary of Electric LTFP Rate Assumptions and Summary of Electric LTFP Rate Assumptions and OutcomesOutcomes(Dollars in $000’s)(Dollars in $000’s)
Current Target 2015 2016 2017 2018 2019 2020 2021 2022 2023 2024Scenario 2015 Assumptions CS outage CS outage
Reserves & Cash $48,420 - $58,920 $102,578 $108,111 $84,511 $97,211 $107,711 $116,111 $130,911 $153,211 $179,811 $213,911Operating Reserve Change $12,000 $6,700 $13,300 $12,700 $10,500 $8,400 $14,800 $22,300 $26,600 $34,100
Days Cash 90 147 147 135 148 159 165 181 208 235 272 DSC 1.75 - 2.0 2.06 1.94 1.93 1.92 2.00 1.99 2.17 2.68 3.00 3.37
Reserves & Cash $48,420 - $58,920 $102,378 $105,711 $75,411 $82,611 $84,811 $85,211 $88,011 $92,411 $100,011 $109,111O ti R Ch $11 800 $4 500 $6 600 $7 200 $2 200 $400 $2 800 $4 400 $7 600 $9 100
1 Adjusted Present Model - Selective Strategic CIP
Long-Term Transformation: Operating Reserve Change $11,800 $4,500 $6,600 $7,200 $2,200 $400 $2,800 $4,400 $7,600 $9,100Days Cash 90 147 143 121 126 125 121 122 126 131 139
DSC 1.75 - 2.0 2.05 1.85 1.67 1.71 1.69 1.69 1.72 1.98 2.16 2.27 Incremental O&M Cuts to support 1.75 DSC $2,000Cumulative O&M Cuts to support 1.75 DSC $2,000 $2,000 $2,000 $2,000 $2,000 $2,000 $2,000 $2,000
Reserves & Cash $48,420 - $58,920 $99,096 $95,756 $58,056 $58,956 $52,556 $49,166 $48,966 $52,101 $53,031 $68,951Operating Reserve Change $10,300 $800 -$700 -$2,600 -$6,400 -$3,200 -$500 $6,100 $11,300 $18,500
Days Cash 90 140 126 91 89 78 69 67 70 69 87 DSC 1 75 - 2 0 1 86 1 53 1 27 1 21 1 30 1 37 1 47 1 93 2 18 2 48
3 Near Term Rate Priority: 0% 2015 rate - Responsive CIP
2g
Lower/Smoother rates - Selective Strategic CIP
DSC 1.75 - 2.0 1.86 1.53 1.27 1.21 1.30 1.37 1.47 1.93 2.18 2.48 Incremental O&M Cuts to support 1.75 DSC $5,500 $6,400 $2,200Cumulative O&M Cuts to support 1.75 DSC $5,500 $11,900 $14,100 $14,100 $14,100 $14,100 $14,100 $14,100 $14,100
Note: Orange highlight represents metric is close to target. Red highlight represents metric is below target.
CompoundedRate Schedule 2015 2016 2017 2018 2019 2020 2021 2022 2023 2024 10 Yr Total
General Rate Increase 1.50% 1.75% 4.25% 0.00% 4.00% 0.50% 4.50% 2.50% 2.50% 2.50% 26.64%
BPA I
Rate Incease Assumptions
BPA Increase 2.50% 2.50% 2.50% 2.50% 2.50% 13.14%
Carmen/Smith Debt 0.25% 1.00% 1.25%
TOTAL RATE CHANGE 1.50% 4.25% 4.50% 2.50% 4.00% 3.00% 4.50% 6.00% 2.50% 5.00% 44.74%
General Rate Increase 1.50% 0.50% 2.00% 0.75% 2.50% 1.00% 2.50% 0.00% 2.50% 0.00% 14.02%
BPA Increase 2.50% 2.50% 2.50% 2.50% 2.50% 13.14%
Carmen/Smith Debt 0.25% 1.00% 1.25%
Adjusted Present Model
Long‐Term Transformation
1
2
TOTAL RATE CHANGE 1.50% 3.00% 2.25% 3.25% 2.50% 3.50% 2.50% 3.50% 2.50% 2.50% 30.51%
General Rate Increase 0.00% 1.50% 1.50% 1.50% 3.00% 3.00% 3.00% 3.00% 3.00% 3.00% 24.86%
BPA Increase 0.00% 0.00% 2.50% 2.50% 2.50% 7.69%
Carmen/Smith Debt 0.00% 1.00% 1.00%
TOTAL RATE CHANGE 0.00% 1.50% 1.50% 1.50% 3.00% 5.50% 3.00% 6.50% 3.00% 5.50% 35.45%
Near‐Term Rate Priority3
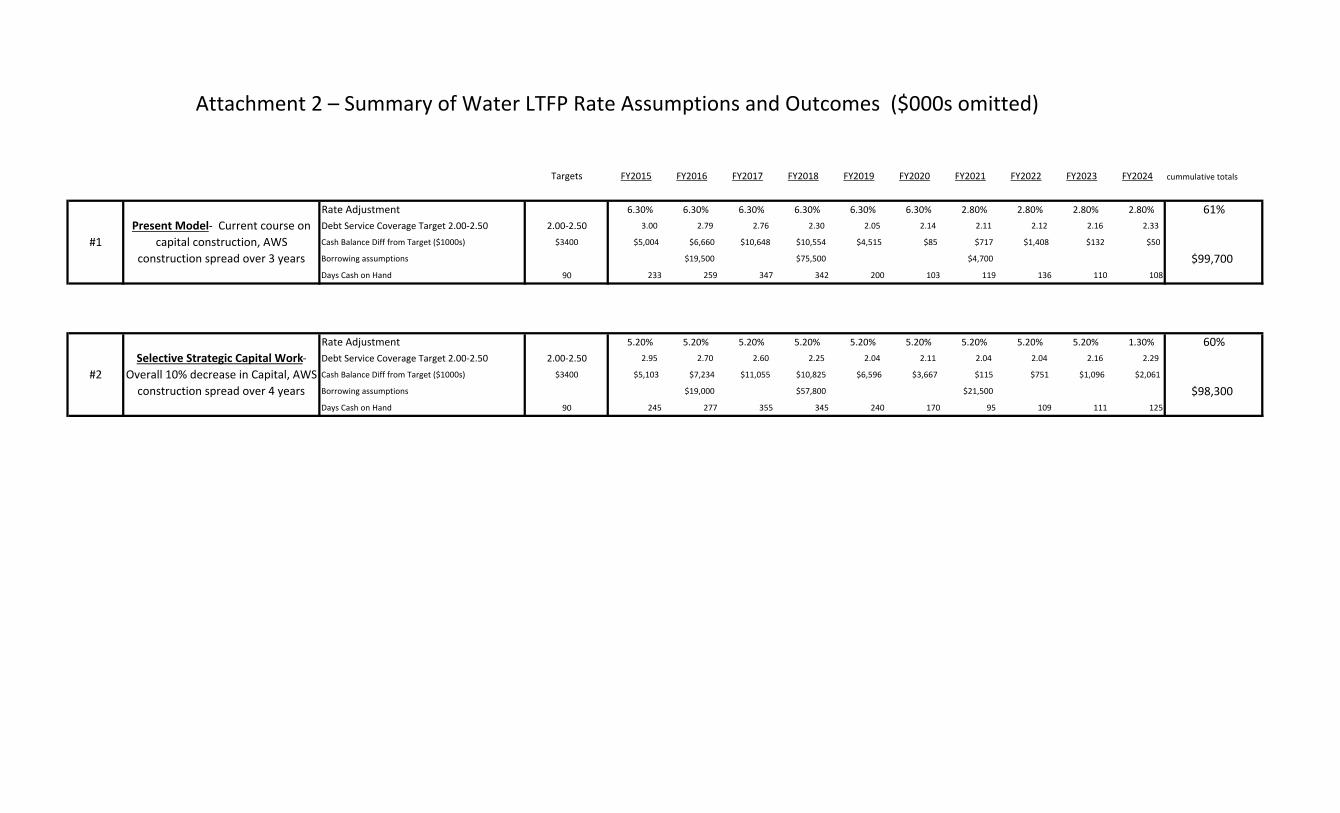
Targets FY2015 FY2016 FY2017 FY2018 FY2019 FY2020 FY2021 FY2022 FY2023 FY2024 cummulative totals
Rate Adjustment 6.30% 6.30% 6.30% 6.30% 6.30% 6.30% 2.80% 2.80% 2.80% 2.80% 61%Debt Service Coverage Target 2.00‐2.50 2.00‐2.50 3.00 2.79 2.76 2.30 2.05 2.14 2.11 2.12 2.16 2.33
Cash Balance Diff from Target ($1000s) $3400 $5,004 $6,660 $10,648 $10,554 $4,515 $85 $717 $1,408 $132 $50
Borrowing assumptions $19,500 $75,500 $4,700 $99,700Days Cash on Hand 90 233 259 347 342 200 103 119 136 110 108
Rate Adjustment 5.20% 5.20% 5.20% 5.20% 5.20% 5.20% 5.20% 5.20% 5.20% 1.30% 60%Debt Service Coverage Target 2.00‐2.50 2.00‐2.50 2.95 2.70 2.60 2.25 2.04 2.11 2.04 2.04 2.16 2.29
Cash Balance Diff from Target ($1000s) $3400 $5,103 $7,234 $11,055 $10,825 $6,596 $3,667 $115 $751 $1,096 $2,061
Borrowing assumptions $19,000 $57,800 $21,500 $98,300Days Cash on Hand 90 245 277 355 345 240 170 95 109 111 125
Attachment 2 – Summary of Water LTFP Rate Assumptions and Outcomes ($000s omitted)
Selective Strategic Capital Work‐ Overall 10% decrease in Capital, AWS construction spread over 4 years
Present Model‐ Current course on capital construction, AWS
construction spread over 3 years#1
#2
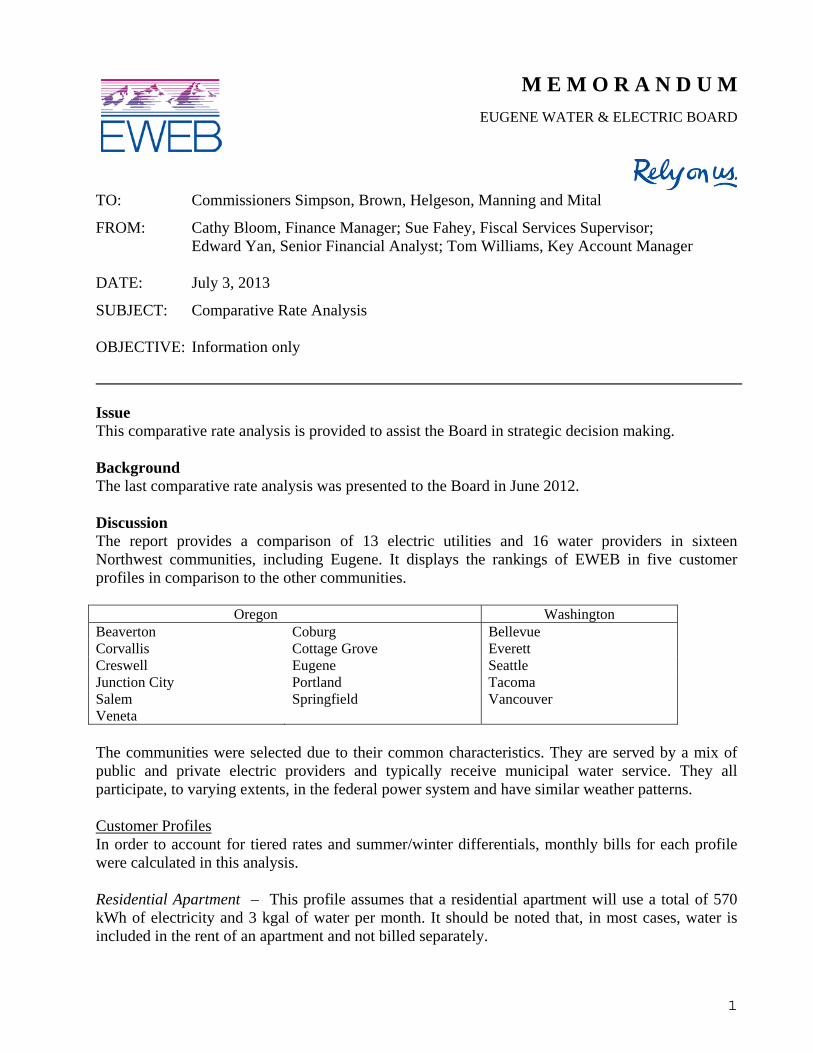
1
M E M O R A N D U M
EUGENE WATER & ELECTRIC BOARD
TO: Commissioners Simpson, Brown, Helgeson, Manning and Mital
FROM: Cathy Bloom, Finance Manager; Sue Fahey, Fiscal Services Supervisor; Edward Yan, Senior Financial Analyst; Tom Williams, Key Account Manager DATE: July 3, 2013
SUBJECT: Comparative Rate Analysis OBJECTIVE: Information only Issue This comparative rate analysis is provided to assist the Board in strategic decision making. Background The last comparative rate analysis was presented to the Board in June 2012. Discussion The report provides a comparison of 13 electric utilities and 16 water providers in sixteen Northwest communities, including Eugene. It displays the rankings of EWEB in five customer profiles in comparison to the other communities.
Oregon Washington Beaverton Coburg Bellevue Corvallis Cottage Grove Everett Creswell Eugene Seattle Junction City Portland Tacoma Salem Springfield Vancouver Veneta The communities were selected due to their common characteristics. They are served by a mix of public and private electric providers and typically receive municipal water service. They all participate, to varying extents, in the federal power system and have similar weather patterns. Customer Profiles In order to account for tiered rates and summer/winter differentials, monthly bills for each profile were calculated in this analysis. Residential Apartment – This profile assumes that a residential apartment will use a total of 570 kWh of electricity and 3 kgal of water per month. It should be noted that, in most cases, water is included in the rent of an apartment and not billed separately.
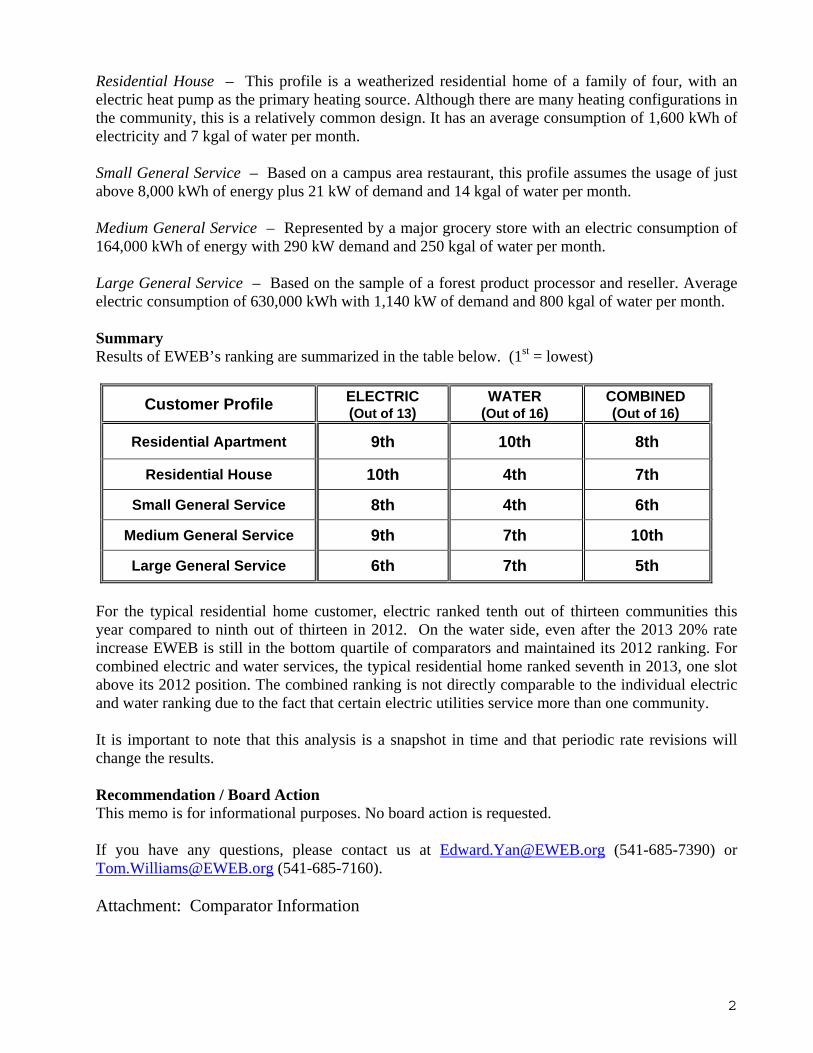
2
Residential House – This profile is a weatherized residential home of a family of four, with an electric heat pump as the primary heating source. Although there are many heating configurations in the community, this is a relatively common design. It has an average consumption of 1,600 kWh of electricity and 7 kgal of water per month. Small General Service – Based on a campus area restaurant, this profile assumes the usage of just above 8,000 kWh of energy plus 21 kW of demand and 14 kgal of water per month. Medium General Service – Represented by a major grocery store with an electric consumption of 164,000 kWh of energy with 290 kW demand and 250 kgal of water per month. Large General Service – Based on the sample of a forest product processor and reseller. Average electric consumption of 630,000 kWh with 1,140 kW of demand and 800 kgal of water per month. Summary Results of EWEB’s ranking are summarized in the table below. (1st = lowest)
Customer Profile ELECTRIC (Out of 13)
WATER (Out of 16)
COMBINED (Out of 16)
Residential Apartment 9th 10th 8th
Residential House 10th 4th 7th
Small General Service 8th 4th 6th
Medium General Service 9th 7th 10th
Large General Service 6th 7th 5th For the typical residential home customer, electric ranked tenth out of thirteen communities this year compared to ninth out of thirteen in 2012. On the water side, even after the 2013 20% rate increase EWEB is still in the bottom quartile of comparators and maintained its 2012 ranking. For combined electric and water services, the typical residential home ranked seventh in 2013, one slot above its 2012 position. The combined ranking is not directly comparable to the individual electric and water ranking due to the fact that certain electric utilities service more than one community. It is important to note that this analysis is a snapshot in time and that periodic rate revisions will change the results. Recommendation / Board Action This memo is for informational purposes. No board action is requested. If you have any questions, please contact us at [email protected] (541-685-7390) or [email protected] (541-685-7160). Attachment: Comparator Information
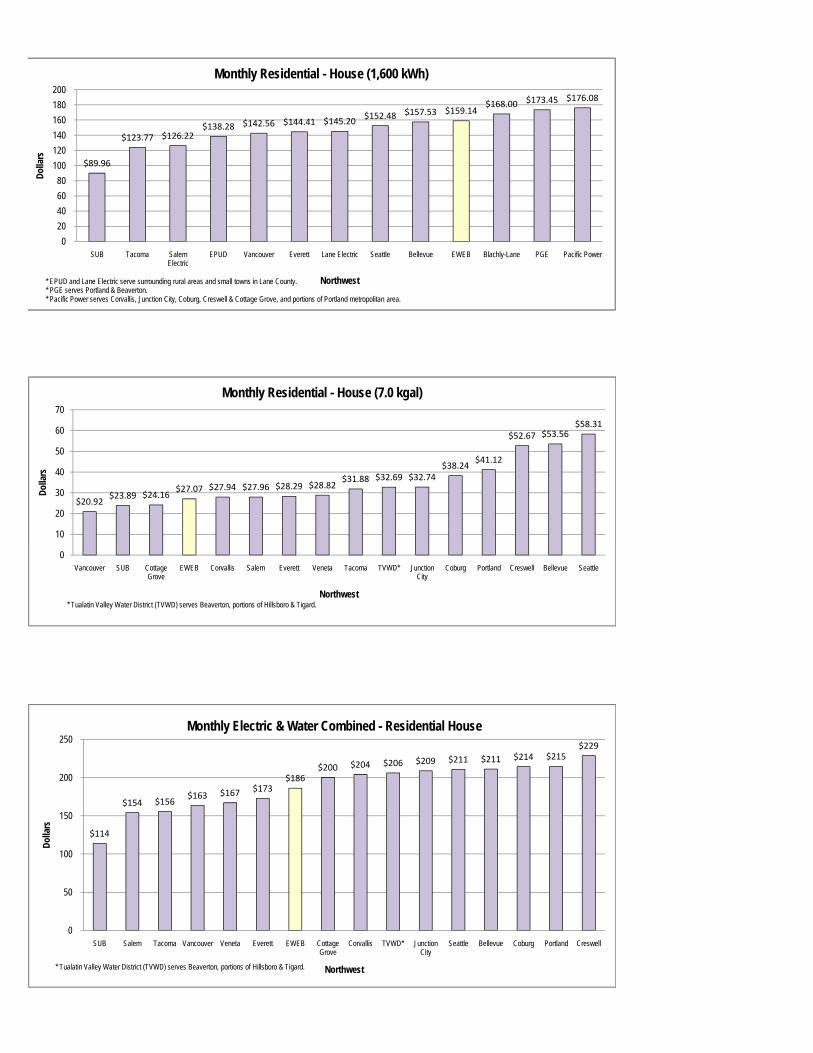
$89.96
$123.77 $126.22$138.28 $142.56 $144.41 $145.20
$152.48 $157.53 $159.14$168.00 $173.45 $176.08
0
20
40
60
80
100
120
140
160
180
200
SUB Tacoma Salem Electric
EPUD Vancouver Everett Lane Electric Seattle Bellevue EWEB Blachly-Lane PGE Pacific Power
Dol
lars
Northwest
Monthly Residential - House (1,600 kWh)
* EPUD and Lane Electric serve surrounding rural areas and small towns in Lane County.* PGE serves Portland & Beaverton.* Pacific Power serves Corvallis, Junction City, Coburg, Creswell & Cottage Grove, and portions of Portland metropolitan area.
$20.92$23.89 $24.16
$27.07 $27.94 $27.96 $28.29 $28.82$31.88 $32.69 $32.74
$38.24$41.12
$52.67 $53.56$58.31
10
20
30
40
50
60
70
Dol
lars
Monthly Residential - House (7.0 kgal)
$89.96
$123.77 $126.22$138.28 $142.56 $144.41 $145.20
$152.48 $157.53 $159.14$168.00 $173.45 $176.08
0
20
40
60
80
100
120
140
160
180
200
SUB Tacoma Salem Electric
EPUD Vancouver Everett Lane Electric Seattle Bellevue EWEB Blachly-Lane PGE Pacific Power
Dol
lars
Northwest
Monthly Residential - House (1,600 kWh)
* EPUD and Lane Electric serve surrounding rural areas and small towns in Lane County.* PGE serves Portland & Beaverton.* Pacific Power serves Corvallis, Junction City, Coburg, Creswell & Cottage Grove, and portions of Portland metropolitan area.
$20.92$23.89 $24.16
$27.07 $27.94 $27.96 $28.29 $28.82$31.88 $32.69 $32.74
$38.24$41.12
$52.67 $53.56$58.31
0
10
20
30
40
50
60
70
Vancouver SUB Cottage Grove
EWEB Corvallis Salem Everett Veneta Tacoma TVWD* Junction City
Coburg Portland Creswell Bellevue Seattle
Dol
lars
Northwest
Monthly Residential - House (7.0 kgal)
* Tualatin Valley Water District (TVWD) serves Beaverton, portions of Hillsboro & Tigard.
$114
$154 $156$163 $167 $173
$186$200 $204 $206 $209 $211 $211 $214 $215
$229
0
50
100
150
200
250
SUB Salem Tacoma Vancouver Veneta Everett EWEB Cottage Grove
Corvallis TVWD* Junction City
Seattle Bellevue Coburg Portland Creswell
Dol
lars
Northwest
Monthly Electric & Water Combined - Residential House
* Tualatin Valley Water District (TVWD) serves Beaverton, portions of Hillsboro & Tigard.
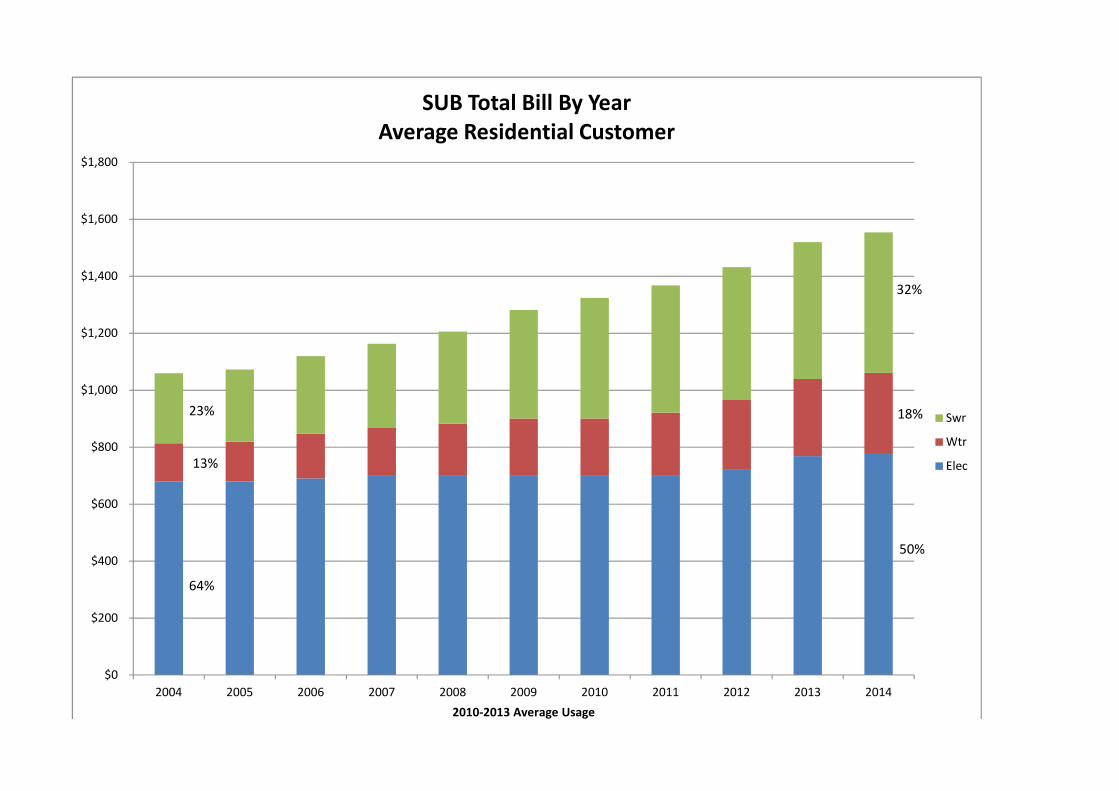
$1,000
$1,200
$1,400
$1,600
$1,800
SUB Total Bill By Year
Average Residential Customer
Swr23%
32%
18%
$0
$200
$400
$600
$800
2004 2005 2006 2007 2008 2009 2010 2011 2012 2013 2014
2010-2013 Average Usage
Wtr
Elec
64%
13%
50%
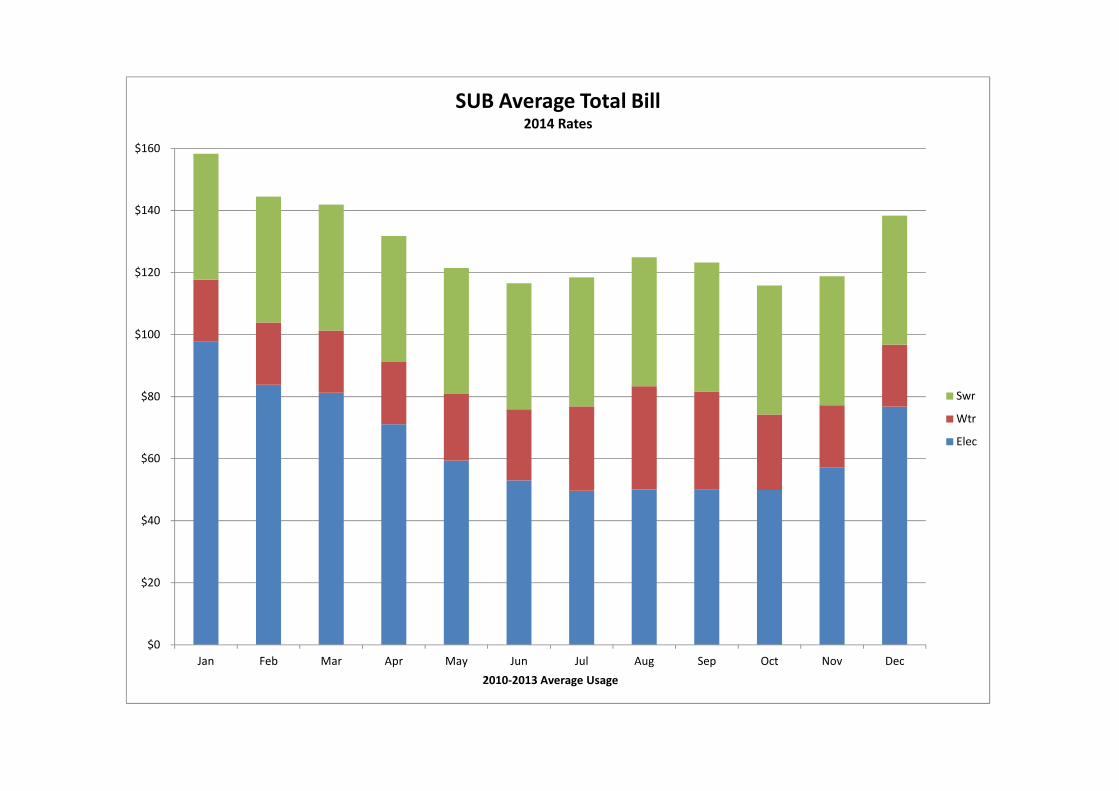
$80
$100
$120
$140
$160
SUB Average Total Bill2014 Rates
Swr
Wtr
$0
$20
$40
$60
Jan Feb Mar Apr May Jun Jul Aug Sep Oct Nov Dec
2010-2013 Average Usage
Elec
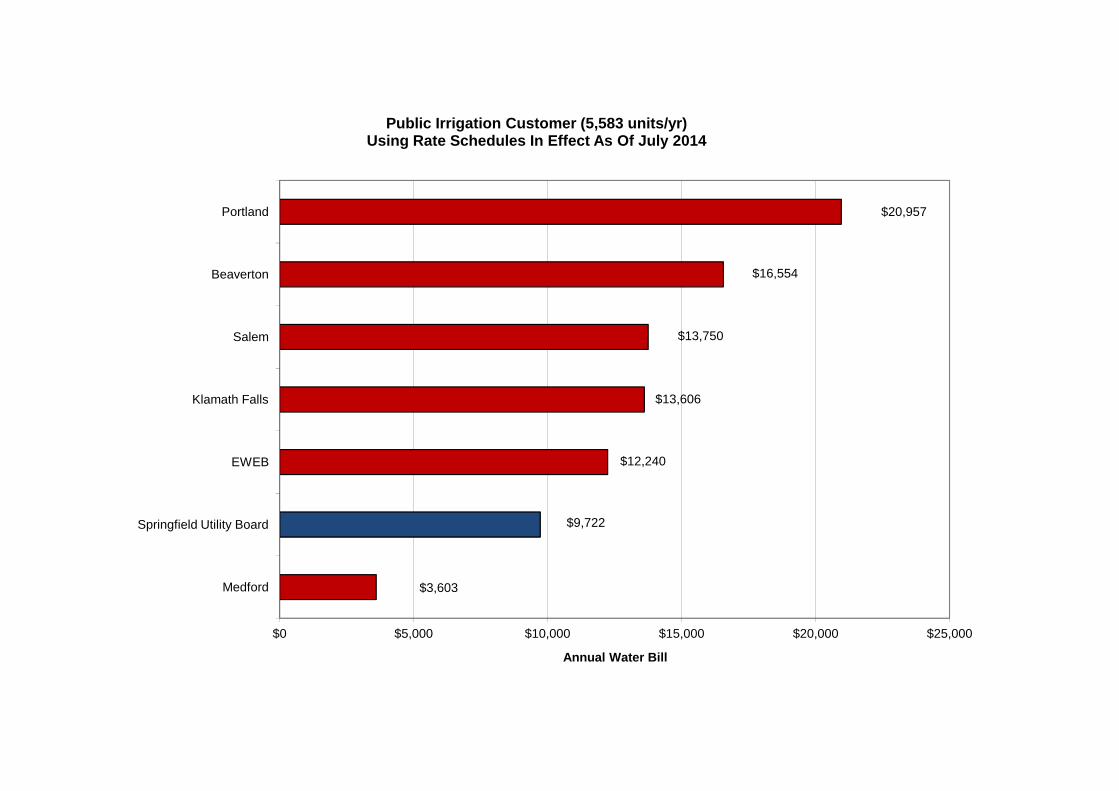
$13,606
$13,750
$16,554
$20,957
Klamath Falls
Salem
Beaverton
Portland
Public Irrigation Customer (5,583 units/yr)Using Rate Schedules In Effect As Of July 2014
$3,603
$9,722
$12,240
$0 $5,000 $10,000 $15,000 $20,000 $25,000
Medford
Springfield Utility Board
EWEB
Annual Water Bill
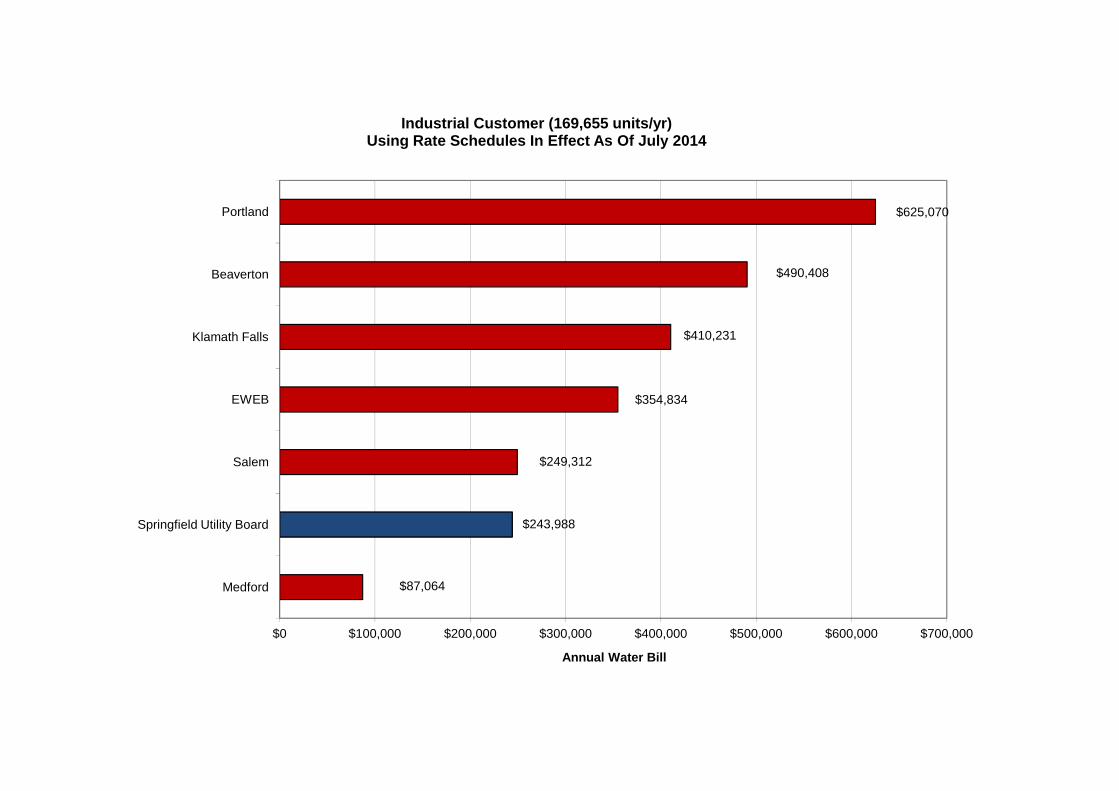
$354,834
$410,231
$490,408
$625,070
EWEB
Klamath Falls
Beaverton
Portland
Industrial Customer (169,655 units/yr)Using Rate Schedules In Effect As Of July 2014
$87,064
$243,988
$249,312
$0 $100,000 $200,000 $300,000 $400,000 $500,000 $600,000 $700,000
Medford
Springfield Utility Board
Salem
Annual Water Bill
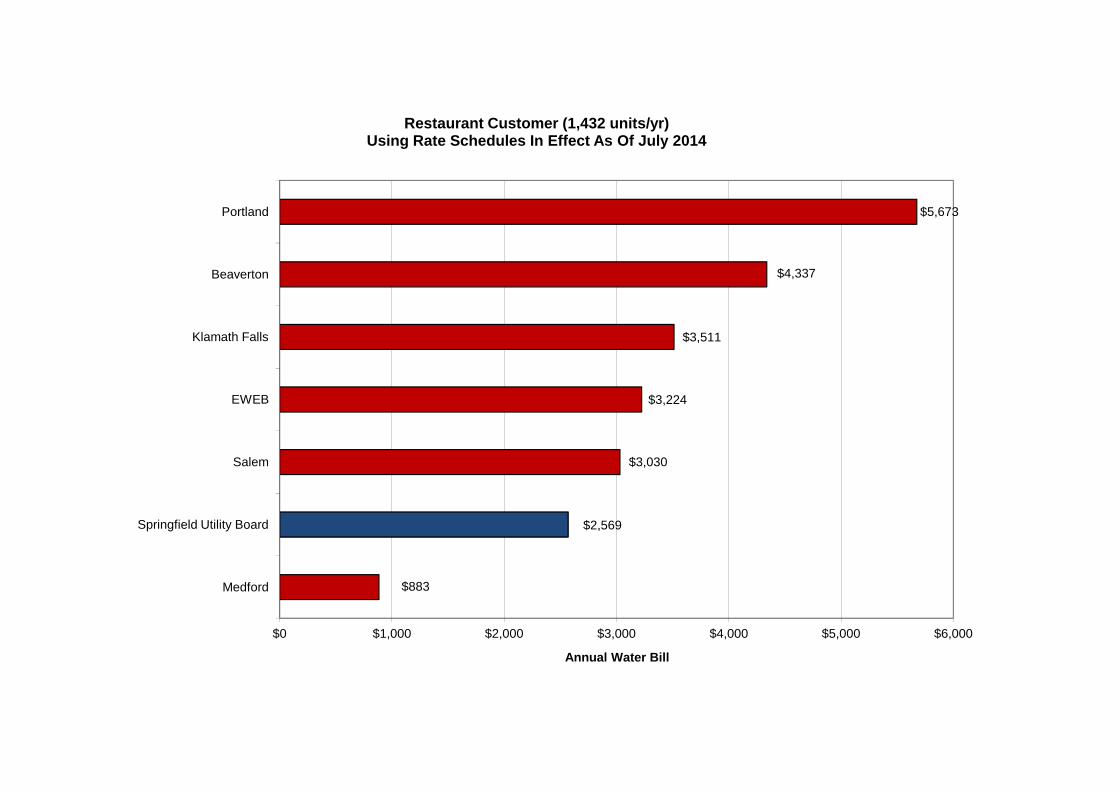
$3,224
$3,511
$4,337
$5,673
EWEB
Klamath Falls
Beaverton
Portland
Restaurant Customer (1,432 units/yr)Using Rate Schedules In Effect As Of July 2014
$883
$2,569
$3,030
$0 $1,000 $2,000 $3,000 $4,000 $5,000 $6,000
Medford
Springfield Utility Board
Salem
Annual Water Bill
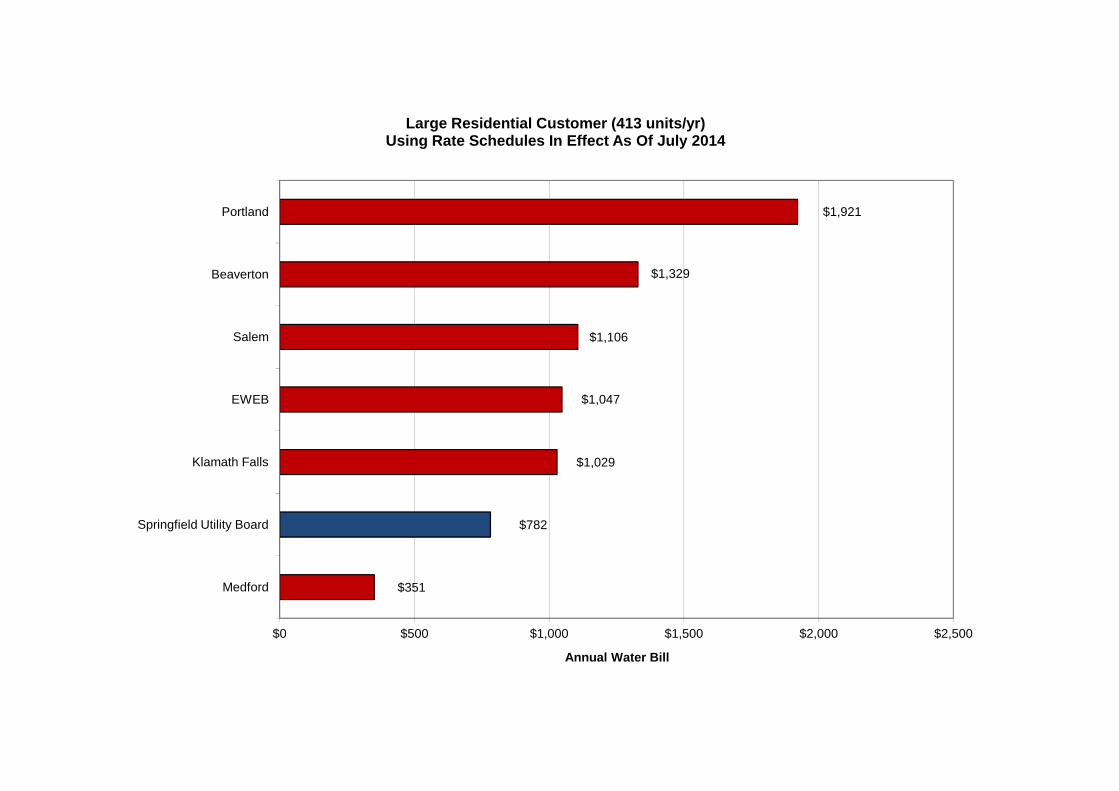
$1,047
$1,106
$1,329
$1,921
EWEB
Salem
Beaverton
Portland
Large Residential Customer (413 units/yr)Using Rate Schedules In Effect As Of July 2014
$351
$782
$1,029
$0 $500 $1,000 $1,500 $2,000 $2,500
Medford
Springfield Utility Board
Klamath Falls
Annual Water Bill
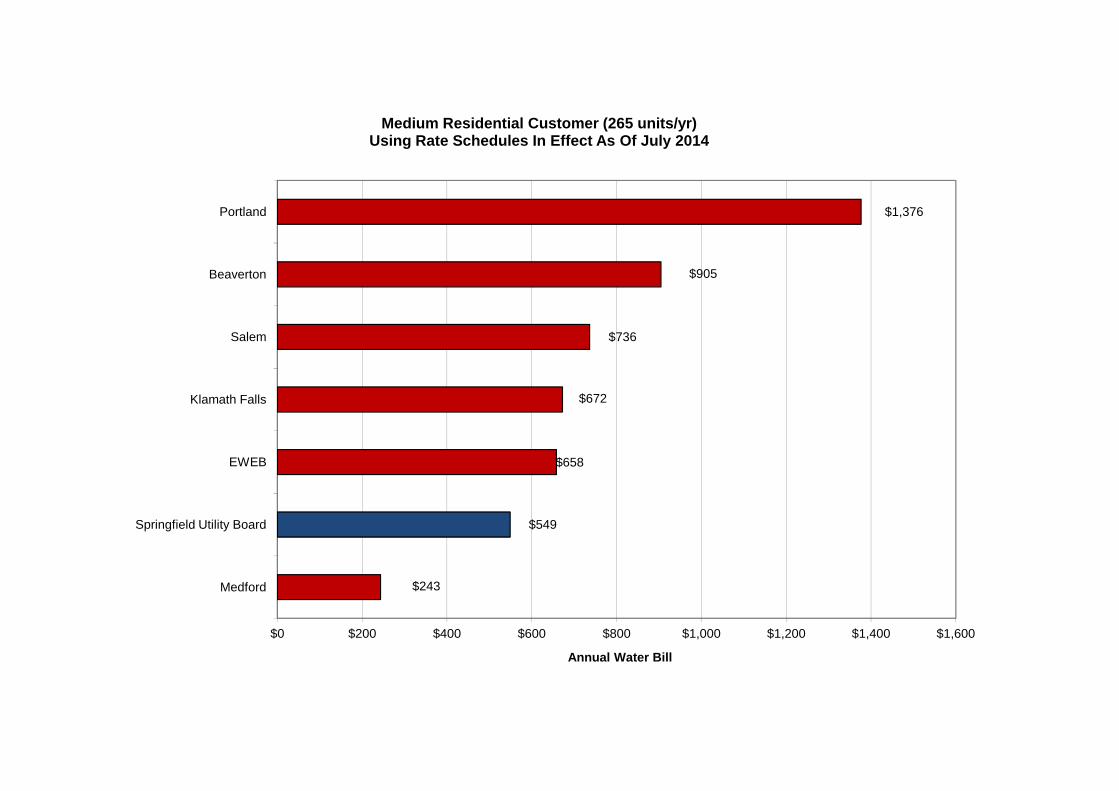
$672
$736
$905
$1,376
Klamath Falls
Salem
Beaverton
Portland
Medium Residential Customer (265 units/yr)Using Rate Schedules In Effect As Of July 2014
$243
$549
$658
$0 $200 $400 $600 $800 $1,000 $1,200 $1,400 $1,600
Medford
Springfield Utility Board
EWEB
Annual Water Bill
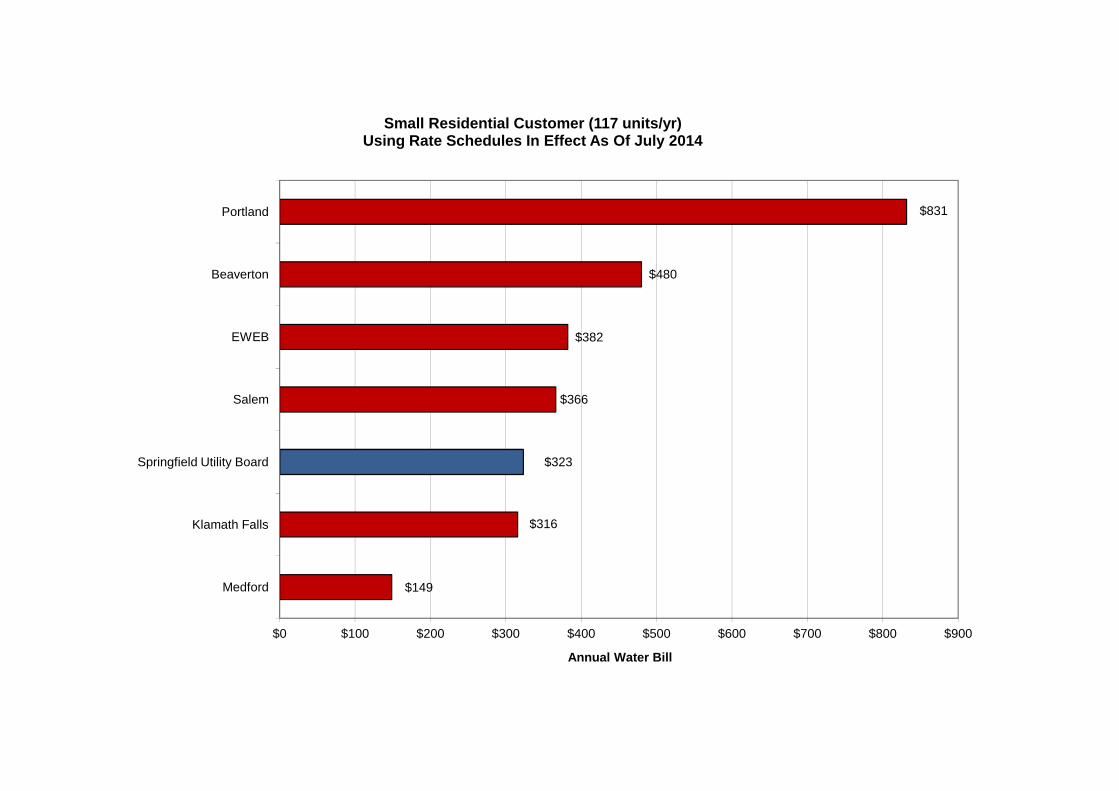
$366
$382
$480
$831
Salem
EWEB
Beaverton
Portland
Small Residential Customer (117 units/yr)Using Rate Schedules In Effect As Of July 2014
$149
$316
$323
$0 $100 $200 $300 $400 $500 $600 $700 $800 $900
Medford
Klamath Falls
Springfield Utility Board
Annual Water Bill
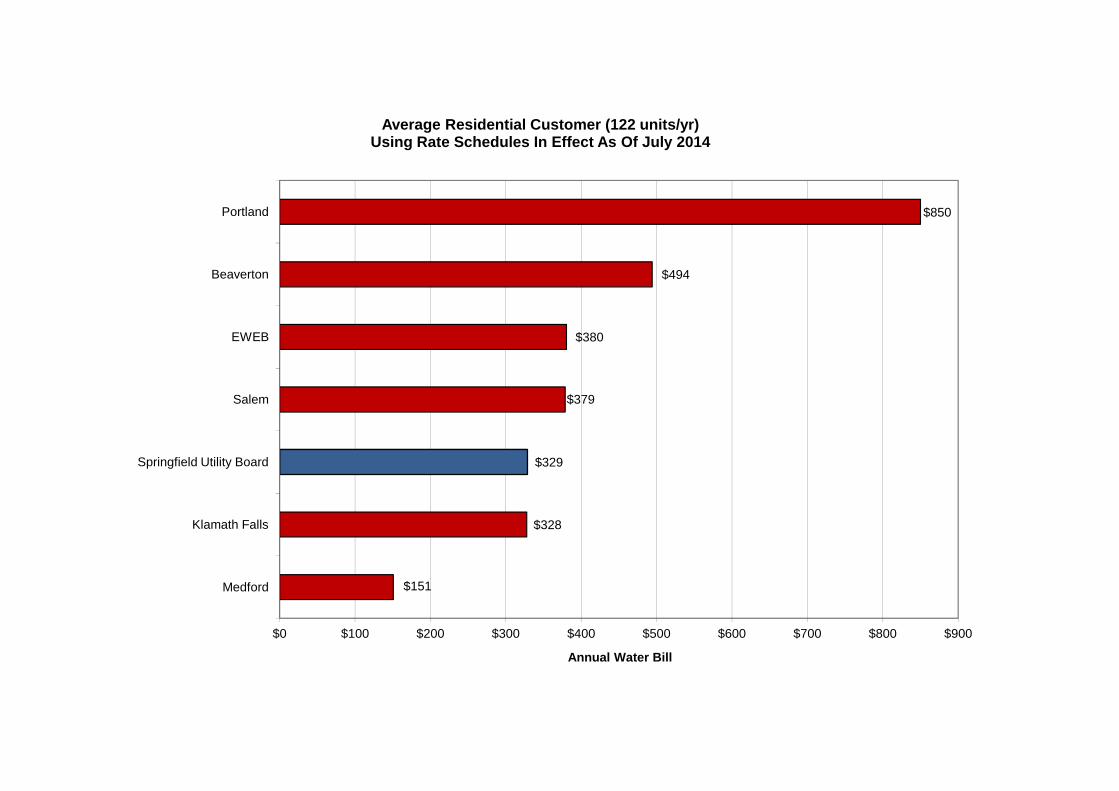
$379
$380
$494
$850
Salem
EWEB
Beaverton
Portland
Average Residential Customer (122 units/yr)Using Rate Schedules In Effect As Of July 2014
$151
$328
$329
$0 $100 $200 $300 $400 $500 $600 $700 $800 $900
Medford
Klamath Falls
Springfield Utility Board
Annual Water Bill
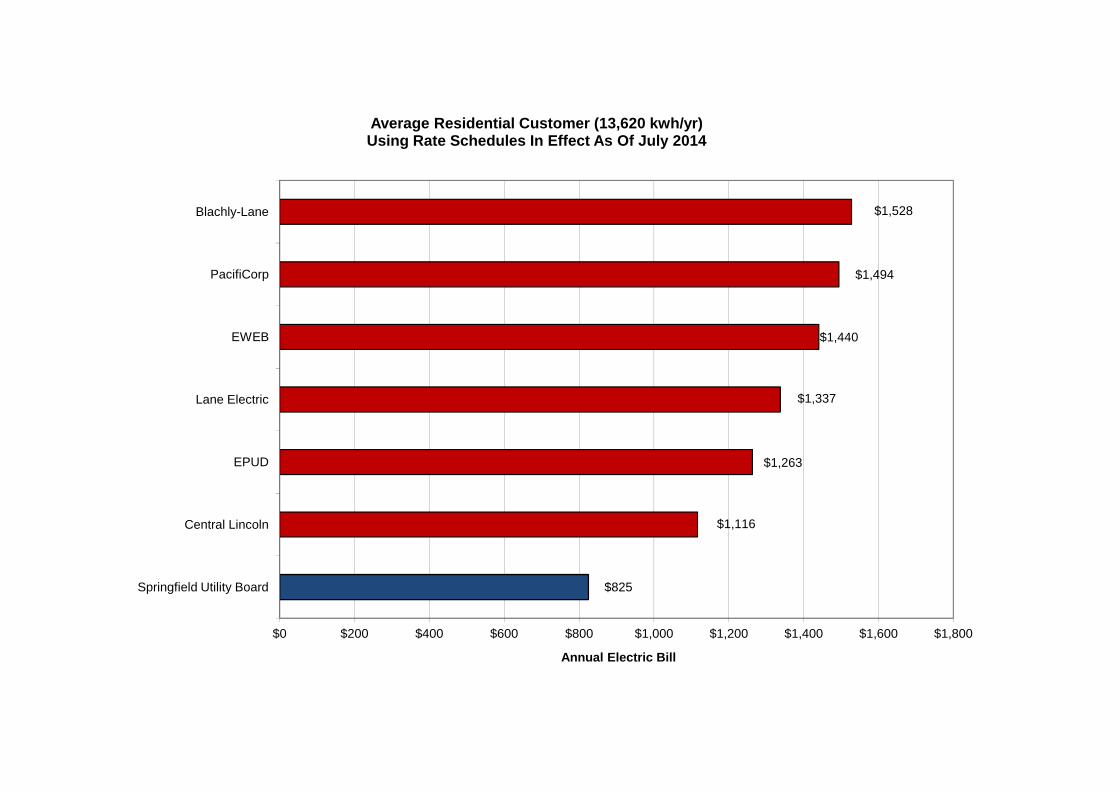
$1,337
$1,440
$1,494
$1,528
Lane Electric
EWEB
PacifiCorp
Blachly-Lane
Average Residential Customer (13,620 kwh/yr)Using Rate Schedules In Effect As Of July 2014
$825
$1,116
$1,263
$0 $200 $400 $600 $800 $1,000 $1,200 $1,400 $1,600 $1,800
Springfield Utility Board
Central Lincoln
EPUD
Annual Electric Bill
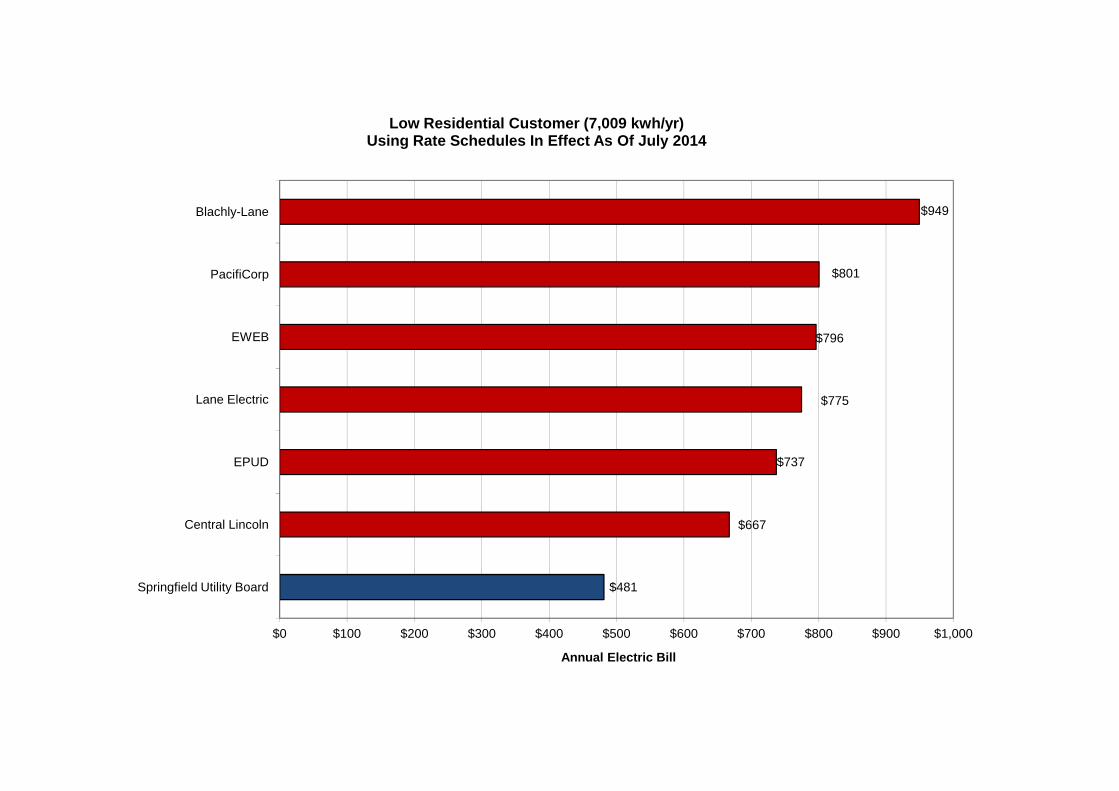
$775
$796
$801
$949
Lane Electric
EWEB
PacifiCorp
Blachly-Lane
Low Residential Customer (7,009 kwh/yr)Using Rate Schedules In Effect As Of July 2014
$481
$667
$737
$0 $100 $200 $300 $400 $500 $600 $700 $800 $900 $1,000
Springfield Utility Board
Central Lincoln
EPUD
Annual Electric Bill
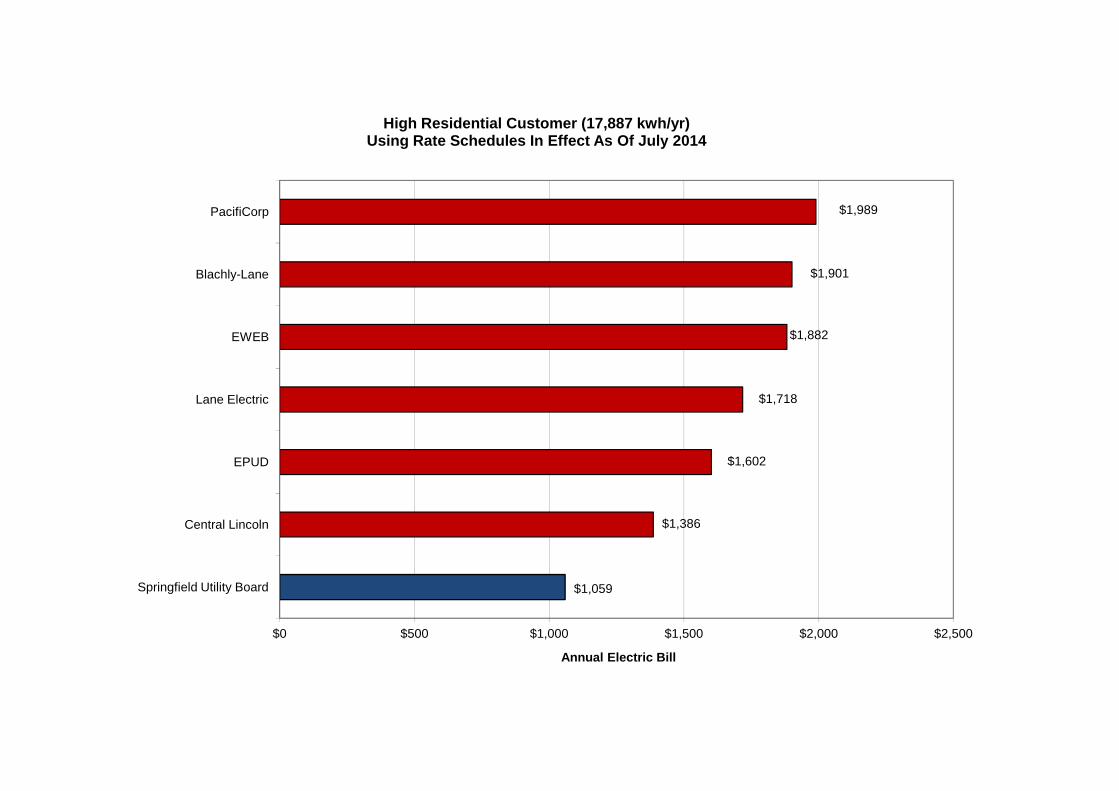
$1,718
$1,882
$1,901
$1,989
Lane Electric
EWEB
Blachly-Lane
PacifiCorp
High Residential Customer (17,887 kwh/yr)Using Rate Schedules In Effect As Of July 2014
$1,059
$1,386
$1,602
$0 $500 $1,000 $1,500 $2,000 $2,500
Springfield Utility Board
Central Lincoln
EPUD
Annual Electric Bill
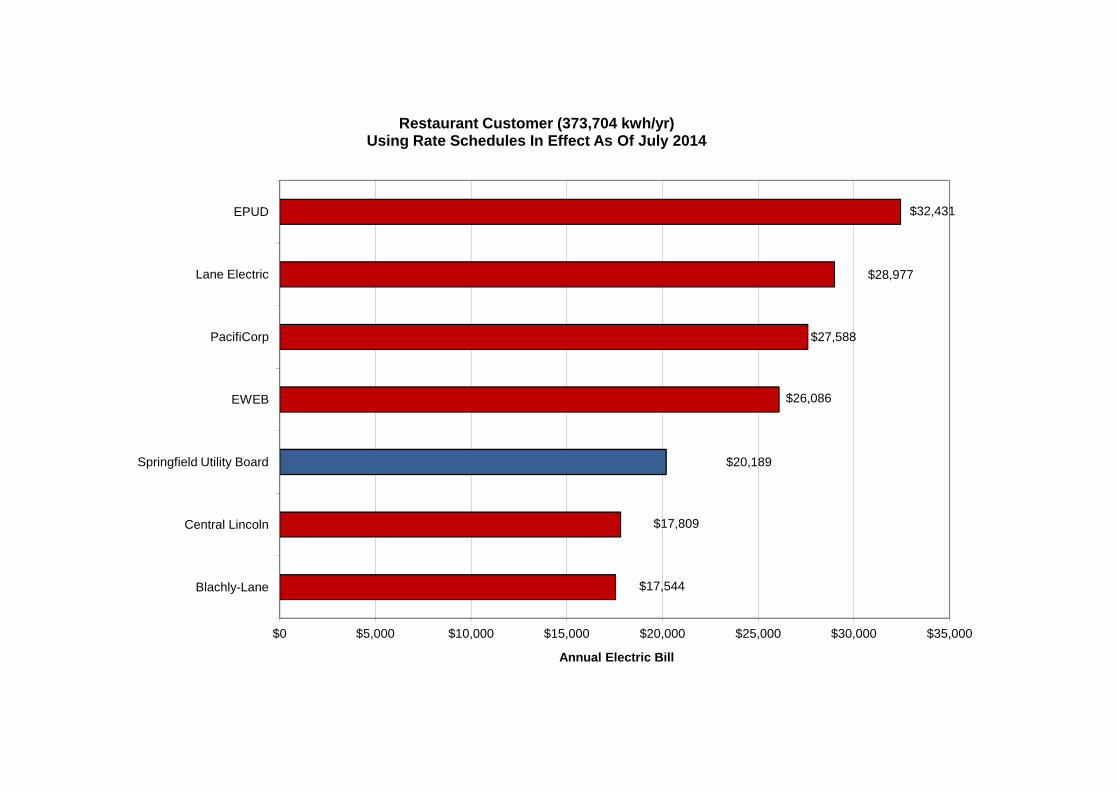
$26,086
$27,588
$28,977
$32,431
EWEB
PacifiCorp
Lane Electric
EPUD
Restaurant Customer (373,704 kwh/yr)Using Rate Schedules In Effect As Of July 2014
$17,544
$17,809
$20,189
$0 $5,000 $10,000 $15,000 $20,000 $25,000 $30,000 $35,000
Blachly-Lane
Central Lincoln
Springfield Utility Board
Annual Electric Bill
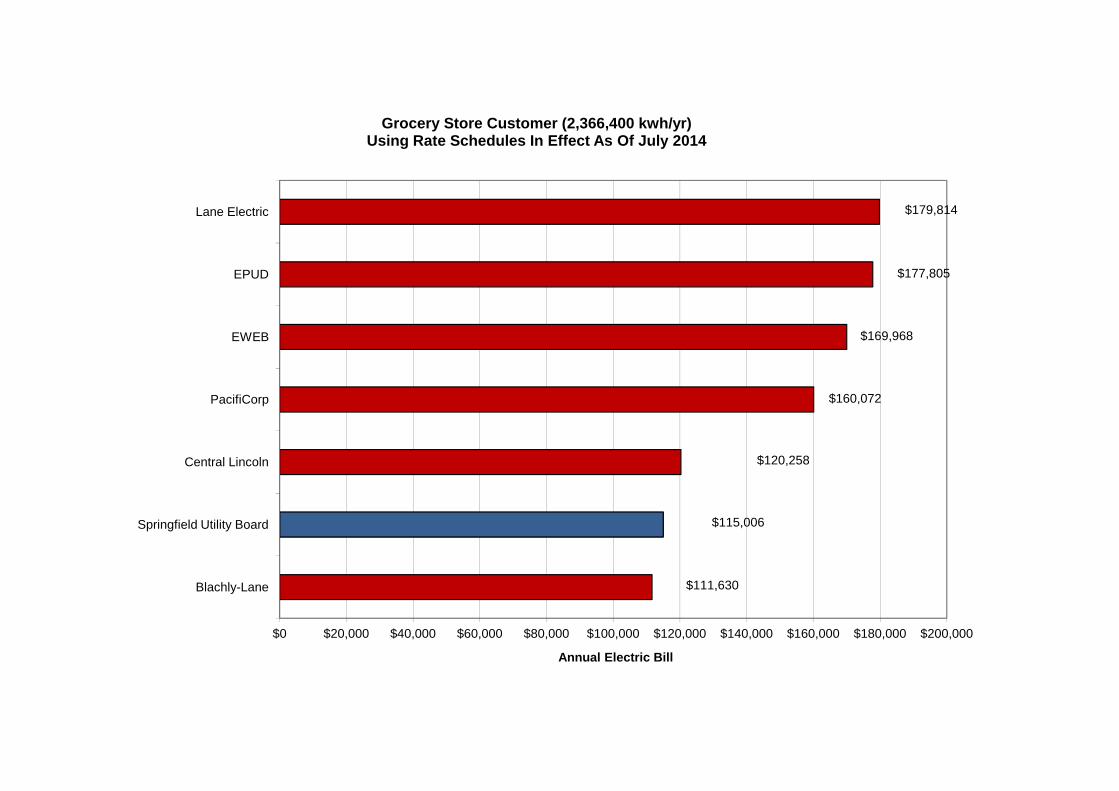
$120,258
$160,072
$169,968
$177,805
$179,814
PacifiCorp
EWEB
EPUD
Lane Electric
Grocery Store Customer (2,366,400 kwh/yr)Using Rate Schedules In Effect As Of July 2014
$111,630
$115,006
$120,258
$0 $20,000 $40,000 $60,000 $80,000 $100,000 $120,000 $140,000 $160,000 $180,000 $200,000
Blachly-Lane
Springfield Utility Board
Central Lincoln
Annual Electric Bill
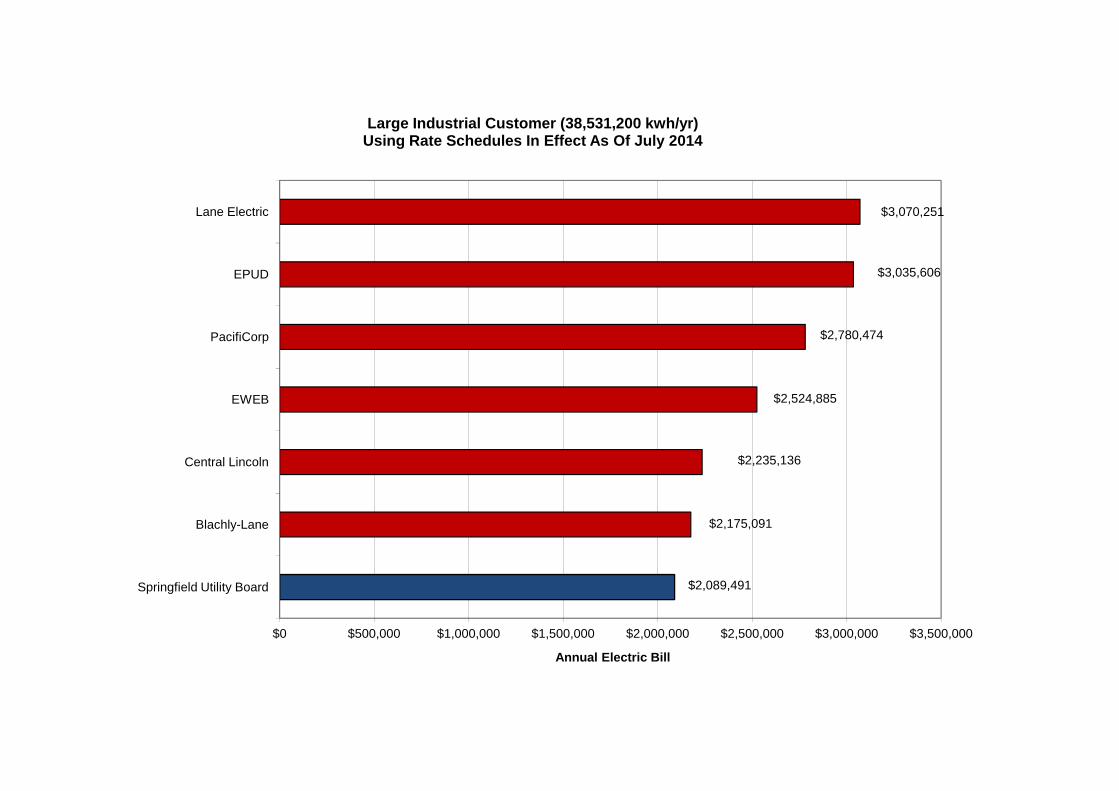
$2,235,136
$2,524,885
$2,780,474
$3,035,606
$3,070,251
EWEB
PacifiCorp
EPUD
Lane Electric
Large Industrial Customer (38,531,200 kwh/yr)Using Rate Schedules In Effect As Of July 2014
$2,089,491
$2,175,091
$2,235,136
$0 $500,000 $1,000,000 $1,500,000 $2,000,000 $2,500,000 $3,000,000 $3,500,000
Springfield Utility Board
Blachly-Lane
Central Lincoln
Annual Electric Bill