Embed Size (px)
Citation preview

Springtime variability of the Intra-Americas low-level jet and its relation
with precipitation and tornadoes in the eastern United States
Ernesto Muñoz and David Enfield
Cooperative Institute for Marine and Atmospheric Studies
Rosenstiel School of Marine and Atmospheric Science
University of Miami
4600 Rickenbacker Causeway
Miami, FL 33149 USA
Accepted October 12, 2009 by Climate Dynamics
Corresponding author: Ernesto Muñoz
E-mail: [email protected]
Telephone: 305-361-4507
Fax: 305-361-4412
1
5
10
15
20
Abstract
The Intra-Americas Sea (IAS) low-level jet has been studied mainly for the summer and
winter seasons. In contrast, spring conditions have been studied less. Here we analyze
the boreal spring variability of the IAS low-level jet (IA-LLJ) and its relation with
precipitation and tornadic activity in the region of the lower Mississippi, Tennessee and
Ohio river basins (MORB). The main mode of variability of the spring IA-LLJ is
obtained from a combined principal component analysis of zonal and meridional winds at
925-hPa. The first empirical orthogonal function of the IA-LLJ is a strengthening of the
climatological flow with stronger easterlies in the Caribbean and stronger southeasterlies
in the Gulf of Mexico. This first mode of variability of the IA-LLJ is related mainly to
the Pacific North American (PNA) teleconnection pattern as the PNA modulates the
pressure in the southeast region of the U.S. Consequently, there is an increase in
precipitation over the MORB region as the moisture fluxes associated with the IA-LLJ
increase. Tornadic activity in nine states spanning the MORB region is also significantly
related to the IA-LLJ and the PNA index for March, in addition to the Pacific Decadal
Oscillation (PDO) and the Niño indexes. Among the environmental factors that influence
tornadic activity are southwesterly wind shear, dry transients at the mid-troposphere,
moist transients at low levels, and an increase in convective available potential energy
(CAPE). The decadal shifts in MORB precipitation and tornado activity appear to be
related to the decadal shift of the IA-LLJ.
Keywords: low-level jet, tornadoes, PNA, Mississippi River, Intra-Americas Sea
2
25
30
35
40
45

1. Introduction
The Intra-Americas Sea (IAS; Gulf of Mexico and Caribbean Sea) is a source of
moisture for the eastern region of the United States of America (U.S.). Previous studies
by Rasmusson (1967), Bosilovich and Schubert (2002), Mestas-Nuñez et al. (2007) and
Ruiz-Barradas and Nigam (2005) highlight the importance of the influence of IAS
atmospheric moisture on the moisture budget of the continental U.S. The bulk of the
moisture transport from the IAS is at the lower-levels below 700 hPa (Helfand and
Schubert, 1995). It travels through a low-level corridor comprised of the Caribbean
easterlies and the Gulf of Mexico southeasterlies. In fact, it is the easterly Caribbean
low-level jet (Muñoz et al. 2008) and the Gulf of Mexico southeasterlies (Mestas-Nuñez
et al. 2007) that are the main wind components of the IAS moisture corridor.
The focus of the studies mentioned in the previous paragraph has been on the summer
and winter seasons, whereas the spring season has received comparatively less attention.
For example, Bosilovich and Schubert (2002) performed integrations for June and
August. Additionally, Rasmusson (1967) and Mestas-Nuñez et al. (2007) analyzed and
contrasted the winter and summer seasons. However, analyzing the spring season is
important for several reasons: (1) it is a season typified by frequent Midwest flood
events; (2) it is the primary season for tornadoes in the southern U.S. affected by the
availability of low-level moisture from the Gulf of Mexico; (3) rainfall anomalies in the
spring create soil moisture conditions that can carry over to summer and either exacerbate
or ameliorate the tendency for summer floods or drought conditions; and (4) it is
observed that over the Mississippi River basin the moisture flux convergence is largest
3
50
55
60
65

during spring and is associated with the northward flux from the Gulf of Mexico (Berbery
and Rasmusson, 1999).
The influence of the El Niño-Southern Oscillation (ENSO) phenomenon on the
tropical North Atlantic has been well-documented. However, other teleconnections that
are active during winter and spring months also play a role in the IAS. For example, one
of the characteristics of the Pacific North American (PNA) oscillation is its anomaly
center of sea level pressure straddling the southeastern part of the U.S. (Feldstein, 2002;
Barnston and Livezey, 1987; Wallace and Gutzler, 1981). The PNA has also been
documented to have a major influence in the region of the Ohio River Valley (Coleman
and Rogers, 2003) and the Mississippi River region (Rogers and Coleman, 2003). Also,
the Pacific Decadal Oscillation (PDO) influences the precipitation variability in North
America (McCabe et al. 2004; Mantua and Hare, 2002). Nevertheless, the PNA and the
PDO have been discussed less with respect to their impacts and relation to IAS climate
variability.
Tornadic activity is also influenced by moisture fluxes from the Gulf of Mexico. A
well-known region of tornadic activity is the “Tornado Alley”, comprised mainly of the
states of Texas, Oklahoma, Kansas, Nebraska, eastern Colorado, and South Dakota with
most of the activity occurring during May and June. However, other regions of the U.S.
are also prone to tornadic activity throughout the year (Brooks et al. 2003a), sometimes
more prominent in late winter and early spring and with a different seasonal behavior
when compared with Tornado Alley. For example, one of the major tornado outbreaks in
the U.S. occurred on April 3-4, 1974 in the region of the Mississippi and Ohio river
basins outside of Tornado Alley (Verbout et al. 2006). Additionally, Trapp et al. (2005)
4
70
75
80
85
90

found that tornado activity was strongly associated with squall lines and bow echoes (as
opposed to cells) for the U.S. states situated along a curved axis from Louisiana to
Pennsylvania and that activity was higher in the first few months of the year (i.e., from
January to April). Tornadic activity in a similar region was found by Cook and Schaefer
(2008) to be susceptible to the influence of ENSO conditions in boreal winter.
The objective of the present study is to analyze the climate factors associated with the
principal mode of interannual variability for the Intra-Americas low-level jet (IA-LLJ) in
boreal spring and its relation to the precipitation and tornadoes of the Mississippi and
Ohio river basins. We analyze the relation of the IA-LLJ variability with Pacific and
Atlantic teleconnections with the goal of identifying the dominant regional mechanisms
likely forced from outside the IAS.
2. The data and the approach
Data were obtained from the ECMWF 40-year reanalysis (ERA-40; Uppala et al.
2005) and the North American Regional Reanalysis (NARR; Mesinger et al. 2006) for
1958-2001 (ERA-40) and 1979-2001 (NARR). To study the boreal spring IA-LLJ, the
925-hPa zonal and meridional monthly winds were analyzed. Previous studies have
documented the 925-hPa level to be near the level of strongest winds in the Caribbean
region (Muñoz et al. 2008; Amador, 2008) and in the southern region of the U.S. (Ting
and Wang, 2006; Weaver and Nigam, 2008). Fig. 1 shows the annual mean of the 925-
hPa winds and their magnitude from NARR and ERA-40 data. In the annual mean, the
Caribbean easterlies and the Gulf of Mexico southeasterlies connect to form the IA-LLJ.
The standard deviation of each component of the wind calculated from the monthly
5
95
100
105
110
115
5
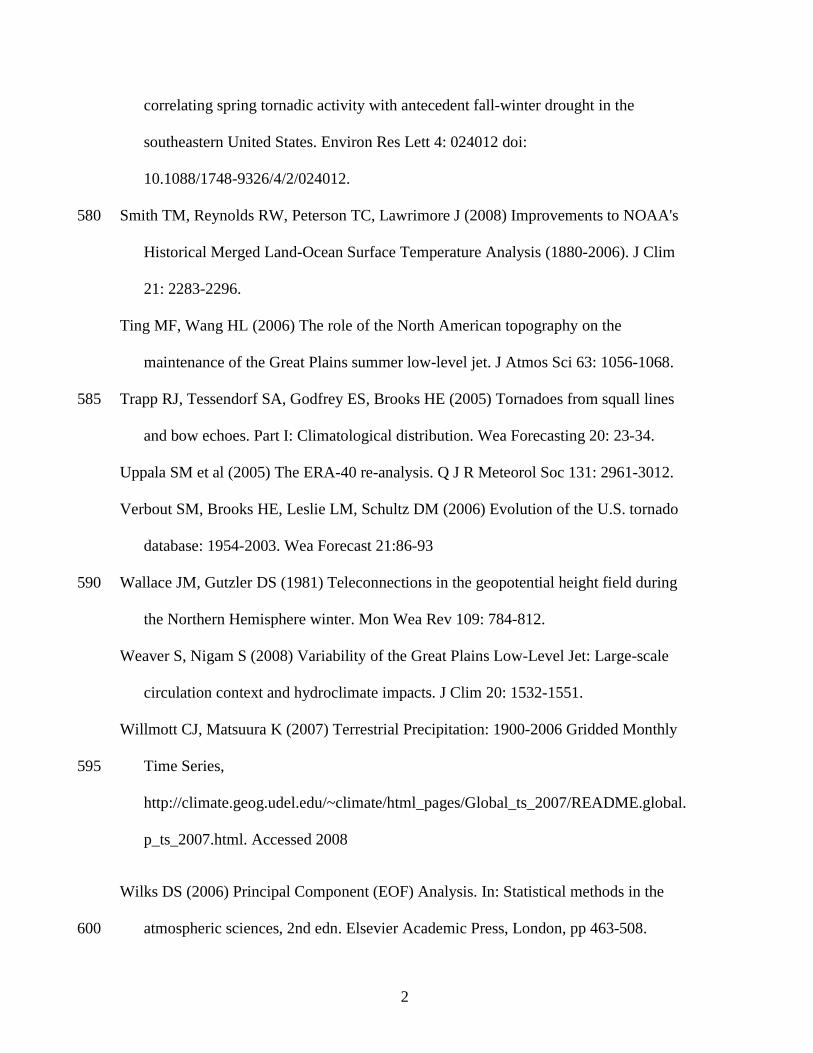
vector winds is shown in Fig. 2. The zonal wind has a greater standard deviation in the
Caribbean Sea, the region of the North Atlantic subtropical high, and the region of the
Papagayo Jet (over the northeastern tropical Pacific). The meridional wind has a greater
standard deviation over the southern states of the U.S. between 88-98°W, in the Gulf of
Mexico, the Tehuatenpec Jet, the Yucatan Channel, and the North Atlantic region north
of 25°N.
To quantify the relation between the interannual variabilities of the Caribbean and
Gulf of Mexico winds, an approximation can be achieved by correlating the 925-hPa
zonal wind anomalies in the Caribbean region (70-80°W, 12-16°N) with the 925-hPa
meridional wind anomalies in the Gulf of Mexico region (87-98°W, 22-30°N) based on
the areas of higher standard deviation (Fig. 2) for each wind component. First, the wind
anomalies were calculated as the monthly departures from the monthly 1979-2001
climatology and then area-averaged over the indicated domains. The respective zonal
and meridional indexes of the monthly anomalies in these regions were correlated
separately for each calendar month as shown in Fig. 3. The common data period of the
correlation was 1979-2001, and the 97.5% level of significance was a correlation
coefficient of ±0.48.
The 925-hPa Caribbean zonal wind and the Gulf of Mexico meridional wind are most
highly and significantly anti-correlated in late winter and early spring (February, March,
and April) and in September in both the ERA-40 and NARR data sets. This indicates that
when the anomalous winds in the Gulf of Mexico are southerly, the anomalous winds in
the Caribbean are easterly. It is in these months that the moisture fluxes of the Caribbean
would combine with the moisture fluxes of the Gulf of Mexico with greater impact on the
6
120
125
130
135

U.S. continent. This implies a greater moisturization of the low-level air mass due to the
longer fetch over warm waters. The months with the lowest correlation in the NARR
data set were July and August, although the ERA-40 data set showed a modest
correlation for these summer months.
The high correlation between the Gulf of Mexico meridional wind and the Caribbean
zonal wind for the months of March and April lends itself to be analyzed with other
statistical techniques. To obtain the main mode of variability for the IA-LLJ, a principal
component analysis (PCA) was performed by combining both wind components into a
single decomposition. The PCA technique separates the variability of the time series of a
given field into independent modes, providing a pattern (the eigenvector, also referred to
as the empirical orthogonal function, EOF) and a respective time series (the principal
component, PC) for each mode. The combined PCA calculation was based on the
correlation matrix, thereby maximizing the joint variance of the zonal and meridional
winds from the correlation between and among the wind components (Wilks, 2006). The
PCA was calculated for the March and April monthly anomalies of the 925-hPa zonal and
meridional winds for 1958-2001 from the ERA-40 data set in the domain specified by
Fig. 4a, the Intra-Americas Sea. That is to say, subsequent individual March and April
monthly values were used (not two-month averages). Most of the land areas were
masked, with the exception of the Yucatan Peninsula and western Cuba, which are low
terrains and over which the Caribbean low-level flow connects with the Gulf of Mexico.
To analyze the main mode of variability of the IA-LLJ the corresponding time series
(or PC1) was regressed on other atmospheric and oceanic fields and correlated with the
teleconnection indexes. The ERA-40 data set was used for the following atmospheric
7
140
145
150
155
160

parameters: sea level pressure (SLP), vertical velocity, geopotential height, divergence,
air-sea fluxes, moisture fluxes, specific humidity and winds. For precipitation, the
University of Delaware's 0.5x0.5 degree data set was used (Willmott and Matsuura,
2007); for sea surface temperature (SST), NOAA's Extended Reconstructed SST data set
(ERSST.v3) was used (Smith et al. 2008).
To analyze the relationship between the IA-LLJ and U.S. precipitation and tornadoes
we calculated two additional indexes. One index was for the area-average precipitation
anomalies over the region of the lower Mississippi, Tennessee, and Ohio river basins.
We refer to this index as the MORB precipitation index. The University of Delaware
(Willmott and Matsuura, 2007) precipitation data set was used to calculate the MORB
precipitation index. The other index was for the monthly average of tornado counts for
the region encompassing the MORB precipitation index. The data set used to calculate
the tornado activity index was the Storm Prediction Center Tornado Database (McCarthy,
2003; Schaefer and Edwards, 1999). As Doswell III et al. (2009) indicate, analyzing
tornado data can be challenging due to issues associated with the temporal inconsistency
of the tornado intensity Fujita scale (F-scale). For example, it is likely that pre-1975
tornadoes were rated higher (Verbout et al. 2006). Therefore, we proceeded with caution
in creating the tornado activity index and accounted only for those tornadoes of
significant strength.
To analyze the environmental conditions related to the tornado activity index, we
used the covariance of wind and specific humidity data from the NCEP/NCAR
Reanalysis (Kalnay et al. 1996). Mestas-Nuñez et al. (2005) showed the usefulness of the
NCEP/NCAR Reanalysis moisture fluxes for the water budget analysis of the IAS. We
8
165
170
175
180
also used wind shear and convective available potential energy (CAPE) data from NARR
(Mesinger et al. 2006). CAPE is a measure of the amount of energy available for
convection, and Brooks et al. (2003b) identified the CAPE and the wind shear as
quantitative measures that serve to characterize environments conducive to severe storms.
The following teleconnection indexes were also used: the PNA index and the North
Atlantic Oscillation (NAO) index from NOAA's Climate Prediction Center calculated
according to the methodology of Barnston and Livezey (1987); the PDO index from
Miller et al. 1994; and the tropical Pacific SST anomaly Niño indexes.
3. Principal mode of variability of IAS low-level winds
a. The atmospheric circulation variability
The main mode of variability for the March-April 925-hPa winds of the Intra-
Americas region has a spatial pattern (EOF1) in which the Caribbean easterlies and the
Gulf of Mexico southeasterlies change along the axis of their climatological flow (Fig.
4b). This first mode has more than 70% of the explained variance, and out of the first
several loading vectors (EOFs) is the only one with a coherent intensification (or
weakening) of the climatological flow (the IA-LLJ). The atmospheric flow from the
Caribbean into the Gulf of Mexico through the Yucatan Channel weakened, for example,
during the years of 1969, 1987, and 1993, while it strengthened for the years from 1973
through 1977 (Fig. 4b-c). In fact, a decadal shift in the late 1970s can be identified as the
direction of the IA-LLJ PC1 anomalies is mostly positive before the early 1980s and
mostly negative after the late 1970s.
The regression of PC1 for the period 1958-2001 onto the upper-level, mid-level and
low-level circulation (Fig. 5) shows significant changes not only in the IAS but also
9
185
190
195
200
205

throughout the western North Atlantic, North American continent and northeastern
Pacific. Strong positive anomalies of the 200-hPa height are centered over the mid-
latitude northeastern Pacific (45°N, 155°W) and straddle the southeastern U.S., separated
by negative anomalies over Canada (Fig. 5a). The large-scale pattern of the 925-hPa
wind (Fig. 5c) is comprised of a large anticyclonic circulation centered over the east coast
of the U.S. and involves a strengthening of the northeast trades over the tropical North
Atlantic extending into the Caribbean. The strengthening of the southerly flow extends
from the Gulf of Mexico to the Great Lakes region between the east coast of the U.S. and
the Rocky Mountains and the Mexican Sierra Madre Oriental. The low-level
strengthening is also accompanied by positive anomalies of specific humidity, indicating
a strengthening of the low-level moisture fluxes from the Gulf of Mexico. When
considering the difference between the low-level (925-hPa) and mid-level winds (500-
hPa), the winds are veering with height, indicating a southwesterly wind shear.
The changes in the large-scale wind pattern lie on the periphery of a pattern of
positive SLP anomalies centered over the western mid-latitude North Atlantic (Fig. 6a).
Concurrent with a strengthening of the IA-LLJ there is a strengthening of SLP to the east
of the U.S. with its core centered at 75°W, 35°N over the ocean. The pattern represents a
northward and westward displacement of the climatological core of the North Atlantic
Subtropical High (NASH). A strong SLP anomaly zonal gradient forms over North
America with negative SLP anomalies over northern North America and positive SLP
anomalies over the Atlantic (also evident in the 925-hPa wind anomalies) corresponding
to a strengthening of the Great Plains LLJ.
In the Pacific, significant SLP anomalies are observed to the west of the U.S. centered
1
210
215
220
225
230
10

at 45°N, 150°W (Fig. 6a). A similar pattern of anomalies has been associated with the
negative phase of the PNA oscillation in the winter season (Barnston and Livezey, 1987;
Wallace and Gutzler, 1981). The 200-hPa height anomalies corroborate the PNA
relationship (Fig. 5a). The 200-hPa level is appropriate to distinguish teleconnection
patterns since this level exhibits both divergent circulation in the tropics and non-
divergent circulation in the mid-latitudes (Nigam, 2003). In fact, out of several northern
hemisphere teleconnection indexes (Table 1), the correlation of the PNA index with PC1
is the most highly (anti-) correlated, having a correlation coefficient of -0.61. This
indicates that when the PNA is in its negative phase, the IA-LLJ most likely intensifies.
The NAO index, on the other hand, is not significantly correlated with PC1. The Pacific
climatic indexes (PNA, PDO, and the Niño indexes), however, are significantly
correlated with the IA-LLJ PC1.
b. Sea surface temperature
In the region of the IAS, there is a cooling of the Caribbean Sea and a warming of the
Gulf of Mexico associated with a strengthening of the IA-LLJ (Fig. 6b). The warming in
the Gulf of Mexico and along the east coast of the U.S. is associated with a decrease in
heat loss from the ocean by turbulent and radiative heat fluxes (not presented), of which
the latent heat flux is dominant followed by the sensible heat flux. This relation with
latent and sensible heat fluxes is consistent with changes in the intensity of frontal
passages associated with the anomalous pressure trough over the eastern seaboard
(Eichler and Higgins, 2006). The oceanic region off the southeastern U.S. also shows
positive SST anomalies as a result of the negative windstress curl anomalies. However,
the cooling in the Caribbean Sea is associated predominantly with an increase in
1
235
240
245
250
evaporation (negative latent heat flux anomalies) due to the strengthened northeast trades
(Fig. 5c). Muñoz et al. (2009) have done an in-depth analyses of the IAS SST dipole
during springtime.
A strengthening of the IA-LLJ is associated with a cooling of the tropical Pacific SST
anomalies that serve as background for the influence of the PNA. The negative phase of
the PNA is associated with cooling along the west coast of North America and warming
farther west as observed in Fig. 6b. The cooling of the tropical Pacific is marginally
significant, with a correlation between the Niño3 index and the IA-LLJ PC1 of 0.38.
Similarly, the negative (cool) phase of the PDO is associated with a strengthening of the
IA-LLJ (Table 1). This tropical Pacific cooling acts as a modulator by strengthening the
tropical North Atlantic (TNA) trade winds, inducing latent heat flux anomalies that cool
the TNA surface waters. Enfield and Mayer (1997) presented evidence of a lagged and
positive correlation between the tropical Pacific conditions in winter and the tropical
North Atlantic conditions a few months after in boreal spring. In this case, stronger
easterlies induced an increase in evaporative heat loss and consequent cooling of the
Caribbean SSTs.
c. Precipitation
The regions of increased precipitation over North America are also regions of upper-
level divergence and an increase in upward motion (Fig. 7), coinciding with a
strengthened IA-LLJ and moisture transport from the IAS. Conversely, those regions of
less precipitation over the Atlantic and the IAS (Fig. 7c) are collocated with regions of
upper-level convergence (Fig. 7a) and decreased upward motion (Fig. 7b). For example,
the precipitation over the Florida peninsula, Bahamas, and Greater Antilles is reduced for
1
255
260
265
270
275

those years with a strengthening of the IA-LLJ.
Precipitation is enhanced in the region of the central Mississippi and Ohio river
basins as the IA-LLJ intensifies (Fig. 7c). In fact, the moisture flux towards North
America along 30°N has strengthened and more moisture reaches the regions north of the
Gulf of Mexico (Fig. 8). This is consistent with the winter and summer relationship as
observed by Mestas-Nuñez et al. (2007) and Ruiz-Barradas and Nigam (2005),
respectively. In this case, as observed in Fig. 8, the strengthening of the moisture flux is
concentrated at the lower levels with the strongest anomalies near 925 hPa. Considering
the moisture flux components separately (Fig. 8), it is observed that the specific humidity
positive anomalies are stronger as the height decreases (as the pressure level increases),
and the southerly wind anomalies are stronger between 90-97°W from 850 hPa and
higher.
4. Precipitation variability in the Mississippi and Ohio river basins
As we have shown, the region of greater precipitation anomalies associated with
changes in the springtime IA-LLJ is the region of the Mississippi and Ohio river basins
(MORB). We corroborate the relation from the standpoint of the precipitation anomalies.
To do this, we created an index of March-April MORB precipitation based on the colored
area shown in Fig. 9a. That is to say, we averaged the precipitation anomalies over the
Mississippi, Tennessee and Ohio river basins. Using the 0.5x0.5 degree precipitation
data set, the river basins were approximated based on the map of U.S. climate divisions.
The MORB precipitation index (Fig. 9b) shows a decrease in precipitation in recent
decades most likely associated with the weakening of the IA-LLJ after the early 1980s
1
280
285
290
295
300

(Fig. 4).
As observed in Fig. 10, the regression of the MORB precipitation index highlights the
region between the Appalachian Mountains to the east, the Great Lakes to the north, the
Gulf of Mexico to the south, and the states of Texas, Oklahoma, Kansas, and Nebraska to
the west. The areas to the west and the area of the coastal southeast U.S. (including the
Florida peninsula) do not have a statistically significant relationship with the MORB
precipitation index. The region of increased moisture flux convergence is collocated with
the region of increased precipitation. The moisture fluxes associated with positive
MORB precipitation anomalies corroborate the IA-LLJ regressions with an anticyclonic
gyre centered over the northeast of the IAS. That is to say, with an increase in
precipitation during March-April in the MORB region there is also a strengthening of the
moisture fluxes from the IAS, including a strengthening of the moisture fluxes associated
with the Caribbean LLJ.
We compared the IAS moisture flux anomalies related to the MORB precipitation
index with those related to the precipitation anomalies of the Great Plains during March-
April. To create the Great Plains index of March-April precipitation anomalies, we used
the area delimited by Ruiz-Barradas and Nigam (2005) as the area of the Great Plains
(i.e., 35-45°N, 90-100°W) (purple square in Fig. 9a). In contrast with the MORB index,
the Great Plains precipitation index for March-April shows precipitation anomalies
centered over 93°W and 38°N that are weaker than those of the MORB index. The
variability of the Great Plains index in March-April is centered in the southeast quadrant
of the Great Plains index area. Positive Great Plains precipitation anomalies in March-
April are related to stronger moisture fluxes from the Gulf of Mexico but not (statistically
1
305
310
315
320

significant) from the Caribbean Sea. The moisture flux anomalies extend from the
northern area of the central U.S. southward towards Mexico. The anticyclonic circulation
centered over the southeastern U.S. is less evident, while a stronger cyclonic flow
centered over the states of California and Arizona emerges. The zones of moisture flux
convergence are also different, as the stronger Great Plains index is associated with
moisture flux convergence over the north-central U.S. and moisture flux divergence to
the west of California and the Baja California peninsula. For both precipitation indexes,
the moisture fluxes from the Gulf of Mexico are important. However, the associated
circulation anomalies are distinct for each case. The Caribbean moisture fluxes are less
related to the circulation anomalies that affect the Great Plains region (used for the index)
in boreal spring.
The SLP and SST anomalies associated with the MORB precipitation index are
highly similar to those related to the IA-LLJ variability (Fig. 6). The SLP and SST
patterns (not presented) highlight significant anomalies in the midlatitudes of the North
Pacific. A strong positive zonal gradient of SLP from the region of Texas to the east of
the U.S. is an indication of the strengthening of the meridional component of the wind at
the lower levels. The region of the Gulf of Mexico and to the east of the U.S. also shows
warm anomalies associated with an increase in precipitation in the MORB region. These
warm anomalies are expected as the precipitation bands associated with storm tracks
move north during negative PNA and La Niña events; this results in decreased cloudiness
over the Gulf region and decreased heat loss from turbulent fluxes. In fact, the
teleconnection index most highly (anti-) correlated with the MORB index in March is the
PNA (-0.43). The PNA, however, is not significantly correlated with the MORB index in
1
325
330
335
340
345
15
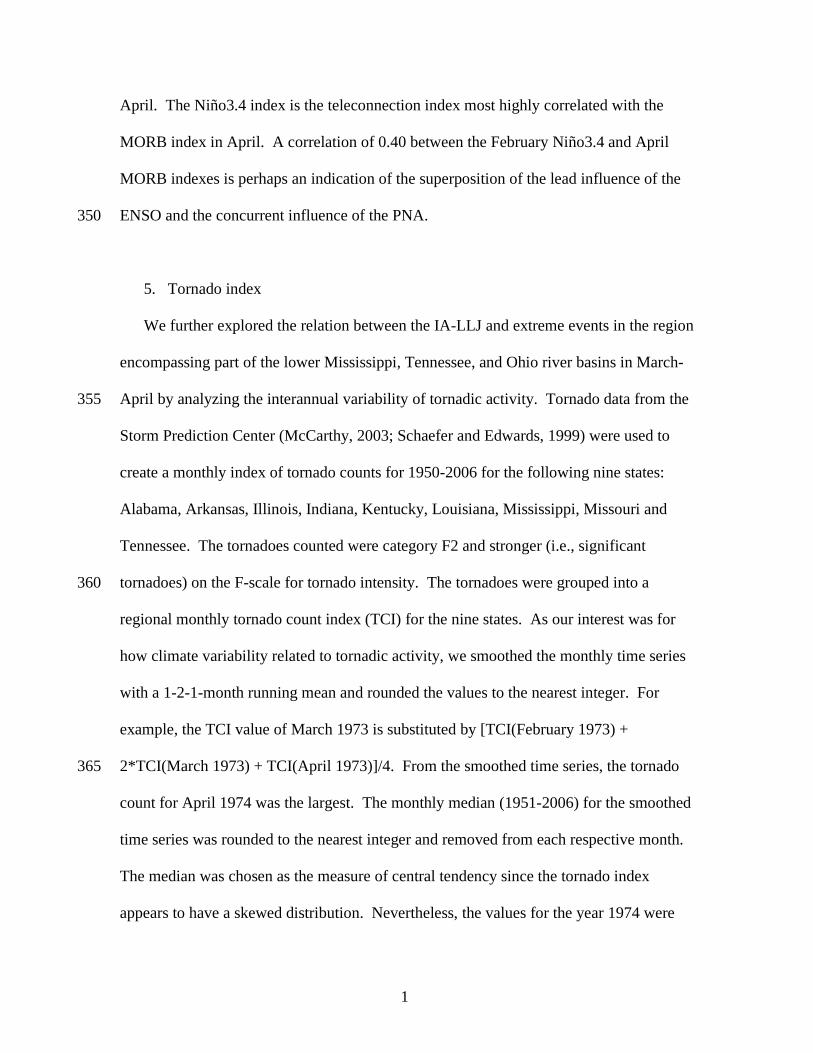
April. The Niño3.4 index is the teleconnection index most highly correlated with the
MORB index in April. A correlation of 0.40 between the February Niño3.4 and April
MORB indexes is perhaps an indication of the superposition of the lead influence of the
ENSO and the concurrent influence of the PNA.
5. Tornado index
We further explored the relation between the IA-LLJ and extreme events in the region
encompassing part of the lower Mississippi, Tennessee, and Ohio river basins in March-
April by analyzing the interannual variability of tornadic activity. Tornado data from the
Storm Prediction Center (McCarthy, 2003; Schaefer and Edwards, 1999) were used to
create a monthly index of tornado counts for 1950-2006 for the following nine states:
Alabama, Arkansas, Illinois, Indiana, Kentucky, Louisiana, Mississippi, Missouri and
Tennessee. The tornadoes counted were category F2 and stronger (i.e., significant
tornadoes) on the F-scale for tornado intensity. The tornadoes were grouped into a
regional monthly tornado count index (TCI) for the nine states. As our interest was for
how climate variability related to tornadic activity, we smoothed the monthly time series
with a 1-2-1-month running mean and rounded the values to the nearest integer. For
example, the TCI value of March 1973 is substituted by [TCI(February 1973) +
2*TCI(March 1973) + TCI(April 1973)]/4. From the smoothed time series, the tornado
count for April 1974 was the largest. The monthly median (1951-2006) for the smoothed
time series was rounded to the nearest integer and removed from each respective month.
The median was chosen as the measure of central tendency since the tornado index
appears to have a skewed distribution. Nevertheless, the values for the year 1974 were
1
350
355
360
365

not accounted for in the calculation of the median. They were excluded from the time
series because 1974 was the most extreme year and would have affected the statistics.
The smoothed March-April tornado time series with the median removed is shown in
Fig. 11. From the time series, one can identify tornado outbreaks in March 1961, March-
April 1963, April 1973, March 1976, April 1982, March 1997, and March-April 2006. A
few of these months have been identified by Verbout et al. (2006) within the group of the
top 25 tornado outbreaks between 1954 and 2003. The index also shows low-activity
periods for 1987-1994 and 2000-2005 (except perhaps April 2003), high-activity periods
in the 1960s and the mid-1970s, and normal-to-high activity for 1996-1998.
6. Climatic conditions related to the tornado index
We regressed the tornado index to the low-level (925-hPa) and mid-level (500-hPa)
winds and specific humidity. The regression coefficients (not presented) make evident
that the pattern of low-level winds associated with tornadic storms is very similar to the
pattern associated with the main mode of variability for the IA-LLJ (Fig. 5). An
intensification of the Gulf of Mexico southerly winds and the Caribbean easterly winds
occurred and, in the North Pacific, there were significant anomalies in the midlatitudes.
It is also evident that the low-level moisture flux from the Gulf of Mexico is important in
providing the moisture relevant to the development of tornadic storms in the region of
study. At the mid-levels (e.g., 500-hPa), the pattern of the winds was one with strong
anomalies coming from the southwest over the Rocky Mountains. Although there are
positive anomalies of specific humidity associated with these winds, they are of very low
strength.
1
370
375
380
385
390
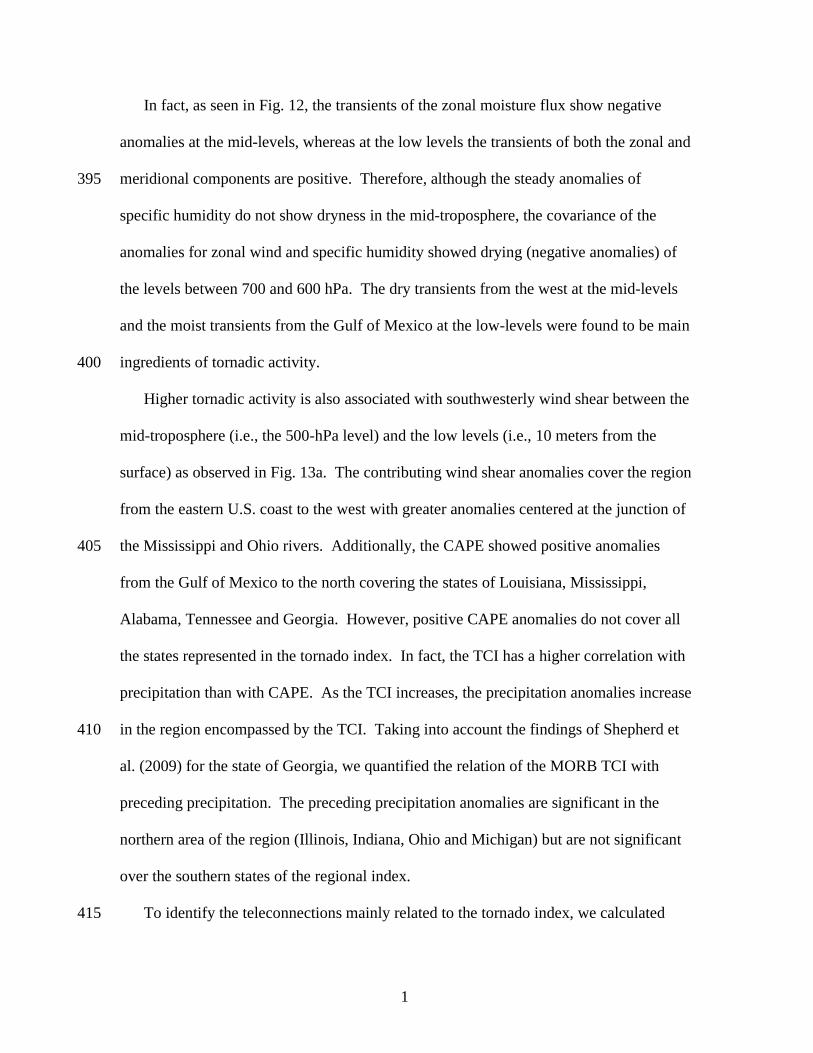
In fact, as seen in Fig. 12, the transients of the zonal moisture flux show negative
anomalies at the mid-levels, whereas at the low levels the transients of both the zonal and
meridional components are positive. Therefore, although the steady anomalies of
specific humidity do not show dryness in the mid-troposphere, the covariance of the
anomalies for zonal wind and specific humidity showed drying (negative anomalies) of
the levels between 700 and 600 hPa. The dry transients from the west at the mid-levels
and the moist transients from the Gulf of Mexico at the low-levels were found to be main
ingredients of tornadic activity.
Higher tornadic activity is also associated with southwesterly wind shear between the
mid-troposphere (i.e., the 500-hPa level) and the low levels (i.e., 10 meters from the
surface) as observed in Fig. 13a. The contributing wind shear anomalies cover the region
from the eastern U.S. coast to the west with greater anomalies centered at the junction of
the Mississippi and Ohio rivers. Additionally, the CAPE showed positive anomalies
from the Gulf of Mexico to the north covering the states of Louisiana, Mississippi,
Alabama, Tennessee and Georgia. However, positive CAPE anomalies do not cover all
the states represented in the tornado index. In fact, the TCI has a higher correlation with
precipitation than with CAPE. As the TCI increases, the precipitation anomalies increase
in the region encompassed by the TCI. Taking into account the findings of Shepherd et
al. (2009) for the state of Georgia, we quantified the relation of the MORB TCI with
preceding precipitation. The preceding precipitation anomalies are significant in the
northern area of the region (Illinois, Indiana, Ohio and Michigan) but are not significant
over the southern states of the regional index.
To identify the teleconnections mainly related to the tornado index, we calculated
1
395
400
405
410
415
rank (Spearman) correlations between the tornado index and the following teleconnection
indexes: NAO, PNA, PDO, and Niño3.4. Rank correlation was used as a non-parametric
measure of correlation which does not assume a specific frequency distribution of the
variables. Table 2 shows the dominant correlation with the teleconnection indexes and
the dominant correlation with the Niño3.4 index for the period 1950-2007. The
teleconnection having the highest correlation with the tornado index is the March PNA.
The correlation between the March PNA and the March (April) tornado index is -0.46
(-0.33). The March correlation drops to about -0.37 when a partial correlation is
performed controlling for the PDO and the Niño3.4 indexes. Therefore, part of the
correlation with the PNA is due to the relation between the PNA and the PDO (and
Niño3.4). Similarly, the April tornado index has a higher correlation with the March
PNA (-0.33) and a significant correlation with the April NAO (-0.29).
The SLP and SST anomalies associated with the tornado index (Fig. 14) confirm the
relation between the tornado index and the teleconnection indexes. The midlatitude
North Pacific shows a weakening of the Aleutian low, corresponding to a negative PNA
as was also observed with the incidence of excess MORB precipitation and southerly
(easterly) wind anomalies over the Gulf of Mexico (Caribbean) (Fig. 5). The equatorial
Pacific shows cool SST anomalies, and the midlatitude Pacific shows a SST anomaly
pattern akin to the PDO. In the Gulf of Mexico and along the west coast of the U.S., the
SLP anomalies have a positive zonal gradient and warm SST anomalies. In the
Caribbean Sea and most of the North Atlantic, the SST anomalies are cool.
7. Summary and conclusions
1
420
425
430
435

The IA-LLJ forms a corridor that transports moisture into North America from the
Gulf of Mexico and the Caribbean Sea. However, the focus of previous studies has been
limited to understanding the winter and summer IAS moisture transport. The objectives
of this study were to diagnose the dynamics of the IA-LLJ in boreal spring, its remote
forcings, and its impacts.
We found that in recent decades (1980s to mid-2000s) the Caribbean and Gulf of
Mexico low-level winds have been highly correlated during March-April. The variability
of the IAS 925-hPa wind anomalies in March and April was analyzed here by principal
component analysis (PCA) using data for 1958-2001. The PCA reveals a main mode of
variability in which the climatological 925-hPa wind weakens or intensifies in unison,
indicating a fluctuation of the IA-LLJ and its moisture transport into the U.S. east of the
Rocky Mountains. The main teleconnection associated with the IA-LLJ variability is the
PNA. Prediction of the IA-LLJ variability may, therefore, be promising given that
Hamill et al (2006) found the PNA to be one of the three most predictable patterns with a
10-day lead.
The strengthening of the IA-LLJ increases the source of moisture from the IAS,
having a positive impact on the precipitation in the Mississippi, Tennessee, and Ohio
rivers basins. This moisture influx at low levels not only impacts the precipitation but
also the tornadic activity in the region centered at the junction of the Ohio and
Mississippi rivers. A regional index of tornado count (TCI) variability was constructed
and found to have similar influences as those factors affecting the IA-LLJ variability.
Other associated factors that influenced the TCI variability were: 1) wet transients of
zonal and meridional moisture fluxes at the low levels; 2) dry transients of zonal moisture
2
440
445
450
455
460
20

fluxes at the levels between 600 and 700 hPa; 3) southwesterly wind shear between the
500-hPa winds and 10-m winds; 4) positive CAPE anomalies over the southeastern gulf
states; and 5) positive precipitation anomalies. Yet, the relation of tornadic activity in
this region with preceding precipitation is unclear; although Shepherd et al. (2009) found
that springtime tornadic activity for the state of Georgia had a tendency to be lower when
drought conditions persisted in the preceding fall and winter.
The variability of the three indexes developed for this study (i.e., IA-LLJ index,
precipitation index, and tornado index) has a strong relationship with the variability of the
PNA and the PDO. Based on our analyses, we conclude that the negative phase of the
PNA during boreal spring is related to an intensification of the IA-LLJ, which provides
greater moisture to the region of the Mississippi and Ohio river basins, leading to
increased precipitation and greater tornadic activity. The significant relation with the
PDO is also evident in the decadal shift of the three indexes in the late 1970s, consistent
with the behavior observed herein. That is to say, the weakening of the springtime IA-
LLJ during the 1980s and 1990s led to weaker moisture influx from the IAS, thereby
manifesting as a decadal shift (a decrease) in precipitation and tornadic activity in the
region of the Mississippi and Ohio river basins for the same period.
In this study, we have presented evidence that the IA-LLJ (and its associated moisture
fluxes) is one dynamic feature by which the PNA, the PDO, and ENSO influence
precipitation and tornado variability in the region of the lower Mississippi, Tennessee,
and Ohio river basins. This dynamic feature is important with respect to seasonal
hydrological and tornadic activity forecasts.
2
465
470
475
480

Acknowledgements
This research was carried out in part under the auspices of the Cooperative Institute for
Marine and Atmospheric Studies (CIMAS), a cooperative institute of the University of
Miami and the National Oceanic and Atmospheric Administration, cooperative
agreement #NA17RJ1226. This work was also supported by base funding of NOAA's
Atlantic Oceanographic and Meteorological Laboratory (AOML). The findings and
conclusions in this report are those of the author(s) and do not necessarily represent the
views of the funding agency. We thank the reviewers' comments and suggestions. Gail
Derr gave some editorial comments. The ERA-40 data used in this study were provided
by ECMWF and NCAR.
2
485
490
495
500
505

References
Amador JA (2008) The Intra-Americas Sea low-level jet: Overview and future research.
In: Trends and directions in climate research: Ann NY Acad Sci 1146:153-188.
Barnston AG, Livezey RE (1987) Classification, seasonality and persistence of low-
frequency atmospheric circulation patterns. Mon Wea Rev 115: 1083–1126.
Berbery EH, Rasmusson EM (1999) Mississippi moisture budgets on regional scales.
Mon Wea Rev 127: 2654-2673.
Bosilovich MG, Schubert SD (2002) Water vapor tracers as diagnostics of the regional
hydrological cycle. J Hydrometeor 3: 149-165.
Brooks HE, Doswell III CA, Kay MP (2003a) Climatological estimates of local daily
tornado probability for the United States. Wea Forecasting 18: 626–640.
Brooks HE, Lee JW, Craven JP (2003b) The spatial distribution of severe thunderstorm
and tornado environments from global reanalysis data. Atmos Res 67–68: 73–94.
Coleman JSM, Rogers JC (2003) Ohio River Valley winter moisture conditions
associated with the Pacific-North American teleconnection pattern. J Clim 16:
969-981.
Cook AR, Schaefer JT (2008) The relation of El Niño-Southern Oscillation (ENSO) to
winter tornado outbreaks. Mon Wea Rev 136: 3121-3137.
Doswell III CA, Brooks HE, Dotzek N (2009) On the implementation of the enhanced
Fujita scale in the USA. Atmos Res 93: 554-563.
Eichler T, Higgins W (2006) Climatology and ENSO-related variability of North
American extratropical cyclone activity. J Clim 19: 2076-2093.
Enfield DB, Mayer DA (1997) Tropical Atlantic sea surface temperature variability and
2
510
515
520
525
530

its relation to El Niño-Southern Oscillation. J Geophys Res 102: 929-945.
Feldstein SB (2002) Fundamental mechanisms of the growth and decay of the PNA
teleconnection pattern. Q J R Meteorol Soc 128: 775-796.
Hamill TM, Whitaker JS, Mullen SL (2006) Reforecasts: An important dataset for
improving weather predictions. Bull Amer Meteor Soc 87: 33–46.
Helfand HM, Schubert SD (1995) Climatology of the simulated Great-Plains low-level
jet and its contribution to the continental moisture budget of the United-States. J Clim
8: 784-806.
Kalnay E, Kanamitsu M, Kistler R, Collins W, Deaven D, Gandin L, Iredell M, Saha S,
White G, Woollen J, Zhu Y, Leetmaa A, Reynolds R, Chelliah M, Ebisuzaki W,
Higgins W, Janowiak J, Mo K, Ropelewski C, Wang J, Jenne R, Joseph D (1996) The
NCEP/NCAR 40-Year Reanalysis Project. Bull Amer Meteor Soc 77: 437–471.
Mantua NJ, Hare SR (2002) The Pacific Decadal Oscillation. J Oceanogr 58: 35-44.
McCabe G, Palecki MA, Betancourt JL (2004) Pacific and Atlantic Ocean influences on
multidecadal drought frequency in the United States. Proc Natl Acad Sci 101:
4136-4141.
McCarthy DW (2003) NWS tornado surveys and the impact on the national tornado
database. Preprints, First Symposium on F-scale and Severe Weather Damage
Assessment, Long Beach, CA, Amer. Meteor. Soc., CD-ROM, 3.2.
Mesinger F et al (2006) North American Regional Reanalysis. Bull Amer Meteor Soc 87:
343-360.
Mestas-Nuñez AM, Zhang C, Enfield DB (2005) Uncertainties in estimating moisture
fluxes over the Intra-Americas Sea. J Hydrometeor 6: 696–709.
2
535
540
545
550
Mestas-Nuñez AM, Enfield DB, Zhang C (2007) Water vapor fluxes over the Intra-
Americas Sea: Seasonal and interannual variability and associations with rainfall. J
Clim 20: 1910-1922.
Miller AJ, Cayan DR, Barnett TP, Graham NE, Oberhuber JM (1994) The 1976-1977
climate shift of the Pacific Ocean. Oceanogr 7: 21-26.
Muñoz E, Busalacchi AJ, Nigam S, Ruiz-Baradas A (2008) Winter and summer structure
of the Caribbean Low-Level Jet. J Clim 21: 1260-1276.
Muñoz E, Wang C, Enfield D (2009) The Intra-Americas Sea springtime surface
temperature anomaly dipole as fingerprint of remote influences. J Clim, in press.
Nigam S (2003) Teleconnections. In: Holton JR, Pyle JA & Curry JA (eds) Encyclopedia
of atmospheric sciences. Elsevier Academic Press, London, pp 2243-2269.
Rasmusson EM (1967) Atmospheric water vapor transport and the water balance of
North America: Part I. Characteristics of the water vapor flux field. Mon Wea Rev
95: 403-426.
Roger JC, Coleman JSM (2003) Interactions between the Atlantic Multidecadal
Oscillation, El Niño/La Niña, and the PNA in winter Mississippi Valley stream flow.
Geophys Res Lett. Doi:10.1029/2003GL017216.
Ruiz-Barradas A, Nigam S (2005) Warm-season rainfall variability over the US Great
Plains in observations, NCEP and ERA-40 reanalyses, and NCAR and NASA
atmospheric model simulations J Clim 18: 1808-1829.
Schaefer JT, Edwards R (1999) The SPC Tornado/Severe Thunderstorm Database.
Preprints, 11th Conf. Applied Climatology, Dallas.
Shepherd M, Niyogi D, Mote TL (2009) A seasonal-scale climatological analysis
2
555
560
565
570
575
25
correlating spring tornadic activity with antecedent fall-winter drought in the
southeastern United States. Environ Res Lett 4: 024012 doi:
10.1088/1748-9326/4/2/024012.
Smith TM, Reynolds RW, Peterson TC, Lawrimore J (2008) Improvements to NOAA's
Historical Merged Land-Ocean Surface Temperature Analysis (1880-2006). J Clim
21: 2283-2296.
Ting MF, Wang HL (2006) The role of the North American topography on the
maintenance of the Great Plains summer low-level jet. J Atmos Sci 63: 1056-1068.
Trapp RJ, Tessendorf SA, Godfrey ES, Brooks HE (2005) Tornadoes from squall lines
and bow echoes. Part I: Climatological distribution. Wea Forecasting 20: 23-34.
Uppala SM et al (2005) The ERA-40 re-analysis. Q J R Meteorol Soc 131: 2961-3012.
Verbout SM, Brooks HE, Leslie LM, Schultz DM (2006) Evolution of the U.S. tornado
database: 1954-2003. Wea Forecast 21:86-93
Wallace JM, Gutzler DS (1981) Teleconnections in the geopotential height field during
the Northern Hemisphere winter. Mon Wea Rev 109: 784-812.
Weaver S, Nigam S (2008) Variability of the Great Plains Low-Level Jet: Large-scale
circulation context and hydroclimate impacts. J Clim 20: 1532-1551.
Willmott CJ, Matsuura K (2007) Terrestrial Precipitation: 1900-2006 Gridded Monthly
Time Series,
http://climate.geog.udel.edu/~climate/html_pages/Global_ts_2007/README.global.
p_ts_2007.html. Accessed 2008
Wilks DS (2006) Principal Component (EOF) Analysis. In: Statistical methods in the
atmospheric sciences, 2nd edn. Elsevier Academic Press, London, pp 463-508.
2
580
585
590
595
600

Figures
Fig. 1 Annual mean of the 925-hPa wind speed (m/s; shades) and direction (vectors) from NARR (top) and ERA-40 (bottom) data. The base period is for 1979-2001. The reference arrow is 10 m/s. The regional domain of the NARR is distinguished by the white areas on the lower sections of the top panel
2
605
610
615
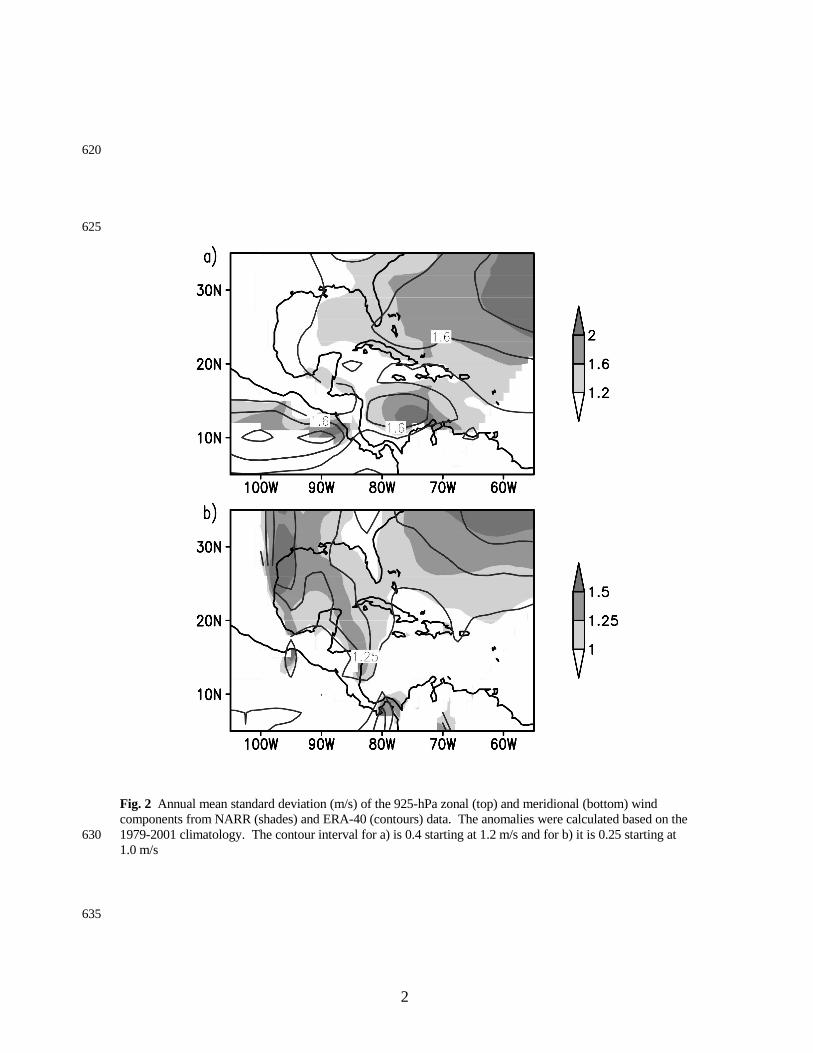
Fig. 2 Annual mean standard deviation (m/s) of the 925-hPa zonal (top) and meridional (bottom) wind components from NARR (shades) and ERA-40 (contours) data. The anomalies were calculated based on the 1979-2001 climatology. The contour interval for a) is 0.4 starting at 1.2 m/s and for b) it is 0.25 starting at 1.0 m/s
2
620
625
630
635
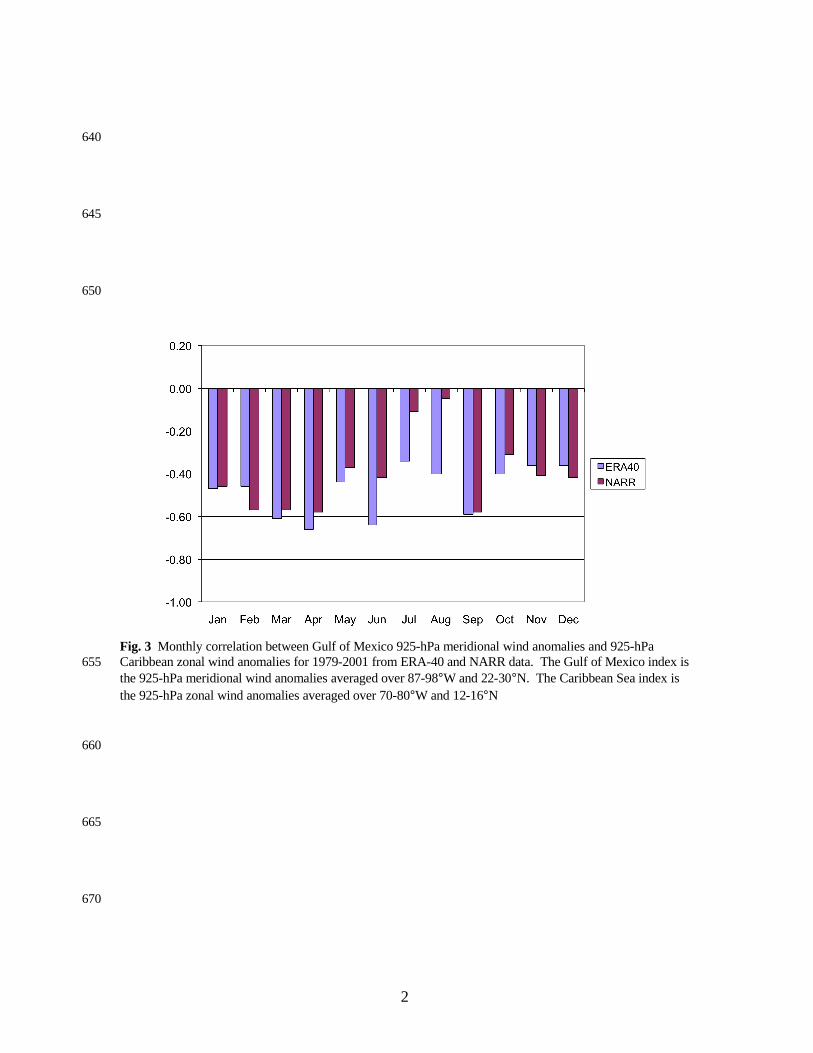
Fig. 3 Monthly correlation between Gulf of Mexico 925-hPa meridional wind anomalies and 925-hPa Caribbean zonal wind anomalies for 1979-2001 from ERA-40 and NARR data. The Gulf of Mexico index is the 925-hPa meridional wind anomalies averaged over 87-98°W and 22-30°N. The Caribbean Sea index is the 925-hPa zonal wind anomalies averaged over 70-80°W and 12-16°N
2
640
645
650
655
660
665
670

Fig. 4 (a) Mask applied to the meridional and zonal components of the 925-hPa wind from ERA-40 data. The gridboxes with the number 1 were used for the PCA. (b) Combined EOF1 of the March-April zonal and meridional 925-hPa wind anomalies for the IAS region. (c) The corresponding principal component (PC1)
3
675
680
685
690
695
700
30
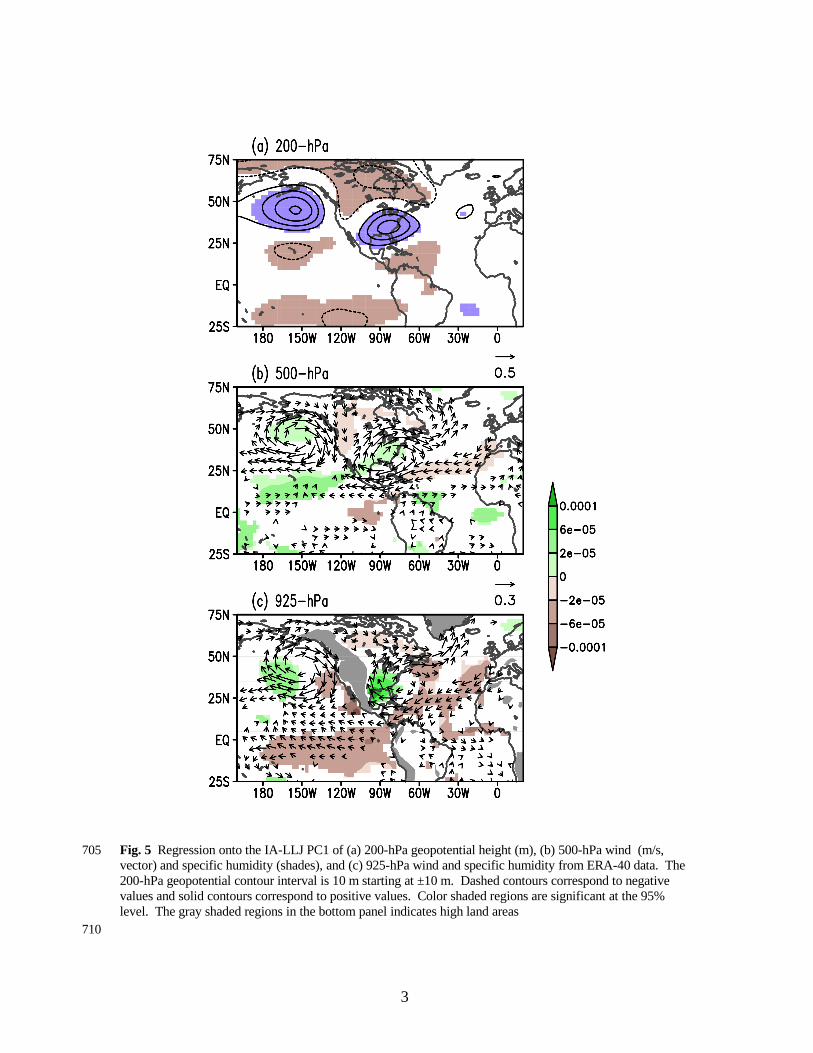
Fig. 5 Regression onto the IA-LLJ PC1 of (a) 200-hPa geopotential height (m), (b) 500-hPa wind (m/s, vector) and specific humidity (shades), and (c) 925-hPa wind and specific humidity from ERA-40 data. The 200-hPa geopotential contour interval is 10 m starting at ±10 m. Dashed contours correspond to negative values and solid contours correspond to positive values. Color shaded regions are significant at the 95% level. The gray shaded regions in the bottom panel indicates high land areas
3
705
710

Fig. 6 Regression onto the IA-LLJ PC1 of (a) mean sea level pressure (MSLP) and (b) sea surface temperature (SST) anomalies. The MSLP contour interval is 10 Pa starting at ±10 Pa. The SSTA contour interval is 0.015ºC starting at ±0.015ºC. Dashed contours indicate negative values and solid contours indicate positive values. Color-shaded regions are significant at the 95% level. MSLP data are from the ERA-40 data set and SST data are from ERSST.v3 data set
3
715
720
725
730

Fig. 7 Regression onto IA-LLJ PC1 for 1958-2001 of (a) 200-hPa wind divergence, (b) vertical pressure velocity, and (c) land precipitation. Dashed (solid) contours indicate values less (greater) than zero. Gray shaded areas are significant at the 95% level. The contour interval for divergence is 5.0 x 10⁻⁸ s-1 starting at ±5.0 x 10⁻⁸ s-1. For vertical pressure velocity, the contour interval is 5 x 10⁻⁴ Pa/s starting at ±5 x 10⁻⁴ Pa/s, and for precipitation it is 1 mm/month starting at ±1 mm/month. Wind divergence and vertical velocity data are from the ERA-40 data set, and precipitation data are from Willmott and Matsuura (2007)
3
740
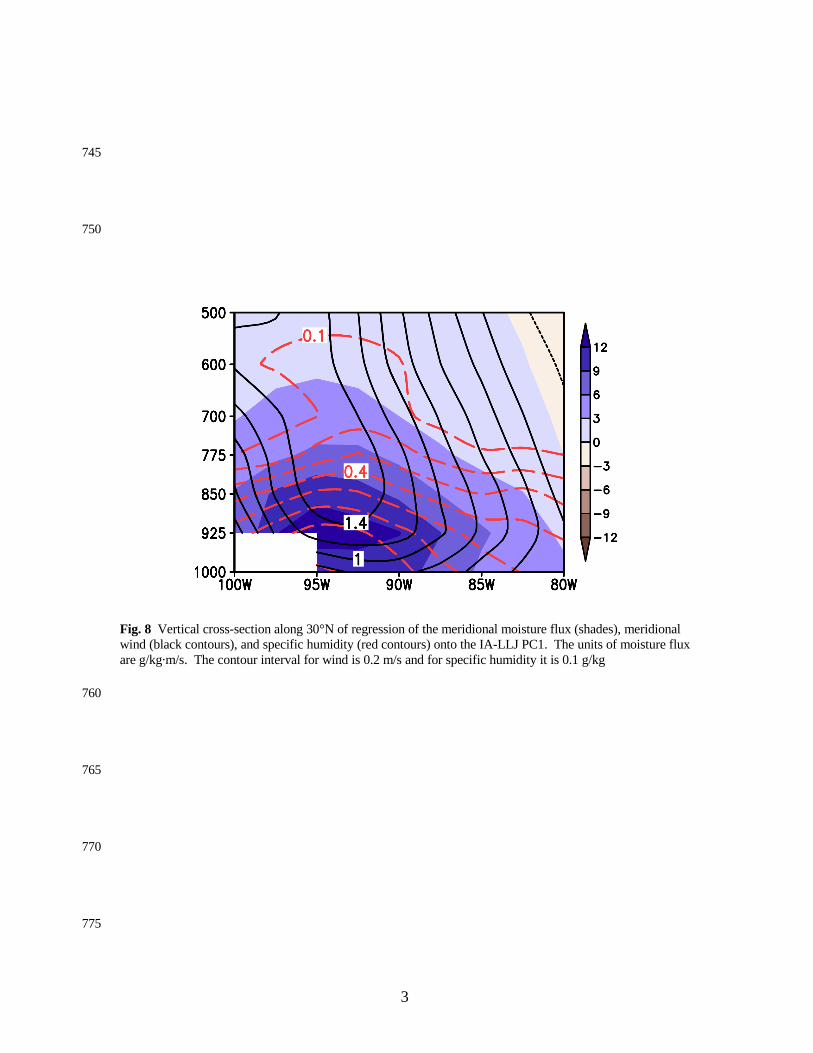
Fig. 8 Vertical cross-section along 30°N of regression of the meridional moisture flux (shades), meridional wind (black contours), and specific humidity (red contours) onto the IA-LLJ PC1. The units of moisture flux are g/kg·m/s. The contour interval for wind is 0.2 m/s and for specific humidity it is 0.1 g/kg
3
745
750
760
765
770
775
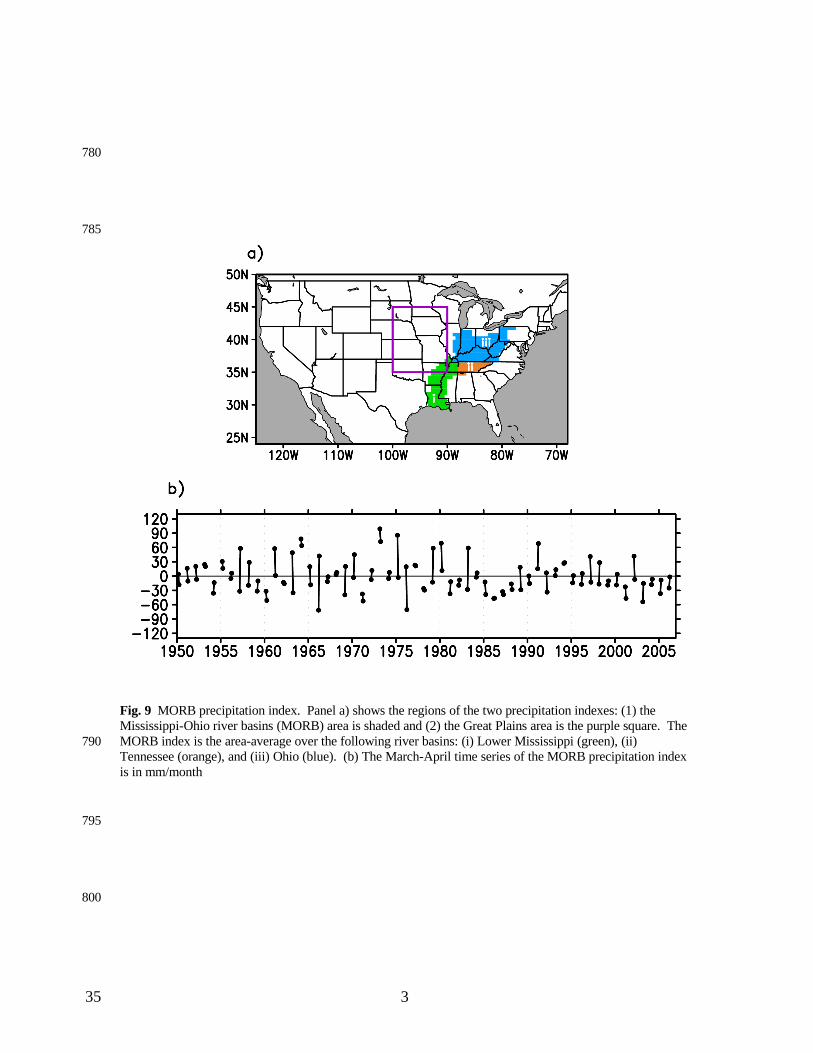
Fig. 9 MORB precipitation index. Panel a) shows the regions of the two precipitation indexes: (1) the Mississippi-Ohio river basins (MORB) area is shaded and (2) the Great Plains area is the purple square. The MORB index is the area-average over the following river basins: (i) Lower Mississippi (green), (ii) Tennessee (orange), and (iii) Ohio (blue). (b) The March-April time series of the MORB precipitation index is in mm/month
3
780
785
790
795
800
35

Fig. 10 Panel a) shows the regression of precipitation onto the MORB precipitation index. Panel b) shows the regression of moisture flux (vectors) and moisture flux divergence (color shades) onto the MORB precipitation index. The reference arrow is 30 kg·m-1·s-1. The moisture flux divergence is in units of kg·m-2·s-1. The period of the regressions is for 1958-2001. Only the statistically-significant regressions of the moisture flux divergence are color shaded. Arrows for which the magnitude of the correlation vector is greater than (less than) 0.29 are in black (gray). Panels c) and d) correspond to panels a) and b) but for the Great Plains index
3
805
810
815
820
825

Fig. 11 March-April monthly tornado count regional index (the year 1974 is not included)
3
830
835
840
845
850
855
860
865
870

Fig. 12 Zonal average from 100°W to 85°W for the regression of the March-April covariance of (a) meridional wind and specific humidity and (b) zonal wind and specific humidity onto the March-April tornado index (1950-2006). The contour interval of the meridional component is 2 x 10⁻⁴ m/s∙kg/kg starting at ±1 x 10⁻⁴. The contour interval for the zonal component is 1 x 10⁻⁴ starting at ±0.5 x 10⁻⁴ m/s∙kg/kg. Moisture transient data are from NCEP/NCAR Reanalysis data set
3
875
880
885
890
895
900
905
910
915

Fig. 13 (a) Wind shear (m/s) and (b) CAPE (J/kg) anomalies regressed onto the tornado index for 1979-2006. The wind shear is calculated as the vector difference between the 500-hPa and 10-m winds. The wind shear contour interval is 0.3 m/s starting at ±0.3 m/s. The CAPE contour interval is 10 J/kg starting at ±10 J/kg. Yellow shaded areas indicate positive values, and blue shaded areas indicate negative values
3
920
925
930
935
940
945
950
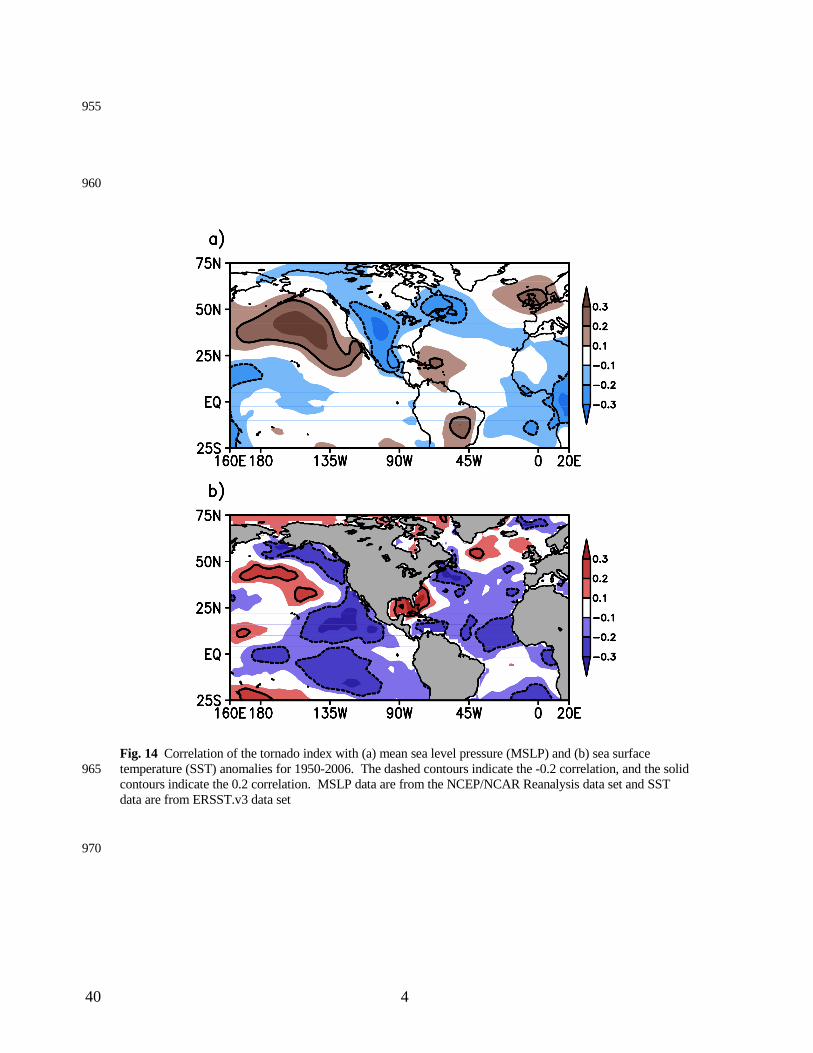
Fig. 14 Correlation of the tornado index with (a) mean sea level pressure (MSLP) and (b) sea surface temperature (SST) anomalies for 1950-2006. The dashed contours indicate the -0.2 correlation, and the solid contours indicate the 0.2 correlation. MSLP data are from the NCEP/NCAR Reanalysis data set and SST data are from ERSST.v3 data set
4
955
960
965
970
40

Tables
Table 1. Correlation of IA-LLJ PC1 and northern hemisphere teleconnection indexes for
1958-2001.
Teleconnection Correlation (r)North Atlantic Oscillation 0.02 East / North Pacific Pattern -0.15 Niño1+2 -0.34*
Niño 3.4 -0.35*
Pacific Decadal Oscillation -0.40*
Pacific North American pattern -0.61** Statistically significant at 95% level
4
975
980
985
990
995

Table 2. Rank correlation coefficients between the regional tornado index and
teleconnection indexes for 1950-2007. The first column indicates the month of the
tornado index used for the correlation. The second column presents the teleconnection,
month, and correlation (in parenthesis) of the highest correlation with the tornado index
in the respective month. The third column presents the month and correlation (in
parenthesis) of the highest correlation between the Niño3.4 (N34) index and the tornado
index in the respective row.
Tornado index Main teleconnection ENSO teleconnection
January PDO January (-0.43) N34 December (-0.31)
February PDO February (-0.41) N34 January (-0.39)
March PNA March (-0.46) N34 March (-0.41)
April PNA March (-0.33) N34 April (-0.20)
May NAO May (-0.21) N34 May (-0.13)
4
1000
1005