Embed Size (px)
Citation preview
Springvale Coal Services/Lamberts Gully Open Cut
2013 ANNUAL ENVIRONMENTAL MANAGEMENT REPORT
January 2013 – December 2013
TABLE OF CONTENTS 1 INTRODUCTION ............................................................................................................................ 1
1.1 Historical Mining ................................................................................................................... 1
1.2 Description of Operations .................................................................................................... 2
1.3 Submission of the Environmental Impact Statement ........................................................... 3
1.4 Current Consents, Leases and Licences ............................................................................. 3
1.4.1 .... Consents ................................................................................................................. 3
1.4.2 .... Leases ..................................................................................................................... 4
1.4.3 .... Mining Operations Plan (MOP) ............................................................................... 4
1.4.4 .... Licences .................................................................................................................. 5
1.5 Site Contacts ........................................................................................................................ 5
1.6 Actions Required at AEMR Review ..................................................................................... 5
1.7 Plans Required Under the Guidelines ................................................................................. 6
2 OPERATIONS DURING THE REPORTING PERIOD ................................................................... 7
2.1 Report on Proposed Activities .............................................................................................. 7
2.2 Exploration ........................................................................................................................... 7
2.3 Land Preparation.................................................................................................................. 8
2.4 Construction ......................................................................................................................... 8
2.5 Mining ................................................................................................................................... 8
2.6 Minerals Processing ............................................................................................................. 9
2.7 Waste Management ...........................................................................................................10
2.8 ROM and Coal Stockpiles ..................................................................................................10
2.9 Water Management ...........................................................................................................11
2.9.1 .... Potable Water Usage ............................................................................................12
2.9.2 .... Process Water .......................................................................................................12
2.9.3 .... Water Management System ..................................................................................12
2.9.4 .... Water Management Studies..................................................................................15
2.9.5 .... Sewage Treatment Systems .................................................................................16
2.10 Hazardous Materials Management ....................................................................................16
2.11 Other Infrastructure Management ......................................................................................16
3 ENVIRONMENTAL MANAGEMENT AND PERFORMANCE ....................................................17
3.1 Risk Management ..............................................................................................................17
3.2 Meteorological Monitoring ..................................................................................................18
3.2.1 .... Rainfall ..................................................................................................................18
3.2.2 .... Temperature Summary .........................................................................................19
3.3 Air Quality ...........................................................................................................................19
3.3.1 .... Air Quality Monitoring Program .............................................................................19
3.3.2 .... Air Quality Monitoring Program – Dust Results ....................................................20
3.3.3 .... Green House Gas Emissions ................................................................................21
3.4 Erosion and Sediment Control ...........................................................................................21
3.5 Surface Water Management ..............................................................................................22
3.5.1 .... Review of Water Quality Monitoring Results – LDP006 .......................................22
3.5.2 .... Review of Discharge Volume Monitoring Results .................................................24
3.5.3 .... Review of Surface Water Monitoring ....................................................................25
3.6 Groundwater Management ................................................................................................25
3.7 Contaminated / Polluted Land ............................................................................................26
3.8 Threatened Flora................................................................................................................26
3.9 Threatened Fauna .............................................................................................................27
3.10 Weeds ................................................................................................................................27
3.11 Operational Noise ..............................................................................................................28
3.11.1 .. Noise Monitoring Program ....................................................................................28
3.11.2 .. Noise Monitoring Compliance Assessment ..........................................................28
3.11.3 .. EIS Noise Assessment ..........................................................................................29
3.12 Blasting ..............................................................................................................................29
3.13 Visual Stray Light ...............................................................................................................29
3.14 Aboriginal Heritage ............................................................................................................29
3.15 European Heritage .............................................................................................................30
3.16 Spontaneous Combustion ..................................................................................................30
3.17 Bushfire ..............................................................................................................................30
3.18 Mine Subsidence................................................................................................................30
3.19 Methane Drainage/Ventilation ............................................................................................31
3.20 Public Safety ......................................................................................................................31
3.21 Other Issues and Risks ......................................................................................................31
3.22 Summary of Compliance ....................................................................................................31
4 COMMUNITY RELATIONS .........................................................................................................32
4.1 Environmental Complaints .................................................................................................32
4.2 Community Liaison ............................................................................................................32
5 REHABILITATION .......................................................................................................................33
5.1 Buildings .............................................................................................................................33
5.2 Rehabilitation of Disturbed Land ........................................................................................33
5.3 Other Infrastructure ............................................................................................................33
5.4 Rehabilitation Trials and Research ....................................................................................34
5.5 Rehabilitation Summary .....................................................................................................39
6 ACTIVITIES PROPOSED IN THE NEXT AEMR PERIOD ..........................................................41
TABLES Table 1.1: Consents for Coal Services/Lamberts Gully .......................................................................... 4 Table 1.2: Status of Leases at Coal Services/Lamberts Gully ................................................................ 4 Table 1.3: Actions/ Comments regarding 2012 AEMR ........................................................................... 6 Table 1.4: Plans Required for Coal Services/Lamberts Gully under the AEMR Guidelines .................. 6 Table 2.1: Summary of the Progress of Activities Proposed for 2013 ................................................... 7 Table 2.2: Lamberts Gully ROM Coal Production .................................................................................. 9 Table 2.3: Lamberts Gully Production and Waste Summary in 2013 .................................................... 9 Table 2.4: 2013 Minerals Processing Summary..................................................................................... 9 Table 2.5: Waste Management Summary ............................................................................................ 10
Table 2.6: Stockpiled Coal at Coal Services at the end of 2013 .......................................................... 10 Table 2.7: Stored Water at Coal Services/Lamberts Gully in 2013 ...................................................... 11 Table 2.8: Main storage dams at Coal Services/Lamberts Gully .......................................................... 14 Table 3.1: Environmental Risk Identification for Coal Services/Lamberts Gully .................................. 17 Table 3.2: 2013 Rainfall and Wet Day Data (mm) ................................................................................ 18 Table 3.3: 2013 Wind Data Summary ................................................................................................... 19 Table 3.4: 2013 Temperature Summary at 10m ................................................................................... 19 Table 3.5: Depositional Dust: Long Term Impact Assessment Criteria ................................................ 20 Table 3.6: High Volume Air Sampler (HVAS) Particulate Matter: Long Term Impact Assessment
Criteria .................................................................................................................................. 20 Table 3.7: HVAS Particulate Matter: Short Term Impact Assessment Criteria ..................................... 20 Table 3.8: LDP006 and LDP007 Discharge Limits ................................................................................ 22 Table 3.9: Water Quality Monitoring Requirements for LDP006 and LDP007 ...................................... 22 Table 3.10: Ambient water quality monitoring for LDP006 during the reporting period ........................ 23
Table 3.11: Comparison of Annual Discharge Volumes from LDP006 from 2011 to 2013 ................... 25 Table 3.12: Comparison of Annual Average Water Quality Monitoring Results at LPDP006 ............... 25 Table 3.13: Summary of Risk Rankings from Phase 1 Study (2013) ................................................... 26 Table 3.14: Noise Impact Assessment Criteria .................................................................................... 28 Table 5.1: Landscape Function Analysis (2013) – Coal Services/Lamberts Gully .............................. 34
Table 5.2: Rehabilitation Summary ...................................................................................................... 39 Table 5.3: Maintenance Activities on Rehabilitated Land ..................................................................... 40
FIGURES Figure 1: Rehabilitation Monitoring Locations – Coal Services/Lamberts Gully ................................... 35 Figure 2: Comparison of Soil Surface Condition Indices 2010-2013 (Rehabilitation Transects) – Coal
Services/Lamberts Gully ...................................................................................................... 36 Figure 3: Comparison of Soil Surface Condition Indices 2010-2013 (Analogue Transects) – Coal
Services/Lamberts Gully ...................................................................................................... 37
PHOTOS Photo 1: Stockpile Area at Coal Services ................................................................................................ 2 Photo 2: New Screener at Coal Services ................................................................................................ 8 Photo 3: Coal Services ROM Stockpile ................................................................................................. 11 Photo 4: The Main Sediment Pond at Coal Services ............................................................................ 12 Photo 5: Construction of dirty water drain at Coal Services .................................................................. 13 Photo 6: Construction of clean water drain at Coal Services/Lamberts Gully ....................................... 13 Photo 7: Several piezometers were installed at Coal Services/Lamberts Gully in 2013....................... 13 Photo 8: Drainage line at Coal Services/Lamberts Gully was reshaped and stabilised in 2013 ........... 21 Photo 9: Rehabilitation Monitoring Location at Coal Services .............................................................. 39
APPENDICES Appendix 1 – Environment Protection Licence 3607
Appendix 2 – Surface Water
Appendix 3 – Noise, Air and Meteorological Monitoring
Appendix 4 – Rehabilitation and Closure Costs
Appendix 5 – Plans
Appendix 6 – Figures
Coal Services/Lamberts Gully 2013 AEMR Page 1
1 INTRODUCTION
Springvale Pty Ltd (Springvale Coal), a subsidiary of Centennial Coal Limited, owns and operates the Springvale Colliery, Springvale Coal Services Washery (Coal Services) and the previously operating Lamberts Gully Open Cut Mine (Lamberts Gully).
For the 2013 Annual Environmental Management Report (AEMR), Coal Services has been included for the third time with Lamberts Gully as previously it was covered by the Springvale Colliery AEMR. The AEMR includes both Coal Services and Lamberts Gully (Coal Services/Lamberts Gully) to reduce the confusion generated by the common Environment Protection Licence (EPL 3607), leases and overlapping consents covering essentially the same land area.
This AEMR relates solely to the reporting period 1 January 2013 to 31 December 2013.
The Reject Emplacement Area (REA), the co-disposal area, Energy Australia’s (prior to September 2013 owned by Delta Electricity) ash emplacement, and Council’s waste disposal activities will extend well beyond the life of the Lamberts Gully open cut. Access to the REA will remain open for the remaining life of the Washery and/or the Springvale Colliery. The REA will remain the responsibility of Coal Services for both management and rehabilitation.
Coal Services/Lamberts Gully continues to consult with the Lithgow City Council (LCC) and Energy Australia regarding access to both the Council Waste Disposal Facility and Ash Emplacement Area. The LCC owned landfill area is subject to a separate development consent. The area has been partly fenced and is the responsibility of the LCC. Energy Australia commenced construction of a new ash emplacement facility in 2013, which is located on Energy Australia owned land to the east of the existing ash emplacement.
During the reporting period there was no coal produced from open cut mining at the site and there are currently no plans to recommence mining at Lamberts Gully.
1.1 Historical Mining
Coal mining began at the Lamberts Gully site in 1942 under the name Big Spur. The site was later named Western Main. Below the open cut mine is an extensive series of underground workings which were part of the old Western Main Colliery, which mined the Lithgow Seam for over fifty years from the 1940’s to 1990’s (Brown, J 1989). Open cut mining has also occurred on the site since the 1940’s as an adjunct to the underground operations.
Between 1980 and 1994 the previous owners (Clutha Coal, then BP Coal, Novacoal Australia and Cypress/Samsung Joint Coal Venture) developed the following open cuts:
Bund Cut, Road Cut and Road Cut Extension– these were developed adjacent to the Castlereagh Highway and were designed to create both a bund wall and an adjacent void to allow backfilling with ash from Mount Piper Power Station.
Western Main Open Cut Extension – this extension mined the barrier between the underground workings and the previous bund cut.
Knoll Cut – this cut extended from Mudgee Road south towards the existing Washery and removed previous coal waste disposal areas which were causing acid leachate issues.
Coal Services/Lamberts Gully 2013 AEMR Page 2
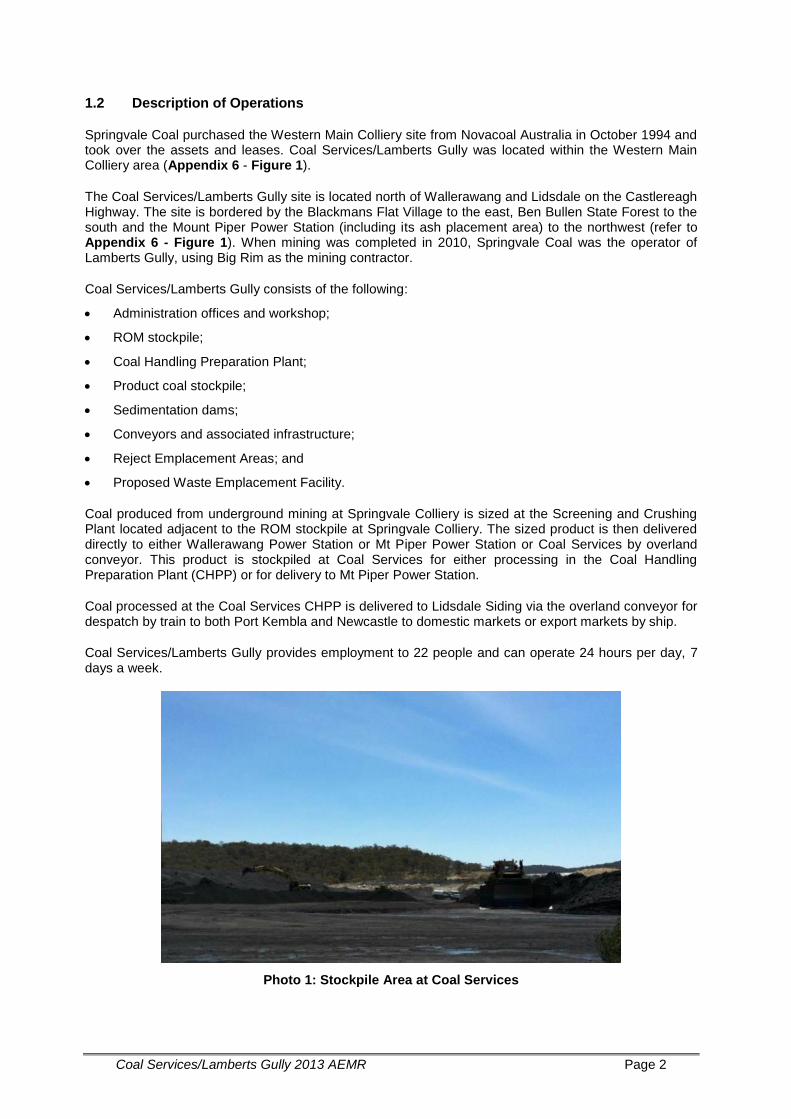
1.2 Description of Operations
Springvale Coal purchased the Western Main Colliery site from Novacoal Australia in October 1994 and took over the assets and leases. Coal Services/Lamberts Gully was located within the Western Main Colliery area (Appendix 6 - Figure 1).
The Coal Services/Lamberts Gully site is located north of Wallerawang and Lidsdale on the Castlereagh Highway. The site is bordered by the Blackmans Flat Village to the east, Ben Bullen State Forest to the south and the Mount Piper Power Station (including its ash placement area) to the northwest (refer to Appendix 6 - Figure 1). When mining was completed in 2010, Springvale Coal was the operator of Lamberts Gully, using Big Rim as the mining contractor.
Coal Services/Lamberts Gully consists of the following:
Administration offices and workshop;
ROM stockpile;
Coal Handling Preparation Plant;
Product coal stockpile;
Sedimentation dams;
Conveyors and associated infrastructure;
Reject Emplacement Areas; and
Proposed Waste Emplacement Facility.
Coal produced from underground mining at Springvale Colliery is sized at the Screening and Crushing Plant located adjacent to the ROM stockpile at Springvale Colliery. The sized product is then delivered directly to either Wallerawang Power Station or Mt Piper Power Station or Coal Services by overland conveyor. This product is stockpiled at Coal Services for either processing in the Coal Handling Preparation Plant (CHPP) or for delivery to Mt Piper Power Station.
Coal processed at the Coal Services CHPP is delivered to Lidsdale Siding via the overland conveyor for despatch by train to both Port Kembla and Newcastle to domestic markets or export markets by ship.
Coal Services/Lamberts Gully provides employment to 22 people and can operate 24 hours per day, 7 days a week.
Photo 1: Stockpile Area at Coal Services
Coal Services/Lamberts Gully 2013 AEMR Page 3
1.3 Submission of the Environmental Impact Statement
An Environmental Impact Statement (EIS) for the Western Coal Services Project was submitted to the Department of Planning and Infrastructure (DP&I) in July 2013 (RPS 2013). This has now been referred to as the July 2013 EIS.
Springvale Coal is seeking approval to:
Upgrade the existing facilities and infrastructure within the Coal Services site to provide a total processing capacity of up to 7 Mtpa;
Construct processing infrastructure including additional conveyors and transfer points and other coal handling requirements to cater for the upgraded Washery facility within the existing disturbance footprint of the Coal Services site;
Extend and enlarge an existing reject emplacement area on the Coal Services site to enable sufficient reject disposal capacity for a 25 year life;
Increase the utilisation of the return side of the existing Overland Conveyor system to enable up to 6.3 Mtpa of coal to be delivered to Lidsdale Siding;
Construct a private Link Haul Road between the Coal Services site and the existing private haul road from Angus Place Colliery to Mt Piper Power Station;
Improve the current water management systems on the Coal Services site by better separation of clean and dirty water streams prior to either reuse or discharge off site;
Integrate the existing approved transport and processing of coal at Springvale Coal Mine and Angus Place Colliery into the one consent;
Integrate the remaining rehabilitation, monitoring, water management and reporting requirements associated with the Lamberts Gully Open Cut Mine, which occupies the Coal Services site; and
Allow continued use of all existing approved infrastructure, facilities and activities associated with the transport and processing of coal from each mine gate and the point of delivery to the Coal Services site. This infrastructure includes the existing conveyors, private haul roads, Kerosene Vale Stockpile Area, REA, services, access roads, car parks and buildings.
1.4 Current Consents, Leases and Licences
1.4.1 Consents
A Development Application (DA) for an extension to Lamberts Gully was submitted to the then Department of Planning (DoP), now DP&I on 20 October 2005, accompanied by a Statement of Environmental Effects. The Project Approval (06-0017) was granted by the Acting Minister of Planning on 12 May 2006.
On 5 December 2007, a submission was made to the then DoP for a modification to the project approval
to allow for the removal of 100,000 tonnes of coal from the ramp area to be constructed on behalf of LCC for a future waste disposal facility. The modification was granted on the 3
September 2008 and
work has been completed on the ramp area. Refer to Table 1.1 for a summary of consents.
As outlined in Section 1.3 above, the Western Coal Services Project EIS was submitted in July 2013 and is currently awaiting determination. Table 1.1 outlines the consents for Coal Services/Lamberts Gully.
Coal Services/Lamberts Gully 2013 AEMR Page 4
Table 1.1: Consents for Coal Services/Lamberts Gully
Planning System Consent
Number
Description Consent
Date
Status of
Consent
Lamberts Gully DA
(Council) 110/98
Open Cut Mine Lot 501, DP 825541,
Castlereagh Highway Lidsdale
(referred to as Lamberts Gully Open
Cut)
14/9/1998 Enacted
Lamberts Gully Coal
Mine
(Minister for
Planning)
06-0017
Lamberts Gully Mine Additional
Operations Within Existing Mining
Leases
12/5/2006 Enacted
Lamberts Gully Coal
Mine (Minister for
Planning)
06-0017
Modification to Project Approval
allowing ramp construction for
Lithgow City Council
3/9/2008 Enacted
Development
Consent issued by
the Minister for
Planning, on behalf of
Greater Lithgow City
Council, in July 1992
11/92
DA 11/92 permits:
Construction and operation of an
underground coal mine; and
Construction and operation of an
overland conveyor and coal
washery.
27/7/1992 Enacted
1.4.2 Leases
Open Cut Mining is permissible in ML1448 (Lamberts Gully). The Coal Services/Lamberts Gully site and Overland Conveyor are on land within CCL 733, ML 1352, and MPL 314. Table 1.2 displays the current status of leases.
Table 1.2: Status of Leases at Coal Services/Lamberts Gully
Coal Services / Lamberts Gully Expiry Date Area (Ha)
Consolidated Coal Lease 733 03/07/2027 723.5
Mineral Lease 204 * 26/05/2012 10.12
Mining Lease 1319 04/07/2014 5.69
Mineral Lease 564 01/05/2025 19.75
Coal Lease 394 **26/05/2013 17
Coal Lease 361 16/07/2032 14.26
Mining Lease 1352 22/06/2015 8.16
Mining Lease 1448 31/05/2020 95.16
Private Land Lease 133 10/08/2024 16.51
* The renewal application was submitted to DTIRIS-RE in May 2011. Springvale Coal has not received a renewal offer yet as the Department has been in the process of drafting new lease conditions.
**The renewal application has been submitted and the final approval by the Minister is pending.
1.4.3 Mining Operations Plan (MOP)
Coal Services/Lamberts Gully operates under the MOP submitted in May 2008 covering the period from April 2008 to April 2015. The MOP was approved by the then Department of Primary Industries (now Department of Trade and Investment, Regional Infrastructure and Services – Resources and Energy – DTIRIS-RE) on 9 July 2008.
Coal Services/Lamberts Gully 2013 AEMR Page 5
1.4.4 Licences
Springvale Coal holds Environment Protection Licence (EPL) 3607 under the Protection of the Environment Operations Act 1997 (Appendix 1). The licence has an anniversary date of the 1
st of
January and allows for 8 discharge points and 5 dust monitoring points, covering both the Springvale Colliery and Coal Services/Lamberts Gully site. For Coal Services/Lamberts Gully there are two licensed discharge points (LDP006 and LDP007).
There was an EPL variation during the AEMR reporting period (3 May 2013). There were several changes to the EPL including:
Condition 3.1 – removal of 10,000KL discharge limit for LDP006;
Condition M7.1 – removal of the requirement to monitor flow volume from LDP006. Coal Services/Lamberts Gully continue to monitor flow volume despite this condition being removed;
Section 8 – Pollution Reduction Program;
o Addition of condition U1 Sediment dam storage capacities;
o Addition of condition U2 Groundwater seepage interception system; and
o Addition of condition U3 Assessment of potential impacts of pollution at LDP006.
1.5 Site Contacts
The Coal Services/Lamberts Gully site contacts are:
Coal Distribution Manager - West: Mr Graeme Glazebrook, (02) 6355 9508, mob: 0438 501 611, or email [email protected].
Environment and Community Coordinator: Mr Rob Hunt, (02) 6355 9509, mob 0428 602 069, or email [email protected].
Environment and Community Officer: Martin Howe, (02) 6355 9509, or email [email protected].
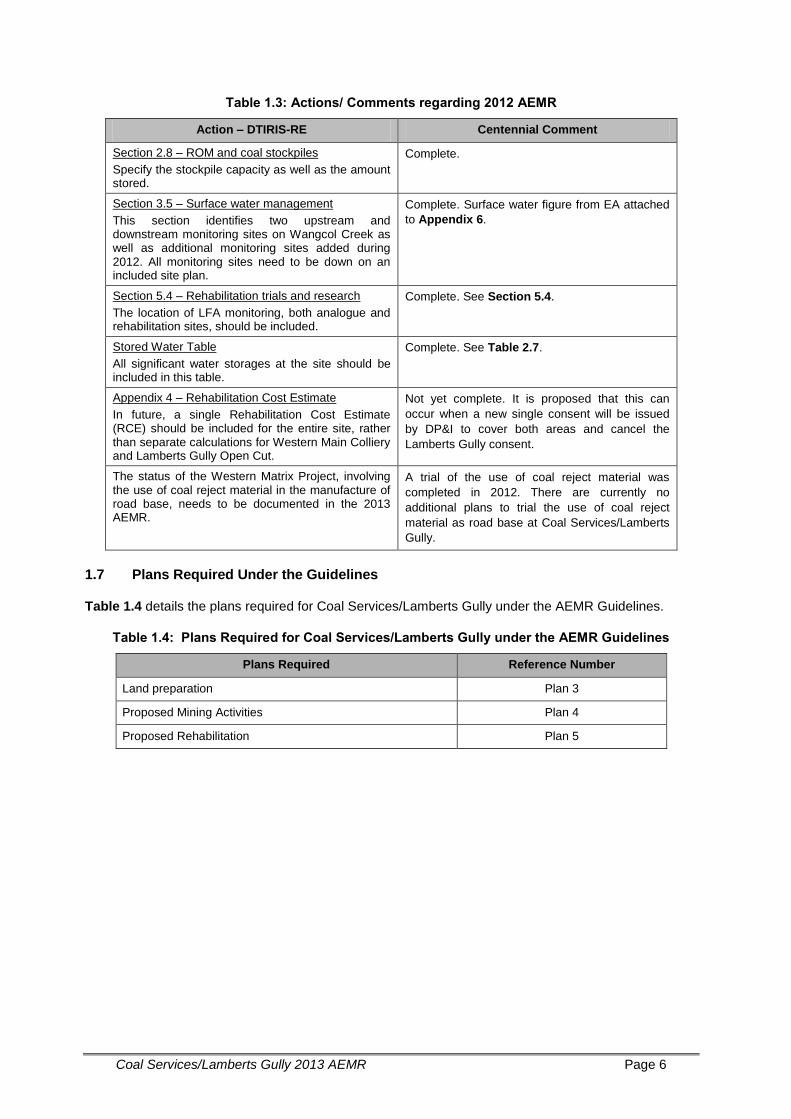
1.6 Actions Required at AEMR Review
DTIRIS-RE sent a letter dated 11 November 2013 accepting the 2012 AEMR. A meeting and site inspection was completed on 27 August 2013 with representatives from DTIRIS-RE, Centennial, Environment Protection Authority (EPA), Crown Lands Division and Lithgow City Council in attendance.
The letter dated 11 November 2013 outlined the following changes are required for the 2013 AEMR (see Table 1.3)
Coal Services/Lamberts Gully 2013 AEMR Page 6
Table 1.3: Actions/ Comments regarding 2012 AEMR
Action – DTIRIS-RE Centennial Comment
Section 2.8 – ROM and coal stockpiles
Specify the stockpile capacity as well as the amount stored.
Complete.
Section 3.5 – Surface water management
This section identifies two upstream and downstream monitoring sites on Wangcol Creek as well as additional monitoring sites added during 2012. All monitoring sites need to be down on an included site plan.
Complete. Surface water figure from EA attached
to Appendix 6.
Section 5.4 – Rehabilitation trials and research
The location of LFA monitoring, both analogue and rehabilitation sites, should be included.
Complete. See Section 5.4.
Stored Water Table
All significant water storages at the site should be included in this table.
Complete. See Table 2.7.
Appendix 4 – Rehabilitation Cost Estimate
In future, a single Rehabilitation Cost Estimate (RCE) should be included for the entire site, rather than separate calculations for Western Main Colliery and Lamberts Gully Open Cut.
Not yet complete. It is proposed that this can
occur when a new single consent will be issued
by DP&I to cover both areas and cancel the
Lamberts Gully consent.
The status of the Western Matrix Project, involving the use of coal reject material in the manufacture of road base, needs to be documented in the 2013 AEMR.
A trial of the use of coal reject material was
completed in 2012. There are currently no
additional plans to trial the use of coal reject
material as road base at Coal Services/Lamberts
Gully.
1.7 Plans Required Under the Guidelines
Table 1.4 details the plans required for Coal Services/Lamberts Gully under the AEMR Guidelines.
Table 1.4: Plans Required for Coal Services/Lamberts Gully under the AEMR Guidelines
Plans Required Reference Number
Land preparation Plan 3
Proposed Mining Activities Plan 4
Proposed Rehabilitation Plan 5
Coal Services/Lamberts Gully 2013 AEMR Page 7
2 OPERATIONS DURING THE REPORTING PERIOD
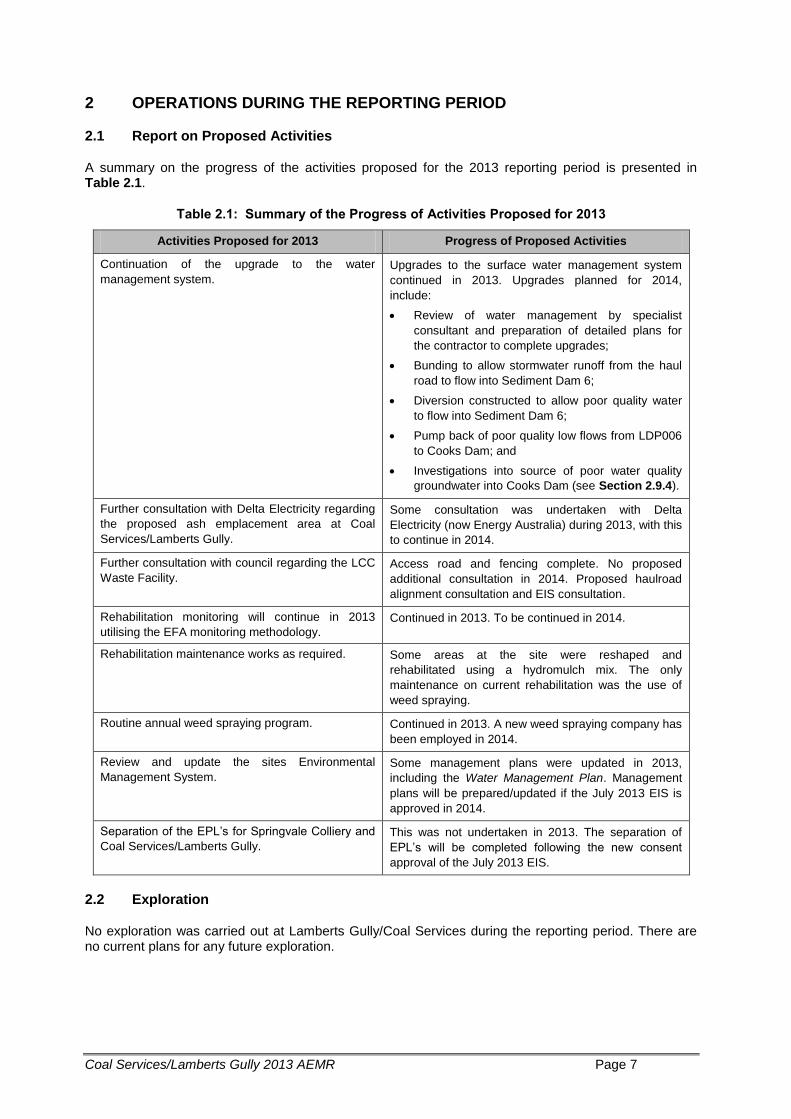
2.1 Report on Proposed Activities
A summary on the progress of the activities proposed for the 2013 reporting period is presented in Table 2.1.
Table 2.1: Summary of the Progress of Activities Proposed for 2013
Activities Proposed for 2013 Progress of Proposed Activities
Continuation of the upgrade to the water
management system.
Upgrades to the surface water management system
continued in 2013. Upgrades planned for 2014,
include:
Review of water management by specialist
consultant and preparation of detailed plans for
the contractor to complete upgrades;
Bunding to allow stormwater runoff from the haul
road to flow into Sediment Dam 6;
Diversion constructed to allow poor quality water
to flow into Sediment Dam 6;
Pump back of poor quality low flows from LDP006
to Cooks Dam; and
Investigations into source of poor water quality
groundwater into Cooks Dam (see Section 2.9.4).
Further consultation with Delta Electricity regarding
the proposed ash emplacement area at Coal
Services/Lamberts Gully.
Some consultation was undertaken with Delta
Electricity (now Energy Australia) during 2013, with this
to continue in 2014.
Further consultation with council regarding the LCC
Waste Facility.
Access road and fencing complete. No proposed
additional consultation in 2014. Proposed haulroad
alignment consultation and EIS consultation.
Rehabilitation monitoring will continue in 2013
utilising the EFA monitoring methodology.
Continued in 2013. To be continued in 2014.
Rehabilitation maintenance works as required. Some areas at the site were reshaped and
rehabilitated using a hydromulch mix. The only
maintenance on current rehabilitation was the use of
weed spraying.
Routine annual weed spraying program. Continued in 2013. A new weed spraying company has
been employed in 2014.
Review and update the sites Environmental
Management System.
Some management plans were updated in 2013,
including the Water Management Plan. Management
plans will be prepared/updated if the July 2013 EIS is
approved in 2014.
Separation of the EPL’s for Springvale Colliery and
Coal Services/Lamberts Gully.
This was not undertaken in 2013. The separation of
EPL’s will be completed following the new consent
approval of the July 2013 EIS.
2.2 Exploration
No exploration was carried out at Lamberts Gully/Coal Services during the reporting period. There are no current plans for any future exploration.
Coal Services/Lamberts Gully 2013 AEMR Page 8
2.3 Land Preparation
Land prepared for Coal Services/Lamberts Gully has been calculated as an area of approximately 80 hectares which is essentially comprised of areas involved with A Blocks, C Blocks, F Blocks, the perimeter of the REA and other miscellaneous areas.
There was no land preparation in the 2013 reporting period as mining had been completed in June 2010. Land preparation was completed by Energy Australia to construct a new ash emplacement facility with this being located in the Lamberts Gully/Coal Services consent area.
The 2010 Revised Mine Closure Plan outlines the final land use for A and B Blocks including a long term REA for Springvale. E Block is being utilised by Energy Australia for ash emplacement from their Mount Piper Power Station. The majority of areas outside A and B blocks are completely rehabilitated or in the process of rehabilitation. The Mine Closure Plan will be updated following the approval of the Western Coal Services Project which was submitted to the DP&I in July 2013.
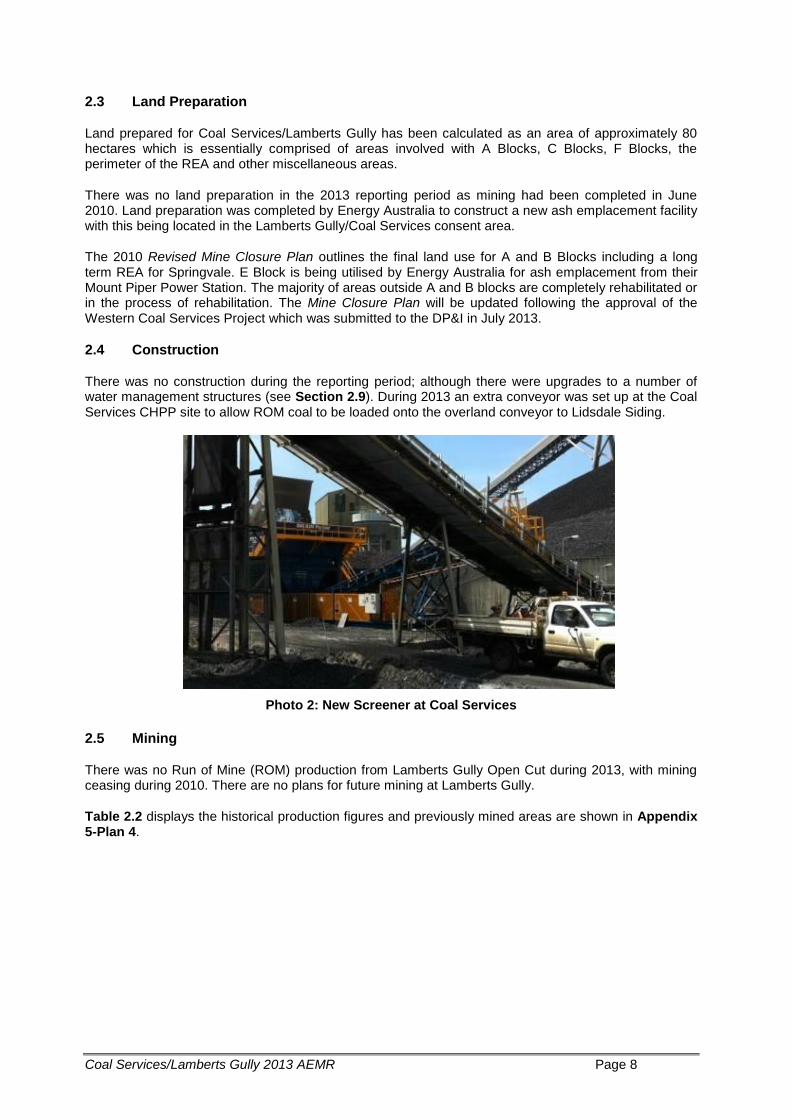
2.4 Construction
There was no construction during the reporting period; although there were upgrades to a number of water management structures (see Section 2.9). During 2013 an extra conveyor was set up at the Coal Services CHPP site to allow ROM coal to be loaded onto the overland conveyor to Lidsdale Siding.
Photo 2: New Screener at Coal Services
2.5 Mining
There was no Run of Mine (ROM) production from Lamberts Gully Open Cut during 2013, with mining ceasing during 2010. There are no plans for future mining at Lamberts Gully.
Table 2.2 displays the historical production figures and previously mined areas are shown in Appendix 5-Plan 4.
Coal Services/Lamberts Gully 2013 AEMR Page 9
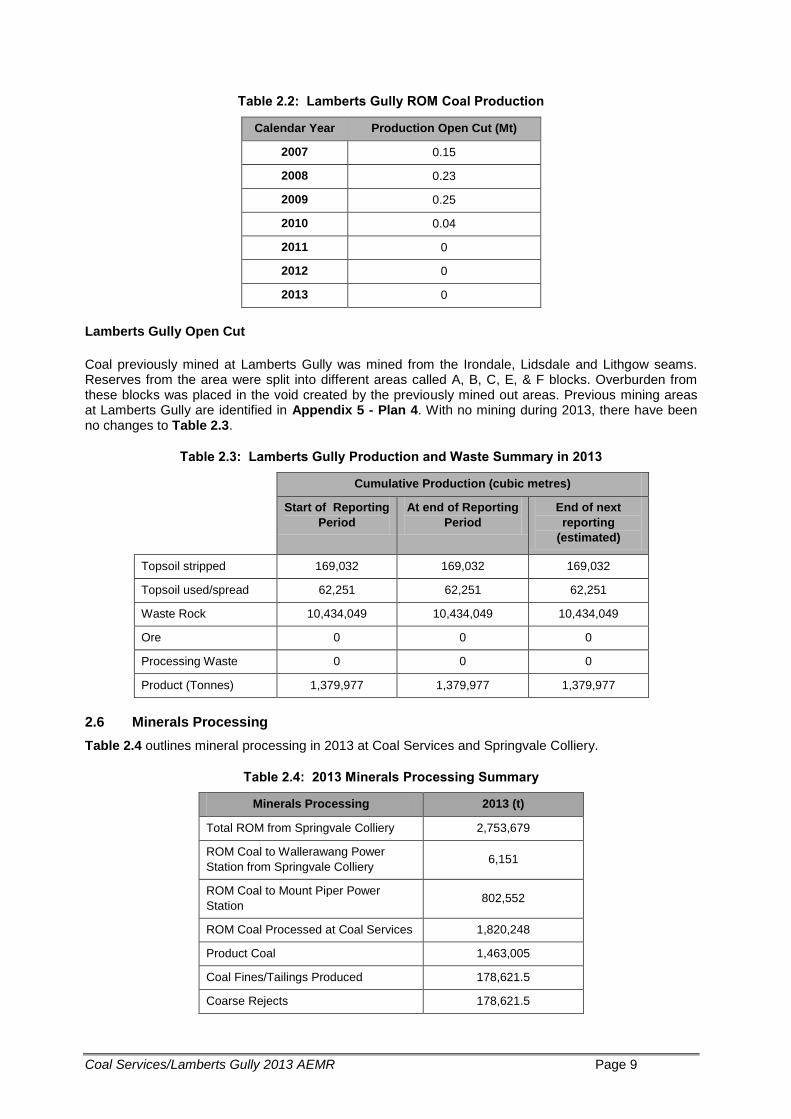
Table 2.2: Lamberts Gully ROM Coal Production
Calendar Year Production Open Cut (Mt)
2007 0.15
2008 0.23
2009 0.25
2010 0.04
2011 0
2012 0
2013 0
Lamberts Gully Open Cut
Coal previously mined at Lamberts Gully was mined from the Irondale, Lidsdale and Lithgow seams. Reserves from the area were split into different areas called A, B, C, E, & F blocks. Overburden from these blocks was placed in the void created by the previously mined out areas. Previous mining areas at Lamberts Gully are identified in Appendix 5 - Plan 4. With no mining during 2013, there have been no changes to Table 2.3.
Table 2.3: Lamberts Gully Production and Waste Summary in 2013
Cumulative Production (cubic metres)
Start of Reporting
Period
At end of Reporting
Period
End of next
reporting
(estimated)
Topsoil stripped 169,032 169,032 169,032
Topsoil used/spread 62,251 62,251 62,251
Waste Rock 10,434,049 10,434,049 10,434,049
Ore 0 0 0
Processing Waste 0 0 0
Product (Tonnes) 1,379,977 1,379,977 1,379,977
2.6 Minerals Processing
Table 2.4 outlines mineral processing in 2013 at Coal Services and Springvale Colliery.
Table 2.4: 2013 Minerals Processing Summary
Minerals Processing 2013 (t)
Total ROM from Springvale Colliery 2,753,679
ROM Coal to Wallerawang Power
Station from Springvale Colliery 6,151
ROM Coal to Mount Piper Power
Station 802,552
ROM Coal Processed at Coal Services 1,820,248
Product Coal 1,463,005
Coal Fines/Tailings Produced 178,621.5
Coarse Rejects 178,621.5
Coal Services/Lamberts Gully 2013 AEMR Page 10
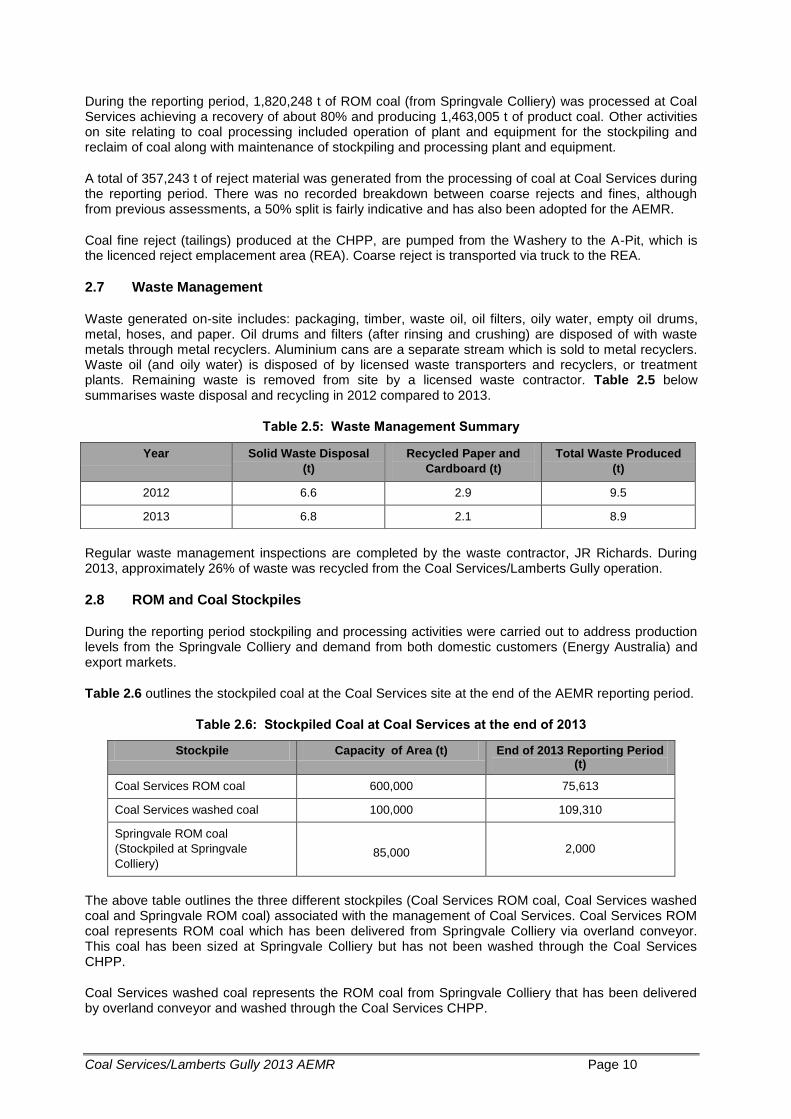
During the reporting period, 1,820,248 t of ROM coal (from Springvale Colliery) was processed at Coal Services achieving a recovery of about 80% and producing 1,463,005 t of product coal. Other activities on site relating to coal processing included operation of plant and equipment for the stockpiling and reclaim of coal along with maintenance of stockpiling and processing plant and equipment.
A total of 357,243 t of reject material was generated from the processing of coal at Coal Services during the reporting period. There was no recorded breakdown between coarse rejects and fines, although from previous assessments, a 50% split is fairly indicative and has also been adopted for the AEMR.
Coal fine reject (tailings) produced at the CHPP, are pumped from the Washery to the A-Pit, which is the licenced reject emplacement area (REA). Coarse reject is transported via truck to the REA.
2.7 Waste Management
Waste generated on-site includes: packaging, timber, waste oil, oil filters, oily water, empty oil drums, metal, hoses, and paper. Oil drums and filters (after rinsing and crushing) are disposed of with waste metals through metal recyclers. Aluminium cans are a separate stream which is sold to metal recyclers. Waste oil (and oily water) is disposed of by licensed waste transporters and recyclers, or treatment plants. Remaining waste is removed from site by a licensed waste contractor. Table 2.5 below summarises waste disposal and recycling in 2012 compared to 2013.
Table 2.5: Waste Management Summary
Regular waste management inspections are completed by the waste contractor, JR Richards. During 2013, approximately 26% of waste was recycled from the Coal Services/Lamberts Gully operation.
2.8 ROM and Coal Stockpiles
During the reporting period stockpiling and processing activities were carried out to address production levels from the Springvale Colliery and demand from both domestic customers (Energy Australia) and export markets.
Table 2.6 outlines the stockpiled coal at the Coal Services site at the end of the AEMR reporting period.
Table 2.6: Stockpiled Coal at Coal Services at the end of 2013
Stockpile Capacity of Area (t) End of 2013 Reporting Period (t)
Coal Services ROM coal 600,000 75,613
Coal Services washed coal 100,000 109,310
Springvale ROM coal
(Stockpiled at Springvale
Colliery)
85,000 2,000
The above table outlines the three different stockpiles (Coal Services ROM coal, Coal Services washed coal and Springvale ROM coal) associated with the management of Coal Services. Coal Services ROM coal represents ROM coal which has been delivered from Springvale Colliery via overland conveyor. This coal has been sized at Springvale Colliery but has not been washed through the Coal Services CHPP.
Coal Services washed coal represents the ROM coal from Springvale Colliery that has been delivered by overland conveyor and washed through the Coal Services CHPP.
Year Solid Waste Disposal
(t)
Recycled Paper and
Cardboard (t)
Total Waste Produced
(t)
2012 6.6 2.9 9.5
2013 6.8 2.1 8.9
Coal Services/Lamberts Gully 2013 AEMR Page 11
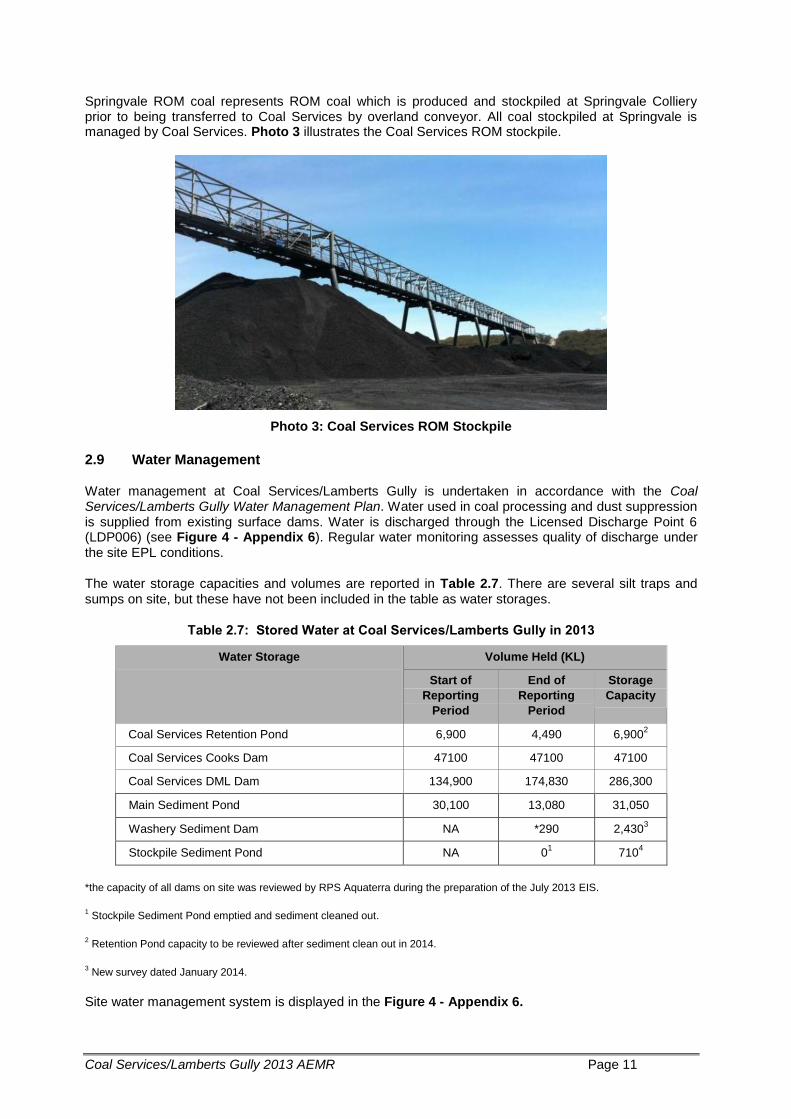
Springvale ROM coal represents ROM coal which is produced and stockpiled at Springvale Colliery prior to being transferred to Coal Services by overland conveyor. All coal stockpiled at Springvale is managed by Coal Services. Photo 3 illustrates the Coal Services ROM stockpile.
Photo 3: Coal Services ROM Stockpile
2.9 Water Management
Water management at Coal Services/Lamberts Gully is undertaken in accordance with the Coal Services/Lamberts Gully Water Management Plan. Water used in coal processing and dust suppression is supplied from existing surface dams. Water is discharged through the Licensed Discharge Point 6 (LDP006) (see Figure 4 - Appendix 6). Regular water monitoring assesses quality of discharge under the site EPL conditions.
The water storage capacities and volumes are reported in Table 2.7. There are several silt traps and sumps on site, but these have not been included in the table as water storages.
Table 2.7: Stored Water at Coal Services/Lamberts Gully in 2013
Water Storage Volume Held (KL)
Start of
Reporting
Period
End of
Reporting
Period
Storage
Capacity
Coal Services Retention Pond 6,900 4,490 6,9002
Coal Services Cooks Dam 47100 47100 47100
Coal Services DML Dam 134,900 174,830 286,300
Main Sediment Pond 30,100 13,080 31,050
Washery Sediment Dam NA *290 2,4303
Stockpile Sediment Pond NA 01 710
4
*the capacity of all dams on site was reviewed by RPS Aquaterra during the preparation of the July 2013 EIS.
1 Stockpile Sediment Pond emptied and sediment cleaned out.
2 Retention Pond capacity to be reviewed after sediment clean out in 2014.
3 New survey dated January 2014.
Site water management system is displayed in the Figure 4 - Appendix 6.
Coal Services/Lamberts Gully 2013 AEMR Page 12
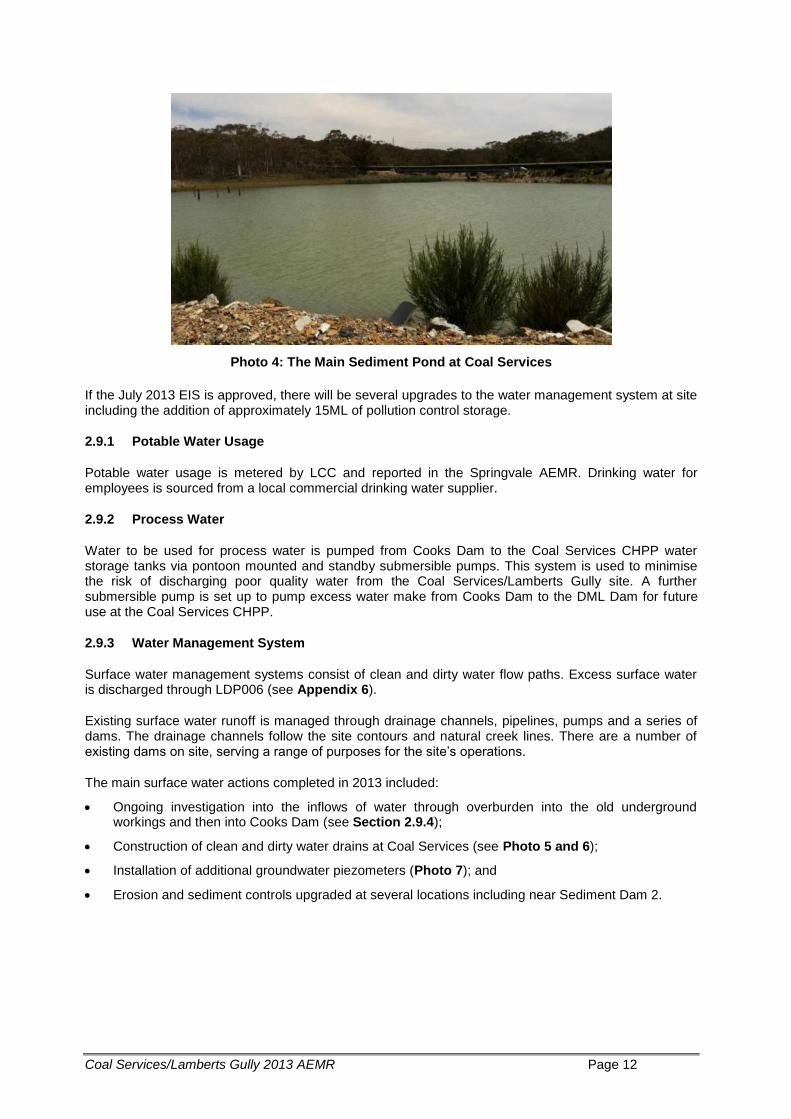
Photo 4: The Main Sediment Pond at Coal Services
If the July 2013 EIS is approved, there will be several upgrades to the water management system at site including the addition of approximately 15ML of pollution control storage.
2.9.1 Potable Water Usage
Potable water usage is metered by LCC and reported in the Springvale AEMR. Drinking water for employees is sourced from a local commercial drinking water supplier.
2.9.2 Process Water
Water to be used for process water is pumped from Cooks Dam to the Coal Services CHPP water storage tanks via pontoon mounted and standby submersible pumps. This system is used to minimise the risk of discharging poor quality water from the Coal Services/Lamberts Gully site. A further submersible pump is set up to pump excess water make from Cooks Dam to the DML Dam for future use at the Coal Services CHPP.
2.9.3 Water Management System
Surface water management systems consist of clean and dirty water flow paths. Excess surface water is discharged through LDP006 (see Appendix 6).
Existing surface water runoff is managed through drainage channels, pipelines, pumps and a series of dams. The drainage channels follow the site contours and natural creek lines. There are a number of existing dams on site, serving a range of purposes for the site’s operations.
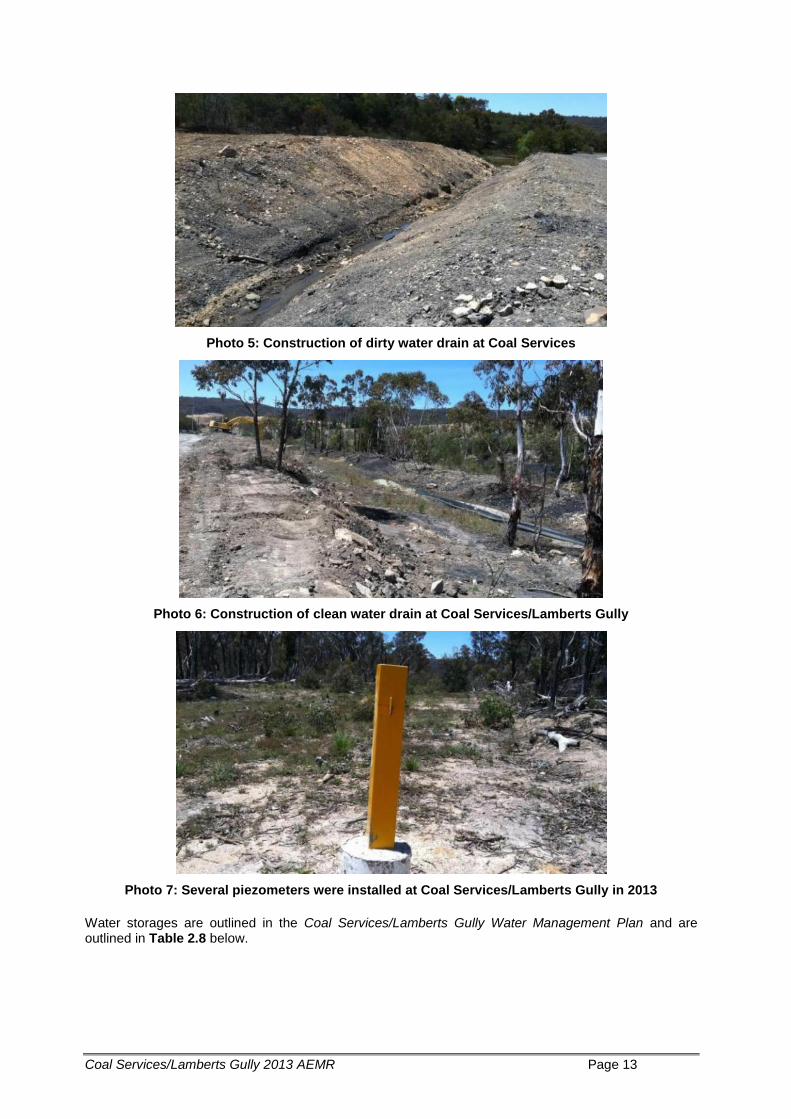
The main surface water actions completed in 2013 included:
Ongoing investigation into the inflows of water through overburden into the old underground workings and then into Cooks Dam (see Section 2.9.4);
Construction of clean and dirty water drains at Coal Services (see Photo 5 and 6);
Installation of additional groundwater piezometers (Photo 7); and
Erosion and sediment controls upgraded at several locations including near Sediment Dam 2.
Coal Services/Lamberts Gully 2013 AEMR Page 13
Photo 5: Construction of dirty water drain at Coal Services
Photo 6: Construction of clean water drain at Coal Services/Lamberts Gully
Photo 7: Several piezometers were installed at Coal Services/Lamberts Gully in 2013
Water storages are outlined in the Coal Services/Lamberts Gully Water Management Plan and are outlined in Table 2.8 below.
Coal Services/Lamberts Gully 2013 AEMR Page 14
Table 2.8: Main storage dams at Coal Services/Lamberts Gully
Dam
Name Function Inflow Outflow
DML
Dam
Water
retention
Receives surface runoff from
upstream and infiltration from
ground water. Main inflow from
pumping of Cooks Dam to
minimise discharge through
LDP006
Evaporation and seepage in to
Cooks Dam. In addition water can
be pumped to Cooks Dam when
required. There has been seepage
into the Cooks Dam since the area
was mined in the 1980’s/90’s.
Since the volume of seepage into
the Cooks Dam increased in 2013
there has been a requirement to
pump water from Cooks Dam to
the DML Dam.
Cooks
Dam
Water
retention
In addition to surface water runoff
from upstream catchment areas,
water is received from existing
coal seam and old workings.
Water is pumped from the Cooks
Dam to the washery tank and DML
Dam.
Cooks Dam overflows to Wangcol Creek.
Main
Sediment
Pond
Pollution
control
Surface runoff from upstream
rehabilitation areas and upstream
undisturbed Ben Bullen Forest
catchment.
Water overflows via concrete
spillway in times of extreme
rainfall. With normal storm events,
turbid water held, treated and
released via pipe and valve to
discharge point.
Retention
Pond
Final sediment
control prior to
discharging to
LDP006
Surface water runoff from
upstream catchment areas.
Water overflows from this dam to
the discharge point (LDP006).
Stockpile
Sediment
Pond
Pollution
control Surface run-off from coal stockpile area.
Water is transferred from the Stockpile Sediment Pond to the washery make up tank.
Washery
Sediment
Pond
Pollution
control and
water retention
Local surface runoff from Washery
area, overflow from the Washery
Clarifier and inflow from the
proposed new sediment pond.
It feeds the washery makeup tank.
A pipe directs all discharge to
Cooks Dam.
Coal Services/Lamberts Gully 2013 AEMR Page 15
2.9.4 Water Management Studies
Cooks Dam Investigation
A preliminary investigation report was completed by RPS Aquaterra in 2013 regarding inflows into Cooks Dam. Extra groundwater inflows result in the exceedance of pumping capacity to DML Dam, causing discharge to LDP006. Without pumping, Cooks Dam will discharge naturally. Upgrades to the site water management system will continue in 2014 in consultation with the EPA.
Several bores have been installed into the goafed mine area to enable the calculation of the volume of water that is held in storage. Close monitoring of the water level response to any rainfall events will enable the determination of the amount of infiltration/recharge that the underground workings are receiving. Potential water level decline within the underground in response to the ongoing discharge to Cooks Dam will also be able to be assessed.
In 2014 the following will be undertaken:
RPS Aquaterra to continue the study into the source and magnitude of inflows;
Consultation with the NSW Office of Water (NOW) and the EPA as required;
Quantification on the amount of water stored within the workings and the rate of recharge/infiltration to the workings;
Continued water testing;
Identify the possibility of offsite influences, notably the Mt Piper ash emplacement and drainage works;
Consider options for remediation measures to reduce the risk of continued seepage into Cooks Dam; and
Hydrodynamic Assessment and Reporting.
Pollution Studies and Reduction Programs
The following pollution studies and reduction programs are required by the EPL 3607.
U1 Sediment dam storage capacities
U1.1 The licensee must undertake works at the Centennial Coal Services site to ensure that the Main Sediment Dam, the Stockpile Sediment Pond and the Washery Sediment Dam have the capacity to store a 95th percentile (56mm) 5 day rainfall event.
These works must be completed by 9 May 2014.
The Stockpile Sediment Pond was desilted during 2013 to create additional storage capacity. All three dams were surveyed for storage capacity in January 2014.
U2 Groundwater seepage interception system
U2.1 The licensee must design and implement a groundwater seepage recovery system at the Coal Services portion of the premises such that all major or significant groundwater seepages that would otherwise flow in to the site's dirty water system and discharge through LD6 are captured and recycled within the closed system of the coal washery's water supply.
The licensee must design and implement the groundwater seepage interception system by 31 July 2013.
A sump and low flow pump have been installed below Cooks Dam adjacent to the spillway to mitigate the issue of groundwater seepage. An additional sump and low flow pump have been installed immediately upstream of LDP006 to minimise low flow poor water quality to discharge through LDP006.
Coal Services/Lamberts Gully 2013 AEMR Page 16
U3 Assessment of potential impacts of pollutants at LDP6
U3.1 At Point 6 (LDP6) the licensee must monitor (by sampling and obtaining results by laboratory analysis) the concentration of each pollutant specified in Column 1 in the table below. The licensee must use the sampling method, units of measure and sample at the frequency as specified in the columns opposite each pollutant. The licensee shall continue to monitor for these pollutants at the upstream and downstream locations within Wangcol Creek as previously nominated.
Following the collection of additional monitoring results up until 31 December 2013, the licensee must undertake an assessment of the pollutants detected in water discharged from the site via LDP6 in accordance with ANZECC water quality guidelines and provide this assessment to the Bathurst Regional Office of the EPA by 28 February 2014.
A report has been completed and will be sent to the EPA by 28 February 2014.
2.9.5 Sewage Treatment Systems
The site sewage management system consists of two Biocycle units. Sewage from the demountable buildings is connected to these systems and treated effluent is sprayed on surrounding land. Maintenance of the Bio-cycle unit is contracted to a local plumbing service provider.
2.10 Hazardous Materials Management
A Safety Data Sheet (SDS) register is maintained at Coal Services/Lamberts Gully. The main potentially hazardous materials at site are flocculent and oil and grease.
Mining ceased during 2010 so there is no requirement for blasting. With the completion of open cut mining, the diesel and waste oil tanks associated with this process have been removed from site. Big Rim coal stockpile equipment (front-end loader, dozer etc.) used on the site is refuelled by mobile tanker.
Environmental Spill Kits are located around Coal Services/Lamberts Gully. These are replenished as required.
2.11 Other Infrastructure Management
There are no other identified major infrastructure management issues apart from those mentioned in this document.
Coal Services/Lamberts Gully 2013 AEMR Page 17
3 ENVIRONMENTAL MANAGEMENT AND PERFORMANCE
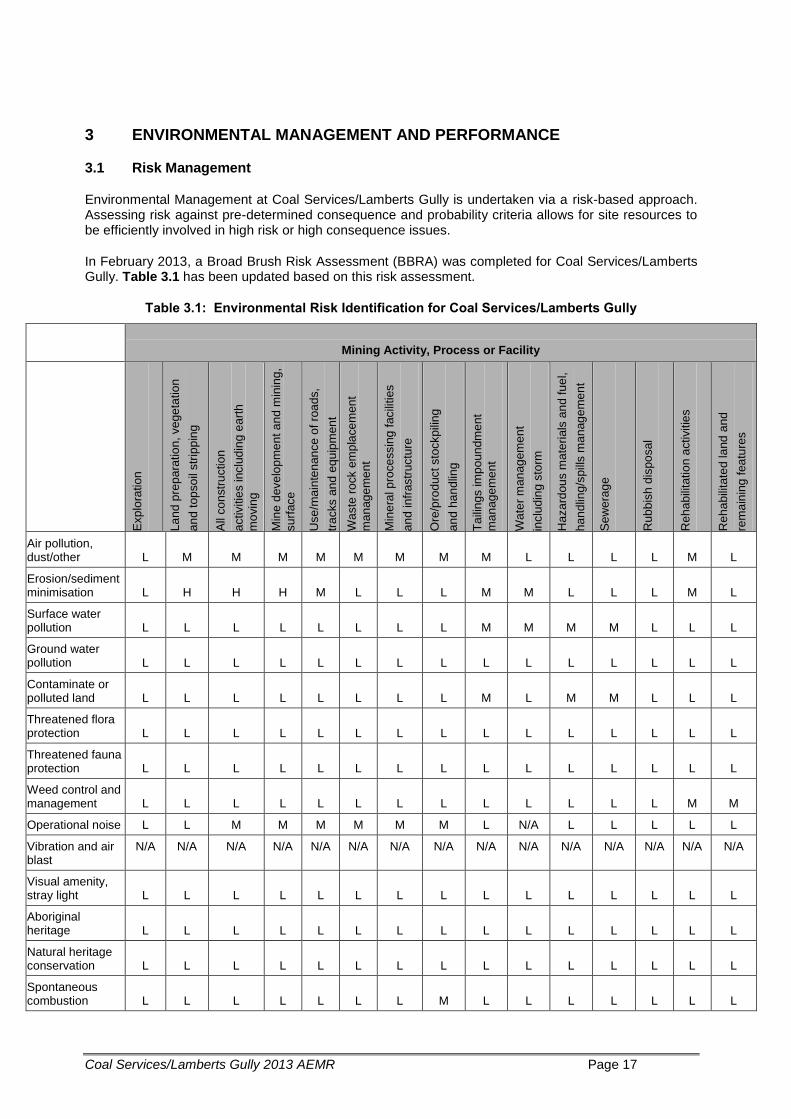
3.1 Risk Management
Environmental Management at Coal Services/Lamberts Gully is undertaken via a risk-based approach. Assessing risk against pre-determined consequence and probability criteria allows for site resources to be efficiently involved in high risk or high consequence issues.
In February 2013, a Broad Brush Risk Assessment (BBRA) was completed for Coal Services/Lamberts Gully. Table 3.1 has been updated based on this risk assessment.
Table 3.1: Environmental Risk Identification for Coal Services/Lamberts Gully
Mining Activity, Process or Facility
Exp
lora
tion
La
nd
pre
pa
ratio
n, ve
ge
tatio
n
an
d t
op
so
il str
ipp
ing
All
co
nstr
uctio
n
activitie
s inclu
din
g e
art
h
mo
vin
g
Min
e d
eve
lop
me
nt a
nd
min
ing
,
su
rface
an
d u
nd
erg
roun
d
Use
/ma
inte
nan
ce
of
roa
ds,
tra
cks a
nd
eq
uip
men
t
Wa
ste
ro
ck e
mp
lace
men
t
ma
nag
em
en
t
Min
era
l p
roce
ssin
g f
acili
ties
an
d in
frastr
uctu
re
Ore
/pro
duct sto
ckpili
ng
an
d h
an
dlin
g
Ta
ilin
gs im
po
un
dm
en
t
ma
nag
em
en
t
Wa
ter
ma
nag
em
en
t
inclu
din
g s
torm
eve
nt
con
tin
ge
ncie
s
Haza
rdou
s m
ate
rials
an
d fu
el,
ha
nd
ling/s
pill
s m
an
ag
em
en
t
Se
wera
ge
Rub
bis
h d
ispo
sal
Reh
ab
ilita
tio
n a
ctivitie
s
Reh
ab
ilita
ted
la
nd
and
rem
ain
ing
fea
ture
s
Air pollution, dust/other L M M M M M M M M L L L L M L
Erosion/sediment minimisation L H H H M L L L M M L L L M L
Surface water pollution L L L L L L L L M M M M L L L
Ground water pollution L L L L L L L L L L L L L L L
Contaminate or polluted land L L L L L L L L M L M M L L L
Threatened flora protection L L L L L L L L L L L L L L L
Threatened fauna protection L L L L L L L L L L L L L L L
Weed control and management L L L L L L L L L L L L L M M
Operational noise L L M M M M M M L N/A L L L L L
Vibration and air blast
N/A N/A N/A N/A N/A N/A N/A N/A N/A N/A N/A N/A N/A N/A N/A
Visual amenity, stray light L L L L L L L L L L L L L L L
Aboriginal heritage L L L L L L L L L L L L L L L
Natural heritage conservation L L L L L L L L L L L L L L L
Spontaneous combustion L L L L L L L M L L L L L L L
Coal Services/Lamberts Gully 2013 AEMR Page 18
Mining Activity, Process or Facility
Exp
lora
tion
La
nd
pre
pa
ratio
n, ve
ge
tatio
n
an
d t
op
so
il str
ipp
ing
All
co
nstr
uctio
n
activitie
s inclu
din
g e
art
h
mo
vin
g
Min
e d
eve
lop
me
nt a
nd
min
ing
,
su
rface
an
d u
nd
erg
roun
d
Use
/ma
inte
nan
ce
of
roa
ds,
tra
cks a
nd
eq
uip
men
t
Wa
ste
ro
ck e
mp
lace
men
t
ma
nag
em
en
t
Min
era
l p
roce
ssin
g f
acili
ties
an
d in
frastr
uctu
re
Ore
/pro
duct sto
ckpili
ng
an
d h
an
dlin
g
Ta
ilin
gs im
po
un
dm
en
t
ma
nag
em
en
t
Wa
ter
ma
nag
em
en
t
inclu
din
g s
torm
eve
nt
con
tin
ge
ncie
s
Ha
za
rdou
s m
ate
rials
an
d fu
el,
ha
nd
ling/s
pill
s m
an
ag
em
en
t
Se
we
rag
e
Ru
bb
ish
dis
po
sal
Re
ha
bili
tatio
n a
ctivitie
s
Re
ha
bili
tate
d la
nd
and
rem
ain
ing
fea
ture
s
Bushfire L L L L L L L L L L L M L L L
Mine subsidence N/A N/A N/A N/A N/A N/A N/A N/A N/A N/A N/A N/A N/A N/A N/A
Hydrocarbon contamination L L L L L L L L L L M L L L L
Methane drainage/venting N/A N/A N/A N/A N/A N/A N/A N/A N/A N/A N/A N/A N/A N/A N/A
Public safety L L L L L L L L L L L L L L L
L - Low Risk
M - Medium Risk
H – High Risk
The identification and assessment of environmental risks at the site has allowed management plans and procedures to be developed to minimise the potential risk on the environment and community. Management controls are required for all items which have been assessed as either high or medium risk. The site BBRA for Coal Services/Lamberts Gully is updated and reviewed annually.
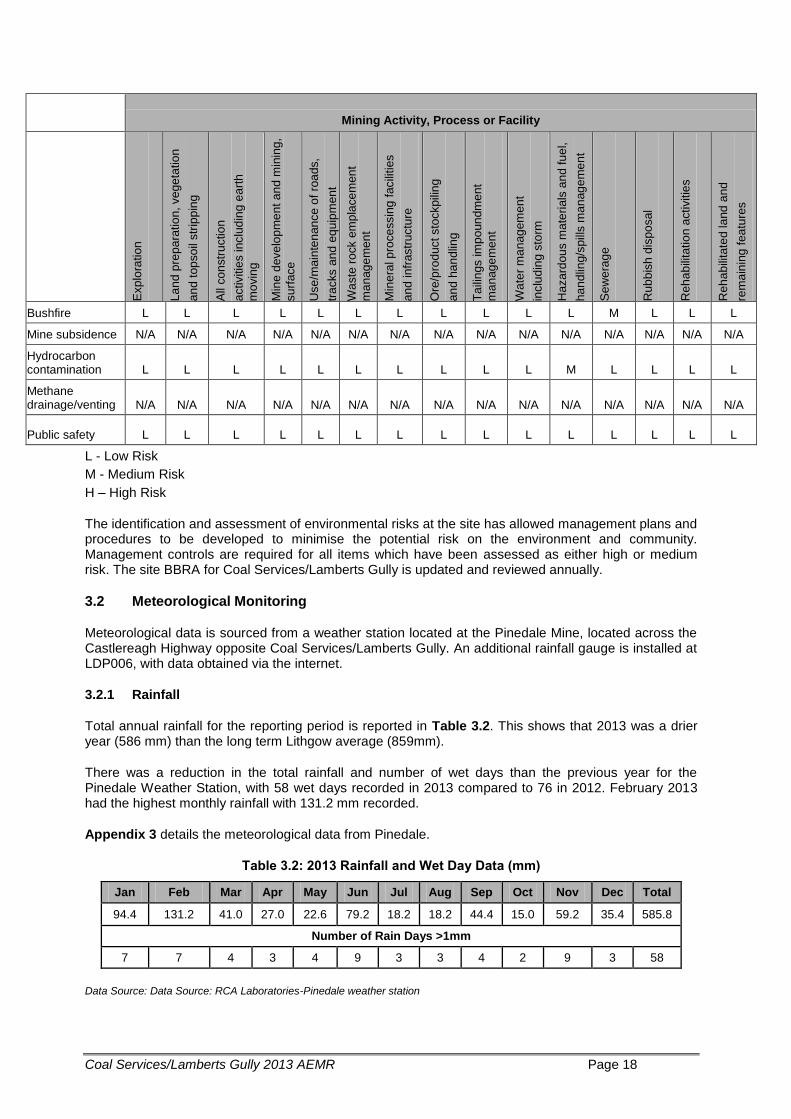
3.2 Meteorological Monitoring
Meteorological data is sourced from a weather station located at the Pinedale Mine, located across the Castlereagh Highway opposite Coal Services/Lamberts Gully. An additional rainfall gauge is installed at LDP006, with data obtained via the internet.
3.2.1 Rainfall
Total annual rainfall for the reporting period is reported in Table 3.2. This shows that 2013 was a drier year (586 mm) than the long term Lithgow average (859mm).
There was a reduction in the total rainfall and number of wet days than the previous year for the Pinedale Weather Station, with 58 wet days recorded in 2013 compared to 76 in 2012. February 2013 had the highest monthly rainfall with 131.2 mm recorded.
Appendix 3 details the meteorological data from Pinedale.
Table 3.2: 2013 Rainfall and Wet Day Data (mm)
Jan Feb Mar Apr May Jun Jul Aug Sep Oct Nov Dec Total
94.4 131.2 41.0 27.0 22.6 79.2 18.2 18.2 44.4 15.0 59.2 35.4 585.8
Number of Rain Days >1mm
7 7 4 3 4 9 3 3 4 2 9 3 58
Data Source: Data Source: RCA Laboratories-Pinedale weather station
Coal Services/Lamberts Gully 2013 AEMR Page 19
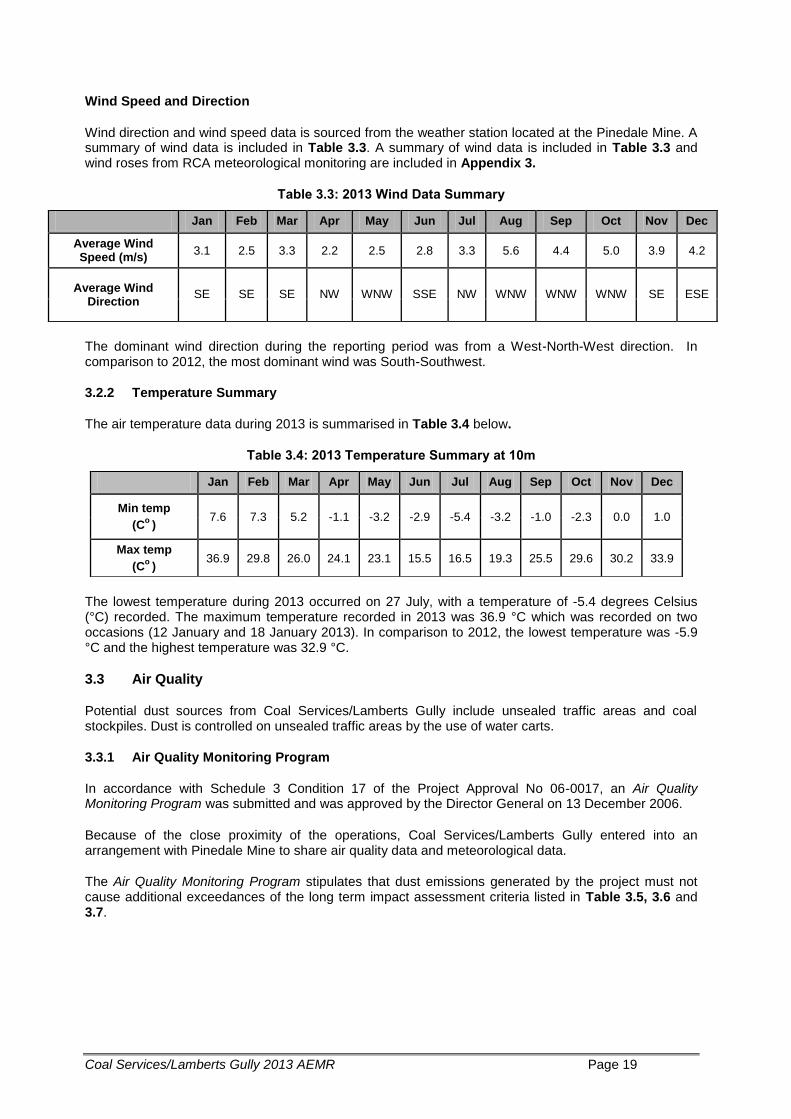
Wind Speed and Direction
Wind direction and wind speed data is sourced from the weather station located at the Pinedale Mine. A summary of wind data is included in Table 3.3. A summary of wind data is included in Table 3.3 and wind roses from RCA meteorological monitoring are included in Appendix 3.
Table 3.3: 2013 Wind Data Summary
The dominant wind direction during the reporting period was from a West-North-West direction. In comparison to 2012, the most dominant wind was South-Southwest.
3.2.2 Temperature Summary
The air temperature data during 2013 is summarised in Table 3.4 below.
Table 3.4: 2013 Temperature Summary at 10m
The lowest temperature during 2013 occurred on 27 July, with a temperature of -5.4 degrees Celsius (°C) recorded. The maximum temperature recorded in 2013 was 36.9 °C which was recorded on two occasions (12 January and 18 January 2013). In comparison to 2012, the lowest temperature was -5.9 °C and the highest temperature was 32.9 °C.
3.3 Air Quality
Potential dust sources from Coal Services/Lamberts Gully include unsealed traffic areas and coal stockpiles. Dust is controlled on unsealed traffic areas by the use of water carts.
3.3.1 Air Quality Monitoring Program
In accordance with Schedule 3 Condition 17 of the Project Approval No 06-0017, an Air Quality Monitoring Program was submitted and was approved by the Director General on 13 December 2006.
Because of the close proximity of the operations, Coal Services/Lamberts Gully entered into an arrangement with Pinedale Mine to share air quality data and meteorological data.
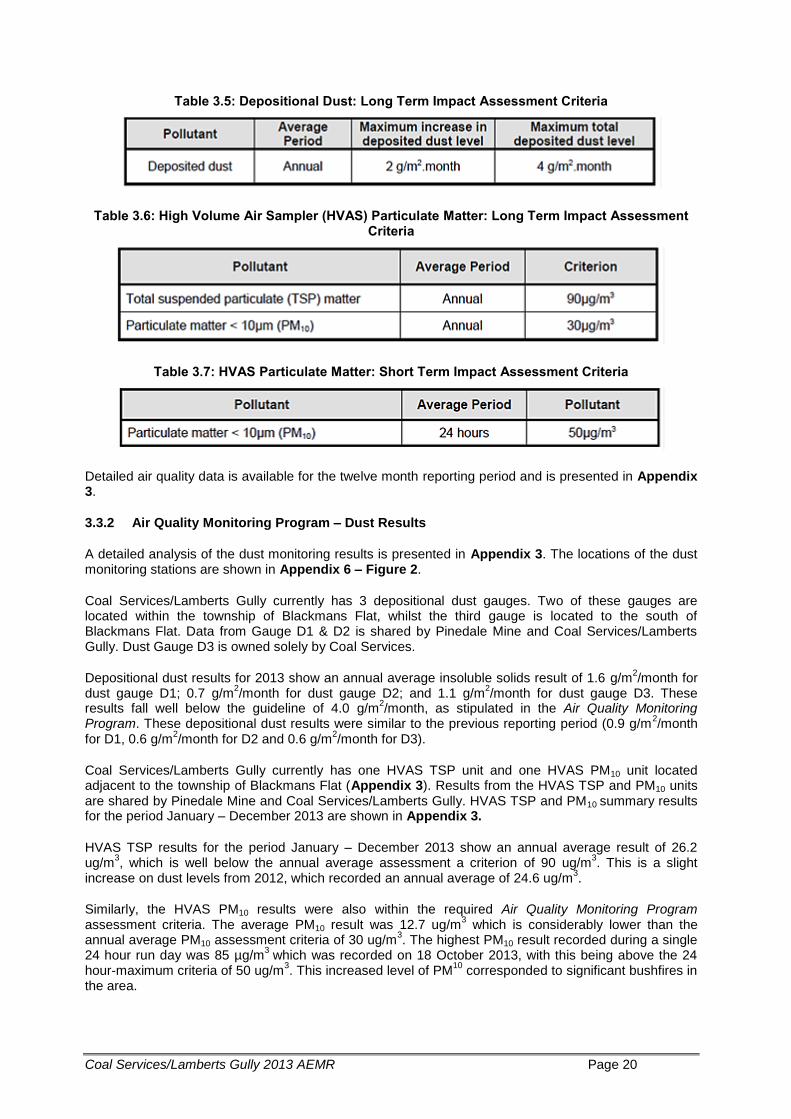
The Air Quality Monitoring Program stipulates that dust emissions generated by the project must not cause additional exceedances of the long term impact assessment criteria listed in Table 3.5, 3.6 and 3.7.
Jan Feb Mar Apr May Jun Jul Aug Sep Oct Nov Dec
Average Wind Speed (m/s)
3.1 2.5 3.3 2.2 2.5 2.8 3.3 5.6 4.4 5.0 3.9 4.2
Average Wind Direction
SE SE SE NW WNW SSE NW WNW WNW WNW SE ESE
Jan Feb Mar Apr May Jun Jul Aug Sep Oct Nov Dec
Min temp
(Co
) 7.6 7.3 5.2 -1.1 -3.2 -2.9 -5.4 -3.2 -1.0 -2.3 0.0 1.0
Max temp
(Co
) 36.9 29.8 26.0 24.1 23.1 15.5 16.5 19.3 25.5 29.6 30.2 33.9
Coal Services/Lamberts Gully 2013 AEMR Page 20
Table 3.5: Depositional Dust: Long Term Impact Assessment Criteria
Table 3.6: High Volume Air Sampler (HVAS) Particulate Matter: Long Term Impact Assessment Criteria
Table 3.7: HVAS Particulate Matter: Short Term Impact Assessment Criteria
Detailed air quality data is available for the twelve month reporting period and is presented in Appendix 3.
3.3.2 Air Quality Monitoring Program – Dust Results
A detailed analysis of the dust monitoring results is presented in Appendix 3. The locations of the dust monitoring stations are shown in Appendix 6 – Figure 2.
Coal Services/Lamberts Gully currently has 3 depositional dust gauges. Two of these gauges are located within the township of Blackmans Flat, whilst the third gauge is located to the south of Blackmans Flat. Data from Gauge D1 & D2 is shared by Pinedale Mine and Coal Services/Lamberts Gully. Dust Gauge D3 is owned solely by Coal Services.
Depositional dust results for 2013 show an annual average insoluble solids result of 1.6 g/m2/month for
dust gauge D1; 0.7 g/m2/month for dust gauge D2; and 1.1 g/m
2/month for dust gauge D3. These
results fall well below the guideline of 4.0 g/m2/month, as stipulated in the Air Quality Monitoring
Program. These depositional dust results were similar to the previous reporting period (0.9 g/m2/month
for D1, 0.6 g/m2/month for D2 and 0.6 g/m
2/month for D3).
Coal Services/Lamberts Gully currently has one HVAS TSP unit and one HVAS PM10 unit located adjacent to the township of Blackmans Flat (Appendix 3). Results from the HVAS TSP and PM10 units are shared by Pinedale Mine and Coal Services/Lamberts Gully. HVAS TSP and PM10 summary results for the period January – December 2013 are shown in Appendix 3.
HVAS TSP results for the period January – December 2013 show an annual average result of 26.2 ug/m
3, which is well below the annual average assessment a criterion of 90 ug/m
3. This is a slight
increase on dust levels from 2012, which recorded an annual average of 24.6 ug/m3.
Similarly, the HVAS PM10 results were also within the required Air Quality Monitoring Program assessment criteria. The average PM10 result was 12.7 ug/m
3 which is considerably lower than the
annual average PM10 assessment criteria of 30 ug/m3. The highest PM10 result recorded during a single
24 hour run day was 85 µg/m3
which was recorded on 18 October 2013, with this being above the 24 hour-maximum criteria of 50 ug/m
3. This increased level of PM
10 corresponded to significant bushfires in
the area.
Coal Services/Lamberts Gully 2013 AEMR Page 21
3.3.3 Green House Gas Emissions
In accordance with Condition 33(c) of the project approval, greenhouse gas (GHG) emissions are monitored on an absolute basis and on a per tonne of coal produced basis. The main source of GHG emissions is the burning of diesel fuel on the site. The operations constantly seek ways of reducing fuel consumption through efficient mine planning and machinery maintenance.
Centennial Coal has statutory reporting obligations for data collected under the National Greenhouse and Energy Reporting (NGER) Act 2007. The data measured under this Act is independently verified by an external auditor prior to submission to Government. This data is collected, audited and reported on a financial year basis and as such is reported externally to any agency on a financial year basis using the most up to date recently audited data.
Greenhouse gas results for Coal Services/Lamberts Gully are recorded as part of the Springvale AEMR.
3.4 Erosion and Sediment Control
Erosion and sediment control is part of the Site Water Management Plan (SWMP). Erosion and sediment control measures that are in place include:
Staging of works;
Controlling access into and within the site;
Management of earthworks;
Maintaining existing vegetation on site;
Minimising erosion of disturbed areas;
Flocculation of dams to reduce TSS;
Where practical progressive rehabilitation of the work areas will be undertaken in accordance with the Mine Closure Plan; and
Contour banks are constructed to reduce runoff velocities and direct runoff into sediment traps and collection ponds before potential discharge.
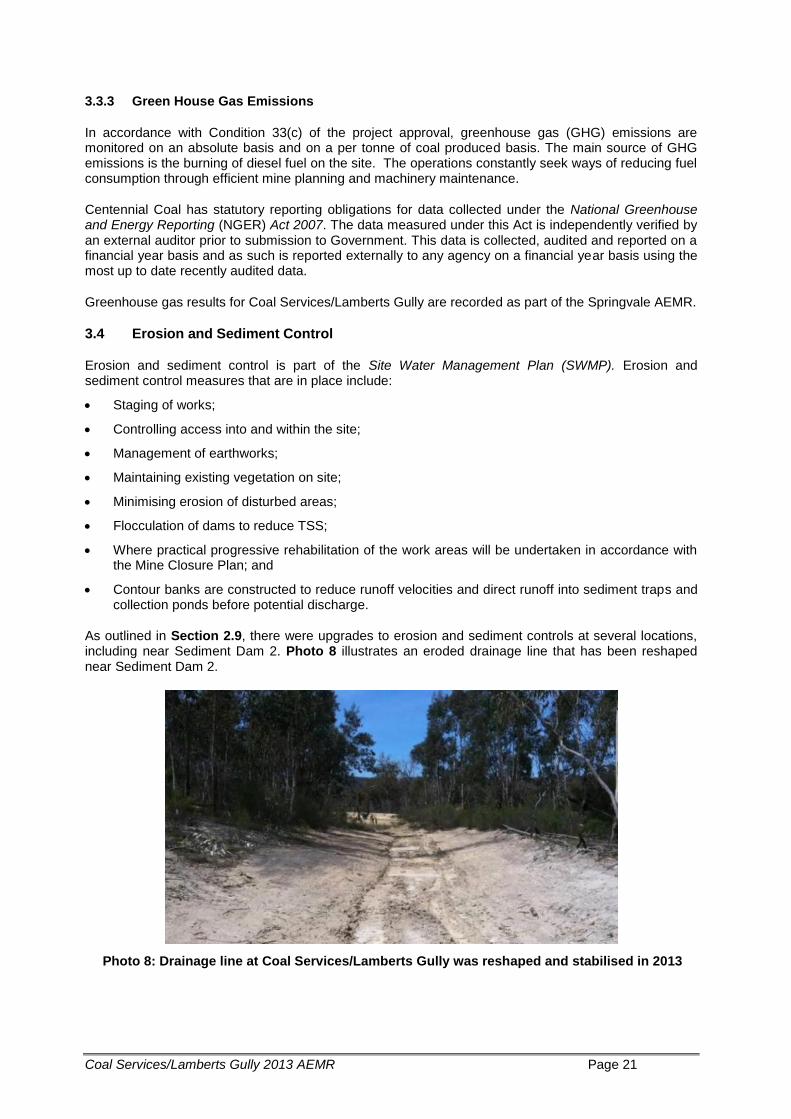
As outlined in Section 2.9, there were upgrades to erosion and sediment controls at several locations, including near Sediment Dam 2. Photo 8 illustrates an eroded drainage line that has been reshaped near Sediment Dam 2.
Photo 8: Drainage line at Coal Services/Lamberts Gully was reshaped and stabilised in 2013
Coal Services/Lamberts Gully 2013 AEMR Page 22
3.5 Surface Water Management
The upgrades to the site water management system are outlined in Section 2.9. This section outlines surface water monitoring results and flows.
Graphed surface water monitoring results (from LDP006) are presented in Appendix 2.
3.5.1 Review of Water Quality Monitoring Results – LDP006
Coal Services/Lamberts Gully has two licensed discharge points, LDP006 and LDP007, under EPL 3607. Overflow from Cooks Dam discharges directly into LDP006, which discharges into Wangcol Creek.
LDP007 is a sump at the overland conveyor transfer point and usually does not discharge. It did not discharge during the reporting period and hence no monitoring data was collected. There is no discharge limit associated with LDP007 in the EPL.
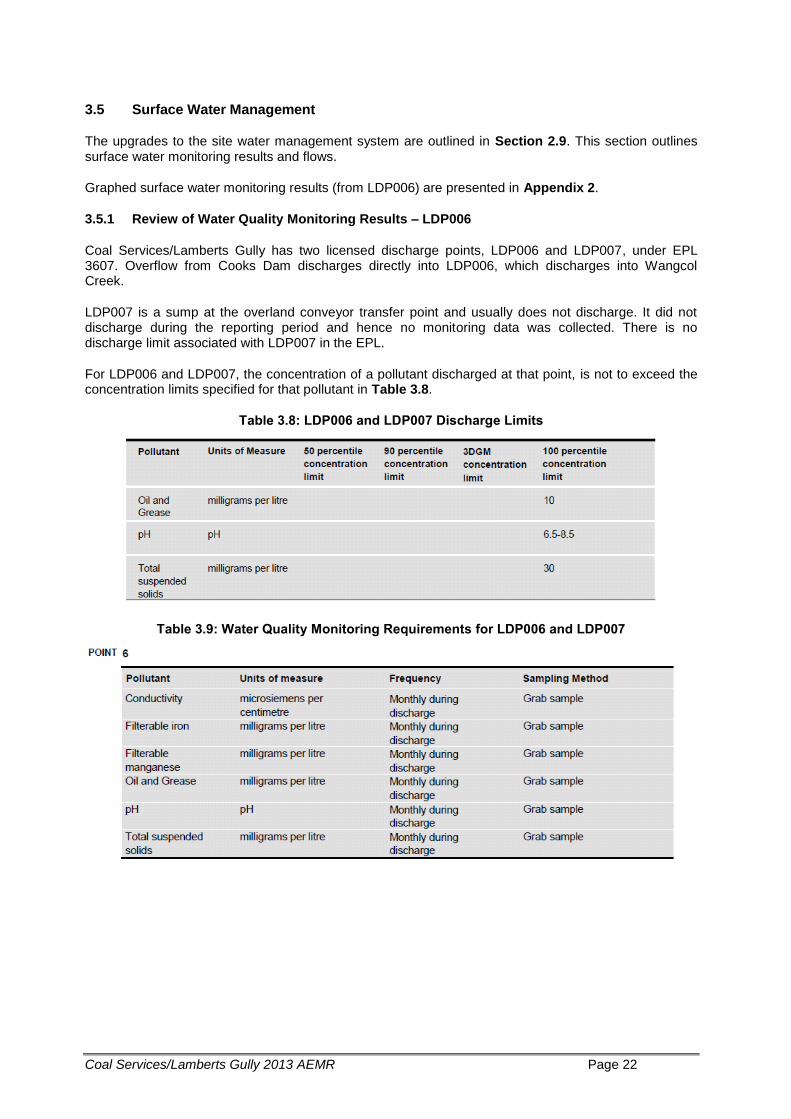
For LDP006 and LDP007, the concentration of a pollutant discharged at that point, is not to exceed the concentration limits specified for that pollutant in Table 3.8.
Table 3.8: LDP006 and LDP007 Discharge Limits
Table 3.9: Water Quality Monitoring Requirements for LDP006 and LDP007
Coal Services/Lamberts Gully 2013 AEMR Page 23
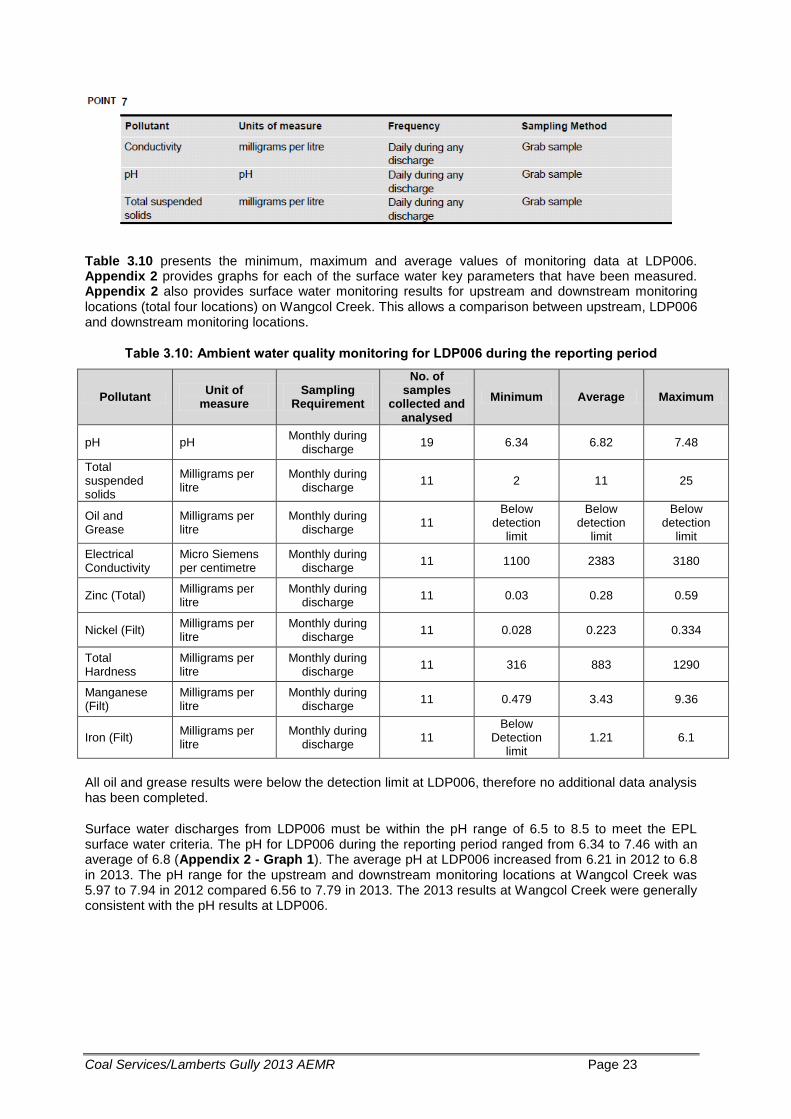
Table 3.10 presents the minimum, maximum and average values of monitoring data at LDP006. Appendix 2 provides graphs for each of the surface water key parameters that have been measured. Appendix 2 also provides surface water monitoring results for upstream and downstream monitoring locations (total four locations) on Wangcol Creek. This allows a comparison between upstream, LDP006 and downstream monitoring locations.
Table 3.10: Ambient water quality monitoring for LDP006 during the reporting period
Pollutant Unit of
measure Sampling
Requirement
No. of samples
collected and analysed
Minimum Average Maximum
pH pH Monthly during
discharge 19 6.34 6.82 7.48
Total suspended solids
Milligrams per litre
Monthly during discharge
11 2 11 25
Oil and Grease
Milligrams per litre
Monthly during discharge
11 Below
detection limit
Below detection
limit
Below detection
limit
Electrical Conductivity
Micro Siemens per centimetre
Monthly during discharge
11 1100 2383 3180
Zinc (Total) Milligrams per litre
Monthly during discharge
11 0.03 0.28 0.59
Nickel (Filt) Milligrams per litre
Monthly during discharge
11 0.028 0.223 0.334
Total Hardness
Milligrams per litre
Monthly during discharge
11 316 883 1290
Manganese (Filt)
Milligrams per litre
Monthly during discharge
11 0.479 3.43 9.36
Iron (Filt) Milligrams per litre
Monthly during discharge
11 Below
Detection limit
1.21 6.1
All oil and grease results were below the detection limit at LDP006, therefore no additional data analysis has been completed.
Surface water discharges from LDP006 must be within the pH range of 6.5 to 8.5 to meet the EPL surface water criteria. The pH for LDP006 during the reporting period ranged from 6.34 to 7.46 with an average of 6.8 (Appendix 2 - Graph 1). The average pH at LDP006 increased from 6.21 in 2012 to 6.8 in 2013. The pH range for the upstream and downstream monitoring locations at Wangcol Creek was 5.97 to 7.94 in 2012 compared 6.56 to 7.79 in 2013. The 2013 results at Wangcol Creek were generally consistent with the pH results at LDP006.
Coal Services/Lamberts Gully 2013 AEMR Page 24
Surface water discharges from LDP006 for Total Suspended Solids (TSS) must be less than 30 mg/L to meet the EPL surface water criteria. TSS results for LDP006 during the reporting period ranged between 2 mg/L and 25 mg/L, with all results therefore being within EPL criteria (Appendix 2 - Graph 2). The average TSS at LDP006 decreased from 22 mg/L in 2012 to 11 mg/L in 2013. The TSS range for the upstream and downstream monitoring locations at Wangcol Creek was 0.6 mg/L to 84 mg/L in 2012 compared to 1 mg/L to 8 mg/L in 2013. The 2013 results at Wangcol Creek were lower than the TSS range at LDP006.
The electrical conductivity (EC) results for LDP006 during the reporting period ranged from 1100 µS/cm to 3180 µS/cm, with an average of 2383 µS/cm (Appendix 2 - Graph 3). The average EC level at LDP006 increased from 1588 µS/cm in 2012 to 2383 µS/cm in 2013. The EC range for the upstream and downstream monitoring locations at Wangcol Creek was 76 µS/cm to 2340 µS/cm in 2012 compared to 237 µS/cm to 3240 µS/cm in 2013. The 2013 results at Wangcol Creek were a greater range than those recorded at LDP006.
Total zinc results for LDP006 during the reporting period ranged from 0.03 mg/L to 0.59 mg/L, with an average of 0.28 mg/L (Appendix 2 - Graph 4). The average total zinc at LDP006 decreased from 0.188 mg/L in 2012 to 0.28 mg/L in 2013. The total zinc levels for the upstream and downstream monitoring locations at Wangcol Creek ranged from 0.005 mg/L to 0.233 mg/L in 2012 compared to 0.005 mg/L to 0.340 mg/L in 2013. The 2013 results at Wangcol Creek were a smaller range than the LDP006 results.
Nickel (filterable) for LDP006 during the reporting period ranged from 0.028 mg/L to 0.334 mg/L, with an average result of 0.223 mg/L (Appendix 2 - Graph 5). The average nickel (filterable) level at LDP006 increased from 0.152 mg/L in 2012 to 0.223 mg/L in 2013. The nickel (filterable) levels for the upstream and downstream monitoring locations at Wangcol Creek ranged from 0.003 mg/L to 0.277 mg/L in 2012 compared to 0.005 mg/L to 0.314 mg/L in 2013. On average the nickel (filterable) levels were higher at LDP006 than at the Wangcol Creek monitoring locations for 2013.
Total hardness results for LDP006 during the reporting period ranged from 316 mg/L to 1290 mg/L, with an average result of 883 mg/L (Appendix 2 - Graph 6). The average total hardness results for LDP006 increased from 575 mg/L in 2012 to 883 mg/L in 2013. The total hardness results for the upstream and downstream monitoring locations at Wangcol Creek ranged from 30 mg/L to 948 mg/L in 2012 compared to 80 mg/L to 1240 mg/L in 2013. The 2013 results at Wangcol Creek were of a similar range to the LDP006 results.
Filterable manganese results for LDP006 during the reporting period ranged from 0.479 mg/L to 9.36 mg/L, with an average result of 3.43 mg/L (Appendix 2 - Graph 7). The average filterable manganese level at LDP006 increased slightly from 3.204 mg/L in 2012 to 3.43 mg/L in 2013. The filterable manganese results for the upstream and downstream monitoring locations at Wangcol Creek ranged from 0.062 mg/L to 2.88 mg/L in 2012 compared to 0.098 mg/L to 3.93 mg/L in 2013. The 2013 results at Wangcol Creek were of a smaller range than the LDP006 results.
Filterable iron results for LDP006 during the reporting period ranged from <0.05 mg/L to 6.1 mg/L, with an average result of 1.21 mg/L (Appendix 2 - Graph 8). The average filterable iron level at LDP006 decreased from 1.74 mg/L in 2012 to 1.21 mg/L in 2013. The filterable iron results for the upstream and downstream monitoring locations at Wangcol Creek ranged from <0.05 mg/L to 5.64 mg/L in 2012 compared to 0.05 mg/L to 0.81 mg/L in 2013. The 2013 results at Wangcol Creek were of a significantly smaller range than the LDP006 results.
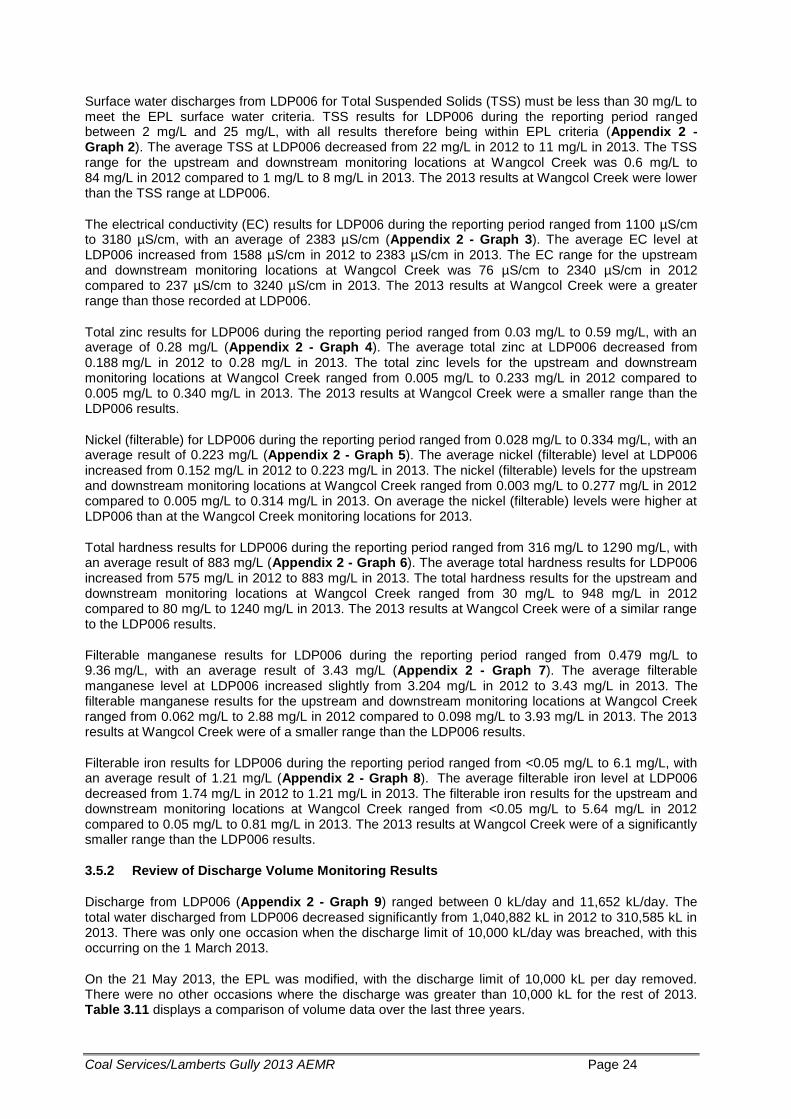
3.5.2 Review of Discharge Volume Monitoring Results
Discharge from LDP006 (Appendix 2 - Graph 9) ranged between 0 kL/day and 11,652 kL/day. The total water discharged from LDP006 decreased significantly from 1,040,882 kL in 2012 to 310,585 kL in 2013. There was only one occasion when the discharge limit of 10,000 kL/day was breached, with this occurring on the 1 March 2013.
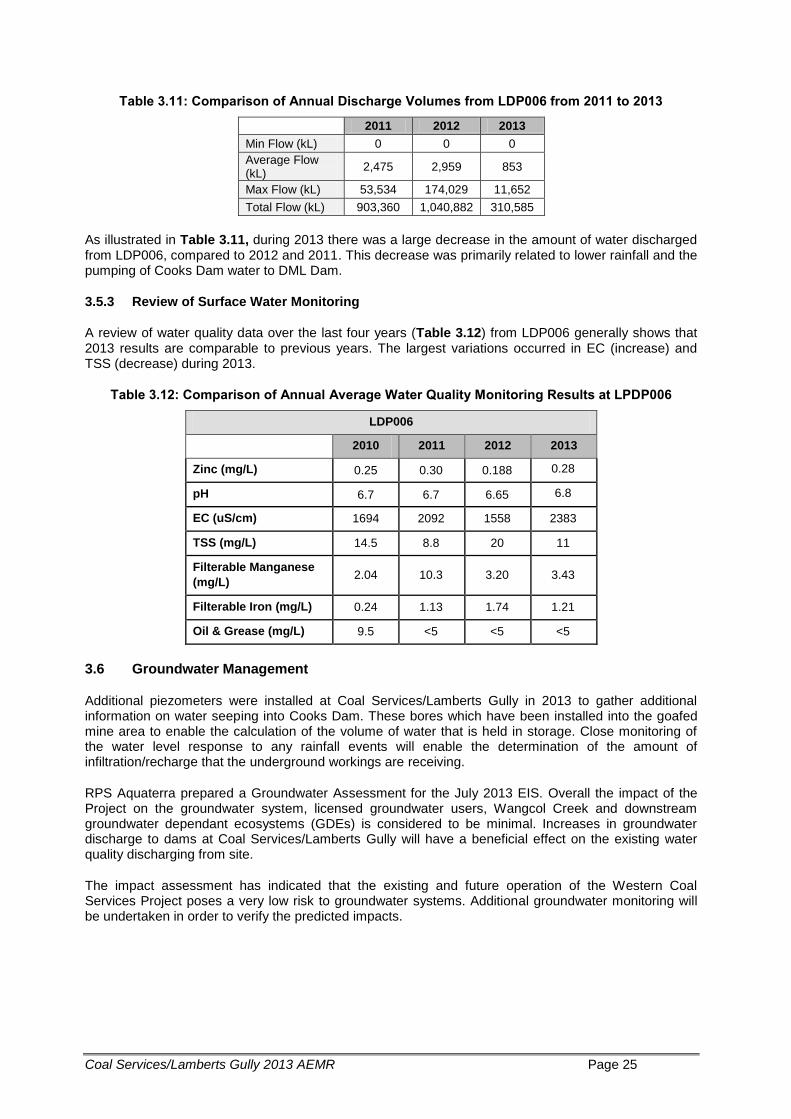
On the 21 May 2013, the EPL was modified, with the discharge limit of 10,000 kL per day removed. There were no other occasions where the discharge was greater than 10,000 kL for the rest of 2013. Table 3.11 displays a comparison of volume data over the last three years.
Coal Services/Lamberts Gully 2013 AEMR Page 25
Table 3.11: Comparison of Annual Discharge Volumes from LDP006 from 2011 to 2013
2011 2012 2013
Min Flow (kL) 0 0 0
Average Flow (kL)
2,475 2,959 853
Max Flow (kL) 53,534 174,029 11,652
Total Flow (kL) 903,360 1,040,882 310,585
As illustrated in Table 3.11, during 2013 there was a large decrease in the amount of water discharged from LDP006, compared to 2012 and 2011. This decrease was primarily related to lower rainfall and the pumping of Cooks Dam water to DML Dam.
3.5.3 Review of Surface Water Monitoring
A review of water quality data over the last four years (Table 3.12) from LDP006 generally shows that 2013 results are comparable to previous years. The largest variations occurred in EC (increase) and TSS (decrease) during 2013.
Table 3.12: Comparison of Annual Average Water Quality Monitoring Results at LPDP006
LDP006
2010 2011 2012 2013
Zinc (mg/L) 0.25 0.30 0.188 0.28
pH 6.7 6.7 6.65 6.8
EC (uS/cm) 1694 2092 1558 2383
TSS (mg/L) 14.5 8.8 20 11
Filterable Manganese
(mg/L) 2.04 10.3 3.20 3.43
Filterable Iron (mg/L) 0.24 1.13 1.74 1.21
Oil & Grease (mg/L) 9.5 <5 <5 <5
3.6 Groundwater Management
Additional piezometers were installed at Coal Services/Lamberts Gully in 2013 to gather additional information on water seeping into Cooks Dam. These bores which have been installed into the goafed mine area to enable the calculation of the volume of water that is held in storage. Close monitoring of the water level response to any rainfall events will enable the determination of the amount of infiltration/recharge that the underground workings are receiving.
RPS Aquaterra prepared a Groundwater Assessment for the July 2013 EIS. Overall the impact of the Project on the groundwater system, licensed groundwater users, Wangcol Creek and downstream groundwater dependant ecosystems (GDEs) is considered to be minimal. Increases in groundwater discharge to dams at Coal Services/Lamberts Gully will have a beneficial effect on the existing water quality discharging from site.
The impact assessment has indicated that the existing and future operation of the Western Coal Services Project poses a very low risk to groundwater systems. Additional groundwater monitoring will be undertaken in order to verify the predicted impacts.
Coal Services/Lamberts Gully 2013 AEMR Page 26
3.7 Contaminated / Polluted Land
In February 2012 a letter was sent to the OEH from Centennial to notify them of a contamination site assessment across all of Centennial’s operating sites in NSW to determine the legal obligation to report contamination pursuant to the amendments to the Contaminated Land Management Act 1997. Coal Services/Lamberts Gully was assessed as a low risk site with an additional assessment to be undertaken within the next three years.
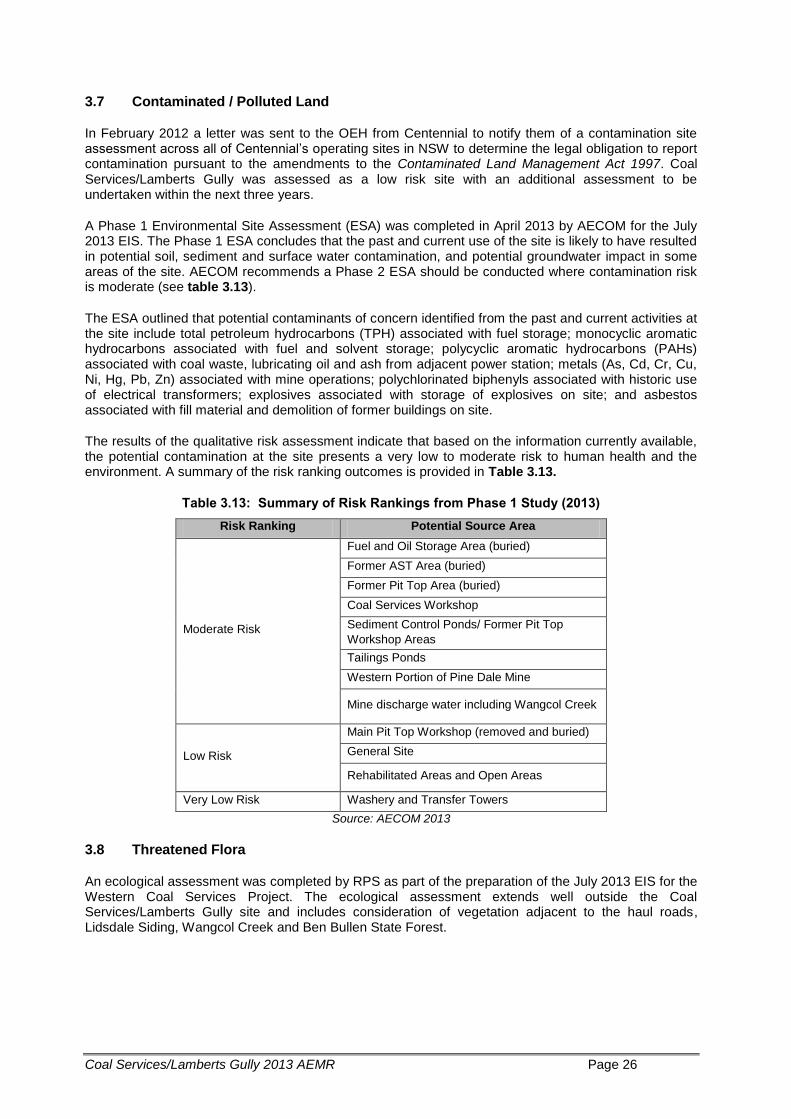
A Phase 1 Environmental Site Assessment (ESA) was completed in April 2013 by AECOM for the July 2013 EIS. The Phase 1 ESA concludes that the past and current use of the site is likely to have resulted in potential soil, sediment and surface water contamination, and potential groundwater impact in some areas of the site. AECOM recommends a Phase 2 ESA should be conducted where contamination risk is moderate (see table 3.13).
The ESA outlined that potential contaminants of concern identified from the past and current activities at the site include total petroleum hydrocarbons (TPH) associated with fuel storage; monocyclic aromatic hydrocarbons associated with fuel and solvent storage; polycyclic aromatic hydrocarbons (PAHs) associated with coal waste, lubricating oil and ash from adjacent power station; metals (As, Cd, Cr, Cu, Ni, Hg, Pb, Zn) associated with mine operations; polychlorinated biphenyls associated with historic use of electrical transformers; explosives associated with storage of explosives on site; and asbestos associated with fill material and demolition of former buildings on site.
The results of the qualitative risk assessment indicate that based on the information currently available, the potential contamination at the site presents a very low to moderate risk to human health and the environment. A summary of the risk ranking outcomes is provided in Table 3.13.
Table 3.13: Summary of Risk Rankings from Phase 1 Study (2013)
Risk Ranking Potential Source Area
Moderate Risk
Fuel and Oil Storage Area (buried)
Former AST Area (buried)
Former Pit Top Area (buried)
Coal Services Workshop
Sediment Control Ponds/ Former Pit Top
Workshop Areas
Tailings Ponds
Western Portion of Pine Dale Mine
Mine discharge water including Wangcol Creek
Low Risk
Main Pit Top Workshop (removed and buried)
General Site
Rehabilitated Areas and Open Areas
Very Low Risk Washery and Transfer Towers
Source: AECOM 2013
3.8 Threatened Flora
An ecological assessment was completed by RPS as part of the preparation of the July 2013 EIS for the Western Coal Services Project. The ecological assessment extends well outside the Coal Services/Lamberts Gully site and includes consideration of vegetation adjacent to the haul roads, Lidsdale Siding, Wangcol Creek and Ben Bullen State Forest.
Coal Services/Lamberts Gully 2013 AEMR Page 27
The total Coal Services site/Lamberts Gully site is approximately 287 hectares and can be described as follows:
51% of the site is cleared and severely disturbed, being mined/worked land;
24% of the site is planted/regenerated vegetation – previously mined areas;
24% of the site is relatively un-disturbed native vegetation; and
Less than 1% of the site is pine plantation.
Targeted threatened flora surveys by RPS for the July 2013 EIS identified one threatened flora species within the site, namely E. Aggregate, which is listed as Vulnerable under the TSC Act 1995. No additional threatened flora species were recorded on site during the preparation of the July 2013 EIS. Only five E. aggregata trees were found in the Tablelands Gum – Peppermint woodland to the east of the dam that occurs within Lamberts Gully. This area was cleared in January 2007. The trees were felled and left for seed harvesting prior to being windrowed. Over half a kilogram of seed was harvested and some has been used in seeding of the rehabilitation program and some has been retained for future use.
E. aggregata is outside the REA and is not likely to be impacted upon as a result of the proposed activities. Surveys within the site did not detect any further threatened flora species, however two are considered to have potential to occur, namely, E. cannonii and T. australe.
3.9 Threatened Fauna
An ecological assessment was completed by RPS as part of the preparation of the July 2013 EIS for the Western Coal Services Project. The results of database searches indicated that 42 threatened fauna species have been previously recorded within 10km of the site (the locality) and/or have potential habitat within the site.
Eleven species of microchiropteran bat were positively identified from Anabat echolocation call recording within the site. Of these, four species are listed as threatened under the TSC Act 1995. These included the Chalinolobus dwyeri (Large-eared Pied Bat), Falistrellus tasmaniensis (Eastern Falsistrelle), Miniopterus schreibersii oceanensis (Eastern Bent Wing Bat) and Saccolaimus flaviventris (Yellow Bellied Sheathtail Bat).
The upgrade project is expected to result in the removal of approximately 10.67 ha of forest based upon the preferred Link Haul Road option (Link Haul Road Option 2). The surrounding state forests provide large areas of consolidated habitat for common and threatened fauna considered to have potential to occur within the locality. Whilst the removal of the vegetation on site is deemed to constitute a loss of habitat for threatened fauna, given the large amounts of neighbouring habitat, the proposal is not considered to constitute a significant reduction of habitat to locally occurring fauna.
3.10 Weeds
The major weed threats include Blackberry (Rubus fruticosus), St. Johns Wort (Hypericum perforatum) and Pampas Grass (Cortaderia selloana), which are controlled by the annual noxious weed control program.
There are very few established weeds in the Lamberts Gully Rehabilitation areas. Weed spraying was completed during 2013, targeting Blackberry, and will continue in 2014.
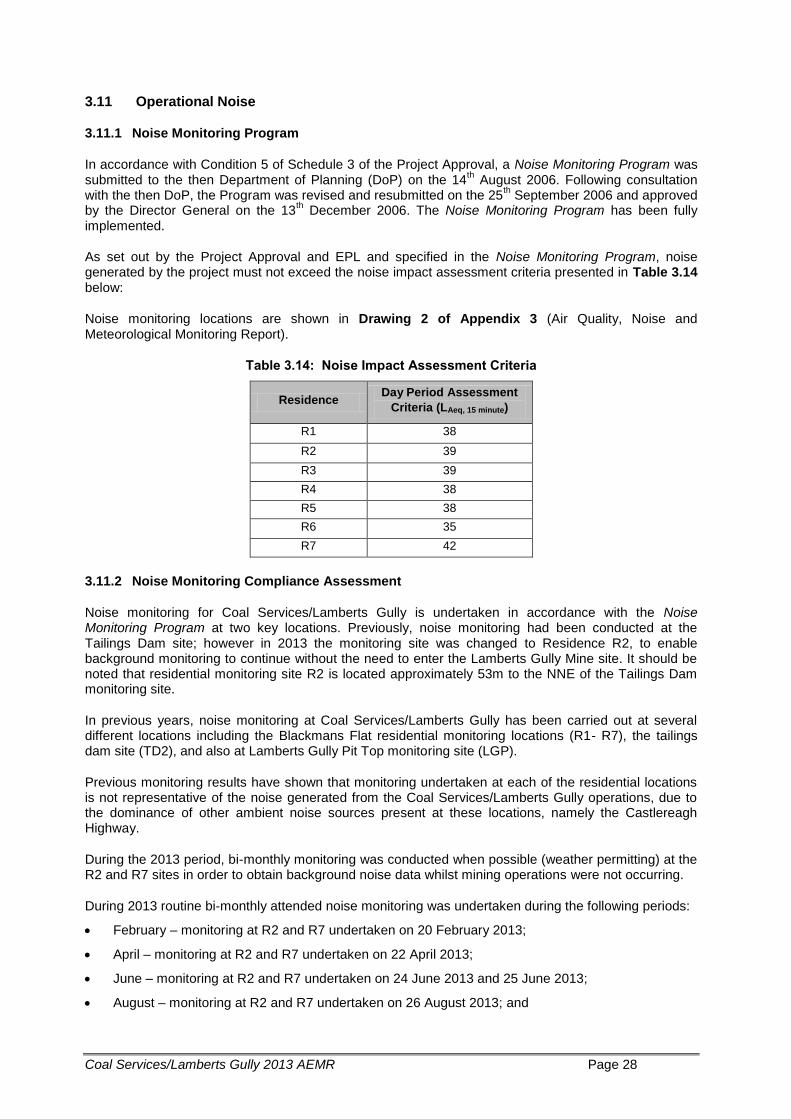
Coal Services/Lamberts Gully 2013 AEMR Page 28
3.11 Operational Noise
3.11.1 Noise Monitoring Program
In accordance with Condition 5 of Schedule 3 of the Project Approval, a Noise Monitoring Program was submitted to the then Department of Planning (DoP) on the 14
th August 2006. Following consultation
with the then DoP, the Program was revised and resubmitted on the 25th September 2006 and approved
by the Director General on the 13th December 2006. The Noise Monitoring Program has been fully
implemented.
As set out by the Project Approval and EPL and specified in the Noise Monitoring Program, noise generated by the project must not exceed the noise impact assessment criteria presented in Table 3.14 below:
Noise monitoring locations are shown in Drawing 2 of Appendix 3 (Air Quality, Noise and Meteorological Monitoring Report).
Table 3.14: Noise Impact Assessment Criteria
Residence Day Period Assessment
Criteria (LAeq, 15 minute)
R1 38
R2 39
R3 39
R4 38
R5 38
R6 35
R7 42
3.11.2 Noise Monitoring Compliance Assessment
Noise monitoring for Coal Services/Lamberts Gully is undertaken in accordance with the Noise Monitoring Program at two key locations. Previously, noise monitoring had been conducted at the Tailings Dam site; however in 2013 the monitoring site was changed to Residence R2, to enable background monitoring to continue without the need to enter the Lamberts Gully Mine site. It should be noted that residential monitoring site R2 is located approximately 53m to the NNE of the Tailings Dam monitoring site.
In previous years, noise monitoring at Coal Services/Lamberts Gully has been carried out at several different locations including the Blackmans Flat residential monitoring locations (R1- R7), the tailings dam site (TD2), and also at Lamberts Gully Pit Top monitoring site (LGP).
Previous monitoring results have shown that monitoring undertaken at each of the residential locations is not representative of the noise generated from the Coal Services/Lamberts Gully operations, due to the dominance of other ambient noise sources present at these locations, namely the Castlereagh Highway.
During the 2013 period, bi-monthly monitoring was conducted when possible (weather permitting) at the R2 and R7 sites in order to obtain background noise data whilst mining operations were not occurring.
During 2013 routine bi-monthly attended noise monitoring was undertaken during the following periods:
February – monitoring at R2 and R7 undertaken on 20 February 2013;
April – monitoring at R2 and R7 undertaken on 22 April 2013;
June – monitoring at R2 and R7 undertaken on 24 June 2013 and 25 June 2013;
August – monitoring at R2 and R7 undertaken on 26 August 2013; and
Coal Services/Lamberts Gully 2013 AEMR Page 29
October – monitoring at R2 and R7 undertaken on 30 October 2013.
Noise monitoring for the December 2013 bi-monthly period is scheduled to be conducted in mid-January 2014.
A detailed analysis of the noise monitoring results and a figure showing location of noise monitoring stations is presented in Appendix 3. In summary, operational attended noise monitoring results for the period January – December 2013 are not directly comparable to the noise impact assessment criteria stipulated in Noise Monitoring Program as the mine was not operational during this period. The results, however, are useful in that they provide a true measure of the background noise levels in the area.
When these background noise results are compared to the noise impact assessment criteria for noise monitoring sites R2 and R7 it can be seen that exceedances are still shown to occur even when the mine is not operational. This implies that the noise impact assessment criteria initially set for the Lamberts Gully Mine are not practically achievable, even during periods of non-operation.
During the reporting period, Coal Services/Lamberts Gully received no noise complaints.
3.11.3 EIS Noise Assessment
SLR Consulting completed the Noise and Vibration Impact Assessment for the July 2013 EIS. The predicted noise emission levels indicate that many noise receivers modelled will meet the Project Specific Noise Criteria established for the upgrade project. However, the results of the Noise and Vibration Impact Assessment indicate that there will be likely residual noise impacts above the Project Specific Noise Criteria at some of the receptors at Blackmans Flat. A specific Noise Management Plan would be developed upon approval of the July 2013 EIS, with this management plan to outline the specific noise monitoring requirements and noise management strategies for the site.
3.12 Blasting
With mine production ceasing during 2010, there was no blasting undertaken during the reporting period. It should be noted that Pinedale has conducted blasting during the reporting period.
3.13 Visual Stray Light
Visual stray light is not considered to pose any potentially adverse environmental impacts at the mine due to surface footprint, locality, and the distance to neighbouring properties. There have been no complaints received in the operating life of the mine in relation to visual stray light.
Visual impact was assessed for the July 2013 EIS. Whilst the visual impact of the upgrade project will be considered moderate, the visual absorption capacity of the area is relatively high in relation to coal handling and coal infrastructure. Consequently, it is considered that the cumulative visual impact is considered minor to moderate.
There are predicted to be no changes to visual impact at Coal Services/Lamberts Gully in 2014.
3.14 Aboriginal Heritage
A Cultural Heritage Assessment was completed by RPS as part of the July 2013 EIS.
A total of 17 registered sites have been identified at the Coal Services/Lamberts Gully site. Of these sites, eight (47.5%) have been salvaged under a Section 90 Aboriginal Heritage Impact Permit, which means that 52.5% of all known sites remain. With the relevant approvals, there is an opportunity to salvage the six newly recorded sites (isolated finds) in the Coal Services/Lamberts Gully site, reducing the total number of sites remaining to three (17.6%).
Coal Services/Lamberts Gully 2013 AEMR Page 30
The Cultural Heritage Assessment notes that isolated finds are a common occurrence in the landscape which cannot be contextualised or associated with an assemblage to develop an understanding of the subsistence activity once associated with the artefact. Given that the six newly recorded sites were identified in a highly modified and/or disturbed landscape, the value of these sites has also been assessed as low.
There are no cumulative impacts or foreseeable risk of harm to Aboriginal or non-Aboriginal Heritage due to the Project.
3.15 European Heritage
There are no identified areas of European heritage at Coal Services/Lamberts Gully.
3.16 Spontaneous Combustion
Spontaneous combustion from coal processing and stockpiling at Coal Services is considered as a low risk. The mined coal seams have a low propensity for spontaneous combustion with no spontaneous combustion issues in relation to in-situ or for processed coal. The highest risk of spontaneous combustion appears to be when stockpiling remains for greater than approximately 1 to 2 years. Coal sent to Coal Services is generally stockpiled for less than 1 year. There have been no incidences of spontaneous combustion in the life of the Coal Services/Lamberts Gully site.
3.17 Bushfire
No controlled burns were carried out during the reporting period and there were no bushfires onsite.
The risk of bushfire being increased by the site activities is low at Coal Services/Lamberts Gully, as the local ecology is adapted to fire and robust bushfire management protocols are in-place, and bushfire management included in the Emergency Management System.
The largest risk comes from bushfires emanating from the Ben Bullen State Forest. This forest is managed by the Forestry Corporation of NSW. Firebreaks have been established along the overland conveyor where it passes through forested land. The main assets on site are adequately protected by existing cleared land.
A Bushfire Management Plan has been prepared for Coal Services/Lamberts Gully with this plan outlining:
Emergency procedures and numbers;
Firefighting equipment;
Management of flammable materials;
Training; and
Water sources for firefighting.
3.18 Mine Subsidence
Surface inspections have identified subsidence areas across the mining lease as the site is above historic underground workings. Previously where subsidence has been found which requires remediation the area is shaped, contour drains established, top-dressed and sown.
During 2013 there were no new subsidence areas identified or repairs completed.
Coal Services/Lamberts Gully 2013 AEMR Page 31
3.19 Methane Drainage/Ventilation
The previous underground mining operations completed in the Lamberts Gully/Coal Services area have not caused any issues relating to methane drainage/ ventilation. Since Centennial has managed the open cut operation the site has had no issues regarding methane drainage/ ventilation. Neighbouring underground operations in the Lithgow region have not recorded any issues relating to methane drainage/ ventilation.
3.20 Public Safety
Public safety risks associated with the Coal Services/Lamberts Gully are largely from public trespass on land around the open cut area. The site is sign posted and regularly patrolled by a contract security service. The site is surrounded by a large perimeter fence.
During the reporting period, fencing had to be repaired on numerous occasions due to vandalism.
3.21 Other Issues and Risks
No other environment or community risks have been identified during the 2013 Broad Brush Risk Assessment process.
3.22 Summary of Compliance
Heavy rainfall on 1 March 2013 resulted in a discharge from LDP006 of greater than 10,000kL per day (total 11,652 kL). On the 21 May 2013, there was a variation to the EPL, with the discharge limit of 10,000 kL per day removed. There were no other occasions where the discharge was greater than 10,000 kL for the rest of 2013.
There were two occasions during 2013 (1 March and 4 July) when the water sample taken at LDP006 was below the EPL pH criteria of 6.5 (result pH 6.34 on 1 March 2013 and pH 6.48 on 4 July 2013). There were no exceedances of TSS or oil and grease from LDP006 during the reporting period.
The above non-compliances relating to volume discharge and the pH exceedances from LDP006 will be reported in the Annual Return.
Coal Services/Lamberts Gully 2013 AEMR Page 32
4 COMMUNITY RELATIONS
4.1 Environmental Complaints
There were no community complaints relating to Coal Services/Lamberts Gully during the reporting period.
4.2 Community Liaison
A Community Consultative Committee (CCC) was formed and ran under the terms of the Lamberts Gully Coal Mine approval. The CCC was officially closed in 2011, following consultation and approval with the Department of Planning and Infrastructure.
Centennial Coal is in the process of establishing a Centennial Western Sites CCC. Letters were sent out to the local community (Wallerawang area) requesting those to register interest in joining the Centennial Western sites CCC. The Centennial Western CCC will be established in 2014.
Community engagement was completed as part of the July 2013 EIS for the Western Coal Services Project. Section 6 of the July 2013 EIS provides details on community consultation, including:
Community Information sessions;
Letter box-drop of leaflets;
A series of articles and advertisements in the local paper;
Direct engagement with residents in the main residential area of Blackmans Flat; and
Meetings with key government stakeholders including the DP&I.
Coal Services/Lamberts Gully 2013 AEMR Page 33
5 REHABILITATION
A Rehabilitation and Mine Closure Risk Assessment was completed for Coal Services/Lamberts Gully in March 2010 to identify and scope the risks associated with rehabilitation and mine closure.
Prior to the risk assessment, aspects and categories were entered into the risk assessment spreadsheet based on the key steps in the Rehabilitation and Closure Costs spreadsheet. Based on these aspects, a detailed rehabilitation and closure methodology was developed, with risks and existing controls recorded by the risk assessment team. The risk assessment team then recommended additional controls to effectively manage the risks associated with rehabilitation and closure of the site. The Mine Closure Plan will be updated following approval of the July 2013 EIS.
5.1 Buildings
On the completion of mining in June 2010, several portable buildings associated with mining were removed. During the reporting period, there were no permanent buildings renovated or removed.
5.2 Rehabilitation of Disturbed Land
Currently there are minimal areas available for rehabilitation, due to areas being used for operational purposes. Where areas are available, a rehabilitation seed mix will be used that is similar to a native forest ecosystem which surrounds the site. This does not include the area to the north which is required for additional ash emplacement by Energy Australia and to accommodate the LCC Waste Emplacement Facility.
Appendix 6, Figure 3 illustrates the layout of the mining blocks at Lamberts Gully.
Reject Emplacement Area (REA)
Access to the REA will remain open for the remaining life of the Washery and these areas will remain the responsibility of Coal Services/Lamberts Gully to both manage and rehabilitate. There was no rehabilitation of this area in 2013, with none planned for 2014. The July 2013 EIS outlines plans to expand the REA.
Council Waste Facility and Energy Australia Ash Emplacement Facility
Separate access to both the Council Waste Disposal Facility and the Ash Emplacement Area will be developed in consultation with both LCC and Energy Australia. Once completed, these areas will become the responsibility of LCC and Energy Australia respectively to both manage and rehabilitate.
During 2013, Energy Australia constructed a new ash emplacement facility on Energy Australia owned land. Specific aspects of the ash emplacement facility are outlined in the Environmental Assessment (August 2010), which was approved by the DP&I on 16 February 2012 (PA09_0186).
5.3 Other Infrastructure
There was no other infrastructure available for removal during the reporting period. All established infrastructure is required for the continued operations of the Washery.
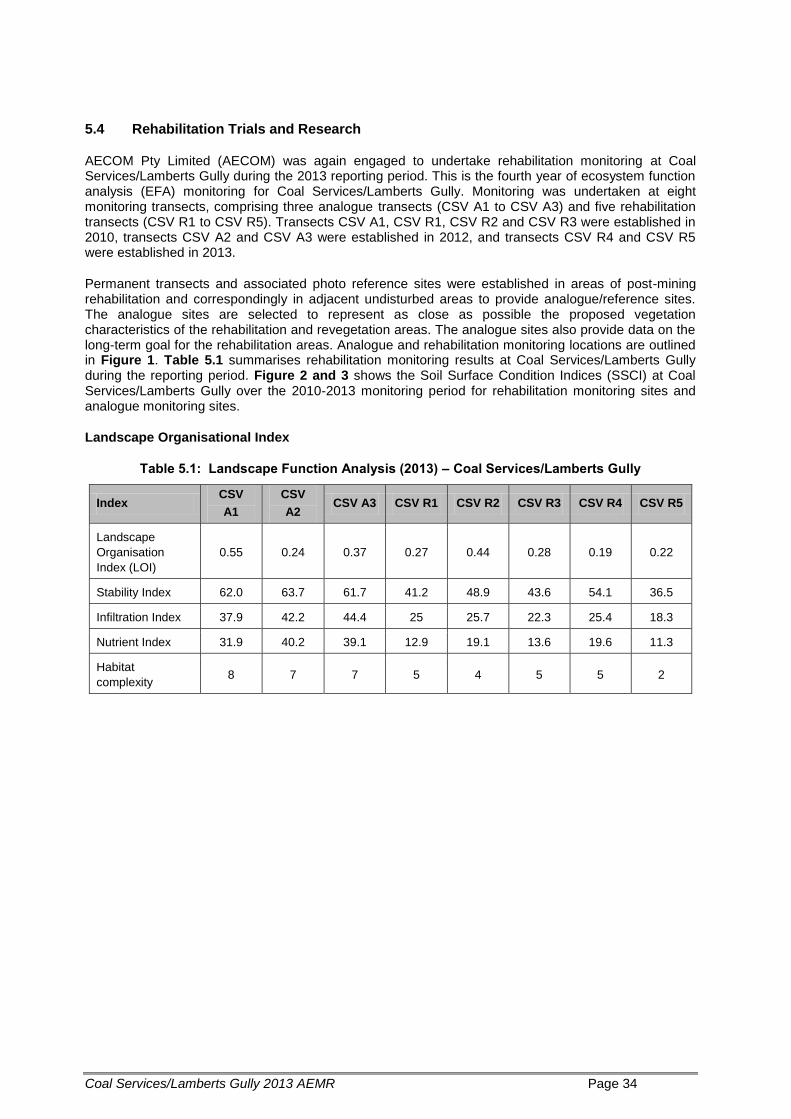
Coal Services/Lamberts Gully 2013 AEMR Page 34
5.4 Rehabilitation Trials and Research
AECOM Pty Limited (AECOM) was again engaged to undertake rehabilitation monitoring at Coal Services/Lamberts Gully during the 2013 reporting period. This is the fourth year of ecosystem function analysis (EFA) monitoring for Coal Services/Lamberts Gully. Monitoring was undertaken at eight monitoring transects, comprising three analogue transects (CSV A1 to CSV A3) and five rehabilitation transects (CSV R1 to CSV R5). Transects CSV A1, CSV R1, CSV R2 and CSV R3 were established in 2010, transects CSV A2 and CSV A3 were established in 2012, and transects CSV R4 and CSV R5 were established in 2013.
Permanent transects and associated photo reference sites were established in areas of post-mining rehabilitation and correspondingly in adjacent undisturbed areas to provide analogue/reference sites. The analogue sites are selected to represent as close as possible the proposed vegetation characteristics of the rehabilitation and revegetation areas. The analogue sites also provide data on the long-term goal for the rehabilitation areas. Analogue and rehabilitation monitoring locations are outlined in Figure 1. Table 5.1 summarises rehabilitation monitoring results at Coal Services/Lamberts Gully during the reporting period. Figure 2 and 3 shows the Soil Surface Condition Indices (SSCI) at Coal Services/Lamberts Gully over the 2010-2013 monitoring period for rehabilitation monitoring sites and analogue monitoring sites.
Landscape Organisational Index
Table 5.1: Landscape Function Analysis (2013) – Coal Services/Lamberts Gully
Index CSV
A1
CSV
A2 CSV A3 CSV R1 CSV R2 CSV R3 CSV R4 CSV R5
Landscape
Organisation
Index (LOI)
0.55 0.24 0.37 0.27 0.44 0.28 0.19 0.22
Stability Index 62.0 63.7 61.7 41.2 48.9 43.6 54.1 36.5
Infiltration Index 37.9 42.2 44.4 25 25.7 22.3 25.4 18.3
Nutrient Index 31.9 40.2 39.1 12.9 19.1 13.6 19.6 11.3
Habitat
complexity 8 7 7 5 4 5 5 2
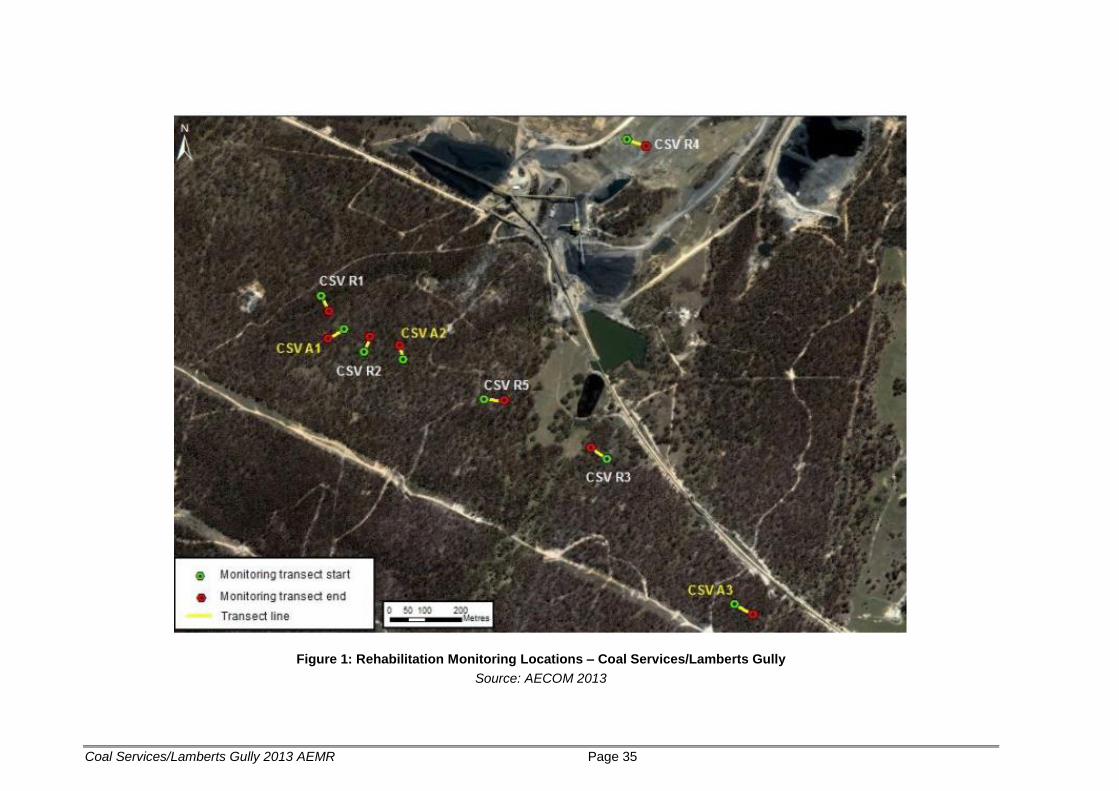
Coal Services/Lamberts Gully 2013 AEMR Page 35
Figure 1: Rehabilitation Monitoring Locations – Coal Services/Lamberts Gully
Source: AECOM 2013
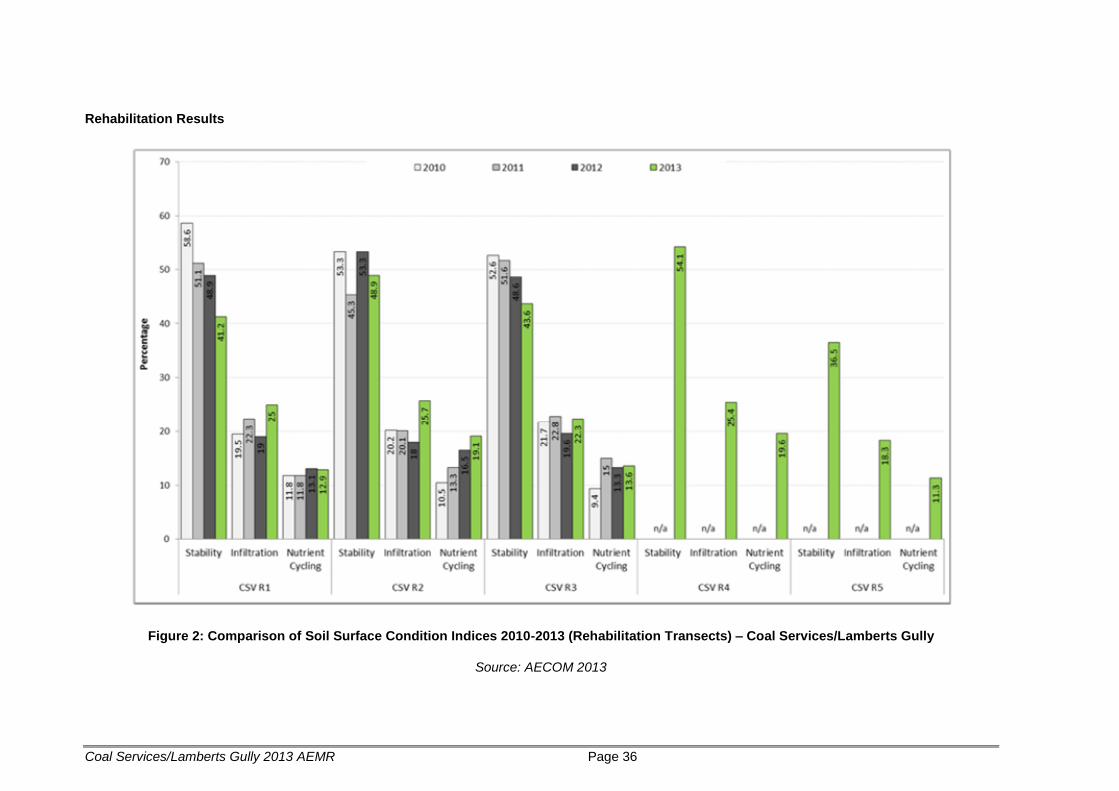
Coal Services/Lamberts Gully 2013 AEMR Page 36
Rehabilitation Results
Figure 2: Comparison of Soil Surface Condition Indices 2010-2013 (Rehabilitation Transects) – Coal Services/Lamberts Gully
Source: AECOM 2013
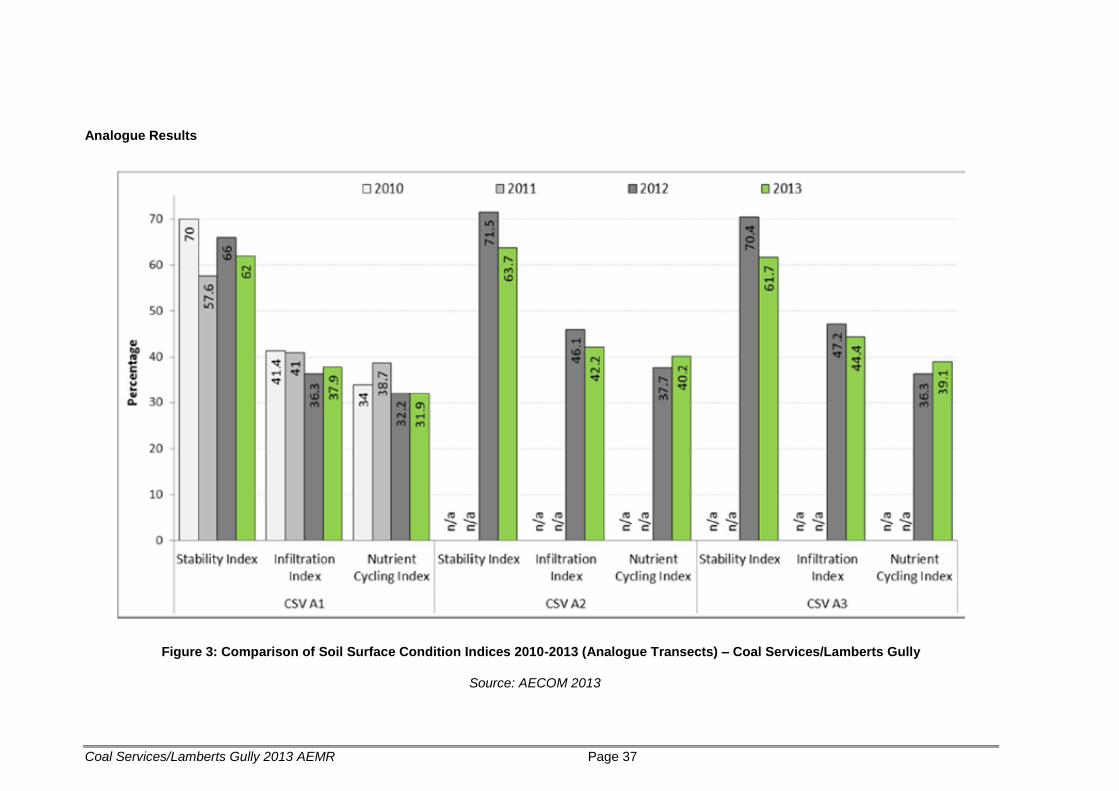
Coal Services/Lamberts Gully 2013 AEMR Page 37
Analogue Results
Figure 3: Comparison of Soil Surface Condition Indices 2010-2013 (Analogue Transects) – Coal Services/Lamberts Gully
Source: AECOM 2013
Coal Services/Lamberts Gully 2013 AEMR Page 38
Summary of Rehabilitation Monitoring Sites
New rehabilitation monitoring sites (CSV R4 and R5) were added in 2013 to the rehabilitation monitoring program. As these sites (CSV R4 and R5) have only recently been added, there is no comparison data from previous years of rehabilitation monitoring. In summary:
CSV R1
Stability – decrease from 49% in 2012 to 41% in 2013.
Infiltration – increase from 19% in 2012 to 25% in 2013.
Nutrient Cycling – no change with 13% in 2012 and 2013.
CSV R2
Stability – decrease from 53% in 2012 to 49% in 2013.
Infiltration – increase from 18% in 2012 to 26% in 2013.
Nutrient Cycling – increase from 17% in 2012 to 19% in 2013.
CSV R3
Stability – decrease from 49% in 2012 to 44% in 2013.
Infiltration – increase from 20% in 2012 to 22% in 2013.
Nutrient Cycling – no change with 13% in 2012 and 2013.
In summary:
The average stability percentage of the three sites (CSV R1, 2 and 3) decreased from 50% in 2012
to 45% in 2013.
The average infiltration percentage of the three sites (CSV R1, 2 and 3) increased from 19% in
2012 to 24% in 2013.
The average nutrient cycling percentage of the three sites (CSV R1, 2 and 3) increased from 14% in
2012 to 15% in 2013.
Summary of Analogue Sites
CSV A1
Stability – decrease from 66% in 2012 to 62% in 2013.
Infiltration – increase from 36% in 2012 to 38% in 2013.
Nutrient Cycling – No change with 32% in 2012 and 2013.
CSV A2
Stability – decrease from 72% in 2012 to 64% in 2013.
Infiltration – decrease from 46% in 2012 to 42% in 2013.
Nutrient Cycling – increase from 38% in 2012 to 40% in 2013.
CSV A3
Stability – decrease from 70% in 2012 to 62% in 2013.
Infiltration – decrease from 47% in 2012 to 44% in 2013.
Nutrient Cycling – increase from 36% in 2012 to 39% in 2013.
In summary:
The average stability percentage of the three sites (CSV A1, 2 and 3) decreased from 69% in 2012
to 62% in 2013.
The average infiltration percentage of the three sites (CSV A1, 2 and 3) decreased from 43% in
2012 to 41% in 2013.
The average nutrient cycling percentage of the three sites (CSV R1, 2 and 3) increased from 35% to
39%.
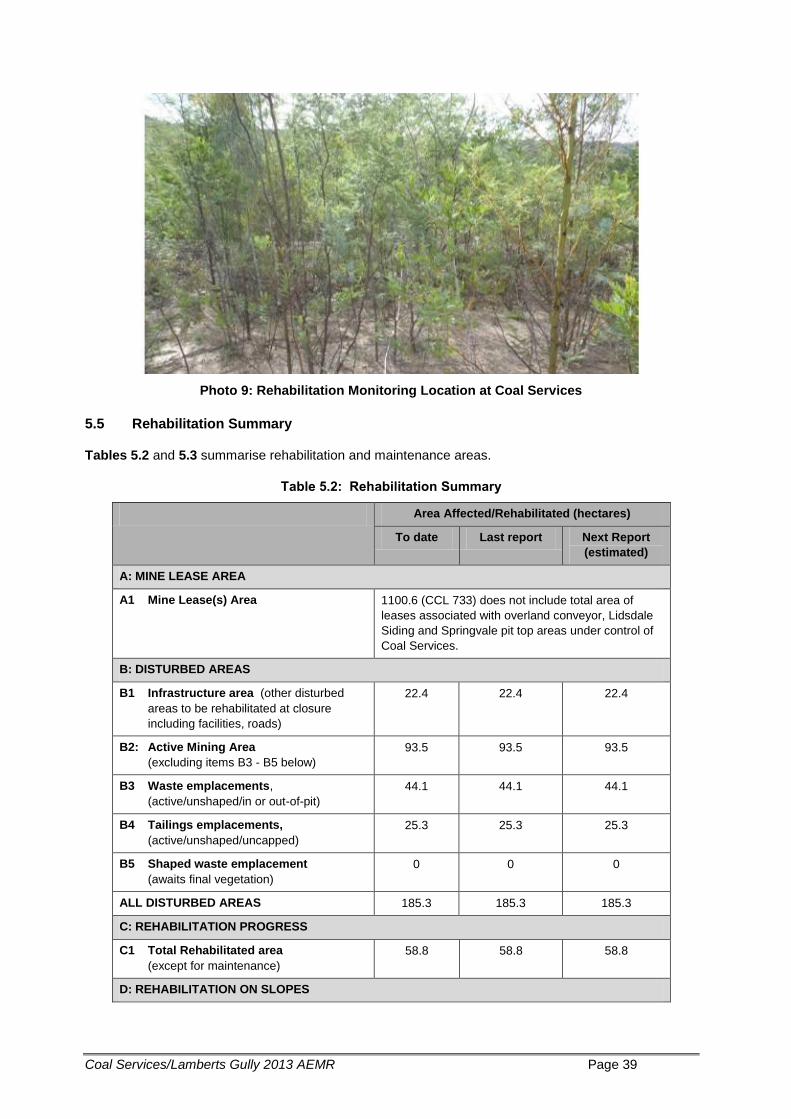
Coal Services/Lamberts Gully 2013 AEMR Page 39
Photo 9: Rehabilitation Monitoring Location at Coal Services
5.5 Rehabilitation Summary
Tables 5.2 and 5.3 summarise rehabilitation and maintenance areas.
Table 5.2: Rehabilitation Summary
Area Affected/Rehabilitated (hectares)
To date Last report Next Report
(estimated)
A: MINE LEASE AREA
A1 Mine Lease(s) Area 1100.6 (CCL 733) does not include total area of
leases associated with overland conveyor, Lidsdale
Siding and Springvale pit top areas under control of
Coal Services.
B: DISTURBED AREAS
B1 Infrastructure area (other disturbed
areas to be rehabilitated at closure
including facilities, roads)
22.4 22.4 22.4
B2: Active Mining Area
(excluding items B3 - B5 below)
93.5 93.5 93.5
B3 Waste emplacements,
(active/unshaped/in or out-of-pit)
44.1 44.1 44.1
B4 Tailings emplacements,
(active/unshaped/uncapped)
25.3 25.3 25.3
B5 Shaped waste emplacement
(awaits final vegetation)
0 0 0
ALL DISTURBED AREAS 185.3 185.3 185.3
C: REHABILITATION PROGRESS
C1 Total Rehabilitated area
(except for maintenance)
58.8 58.8 58.8
D: REHABILITATION ON SLOPES
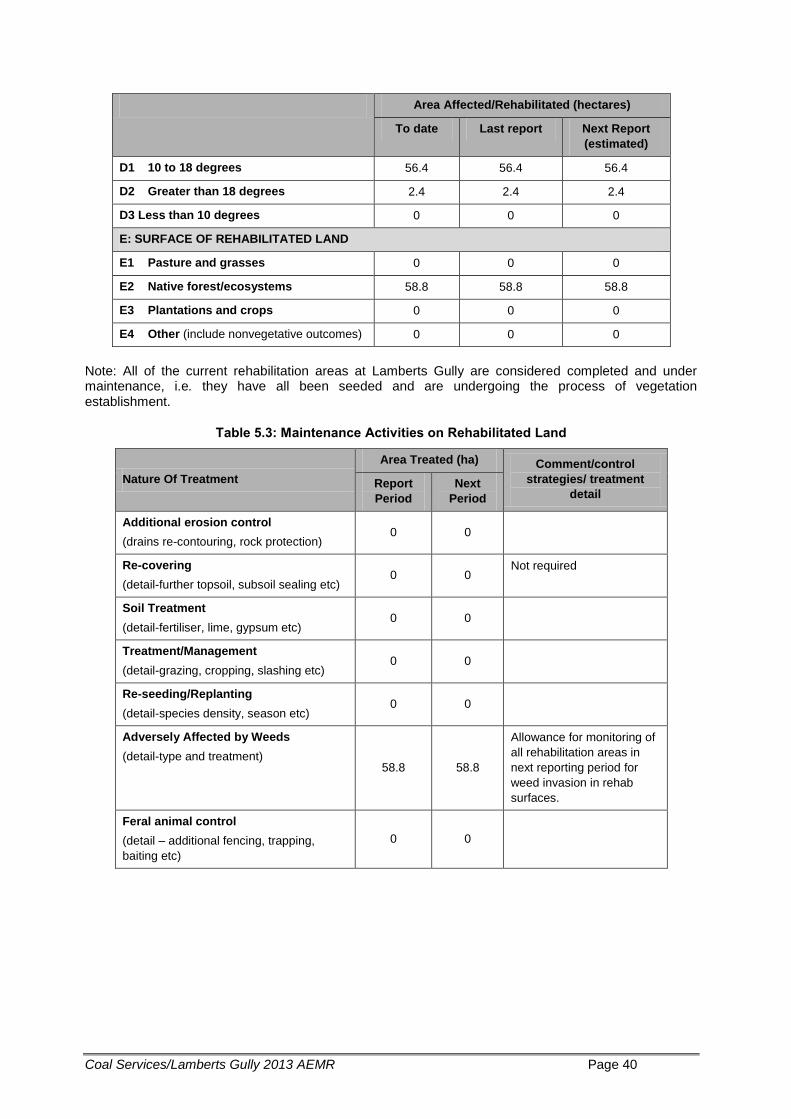
Coal Services/Lamberts Gully 2013 AEMR Page 40
Area Affected/Rehabilitated (hectares)
To date Last report Next Report
(estimated)
D1 10 to 18 degrees 56.4 56.4 56.4
D2 Greater than 18 degrees 2.4 2.4 2.4
D3 Less than 10 degrees 0 0 0
E: SURFACE OF REHABILITATED LAND
E1 Pasture and grasses 0 0 0
E2 Native forest/ecosystems 58.8 58.8 58.8
E3 Plantations and crops 0 0 0
E4 Other (include nonvegetative outcomes) 0 0 0
Note: All of the current rehabilitation areas at Lamberts Gully are considered completed and under maintenance, i.e. they have all been seeded and are undergoing the process of vegetation establishment.
Table 5.3: Maintenance Activities on Rehabilitated Land
Nature Of Treatment
Area Treated (ha) Comment/control
strategies/ treatment
detail Report
Period
Next
Period
Additional erosion control
(drains re-contouring, rock protection) 0 0
Re-covering
(detail-further topsoil, subsoil sealing etc) 0 0
Not required
Soil Treatment
(detail-fertiliser, lime, gypsum etc) 0 0
Treatment/Management
(detail-grazing, cropping, slashing etc) 0 0
Re-seeding/Replanting
(detail-species density, season etc) 0 0
Adversely Affected by Weeds
(detail-type and treatment) 58.8 58.8
Allowance for monitoring of
all rehabilitation areas in
next reporting period for
weed invasion in rehab
surfaces.
Feral animal control
(detail – additional fencing, trapping,
baiting etc)
0 0
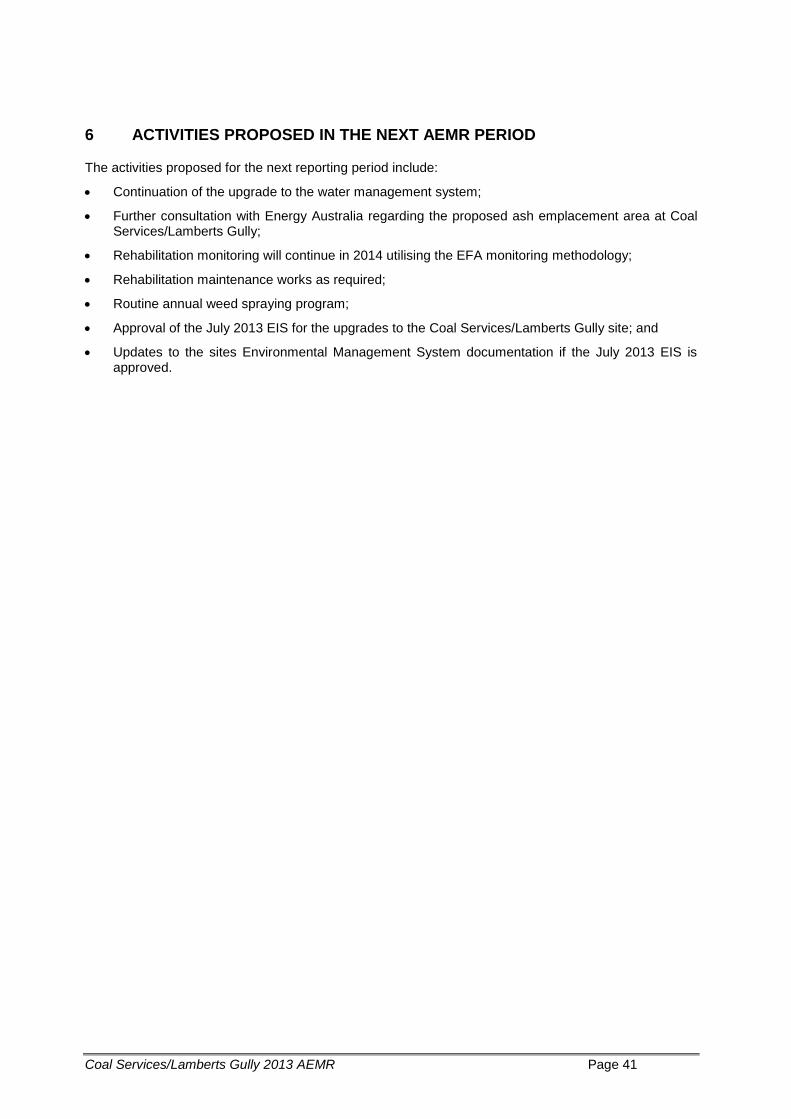
Coal Services/Lamberts Gully 2013 AEMR Page 41
6 ACTIVITIES PROPOSED IN THE NEXT AEMR PERIOD
The activities proposed for the next reporting period include:
Continuation of the upgrade to the water management system;
Further consultation with Energy Australia regarding the proposed ash emplacement area at Coal Services/Lamberts Gully;
Rehabilitation monitoring will continue in 2014 utilising the EFA monitoring methodology;
Rehabilitation maintenance works as required;
Routine annual weed spraying program;
Approval of the July 2013 EIS for the upgrades to the Coal Services/Lamberts Gully site; and
Updates to the sites Environmental Management System documentation if the July 2013 EIS is approved.
Appendix 1
Environment Protection Licence 3607
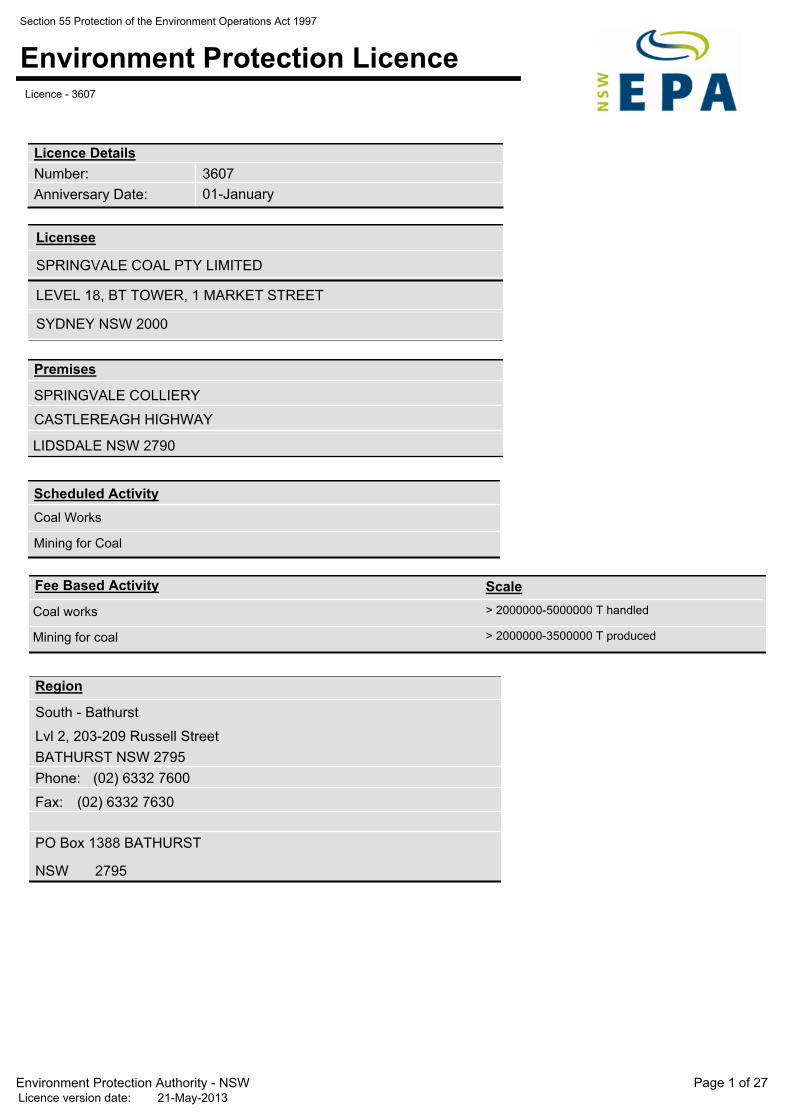
Section 55 Protection of the Environment Operations Act 1997
Environment Protection LicenceLicence - 3607
Number:
Licence Details
Anniversary Date:
3607
01-January
Licensee
SPRINGVALE COAL PTY LIMITED
LEVEL 18, BT TOWER, 1 MARKET STREET
SYDNEY NSW 2000
Premises
SPRINGVALE COLLIERY
CASTLEREAGH HIGHWAY
LIDSDALE NSW 2790
Scheduled Activity
Coal Works
Mining for Coal
Fee Based Activity Scale
Coal works > 2000000-5000000 T handled
Mining for coal > 2000000-3500000 T produced
Region
Phone:
Fax:
South - Bathurst
Lvl 2, 203-209 Russell Street
BATHURST NSW 2795
(02) 6332 7600
(02) 6332 7630
NSW 2795
PO Box 1388 BATHURST
Page 1 of 27Environment Protection Authority - NSWLicence version date: 21-May-2013
Section 55 Protection of the Environment Operations Act 1997
Environment Protection LicenceLicence - 3607
INFORMATION ABOUT THIS LICENCE -------------------------------------------------------------------------------------------------------------------------------------------------------------------------------------------------------------------------------------------------------------------------------------------------- 4
Dictionary ---------------------------------------------------------------------------------------------------------------------------------------- 4
Responsibilities of licensee ----------------------------------------------------------------------------------------------------------------- 4
Duration of licence ---------------------------------------------------------------------------------------------------------------------------- 4
Licence review ---------------------------------------------------------------------------------------------------------------------------------- 4
Fees and annual return to be sent to the EPA ----------------------------------------------------------------------------------------- 4
Transfer of licence ----------------------------------------------------------------------------------------------------------------------------- 5
Public register and access to monitoring data ----------------------------------------------------------------------------------------- 5
1 ADMINISTRATIVE CONDITIONS ------------------------------------------------------------------------------------------------------------------------------------------------------------------------------------------------------------------------------------------------------------------------------------------------------- 6
A1 What the licence authorises and regulates ------------------------------------------------------------------------------------- 6
A2 Premises or plant to which this licence applies -------------------------------------------------------------------------------- 6
A3 Information supplied to the EPA --------------------------------------------------------------------------------------------------- 6
2 DISCHARGES TO AIR AND WATER AND APPLICATIONS TO LAND ---------------------------------------------------------------------------------------------------------------------------------------------------------------------------------------------------------------------------------------------------------------------------- 7
P1 Location of monitoring/discharge points and areas -------------------------------------------------------------------------- 7
3 LIMIT CONDITIONS ---------------------------------------------------------------------------------------------------------------------------------------------------------------------------------------------------------------------------------------------------------------------------------------------------------------- 8
L1 Pollution of waters --------------------------------------------------------------------------------------------------------------------- 8
L2 Concentration limits ------------------------------------------------------------------------------------------------------------------- 8
L3 Volume and mass limits -------------------------------------------------------------------------------------------------------------- 11
L4 Noise limits ------------------------------------------------------------------------------------------------------------------------------- 11
4 OPERATING CONDITIONS ------------------------------------------------------------------------------------------------------------------------------------------------------------------------------------------------------------------------------------------------------------------------------------------------------------ 12
O1 Activities must be carried out in a competent manner ---------------------------------------------------------------------- 12
O2 Maintenance of plant and equipment -------------------------------------------------------------------------------------------- 12
O3 Dust --------------------------------------------------------------------------------------------------------------------------------------- 12
O4 Effluent application to land ---------------------------------------------------------------------------------------------------------- 12
O5 Waste management ------------------------------------------------------------------------------------------------------------------ 12
5 MONITORING AND RECORDING CONDITIONS --------------------------------------------------------------------------------------------------------------------------------------------------------------------------------------------------------------------------------------------------------------------------------------------- 13
M1 Monitoring records -------------------------------------------------------------------------------------------------------------------- 13
M2 Requirement to monitor concentration of pollutants discharged --------------------------------------------------------- 13
M3 Testing methods - concentration limits ------------------------------------------------------------------------------------------ 16
M4 Environmental monitoring ----------------------------------------------------------------------------------------------------------- 16
M5 Recording of pollution complaints ------------------------------------------------------------------------------------------------ 17
M6 Telephone complaints line ---------------------------------------------------------------------------------------------------------- 17
M7 Requirement to monitor volume or mass --------------------------------------------------------------------------------------- 17
6 REPORTING CONDITIONS ------------------------------------------------------------------------------------------------------------------------------------------------------------------------------------------------------------------------------------------------------------------------------------------------------------ 18
Page 2 of 27Environment Protection Authority - NSWLicence version date: 21-May-2013
Section 55 Protection of the Environment Operations Act 1997
Environment Protection LicenceLicence - 3607
R1 Annual return documents ------------------------------------------------------------------------------------------------------------ 18
R2 Notification of environmental harm ----------------------------------------------------------------------------------------------- 19
R3 Written report --------------------------------------------------------------------------------------------------------------------------- 19
7 GENERAL CONDITIONS -------------------------------------------------------------------------------------------------------------------------------------------------------------------------------------------------------------------------------------------------------------------------------------------------------------- 20
G1 Copy of licence kept at the premises or plant --------------------------------------------------------------------------------- 20
G2 Signage ---------------------------------------------------------------------------------------------------------------------------------- 20
8 POLLUTION STUDIES AND REDUCTION PROGRAMS ---------------------------------------------------------------------------------------------------------------------------------------------------------------------------------------------------------------------------------------------------------------------------------------- 21
U1 Sediment dam storage capacities ------------------------------------------------------------------------------------------------- 21
U2 Groundwater seepage interception system ------------------------------------------------------------------------------------ 21
U3 Assessment of potential impacts of pollutants at LDP6 --------------------------------------------------------------------- 21
9 SPECIAL CONDITIONS -------------------------------------------------------------------------------------------------------------------------------------------------------------------------------------------------------------------------------------------------------------------------------------------------------------- 22
E1 Emergency Discharges to Wolgan River ---------------------------------------------------------------------------------------- 22
E2 Option Study to treat Mine Water Discharge ----------------------------------------------------------------------------------- 23
DICTIONARY ---------------------------------------------------------------------------------------------------------------------------------------------------------------------------------------------------------------------------------------------------------------------------------------------------------------------- 24
General Dictionary ----------------------------------------------------------------------------------------------------------------------------- 24
Page 3 of 27Environment Protection Authority - NSWLicence version date: 21-May-2013
Section 55 Protection of the Environment Operations Act 1997
Environment Protection LicenceLicence - 3607
Information about this licence
Dictionary
A definition of terms used in the licence can be found in the dictionary at the end of this licence.
Responsibilities of licensee
Separate to the requirements of this licence, general obligations of licensees are set out in the Protection of the Environment Operations Act 1997 (“the Act”) and the Regulations made under the Act. These include obligations to:
ensure persons associated with you comply with this licence, as set out in section 64 of the Act; control the pollution of waters and the pollution of air (see for example sections 120 - 132 of the Act);
and report incidents causing or threatening material environmental harm to the environment, as set out in
Part 5.7 of the Act.
Variation of licence conditions
The licence holder can apply to vary the conditions of this licence. An application form for this purpose is available from the EPA.
The EPA may also vary the conditions of the licence at any time by written notice without an application being made.
Where a licence has been granted in relation to development which was assessed under the Environmental Planning and Assessment Act 1979 in accordance with the procedures applying to integrated development, the EPA may not impose conditions which are inconsistent with the development consent conditions until the licence is first reviewed under Part 3.6 of the Act.
Duration of licence
This licence will remain in force until the licence is surrendered by the licence holder or until it is suspended or revoked by the EPA or the Minister. A licence may only be surrendered with the written approval of the EPA.
Licence review
The Act requires that the EPA review your licence at least every 5 years after the issue of the licence, as set out in Part 3.6 and Schedule 5 of the Act. You will receive advance notice of the licence review.
Fees and annual return to be sent to the EPA
For each licence fee period you must pay:
an administrative fee; and a load-based fee (if applicable).
Page 4 of 27Environment Protection Authority - NSWLicence version date: 21-May-2013
Section 55 Protection of the Environment Operations Act 1997
Environment Protection LicenceLicence - 3607
The EPA publication “A Guide to Licensing” contains information about how to calculate your licence fees. The licence requires that an Annual Return, comprising a Statement of Compliance and a summary of any monitoring required by the licence (including the recording of complaints), be submitted to the EPA. The Annual Return must be submitted within 60 days after the end of each reporting period. See condition R1 regarding the Annual Return reporting requirements. Usually the licence fee period is the same as the reporting period.
Transfer of licence
The licence holder can apply to transfer the licence to another person. An application form for this purpose is available from the EPA.
Public register and access to monitoring data
Part 9.5 of the Act requires the EPA to keep a public register of details and decisions of the EPA in relation to, for example: licence applications; licence conditions and variations; statements of compliance; load based licensing information; and load reduction agreements. Under s320 of the Act application can be made to the EPA for access to monitoring data which has been submitted to the EPA by licensees.
This licence is issued to:
SPRINGVALE COAL PTY LIMITED
LEVEL 18, BT TOWER, 1 MARKET STREET
SYDNEY NSW 2000
subject to the conditions which follow.
Page 5 of 27Environment Protection Authority - NSWLicence version date: 21-May-2013
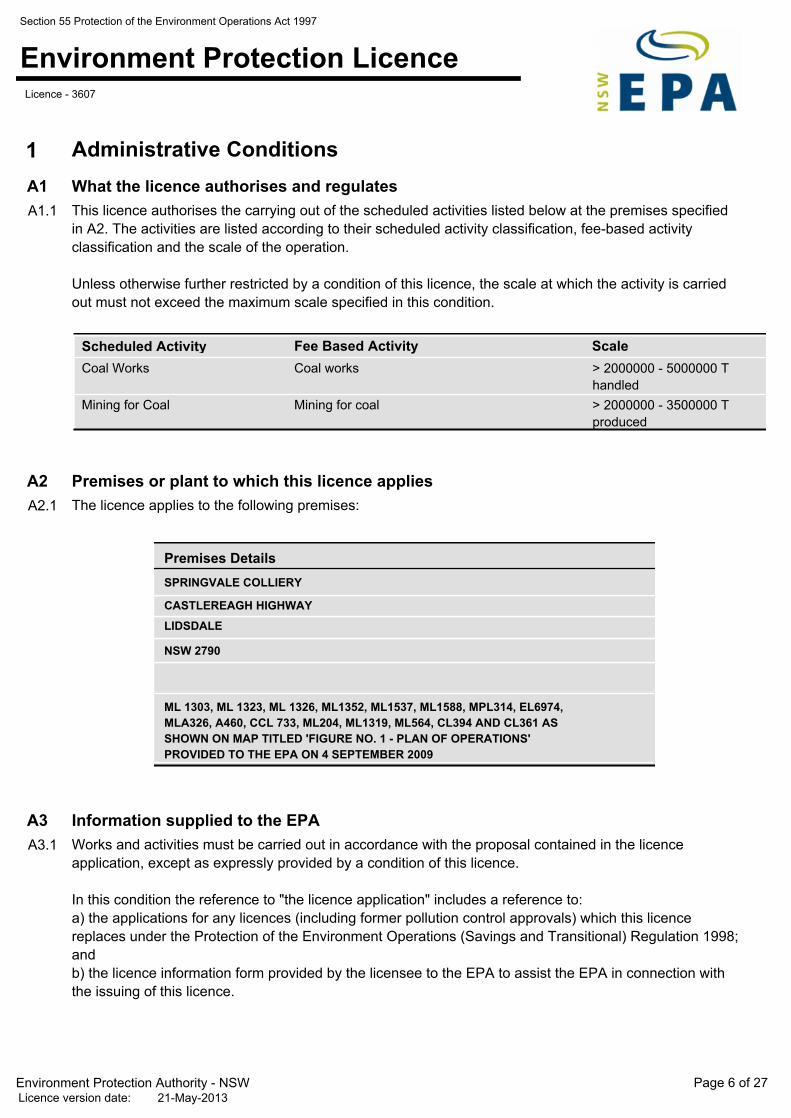
Section 55 Protection of the Environment Operations Act 1997
Environment Protection LicenceLicence - 3607
Administrative Conditions 1
What the licence authorises and regulatesA1
A1.1 This licence authorises the carrying out of the scheduled activities listed below at the premises specified
in A2. The activities are listed according to their scheduled activity classification, fee-based activity
classification and the scale of the operation.
Unless otherwise further restricted by a condition of this licence, the scale at which the activity is carried
out must not exceed the maximum scale specified in this condition.
Scheduled Activity Fee Based Activity Scale
> 2000000 - 5000000 T
handled
Coal worksCoal Works
> 2000000 - 3500000 T
produced
Mining for coalMining for Coal
Premises or plant to which this licence appliesA2
A2.1 The licence applies to the following premises:
Premises Details
SPRINGVALE COLLIERY
CASTLEREAGH HIGHWAY
LIDSDALE
NSW 2790
ML 1303, ML 1323, ML 1326, ML1352, ML1537, ML1588, MPL314, EL6974,
MLA326, A460, CCL 733, ML204, ML1319, ML564, CL394 AND CL361 AS
SHOWN ON MAP TITLED 'FIGURE NO. 1 - PLAN OF OPERATIONS'
PROVIDED TO THE EPA ON 4 SEPTEMBER 2009
Information supplied to the EPAA3
A3.1 Works and activities must be carried out in accordance with the proposal contained in the licence
application, except as expressly provided by a condition of this licence.
In this condition the reference to "the licence application" includes a reference to:
a) the applications for any licences (including former pollution control approvals) which this licence
replaces under the Protection of the Environment Operations (Savings and Transitional) Regulation 1998;
and
b) the licence information form provided by the licensee to the EPA to assist the EPA in connection with
the issuing of this licence.
Page 6 of 27Environment Protection Authority - NSWLicence version date: 21-May-2013
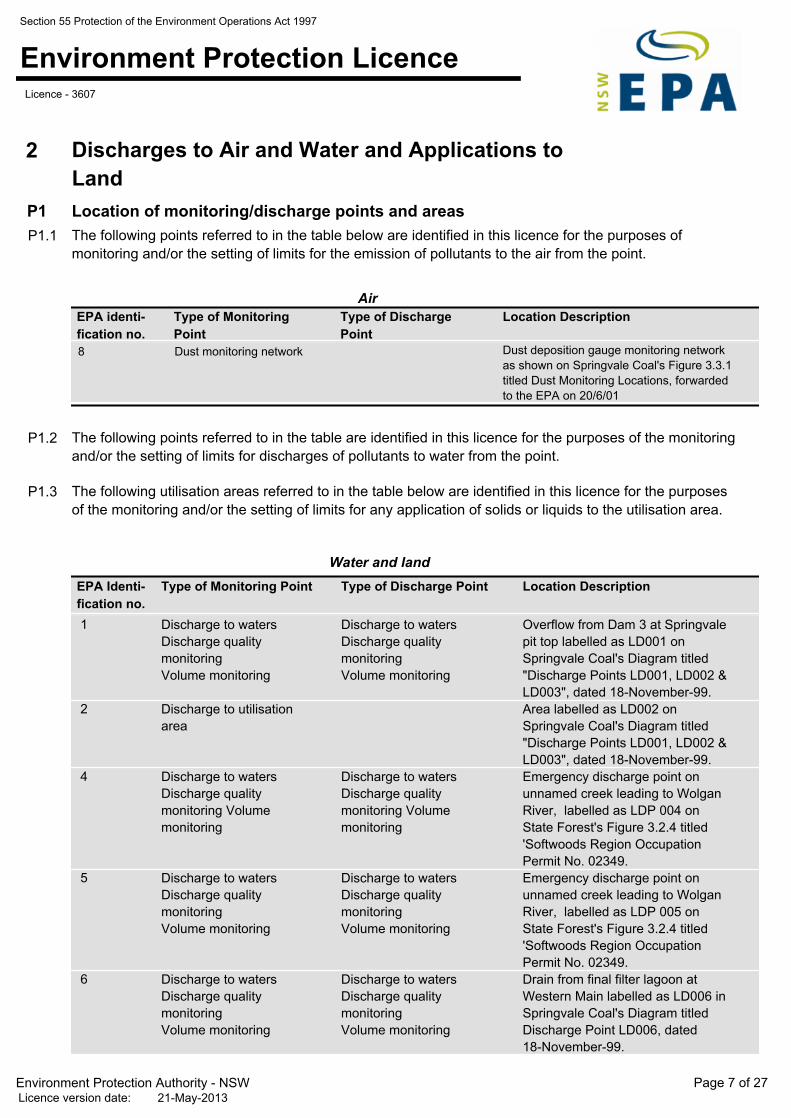
Section 55 Protection of the Environment Operations Act 1997
Environment Protection LicenceLicence - 3607
Discharges to Air and Water and Applications to
Land
2
Location of monitoring/discharge points and areasP1
P1.1 The following points referred to in the table below are identified in this licence for the purposes of
monitoring and/or the setting of limits for the emission of pollutants to the air from the point.
Air
Location DescriptionType of Monitoring
Point
EPA identi-
fication no.
Type of Discharge
PointDust deposition gauge monitoring network
as shown on Springvale Coal's Figure 3.3.1
titled Dust Monitoring Locations, forwarded
to the EPA on 20/6/01
8 Dust monitoring network
P1.2 The following points referred to in the table are identified in this licence for the purposes of the monitoring
and/or the setting of limits for discharges of pollutants to water from the point.
P1.3 The following utilisation areas referred to in the table below are identified in this licence for the purposes
of the monitoring and/or the setting of limits for any application of solids or liquids to the utilisation area.
Water and land
Location DescriptionType of Monitoring PointEPA Identi-
fication no.
Type of Discharge Point
Overflow from Dam 3 at Springvale
pit top labelled as LD001 on
Springvale Coal's Diagram titled
"Discharge Points LD001, LD002 &
LD003", dated 18-November-99.
1 Discharge to waters
Discharge quality
monitoring
Volume monitoring
Discharge to waters
Discharge quality
monitoring
Volume monitoring
Area labelled as LD002 on
Springvale Coal's Diagram titled
"Discharge Points LD001, LD002 &
LD003", dated 18-November-99.
2 Discharge to utilisation
area
Emergency discharge point on
unnamed creek leading to Wolgan
River, labelled as LDP 004 on
State Forest's Figure 3.2.4 titled
'Softwoods Region Occupation
Permit No. 02349.
4 Discharge to waters
Discharge quality
monitoring Volume
monitoring
Discharge to waters
Discharge quality
monitoring Volume
monitoring
Emergency discharge point on
unnamed creek leading to Wolgan
River, labelled as LDP 005 on
State Forest's Figure 3.2.4 titled
'Softwoods Region Occupation
Permit No. 02349.
5 Discharge to waters
Discharge quality
monitoring
Volume monitoring
Discharge to waters
Discharge quality
monitoring
Volume monitoring
Drain from final filter lagoon at
Western Main labelled as LD006 in
Springvale Coal's Diagram titled
Discharge Point LD006, dated
18-November-99.
6 Discharge to waters
Discharge quality
monitoring
Volume monitoring
Discharge to waters
Discharge quality
monitoring
Volume monitoring
Page 7 of 27Environment Protection Authority - NSWLicence version date: 21-May-2013
Section 55 Protection of the Environment Operations Act 1997
Environment Protection LicenceLicence - 3607
Duncan Street coal conveyor
transfer drain from final filter lagoon
at Western Main labelled as LD007
in Springvale Coal's Diagram titled
as LD007, dated 18-November-99
7 Discharge to waters
Discharge quality
monitoring
Discharge to waters
Discharge quality
monitoring
Centennial's Springvale Water
Transfer System bypass point east
of Kerosene Vale Ash Dam.
9 Discharges to waters
Discharge quality
monitoring
Volume monitoring
Discharges to waters
Discharge quality
monitoring
Volume monitoring
Emergency/maintenance discharge
from Centennial's Springvale Water
Transfer Scheme upstream of the
settling ponds.
10 Discharge to waters
Discharge quality
monitoring
Volume monitoring
Discharge to waters
Discharge quality
monitoring
Volume monitoring
Note: Licensed discharge points 4 (LD4) and 5 (LD5) are only to be used for emergency discharges as defined
in condition E1.1.
Limit Conditions 3
Pollution of watersL1
L1.1 Except as may be expressly provided in any other condition of this licence, the licensee must comply with
section 120 of the Protection of the Environment Operations Act 1997.
Concentration limitsL2
L2.1 For each monitoring/discharge point or utilisation area specified in the table\s below (by a point number),
the concentration of a pollutant discharged at that point, or applied to that area, must not exceed the
concentration limits specified for that pollutant in the table.
L2.2 Where a pH quality limit is specified in the table, the specified percentage of samples must be within the
specified ranges.
L2.3 To avoid any doubt, this condition does not authorise the pollution of waters by any pollutant other than
those specified in the table\s.
L2.4 Water and/or Land Concentration Limits
Pollutant Units of Measure 100 percentile
concentration
limit
POINT 1
50 percentile
concentration
limit
90 percentile
concentration
limit
3DGM
concentration
limit
10milligrams per litreOil and
Grease
Page 8 of 27Environment Protection Authority - NSWLicence version date: 21-May-2013
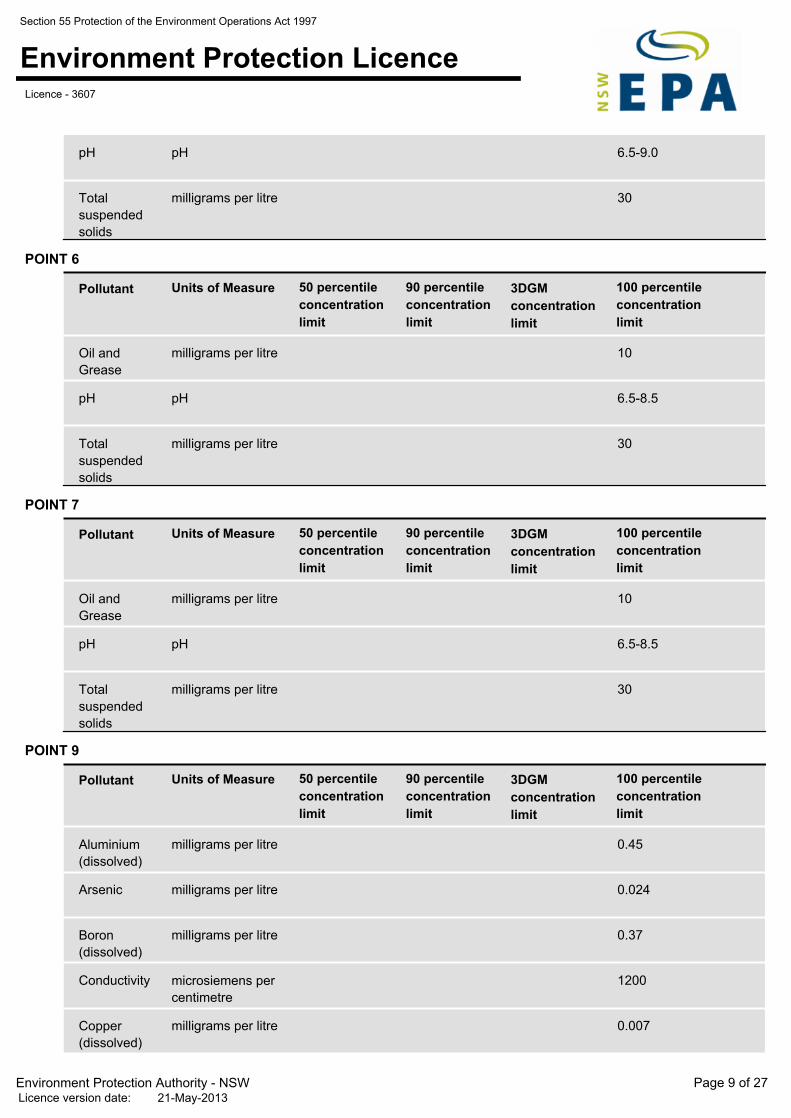
Section 55 Protection of the Environment Operations Act 1997
Environment Protection LicenceLicence - 3607
6.5-9.0pHpH
30milligrams per litreTotal
suspended
solids
Pollutant Units of Measure 100 percentile
concentration
limit
POINT 6
50 percentile
concentration
limit
90 percentile
concentration
limit
3DGM
concentration
limit
10milligrams per litreOil and
Grease
6.5-8.5pHpH
30milligrams per litreTotal
suspended
solids
Pollutant Units of Measure 100 percentile
concentration
limit
POINT 7
50 percentile
concentration
limit
90 percentile
concentration
limit
3DGM
concentration
limit
10milligrams per litreOil and
Grease
6.5-8.5pHpH
30milligrams per litreTotal
suspended
solids
Pollutant Units of Measure 100 percentile
concentration
limit
POINT 9
50 percentile
concentration
limit
90 percentile
concentration
limit
3DGM
concentration
limit
0.45milligrams per litreAluminium
(dissolved)
0.024milligrams per litreArsenic
0.37milligrams per litreBoron
(dissolved)
1200microsiemens per
centimetre
Conductivity
0.007milligrams per litreCopper
(dissolved)
Page 9 of 27Environment Protection Authority - NSWLicence version date: 21-May-2013
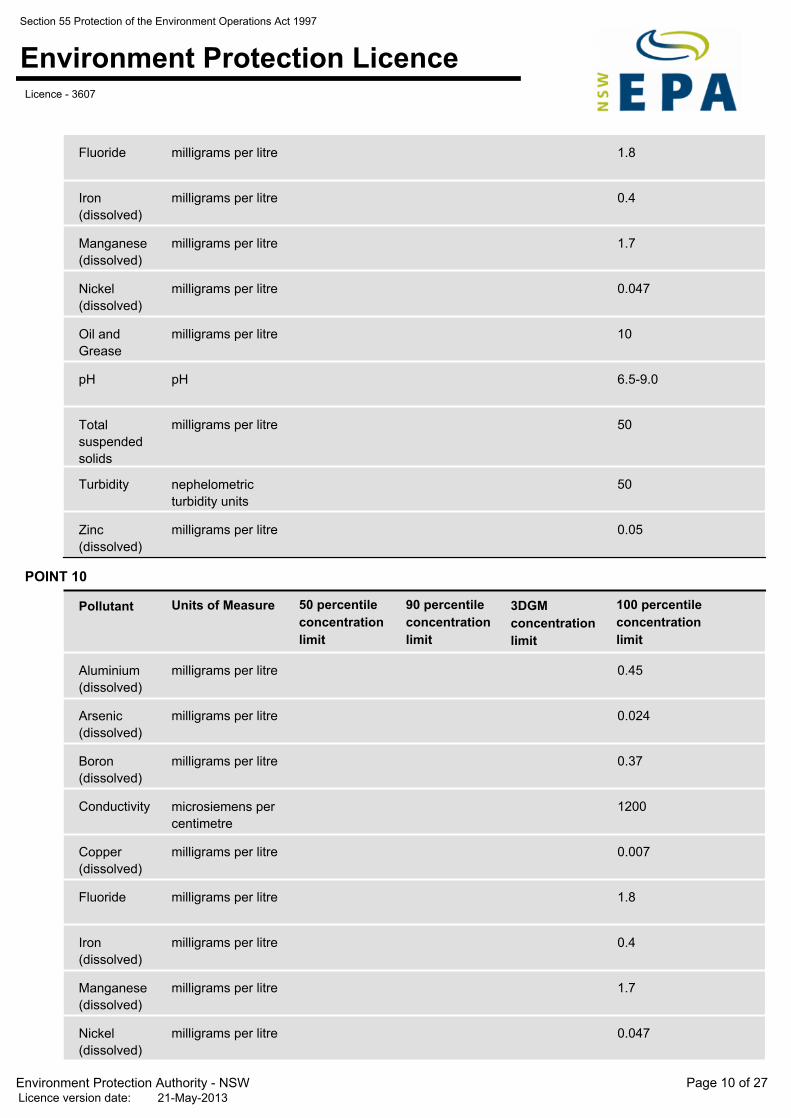
Section 55 Protection of the Environment Operations Act 1997
Environment Protection LicenceLicence - 3607
1.8milligrams per litreFluoride
0.4milligrams per litreIron
(dissolved)
1.7milligrams per litreManganese
(dissolved)
0.047milligrams per litreNickel
(dissolved)
10milligrams per litreOil and
Grease
6.5-9.0pHpH
50milligrams per litreTotal
suspended
solids
50nephelometric
turbidity units
Turbidity
0.05milligrams per litreZinc
(dissolved)
Pollutant Units of Measure 100 percentile
concentration
limit
POINT 10
50 percentile
concentration
limit
90 percentile
concentration
limit
3DGM
concentration
limit
0.45milligrams per litreAluminium
(dissolved)
0.024milligrams per litreArsenic
(dissolved)
0.37milligrams per litreBoron
(dissolved)
1200microsiemens per
centimetre
Conductivity
0.007milligrams per litreCopper
(dissolved)
1.8milligrams per litreFluoride
0.4milligrams per litreIron
(dissolved)
1.7milligrams per litreManganese
(dissolved)
0.047milligrams per litreNickel
(dissolved)
Page 10 of 27Environment Protection Authority - NSWLicence version date: 21-May-2013
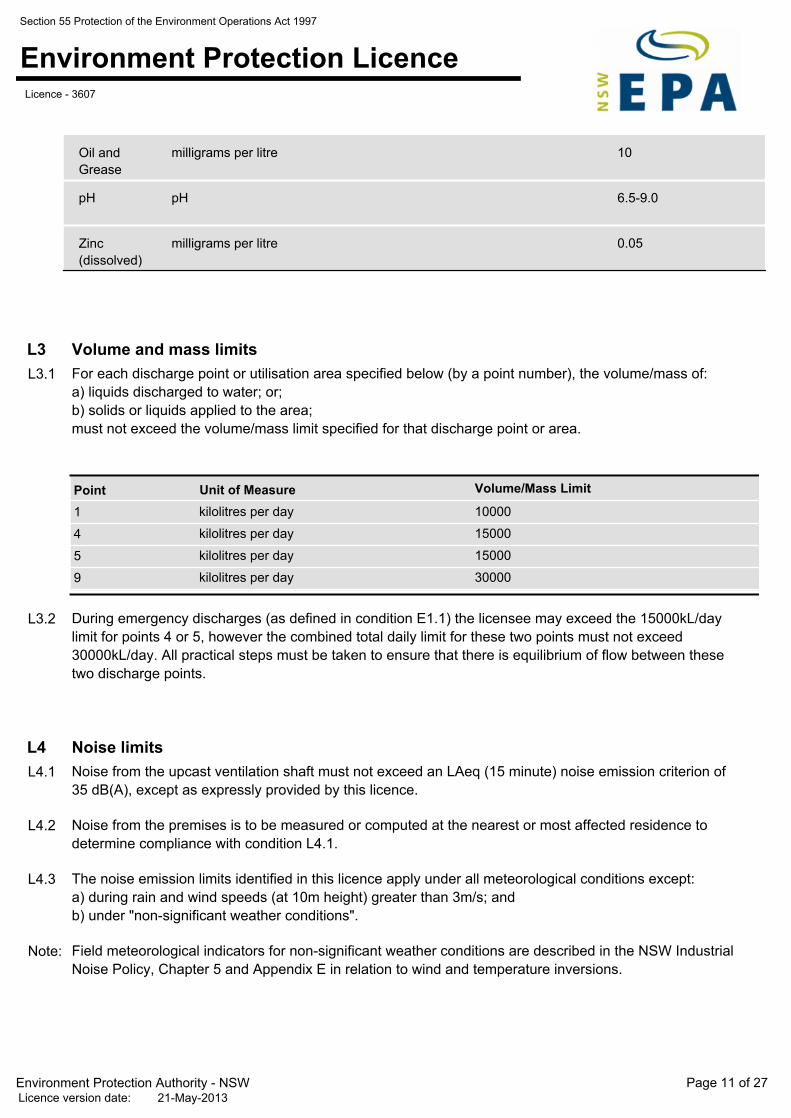
Section 55 Protection of the Environment Operations Act 1997
Environment Protection LicenceLicence - 3607
10milligrams per litreOil and
Grease
6.5-9.0pHpH
0.05milligrams per litreZinc
(dissolved)
Volume and mass limitsL3
L3.1 For each discharge point or utilisation area specified below (by a point number), the volume/mass of:
a) liquids discharged to water; or;
b) solids or liquids applied to the area;
must not exceed the volume/mass limit specified for that discharge point or area.
Volume/Mass LimitUnit of MeasurePoint
10000kilolitres per day1
15000kilolitres per day4
15000kilolitres per day5
30000kilolitres per day9
L3.2 During emergency discharges (as defined in condition E1.1) the licensee may exceed the 15000kL/day
limit for points 4 or 5, however the combined total daily limit for these two points must not exceed
30000kL/day. All practical steps must be taken to ensure that there is equilibrium of flow between these
two discharge points.
Noise limitsL4
L4.1 Noise from the upcast ventilation shaft must not exceed an LAeq (15 minute) noise emission criterion of
35 dB(A), except as expressly provided by this licence.
L4.2 Noise from the premises is to be measured or computed at the nearest or most affected residence to
determine compliance with condition L4.1.
L4.3 The noise emission limits identified in this licence apply under all meteorological conditions except:
a) during rain and wind speeds (at 10m height) greater than 3m/s; and
b) under "non-significant weather conditions".
Note: Field meteorological indicators for non-significant weather conditions are described in the NSW Industrial
Noise Policy, Chapter 5 and Appendix E in relation to wind and temperature inversions.
Page 11 of 27Environment Protection Authority - NSWLicence version date: 21-May-2013
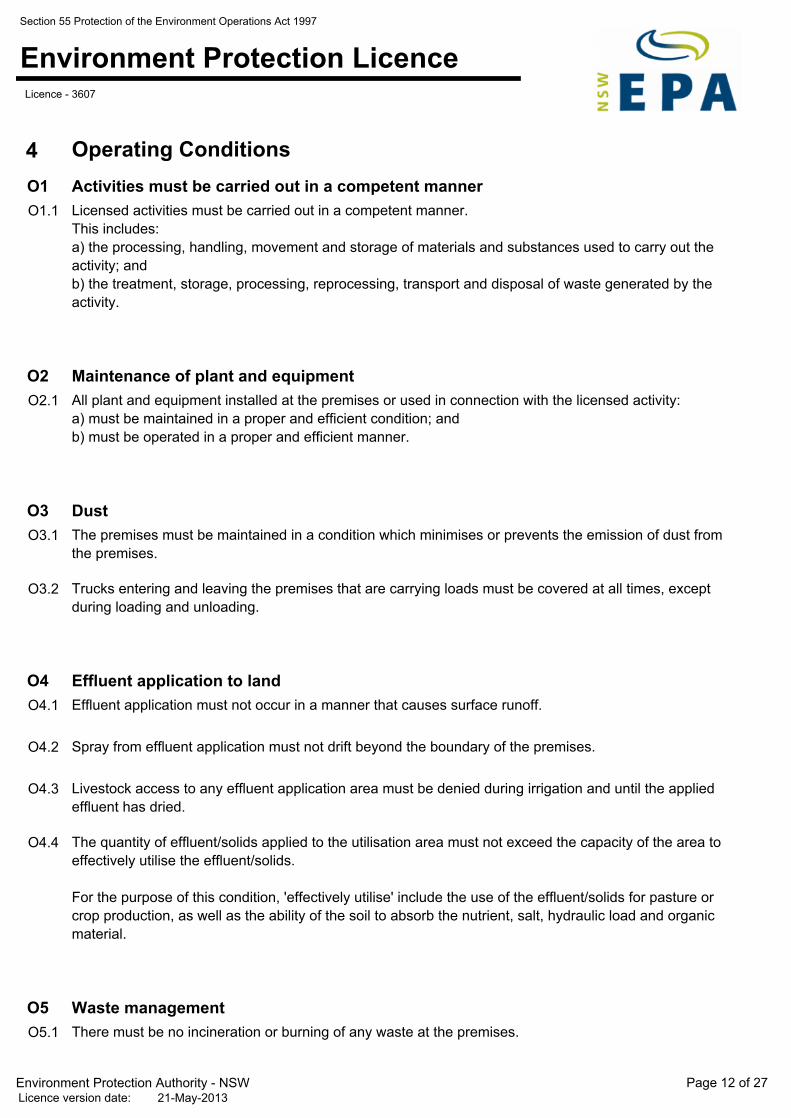
Section 55 Protection of the Environment Operations Act 1997
Environment Protection LicenceLicence - 3607
Operating Conditions 4
Activities must be carried out in a competent mannerO1
O1.1 Licensed activities must be carried out in a competent manner.
This includes:
a) the processing, handling, movement and storage of materials and substances used to carry out the
activity; and
b) the treatment, storage, processing, reprocessing, transport and disposal of waste generated by the
activity.
Maintenance of plant and equipmentO2
O2.1 All plant and equipment installed at the premises or used in connection with the licensed activity:
a) must be maintained in a proper and efficient condition; and
b) must be operated in a proper and efficient manner.
DustO3
O3.1 The premises must be maintained in a condition which minimises or prevents the emission of dust from
the premises.
O3.2 Trucks entering and leaving the premises that are carrying loads must be covered at all times, except
during loading and unloading.
Effluent application to landO4
O4.1 Effluent application must not occur in a manner that causes surface runoff.
O4.2 Spray from effluent application must not drift beyond the boundary of the premises.
O4.3 Livestock access to any effluent application area must be denied during irrigation and until the applied
effluent has dried.
O4.4 The quantity of effluent/solids applied to the utilisation area must not exceed the capacity of the area to
effectively utilise the effluent/solids.
For the purpose of this condition, 'effectively utilise' include the use of the effluent/solids for pasture or
crop production, as well as the ability of the soil to absorb the nutrient, salt, hydraulic load and organic
material.
Waste managementO5
O5.1 There must be no incineration or burning of any waste at the premises.
Page 12 of 27Environment Protection Authority - NSWLicence version date: 21-May-2013
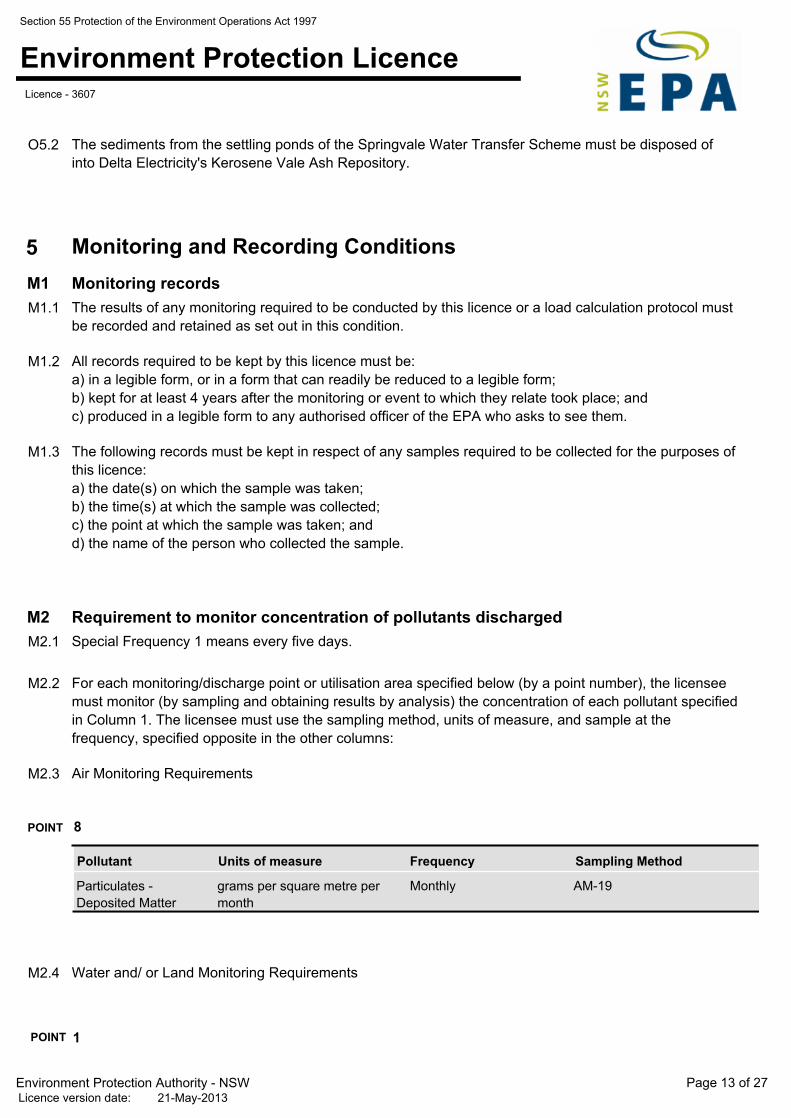
Section 55 Protection of the Environment Operations Act 1997
Environment Protection LicenceLicence - 3607
O5.2 The sediments from the settling ponds of the Springvale Water Transfer Scheme must be disposed of
into Delta Electricity's Kerosene Vale Ash Repository.
Monitoring and Recording Conditions 5
Monitoring recordsM1
M1.1 The results of any monitoring required to be conducted by this licence or a load calculation protocol must
be recorded and retained as set out in this condition.
M1.2 All records required to be kept by this licence must be:
a) in a legible form, or in a form that can readily be reduced to a legible form;
b) kept for at least 4 years after the monitoring or event to which they relate took place; and
c) produced in a legible form to any authorised officer of the EPA who asks to see them.
M1.3 The following records must be kept in respect of any samples required to be collected for the purposes of
this licence:
a) the date(s) on which the sample was taken;
b) the time(s) at which the sample was collected;
c) the point at which the sample was taken; and
d) the name of the person who collected the sample.
Requirement to monitor concentration of pollutants dischargedM2
M2.1 Special Frequency 1 means every five days.
M2.2 For each monitoring/discharge point or utilisation area specified below (by a point number), the licensee
must monitor (by sampling and obtaining results by analysis) the concentration of each pollutant specified
in Column 1. The licensee must use the sampling method, units of measure, and sample at the
frequency, specified opposite in the other columns:
M2.3 Air Monitoring Requirements
8POINT
Sampling MethodFrequencyUnits of measurePollutant
Particulates -
Deposited Matter
grams per square metre per
month
AM-19Monthly
M2.4 Water and/ or Land Monitoring Requirements
1POINT
Page 13 of 27Environment Protection Authority - NSWLicence version date: 21-May-2013
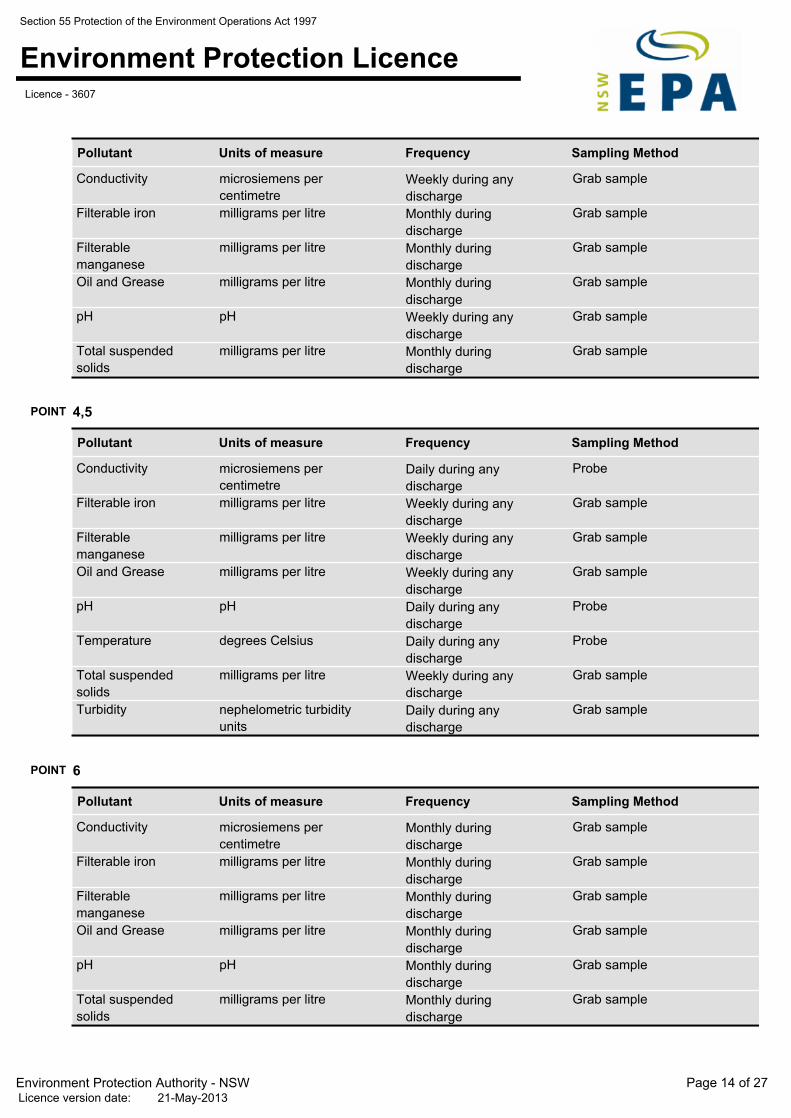
Section 55 Protection of the Environment Operations Act 1997
Environment Protection LicenceLicence - 3607
Sampling MethodFrequencyUnits of measurePollutant
Grab samplemicrosiemens per
centimetre
Conductivity Weekly during any
discharge
Grab samplemilligrams per litreFilterable iron Monthly during
discharge
Grab samplemilligrams per litreFilterable
manganeseMonthly during
discharge
Grab samplemilligrams per litreOil and Grease Monthly during
discharge
Grab samplepHpH Weekly during any
discharge
Grab samplemilligrams per litreTotal suspended
solidsMonthly during
discharge
4,5POINT
Sampling MethodFrequencyUnits of measurePollutant
Probemicrosiemens per
centimetre
Conductivity Daily during any
discharge
Grab samplemilligrams per litreFilterable iron Weekly during any
discharge
Grab samplemilligrams per litreFilterable
manganeseWeekly during any
discharge
Grab samplemilligrams per litreOil and Grease Weekly during any
discharge
ProbepHpH Daily during any
discharge
Probedegrees CelsiusTemperature Daily during any
discharge
Grab samplemilligrams per litreTotal suspended
solidsWeekly during any
discharge
Grab samplenephelometric turbidity
units
Turbidity Daily during any
discharge
6POINT
Sampling MethodFrequencyUnits of measurePollutant
Grab samplemicrosiemens per
centimetre
Conductivity Monthly during
discharge
Grab samplemilligrams per litreFilterable iron Monthly during
discharge
Grab samplemilligrams per litreFilterable
manganeseMonthly during
discharge
Grab samplemilligrams per litreOil and Grease Monthly during
discharge
Grab samplepHpH Monthly during
discharge
Grab samplemilligrams per litreTotal suspended
solidsMonthly during
discharge
Page 14 of 27Environment Protection Authority - NSWLicence version date: 21-May-2013
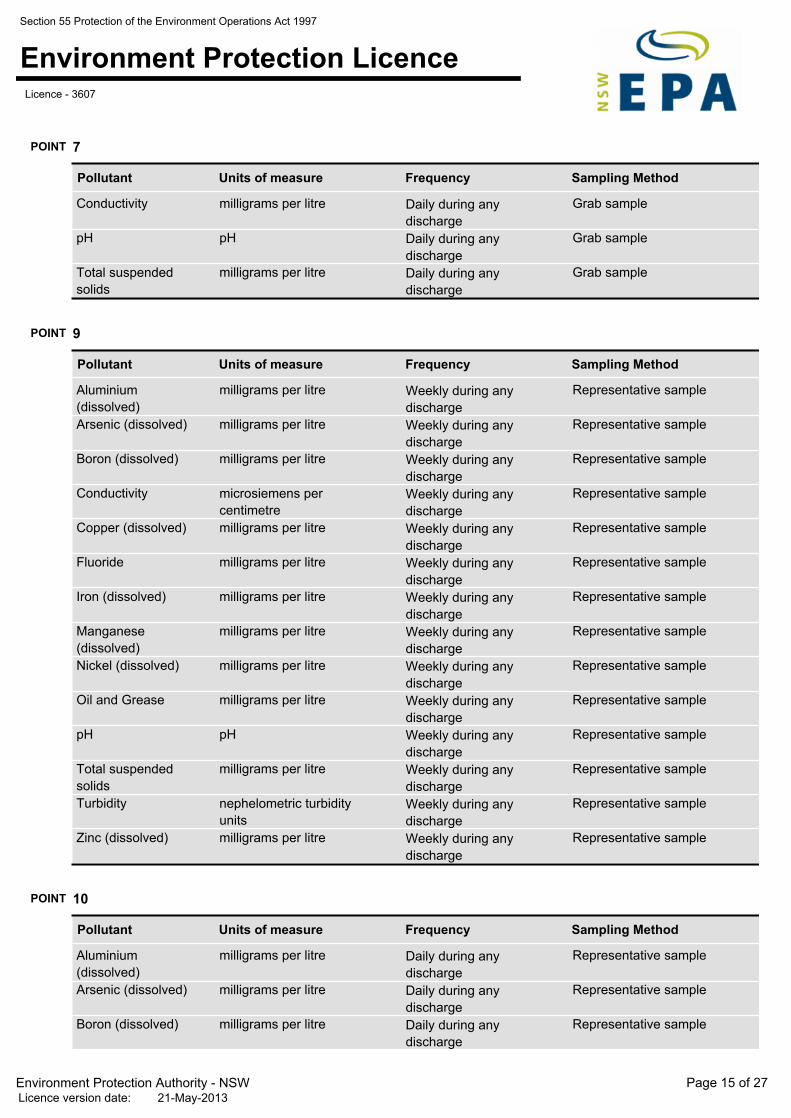
Section 55 Protection of the Environment Operations Act 1997
Environment Protection LicenceLicence - 3607
7POINT
Sampling MethodFrequencyUnits of measurePollutant
Grab samplemilligrams per litreConductivity Daily during any
discharge
Grab samplepHpH Daily during any
discharge
Grab samplemilligrams per litreTotal suspended
solidsDaily during any
discharge
9POINT
Sampling MethodFrequencyUnits of measurePollutant
Representative samplemilligrams per litreAluminium
(dissolved)Weekly during any
discharge
Representative samplemilligrams per litreArsenic (dissolved) Weekly during any
discharge
Representative samplemilligrams per litreBoron (dissolved) Weekly during any
discharge
Representative samplemicrosiemens per
centimetre
Conductivity Weekly during any
discharge
Representative samplemilligrams per litreCopper (dissolved) Weekly during any
discharge
Representative samplemilligrams per litreFluoride Weekly during any
discharge
Representative samplemilligrams per litreIron (dissolved) Weekly during any
discharge
Representative samplemilligrams per litreManganese
(dissolved)Weekly during any
discharge
Representative samplemilligrams per litreNickel (dissolved) Weekly during any
discharge
Representative samplemilligrams per litreOil and Grease Weekly during any
discharge
Representative samplepHpH Weekly during any
discharge
Representative samplemilligrams per litreTotal suspended
solidsWeekly during any
discharge
Representative samplenephelometric turbidity
units
Turbidity Weekly during any
discharge
Representative samplemilligrams per litreZinc (dissolved) Weekly during any
discharge
10POINT
Sampling MethodFrequencyUnits of measurePollutant
Representative samplemilligrams per litreAluminium
(dissolved)Daily during any
discharge
Representative samplemilligrams per litreArsenic (dissolved) Daily during any
discharge
Representative samplemilligrams per litreBoron (dissolved) Daily during any
discharge
Page 15 of 27Environment Protection Authority - NSWLicence version date: 21-May-2013
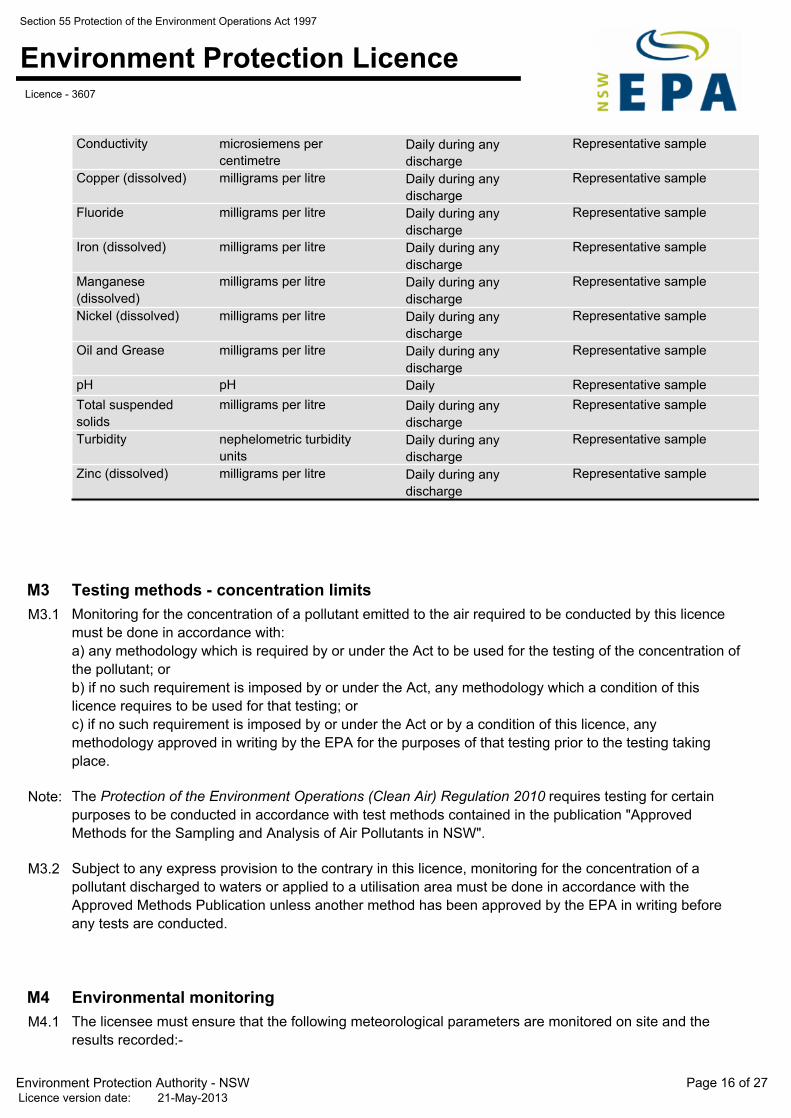
Section 55 Protection of the Environment Operations Act 1997
Environment Protection LicenceLicence - 3607
Representative samplemicrosiemens per
centimetre
Conductivity Daily during any
discharge
Representative samplemilligrams per litreCopper (dissolved) Daily during any
discharge
Representative samplemilligrams per litreFluoride Daily during any
discharge
Representative samplemilligrams per litreIron (dissolved) Daily during any
discharge
Representative samplemilligrams per litreManganese
(dissolved)Daily during any
discharge
Representative samplemilligrams per litreNickel (dissolved) Daily during any
discharge
Representative samplemilligrams per litreOil and Grease Daily during any
discharge
Representative samplepHpH Daily
Representative samplemilligrams per litreTotal suspended
solidsDaily during any
discharge
Representative samplenephelometric turbidity
units
Turbidity Daily during any
discharge
Representative samplemilligrams per litreZinc (dissolved) Daily during any
discharge
Testing methods - concentration limitsM3
M3.1 Monitoring for the concentration of a pollutant emitted to the air required to be conducted by this licence
must be done in accordance with:
a) any methodology which is required by or under the Act to be used for the testing of the concentration of
the pollutant; or
b) if no such requirement is imposed by or under the Act, any methodology which a condition of this
licence requires to be used for that testing; or
c) if no such requirement is imposed by or under the Act or by a condition of this licence, any
methodology approved in writing by the EPA for the purposes of that testing prior to the testing taking
place.
Note: The Protection of the Environment Operations (Clean Air) Regulation 2010 requires testing for certain
purposes to be conducted in accordance with test methods contained in the publication "Approved
Methods for the Sampling and Analysis of Air Pollutants in NSW".
M3.2 Subject to any express provision to the contrary in this licence, monitoring for the concentration of a
pollutant discharged to waters or applied to a utilisation area must be done in accordance with the
Approved Methods Publication unless another method has been approved by the EPA in writing before
any tests are conducted.
Environmental monitoringM4
M4.1 The licensee must ensure that the following meteorological parameters are monitored on site and the
results recorded:-
Page 16 of 27Environment Protection Authority - NSWLicence version date: 21-May-2013
Section 55 Protection of the Environment Operations Act 1997
Environment Protection LicenceLicence - 3607
a) daily rainfall;
b) daily evaporation;
c) continuous wind speed and direction.
Recording of pollution complaintsM5
M5.1 The licensee must keep a legible record of all complaints made to the licensee or any employee or agent
of the licensee in relation to pollution arising from any activity to which this licence applies.
M5.2 The record must include details of the following:
a) the date and time of the complaint;
b) the method by which the complaint was made;
c) any personal details of the complainant which were provided by the complainant or, if no such details
were provided, a note to that effect;
d) the nature of the complaint;
e) the action taken by the licensee in relation to the complaint, including any follow-up contact with the
complainant; and
f) if no action was taken by the licensee, the reasons why no action was taken.
M5.3 The record of a complaint must be kept for at least 4 years after the complaint was made.
M5.4 The record must be produced to any authorised officer of the EPA who asks to see them.
Telephone complaints lineM6
M6.1 The licensee must operate during its operating hours a telephone complaints line for the purpose of
receiving any complaints from members of the public in relation to activities conducted at the premises or
by the vehicle or mobile plant, unless otherwise specified in the licence.
M6.2 The licensee must notify the public of the complaints line telephone number and the fact that it is a
complaints line so that the impacted community knows how to make a complaint.
M6.3 The preceding two conditions do not apply until 3 months after:
a) the date of the issue of this licence or
b) if this licence is a replacement licence within the meaning of the Protection of the Environment
Operations (Savings and Transitional) Regulation 1998, the date on which a copy of the licence was
served on the licensee under clause 10 of that regulation.
Requirement to monitor volume or massM7
M7.1 For each discharge point or utilisation area specified below, the licensee must monitor:
a) the volume of liquids discharged to water or applied to the area;
b) the mass of solids applied to the area;
c) the mass of pollutants emitted to the air;
at the frequency and using the method and units of measure, specified below.
Page 17 of 27Environment Protection Authority - NSWLicence version date: 21-May-2013
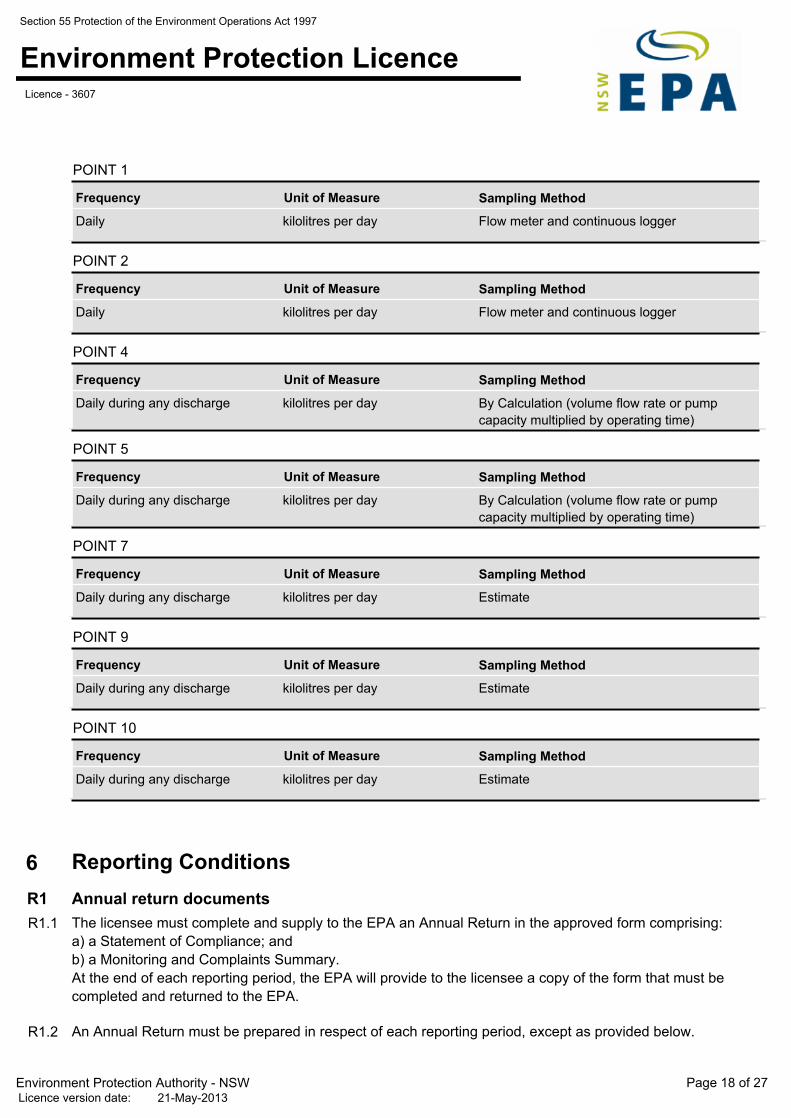
Section 55 Protection of the Environment Operations Act 1997
Environment Protection LicenceLicence - 3607
Frequency Unit of Measure
POINT 1
Sampling Method
kilolitres per day Flow meter and continuous loggerDaily
Frequency Unit of Measure
POINT 2
Sampling Method
kilolitres per day Flow meter and continuous loggerDaily
Frequency Unit of Measure
POINT 4
Sampling Method
kilolitres per day By Calculation (volume flow rate or pump
capacity multiplied by operating time)
Daily during any discharge
Frequency Unit of Measure
POINT 5
Sampling Method
kilolitres per day By Calculation (volume flow rate or pump
capacity multiplied by operating time)
Daily during any discharge
Frequency Unit of Measure
POINT 7
Sampling Method
kilolitres per day EstimateDaily during any discharge
Frequency Unit of Measure
POINT 9
Sampling Method
kilolitres per day EstimateDaily during any discharge
Frequency Unit of Measure
POINT 10
Sampling Method
kilolitres per day EstimateDaily during any discharge
Reporting Conditions 6
Annual return documentsR1
R1.1 The licensee must complete and supply to the EPA an Annual Return in the approved form comprising:
a) a Statement of Compliance; and
b) a Monitoring and Complaints Summary.
At the end of each reporting period, the EPA will provide to the licensee a copy of the form that must be
completed and returned to the EPA.
R1.2 An Annual Return must be prepared in respect of each reporting period, except as provided below.
Page 18 of 27Environment Protection Authority - NSWLicence version date: 21-May-2013
Section 55 Protection of the Environment Operations Act 1997
Environment Protection LicenceLicence - 3607
Note: The term "reporting period" is defined in the dictionary at the end of this licence. Do not complete the
Annual Return until after the end of the reporting period.
R1.3 Where this licence is transferred from the licensee to a new licensee:
a) the transferring licensee must prepare an Annual Return for the period commencing on the first day of
the reporting period and ending on the date the application for the transfer of the licence to the new
licensee is granted; and
b) the new licensee must prepare an Annual Return for the period commencing on the date the
application for the transfer of the licence is granted and ending on the last day of the reporting period.
Note: An application to transfer a licence must be made in the approved form for this purpose.
R1.4 Where this licence is surrendered by the licensee or revoked by the EPA or Minister, the licensee must
prepare an Annual Return in respect of the period commencing on the first day of the reporting period and
ending on:
a) in relation to the surrender of a licence - the date when notice in writing of approval of the surrender is
given; or
b) in relation to the revocation of the licence - the date from which notice revoking the licence operates.
R1.5 The Annual Return for the reporting period must be supplied to the EPA by registered post not later than
60 days after the end of each reporting period or in the case of a transferring licence not later than 60
days after the date the transfer was granted (the 'due date').
R1.6 The licensee must retain a copy of the Annual Return supplied to the EPA for a period of at least 4 years
after the Annual Return was due to be supplied to the EPA.
R1.7 Within the Annual Return, the Statement of Compliance must be certified and the Monitoring and
Complaints Summary must be signed by:
a) the licence holder; or
b) by a person approved in writing by the EPA to sign on behalf of the licence holder.
R1.8 A person who has been given written approval to certify a certificate of compliance under a licence issued
under the Pollution Control Act 1970 is taken to be approved for the purpose of this condition until the
date of first review of this licence.
Notification of environmental harmR2
Note: The licensee or its employees must notify all relevant authorities of incidents causing or threatening
material harm to the environment immediately after the person becomes aware of the incident in
accordance with the requirements of Part 5.7 of the Act.
R2.1 Notifications must be made by telephoning the Environment Line service on 131 555.
R2.2 The licensee must provide written details of the notification to the EPA within 7 days of the date on which
the incident occurred.
Written reportR3
Page 19 of 27Environment Protection Authority - NSWLicence version date: 21-May-2013
Section 55 Protection of the Environment Operations Act 1997
Environment Protection LicenceLicence - 3607
R3.1 Where an authorised officer of the EPA suspects on reasonable grounds that:
a) where this licence applies to premises, an event has occurred at the premises; or
b) where this licence applies to vehicles or mobile plant, an event has occurred in connection with the
carrying out of the activities authorised by this licence,
and the event has caused, is causing or is likely to cause material harm to the environment (whether the
harm occurs on or off premises to which the licence applies), the authorised officer may request a written
report of the event.
R3.2 The licensee must make all reasonable inquiries in relation to the event and supply the report to the EPA
within such time as may be specified in the request.
R3.3 The request may require a report which includes any or all of the following information:
a) the cause, time and duration of the event;
b) the type, volume and concentration of every pollutant discharged as a result of the event;
c) the name, address and business hours telephone number of employees or agents of the licensee, or a
specified class of them, who witnessed the event;
d) the name, address and business hours telephone number of every other person (of whom the licensee
is aware) who witnessed the event, unless the licensee has been unable to obtain that information after
making reasonable effort;
e) action taken by the licensee in relation to the event, including any follow-up contact with any
complainants;
f) details of any measure taken or proposed to be taken to prevent or mitigate against a recurrence of
such an event; and
g) any other relevant matters.
R3.4 The EPA may make a written request for further details in relation to any of the above matters if it is not
satisfied with the report provided by the licensee. The licensee must provide such further details to the
EPA within the time specified in the request.
General Conditions 7
Copy of licence kept at the premises or plantG1
G1.1 A copy of this licence must be kept at the premises to which the licence applies.
G1.2 The licence must be produced to any authorised officer of the EPA who asks to see it.
G1.3 The licence must be available for inspection by any employee or agent of the licensee working at the
premises.
SignageG2
G2.1 The location of EPA point number(s) 4 (LD4) and 5 (LD5) must be clearly marked by signs that indicate
the point identification number used in this licence and be located as close as practical to the point.
Page 20 of 27Environment Protection Authority - NSWLicence version date: 21-May-2013
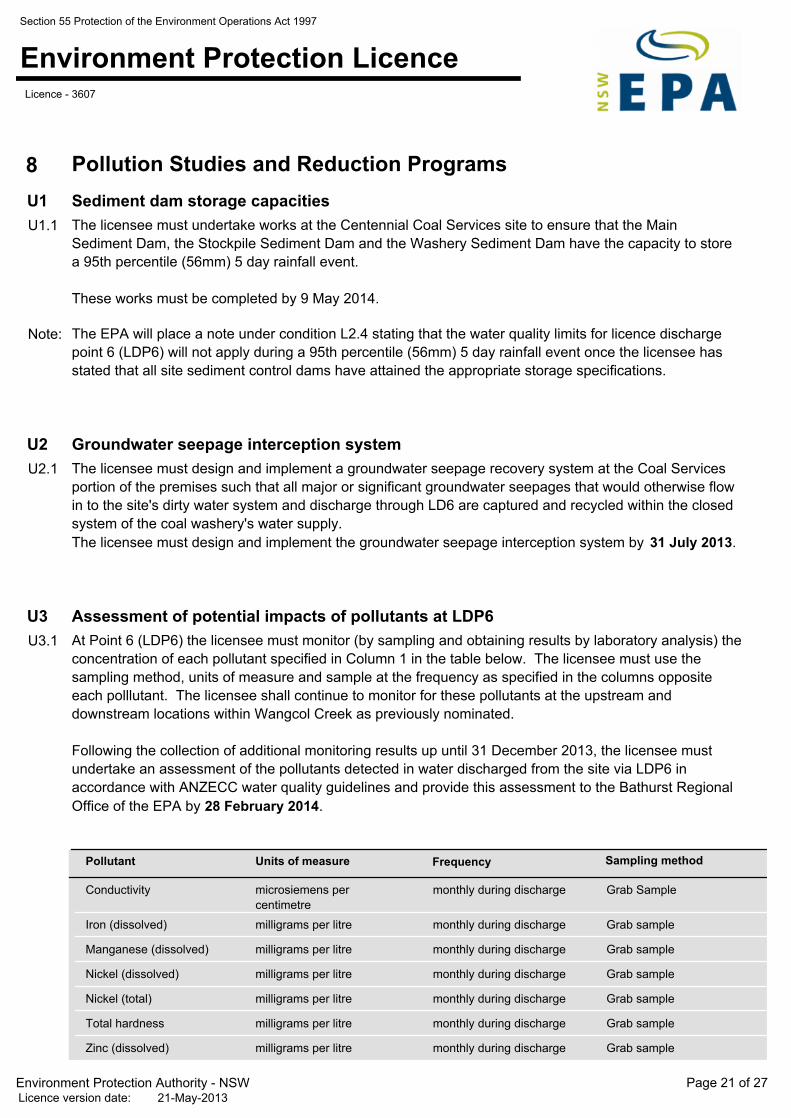
Section 55 Protection of the Environment Operations Act 1997
Environment Protection LicenceLicence - 3607
Pollution Studies and Reduction Programs 8
Sediment dam storage capacitiesU1
U1.1 The licensee must undertake works at the Centennial Coal Services site to ensure that the Main
Sediment Dam, the Stockpile Sediment Dam and the Washery Sediment Dam have the capacity to store
a 95th percentile (56mm) 5 day rainfall event.
These works must be completed by 9 May 2014.
Note: The EPA will place a note under condition L2.4 stating that the water quality limits for licence discharge
point 6 (LDP6) will not apply during a 95th percentile (56mm) 5 day rainfall event once the licensee has
stated that all site sediment control dams have attained the appropriate storage specifications.
Groundwater seepage interception systemU2
U2.1 The licensee must design and implement a groundwater seepage recovery system at the Coal Services
portion of the premises such that all major or significant groundwater seepages that would otherwise flow
in to the site's dirty water system and discharge through LD6 are captured and recycled within the closed
system of the coal washery's water supply.
The licensee must design and implement the groundwater seepage interception system by 31 July 2013.
Assessment of potential impacts of pollutants at LDP6U3
U3.1 At Point 6 (LDP6) the licensee must monitor (by sampling and obtaining results by laboratory analysis) the
concentration of each pollutant specified in Column 1 in the table below. The licensee must use the
sampling method, units of measure and sample at the frequency as specified in the columns opposite
each polllutant. The licensee shall continue to monitor for these pollutants at the upstream and
downstream locations within Wangcol Creek as previously nominated.
Following the collection of additional monitoring results up until 31 December 2013, the licensee must
undertake an assessment of the pollutants detected in water discharged from the site via LDP6 in
accordance with ANZECC water quality guidelines and provide this assessment to the Bathurst Regional
Office of the EPA by 28 February 2014.
Pollutant Units of measure Frequency Sampling method
Conductivity microsiemens per
centimetre
monthly during discharge Grab Sample
Iron (dissolved) milligrams per litre monthly during discharge Grab sample
Manganese (dissolved) milligrams per litre monthly during discharge Grab sample
Nickel (dissolved) milligrams per litre monthly during discharge Grab sample
Nickel (total) milligrams per litre monthly during discharge Grab sample
Total hardness milligrams per litre monthly during discharge Grab sample
Zinc (dissolved) milligrams per litre monthly during discharge Grab sample
Page 21 of 27Environment Protection Authority - NSWLicence version date: 21-May-2013
Section 55 Protection of the Environment Operations Act 1997
Environment Protection LicenceLicence - 3607
Zinc (total) milligrams per litre monthly during discharge Grab sample
Note: It is the EPA's intention to place water quality limits for these pollutants on all discharges via LDP6 based
on the results of this assessment.
Special Conditions 9
Emergency Discharges to Wolgan RiverE1
E1.1 For the purposes of this licence, an “emergency discharge” is defined as the release of groundwater,
sourced from the licensee’s underground workings, through licensed discharge points 4 (LD4) and 5
(LD5) in the event of a shutdown of the Springvale Colliery to Delta Water Transfer Scheme for
circumstances either beyond the licensee’s control or for essential maintenance purposes.
E1.2 Prior to discharge:
The licensee must ensure that appropriate measures are taken prior to any emergency water discharge to
minimise erosion and sedimentation at the discharge points (LD4 and LD5) and of the drainage lines
downstream of LD4 and LD5.
E1.3 Notifying the EPA of emergency discharge
The licensee shall inform the EPA in writing (fax to 6332 7630):
a) within 24 hours of a failure in the Springvale to Delta Water Transfer Scheme;
b) no later than 48 hours prior to a scheduled pipeline shutdown;
c) no later than 48 hours prior to the requirement to continue the emergency discharge for a period
greater than 2 weeks; and
d) within 24 hours following the reinstatement of the pipeline.
The notification of a failure or planned shutdown of the pipeline must include details of the nature of the
failure/shutdown and the expected timeframe to restore the pipeline.
E1.4 Monitoring during emergency discharge
In addition to the monitoring required by condition M2.1, the licensee shall undertake the following
monitoring during and following an emergency discharge event:
a) daily inspections of the discharge points (LD4 and LD5) and the drainage lines downstream of LD4 and
LD5;
b) daily monitoring (visual) of the equilibration of the flow rate between emergency discharge points LD4
and LD5; and
c) a photographic survey along the length of the flow lines, beneath the discharge points, likely to be
affected during periods of emergency discharge. This survey must be conducted either immediately prior
to or during the emergency discharge event and no later than 6 months following the cessation of the
emergency discharge event.
E1.5 Emergency discharge reporting
Page 22 of 27Environment Protection Authority - NSWLicence version date: 21-May-2013
Section 55 Protection of the Environment Operations Act 1997
Environment Protection LicenceLicence - 3607
A report shall be prepared by the licensee, following the recommissioning of the pipeline, which shall
include but not be limited to:
a) the cause of the pipe failure/shutdown;
b) the duration of the emergency discharge (in days);
c) the total volume of water discharged from LD4 and LD5 (in kL/day);
d) the results of all monitoring undertaken;
e) any remedial measures required on the drainage line(s) below the emergency discharge points that
have been or will require implementation;
f) any measures to be taken to prevent a recurrence in the case the emergency discharge event was a
result of a pipe failure; and
g) all appropriate photos and figures.
The report must be sent to the EPA’s Bathurst office within four (4) weeks of the recommissioning of the
Springvale to Delta Water Transfer Scheme.
Option Study to treat Mine Water DischargeE2
E2.1 The licensee must prepare and submit to the EPA for review, a report outlining options to treat ground
water (mine water) generated by the licensed premise as a result of mine dewatering activities, prior to
any discharge to the environment.
The objective of the option study is to reduce salt load and salinity levels discharged into the Coxs River
Catchment by the licensee. The options or option identified must be capable of treating all mine water
generated by the premises (ground and surface water) to achieve an electrical conductivity (EC) of 350
microsiemens per centimetre in the treated water, prior to the treated water being discharged to the Coxs
River or any of its tributaries. Where appropriate, the treatment of other pollutants in the discharge must
be assessed.
Where the option study proposes a water treatment option that involves Delta Electricity, the option must
be developed in consultation and agreement with Delta Electricity.
Completion Date: The option study and report must be submitted to the EPA by 30 September 2013.
Page 23 of 27Environment Protection Authority - NSWLicence version date: 21-May-2013
Section 55 Protection of the Environment Operations Act 1997
Environment Protection LicenceLicence - 3607
3DGM [in relation to a concentration limit]
Means the three day geometric mean, which is calculated by multiplying the results of the analysis of three samples collected on consecutive days and then taking the cubed root of that amount. Where one or more of the samples is zero or below the detection limit for the analysis, then 1 or the detection limit respectively should be used in place of those samples
Act Means the Protection of the Environment Operations Act 1997
activity Means a scheduled or non-scheduled activity within the meaning of the Protection of the Environment Operations Act 1997
actual load Has the same meaning as in the Protection of the Environment Operations (General) Regulation 2009
AM Together with a number, means an ambient air monitoring method of that number prescribed by the Approved Methods for the Sampling and Analysis of Air Pollutants in New South Wales.
AMG Australian Map Grid
anniversary date The anniversary date is the anniversary each year of the date of issue of the licence. In the case of a licence continued in force by the Protection of the Environment Operations Act 1997, the date of issue of the licence is the first anniversary of the date of issue or last renewal of the licence following the commencement of the Act.
annual return Is defined in R1.1
Approved Methods Publication
Has the same meaning as in the Protection of the Environment Operations (General) Regulation 2009
assessable pollutants
Has the same meaning as in the Protection of the Environment Operations (General) Regulation 2009
BOD Means biochemical oxygen demand
CEM Together with a number, means a continuous emission monitoring method of that number prescribed by the Approved Methods for the Sampling and Analysis of Air Pollutants in New South Wales.
COD Means chemical oxygen demand
composite sample Unless otherwise specifically approved in writing by the EPA, a sample consisting of 24 individual samples collected at hourly intervals and each having an equivalent volume.
cond. Means conductivity
environment Has the same meaning as in the Protection of the Environment Operations Act 1997
environment protection legislation
Has the same meaning as in the Protection of the Environment Administration Act 1991
EPA Means Environment Protection Authority of New South Wales.
fee-based activity classification
Means the numbered short descriptions in Schedule 1 of the Protection of the Environment Operations (General) Regulation 2009.
general solid waste (non-putrescible)
Has the same meaning as in Part 3 of Schedule 1 of the Protection of the Environment Operations Act 1997
Dictionary
General Dictionary
Page 24 of 27Environment Protection Authority - NSWLicence version date: 21-May-2013
Section 55 Protection of the Environment Operations Act 1997
Environment Protection LicenceLicence - 3607
flow weighted composite sample
Means a sample whose composites are sized in proportion to the flow at each composites time of collection.
general solid waste (putrescible)
Has the same meaning as in Part 3 of Schedule 1 of the Protection of the Environmen t Operations Act 1997
grab sample Means a single sample taken at a point at a single time
hazardous waste Has the same meaning as in Part 3 of Schedule 1 of the Protection of the Environment Operations Act 1997
licensee Means the licence holder described at the front of this licence
load calculation protocol
Has the same meaning as in the Protection of the Environment Operations (General) Regulation 2009
local authority Has the same meaning as in the Protection of the Environment Operations Act 1997
material harm Has the same meaning as in section 147 Protection of the Environment Operations Act 1997
MBAS Means methylene blue active substances
Minister Means the Minister administering the Protection of the Environment Operations Act 1997
mobile plant Has the same meaning as in Part 3 of Schedule 1 of the Protection of the Environment Operations Act 1997
motor vehicle Has the same meaning as in the Protection of the Environment Operations Act 1997
O&G Means oil and grease
percentile [in relation to a concentration limit of a sample]
Means that percentage [eg.50%] of the number of samples taken that must meet the concentration limit specified in the licence for that pollutant over a specified period of time. In this licence, the specified period of time is the Reporting Period unless otherwise stated in this licence.
plant Includes all plant within the meaning of the Protection of the Environment Operations Act 1997 as well as motor vehicles.
pollution of waters [or water pollution]
Has the same meaning as in the Protection of the Environment Operations Act 1997
premises Means the premises described in condition A2.1
public authority Has the same meaning as in the Protection of the Environment Operations Act 1997
regional office Means the relevant EPA office referred to in the Contacting the EPA document accompanying this licence
reporting period For the purposes of this licence, the reporting period means the period of 12 months after the issue of the licence, and each subsequent period of 12 mo nths. In the case of a licence continued in force by the Protection of the Environment Operations Act 1997, the date of issue of the licence is the first anniversary of the date of issue or last renewal of the licence following the commencement of the Act.
restricted solid waste
Has the same meaning as in Part 3 of Schedule 1 of the Protection of the Environment Operations Act 1997
scheduled activity Means an activity listed in Schedule 1 of the Protection of the Environment Operations Act 1997
special waste Has the same meaning as in Part 3 of Schedule 1 of the Protection of the Environment Operations Act 1997
TM Together with a number, means a test method of that number prescribed by the Approved Methods for the Sampling and Analysis of Air Pollutants in New South Wales.
Page 25 of 27Environment Protection Authority - NSWLicence version date: 21-May-2013
Section 55 Protection of the Environment Operations Act 1997
Environment Protection LicenceLicence - 3607
TSP Means total suspended particles
TSS Means total suspended solids
Type 1 substance Means the elements antimony, arsenic, cadmium, lead or mercury or any compound containing one or more of those elements
Type 2 substance Means the elements beryllium, chromium, cobalt, manganese, nickel, selenium, tin or vanadium or any compound containing one or more of those elements
utilisation area Means any area shown as a utilisation area on a map submitted with the application for this licence
waste Has the same meaning as in the Protection of the Environment Operations Act 1997
waste type Means liquid, restricted solid waste, general solid waste (putrescible), general solid waste (non -putrescible), special waste or hazardous waste
Environment Protection Authority
(By Delegation)
Date of this edition: 17-May-2000
Ms Debbie Maddison
Page 26 of 27Environment Protection Authority - NSWLicence version date: 21-May-2013
Section 55 Protection of the Environment Operations Act 1997
Environment Protection LicenceLicence - 3607
End Notes
Licence varied by notice V/M upgrade, issued on 08-Jul-2000, which came into effect on
08-Jul-2000.
1
Licence varied by notice 1008839, issued on 24-Sep-2001, which came into effect on
24-Sep-2001.
2
Licence varied by notice 1020230, issued on 04-Sep-2002, which came into effect on
29-Sep-2002.
3
Licence varied by notice 1025883, issued on 03-Apr-2003, which came into effect on
07-Apr-2003.
4
Licence varied by notice 1028983, issued on 19-Dec-2003, which came into effect on
13-Jan-2004.
5
Licence varied by notice 1034311, issued on 03-Sep-2004, which came into effect on
28-Sep-2004.
6
Licence varied by notice 1041194, issued on 11-Oct-2004, which came into effect on
11-Oct-2004.
7
Licence varied by notice 1046241, issued on 08-Aug-2005, which came into effect on
02-Sep-2005.
8
Licence varied by notice 1052295, issued on 26-Apr-2006, which came into effect on
26-Apr-2006.
9
Licence varied by notice 1063851, issued on 03-Oct-2006, which came into effect on
03-Oct-2006.
10
Licence varied by notice 1077081, issued on 21-Aug-2007, which came into effect on
21-Aug-2007.
11
Condition A1.3 Not applicable varied by notice issued on <issue date> which came into effect
on <effective date>
12
Licence varied by notice 1103012, issued on 09-Sep-2009, which came into effect on
09-Sep-2009.
13
Licence varied by notice 1114246, issued on 10-Sep-2010, which came into effect on
10-Sep-2010.
14
Licence varied by notice 1126999, issued on 05-Jul-2011, which came into effect on
05-Jul-2011.
15
Licence varied by notice 1501785 issued on 19-Dec-2011 16
Licence varied by notice 1506033 issued on 02-Aug-2012 17
Licence varied by notice 1514038 issued on 21-May-2013 18
Page 27 of 27Environment Protection Authority - NSWLicence version date: 21-May-2013
Appendix 2
EPL Monitoring Results (Surface Water)
EPL Monitoring Results – Coal Services/Lamberts Gully 2013 Annual Review
Surface Water Monitoring
Graph 1: Comparison of pH at LDP006 and Wangcol Creek during 2013
Graph 2: Comparison of TSS at LDP006 and Wangcol Creek during 2013
5
5.5
6
6.5
7
7.5
8
8.5
9
9.5
10
pH
Date
Comparision of pH at LDP006 and Wangcol Creek - 2013
Wangcol NOW STATION U/S
Wangcol Creek Upstream
Wangcol Creek Downstream
Wangcol Far D/S
LDP006
Linear (LDP006 EPL Upper Limit )
Linear (LDP006 EPL Lower Limit)
0
5
10
15
20
25
30
35
TSS
(mg/
L)
Date
Comparison of TSS at LDP 006 and Wangcol Creek - 2013
Wangcol NOW STATION U/S
Wangcol Creek Upstream
Wangcol Creek Downstream
Wangcol Far D/S
LDP006
LDP006 EPL Limit
Linear (LDP006 EPL Limit )
Graph 3: Comparison of EC at LDP006 and Wangcol Creek during 2013
Graph 4: Comparison of Total Zinc at LDP006 and Wangcol Creek during 2013
0
500
1000
1500
2000
2500
3000
3500
Ele
ctri
cal C
on
du
ctiv
ity
(µs/
cm)
Date
Comparison of EC at LDP006 and Wangcol Creek - 2013
Wangcol NOW STATION U/S
Wangcol Creek Upstream
Wangcol Creek Downstream
Wangcol Far D/S
LDP006
0
0.1
0.2
0.3
0.4
0.5
0.6
0.7
Tota
l Zin
c (m
g/L)
Date
Comparison of Total Zinc at LDP006 and Wangcol Creek - 2013
Wangcol NOW STATION U/S
Wangcol Creek Upstream
Wangcol Creek Downstream
Wangcol Far D/S
LDP006
Graph 5: Comparison of Nickel at LDP006 and Wangcol Creek during 2013
Graph 6: Comparison of Total Hardness at LDP006 and Wangcol Creek during 2013
0
0.05
0.1
0.15
0.2
0.25
0.3
0.35
0.4
Tota
l Nic
kel (
mg/
L)
Date
Comparison of Total Nickel at LDP006 and Wangcol Creek - 2013
Wangcol NOW STATION U/S
Wangcol Creek Upstream
Wangcol Creek Downstream
Wangcol Far D/S
LDP006
0
200
400
600
800
1000
1200
1400
Tota
l Har
dn
ess
(m
g/L)
Date
Comparison of Total Hardness at LDP006 and Wangcol Creek - 2013
Wangcol NOW STATION U/S
Wangcol Creek Upstream
Wangcol Creek Downstream
Wangcol Far D/S
LDP006
Graph 7: Comparison of Filterable Magnesium at LDP006 and Wangcol Creek during 2013
Graph 8: Comparison of Filterable Iron at LDP006 and Wangcol Creek during 2013
0
1
2
3
4
5
6
7
8
9
10
Filt
era
ble
Man
gan
ese
(m
g/L)
Date
Comparison of Filterable Manganese at LDP006 and Wangcol Creek - 2013
Wangcol NOW STATION U/S
Wangcol Creek Upstream
Wangcol Creek Downstream
Wangcol Far D/S
LDP006
0
1
2
3
4
5
6
7
Filt
era
ble
Iro
n (
mg/
L)
Date
Comparison of Filterable Iron at LDP006 and Wangcol Creek - 2013
Wangcol NOW STATION U/S
Wangcol Creek Upstream
Wangcol Creek Downstream
Wangcol Far D/S
LDP006
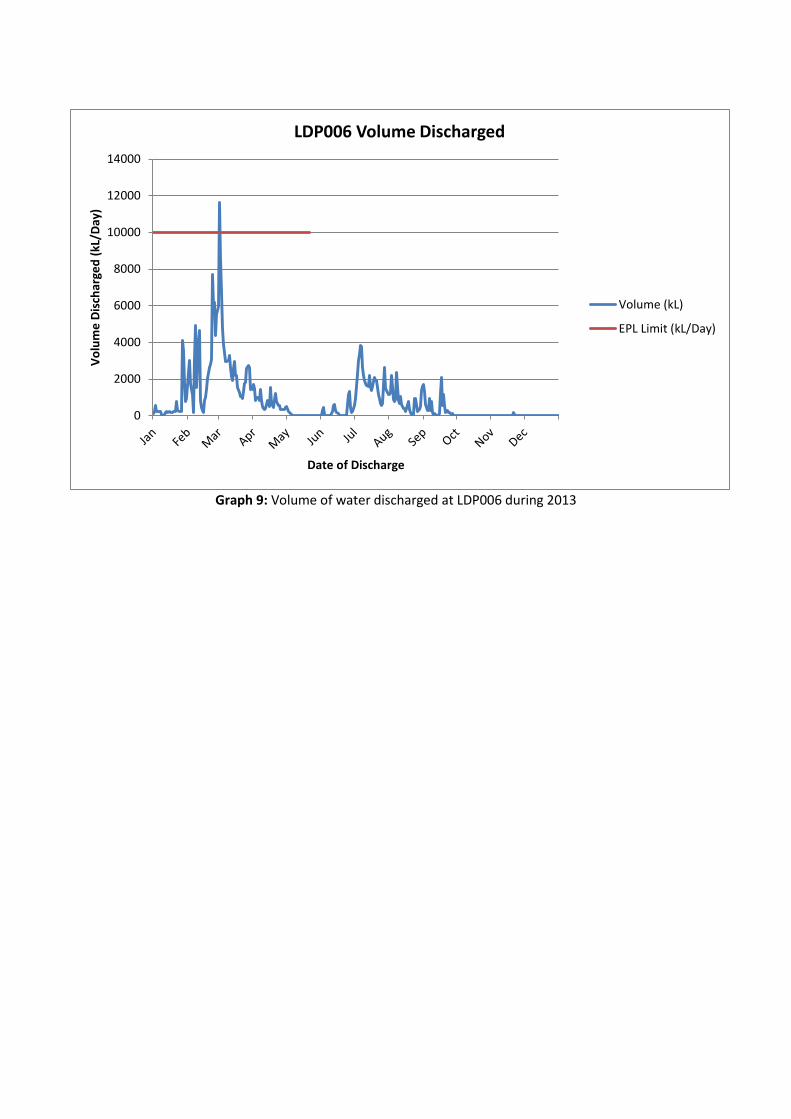
Graph 9: Volume of water discharged at LDP006 during 2013
0
2000
4000
6000
8000
10000
12000
14000
Vo
lum
e D
isch
arge
d (
kL/D
ay)
Date of Discharge
LDP006 Volume Discharged
Volume (kL)
EPL Limit (kL/Day)
Appendix 3
Air Quality, Noise and Meteorological Monitoring Summary
RCA LE ref 6910-769 17 January 2014 Springvale Coal Pty Ltd Lamberts Gully Mine PO Box 198 WALLERAWANG NSW 2845 Attention: Mr Rob Hunt
AEMR SUMMARY REPORT COMPILED FOR
SPRINGVALE COAL – LAMBERTS GULLY EXTENSION DETAILING
AIR QUALITY, NOISE & METEOROLOGICAL MONITORING
JANUARY – DECEMBER 2013
CONTENTS
1 GENERAL COMMENTS ............................................................................................ 3
2 ASSESSMENT CRITERIA ........................................................................................ 3
2.1 DEPOSITIONAL DUST AND HVAS PARTICULATE MATTER ASSESSMENT
CRITERIA ......................................................................................................... 3 2.2 NOISE IMPACT ASSESSMENT CRITERIA ............................................................. 4
3 ANNUAL DATA SUMMARY: JANUARY – DECEMBER 2013 ................................ 4
3.1 METEOROLOGICAL MONITORING RELATING TO AIR ........................................... 4 3.2 DEPOSITIONAL DUST DATA SUMMARY .............................................................. 4 3.3 HVAS PARTICULATE MATTER DATA SUMMARY ................................................ 7 3.4 METEOROLOGICAL MONITORING RELATING TO NOISE MONITORING ................... 9 3.5 NOISE MONITORING RESULTS SUMMARY .......................................................... 9
4 COMPLIANCE ASSESSMENTS ............................................................................. 14
4.1 4.1 AIR QUALITY MONITORING COMPLIANCE ASSESSMENT ............................. 14 4.1.1 DEPOSITIONAL DUST RESULTS ......................................................... 14 4.1.2 HVAS PARTICULATE MATTER RESULTS ............................................ 14
4.2 NOISE MONITORING COMPLIANCE ASSESSMENT ............................................. 15
TABLES Table 1 – Depositional Dust: Long Term Impact Assessment Criteria ..................................... 3
Table 2 – HVAS Particulate Matter: Long Term Impact Assessment Criteria .......................... 3
Table 3 – HVAS Particulate Matter: Short Term Impact Assessment Criteria ......................... 3
Table 4 – Noise Impact Assessment Criteria ........................................................................... 4
Table 5 – Depositional Dust Data Summary: Jan – Dec 2013 ................................................. 5
Table 6 – HVAS Particulate Matter Summary Jan– Dec 2013 ................................................. 7
Table 7 – Bi-Monthly Attended Noise Monitoring Results: Jan - Dec 2013 ............................ 11
Table 8 – Attended Noise Monitoring Compared to Noise Impact Assessment Criteria ........ 14
APPENDIX A
Drawing 1 – Air Quality Monitoring Locations Drawing 2 – Noise Monitoring Locations
APPENDIX B
Meteorological Monitoring Data – January to December 2013
Page 3
Springvale Coal Lamberts Gully RCA-LE ref 6910-769/0, January 2014
1 GENERAL COMMENTS
The following report provides a summary of monthly environmental monitoring data for the Lamberts Gully Mine for the year 2013. Summary data is comprised of High Volume Air Samples (TSP & PM10), Depositional Dust, and Environmental Noise monitoring.
A compliance assessment of both depositional dust results and High Volume Air Sample (HVAS) results is made in accordance with the criteria presented in the Lamberts Gully Coal Mine Air Quality Monitoring Program.
Similarly, a compliance assessment of the routine noise monitoring results is undertaken in accordance with the criteria presented in the Lamberts Gully Coal Mine Noise Monitoring Program.
2 ASSESSMENT CRITERIA
2.1 DEPOSITIONAL DUST AND HVAS PARTICULATE MATTER ASSESSMENT CRITERIA
The Air Quality Monitoring Program stipulates that dust emissions generated by the project must not cause additional exceedances of the long term impact assessment criteria listed in Table 1, 2 and 3.
Table 1 – Depositional Dust: Long Term Impact Assessment Criteria
POLLUTANT AVERAGE
PERIOD MAXIMUM INCREASE IN
DEPOSITED DUST LEVEL MAXIMUM TOTAL
DEPOSITED DUST LEVEL
Deposited dust Annual 2 g/m2.month 4 g/m2.month
Table 2 – HVAS Particulate Matter: Long Term Impact Assessment Criteria
POLLUTANT AVERAGE PERIOD CRITERION
Total suspended particulate (TSP) matter Annual 90µg/m3
Particulate matter < 10µm (PM10) Annual 30µg/m3
Table 3 – HVAS Particulate Matter: Short Term Impact Assessment Criteria
POLLUTANT AVERAGE PERIOD POLLUTANT
Particulate matter < 10µm (PM10) 24 hours 50µg/m3
4
Springvale Coal Lamberts Gully RCA-LE ref 6910-769, January 2014
2.2 NOISE IMPACT ASSESSMENT CRITERIA
As stipulated in the Noise Monitoring Program, noise generated by the project must not exceed the noise impact assessment criteria presented in Table 4.
Table 4 – Noise Impact Assessment Criteria
RESIDENCE DAY PERIOD
ASSESSMENT CRITERIA (LAEQ 15 minute, dB)
R1 38
R2 39
R3 39
R4 38
R5 38
R6 35
R7 42
3 ANNUAL DATA SUMMARY: JANUARY – DECEMBER 2013
3.1 METEOROLOGICAL MONITORING RELATING TO AIR
Lamberts Gully receives continuously recorded meteorological data via a data sharing agreement with nearby Pine Dale Mine, which has a meteorological monitoring station located on-site. Parameters recorded (at 10-minute intervals) include wind speed, wind direction, temperature at 10m height, temperature at 2m height, and rainfall. Additional sensors to record humidity, solar radiation, sigma theta and evapotranspiration were installed on 22 May 2013.
Data capture from the weather station during the January to December 2013 period was 99.96%.
Details of weather data recorded for the period January to December 2013 are presented in Appendix B.
3.2 DEPOSITIONAL DUST DATA SUMMARY
Lamberts Gully Coal Mine currently has 3 depositional dust gauges. Two of these gauges are located within the township of Blackmans Flat, whilst the third gauge is located to the south of Blackmans Flat (refer Drawing 1- Appendix A). Data from Gauge D1 & D2 is shared by Pine Dale Mine and Springvale Coal – Lamberts Gully Coal Mine. Dust Gauge D3 is owned solely by Springvale Coal.
Depositional Dust summary results for the period January – December 2013 are shown in Table 5 over. Graphical presentations are shown in Figure 1.
5
Springvale Coal Lamberts Gully RCA-LE ref 6910-769, January 2014
Table 5 – Depositional Dust Data Summary: Jan – Dec 2013
MONTH GAUGE NO. INSOLUBLE
SOLIDS (g/m2.month)
ASH (g/m2.month)
COMBUSTIBLE MATTER
(g/m2.month)
Jan-13 D1 0.9 0.5 0.4 Feb-13 D1 1.4 0.7 0.7 Mar-13 D1 0.5 0.2 0.3 Apr-13 D1 0.8 0.3 0.5 May-13 D1 0.9 0.6 0.3 Jun-13 D1 0.3 0.1 0.2 Jul-13 D1 1.0 0.7 0.3 Aug-13 D1 0.4 0.2 0.2 Sep-13 D1 1.1 0.6 0.5 Oct-13 D1 0.9 0.5 0.4 Nov-13 D1 1.3 0.6 0.7 Dec-13 D1 9.5 1.2 8.3 GAUGE D1 AVERAGE 1.6 0.5 1.1
Jan-13 D2 0.6 0.2 0.4 Feb-13 D2 0.9 0.4 0.5 Mar-13 D2 0.8 0.4 0.4 Apr-13 D2 0.7 0.3 0.4 May-13 D2 0.7 0.4 0.3 Jun-13 D2 0.5 0.2 0.3 Jul-13 D2 0.9 0.5 0.4 Aug-13 D2 0.2 0.1 0.1 Sep-13 D2 0.7 0.3 0.4 Oct-13 D2 0.8 0.5 0.3 Nov-13 D2 0.7 0.3 0.4 Dec-13 D2 1.2 0.6 0.6 GAUGE D2 AVERAGE 0.7 0.3 0.4
Jan-13 D3 0.7 0.5 0.2 Feb-13 D3 1.8 1.2 0.6 Mar-13 D3 0.7 0.5 0.2 Apr-13 D3 3.5 2.0 1.5 May-13 D3 0.7 0.6 0.1 Jun-13 D3 0.5 0.3 0.2 Jul-13 D3 0.8 0.6 0.2 Aug-13 D3 0.2 0.1 0.1 Sep-13 D3 0.8 0.5 0.3 Oct-13 D3 0.7 0.5 0.2 Nov-13 D3 0.7 0.4 0.3 Dec-13 D3 1.7 0.9 0.8 GAUGE D3 AVERAGE 1.1 0.7 0.4
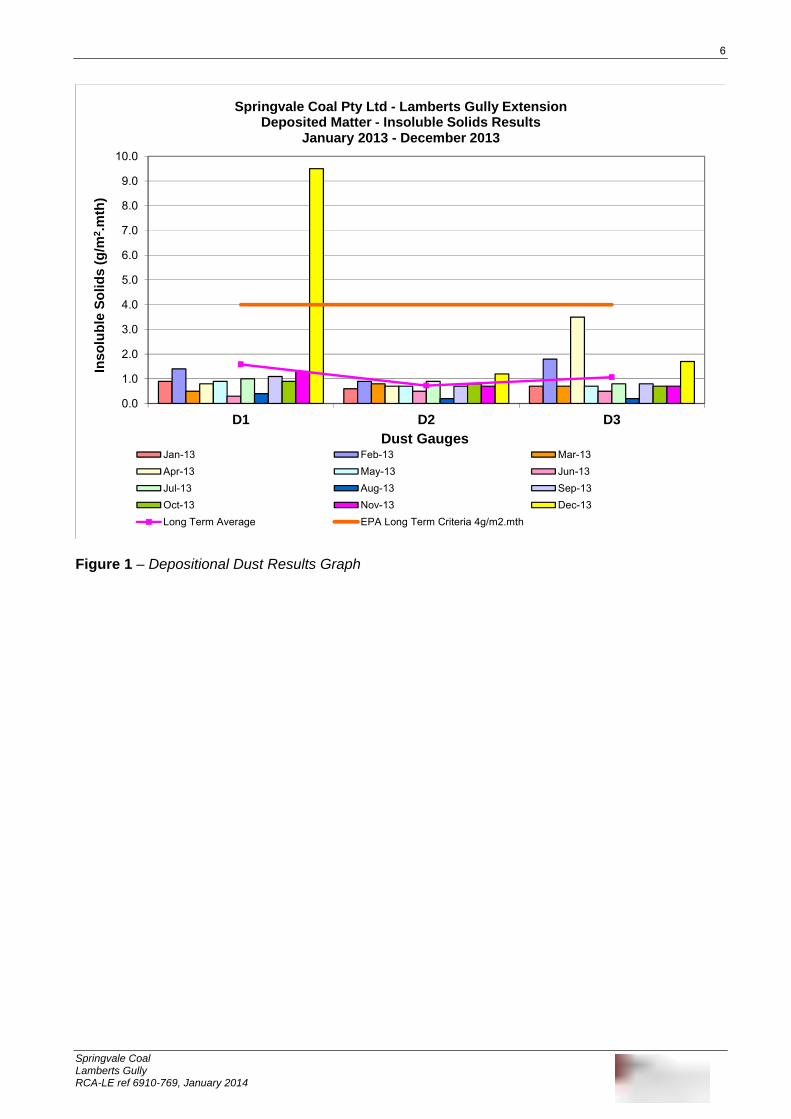
6
Springvale Coal Lamberts Gully RCA-LE ref 6910-769, January 2014
0.0
1.0
2.0
3.0
4.0
5.0
6.0
7.0
8.0
9.0
10.0
D1 D2 D3
Inso
lub
le S
olid
s (g
/m2 .
mth
)Springvale Coal Pty Ltd - Lamberts Gully Extension
Deposited Matter - Insoluble Solids ResultsJanuary 2013 - December 2013
Jan-13 Feb-13 Mar-13Apr-13 May-13 Jun-13Jul-13 Aug-13 Sep-13Oct-13 Nov-13 Dec-13Long Term Average EPA Long Term Criteria 4g/m2.mth
Dust Gauges
Figure 1 – Depositional Dust Results Graph
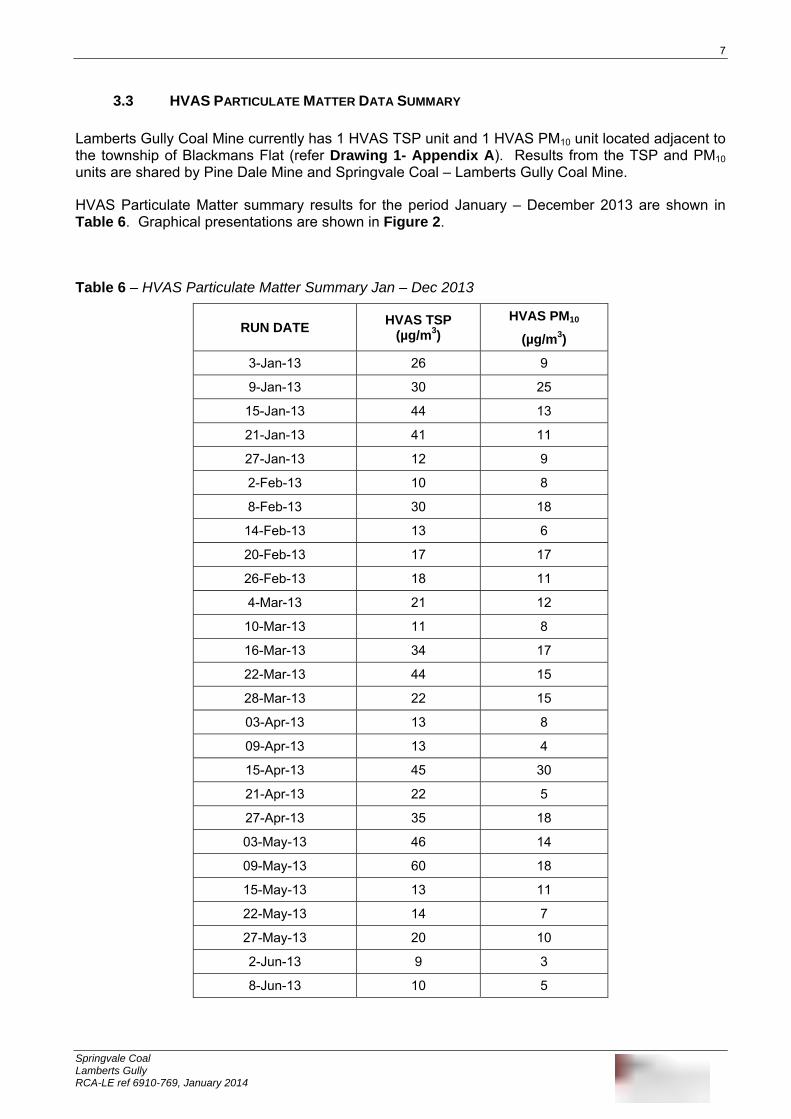
7
Springvale Coal Lamberts Gully RCA-LE ref 6910-769, January 2014
3.3 HVAS PARTICULATE MATTER DATA SUMMARY
Lamberts Gully Coal Mine currently has 1 HVAS TSP unit and 1 HVAS PM10 unit located adjacent to the township of Blackmans Flat (refer Drawing 1- Appendix A). Results from the TSP and PM10 units are shared by Pine Dale Mine and Springvale Coal – Lamberts Gully Coal Mine.
HVAS Particulate Matter summary results for the period January – December 2013 are shown in Table 6. Graphical presentations are shown in Figure 2.
Table 6 – HVAS Particulate Matter Summary Jan – Dec 2013
RUN DATE HVAS TSP
(µg/m3)
HVAS PM10
(µg/m3)
3-Jan-13 26 9
9-Jan-13 30 25
15-Jan-13 44 13
21-Jan-13 41 11
27-Jan-13 12 9
2-Feb-13 10 8
8-Feb-13 30 18
14-Feb-13 13 6
20-Feb-13 17 17
26-Feb-13 18 11
4-Mar-13 21 12
10-Mar-13 11 8
16-Mar-13 34 17
22-Mar-13 44 15
28-Mar-13 22 15
03-Apr-13 13 8
09-Apr-13 13 4
15-Apr-13 45 30
21-Apr-13 22 5
27-Apr-13 35 18
03-May-13 46 14
09-May-13 60 18
15-May-13 13 11
22-May-13 14 7
27-May-13 20 10
2-Jun-13 9 3
8-Jun-13 10 5
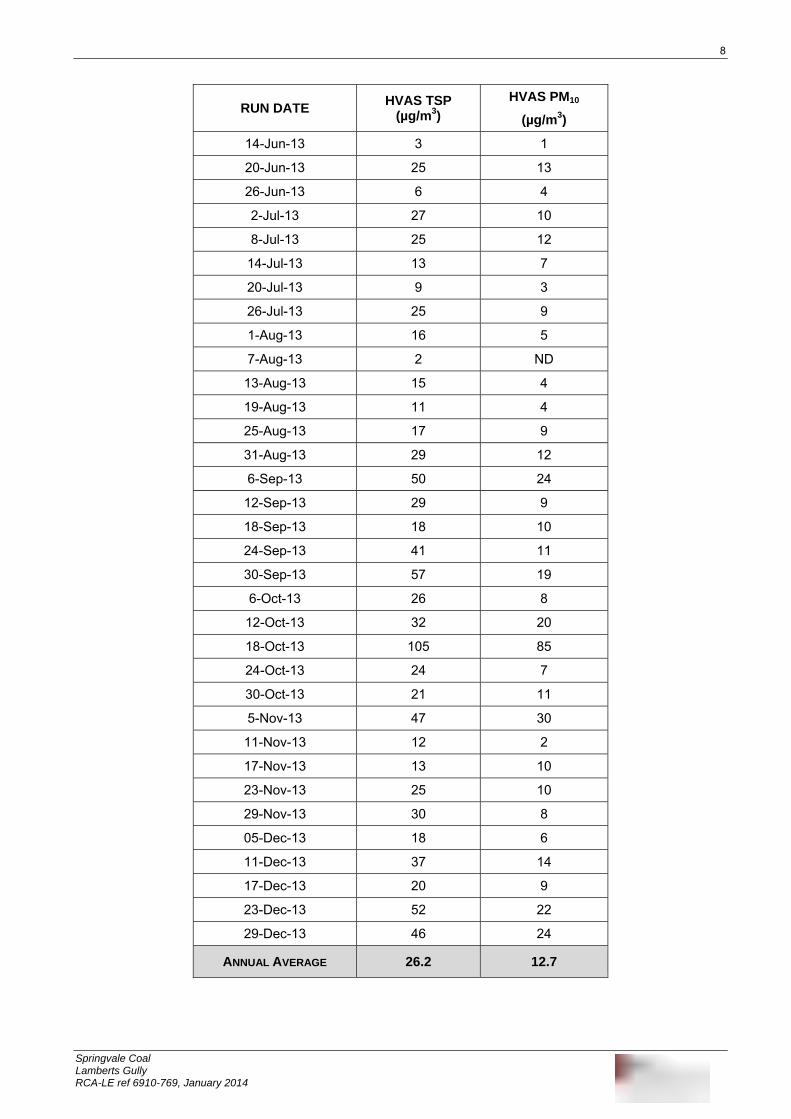
8
Springvale Coal Lamberts Gully RCA-LE ref 6910-769, January 2014
RUN DATE HVAS TSP
(µg/m3)
HVAS PM10
(µg/m3)
14-Jun-13 3 1
20-Jun-13 25 13
26-Jun-13 6 4
2-Jul-13 27 10
8-Jul-13 25 12
14-Jul-13 13 7
20-Jul-13 9 3
26-Jul-13 25 9
1-Aug-13 16 5
7-Aug-13 2 ND
13-Aug-13 15 4
19-Aug-13 11 4
25-Aug-13 17 9
31-Aug-13 29 12
6-Sep-13 50 24
12-Sep-13 29 9
18-Sep-13 18 10
24-Sep-13 41 11
30-Sep-13 57 19
6-Oct-13 26 8
12-Oct-13 32 20
18-Oct-13 105 85
24-Oct-13 24 7
30-Oct-13 21 11
5-Nov-13 47 30
11-Nov-13 12 2
17-Nov-13 13 10
23-Nov-13 25 10
29-Nov-13 30 8
05-Dec-13 18 6
11-Dec-13 37 14
17-Dec-13 20 9
23-Dec-13 52 22
29-Dec-13 46 24
ANNUAL AVERAGE 26.2 12.7
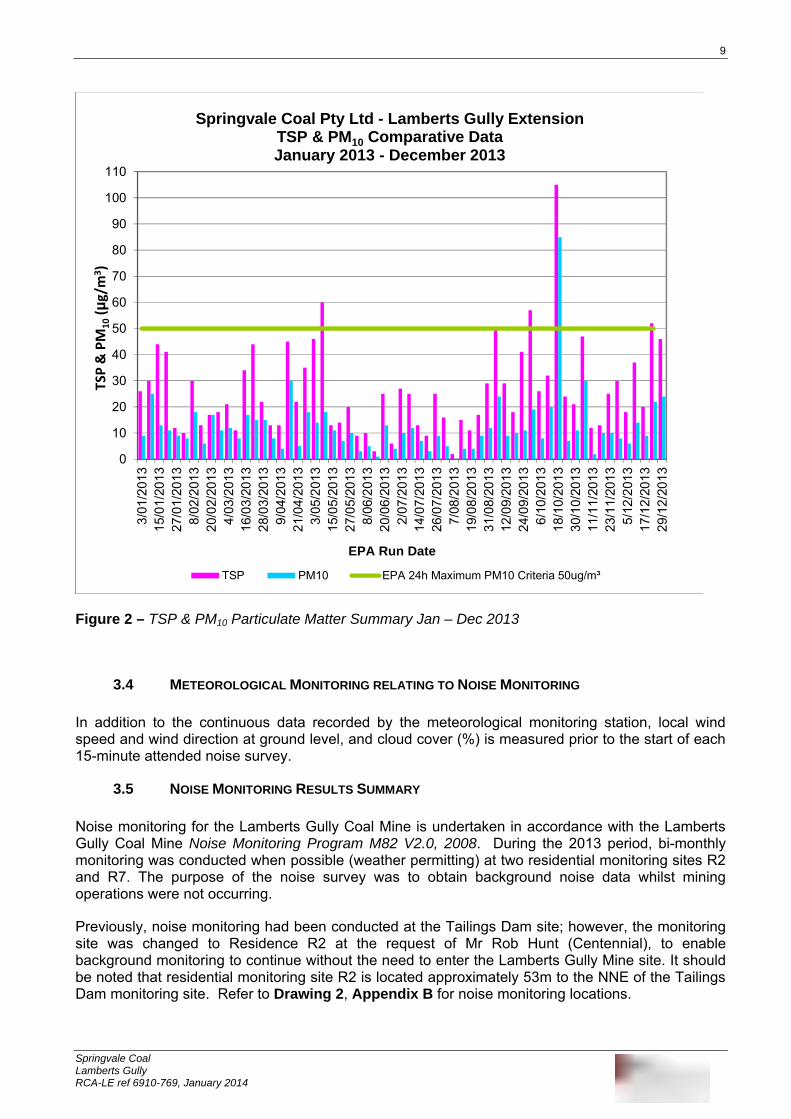
9
Springvale Coal Lamberts Gully RCA-LE ref 6910-769, January 2014
0
10
20
30
40
50
60
70
80
90
100
110
3/01
/201
315
/01/
2013
27/0
1/20
138/
02/2
013
20/0
2/20
134/
03/2
013
16/0
3/20
1328
/03/
2013
9/04
/201
321
/04/
2013
3/05
/201
315
/05/
2013
27/0
5/20
138/
06/2
013
20/0
6/20
132/
07/2
013
14/0
7/20
1326
/07/
2013
7/08
/201
319
/08/
2013
31/0
8/20
1312
/09/
2013
24/0
9/20
136/
10/2
013
18/1
0/20
1330
/10/
2013
11/1
1/20
1323
/11/
2013
5/12
/201
317
/12/
2013
29/1
2/20
13
TSP & PM
10(µg/m
3)
EPA Run Date
Springvale Coal Pty Ltd - Lamberts Gully ExtensionTSP & PM10 Comparative DataJanuary 2013 - December 2013
TSP PM10 EPA 24h Maximum PM10 Criteria 50ug/m³
Figure 2 – TSP & PM10 Particulate Matter Summary Jan – Dec 2013
3.4 METEOROLOGICAL MONITORING RELATING TO NOISE MONITORING
In addition to the continuous data recorded by the meteorological monitoring station, local wind speed and wind direction at ground level, and cloud cover (%) is measured prior to the start of each 15-minute attended noise survey.
3.5 NOISE MONITORING RESULTS SUMMARY
Noise monitoring for the Lamberts Gully Coal Mine is undertaken in accordance with the Lamberts Gully Coal Mine Noise Monitoring Program M82 V2.0, 2008. During the 2013 period, bi-monthly monitoring was conducted when possible (weather permitting) at two residential monitoring sites R2 and R7. The purpose of the noise survey was to obtain background noise data whilst mining operations were not occurring.
Previously, noise monitoring had been conducted at the Tailings Dam site; however, the monitoring site was changed to Residence R2 at the request of Mr Rob Hunt (Centennial), to enable background monitoring to continue without the need to enter the Lamberts Gully Mine site. It should be noted that residential monitoring site R2 is located approximately 53m to the NNE of the Tailings Dam monitoring site. Refer to Drawing 2, Appendix B for noise monitoring locations.
10
Springvale Coal Lamberts Gully RCA-LE ref 6910-769, January 2014
During 2013 routine bi-monthly attended noise monitoring was undertaken during the following periods:
February – monitoring at R2 and R7 undertaken on 20/02/13.
April – monitoring at R2 and R7 undertaken on 22/04/13.
June – monitoring at R2 and R7 undertaken on 24/06/13 & 25/06/13.
August – monitoring at R2 and R7 undertaken on 26/08/13.
October – monitoring at R2 and R7 undertaken on 30/10/13.
December – see note.
Note - noise monitoring for the December 2013 bi-monthly period is schedule to be conducted in mid-January 2014.
Results of bi-monthly attended noise monitoring are shown in Table 7. Results compared to the Noise Impact Assessment Criteria are shown in Table 8.
Page 11
Springvale Coal Lamberts Gully RCA-LE ref 6910-769/0, January 2014
Table 7 – Bi-Monthly Attended Noise Monitoring Results: Jan - Dec 2013
SITE DATE START TIME
END TIME
LAEQ (dBA)
L10 (dBA)
L50 (dBA)
L90 (dBA)
LMIN (dBA)
LMAX (dBA)
WIND SPEED (M/S)
WIND DIR.
CLOUD COVER
(%) COMMENTS
R7 20/2/13 9:00 AM
9:15 AM 42 43 41 39 38 59 2.9 S 75
Mine not operating during monitoring. Conveyor running constantly during noise survey. Birdcall and insects dominant (range 39-59dBA).
R2 20/2/13 9:51 AM
10:06 AM 43 46 41 38 35 59 3.3 SE 75
Mine not operating during monitoring. Highway traffic dominant (37-59dBA). Birdcall audible in the range 37-55dBA.
R7 22/4/13 8:32 AM
8:47 AM 42 44 39 38 36 65 0.8 NNW 25
Mine not operating during monitoring. Conveyor was not operational during noise survey. Birdcall and insects dominant (range 37-65dBA).
R2 22/4/13 9:45 AM
10:00 AM 51 55 48 43 40 63 2.6 NW 75
Mine not operating during monitoring. Highway traffic dominant (40-63dBA). Birdcall audible in the range 43-59dBA.
12
Springvale Coal Lamberts Gully RCA-LE ref 6910-769/0, January 2014
SITE DATE START TIME
END TIME
LAEQ (dBA)
L10 (dBA)
L50 (dBA)
L90 (dBA)
LMIN (dBA)
LMAX (dBA)
WIND SPEED (m/s)
WIND DIR.
CLOUD COVER
(%) COMMENTS
R7 24/6/13 9:22 AM
9:37 AM 39 39 37 36 34 58 1.7 W 100
Mine not operating during monitoring. Conveyor was operational during noise survey. Birdcall and insects were audible in the range 35-58dBA. Traffic on the access road was recorded in the range 35 – 46dBA; whilst the conveyor and washery noise was noted as the dominant noise source (34 – 47dBA).
R2 25/6/13 10:02 AM
10:17 AM 46 49 45 40 37 58 2.3 SE 100
Mine not operating during monitoring. Highway traffic noise was dominant (37-58dBA). Washery operations at Lamberts Gully were audible in the range 38 – 51dBA.
R7 26/8/13 9:03 AM 9:18 AM 38 39 33 31 29 61 0.8 E 0
Mine not operating during monitoring. Conveyor was not operational during the survey. Birdcall and insects were audible in the range 39-61dBA. Traffic on the access road was recorded in the range 30 – 56dBA; whilst an aeroplane was also audible during the monitoring survey.
R2 26/8/13 9:53 AM
10:08 AM 44 46 41 37 34 65 0.8 WNW 0
Mine not operating during monitoring. Highway traffic noise was dominant (34-65dBA). Washery operations at Lamberts Gully were audible in the range 34 – 42dBA. Birdcall was also recorded at 57bBA.
13
Springvale Coal Lamberts Gully RCA-LE ref 6910-769/0, January 2014
SITE DATE START TIME
END TIME
LAEQ (dBA)
L10 (dBA)
L50 (dBA)
L90 (dBA)
LMIN (dBA)
LMAX (dBA)
WIND SPEED (m/s)
WIND DIR.
CLOUD COVER
(%) COMMENTS
R7 30/10/13 10:10 AM
10:25 AM 36 38 35 34 32 48 1.40 S 12.5
Mine not operating during monitoring. Conveyor was operational during the survey. Birdcall and insects were audible in the range 32 – 48 dB(A).
R2 30/10/13 10:52 AM
11:07 AM 43 46 41 36 33 60 1.40 SW 12.5
Mine not operating during monitoring. Highway traffic noise was dominant with levels ranging from 33 – 60 dB(A). Birdcall was also recorded at 57 dB(A).
Page 14
Springvale Coal Lamberts Gully RCA-LE ref 6910-769, January 2014
Table 8 – Attended Noise Monitoring Compared to Noise Impact Assessment Criteria
DATE
ATTENDED MONITORING SUMMARY TABLE
LAEQ 15-MINUTE (dB)
R2 R7
February (20/02/13) 43 42
April (22/04/13) 51 42
June (24/06/13 & 25/06/13) 46 39
August (26/08/13) 44 38
October (30/10/13) 43 36
Noise Impact Assessment Criteria
39 42
Notes:
Shaded Cells - Indicate noise result is greater than the Noise Impact Assessment Criteria. All sampling was conducted during the mine closure period.
4 COMPLIANCE ASSESSMENTS
4.1 4.1 AIR QUALITY MONITORING COMPLIANCE ASSESSMENT
4.1.1 Depositional Dust Results
Depositional Dust results for the period January – December 2013 show an average insoluble solids result of 1.6g/m2.month for dust gauge D1; 0.7 g/m2.month for gauge D2; and 1.1 g/m2.month for gauge D3. These results fall well below the nominated annual average assessment criteria of 4.0g/m2.month, as stipulated in the Air Quality Monitoring Program.
An elevated result (9.5g/m2.month) was recorded at D1 during December 2013. An investigation of the sample indicates that organic contamination contributed heavily to the insoluble solids result with a combustible matter to insoluble solids ratio of 87%. This shows that only 13% of the sample consisted of inorganic (potential deposited dust) material. The field sheet indicates that insects were present and therefore are the likely contamination source. Despite this high result, the annual average at this monitoring location is still considered low, with a result of 1.6g/m2.month.
4.1.2 HVAS Particulate Matter Results
HVAS Total Suspended Particulate (TSP) results for the period January – December 2013 show an annual average result of 26.2g/m3; which is well below the annual average TSP assessment criteria of 90g/m3. During the reporting period there were six run events in which a programming error caused the TSP unit to run for greater than the quality assurance period of twenty four hours ± one hour as stipulated in AS3580.9.3.
15
Springvale Coal Lamberts Gully RCA-LE ref 6910-769, January 2014
The HVAS particulate matter results <10m (PM10) also show levels which are within the required Air Quality Monitoring Program assessment criteria. The annual average PM10 result was 12.7g/m3 which considerably lower than the annual average PM10 assessment criteria limit of 30g/m3. There was one exceedence of the OEH’s short term 24hour maximum criteria of 50g/m3 for PM10 particulates during the reporting period with a concentration of 85µg/m³ measured. This exceedence occurred on the 18 October 2013 during a period when severe bushfires, including the “State Mine Fire”, were present in and around the Lithgow area.
During the reporting period there were two run events in which a programming error caused the PM10 unit to run outside of the quality assurance run period of twenty four hours ± one hour as stipulated in AS3580.9.6.
4.2 NOISE MONITORING COMPLIANCE ASSESSMENT
Operational attended noise monitoring results for the period January – December 2013 are not directly comparable to the noise impact assessment criteria stipulated in the Lamberts Gully Coal Mine Noise Monitoring Program as the mine was not operational during the 2013 period. The results, however, are useful in that they provide a true measure of the ambient noise levels present at each monitoring location.
When these ambient noise results are compared to the noise impact assessment criteria for noise monitoring sites R2 and R7 it can be seen that exceedances are still shown to occur even when the mine is not operational. This indicates that during periods when the Lamberts Gully mine is not operational, the noise impact assessment criteria is exceeded at the Blackmans Flat residences. The influence of the nearby Castlereagh Highway is considered to have a much greater impact upon the noise levels received at the Blackmans Flat residences than the noise emissions generated by the Lamberts Gully mining operations.
This report must not be reproduced except in full. Results or figures from this report must not be used without acknowledgment.
Please contact the undersigned if you have any queries.
Yours faithfully
Katy Shaw Karen Tripp Environmental Scientist Senior Environmental Scientist/Hygienist Robert Carr & Associates Pty Ltd trading as Robert Carr & Associates Pty Ltd trading as RCA Laboratories – Environmental RCA Laboratories – Environmental

Appendix A
Drawings
Drawing 1 - Air Quality Monitoring Locations
Drawing 2 - Noise Monitoring Locations
Appendix B
Meteorological Monitoring Data January – December 2013
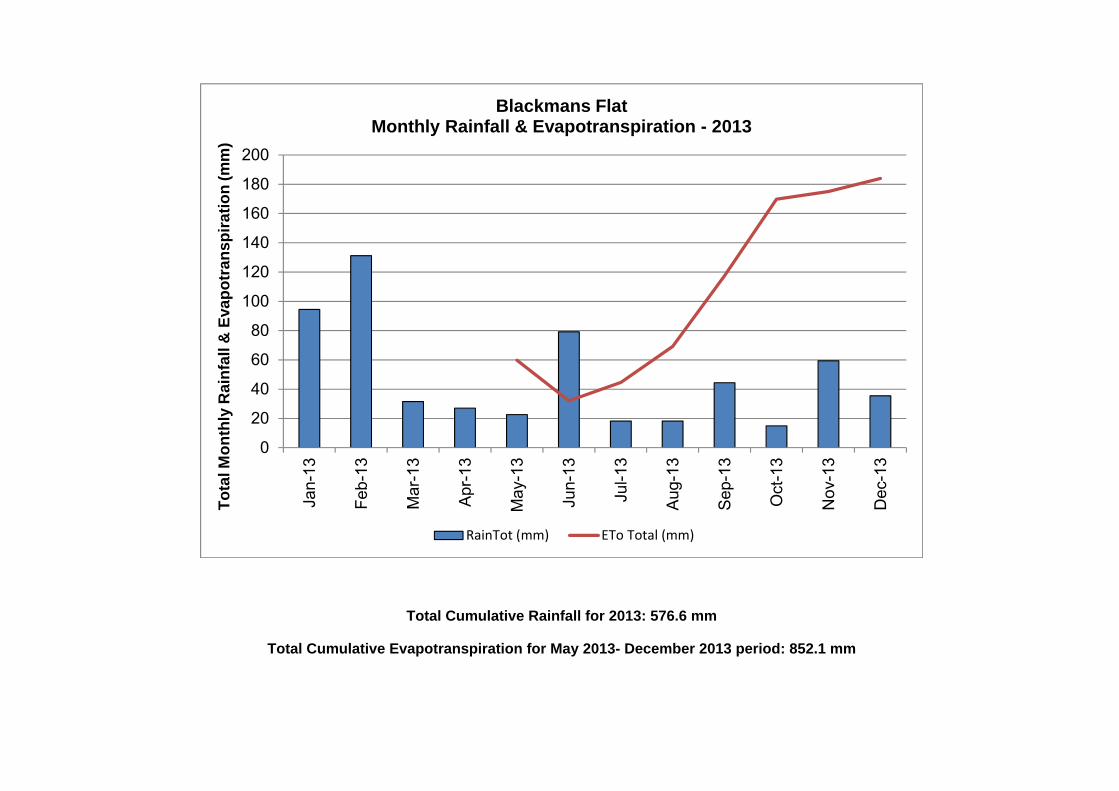
0
20
40
60
80
100
120
140
160
180
200
Jan-
13
Feb-
13
Mar
-13
Apr-1
3
May
-13
Jun-
13
Jul-1
3
Aug-
13
Sep-
13
Oct
-13
Nov
-13
Dec
-13
To
tal M
on
thly
Rai
nfa
ll &
Eva
po
tran
spir
atio
n (
mm
)
Blackmans FlatMonthly Rainfall & Evapotranspiration - 2013
RainTot (mm) ETo Total (mm)
Total Cumulative Rainfall for 2013: 576.6 mm
Total Cumulative Evapotranspiration for May 2013- December 2013 period: 852.1 mm
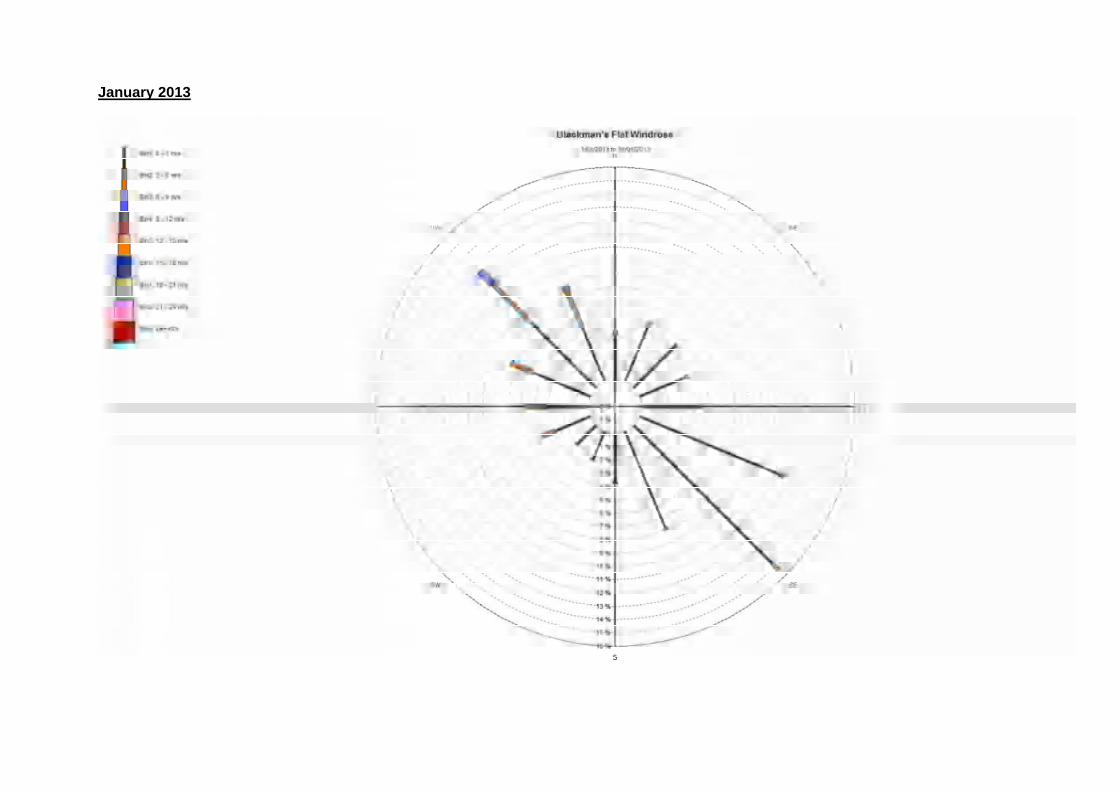
January 2013
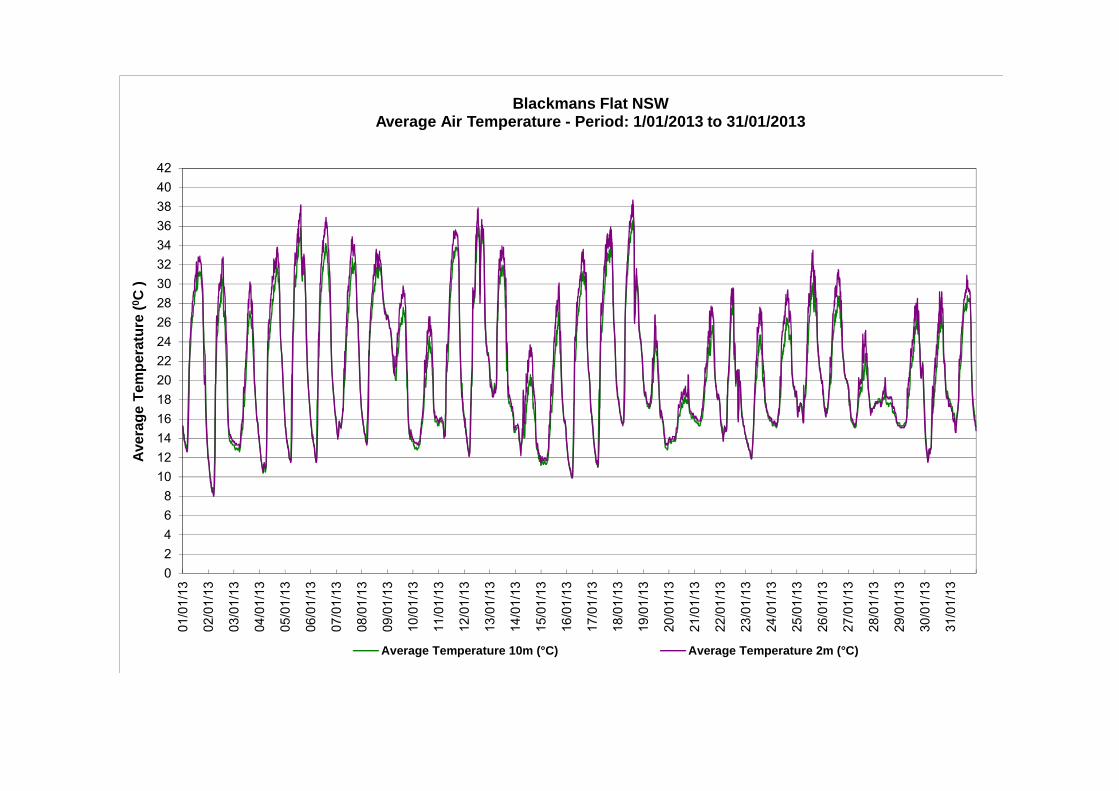
02468
101214161820222426283032343638404201
/01/
13
02/0
1/13
03/0
1/13
04/0
1/13
05/0
1/13
06/0
1/13
07/0
1/13
08/0
1/13
09/0
1/13
10/0
1/13
11/0
1/13
12/0
1/13
13/0
1/13
14/0
1/13
15/0
1/13
16/0
1/13
17/0
1/13
18/0
1/13
19/0
1/13
20/0
1/13
21/0
1/13
22/0
1/13
23/0
1/13
24/0
1/13
25/0
1/13
26/0
1/13
27/0
1/13
28/0
1/13
29/0
1/13
30/0
1/13
31/0
1/13
Ave
rag
e T
emp
erat
ure
(0C
)
Blackmans Flat NSWAverage Air Temperature - Period: 1/01/2013 to 31/01/2013
Average Temperature 10m (°C) Average Temperature 2m (°C)
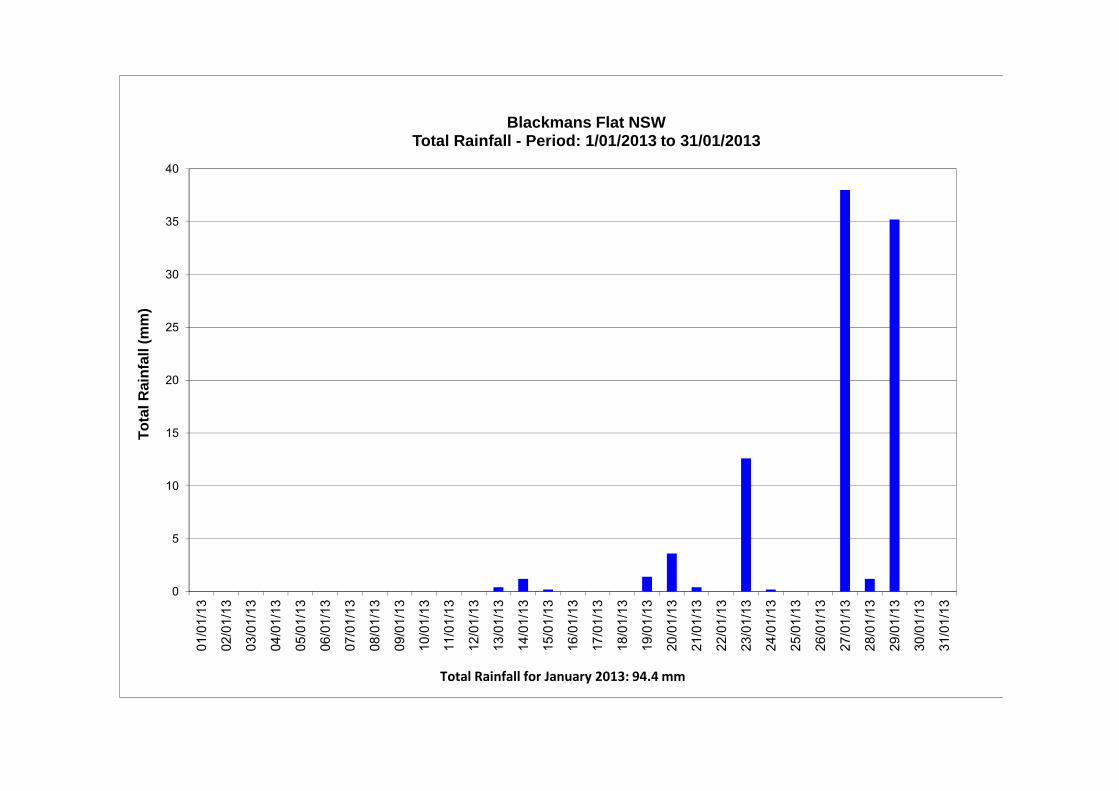
0
5
10
15
20
25
30
35
40
01/0
1/13
02/0
1/13
03/0
1/13
04/0
1/13
05/0
1/13
06/0
1/13
07/0
1/13
08/0
1/13
09/0
1/13
10/0
1/13
11/0
1/13
12/0
1/13
13/0
1/13
14/0
1/13
15/0
1/13
16/0
1/13
17/0
1/13
18/0
1/13
19/0
1/13
20/0
1/13
21/0
1/13
22/0
1/13
23/0
1/13
24/0
1/13
25/0
1/13
26/0
1/13
27/0
1/13
28/0
1/13
29/0
1/13
30/0
1/13
31/0
1/13
To
tal R
ain
fall
(m
m)
Blackmans Flat NSWTotal Rainfall - Period: 1/01/2013 to 31/01/2013
Total Rainfall for January 2013: 94.4 mm
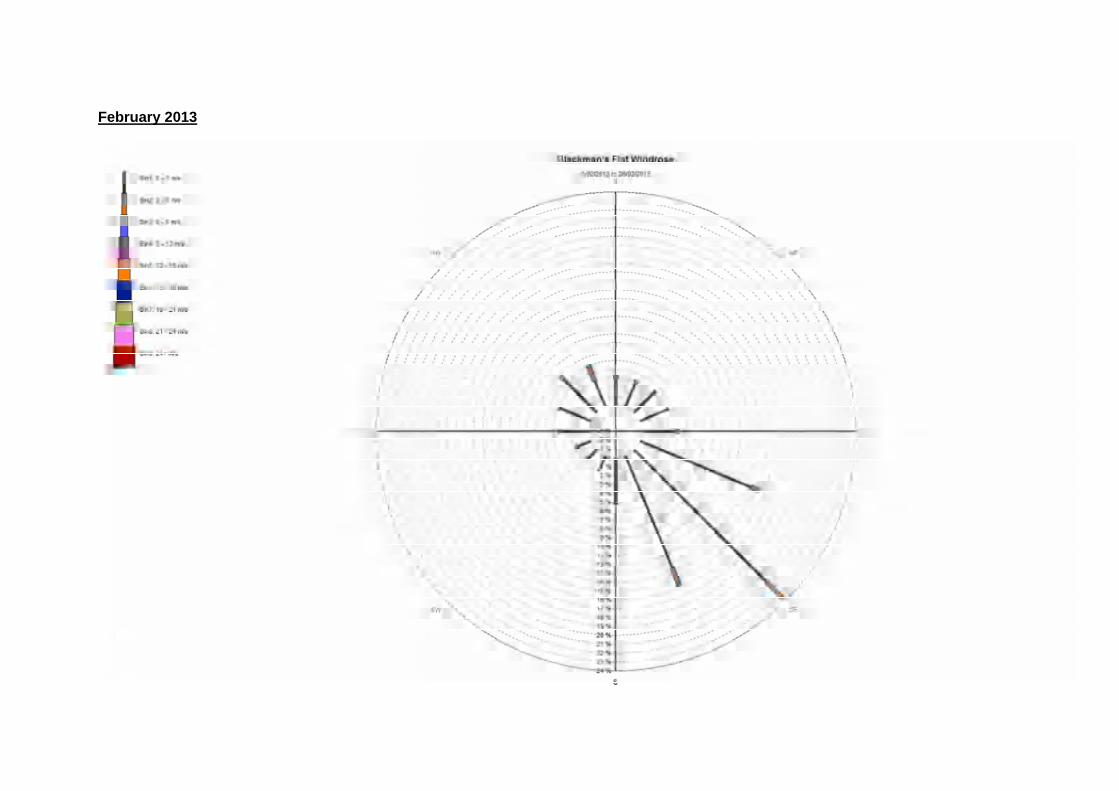
February 2013
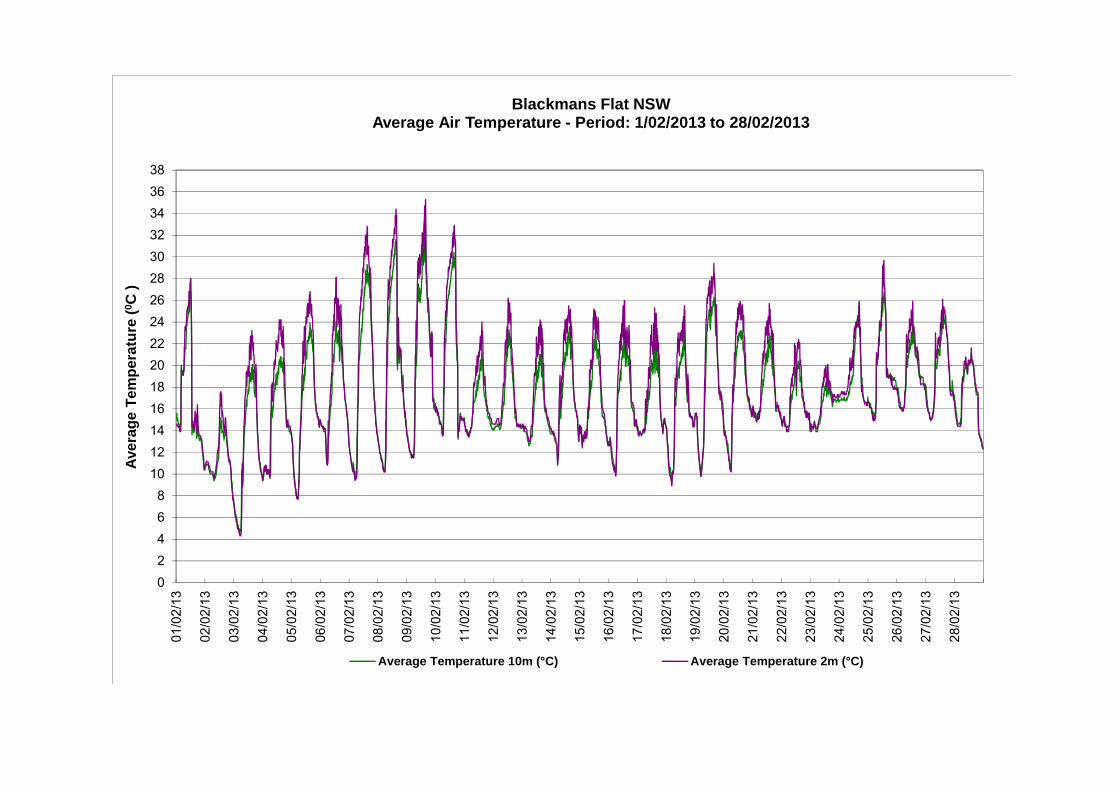
02468
10121416182022242628303234363801
/02/
13
02/0
2/13
03/0
2/13
04/0
2/13
05/0
2/13
06/0
2/13
07/0
2/13
08/0
2/13
09/0
2/13
10/0
2/13
11/0
2/13
12/0
2/13
13/0
2/13
14/0
2/13
15/0
2/13
16/0
2/13
17/0
2/13
18/0
2/13
19/0
2/13
20/0
2/13
21/0
2/13
22/0
2/13
23/0
2/13
24/0
2/13
25/0
2/13
26/0
2/13
27/0
2/13
28/0
2/13
Ave
rag
e T
emp
erat
ure
(0 C
)
Blackmans Flat NSWAverage Air Temperature - Period: 1/02/2013 to 28/02/2013
Average Temperature 10m (°C) Average Temperature 2m (°C)
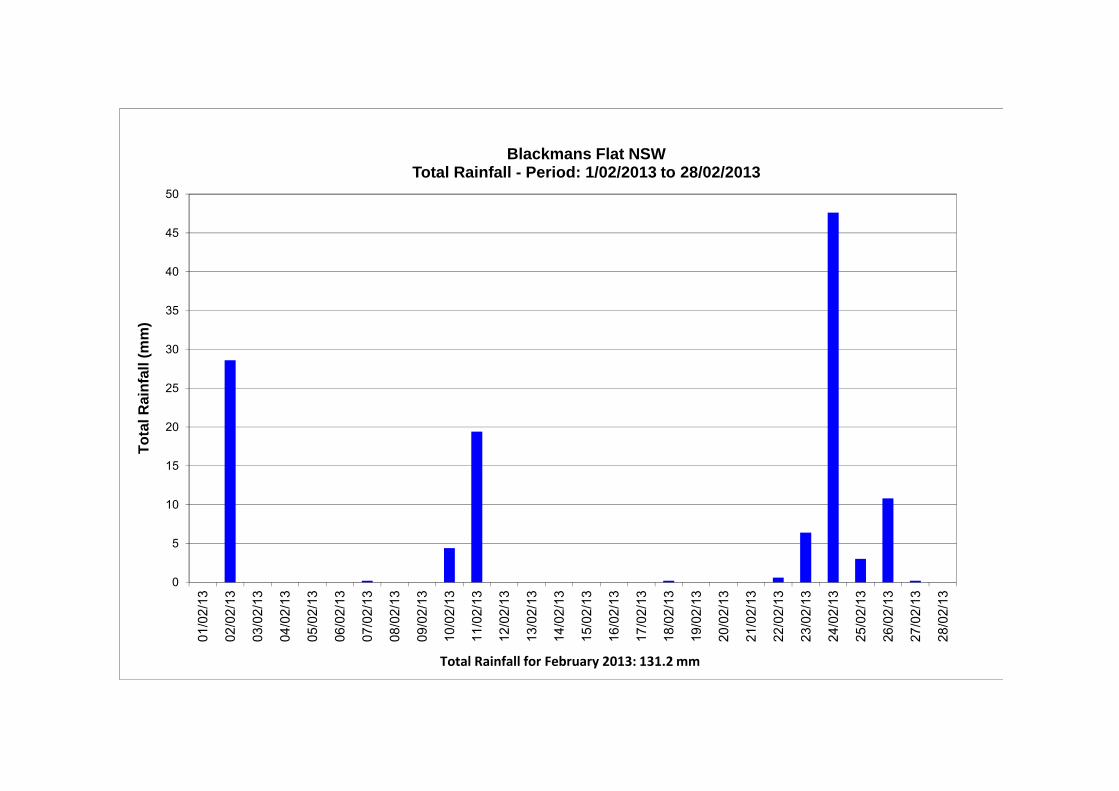
0
5
10
15
20
25
30
35
40
45
5001
/02/
13
02/0
2/13
03/0
2/13
04/0
2/13
05/0
2/13
06/0
2/13
07/0
2/13
08/0
2/13
09/0
2/13
10/0
2/13
11/0
2/13
12/0
2/13
13/0
2/13
14/0
2/13
15/0
2/13
16/0
2/13
17/0
2/13
18/0
2/13
19/0
2/13
20/0
2/13
21/0
2/13
22/0
2/13
23/0
2/13
24/0
2/13
25/0
2/13
26/0
2/13
27/0
2/13
28/0
2/13
To
tal R
ain
fall
(m
m)
Blackmans Flat NSWTotal Rainfall - Period: 1/02/2013 to 28/02/2013
Total Rainfall for February 2013: 131.2 mm
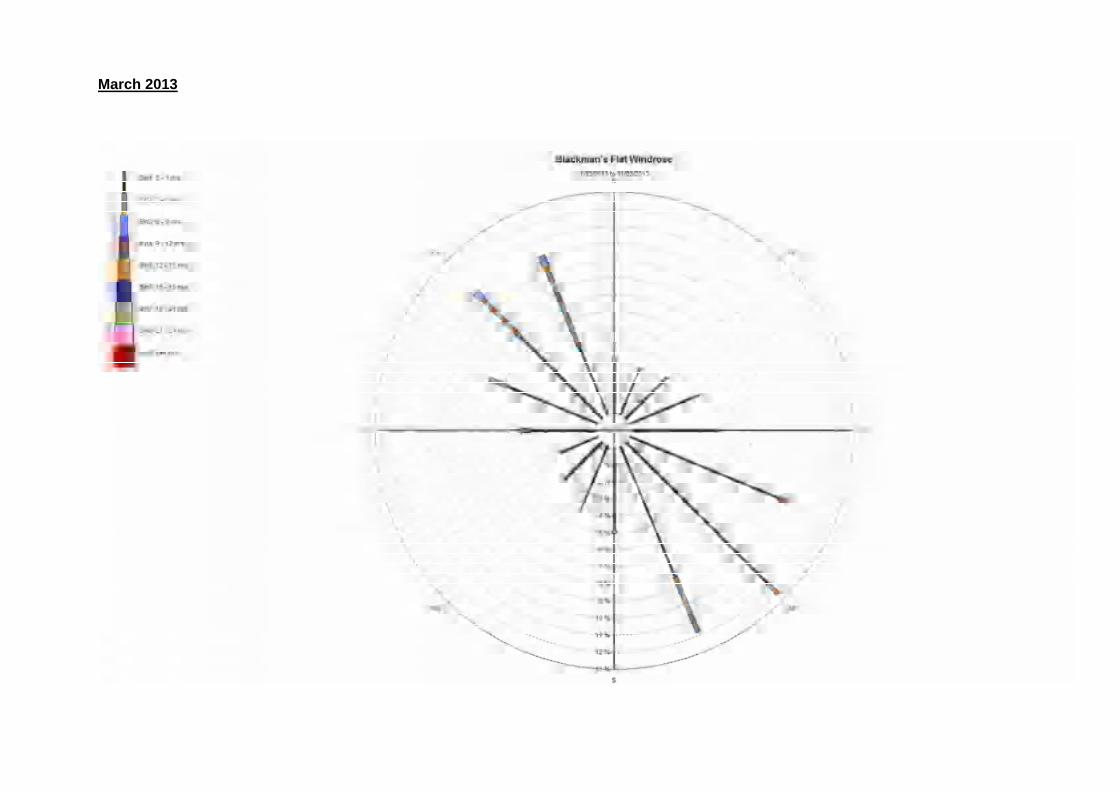
March 2013
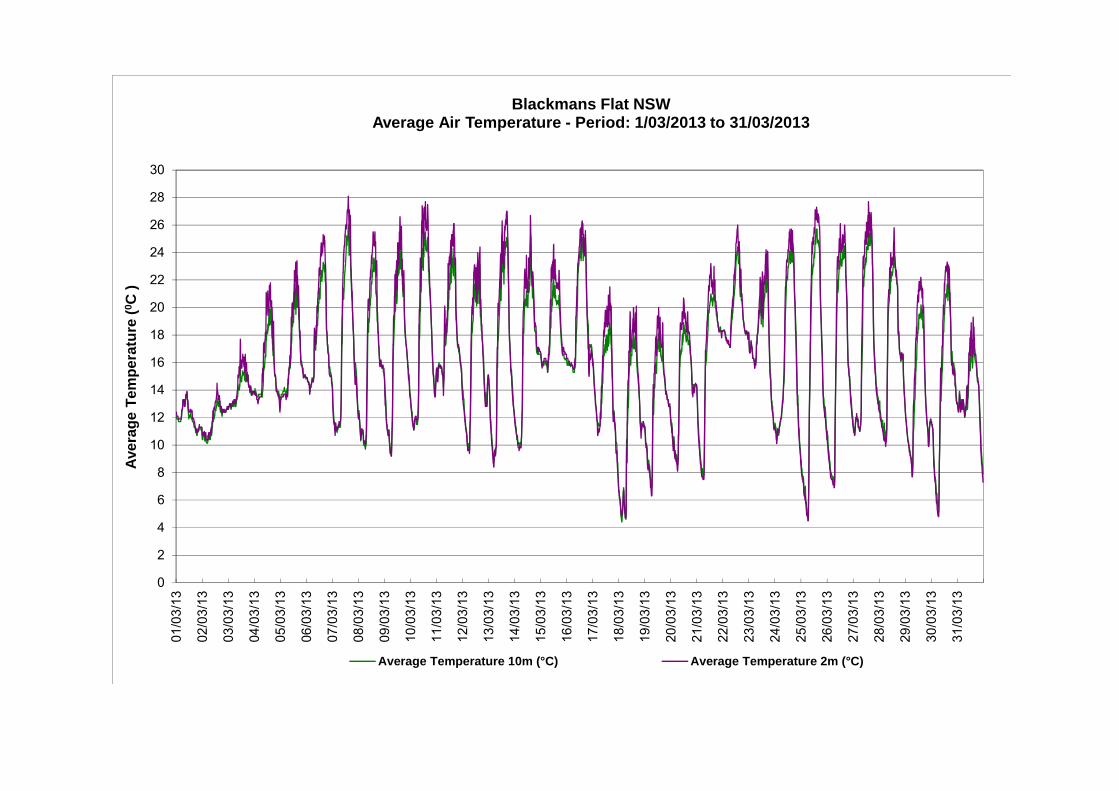
0
2
4
6
8
10
12
14
16
18
20
22
24
26
28
3001
/03/
13
02/0
3/13
03/0
3/13
04/0
3/13
05/0
3/13
06/0
3/13
07/0
3/13
08/0
3/13
09/0
3/13
10/0
3/13
11/0
3/13
12/0
3/13
13/0
3/13
14/0
3/13
15/0
3/13
16/0
3/13
17/0
3/13
18/0
3/13
19/0
3/13
20/0
3/13
21/0
3/13
22/0
3/13
23/0
3/13
24/0
3/13
25/0
3/13
26/0
3/13
27/0
3/13
28/0
3/13
29/0
3/13
30/0
3/13
31/0
3/13
Ave
rag
e T
emp
erat
ure
(0 C
)
Blackmans Flat NSWAverage Air Temperature - Period: 1/03/2013 to 31/03/2013
Average Temperature 10m (°C) Average Temperature 2m (°C)
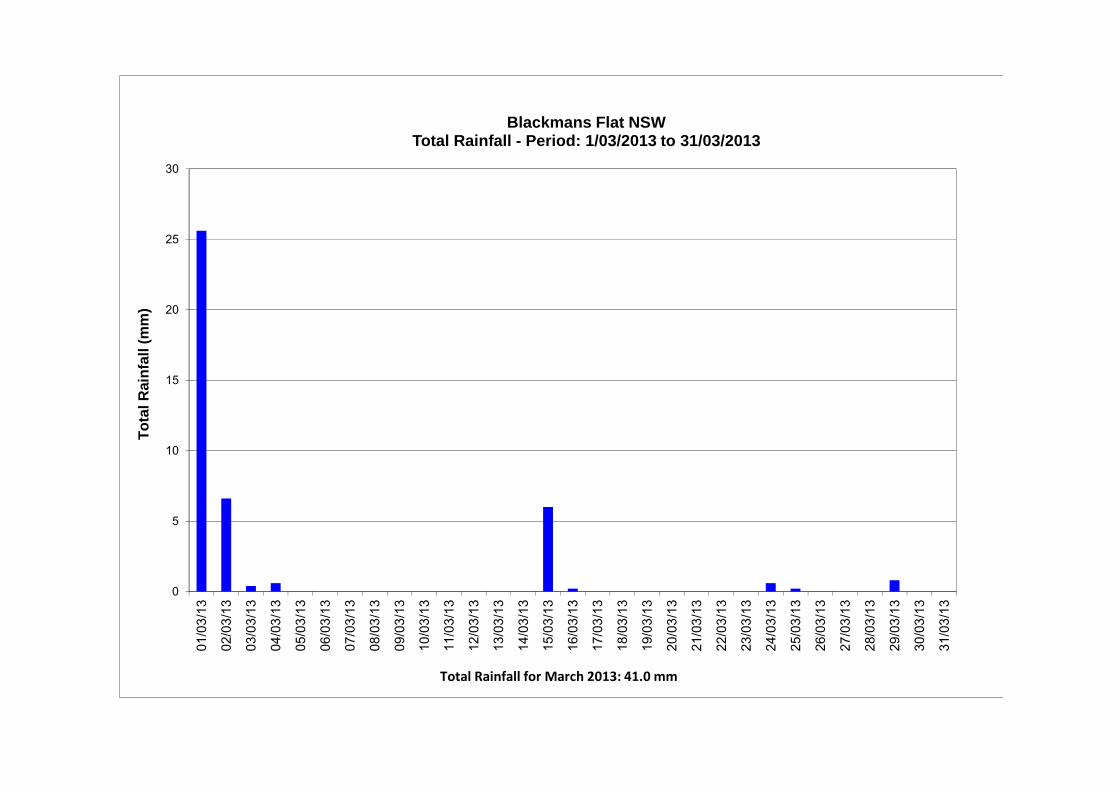
0
5
10
15
20
25
30
01/0
3/13
02/0
3/13
03/0
3/13
04/0
3/13
05/0
3/13
06/0
3/13
07/0
3/13
08/0
3/13
09/0
3/13
10/0
3/13
11/0
3/13
12/0
3/13
13/0
3/13
14/0
3/13
15/0
3/13
16/0
3/13
17/0
3/13
18/0
3/13
19/0
3/13
20/0
3/13
21/0
3/13
22/0
3/13
23/0
3/13
24/0
3/13
25/0
3/13
26/0
3/13
27/0
3/13
28/0
3/13
29/0
3/13
30/0
3/13
31/0
3/13
To
tal R
ain
fall
(m
m)
Blackmans Flat NSWTotal Rainfall - Period: 1/03/2013 to 31/03/2013
Total Rainfall for March 2013: 41.0 mm
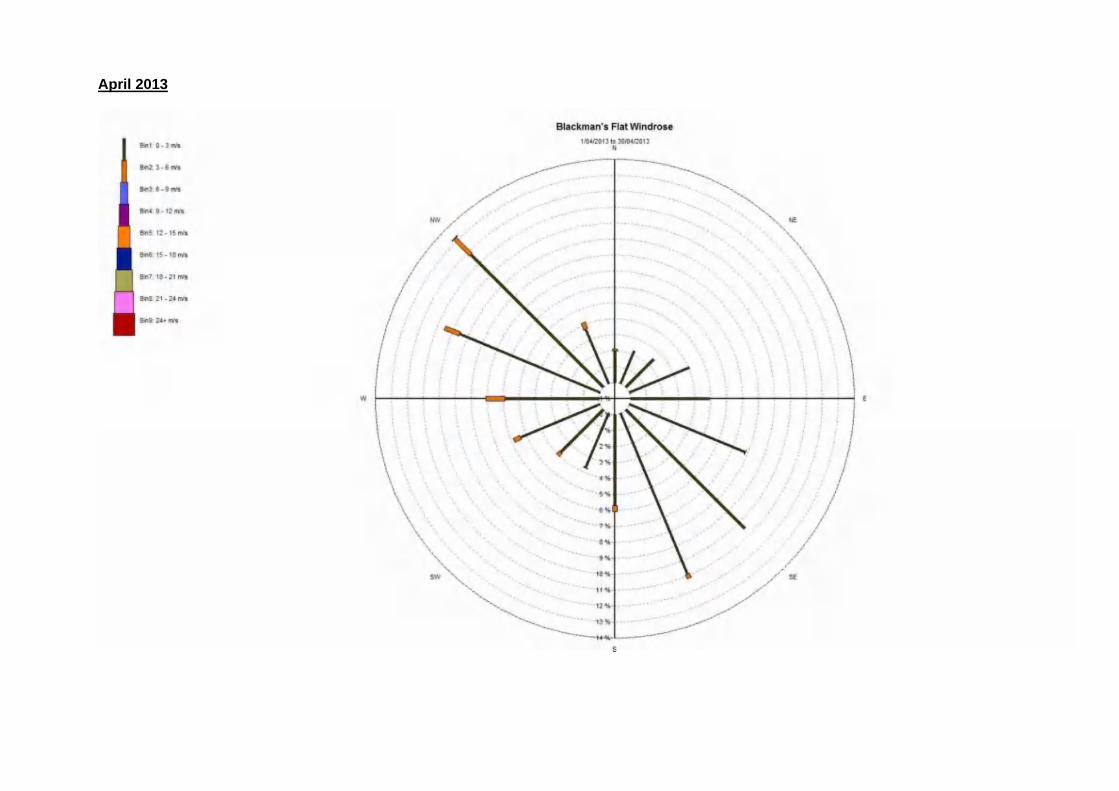
April 2013
-4
-2
0
2
4
6
8
10
12
14
16
18
20
22
24
26
2801
/04/
13
02/0
4/13
03/0
4/13
04/0
4/13
05/0
4/13
06/0
4/13
07/0
4/13
08/0
4/13
09/0
4/13
10/0
4/13
11/0
4/13
12/0
4/13
13/0
4/13
14/0
4/13
15/0
4/13
16/0
4/13
17/0
4/13
18/0
4/13
19/0
4/13
20/0
4/13
21/0
4/13
22/0
4/13
23/0
4/13
24/0
4/13
25/0
4/13
26/0
4/13
27/0
4/13
28/0
4/13
29/0
4/13
30/0
4/13
Ave
rag
e T
emp
erat
ure
(0 C
)
Blackmans Flat NSWAverage Air Temperature - Period: 1/04/2013 to 30/04/2013
Average Temperature 10m (°C) Average Temperature 2m (°C)
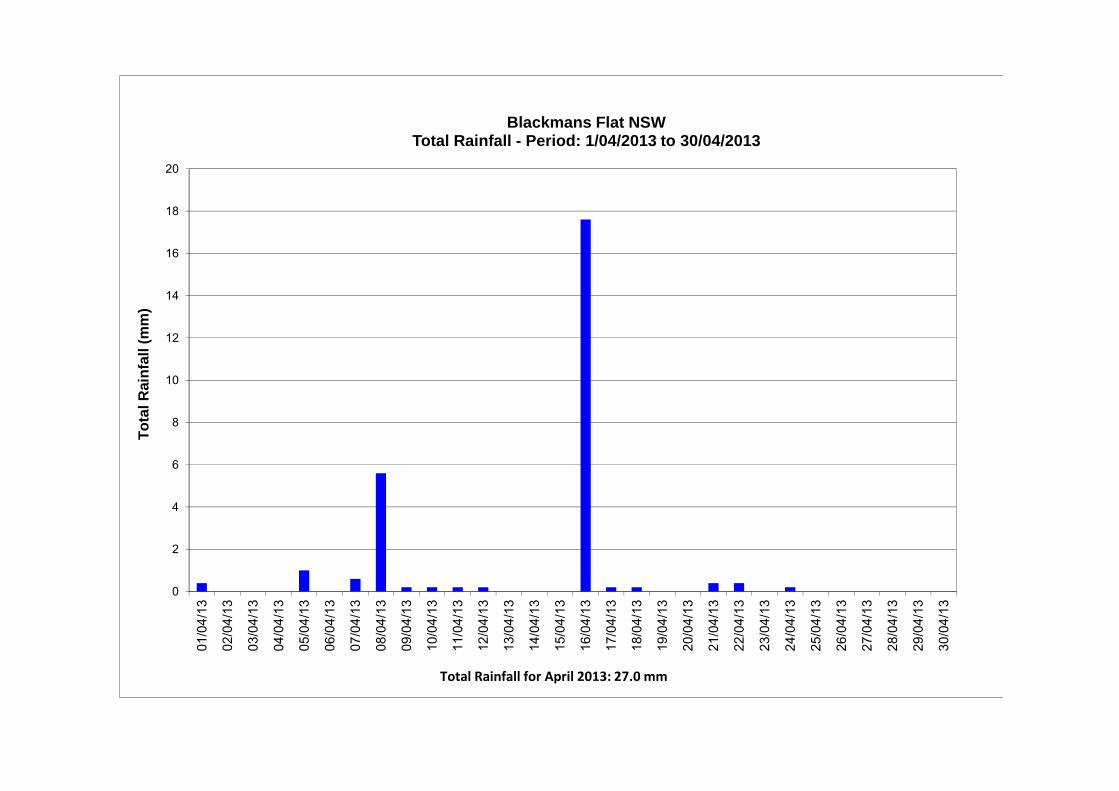
0
2
4
6
8
10
12
14
16
18
20
01/0
4/13
02/0
4/13
03/0
4/13
04/0
4/13
05/0
4/13
06/0
4/13
07/0
4/13
08/0
4/13
09/0
4/13
10/0
4/13
11/0
4/13
12/0
4/13
13/0
4/13
14/0
4/13
15/0
4/13
16/0
4/13
17/0
4/13
18/0
4/13
19/0
4/13
20/0
4/13
21/0
4/13
22/0
4/13
23/0
4/13
24/0
4/13
25/0
4/13
26/0
4/13
27/0
4/13
28/0
4/13
29/0
4/13
30/0
4/13
To
tal R
ain
fall
(m
m)
Blackmans Flat NSWTotal Rainfall - Period: 1/04/2013 to 30/04/2013
Total Rainfall for April 2013: 27.0 mm
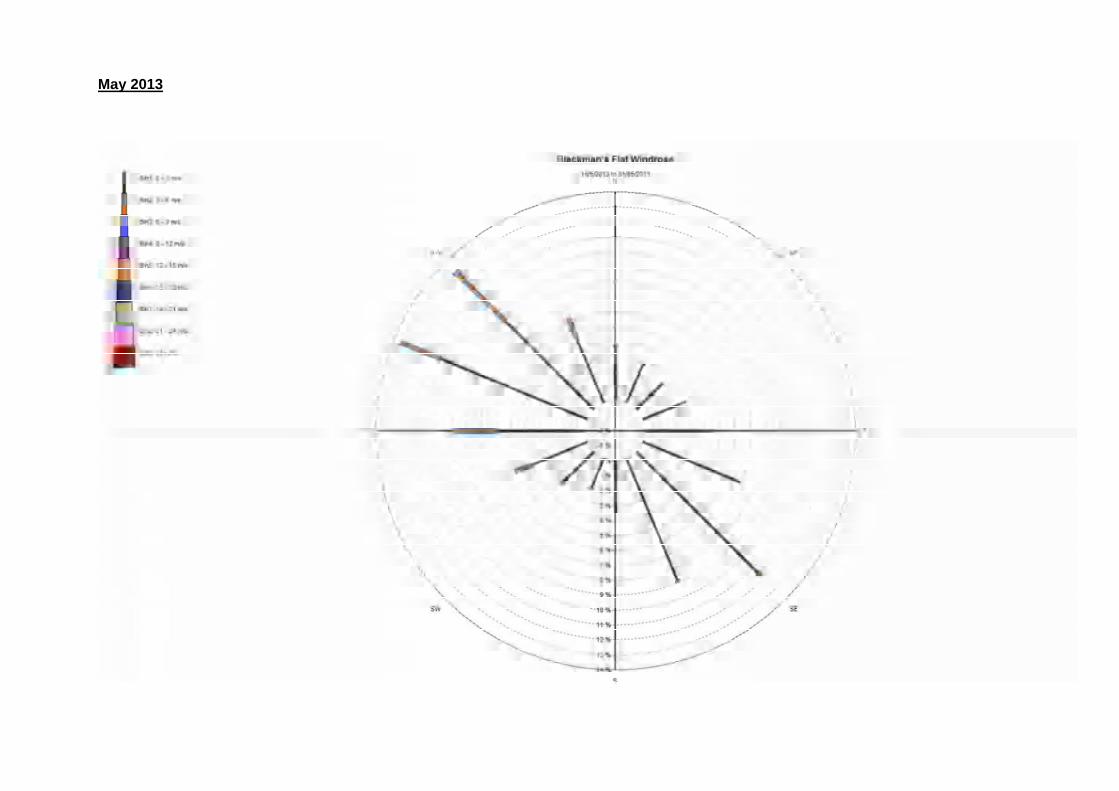
May 2013
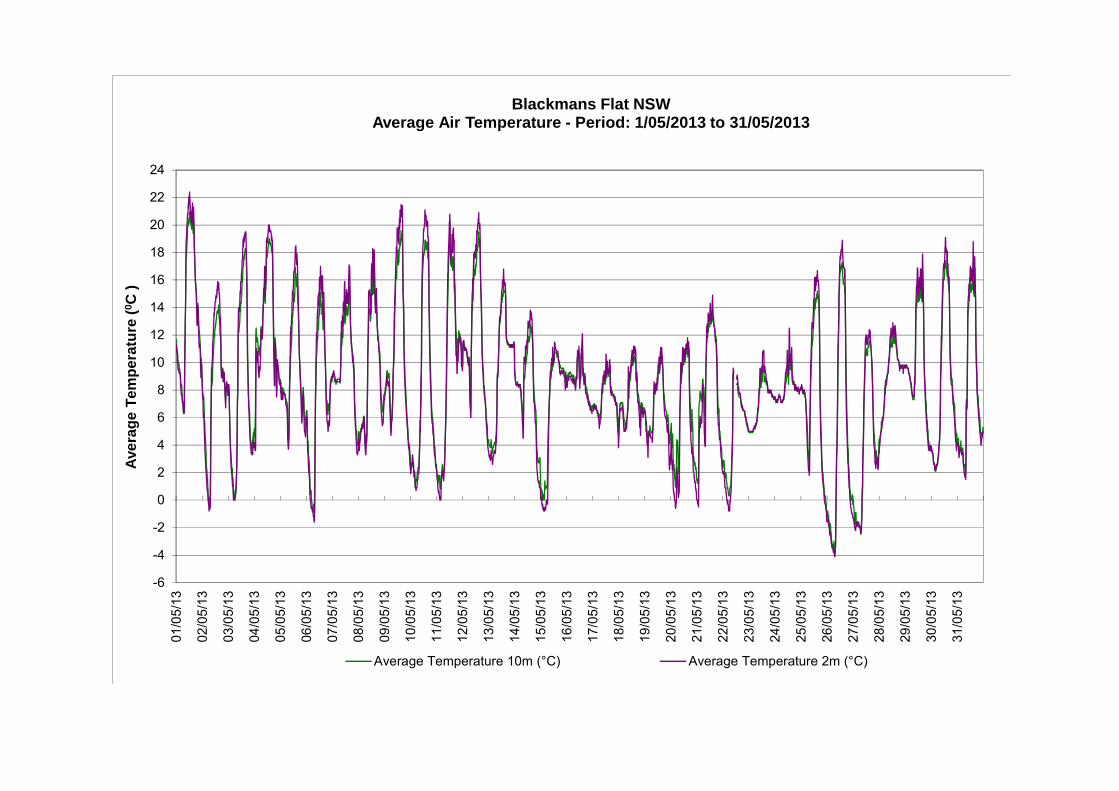
-6
-4
-2
0
2
4
6
8
10
12
14
16
18
20
22
2401
/05/
13
02/0
5/13
03/0
5/13
04/0
5/13
05/0
5/13
06/0
5/13
07/0
5/13
08/0
5/13
09/0
5/13
10/0
5/13
11/0
5/13
12/0
5/13
13/0
5/13
14/0
5/13
15/0
5/13
16/0
5/13
17/0
5/13
18/0
5/13
19/0
5/13
20/0
5/13
21/0
5/13
22/0
5/13
23/0
5/13
24/0
5/13
25/0
5/13
26/0
5/13
27/0
5/13
28/0
5/13
29/0
5/13
30/0
5/13
31/0
5/13
Ave
rag
e T
emp
erat
ure
(0 C
)
Blackmans Flat NSWAverage Air Temperature - Period: 1/05/2013 to 31/05/2013
Average Temperature 10m (°C) Average Temperature 2m (°C)
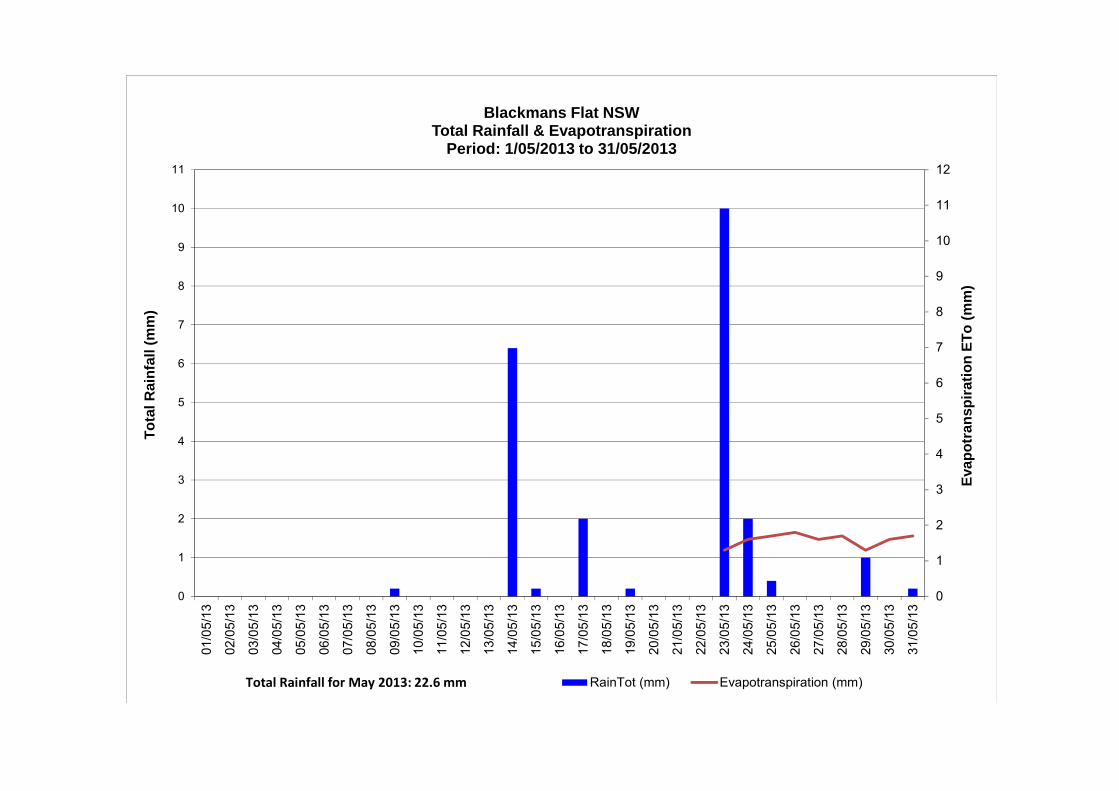
0
1
2
3
4
5
6
7
8
9
10
11
12
0
1
2
3
4
5
6
7
8
9
10
11
01/0
5/13
02/0
5/13
03/0
5/13
04/0
5/13
05/0
5/13
06/0
5/13
07/0
5/13
08/0
5/13
09/0
5/13
10/0
5/13
11/0
5/13
12/0
5/13
13/0
5/13
14/0
5/13
15/0
5/13
16/0
5/13
17/0
5/13
18/0
5/13
19/0
5/13
20/0
5/13
21/0
5/13
22/0
5/13
23/0
5/13
24/0
5/13
25/0
5/13
26/0
5/13
27/0
5/13
28/0
5/13
29/0
5/13
30/0
5/13
31/0
5/13
Eva
po
tran
spir
atio
n E
To
(m
m)
To
tal R
ain
fall
(m
m)
Blackmans Flat NSWTotal Rainfall & Evapotranspiration
Period: 1/05/2013 to 31/05/2013
RainTot (mm) Evapotranspiration (mm)Total Rainfall for May 2013: 22.6 mm
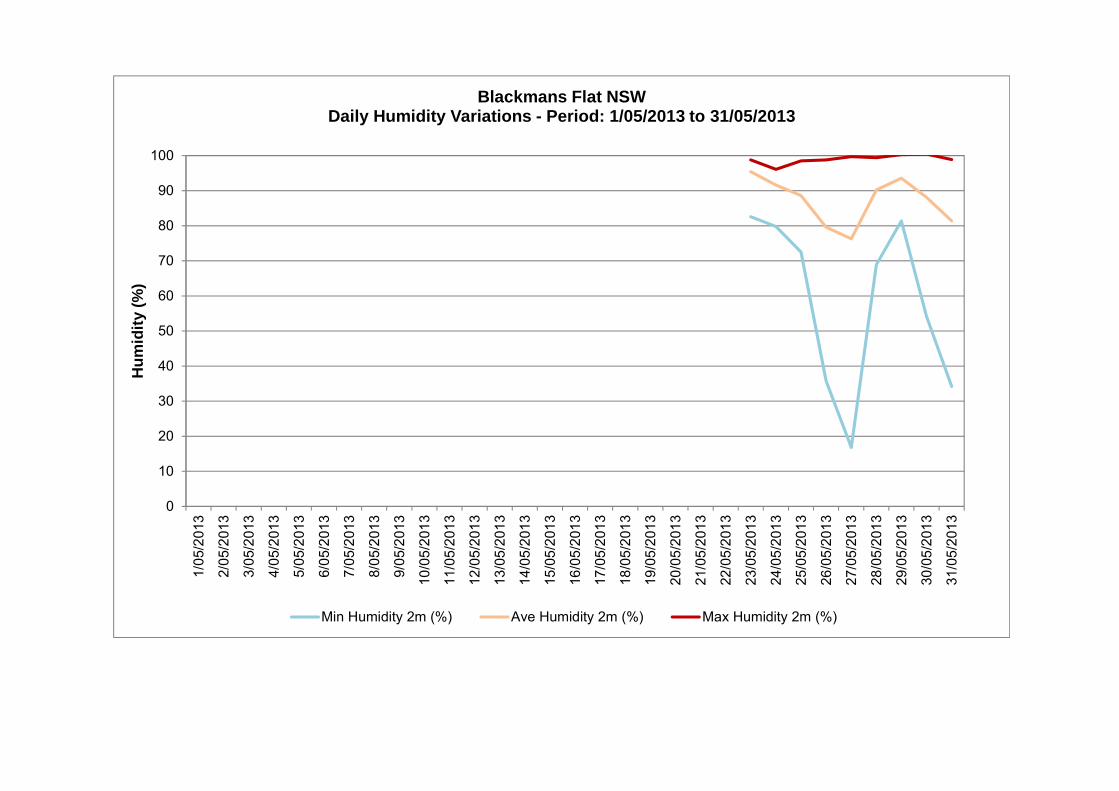
0
10
20
30
40
50
60
70
80
90
100
1/05
/201
3
2/05
/201
3
3/05
/201
3
4/05
/201
3
5/05
/201
3
6/05
/201
3
7/05
/201
3
8/05
/201
3
9/05
/201
3
10/0
5/20
13
11/0
5/20
13
12/0
5/20
13
13/0
5/20
13
14/0
5/20
13
15/0
5/20
13
16/0
5/20
13
17/0
5/20
13
18/0
5/20
13
19/0
5/20
13
20/0
5/20
13
21/0
5/20
13
22/0
5/20
13
23/0
5/20
13
24/0
5/20
13
25/0
5/20
13
26/0
5/20
13
27/0
5/20
13
28/0
5/20
13
29/0
5/20
13
30/0
5/20
13
31/0
5/20
13
Hu
mid
ity
(%)
Blackmans Flat NSWDaily Humidity Variations - Period: 1/05/2013 to 31/05/2013
Min Humidity 2m (%) Ave Humidity 2m (%) Max Humidity 2m (%)
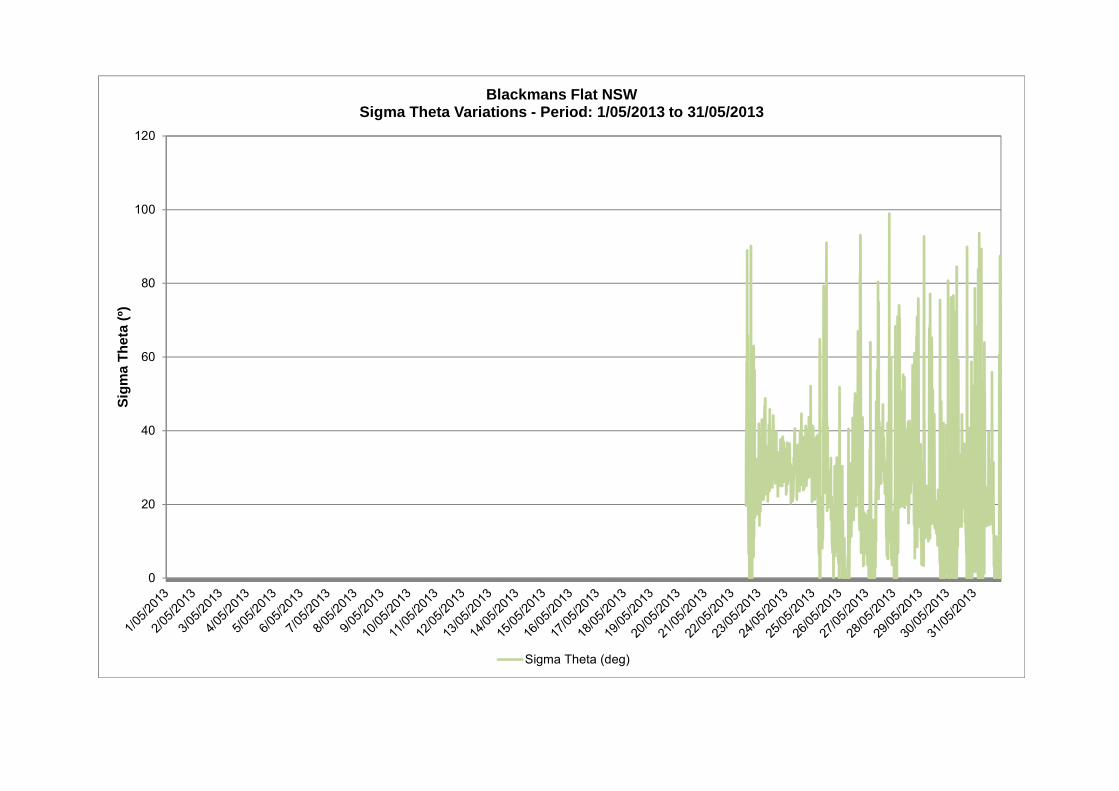
0
20
40
60
80
100
120S
igm
a T
het
a (º
)
Blackmans Flat NSWSigma Theta Variations - Period: 1/05/2013 to 31/05/2013
Sigma Theta (deg)
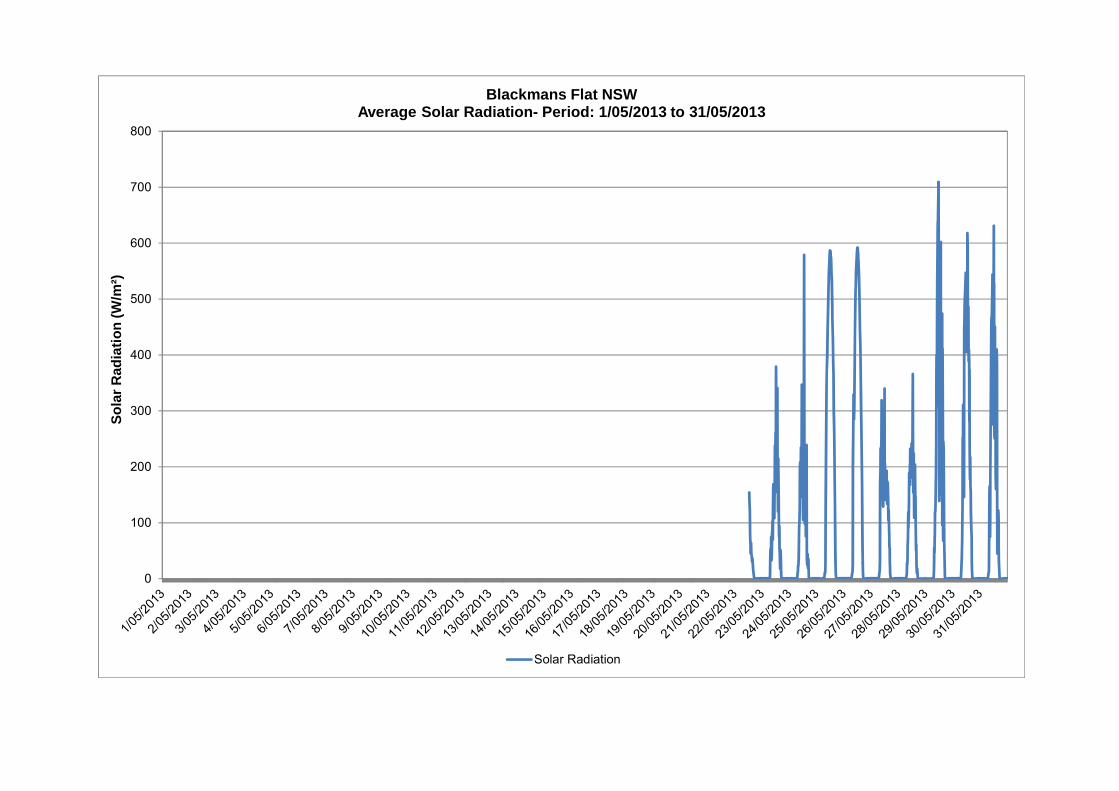
0
100
200
300
400
500
600
700
800S
ola
r R
adia
tio
n (
W/m
²)
Blackmans Flat NSWAverage Solar Radiation- Period: 1/05/2013 to 31/05/2013
Solar Radiation
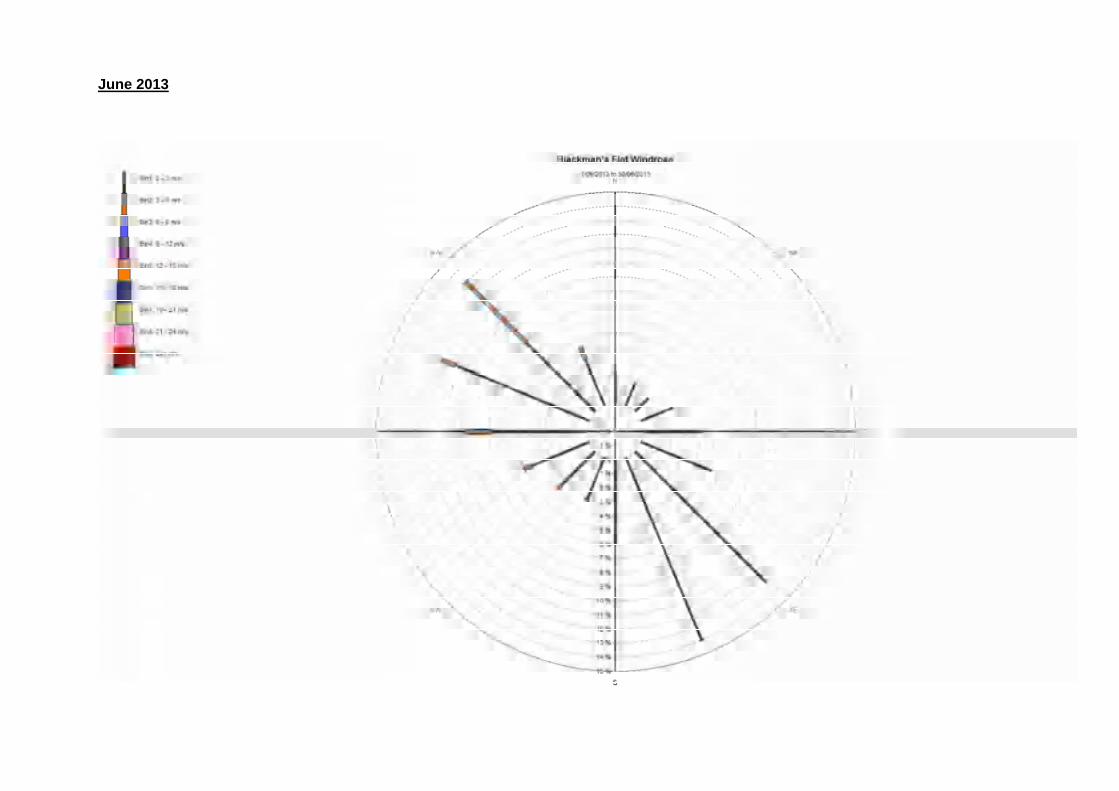
June 2013
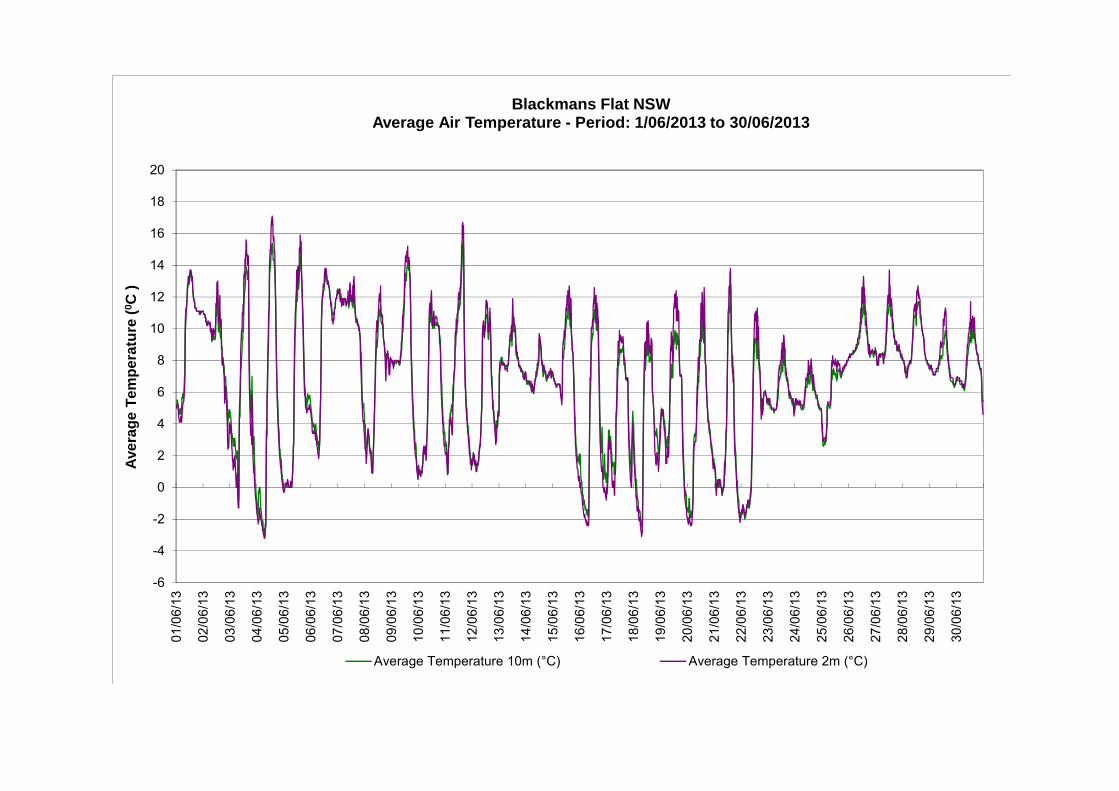
-6
-4
-2
0
2
4
6
8
10
12
14
16
18
2001
/06/
13
02/0
6/13
03/0
6/13
04/0
6/13
05/0
6/13
06/0
6/13
07/0
6/13
08/0
6/13
09/0
6/13
10/0
6/13
11/0
6/13
12/0
6/13
13/0
6/13
14/0
6/13
15/0
6/13
16/0
6/13
17/0
6/13
18/0
6/13
19/0
6/13
20/0
6/13
21/0
6/13
22/0
6/13
23/0
6/13
24/0
6/13
25/0
6/13
26/0
6/13
27/0
6/13
28/0
6/13
29/0
6/13
30/0
6/13
Ave
rag
e T
emp
erat
ure
(0 C
)
Blackmans Flat NSWAverage Air Temperature - Period: 1/06/2013 to 30/06/2013
Average Temperature 10m (°C) Average Temperature 2m (°C)
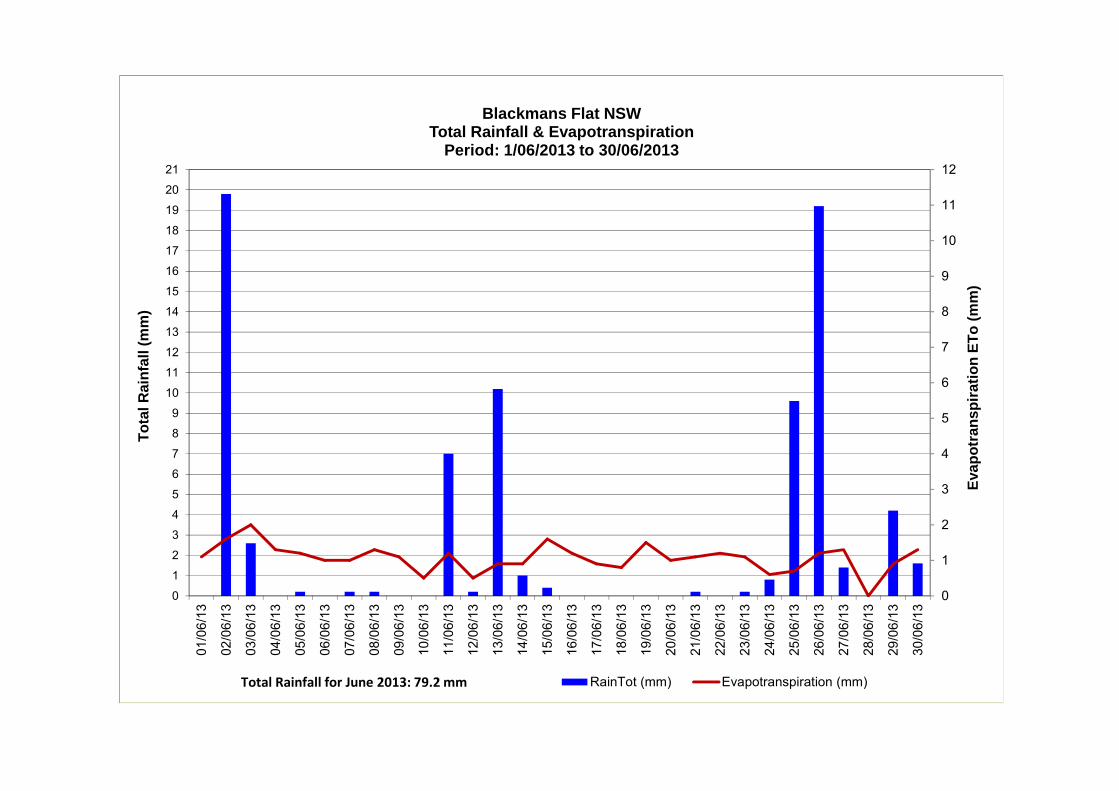
0
1
2
3
4
5
6
7
8
9
10
11
12
0
1
2
3
4
5
6
7
8
9
10
11
12
13
14
15
16
17
18
19
20
21
01/0
6/13
02/0
6/13
03/0
6/13
04/0
6/13
05/0
6/13
06/0
6/13
07/0
6/13
08/0
6/13
09/0
6/13
10/0
6/13
11/0
6/13
12/0
6/13
13/0
6/13
14/0
6/13
15/0
6/13
16/0
6/13
17/0
6/13
18/0
6/13
19/0
6/13
20/0
6/13
21/0
6/13
22/0
6/13
23/0
6/13
24/0
6/13
25/0
6/13
26/0
6/13
27/0
6/13
28/0
6/13
29/0
6/13
30/0
6/13
Eva
po
tran
spir
atio
n E
To
(m
m)
To
tal R
ain
fall
(m
m)
Blackmans Flat NSWTotal Rainfall & Evapotranspiration
Period: 1/06/2013 to 30/06/2013
RainTot (mm) Evapotranspiration (mm)Total Rainfall for June 2013: 79.2 mm
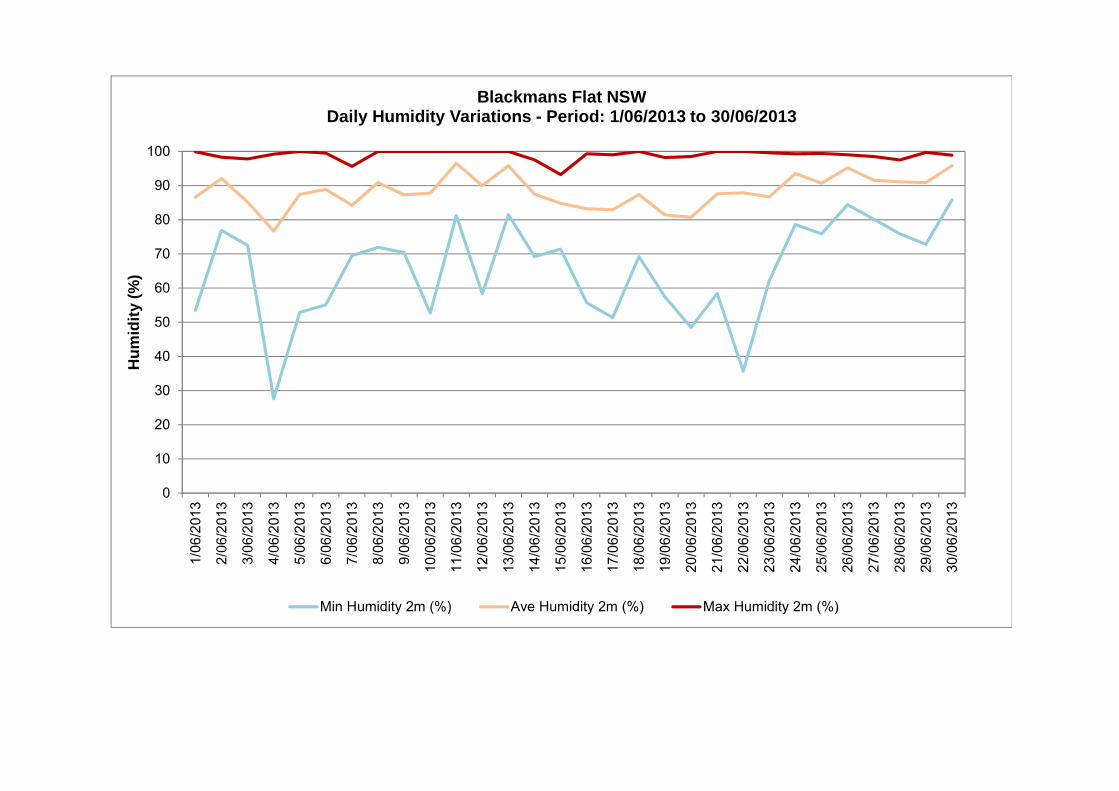
0
10
20
30
40
50
60
70
80
90
100
1/06
/201
3
2/06
/201
3
3/06
/201
3
4/06
/201
3
5/06
/201
3
6/06
/201
3
7/06
/201
3
8/06
/201
3
9/06
/201
3
10/0
6/20
13
11/0
6/20
13
12/0
6/20
13
13/0
6/20
13
14/0
6/20
13
15/0
6/20
13
16/0
6/20
13
17/0
6/20
13
18/0
6/20
13
19/0
6/20
13
20/0
6/20
13
21/0
6/20
13
22/0
6/20
13
23/0
6/20
13
24/0
6/20
13
25/0
6/20
13
26/0
6/20
13
27/0
6/20
13
28/0
6/20
13
29/0
6/20
13
30/0
6/20
13
Hu
mid
ity
(%)
Blackmans Flat NSWDaily Humidity Variations - Period: 1/06/2013 to 30/06/2013
Min Humidity 2m (%) Ave Humidity 2m (%) Max Humidity 2m (%)
0
20
40
60
80
100
120S
igm
a T
het
a (º
)
Blackmans Flat NSWSigma Theta Variations - Period: 1/06/2013 to 30/06/2013
Sigma Theta (deg)
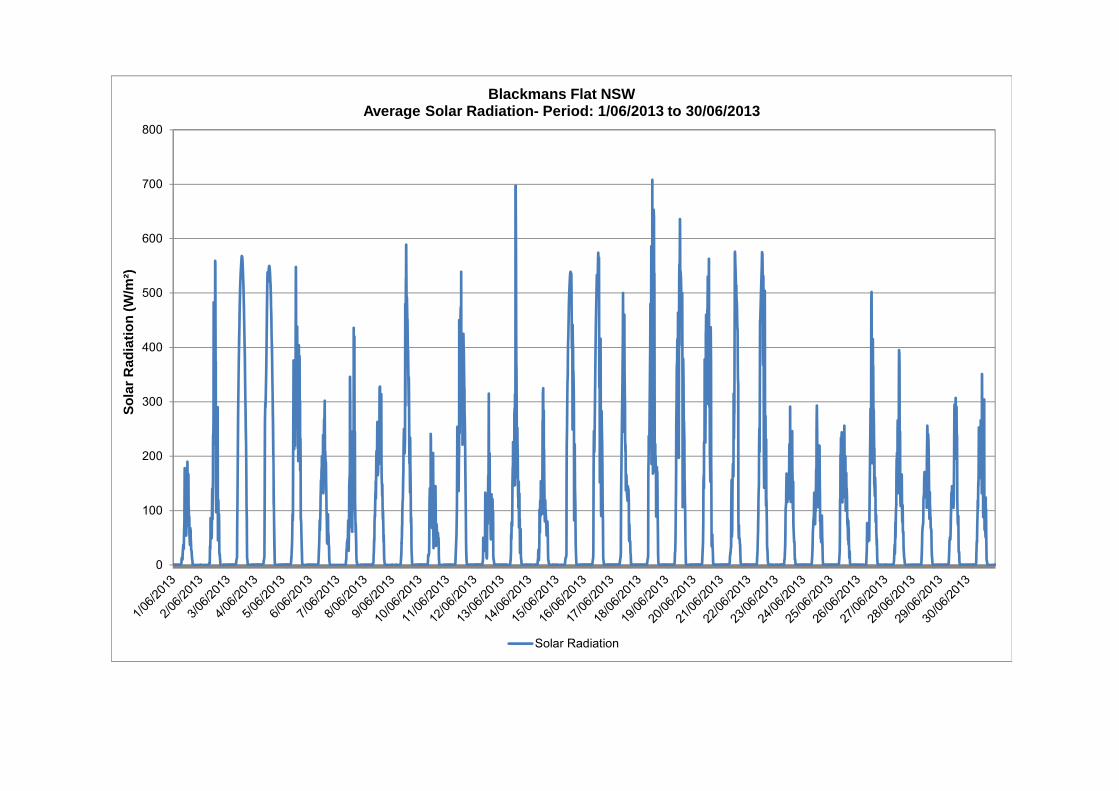
0
100
200
300
400
500
600
700
800S
ola
r R
adia
tio
n (
W/m
²)
Blackmans Flat NSWAverage Solar Radiation- Period: 1/06/2013 to 30/06/2013
Solar Radiation
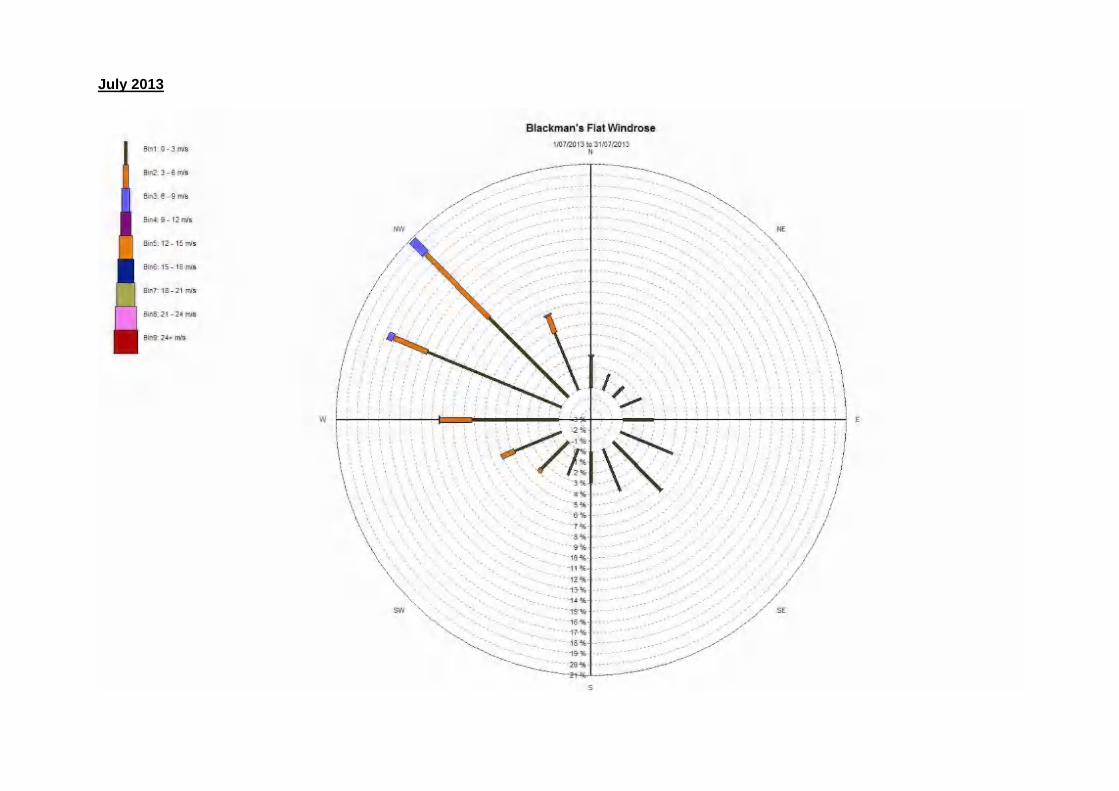
July 2013
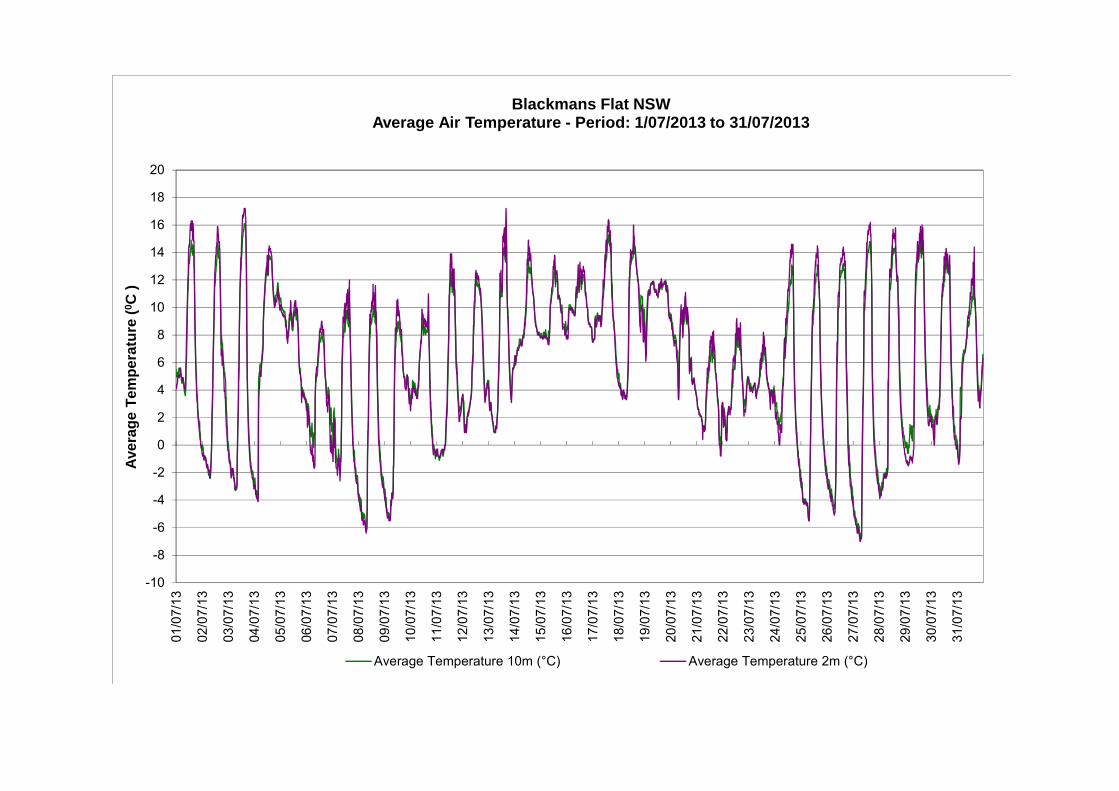
-10
-8
-6
-4
-2
0
2
4
6
8
10
12
14
16
18
2001
/07/
13
02/0
7/13
03/0
7/13
04/0
7/13
05/0
7/13
06/0
7/13
07/0
7/13
08/0
7/13
09/0
7/13
10/0
7/13
11/0
7/13
12/0
7/13
13/0
7/13
14/0
7/13
15/0
7/13
16/0
7/13
17/0
7/13
18/0
7/13
19/0
7/13
20/0
7/13
21/0
7/13
22/0
7/13
23/0
7/13
24/0
7/13
25/0
7/13
26/0
7/13
27/0
7/13
28/0
7/13
29/0
7/13
30/0
7/13
31/0
7/13
Ave
rag
e T
emp
erat
ure
(0 C
)
Blackmans Flat NSWAverage Air Temperature - Period: 1/07/2013 to 31/07/2013
Average Temperature 10m (°C) Average Temperature 2m (°C)
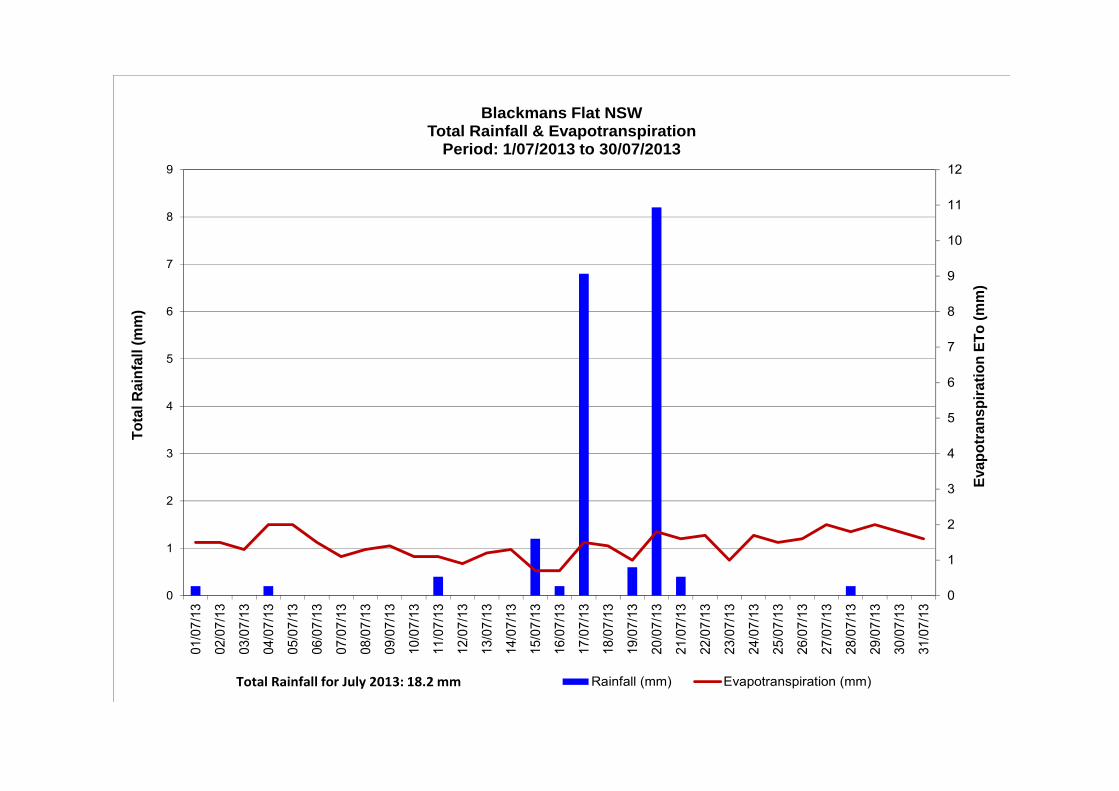
0
1
2
3
4
5
6
7
8
9
10
11
12
0
1
2
3
4
5
6
7
8
9
01/0
7/13
02/0
7/13
03/0
7/13
04/0
7/13
05/0
7/13
06/0
7/13
07/0
7/13
08/0
7/13
09/0
7/13
10/0
7/13
11/0
7/13
12/0
7/13
13/0
7/13
14/0
7/13
15/0
7/13
16/0
7/13
17/0
7/13
18/0
7/13
19/0
7/13
20/0
7/13
21/0
7/13
22/0
7/13
23/0
7/13
24/0
7/13
25/0
7/13
26/0
7/13
27/0
7/13
28/0
7/13
29/0
7/13
30/0
7/13
31/0
7/13
Eva
po
tran
spir
atio
n E
To
(m
m)
To
tal R
ain
fall
(mm
)
Blackmans Flat NSWTotal Rainfall & Evapotranspiration
Period: 1/07/2013 to 30/07/2013
Rainfall (mm) Evapotranspiration (mm)Total Rainfall for July 2013: 18.2 mm
0
10
20
30
40
50
60
70
80
90
100
1/07
/201
3
2/07
/201
3
3/07
/201
3
4/07
/201
3
5/07
/201
3
6/07
/201
3
7/07
/201
3
8/07
/201
3
9/07
/201
3
10/0
7/20
13
11/0
7/20
13
12/0
7/20
13
13/0
7/20
13
14/0
7/20
13
15/0
7/20
13
16/0
7/20
13
17/0
7/20
13
18/0
7/20
13
19/0
7/20
13
20/0
7/20
13
21/0
7/20
13
22/0
7/20
13
23/0
7/20
13
24/0
7/20
13
25/0
7/20
13
26/0
7/20
13
27/0
7/20
13
28/0
7/20
13
29/0
7/20
13
30/0
7/20
13
31/0
7/20
13
Hu
mid
ity
(%)
Blackmans Flat NSWDaily Humidity Variations - Period: 1/07/2013 to 31/07/2013
Min Humidity 2m (%) Ave Humidity 2m (%) Max Humidity 2m (%)
0
20
40
60
80
100
120S
igm
a T
het
a (º
)
Blackmans Flat NSWSigma Theta Variations - Period: 1/07/2013 to 31/07/2013
Sigma Theta (deg)
0
100
200
300
400
500
600
700
800
900S
ola
r R
adia
tio
n (
W/m
²)
Blackmans Flat NSWAverage Solar Radiation- Period: 1/07/2013 to 31/07/2013
Solar Radiation
August 2013
-8
-6
-4
-2
0
2
4
6
8
10
12
14
16
18
20
22
2401
/08/
13
02/0
8/13
03/0
8/13
04/0
8/13
05/0
8/13
06/0
8/13
07/0
8/13
08/0
8/13
09/0
8/13
10/0
8/13
11/0
8/13
12/0
8/13
13/0
8/13
14/0
8/13
15/0
8/13
16/0
8/13
17/0
8/13
18/0
8/13
19/0
8/13
20/0
8/13
21/0
8/13
22/0
8/13
23/0
8/13
24/0
8/13
25/0
8/13
26/0
8/13
27/0
8/13
28/0
8/13
29/0
8/13
30/0
8/13
31/0
8/13
Ave
rag
e T
emp
erat
ure
(0 C
)
Blackmans Flat NSWAverage Air Temperature - Period: 1/08/2013 to 31/08/2013
Average Temperature 10m (°C) Average Temperature 2m (°C)
0
1
2
3
4
5
6
7
8
9
10
11
12
0
1
2
3
4
5
6
7
8
9
10
11
01/0
8/13
02/0
8/13
03/0
8/13
04/0
8/13
05/0
8/13
06/0
8/13
07/0
8/13
08/0
8/13
09/0
8/13
10/0
8/13
11/0
8/13
12/0
8/13
13/0
8/13
14/0
8/13
15/0
8/13
16/0
8/13
17/0
8/13
18/0
8/13
19/0
8/13
20/0
8/13
21/0
8/13
22/0
8/13
23/0
8/13
24/0
8/13
25/0
8/13
26/0
8/13
27/0
8/13
28/0
8/13
29/0
8/13
30/0
8/13
31/0
8/13
Eva
po
tran
spir
atio
n E
To
(m
m)
To
tal R
ain
fall
(mm
)
Blackmans Flat NSWTotal Rainfall & Evapotranspiration
Period: 1/08/2013 to 31/08/2013
Rainfall (mm) Evapotranspiration (mm)Total Rainfall for August 2013: 18.2 mm
0
10
20
30
40
50
60
70
80
90
100
1/08
/201
3
2/08
/201
3
3/08
/201
3
4/08
/201
3
5/08
/201
3
6/08
/201
3
7/08
/201
3
8/08
/201
3
9/08
/201
3
10/0
8/20
13
11/0
8/20
13
12/0
8/20
13
13/0
8/20
13
14/0
8/20
13
15/0
8/20
13
16/0
8/20
13
17/0
8/20
13
18/0
8/20
13
19/0
8/20
13
20/0
8/20
13
21/0
8/20
13
22/0
8/20
13
23/0
8/20
13
24/0
8/20
13
25/0
8/20
13
26/0
8/20
13
27/0
8/20
13
28/0
8/20
13
29/0
8/20
13
30/0
8/20
13
31/0
8/20
13
Hu
mid
ity
(%)
Blackmans Flat NSWDaily Humidity Variations - Period: 1/08/2013 to 31/08/2013
Min Humidity 2m (%) Ave Humidity 2m (%) Max Humidity 2m (%)
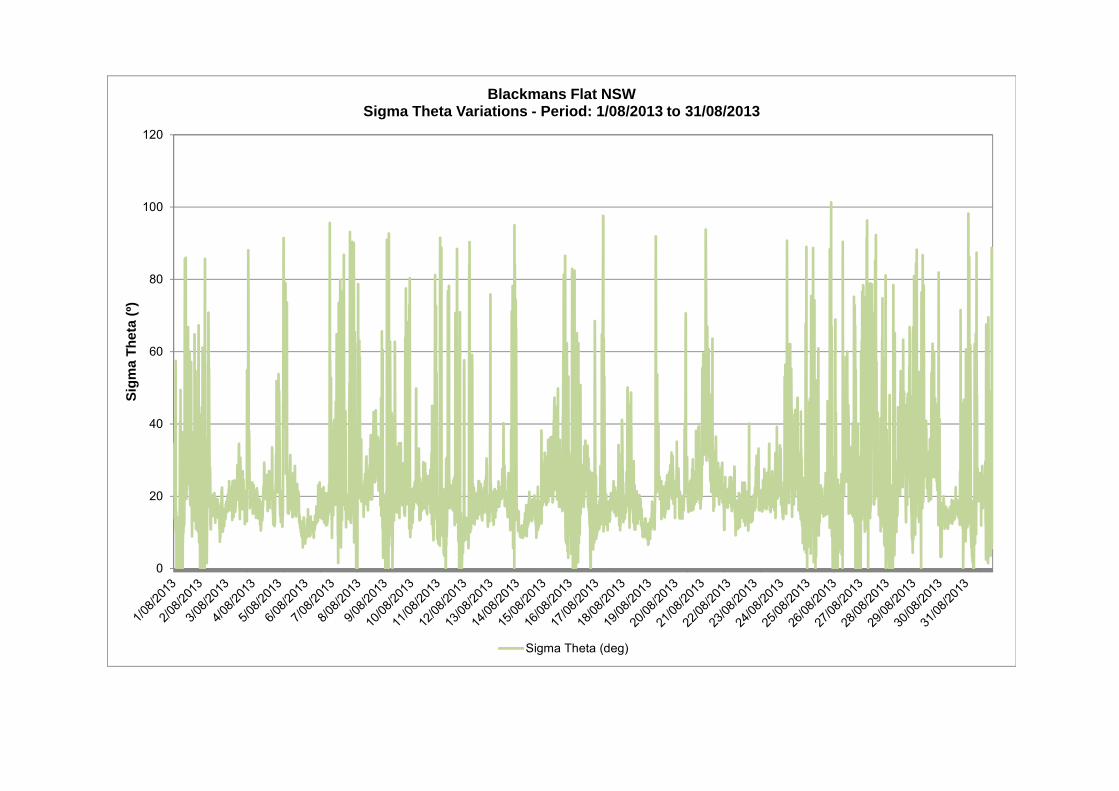
0
20
40
60
80
100
120S
igm
a T
het
a (º
)
Blackmans Flat NSWSigma Theta Variations - Period: 1/08/2013 to 31/08/2013
Sigma Theta (deg)
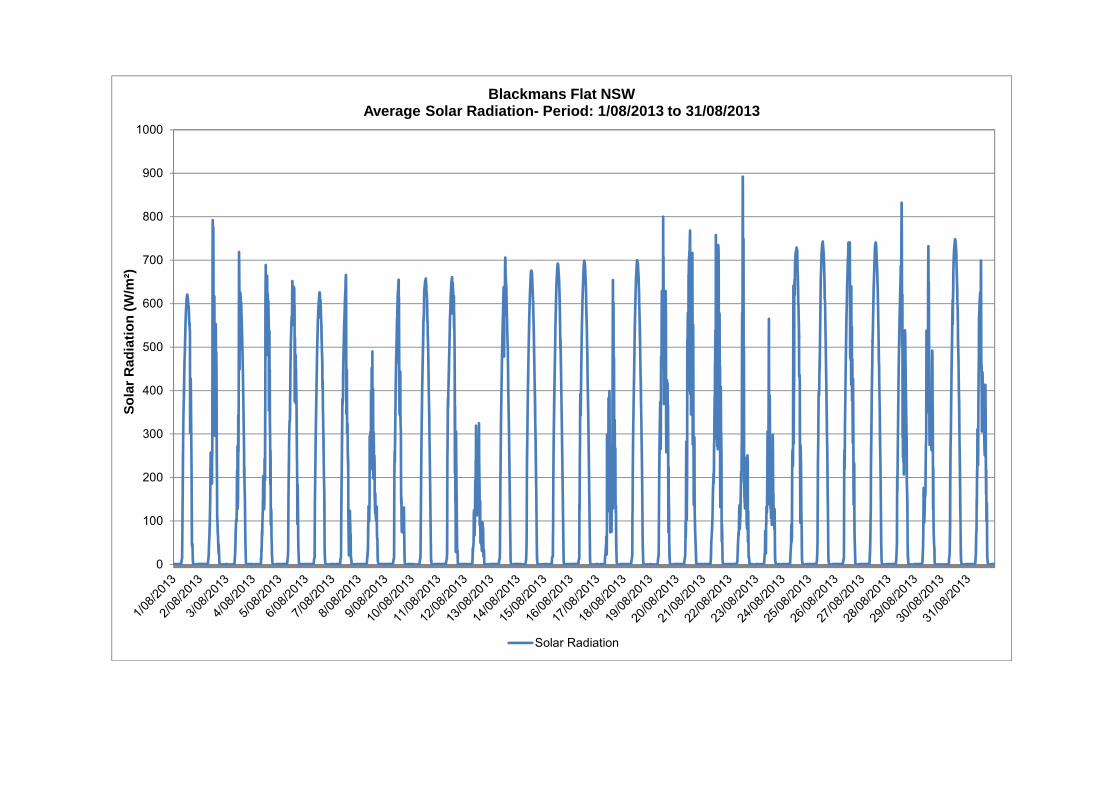
0
100
200
300
400
500
600
700
800
900
1000S
ola
r R
adia
tio
n (
W/m
²)
Blackmans Flat NSWAverage Solar Radiation- Period: 1/08/2013 to 31/08/2013
Solar Radiation
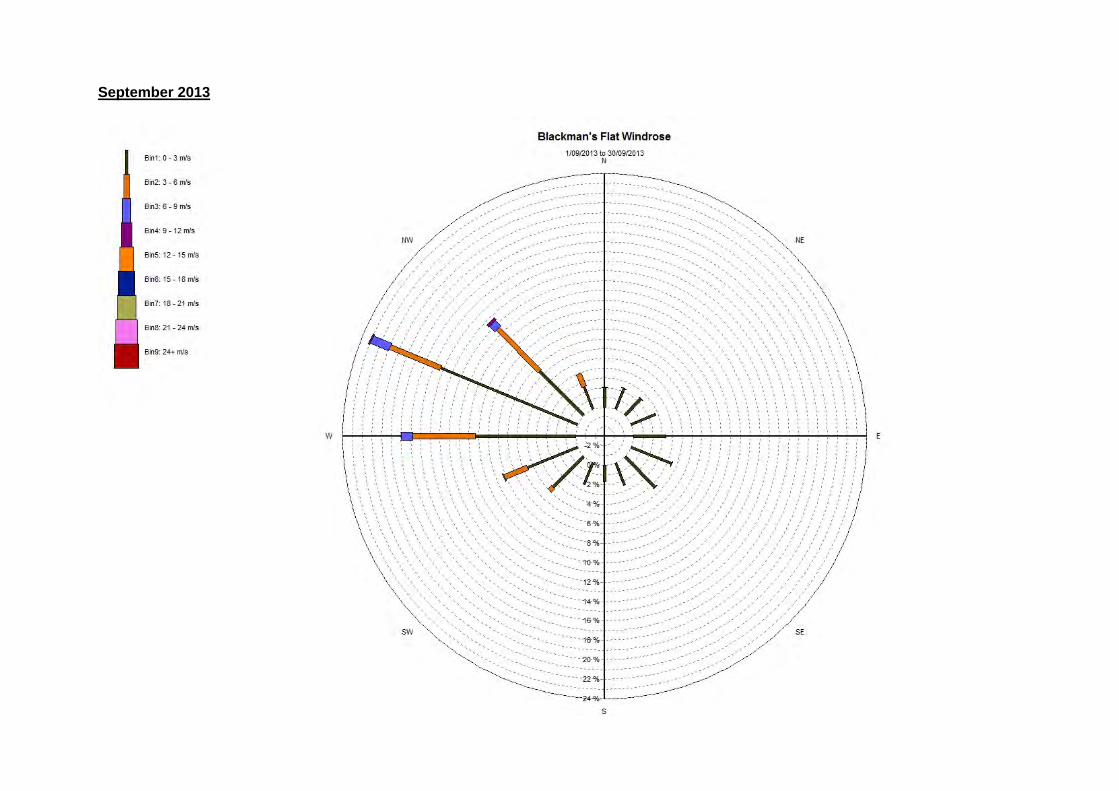
September 2013
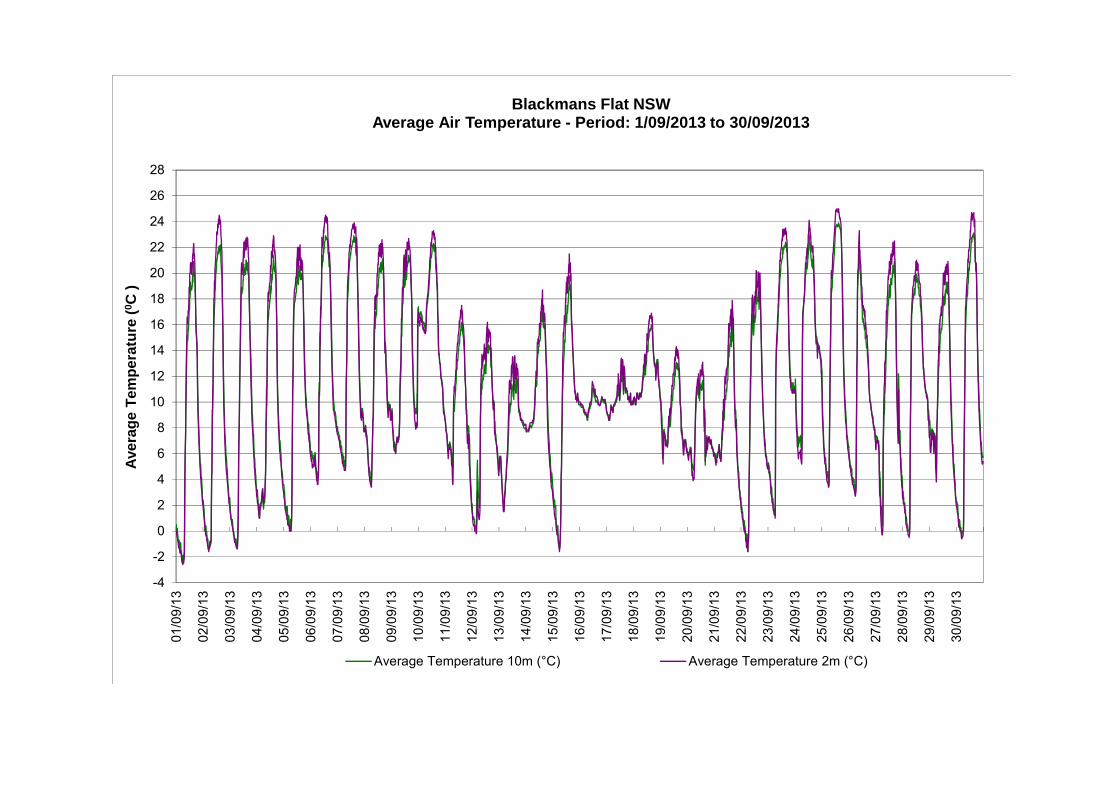
-4
-2
0
2
4
6
8
10
12
14
16
18
20
22
24
26
2801
/09/
13
02/0
9/13
03/0
9/13
04/0
9/13
05/0
9/13
06/0
9/13
07/0
9/13
08/0
9/13
09/0
9/13
10/0
9/13
11/0
9/13
12/0
9/13
13/0
9/13
14/0
9/13
15/0
9/13
16/0
9/13
17/0
9/13
18/0
9/13
19/0
9/13
20/0
9/13
21/0
9/13
22/0
9/13
23/0
9/13
24/0
9/13
25/0
9/13
26/0
9/13
27/0
9/13
28/0
9/13
29/0
9/13
30/0
9/13
Ave
rag
e T
emp
erat
ure
(0 C
)
Blackmans Flat NSWAverage Air Temperature - Period: 1/09/2013 to 30/09/2013
Average Temperature 10m (°C) Average Temperature 2m (°C)
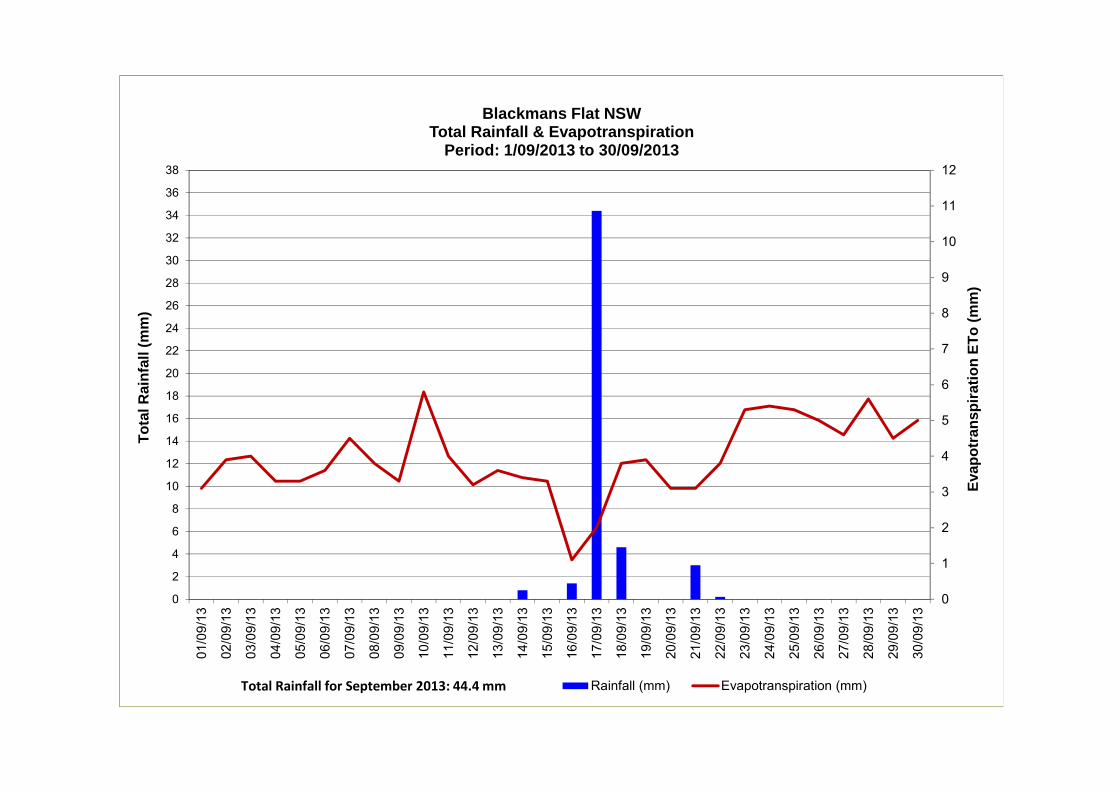
0
1
2
3
4
5
6
7
8
9
10
11
12
0
2
4
6
8
10
12
14
16
18
20
22
24
26
28
30
32
34
36
38
01/0
9/13
02/0
9/13
03/0
9/13
04/0
9/13
05/0
9/13
06/0
9/13
07/0
9/13
08/0
9/13
09/0
9/13
10/0
9/13
11/0
9/13
12/0
9/13
13/0
9/13
14/0
9/13
15/0
9/13
16/0
9/13
17/0
9/13
18/0
9/13
19/0
9/13
20/0
9/13
21/0
9/13
22/0
9/13
23/0
9/13
24/0
9/13
25/0
9/13
26/0
9/13
27/0
9/13
28/0
9/13
29/0
9/13
30/0
9/13
Eva
po
tran
spir
atio
n E
To
(m
m)
To
tal R
ain
fall
(m
m)
Blackmans Flat NSWTotal Rainfall & Evapotranspiration
Period: 1/09/2013 to 30/09/2013
Rainfall (mm) Evapotranspiration (mm)Total Rainfall for September 2013: 44.4 mm
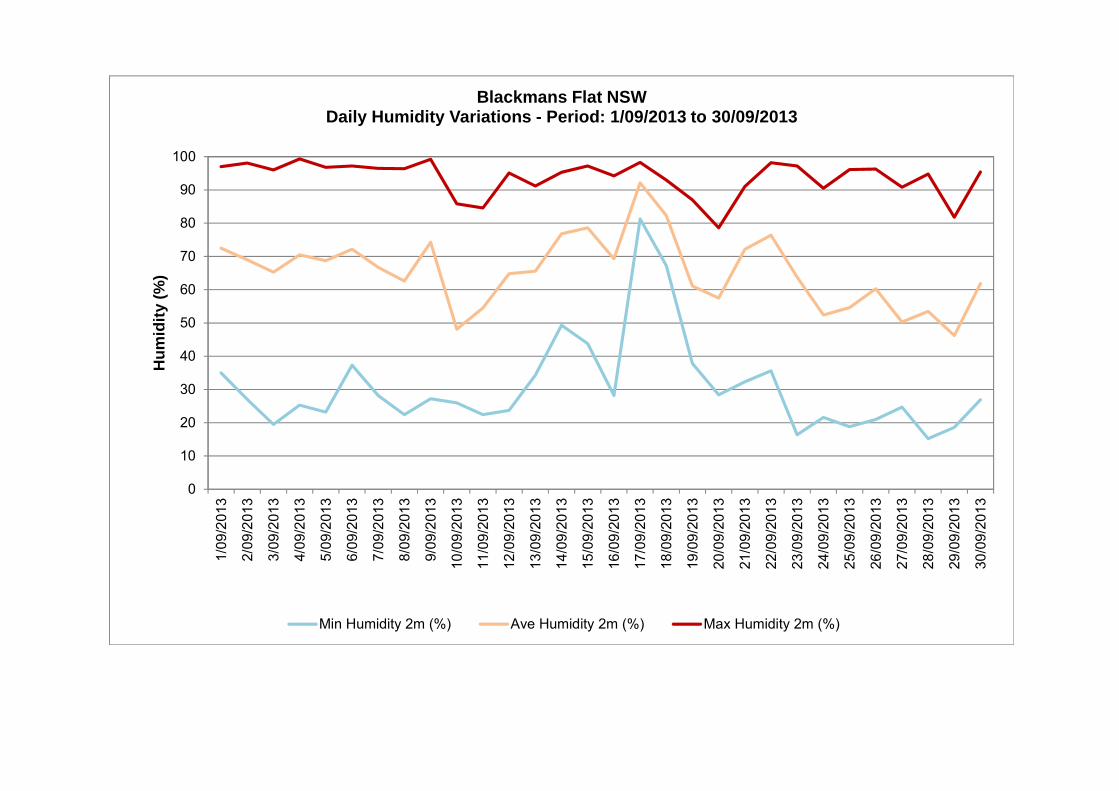
0
10
20
30
40
50
60
70
80
90
100
1/09
/201
3
2/09
/201
3
3/09
/201
3
4/09
/201
3
5/09
/201
3
6/09
/201
3
7/09
/201
3
8/09
/201
3
9/09
/201
3
10/0
9/20
13
11/0
9/20
13
12/0
9/20
13
13/0
9/20
13
14/0
9/20
13
15/0
9/20
13
16/0
9/20
13
17/0
9/20
13
18/0
9/20
13
19/0
9/20
13
20/0
9/20
13
21/0
9/20
13
22/0
9/20
13
23/0
9/20
13
24/0
9/20
13
25/0
9/20
13
26/0
9/20
13
27/0
9/20
13
28/0
9/20
13
29/0
9/20
13
30/0
9/20
13
Hu
mid
ity
(%)
Blackmans Flat NSWDaily Humidity Variations - Period: 1/09/2013 to 30/09/2013
Min Humidity 2m (%) Ave Humidity 2m (%) Max Humidity 2m (%)
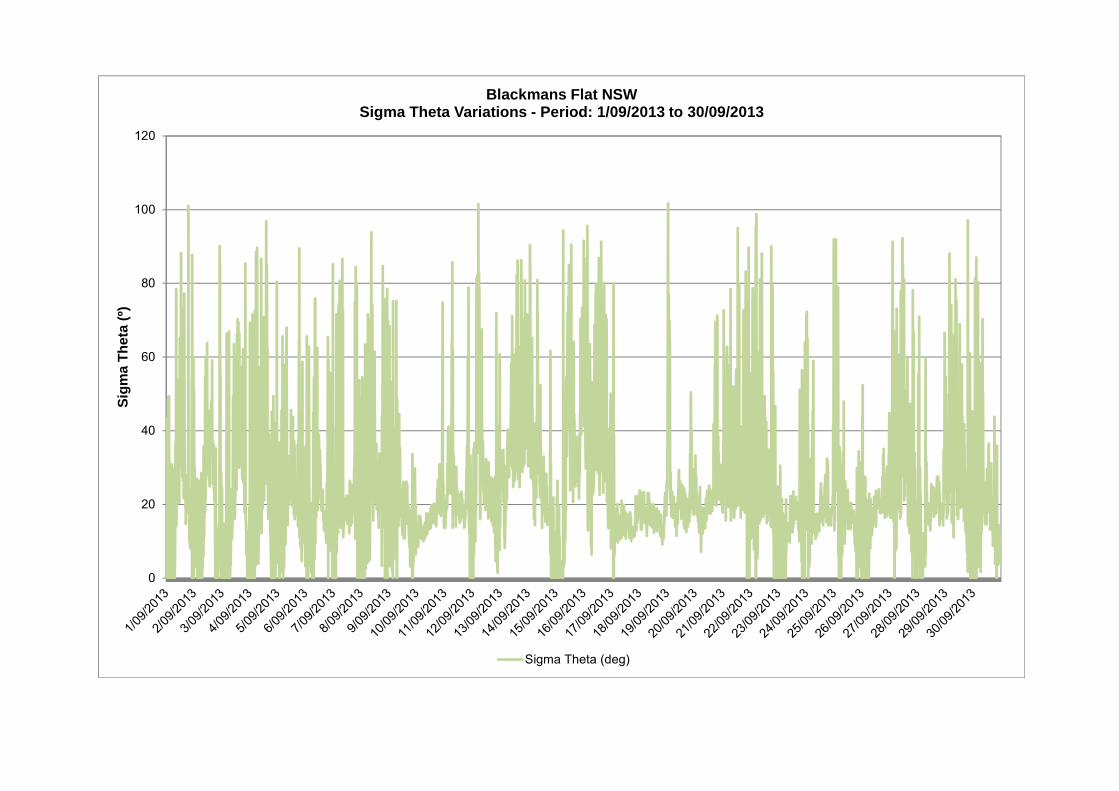
0
20
40
60
80
100
120S
igm
a T
het
a (º
)
Blackmans Flat NSWSigma Theta Variations - Period: 1/09/2013 to 30/09/2013
Sigma Theta (deg)
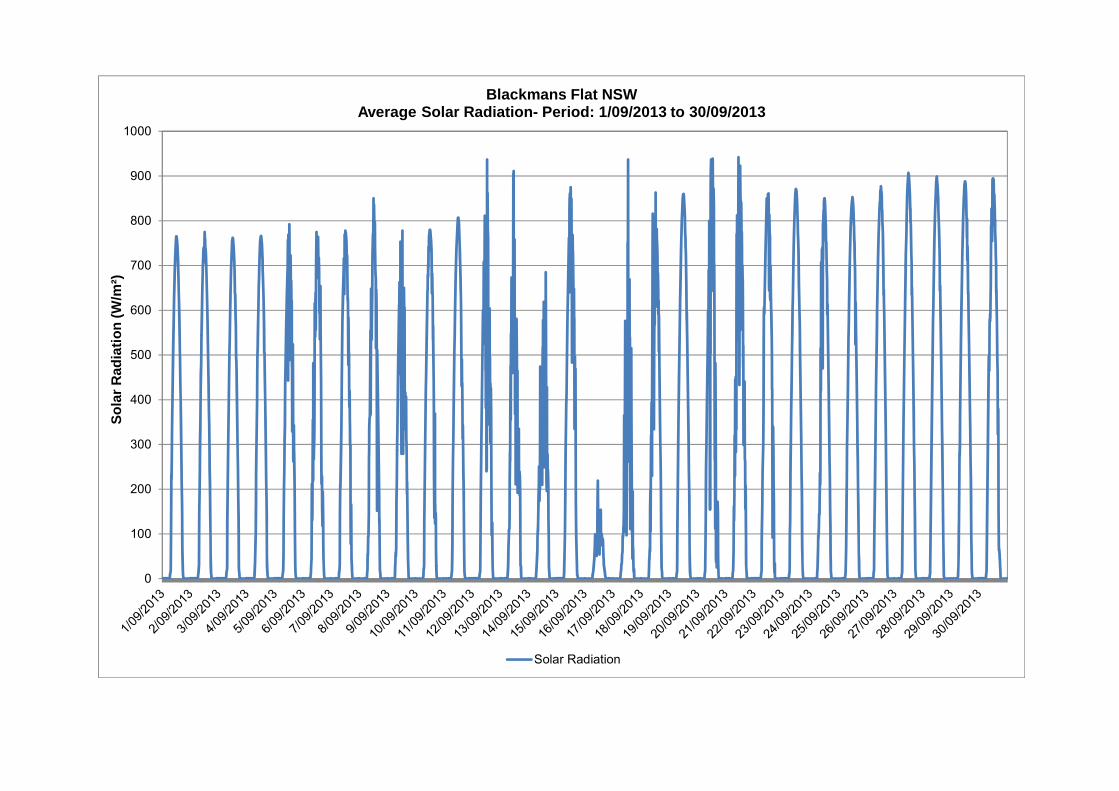
0
100
200
300
400
500
600
700
800
900
1000S
ola
r R
adia
tio
n (
W/m
²)
Blackmans Flat NSWAverage Solar Radiation- Period: 1/09/2013 to 30/09/2013
Solar Radiation
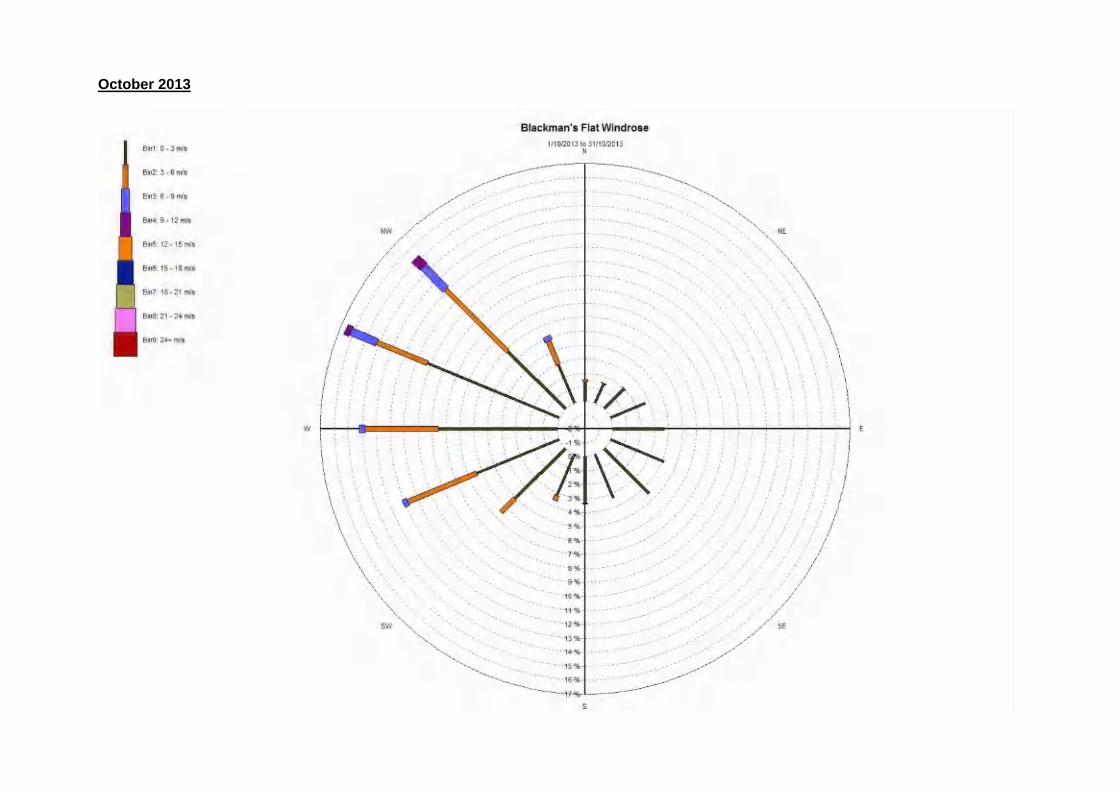
October 2013
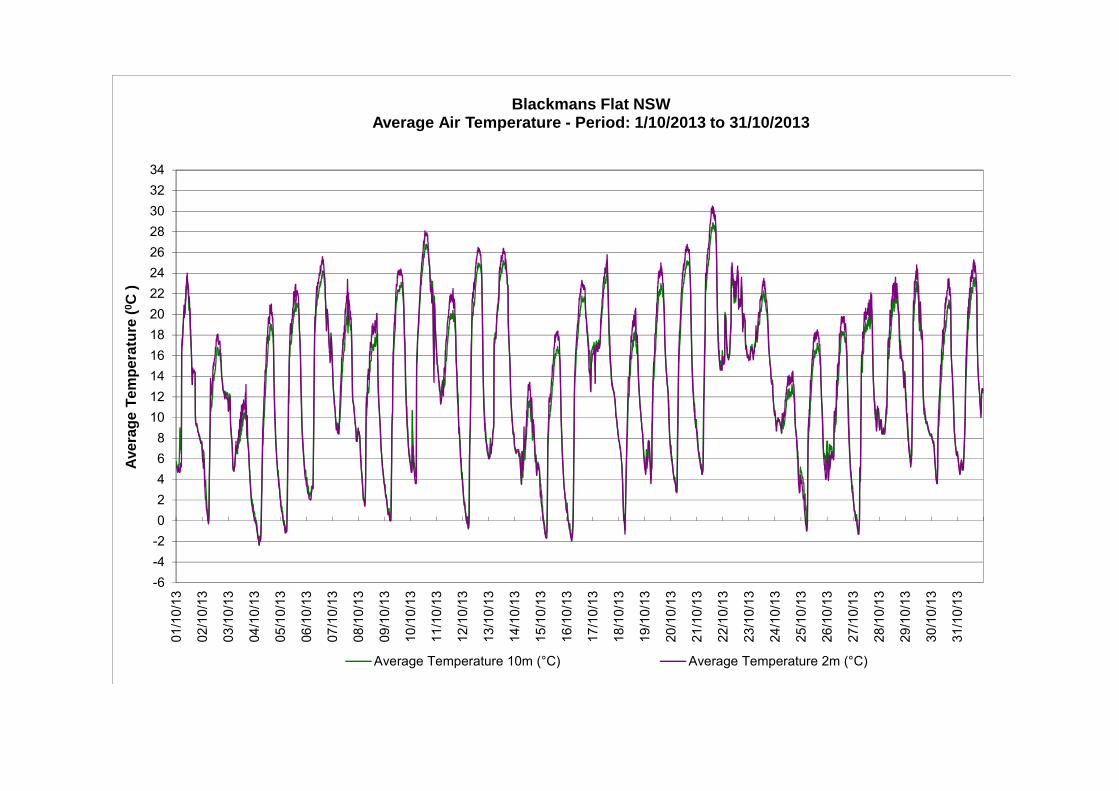
-6-4-202468
1012141618202224262830323401
/10/
13
02/1
0/13
03/1
0/13
04/1
0/13
05/1
0/13
06/1
0/13
07/1
0/13
08/1
0/13
09/1
0/13
10/1
0/13
11/1
0/13
12/1
0/13
13/1
0/13
14/1
0/13
15/1
0/13
16/1
0/13
17/1
0/13
18/1
0/13
19/1
0/13
20/1
0/13
21/1
0/13
22/1
0/13
23/1
0/13
24/1
0/13
25/1
0/13
26/1
0/13
27/1
0/13
28/1
0/13
29/1
0/13
30/1
0/13
31/1
0/13
Ave
rag
e T
emp
erat
ure
(0 C
)
Blackmans Flat NSWAverage Air Temperature - Period: 1/10/2013 to 31/10/2013
Average Temperature 10m (°C) Average Temperature 2m (°C)
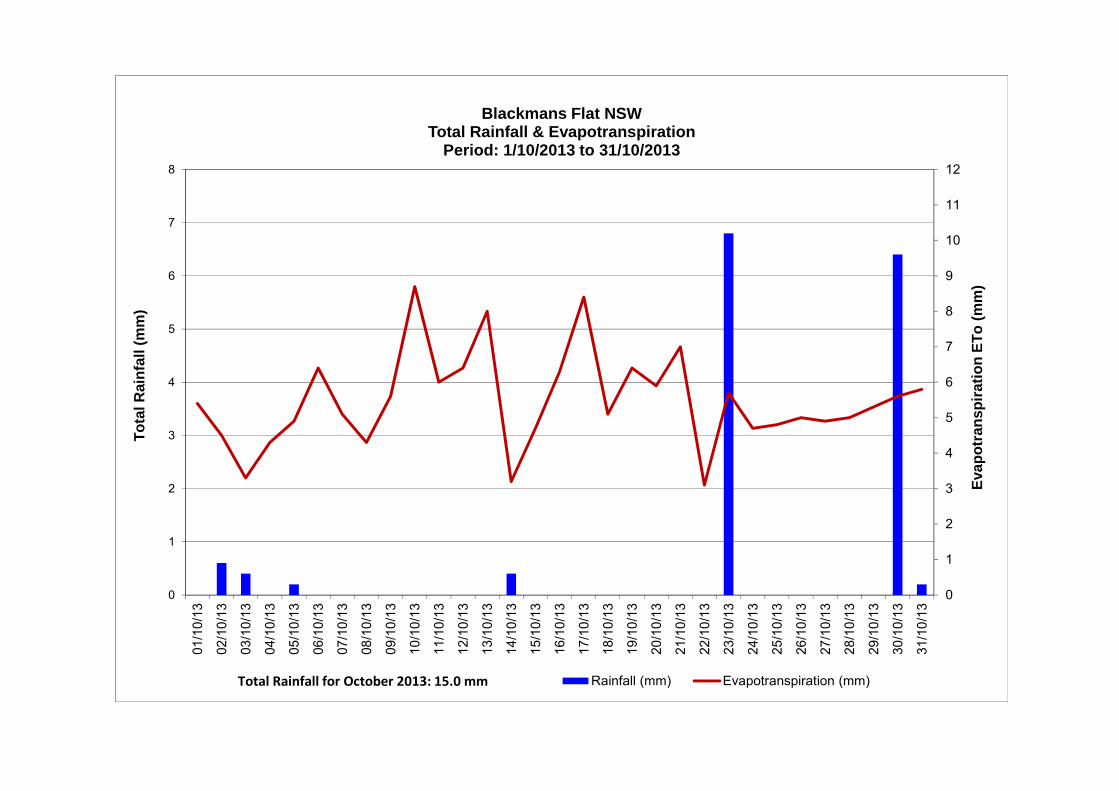
0
1
2
3
4
5
6
7
8
9
10
11
12
0
1
2
3
4
5
6
7
8
01/1
0/13
02/1
0/13
03/1
0/13
04/1
0/13
05/1
0/13
06/1
0/13
07/1
0/13
08/1
0/13
09/1
0/13
10/1
0/13
11/1
0/13
12/1
0/13
13/1
0/13
14/1
0/13
15/1
0/13
16/1
0/13
17/1
0/13
18/1
0/13
19/1
0/13
20/1
0/13
21/1
0/13
22/1
0/13
23/1
0/13
24/1
0/13
25/1
0/13
26/1
0/13
27/1
0/13
28/1
0/13
29/1
0/13
30/1
0/13
31/1
0/13
Eva
po
tran
spir
atio
n E
To
(m
m)
To
tal R
ain
fall
(m
m)
Blackmans Flat NSWTotal Rainfall & Evapotranspiration
Period: 1/10/2013 to 31/10/2013
Rainfall (mm) Evapotranspiration (mm)Total Rainfall for October 2013: 15.0 mm
0
10
20
30
40
50
60
70
80
90
100
1/10
/201
3
2/10
/201
3
3/10
/201
3
4/10
/201
3
5/10
/201
3
6/10
/201
3
7/10
/201
3
8/10
/201
3
9/10
/201
3
10/1
0/20
13
11/1
0/20
13
12/1
0/20
13
13/1
0/20
13
14/1
0/20
13
15/1
0/20
13
16/1
0/20
13
17/1
0/20
13
18/1
0/20
13
19/1
0/20
13
20/1
0/20
13
21/1
0/20
13
22/1
0/20
13
23/1
0/20
13
24/1
0/20
13
25/1
0/20
13
26/1
0/20
13
27/1
0/20
13
28/1
0/20
13
29/1
0/20
13
30/1
0/20
13
31/1
0/20
13
Hu
mid
ity
(%)
Blackmans Flat NSWDaily Humidity Variations - Period: 1/10/2013 to 31/10/2013
Min Humidity 2m (%) Ave Humidity 2m (%) Max Humidity 2m (%)
0
20
40
60
80
100
120S
igm
a T
het
a (º
)
Blackmans Flat NSWSigma Theta Variations - Period: 1/10/2013 to 31/10/2013
Sigma Theta (deg)
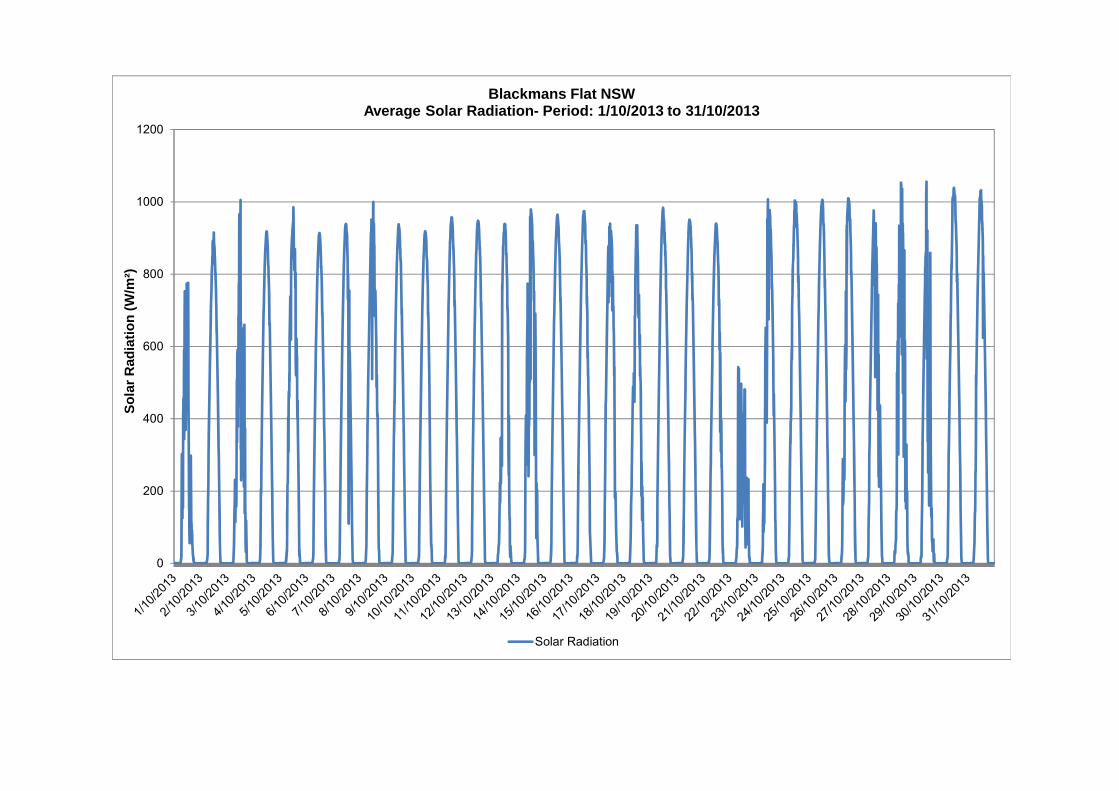
0
200
400
600
800
1000
1200S
ola
r R
adia
tio
n (
W/m
²)
Blackmans Flat NSWAverage Solar Radiation- Period: 1/10/2013 to 31/10/2013
Solar Radiation
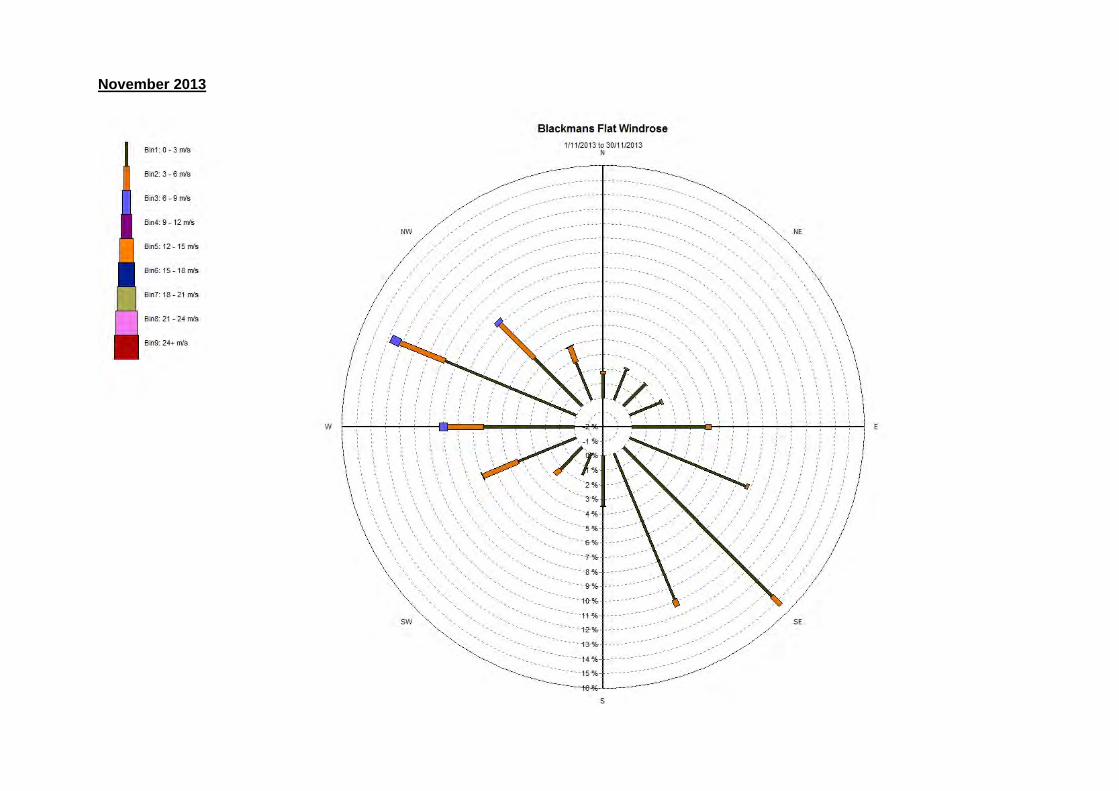
November 2013
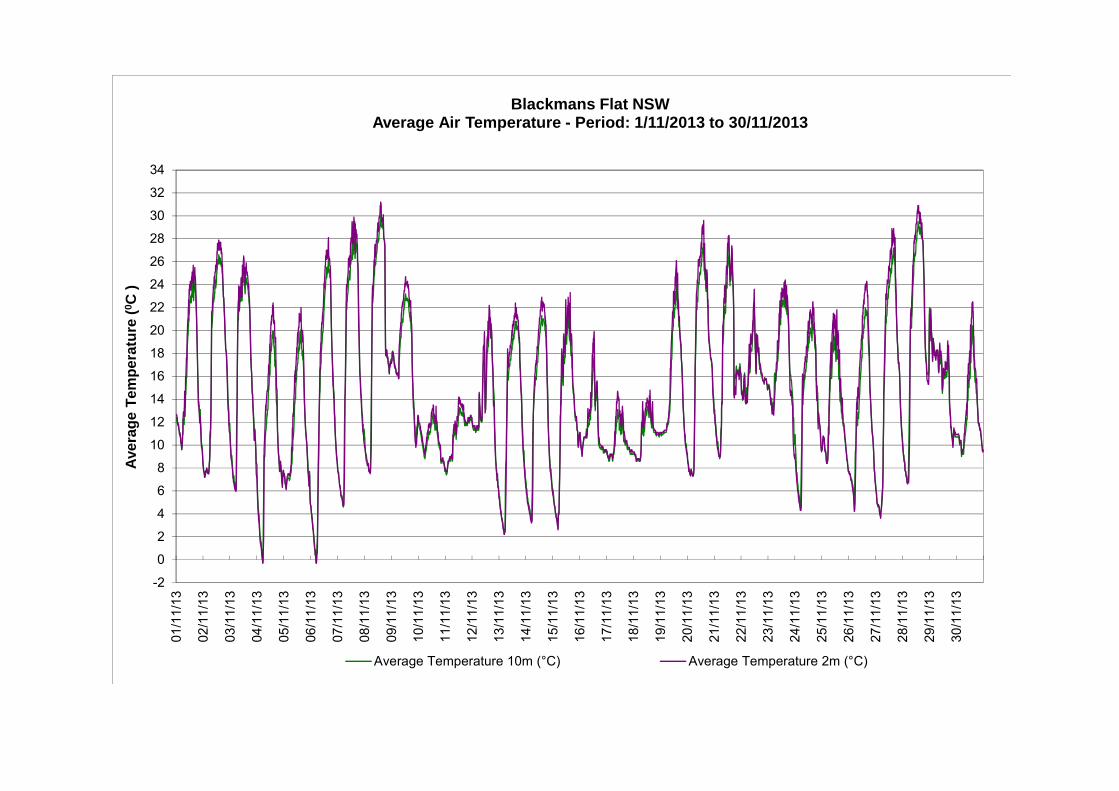
-2
0
2
4
6
8
10
12
14
16
18
20
22
24
26
28
30
32
3401
/11/
13
02/1
1/13
03/1
1/13
04/1
1/13
05/1
1/13
06/1
1/13
07/1
1/13
08/1
1/13
09/1
1/13
10/1
1/13
11/1
1/13
12/1
1/13
13/1
1/13
14/1
1/13
15/1
1/13
16/1
1/13
17/1
1/13
18/1
1/13
19/1
1/13
20/1
1/13
21/1
1/13
22/1
1/13
23/1
1/13
24/1
1/13
25/1
1/13
26/1
1/13
27/1
1/13
28/1
1/13
29/1
1/13
30/1
1/13
Ave
rag
e T
emp
erat
ure
(0 C
)
Blackmans Flat NSWAverage Air Temperature - Period: 1/11/2013 to 30/11/2013
Average Temperature 10m (°C) Average Temperature 2m (°C)
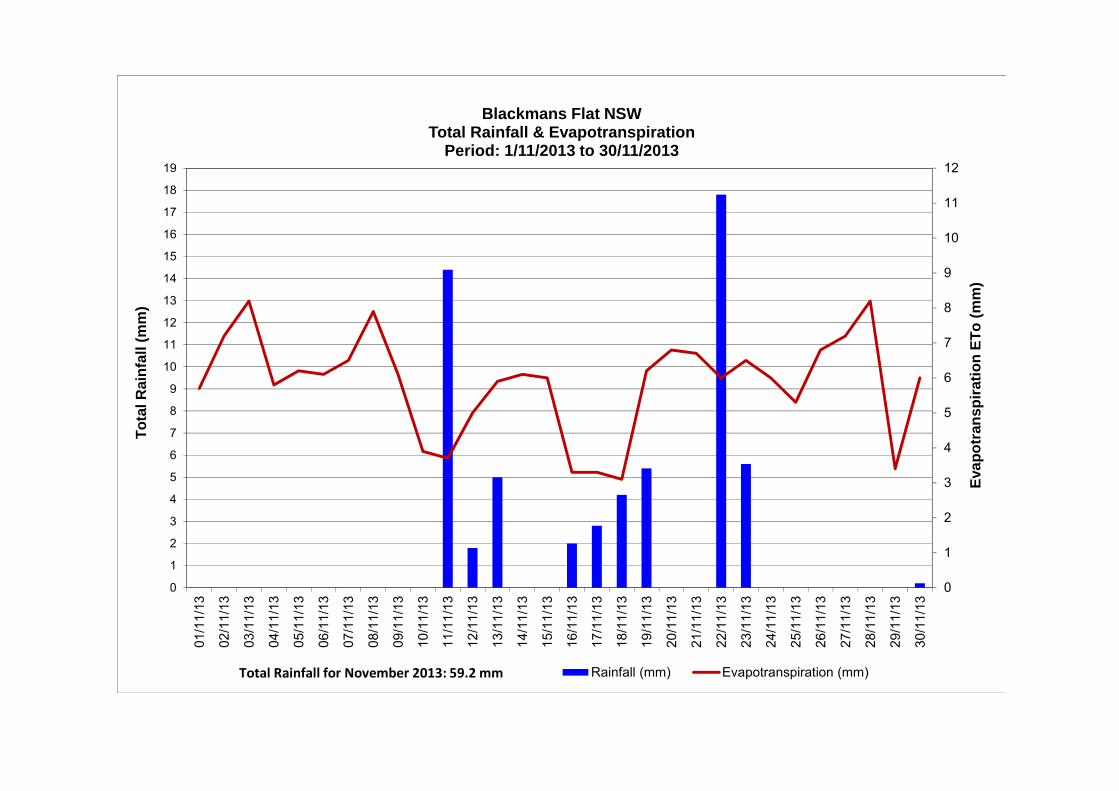
0
1
2
3
4
5
6
7
8
9
10
11
12
0
1
2
3
4
5
6
7
8
9
10
11
12
13
14
15
16
17
18
19
01/1
1/13
02/1
1/13
03/1
1/13
04/1
1/13
05/1
1/13
06/1
1/13
07/1
1/13
08/1
1/13
09/1
1/13
10/1
1/13
11/1
1/13
12/1
1/13
13/1
1/13
14/1
1/13
15/1
1/13
16/1
1/13
17/1
1/13
18/1
1/13
19/1
1/13
20/1
1/13
21/1
1/13
22/1
1/13
23/1
1/13
24/1
1/13
25/1
1/13
26/1
1/13
27/1
1/13
28/1
1/13
29/1
1/13
30/1
1/13
Eva
po
tran
spir
atio
n E
To
(m
m)
To
tal R
ain
fall
(m
m)
Blackmans Flat NSWTotal Rainfall & Evapotranspiration
Period: 1/11/2013 to 30/11/2013
Rainfall (mm) Evapotranspiration (mm)Total Rainfall for November 2013: 59.2 mm
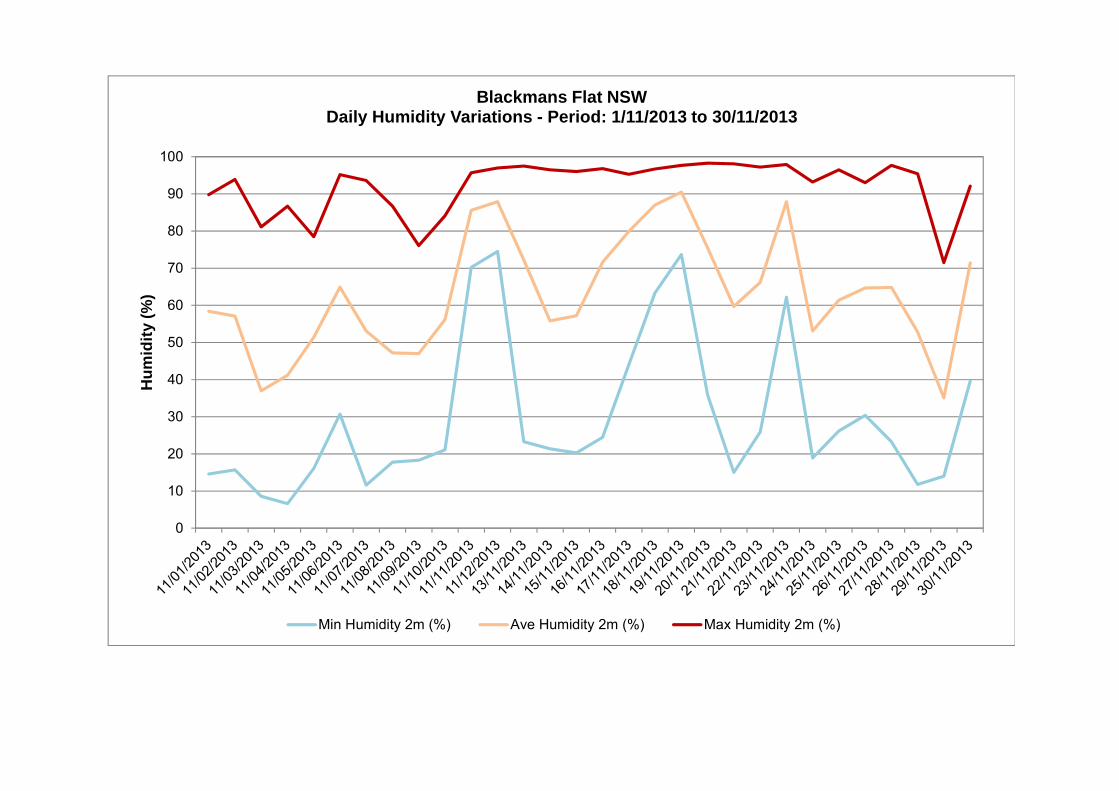
0
10
20
30
40
50
60
70
80
90
100H
um
idit
y (%
)
Blackmans Flat NSWDaily Humidity Variations - Period: 1/11/2013 to 30/11/2013
Min Humidity 2m (%) Ave Humidity 2m (%) Max Humidity 2m (%)
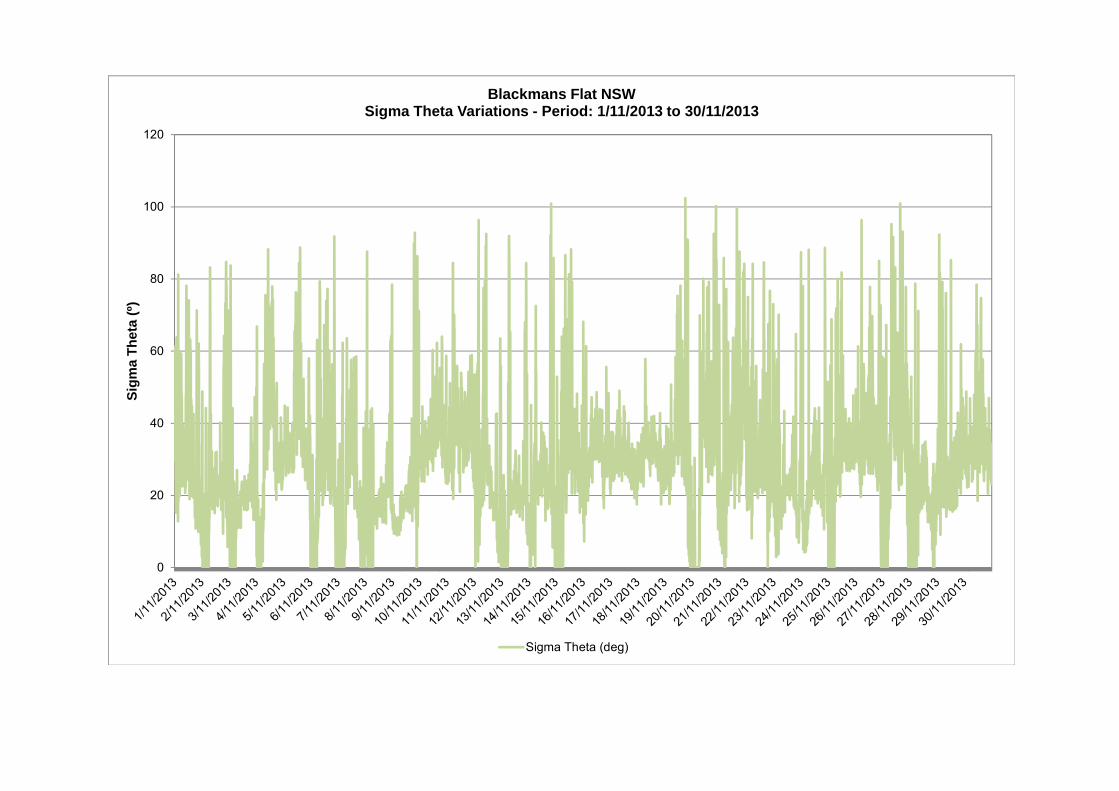
0
20
40
60
80
100
120S
igm
a T
het
a (º
)
Blackmans Flat NSWSigma Theta Variations - Period: 1/11/2013 to 30/11/2013
Sigma Theta (deg)
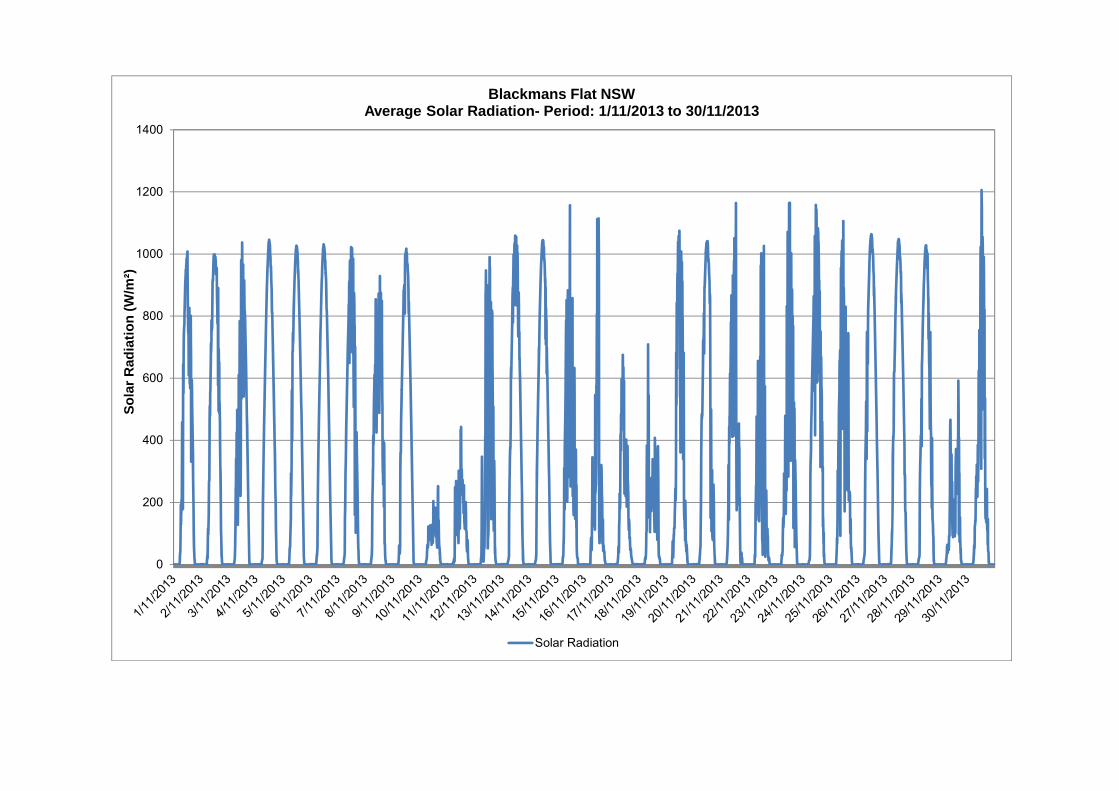
0
200
400
600
800
1000
1200
1400S
ola
r R
adia
tio
n (
W/m
²)
Blackmans Flat NSWAverage Solar Radiation- Period: 1/11/2013 to 30/11/2013
Solar Radiation
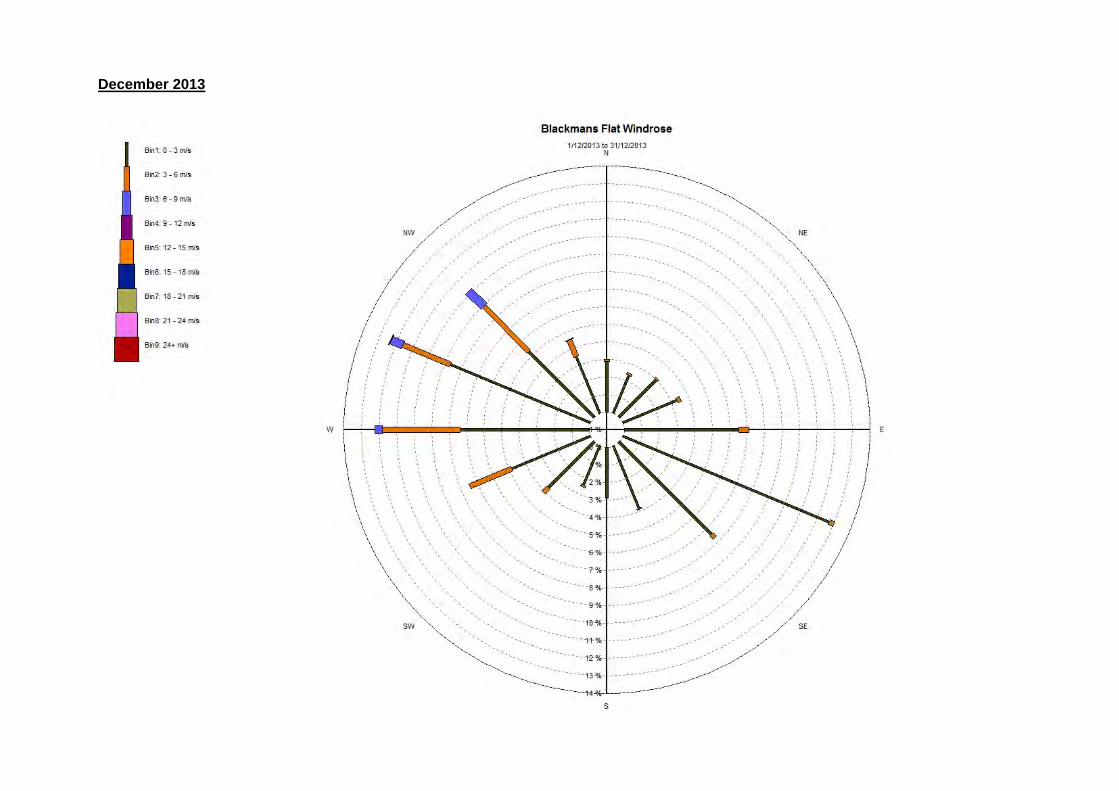
December 2013
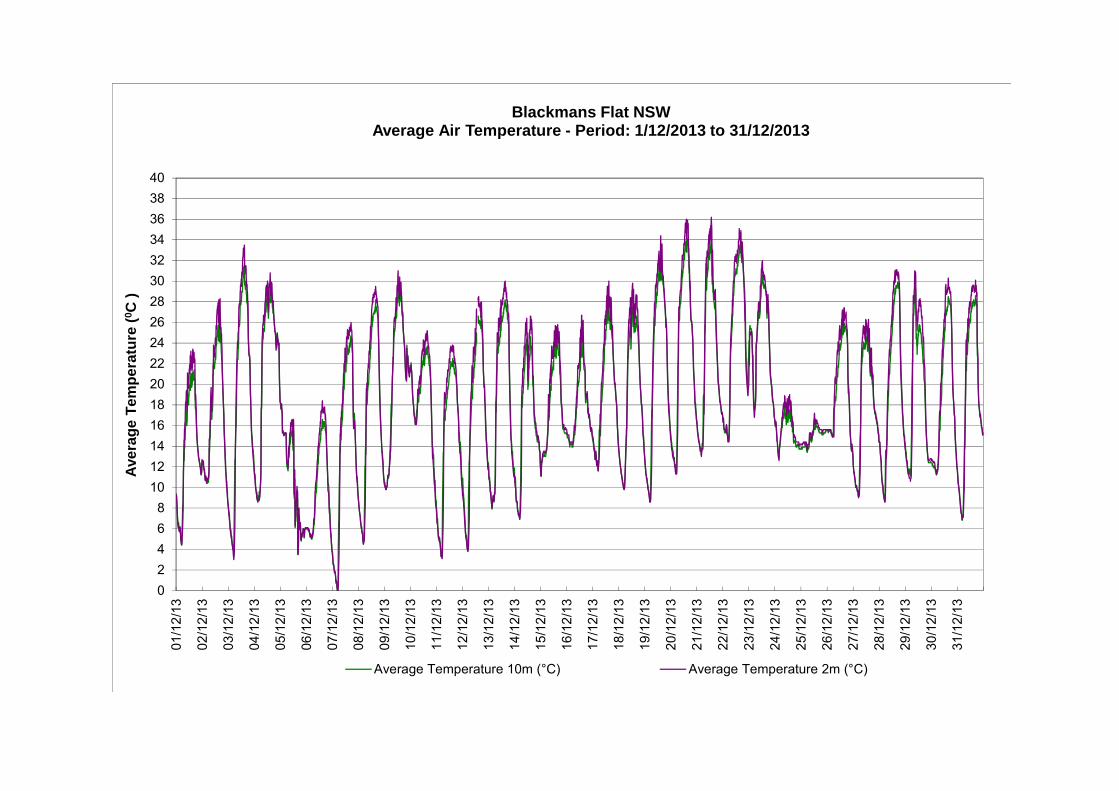
02468
10121416182022242628303234363840
01/1
2/13
02/1
2/13
03/1
2/13
04/1
2/13
05/1
2/13
06/1
2/13
07/1
2/13
08/1
2/13
09/1
2/13
10/1
2/13
11/1
2/13
12/1
2/13
13/1
2/13
14/1
2/13
15/1
2/13
16/1
2/13
17/1
2/13
18/1
2/13
19/1
2/13
20/1
2/13
21/1
2/13
22/1
2/13
23/1
2/13
24/1
2/13
25/1
2/13
26/1
2/13
27/1
2/13
28/1
2/13
29/1
2/13
30/1
2/13
31/1
2/13
Ave
rag
e T
emp
erat
ure
(0 C
)Blackmans Flat NSW
Average Air Temperature - Period: 1/12/2013 to 31/12/2013
Average Temperature 10m (°C) Average Temperature 2m (°C)
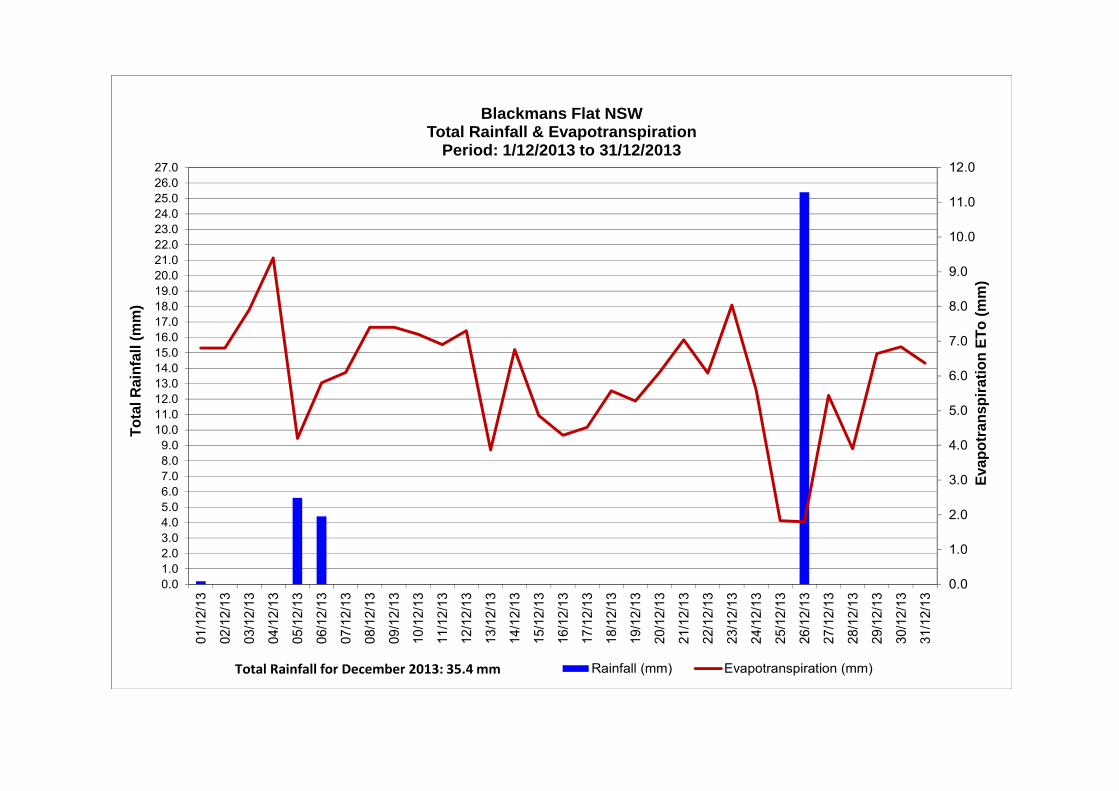
0.0
1.0
2.0
3.0
4.0
5.0
6.0
7.0
8.0
9.0
10.0
11.0
12.0
0.01.02.03.04.05.06.07.08.09.0
10.011.012.013.014.015.016.017.018.019.020.021.022.023.024.025.026.027.0
01/1
2/13
02/1
2/13
03/1
2/13
04/1
2/13
05/1
2/13
06/1
2/13
07/1
2/13
08/1
2/13
09/1
2/13
10/1
2/13
11/1
2/13
12/1
2/13
13/1
2/13
14/1
2/13
15/1
2/13
16/1
2/13
17/1
2/13
18/1
2/13
19/1
2/13
20/1
2/13
21/1
2/13
22/1
2/13
23/1
2/13
24/1
2/13
25/1
2/13
26/1
2/13
27/1
2/13
28/1
2/13
29/1
2/13
30/1
2/13
31/1
2/13
Eva
po
tran
spir
atio
n E
To
(m
m)
To
tal R
ain
fall
(mm
)
Blackmans Flat NSWTotal Rainfall & Evapotranspiration
Period: 1/12/2013 to 31/12/2013
Rainfall (mm) Evapotranspiration (mm)Total Rainfall for December 2013: 35.4 mm
0
10
20
30
40
50
60
70
80
90
100
1/12
/201
3
2/12
/201
3
3/12
/201
3
4/12
/201
3
5/12
/201
3
6/12
/201
3
7/12
/201
3
8/12
/201
3
9/12
/201
3
10/1
2/20
13
11/1
2/20
13
12/1
2/20
13
13/1
2/20
13
14/1
2/20
13
15/1
2/20
13
16/1
2/20
13
17/1
2/20
13
18/1
2/20
13
19/1
2/20
13
20/1
2/20
13
21/1
2/20
13
22/1
2/20
13
23/1
2/20
13
24/1
2/20
13
25/1
2/20
13
26/1
2/20
13
27/1
2/20
13
28/1
2/20
13
29/1
2/20
13
30/1
2/20
13
31/1
2/20
13
Hu
mid
ity
(%)
Blackmans Flat NSWDaily Humidity Variations - Period: 1/12/2013 to 31/12/2013
Min Humidity 2m (%) Ave Humidity 2m (%) Max Humidity 2m (%)
0
20
40
60
80
100
120S
igm
a T
het
a (º
)
Blackmans Flat NSWSigma Theta Variations - Period: 1/12/2013 to 31/12/2013
Sigma Theta (deg)
0
200
400
600
800
1000
1200
1400S
ola
r R
adia
tio
n (
W/m
²)
Blackmans Flat NSWAverage Solar Radiation- Period: 1/12/2013 to 31/12/2013
Solar Radiation

Appendix 4
Rehabilitation and Decommissioning Costs
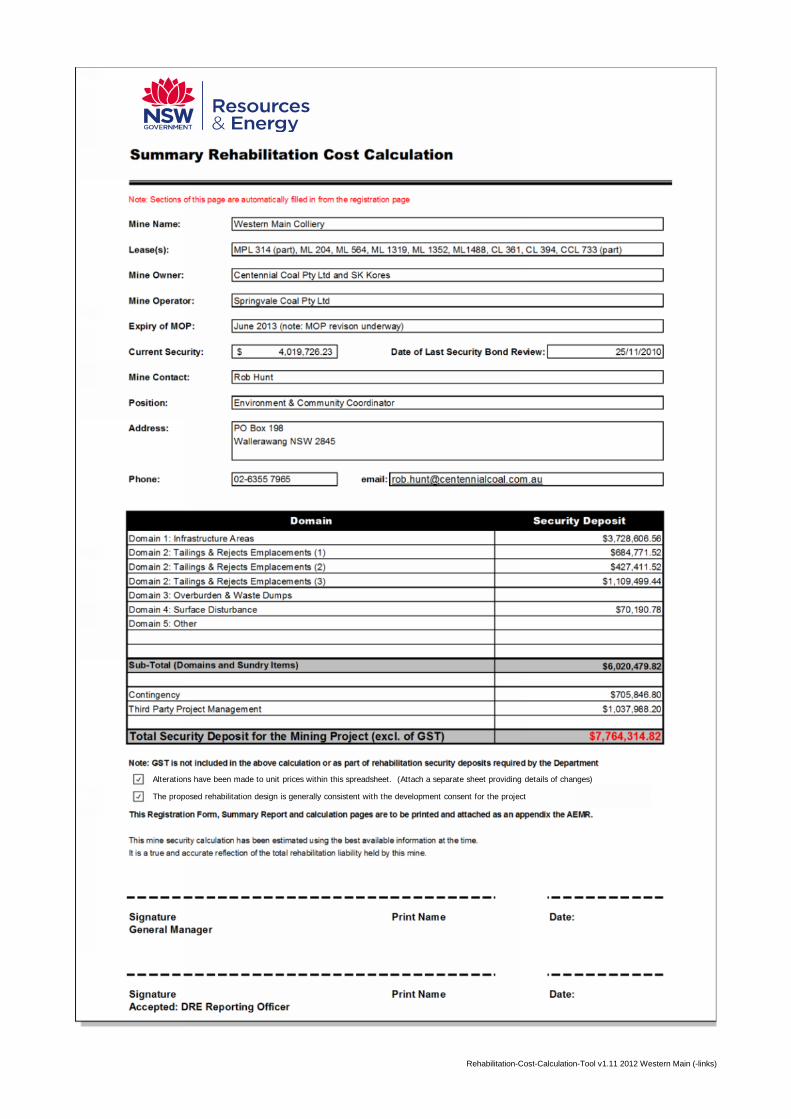
Summary Rehabilitation Cost Calculation
Note: Sections of this page are automatically filled in from the registration page
Mine Name:
Lease(s):
Mine Owner:
Mine Operator:
Expiry of MOP:
Current Security:
Mine Contact:
Position:
Address:
Phone: email:
Third Party Project Management
Note: GST is not included in the above calculation or as part of rehabilitation security deposits required by the Department
This Registration Form, Summary Report and calculation pages are to be printed and attached as an appendix the AEMR.
This mine security calculation has been estimated using the best available information at the time.
It is a true and accurate reflection of the total rehabilitation liability held by this mine.
Signature Print Name Date:General Manager
Signature Print Name Date:Accepted: DRE Reporting Officer
02-6355 7965 [email protected]
Domain
Rob Hunt
Environment & Community Coordinator
PO Box 198Wallerawang NSW 2845
June 2013 (note: MOP revison underway)
4,019,726.23$ Date of Last Security Bond Review: 25/11/2010
Western Main Colliery
MPL 314 (part), ML 204, ML 564, ML 1319, ML 1352, ML1488, CL 361, CL 394, CCL 733 (part)
Centennial Coal Pty Ltd and SK Kores
Springvale Coal Pty Ltd
Domain 1: Infrastructure Areas
Security Deposit$3,728,606.56
Domain 4: Surface Disturbance
Domain 2: Tailings & Rejects Emplacements (1)
Domain 2: Tailings & Rejects Emplacements (2)
Domain 2: Tailings & Rejects Emplacements (3)
Domain 3: Overburden & Waste Dumps
$70,190.78
$684,771.52
Sub-Total (Domains and Sundry Items)
Contingency
$427,411.52
$1,109,499.44
$6,020,479.82
Domain 5: Other
$7,764,314.82
$705,846.80
$1,037,988.20
Total Security Deposit for the Mining Project (excl. of GST)
Alterations have been made to unit prices within this spreadsheet. (Attach a separate sheet providing details of changes)
The proposed rehabilitation design is generally consistent with the development consent for the project
Rehabilitation-Cost-Calculation-Tool v1.11 2012 Western Main (-links)
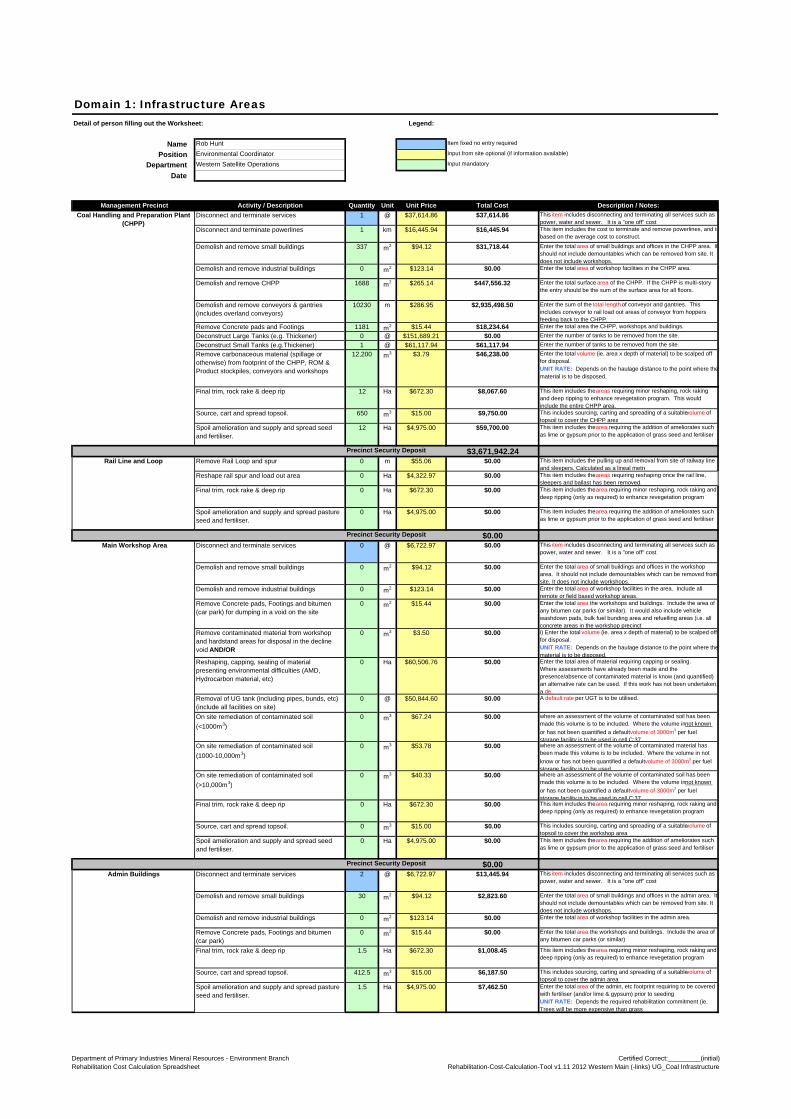
Domain 1: Infrastructure AreasDetail of person filling out the Worksheet: Legend:
Name Rob Hunt Item fixed no entry required
Position Environmental Coordinator Input from site optional (if information available)
Department Western Satellite Operations Input mandatory
Date
Management Precinct Activity / Description Quantity Unit Unit Price Total Cost Description / Notes:
Disconnect and terminate services 1 @ $37,614.86 $37,614.86 This item includes disconnecting and terminating all services such as power, water and sewer. It is a "one off" cost
Disconnect and terminate powerlines 1 km $16,445.94 $16,445.94 This item includes the cost to terminate and remove powerlines, and isbased on the average cost to construct.
Demolish and remove small buildings 337 m2 $94.12 $31,718.44 Enter the total area of small buildings and offices in the CHPP area. It should not include demountables which can be removed from site. It does not include workshops.
Demolish and remove industrial buildings 0 m2 $123.14 $0.00 Enter the total area of workshop facilities in the CHPP area.
Demolish and remove CHPP 1688 m2 $265.14 $447,556.32 Enter the total surface area of the CHPP. If the CHPP is multi-story the entry should be the sum of the surface area for all floors.
Demolish and remove conveyors & gantries (includes overland conveyors)
10230 m $286.95 $2,935,498.50 Enter the sum of the total length of conveyor and gantries. This includes conveyor to rail load out areas of conveyor from hoppers feeding back to the CHPP.
Remove Concrete pads and Footings 1181 m2 $15.44 $18,234.64 Enter the total area the CHPP, workshops and buildings.
Deconstruct Large Tanks (e.g. Thickener) 0 @ $151,689.21 $0.00 Enter the number of tanks to be removed from the site.
Deconstruct Small Tanks (e.g.Thickener) 1 @ $61,117.94 $61,117.94 Enter the number of tanks to be removed from the site.
Remove carbonaceous material (spillage or otherwise) from footprint of the CHPP, ROM & Product stockpiles, conveyors and workshops
12,200 m3 $3.79 $46,238.00 Enter the total volume (ie. area x depth of material) to be scalped off for disposal.UNIT RATE: Depends on the haulage distance to the point where the material is to be disposed.
Final trim, rock rake & deep rip 12 Ha $672.30 $8,067.60 This item includes the areas requiring minor reshaping, rock raking and deep ripping to enhance revegetation program. This would include the entire CHPP area.
Source, cart and spread topsoil. 650 m3 $15.00 $9,750.00 This includes sourcing, carting and spreading of a suitable volume of topsoil to cover the CHPP area
Spoil amelioration and supply and spread seed and fertiliser.
12 Ha $4,975.00 $59,700.00 This item includes the area requiring the addition of ameliorates such as lime or gypsum prior to the application of grass seed and fertiliser
Precinct Security Deposit $3,671,942.24Rail Line and Loop Remove Rail Loop and spur 0 m $55.06 $0.00 This item includes the pulling up and removal from site of railway line
and sleepers. Calculated as a lineal metreReshape rail spur and load out area 0 Ha $4,322.97 $0.00 This item includes the areas requiring reshaping once the rail line,
sleepers and ballast has been removed.Final trim, rock rake & deep rip 0 Ha $672.30 $0.00 This item includes the area requiring minor reshaping, rock raking and
deep ripping (only as required) to enhance revegetation program
Spoil amelioration and supply and spread pasture seed and fertiliser.
0 Ha $4,975.00 $0.00 This item includes the area requiring the addition of ameliorates such as lime or gypsum prior to the application of grass seed and fertiliser
Precinct Security Deposit $0.00Disconnect and terminate services 0 @ $6,722.97 $0.00 This item includes disconnecting and terminating all services such as
power, water and sewer. It is a "one off" cost
Demolish and remove small buildings 0 m2 $94.12 $0.00 Enter the total area of small buildings and offices in the workshop area. It should not include demountables which can be removed from site. It does not include workshops.
Demolish and remove industrial buildings 0 m2 $123.14 $0.00 Enter the total area of workshop facilities in the area. Include all remote or field based workshop areas.
Remove Concrete pads, Footings and bitumen (car park) for dumping in a void on the site
0 m2 $15.44 $0.00 Enter the total area the workshops and buildings. Include the area of any bitumen car parks (or similar). It would also include vehicle washdown pads, bulk fuel bunding area and refuelling areas (i.e. all concrete areas in the workshop precinct)
Remove contaminated material from workshop and hardstand areas for disposal in the decline void AND/OR
0 m3 $3.50 $0.00 i) Enter the total volume (ie. area x depth of material) to be scalped off for disposal.UNIT RATE: Depends on the haulage distance to the point where the material is to be disposed.
Reshaping, capping, sealing of material presenting environmental difficulties (AMD, Hydrocarbon material, etc)
0 Ha $60,506.76 $0.00 Enter the total area of material requiring capping or sealing.Where assessments have already been made and the presence/absence of contaminated material is know (and quantified) an alternative rate can be used. If this work has not been undertaken, a de
Removal of UG tank (including pipes, bunds, etc) (include all facilities on site)
0 @ $50,844.60 $0.00 A default rate per UGT is to be utilised.
On site remediation of contaminated soil
(<1000m3)
0 m3 $67.24 $0.00 where an assessment of the volume of contaminated soil has been made this volume is to be included. Where the volume in not known
or has not been quantified a default volume of 3000m3 per fuel storage facility is to be used in cell C:37
On site remediation of contaminated soil
(1000-10,000m3)
0 m3 $53.78 $0.00 where an assessment of the volume of contaminated material has been made this volume is to be included. Where the volume in not
know or has not been quantified a default volume of 3000m3 per fuel storage facility is to be used.
On site remediation of contaminated soil
(>10,000m3)
0 m3 $40.33 $0.00 where an assessment of the volume of contaminated soil has been made this volume is to be included. Where the volume in not known
or has not been quantified a default volume of 3000m3 per fuel storage facility is to be used in cell C:37
Final trim, rock rake & deep rip 0 Ha $672.30 $0.00 This item includes the area requiring minor reshaping, rock raking and deep ripping (only as required) to enhance revegetation program
Source, cart and spread topsoil. 0 m3 $15.00 $0.00 This includes sourcing, carting and spreading of a suitable volume of topsoil to cover the workshop area.
Spoil amelioration and supply and spread seed and fertiliser.
0 Ha $4,975.00 $0.00 This item includes the area requiring the addition of ameliorates such as lime or gypsum prior to the application of grass seed and fertiliser
Precinct Security Deposit $0.00Disconnect and terminate services 2 @ $6,722.97 $13,445.94 This item includes disconnecting and terminating all services such as
power, water and sewer. It is a "one off" cost
Demolish and remove small buildings 30 m2 $94.12 $2,823.60 Enter the total area of small buildings and offices in the admin area. It should not include demountables which can be removed from site. It does not include workshops.
Demolish and remove industrial buildings 0 m2 $123.14 $0.00 Enter the total area of workshop facilities in the admin area.
Remove Concrete pads, Footings and bitumen (car park)
0 m2 $15.44 $0.00 Enter the total area the workshops and buildings. Include the area of any bitumen car parks (or similar)
Final trim, rock rake & deep rip 1.5 Ha $672.30 $1,008.45 This item includes the area requiring minor reshaping, rock raking and deep ripping (only as required) to enhance revegetation program
Source, cart and spread topsoil. 412.5 m3 $15.00 $6,187.50 This includes sourcing, carting and spreading of a suitable volume of topsoil to cover the admin area.
Spoil amelioration and supply and spread pasture seed and fertiliser.
1.5 Ha $4,975.00 $7,462.50 Enter the total area of the admin, etc footprint requiring to be covered with fertiliser (and/or lime & gypsum) prior to seedingUNIT RATE: Depends the required rehabilitation commitment (ie. Trees will be more expensive than grass
Coal Handling and Preparation Plant (CHPP)
Main Workshop Area
Admin Buildings
Department of Primary Industries Mineral Resources - Environment BranchRehabilitation Cost Calculation Spreadsheet
Certified Correct:_________(initial)Rehabilitation-Cost-Calculation-Tool v1.11 2012 Western Main (-links) UG_Coal Infrastructure
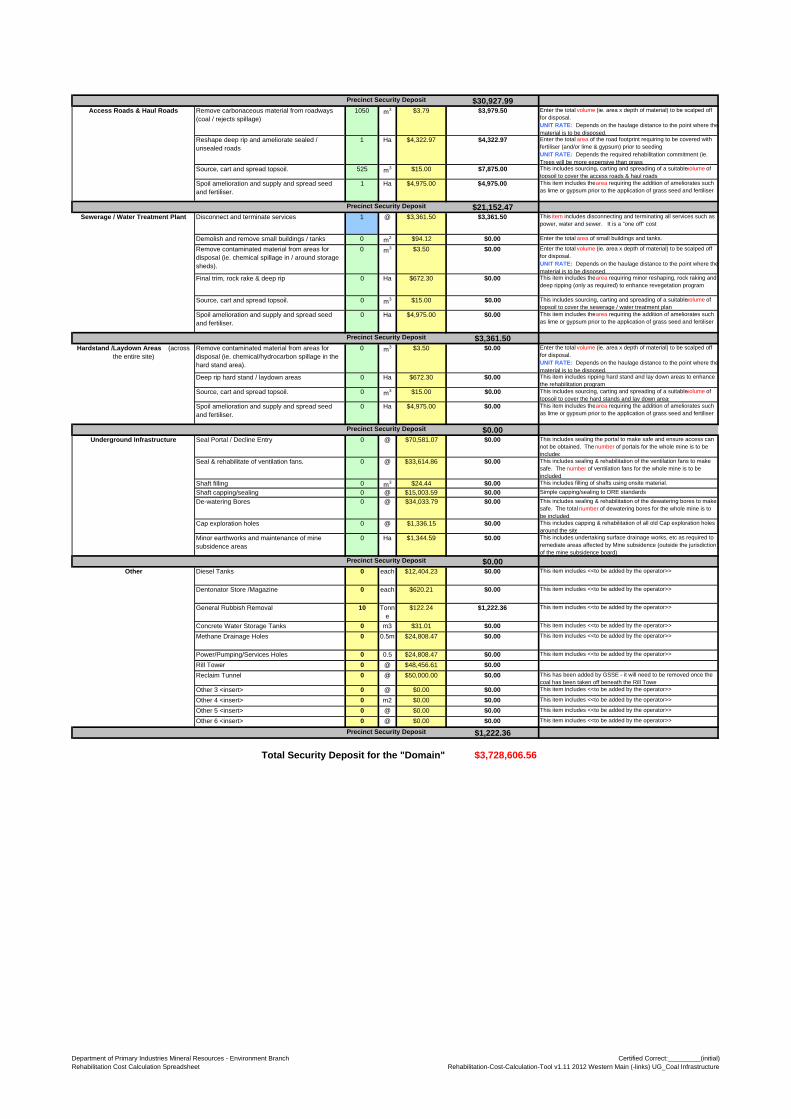
Precinct Security Deposit $30,927.99Remove carbonaceous material from roadways (coal / rejects spillage)
1050 m3 $3.79 $3,979.50 Enter the total volume (ie. area x depth of material) to be scalped off for disposal.UNIT RATE: Depends on the haulage distance to the point where the material is to be disposed.
Reshape deep rip and ameliorate sealed / unsealed roads
1 Ha $4,322.97 $4,322.97 Enter the total area of the road footprint requiring to be covered with fertiliser (and/or lime & gypsum) prior to seedingUNIT RATE: Depends the required rehabilitation commitment (ie. Trees will be more expensive than grass
Source, cart and spread topsoil. 525 m3 $15.00 $7,875.00 This includes sourcing, carting and spreading of a suitable volume of topsoil to cover the access roads & haul roads
Spoil amelioration and supply and spread seed and fertiliser.
1 Ha $4,975.00 $4,975.00 This item includes the area requiring the addition of ameliorates such as lime or gypsum prior to the application of grass seed and fertiliser
Precinct Security Deposit $21,152.47Disconnect and terminate services 1 @ $3,361.50 $3,361.50 This item includes disconnecting and terminating all services such as
power, water and sewer. It is a "one off" cost
Demolish and remove small buildings / tanks 0 m2 $94.12 $0.00 Enter the total area of small buildings and tanks.
Remove contaminated material from areas for disposal (ie. chemical spillage in / around storage sheds).
0 m3 $3.50 $0.00 Enter the total volume (ie. area x depth of material) to be scalped off for disposal.UNIT RATE: Depends on the haulage distance to the point where the material is to be disposed.
Final trim, rock rake & deep rip 0 Ha $672.30 $0.00 This item includes the area requiring minor reshaping, rock raking and deep ripping (only as required) to enhance revegetation program
Source, cart and spread topsoil. 0 m3 $15.00 $0.00 This includes sourcing, carting and spreading of a suitable volume of topsoil to cover the sewerage / water treatment plant
Spoil amelioration and supply and spread seed and fertiliser.
0 Ha $4,975.00 $0.00 This item includes the area requiring the addition of ameliorates such as lime or gypsum prior to the application of grass seed and fertiliser
Precinct Security Deposit $3,361.50Remove contaminated material from areas for disposal (ie. chemical/hydrocarbon spillage in the hard stand area).
0 m3 $3.50 $0.00 Enter the total volume (ie. area x depth of material) to be scalped off for disposal.UNIT RATE: Depends on the haulage distance to the point where the material is to be disposed.
Deep rip hard stand / laydown areas 0 Ha $672.30 $0.00 This item includes ripping hard stand and lay down areas to enhance the rehabilitation program.
Source, cart and spread topsoil. 0 m3 $15.00 $0.00 This includes sourcing, carting and spreading of a suitable volume of topsoil to cover the hard stands and lay down areas
Spoil amelioration and supply and spread seed and fertiliser.
0 Ha $4,975.00 $0.00 This item includes the area requiring the addition of ameliorates such as lime or gypsum prior to the application of grass seed and fertiliser
Precinct Security Deposit $0.00Underground Infrastructure Seal Portal / Decline Entry 0 @ $70,581.07 $0.00 This includes sealing the portal to make safe and ensure access can
not be obtained. The number of portals for the whole mine is to be included
Seal & rehabilitate of ventilation fans. 0 @ $33,614.86 $0.00 This includes sealing & rehabilitation of the ventilation fans to make safe. The number of ventilation fans for the whole mine is to be included.
Shaft filling 0 m3 $24.44 $0.00 This includes filling of shafts using onsite material.
Shaft capping/sealing 0 @ $15,003.59 $0.00 Simple capping/sealing to DRE standards
De-watering Bores 0 @ $34,033.79 $0.00 This includes sealing & rehabilitation of the dewatering bores to make safe. The total number of dewatering bores for the whole mine is to be included.
Cap exploration holes 0 @ $1,336.15 $0.00 This includes capping & rehabilitation of all old Cap exploration holes around the site
Minor earthworks and maintenance of mine subsidence areas
0 Ha $1,344.59 $0.00 This includes undertaking surface drainage works, etc as required to remediate areas affected by Mine subsidence (outside the jurisdiction of the mine subsidence board)
Precinct Security Deposit $0.00Diesel Tanks 0 each $12,404.23 $0.00 This item includes <<to be added by the operator>>
Dentonator Store /Magazine 0 each $620.21 $0.00 This item includes <<to be added by the operator>>
General Rubbish Removal 10 Tonne
$122.24 $1,222.36 This item includes <<to be added by the operator>>
Concrete Water Storage Tanks 0 m3 $31.01 $0.00 This item includes <<to be added by the operator>>
Methane Drainage Holes 0 0.5m $24,808.47 $0.00 This item includes <<to be added by the operator>>
Power/Pumping/Services Holes 0 0.5 $24,808.47 $0.00 This item includes <<to be added by the operator>>
Rill Tower 0 @ $48,456.61 $0.00
Reclaim Tunnel 0 @ $50,000.00 $0.00 This has been added by GSSE - it will need to be removed once the coal has been taken off beneath the Rill Towe
Other 3 <insert> 0 @ $0.00 $0.00 This item includes <<to be added by the operator>>
Other 4 <insert> 0 m2 $0.00 $0.00 This item includes <<to be added by the operator>>
Other 5 <insert> 0 @ $0.00 $0.00 This item includes <<to be added by the operator>>
Other 6 <insert> 0 @ $0.00 $0.00 This item includes <<to be added by the operator>>
Precinct Security Deposit $1,222.36
$3,728,606.56
Access Roads & Haul Roads
Total Security Deposit for the "Domain"
Other
Sewerage / Water Treatment Plant
Hardstand /Laydown Areas (across the entire site)
Department of Primary Industries Mineral Resources - Environment BranchRehabilitation Cost Calculation Spreadsheet
Certified Correct:_________(initial)Rehabilitation-Cost-Calculation-Tool v1.11 2012 Western Main (-links) UG_Coal Infrastructure
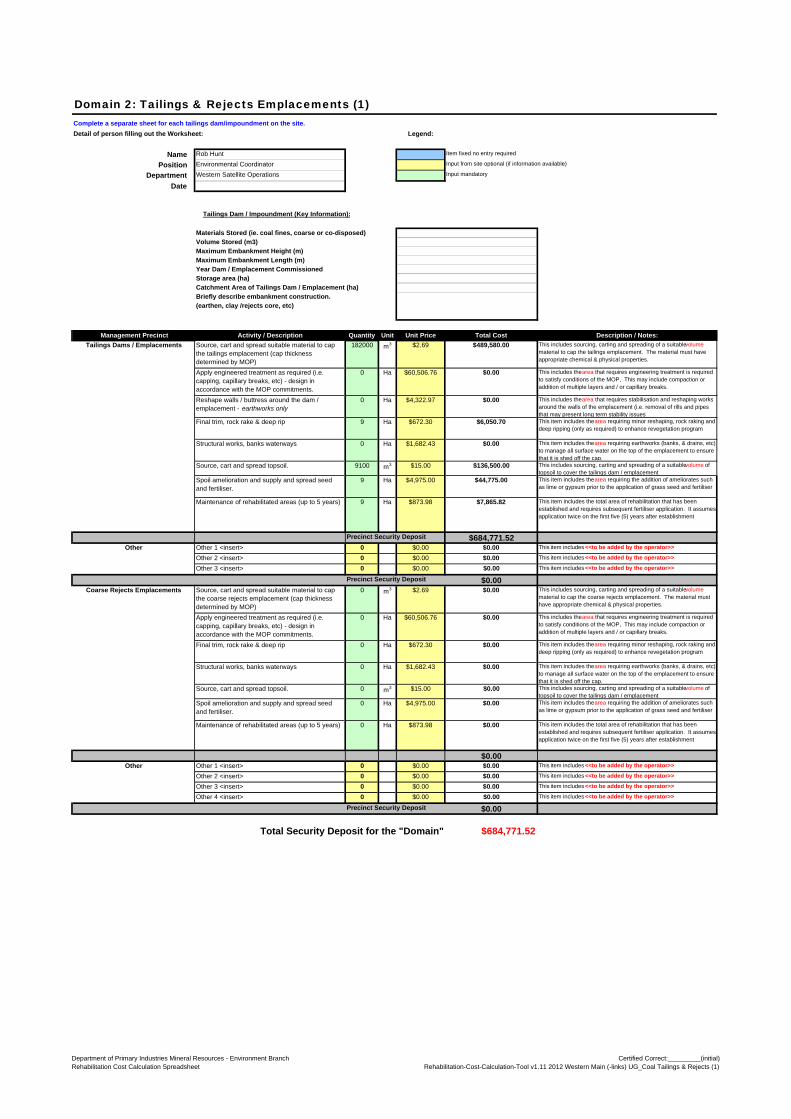
Domain 2: Tailings & Rejects Emplacements (1)Complete a separate sheet for each tailings dam/impoundment on the site.
Detail of person filling out the Worksheet: Legend:
Name Rob Hunt Item fixed no entry required
Position Environmental Coordinator Input from site optional (if information available)
Department Western Satellite Operations Input mandatory
Date
Tailings Dam / Impoundment (Key Information):
Materials Stored (ie. coal fines, coarse or co-disposed)Volume Stored (m3)Maximum Embankment Height (m)Maximum Embankment Length (m)Year Dam / Emplacement CommissionedStorage area (ha)Catchment Area of Tailings Dam / Emplacement (ha)Briefly describe embankment construction.(earthen, clay /rejects core, etc)
Management Precinct Activity / Description Quantity Unit Unit Price Total Cost Description / Notes:
Source, cart and spread suitable material to cap the tailings emplacement (cap thickness determined by MOP)
182000 m3 $2.69 $489,580.00 This includes sourcing, carting and spreading of a suitable volume material to cap the tailings emplacement. The material must have appropriate chemical & physical properties.
Apply engineered treatment as required (i.e. capping, capillary breaks, etc) - design in accordance with the MOP commitments.
0 Ha $60,506.76 $0.00 This includes the area that requires engineering treatment is required to satisfy conditions of the MOP, This may include compaction or addition of multiple layers and / or capillary breaks.
Reshape walls / buttress around the dam / emplacement - earthworks only
0 Ha $4,322.97 $0.00 This includes the area that requires stabilisation and reshaping works around the walls of the emplacement (i.e. removal of rills and pipes that may present long term stability issues)
Final trim, rock rake & deep rip 9 Ha $672.30 $6,050.70 This item includes the area requiring minor reshaping, rock raking and deep ripping (only as required) to enhance revegetation program
Structural works, banks waterways 0 Ha $1,682.43 $0.00 This item includes the area requiring earthworks (banks, & drains, etc) to manage all surface water on the top of the emplacement to ensure that it is shed off the cap.
Source, cart and spread topsoil. 9100 m3 $15.00 $136,500.00 This includes sourcing, carting and spreading of a suitable volume of topsoil to cover the tailings dam / emplacement
Spoil amelioration and supply and spread seed and fertiliser.
9 Ha $4,975.00 $44,775.00 This item includes the area requiring the addition of ameliorates such as lime or gypsum prior to the application of grass seed and fertiliser
Maintenance of rehabilitated areas (up to 5 years) 9 Ha $873.98 $7,865.82 This item includes the total area of rehabilitation that has been established and requires subsequent fertiliser application. It assumes application twice on the first five (5) years after establishment
Precinct Security Deposit $684,771.52Other 1 <insert> 0 $0.00 $0.00 This item includes <<to be added by the operator>>
Other 2 <insert> 0 $0.00 $0.00 This item includes <<to be added by the operator>>
Other 3 <insert> 0 $0.00 $0.00 This item includes <<to be added by the operator>>
Precinct Security Deposit $0.00Source, cart and spread suitable material to cap the coarse rejects emplacement (cap thickness determined by MOP)
0 m3 $2.69 $0.00 This includes sourcing, carting and spreading of a suitable volume material to cap the coarse rejects emplacement. The material must have appropriate chemical & physical properties.
Apply engineered treatment as required (i.e. capping, capillary breaks, etc) - design in accordance with the MOP commitments.
0 Ha $60,506.76 $0.00 This includes the area that requires engineering treatment is required to satisfy conditions of the MOP, This may include compaction or addition of multiple layers and / or capillary breaks.
Final trim, rock rake & deep rip 0 Ha $672.30 $0.00 This item includes the area requiring minor reshaping, rock raking and deep ripping (only as required) to enhance revegetation program
Structural works, banks waterways 0 Ha $1,682.43 $0.00 This item includes the area requiring earthworks (banks, & drains, etc) to manage all surface water on the top of the emplacement to ensure that it is shed off the cap.
Source, cart and spread topsoil. 0 m3 $15.00 $0.00 This includes sourcing, carting and spreading of a suitable volume of topsoil to cover the tailings dam / emplacement
Spoil amelioration and supply and spread seed and fertiliser.
0 Ha $4,975.00 $0.00 This item includes the area requiring the addition of ameliorates such as lime or gypsum prior to the application of grass seed and fertiliser
Maintenance of rehabilitated areas (up to 5 years) 0 Ha $873.98 $0.00 This item includes the total area of rehabilitation that has been established and requires subsequent fertiliser application. It assumes application twice on the first five (5) years after establishment
$0.00Other 1 <insert> 0 $0.00 $0.00 This item includes <<to be added by the operator>>
Other 2 <insert> 0 $0.00 $0.00 This item includes <<to be added by the operator>>
Other 3 <insert> 0 $0.00 $0.00 This item includes <<to be added by the operator>>
Other 4 <insert> 0 $0.00 $0.00 This item includes <<to be added by the operator>>
Precinct Security Deposit $0.00
$684,771.52Total Security Deposit for the "Domain"
Other
Coarse Rejects Emplacements
Tailings Dams / Emplacements
Other
Department of Primary Industries Mineral Resources - Environment BranchRehabilitation Cost Calculation Spreadsheet
Certified Correct:_________(initial)Rehabilitation-Cost-Calculation-Tool v1.11 2012 Western Main (-links) UG_Coal Tailings & Rejects (1)
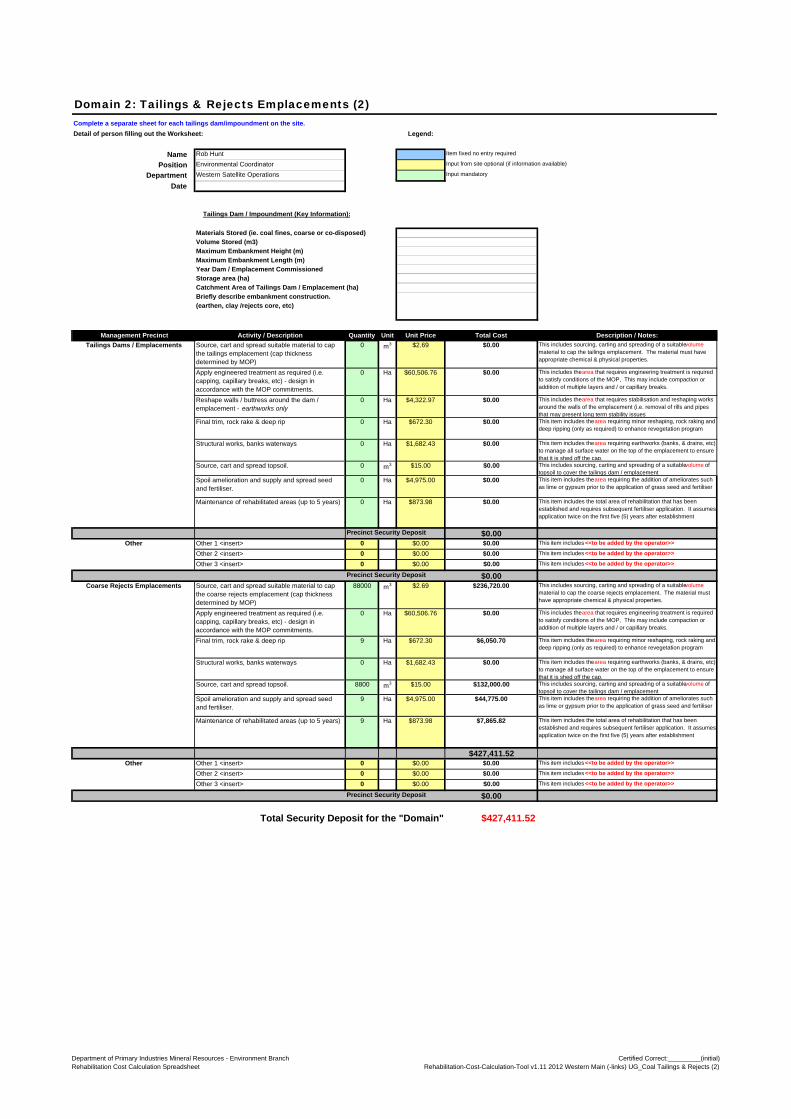
Domain 2: Tailings & Rejects Emplacements (2)Complete a separate sheet for each tailings dam/impoundment on the site.
Detail of person filling out the Worksheet: Legend:
Name Rob Hunt Item fixed no entry required
Position Environmental Coordinator Input from site optional (if information available)
Department Western Satellite Operations Input mandatory
Date
Tailings Dam / Impoundment (Key Information):
Materials Stored (ie. coal fines, coarse or co-disposed)Volume Stored (m3)Maximum Embankment Height (m)Maximum Embankment Length (m)Year Dam / Emplacement CommissionedStorage area (ha)Catchment Area of Tailings Dam / Emplacement (ha)Briefly describe embankment construction.(earthen, clay /rejects core, etc)
Management Precinct Activity / Description Quantity Unit Unit Price Total Cost Description / Notes:
Source, cart and spread suitable material to cap the tailings emplacement (cap thickness determined by MOP)
0 m3 $2.69 $0.00 This includes sourcing, carting and spreading of a suitable volume material to cap the tailings emplacement. The material must have appropriate chemical & physical properties.
Apply engineered treatment as required (i.e. capping, capillary breaks, etc) - design in accordance with the MOP commitments.
0 Ha $60,506.76 $0.00 This includes the area that requires engineering treatment is required to satisfy conditions of the MOP, This may include compaction or addition of multiple layers and / or capillary breaks.
Reshape walls / buttress around the dam / emplacement - earthworks only
0 Ha $4,322.97 $0.00 This includes the area that requires stabilisation and reshaping works around the walls of the emplacement (i.e. removal of rills and pipes that may present long term stability issues)
Final trim, rock rake & deep rip 0 Ha $672.30 $0.00 This item includes the area requiring minor reshaping, rock raking and deep ripping (only as required) to enhance revegetation program
Structural works, banks waterways 0 Ha $1,682.43 $0.00 This item includes the area requiring earthworks (banks, & drains, etc) to manage all surface water on the top of the emplacement to ensure that it is shed off the cap.
Source, cart and spread topsoil. 0 m3 $15.00 $0.00 This includes sourcing, carting and spreading of a suitable volume of topsoil to cover the tailings dam / emplacement
Spoil amelioration and supply and spread seed and fertiliser.
0 Ha $4,975.00 $0.00 This item includes the area requiring the addition of ameliorates such as lime or gypsum prior to the application of grass seed and fertiliser
Maintenance of rehabilitated areas (up to 5 years) 0 Ha $873.98 $0.00 This item includes the total area of rehabilitation that has been established and requires subsequent fertiliser application. It assumes application twice on the first five (5) years after establishment
Precinct Security Deposit $0.00Other 1 <insert> 0 $0.00 $0.00 This item includes <<to be added by the operator>>
Other 2 <insert> 0 $0.00 $0.00 This item includes <<to be added by the operator>>
Other 3 <insert> 0 $0.00 $0.00 This item includes <<to be added by the operator>>
Precinct Security Deposit $0.00Source, cart and spread suitable material to cap the coarse rejects emplacement (cap thickness determined by MOP)
88000 m3 $2.69 $236,720.00 This includes sourcing, carting and spreading of a suitable volume material to cap the coarse rejects emplacement. The material must have appropriate chemical & physical properties.
Apply engineered treatment as required (i.e. capping, capillary breaks, etc) - design in accordance with the MOP commitments.
0 Ha $60,506.76 $0.00 This includes the area that requires engineering treatment is required to satisfy conditions of the MOP, This may include compaction or addition of multiple layers and / or capillary breaks.
Final trim, rock rake & deep rip 9 Ha $672.30 $6,050.70 This item includes the area requiring minor reshaping, rock raking and deep ripping (only as required) to enhance revegetation program
Structural works, banks waterways 0 Ha $1,682.43 $0.00 This item includes the area requiring earthworks (banks, & drains, etc) to manage all surface water on the top of the emplacement to ensure that it is shed off the cap.
Source, cart and spread topsoil. 8800 m3 $15.00 $132,000.00 This includes sourcing, carting and spreading of a suitable volume of topsoil to cover the tailings dam / emplacement
Spoil amelioration and supply and spread seed and fertiliser.
9 Ha $4,975.00 $44,775.00 This item includes the area requiring the addition of ameliorates such as lime or gypsum prior to the application of grass seed and fertiliser
Maintenance of rehabilitated areas (up to 5 years) 9 Ha $873.98 $7,865.82 This item includes the total area of rehabilitation that has been established and requires subsequent fertiliser application. It assumes application twice on the first five (5) years after establishment
$427,411.52Other 1 <insert> 0 $0.00 $0.00 This item includes <<to be added by the operator>>
Other 2 <insert> 0 $0.00 $0.00 This item includes <<to be added by the operator>>
Other 3 <insert> 0 $0.00 $0.00 This item includes <<to be added by the operator>>
Precinct Security Deposit $0.00
$427,411.52
Other
Coarse Rejects Emplacements
Tailings Dams / Emplacements
Other
Total Security Deposit for the "Domain"
Department of Primary Industries Mineral Resources - Environment BranchRehabilitation Cost Calculation Spreadsheet
Certified Correct:_________(initial)Rehabilitation-Cost-Calculation-Tool v1.11 2012 Western Main (-links) UG_Coal Tailings & Rejects (2)
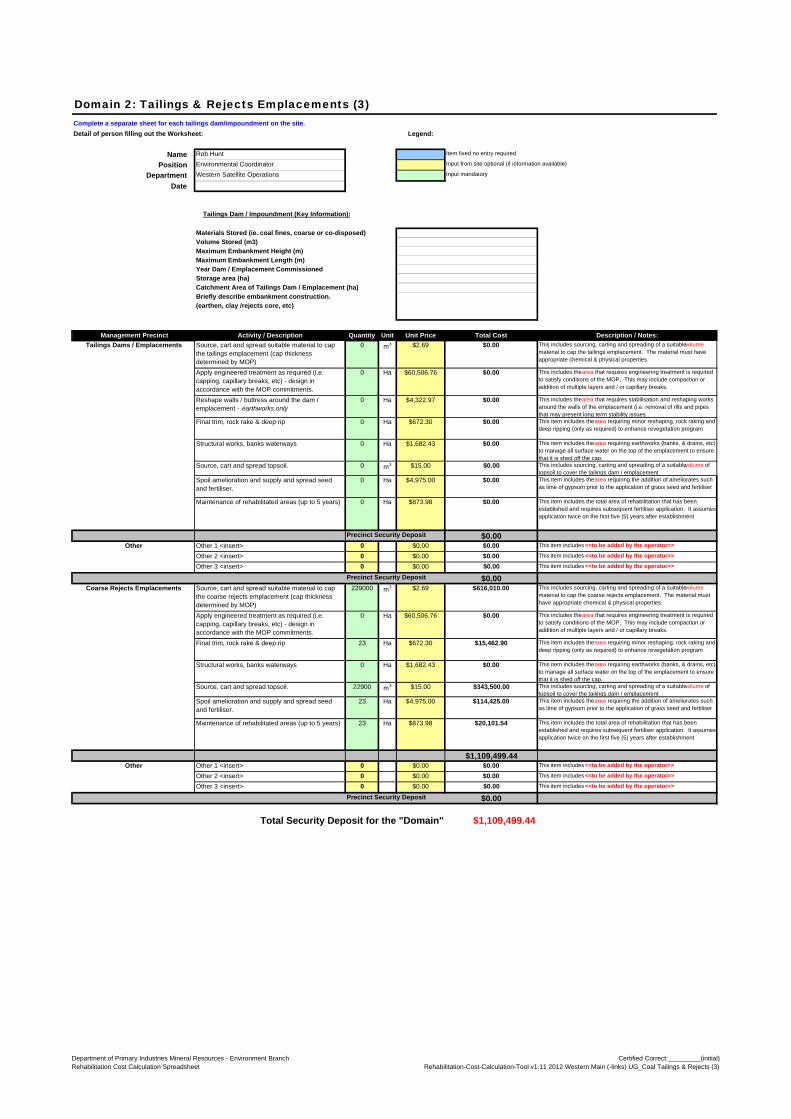
Domain 2: Tailings & Rejects Emplacements (3)Complete a separate sheet for each tailings dam/impoundment on the site.
Detail of person filling out the Worksheet: Legend:
Name Rob Hunt Item fixed no entry required
Position Environmental Coordinator Input from site optional (if information available)
Department Western Satellite Operations Input mandatory
Date
Tailings Dam / Impoundment (Key Information):
Materials Stored (ie. coal fines, coarse or co-disposed)Volume Stored (m3)Maximum Embankment Height (m)Maximum Embankment Length (m)Year Dam / Emplacement CommissionedStorage area (ha)Catchment Area of Tailings Dam / Emplacement (ha)Briefly describe embankment construction.(earthen, clay /rejects core, etc)
Management Precinct Activity / Description Quantity Unit Unit Price Total Cost Description / Notes:
Source, cart and spread suitable material to cap the tailings emplacement (cap thickness determined by MOP)
0 m3 $2.69 $0.00 This includes sourcing, carting and spreading of a suitable volume material to cap the tailings emplacement. The material must have appropriate chemical & physical properties.
Apply engineered treatment as required (i.e. capping, capillary breaks, etc) - design in accordance with the MOP commitments.
0 Ha $60,506.76 $0.00 This includes the area that requires engineering treatment is required to satisfy conditions of the MOP, This may include compaction or addition of multiple layers and / or capillary breaks.
Reshape walls / buttress around the dam / emplacement - earthworks only
0 Ha $4,322.97 $0.00 This includes the area that requires stabilisation and reshaping works around the walls of the emplacement (i.e. removal of rills and pipes that may present long term stability issues)
Final trim, rock rake & deep rip 0 Ha $672.30 $0.00 This item includes the area requiring minor reshaping, rock raking and deep ripping (only as required) to enhance revegetation program
Structural works, banks waterways 0 Ha $1,682.43 $0.00 This item includes the area requiring earthworks (banks, & drains, etc) to manage all surface water on the top of the emplacement to ensure that it is shed off the cap.
Source, cart and spread topsoil. 0 m3 $15.00 $0.00 This includes sourcing, carting and spreading of a suitable volume of topsoil to cover the tailings dam / emplacement
Spoil amelioration and supply and spread seed and fertiliser.
0 Ha $4,975.00 $0.00 This item includes the area requiring the addition of ameliorates such as lime of gypsum prior to the application of grass seed and fertiliser
Maintenance of rehabilitated areas (up to 5 years) 0 Ha $873.98 $0.00 This item includes the total area of rehabilitation that has been established and requires subsequent fertiliser application. It assumes application twice on the first five (5) years after establishment
Precinct Security Deposit $0.00Other 1 <insert> 0 $0.00 $0.00 This item includes <<to be added by the operator>>
Other 2 <insert> 0 $0.00 $0.00 This item includes <<to be added by the operator>>
Other 3 <insert> 0 $0.00 $0.00 This item includes <<to be added by the operator>>
Precinct Security Deposit $0.00Source, cart and spread suitable material to cap the coarse rejects emplacement (cap thickness determined by MOP)
229000 m3 $2.69 $616,010.00 This includes sourcing, carting and spreading of a suitable volume material to cap the coarse rejects emplacement. The material must have appropriate chemical & physical properties.
Apply engineered treatment as required (i.e. capping, capillary breaks, etc) - design in accordance with the MOP commitments.
0 Ha $60,506.76 $0.00 This includes the area that requires engineering treatment is required to satisfy conditions of the MOP, This may include compaction or addition of multiple layers and / or capillary breaks.
Final trim, rock rake & deep rip 23 Ha $672.30 $15,462.90 This item includes the area requiring minor reshaping, rock raking and deep ripping (only as required) to enhance revegetation program
Structural works, banks waterways 0 Ha $1,682.43 $0.00 This item includes the area requiring earthworks (banks, & drains, etc) to manage all surface water on the top of the emplacement to ensure that it is shed off the cap.
Source, cart and spread topsoil. 22900 m3 $15.00 $343,500.00 This includes sourcing, carting and spreading of a suitable volume of topsoil to cover the tailings dam / emplacement
Spoil amelioration and supply and spread seed and fertiliser.
23 Ha $4,975.00 $114,425.00 This item includes the area requiring the addition of ameliorates such as lime of gypsum prior to the application of grass seed and fertiliser
Maintenance of rehabilitated areas (up to 5 years) 23 Ha $873.98 $20,101.54 This item includes the total area of rehabilitation that has been established and requires subsequent fertiliser application. It assumes application twice on the first five (5) years after establishment
$1,109,499.44Other 1 <insert> 0 $0.00 $0.00 This item includes <<to be added by the operator>>
Other 2 <insert> 0 $0.00 $0.00 This item includes <<to be added by the operator>>
Other 3 <insert> 0 $0.00 $0.00 This item includes <<to be added by the operator>>
Precinct Security Deposit $0.00
$1,109,499.44Total Security Deposit for the "Domain"
Other
Coarse Rejects Emplacements
Tailings Dams / Emplacements
Other
Department of Primary Industries Mineral Resources - Environment BranchRehabilitation Cost Calculation Spreadsheet
Certified Correct:_________(initial)Rehabilitation-Cost-Calculation-Tool v1.11 2012 Western Main (-links) UG_Coal Tailings & Rejects (3)
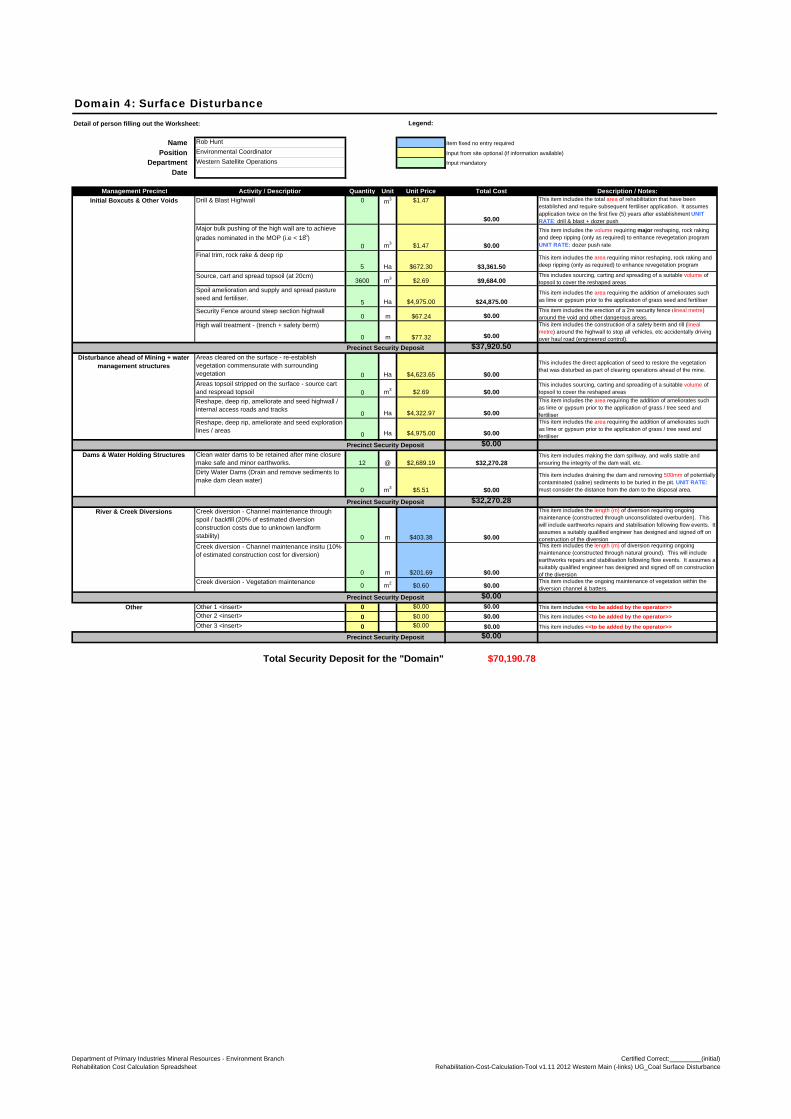
Domain 4: Surface DisturbanceDetail of person filling out the Worksheet: Legend:
Name Rob Hunt Item fixed no entry required
Position Environmental Coordinator Input from site optional (if information available)
Department Western Satellite Operations Input mandatory
Date
Management Precinct Activity / Description Quantity Unit Unit Price Total Cost Description / Notes:
Drill & Blast Highwall 0 m3 $1.47
$0.00
This item includes the total area of rehabilitation that have been established and require subsequent fertiliser application. It assumes application twice on the first five (5) years after establishment UNIT RATE: drill & blast + dozer push
Major bulk pushing of the high wall are to achieve
grades nominated in the MOP (i.e < 18o)0 m3 $1.47 $0.00
This item includes the volume requiring major reshaping, rock raking and deep ripping (only as required) to enhance revegetation program UNIT RATE: dozer push rate
Final trim, rock rake & deep rip
5 Ha $672.30 $3,361.50
This item includes the area requiring minor reshaping, rock raking and deep ripping (only as required) to enhance revegetation program
Source, cart and spread topsoil (at 20cm)3600 m3 $2.69 $9,684.00
This includes sourcing, carting and spreading of a suitable volume of topsoil to cover the reshaped areas
Spoil amelioration and supply and spread pasture seed and fertiliser.
5 Ha $4,975.00 $24,875.00
This item includes the area requiring the addition of ameliorates such as lime or gypsum prior to the application of grass seed and fertiliser
Security Fence around steep section highwall0 m $67.24 $0.00
This item includes the erection of a 2m security fence (lineal metre) around the void and other dangerous areas.
High wall treatment - (trench + safety berm)
0 m $77.32 $0.00
This item includes the construction of a safety berm and rill (lineal metre) around the highwall to stop all vehicles, etc accidentally driving over haul road (engineered control).
Precinct Security Deposit $37,920.50Areas cleared on the surface - re-establish vegetation commensurate with surrounding vegetation 0 Ha $4,623.65 $0.00
This includes the direct application of seed to restore the vegetation that was disturbed as part of clearing operations ahead of the mine.
Areas topsoil stripped on the surface - source cart and respread topsoil 0 m3 $2.69 $0.00
This includes sourcing, carting and spreading of a suitable volume of topsoil to cover the reshaped areas
Reshape, deep rip, ameliorate and seed highwall / internal access roads and tracks
0 Ha $4,322.97 $0.00
This item includes the area requiring the addition of ameliorates such as lime or gypsum prior to the application of grass / tree seed and fertiliser
Reshape, deep rip, ameliorate and seed exploration lines / areas
0 Ha $4,975.00 $0.00
This item includes the area requiring the addition of ameliorates such as lime or gypsum prior to the application of grass / tree seed and fertiliser
Precinct Security Deposit $0.00Clean water dams to be retained after mine closure -make safe and minor earthworks. 12 @ $2,689.19 $32,270.28
This item includes making the dam spillway, and walls stable and ensuring the integrity of the dam wall, etc.
Dirty Water Dams (Drain and remove sediments to make dam clean water)
0 m3 $5.51 $0.00
This item includes draining the dam and removing 500mm of potentially contaminated (saline) sediments to be buried in the pit. UNIT RATE: must consider the distance from the dam to the disposal area.
Precinct Security Deposit $32,270.28Creek diversion - Channel maintenance through spoil / backfill (20% of estimated diversion construction costs due to unknown landform stability) 0 m $403.38 $0.00
This item includes the length (m) of diversion requiring ongoing maintenance (constructed through unconsolidated overburden). This will include earthworks repairs and stabilisation following flow events. It assumes a suitably qualified engineer has designed and signed off on construction of the diversion
Creek diversion - Channel maintenance insitu (10% of estimated construction cost for diversion)
0 m $201.69 $0.00
This item includes the length (m) of diversion requiring ongoing maintenance (constructed through natural ground). This will include earthworks repairs and stabilisation following flow events. It assumes a suitably qualified engineer has designed and signed off on construction of the diversion
Creek diversion - Vegetation maintenance0 m2 $0.60 $0.00
This item includes the ongoing maintenance of vegetation within the diversion channel & batters.
Precinct Security Deposit $0.00Other 1 <insert> 0 $0.00 $0.00 This item includes <<to be added by the operator>>
Other 2 <insert> 0 $0.00 $0.00 This item includes <<to be added by the operator>>
Other 3 <insert> 0 $0.00 $0.00 This item includes <<to be added by the operator>>
Precinct Security Deposit $0.00
$70,190.78Total Security Deposit for the "Domain"
Initial Boxcuts & Other Voids
Other
Dams & Water Holding Structures
Disturbance ahead of Mining + water management structures
River & Creek Diversions
Department of Primary Industries Mineral Resources - Environment BranchRehabilitation Cost Calculation Spreadsheet
Certified Correct:_________(initial)Rehabilitation-Cost-Calculation-Tool v1.11 2012 Western Main (-links) UG_Coal Surface Disturbance
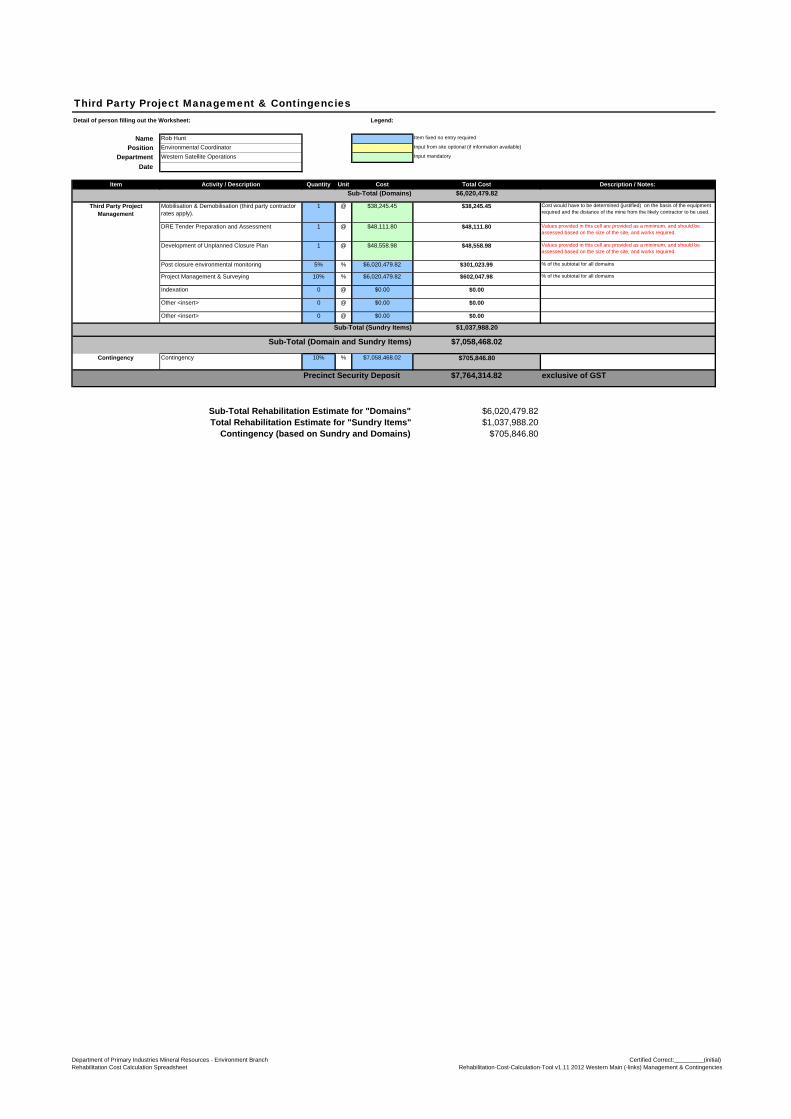
Third Party Project Management & ContingenciesDetail of person filling out the Worksheet: Legend:
Name Rob Hunt Item fixed no entry required
Position Environmental Coordinator Input from site optional (if information available)
Department Western Satellite Operations Input mandatory
Date
Item Activity / Description Quantity Unit Cost Total Cost Description / Notes:
Sub-Total (Domains) $6,020,479.82
Third Party Project Management
Mobilisation & Demobilisation (third party contractor rates apply).
1 @ $38,245.45 $38,245.45 Cost would have to be determined (justified) on the basis of the equipment required and the distance of the mine from the likely contractor to be used.
DRE Tender Preparation and Assessment 1 @ $48,111.80 $48,111.80 Values provided in this cell are provided as a minimum, and should be assessed based on the size of the site, and works required.
Development of Unplanned Closure Plan 1 @ $48,558.98 $48,558.98 Values provided in this cell are provided as a minimum, and should be assessed based on the size of the site, and works required.
Post closure environmental monitoring 5% % $6,020,479.82 $301,023.99 % of the subtotal for all domains
Project Management & Surveying 10% % $6,020,479.82 $602,047.98 % of the subtotal for all domains
Indexation 0 @ $0.00 $0.00
Other <insert> 0 @ $0.00 $0.00
Other <insert> 0 @ $0.00 $0.00
Sub-Total (Sundry Items) $1,037,988.20
Sub-Total (Domain and Sundry Items) $7,058,468.02
Contingency Contingency 10% % $7,058,468.02 $705,846.80
Precinct Security Deposit $7,764,314.82 exclusive of GST
$6,020,479.82$1,037,988.20
$705,846.80
Sub-Total Rehabilitation Estimate for "Domains"Total Rehabilitation Estimate for "Sundry Items"
Contingency (based on Sundry and Domains)
Department of Primary Industries Mineral Resources - Environment BranchRehabilitation Cost Calculation Spreadsheet
Certified Correct:_________(initial)Rehabilitation-Cost-Calculation-Tool v1.11 2012 Western Main (-links) Management & Contingencies
Appendix 5
AEMR Plans
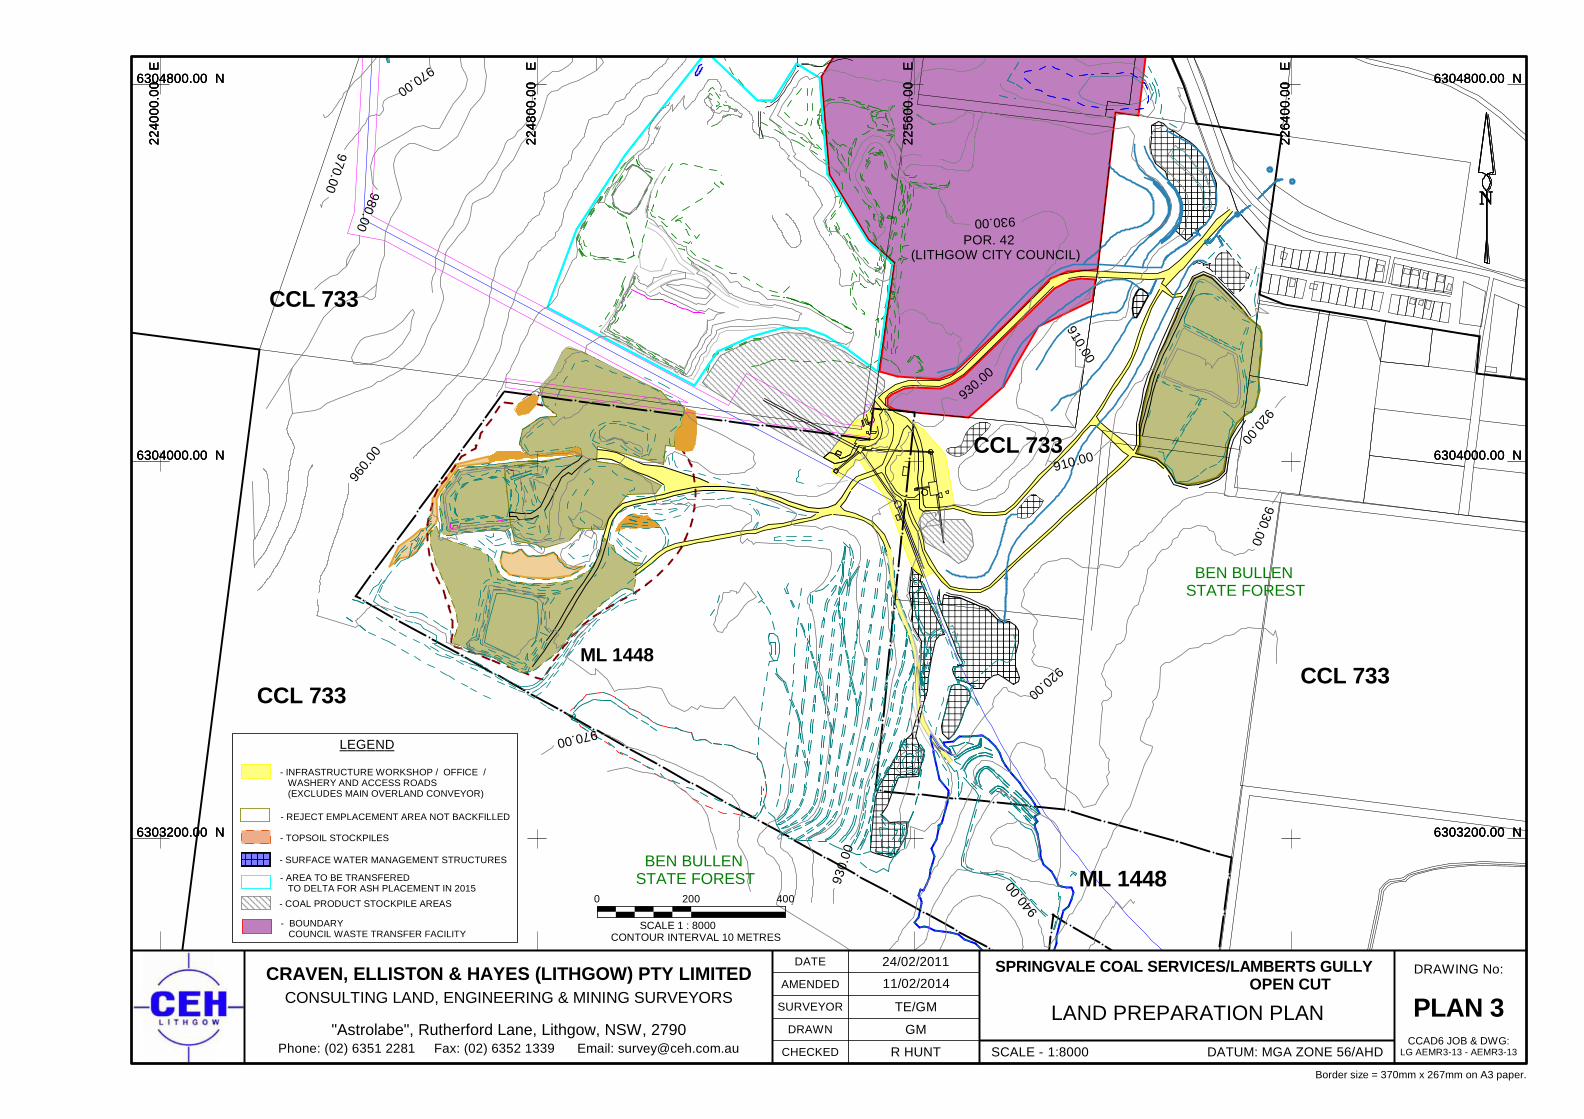
2240
00.0
0 E
2248
00.0
0 E
2256
00.0
0 E
2264
00.0
0 E
6303200.00 N 6303200.00 N
6304000.00 N 6304000.00 N
6304800.00 N 6304800.00 N
N
910.00
910.00
920.00
920.00
930.
00
930.00
930.00
930.00
940.
00
960.
00
970.00
970.00
970.00
980.00
LEGEND
- REJECT EMPLACEMENT AREA NOT BACKFILLED
- INFRASTRUCTURE WORKSHOP / OFFICE / WASHERY AND ACCESS ROADS (EXCLUDES MAIN OVERLAND CONVEYOR)
- TOPSOIL STOCKPILES
- SURFACE WATER MANAGEMENT STRUCTURES
- AREA TO BE TRANSFERED TO DELTA FOR ASH PLACEMENT IN 2015
- COAL PRODUCT STOCKPILE AREAS
- BOUNDARY COUNCIL WASTE TRANSFER FACILITY
BEN BULLEN STATE FOREST
BEN BULLEN STATE FOREST
CCL 733CCL 733
CCL 733
CCL 733
ML 1448
ML 1448
POR. 42 (LITHGOW CITY COUNCIL)
2240
00.0
0 E
2248
00.0
0 E
2256
00.0
0 E
2264
00.0
0 E
6303200.00 N 6303200.00 N
6304000.00 N 6304000.00 N
6304800.00 N 6304800.00 N
N
0 200 400
SCALE 1 : 8000CONTOUR INTERVAL 10 METRES
11/02/2014SPRINGVALE COAL SERVICES/LAMBERTS GULLY OPEN CUT
LAND PREPARATION PLAN
CRAVEN, ELLISTON & HAYES (LITHGOW) PTY LIMITEDCONSULTING LAND, ENGINEERING & MINING SURVEYORS
"Astrolabe", Rutherford Lane, Lithgow, NSW, 2790Phone: (02) 6351 2281 Fax: (02) 6352 1339 Email: [email protected] SCALE - DATUM: MGA ZONE 56/AHD1:8000
DRAWING No:24/02/2011
TE/GM
GM
R HUNT
DATE
AMENDED
SURVEYOR
DRAWN
CHECKED
Border size = 370mm x 267mm on A3 paper.
CCAD6 JOB & DWG:LG AEMR3-13 - AEMR3-13
PLAN 3
2240
00.0
0 E
2248
00.0
0 E
2256
00.0
0 E
2264
00.0
0 E
6303200.00 N 6303200.00 N
6304000.00 N 6304000.00 N
6304800.00 N 6304800.00 N
N
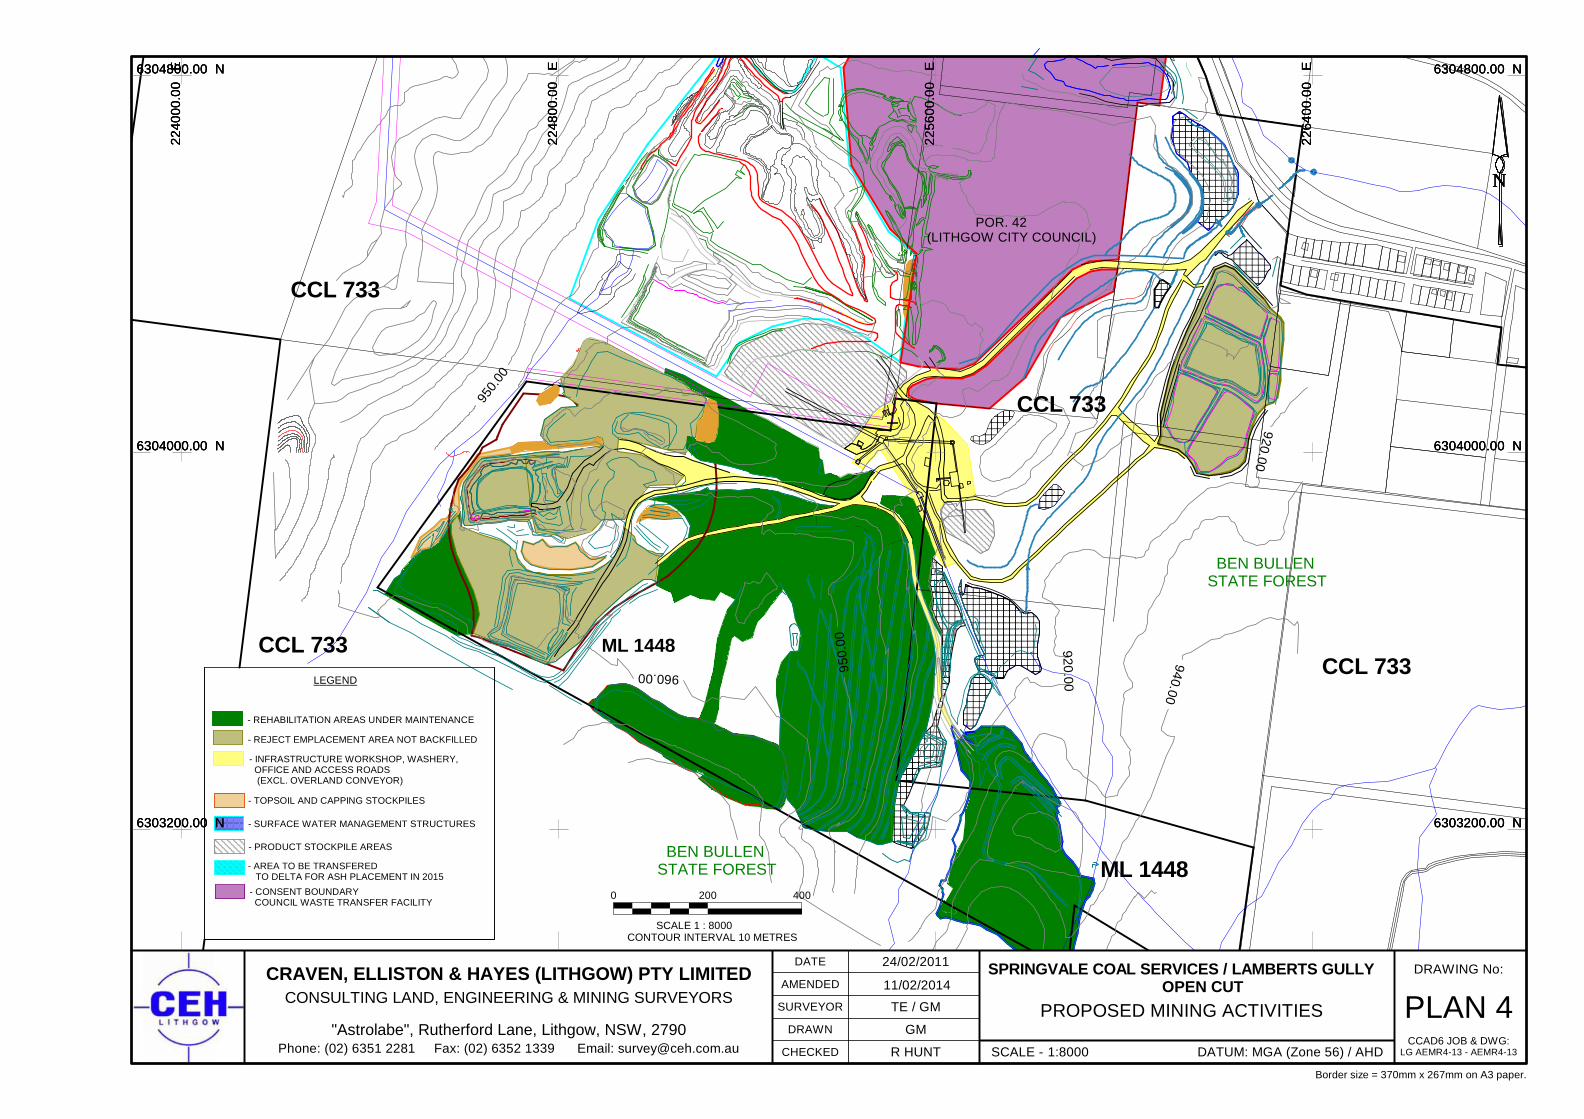
2240
00.0
0 E
2248
00.0
0 E
2256
00.0
0 E
2264
00.0
0 E
6303200.00 N 6303200.00 N
6304000.00 N 6304000.00 N
6304800.00 N 6304800.00 N
N
920.00
920.00
940.00
950.
00
950.
00
960.00
BEN BULLEN STATE FOREST
BEN BULLEN STATE FOREST
CCL 733CCL 733
CCL 733
ML 1448
CCL 733
ML 1448
LEGEND
- REJECT EMPLACEMENT AREA NOT BACKFILLED
- INFRASTRUCTURE WORKSHOP, WASHERY, OFFICE AND ACCESS ROADS (EXCL. OVERLAND CONVEYOR)
- REHABILITATION AREAS UNDER MAINTENANCE
- TOPSOIL AND CAPPING STOCKPILES
- SURFACE WATER MANAGEMENT STRUCTURES
- PRODUCT STOCKPILE AREAS
- CONSENT BOUNDARY COUNCIL WASTE TRANSFER FACILITY
- AREA TO BE TRANSFERED TO DELTA FOR ASH PLACEMENT IN 2015
15
2240
00.0
0 E
2248
00.0
0 E
2256
00.0
0 E
2264
00.0
0 E
6303200.00 N 6303200.00 N
6304000.00 N 6304000.00 N
6304800.00 N 6304800.00 N
N
0 200 400
SCALE 1 : 8000 CONTOUR INTERVAL 10 METRES
SPRINGVALE COAL SERVICES / LAMBERTS GULLY OPEN CUT
PROPOSED MINING ACTIVITIES
POR. 42 (LITHGOW CITY COUNCIL)
11/02/2014CRAVEN, ELLISTON & HAYES (LITHGOW) PTY LIMITED
CONSULTING LAND, ENGINEERING & MINING SURVEYORS
"Astrolabe", Rutherford Lane, Lithgow, NSW, 2790Phone: (02) 6351 2281 Fax: (02) 6352 1339 Email: [email protected] SCALE - DATUM: MGA (Zone 56) / AHD1:8000
DRAWING No:24/02/2011
TE / GM
GM
R HUNT
DATE
AMENDED
SURVEYOR
DRAWN
CHECKED
Border size = 370mm x 267mm on A3 paper.
CCAD6 JOB & DWG:LG AEMR4-13 - AEMR4-13
PLAN 4
2240
00.0
0 E
2248
00.0
0 E
2256
00.0
0 E
2264
00.0
0 E
6303200.00 N 6303200.00 N
6304000.00 N 6304000.00 N
6304800.00 N 6304800.00 N
N
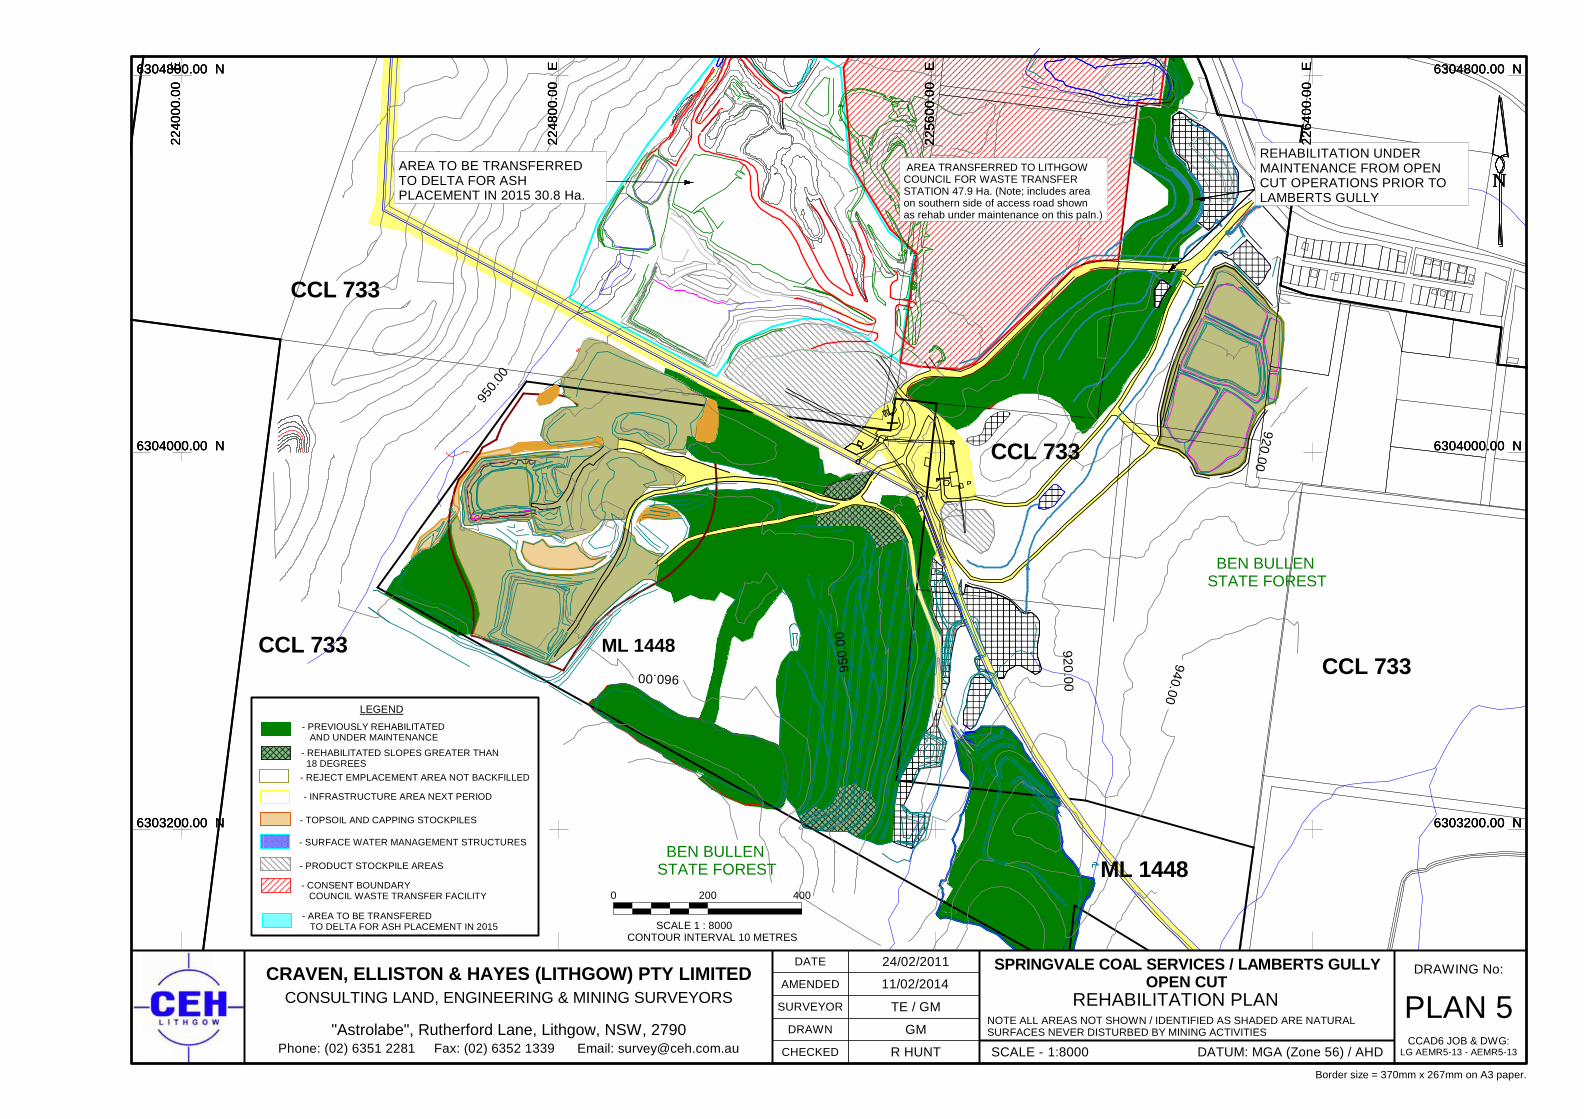
2240
00.0
0 E
2248
00.0
0 E
2256
00.0
0 E
2264
00.0
0 E
6303200.00 N 6303200.00 N
6304000.00 N 6304000.00 N
6304800.00 N 6304800.00 N
N
920.00
920.00
940.00
950.
00
950.
00
960.00
BEN BULLEN STATE FOREST
BEN BULLEN STATE FOREST
CCL 733CCL 733
CCL 733
CCL 733
ML 1448
ML 1448
LEGEND
- REJECT EMPLACEMENT AREA NOT BACKFILLED
- INFRASTRUCTURE AREA NEXT PERIOD
- TOPSOIL AND CAPPING STOCKPILES
- SURFACE WATER MANAGEMENT STRUCTURES
- PRODUCT STOCKPILE AREAS
- PREVIOUSLY REHABILITATED AND UNDER MAINTENANCE
- CONSENT BOUNDARY COUNCIL WASTE TRANSFER FACILITY
- REHABILITATED SLOPES GREATER THAN 18 DEGREES
- AREA TO BE TRANSFERED TO DELTA FOR ASH PLACEMENT IN 2015
15
2240
00.0
0 E
2248
00.0
0 E
2256
00.0
0 E
2264
00.0
0 E
6303200.00 N 6303200.00 N
6304000.00 N 6304000.00 N
6304800.00 N 6304800.00 N
N
0 200 400
SCALE 1 : 8000 CONTOUR INTERVAL 10 METRES
NOTE ALL AREAS NOT SHOWN / IDENTIFIED AS SHADED ARE NATURALSURFACES NEVER DISTURBED BY MINING ACTIVITIES
AREA TRANSFERRED TO LITHGOW COUNCIL FOR WASTE TRANSFER STATION 47.9 Ha. (Note; includes area on southern side of access road shown as rehab under maintenance on this paln.)
SPRINGVALE COAL SERVICES / LAMBERTS GULLY OPEN CUT
REHABILITATION PLAN
REHABILITATION UNDER MAINTENANCE FROM OPEN CUT OPERATIONS PRIOR TO LAMBERTS GULLY
11/02/2014
AREA TO BE TRANSFERRED TO DELTA FOR ASH PLACEMENT IN 2015 30.8 Ha.
CRAVEN, ELLISTON & HAYES (LITHGOW) PTY LIMITEDCONSULTING LAND, ENGINEERING & MINING SURVEYORS
"Astrolabe", Rutherford Lane, Lithgow, NSW, 2790Phone: (02) 6351 2281 Fax: (02) 6352 1339 Email: [email protected] SCALE - DATUM: MGA (Zone 56) / AHD1:8000
DRAWING No:24/02/2011
TE / GM
GM
R HUNT
DATE
AMENDED
SURVEYOR
DRAWN
CHECKED
Border size = 370mm x 267mm on A3 paper.
CCAD6 JOB & DWG:LG AEMR5-13 - AEMR5-13
PLAN 5
2240
00.0
0 E
2248
00.0
0 E
2256
00.0
0 E
2264
00.0
0 E
6303200.00 N 6303200.00 N
6304000.00 N 6304000.00 N
6304800.00 N 6304800.00 N
N
Appendix 6
Figures
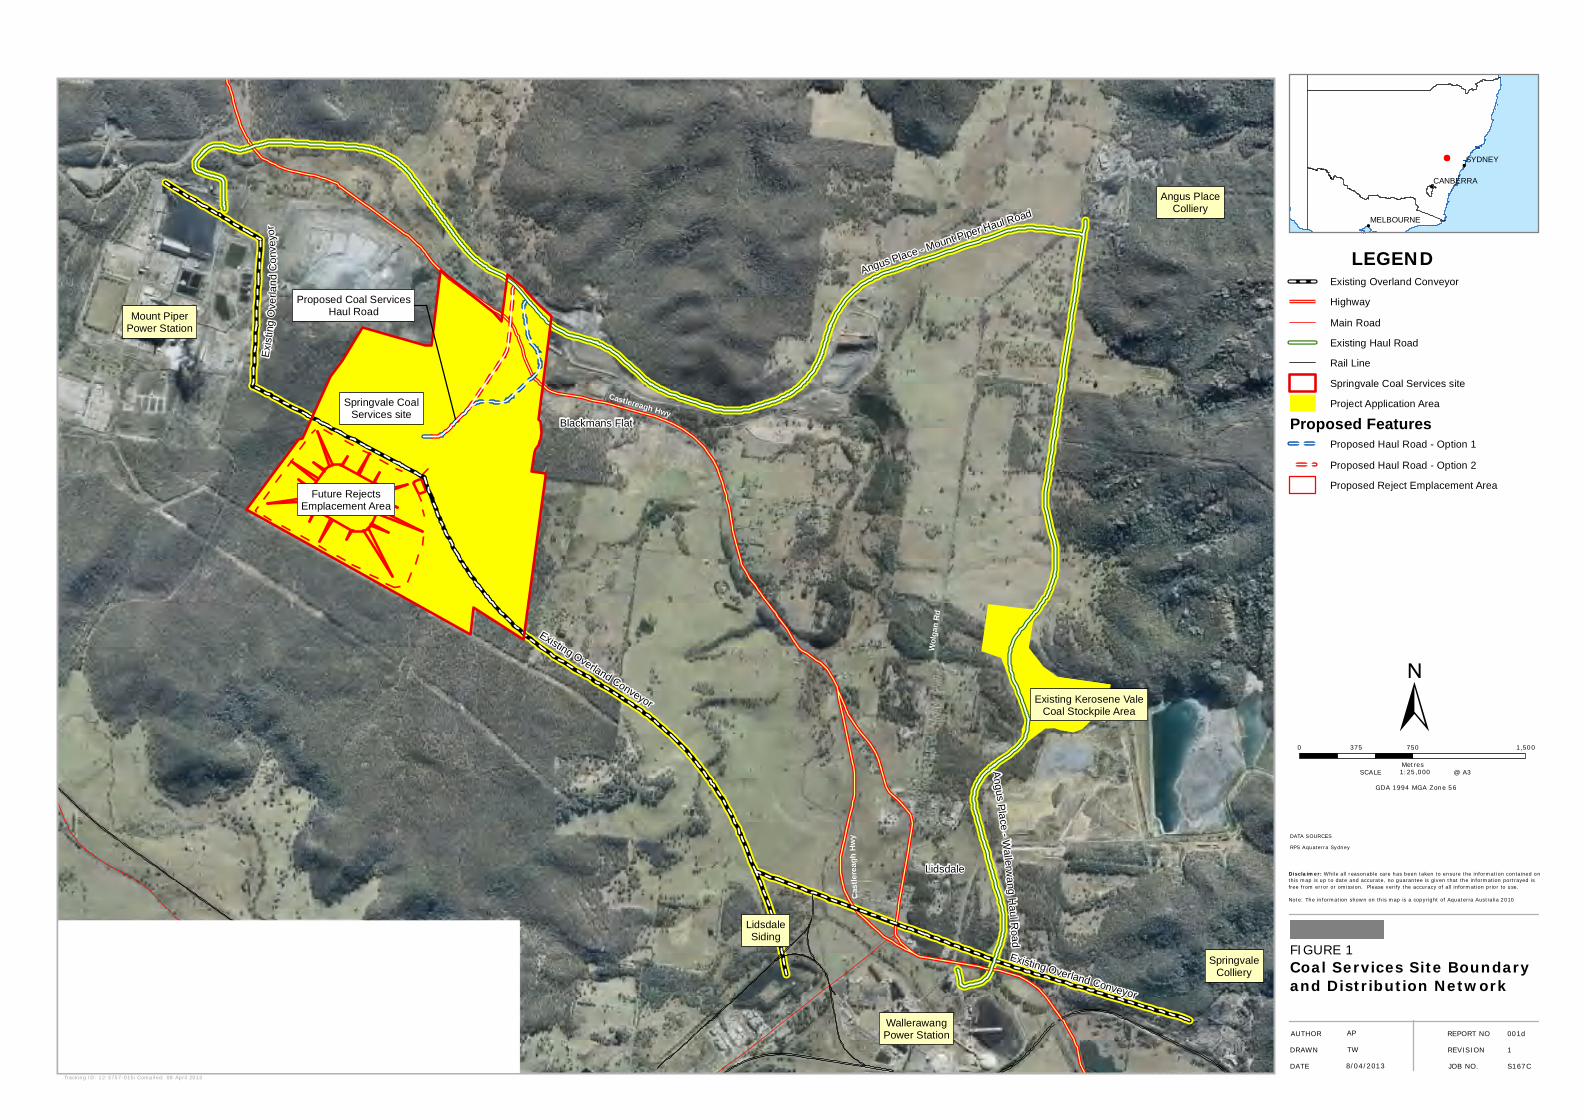
Tracking ID: 12-3757-015i Compiled: 08 April 2013
0 750 1,500375
Metres
!
!
!SYDNEY
CANBERRA
MELBOURNE
Springvale CoalServices site
Angus PlaceColliery
SpringvaleColliery
LidsdaleSiding
WallerawangPower Station
Mount PiperPower Station
Lidsdale
Blackmans Flat
Proposed Coal ServicesHaul Road
Existing Kerosene ValeCoal Stockpile Area
Future RejectsEmplacement Area
Existing Overland Conveyor
Exi
stin
g O
verl a
nd
Co
nve
yor
Angus Place - Mount Piper Haul Road
Angus
Pla
ce -
Wallerw
ang
Haul R
o ad
Wolga
n Rd
Pipers Flat Rd
Castl
ereag
h Hwy
Castlereagh Hwy
Existing Overland Conveyor
±
FIGURE 1Coal Services Site Boundaryand Distribution Network
LEGENDExisting Overland Conveyor
Highway
Main Road
Existing Haul Road
Rail Line
Springvale Coal Services site
Project Application Area
Proposed FeaturesProposed Haul Road - Option 1
Proposed Haul Road - Option 2
Proposed Reject Emplacement Area
DATA SOURCES
AUTHORDRAWNDATE JOB NO.
APTW8/04/2013 S167C
REPORT NO REVISION
SCALE
001d1
RPS Aquaterra Sydney
@ A3
Disclaimer: While all reasonable care has been taken to ensure the information contained onthis map is up to date and accurate, no guarantee is given that the information portrayed isfree from error or omission. Please verify the accuracy of all information prior to use.
Note: The information shown on this map is a copyright of Aquaterra Australia 2010
1:25,000GDA 1994 MGA Zone 56
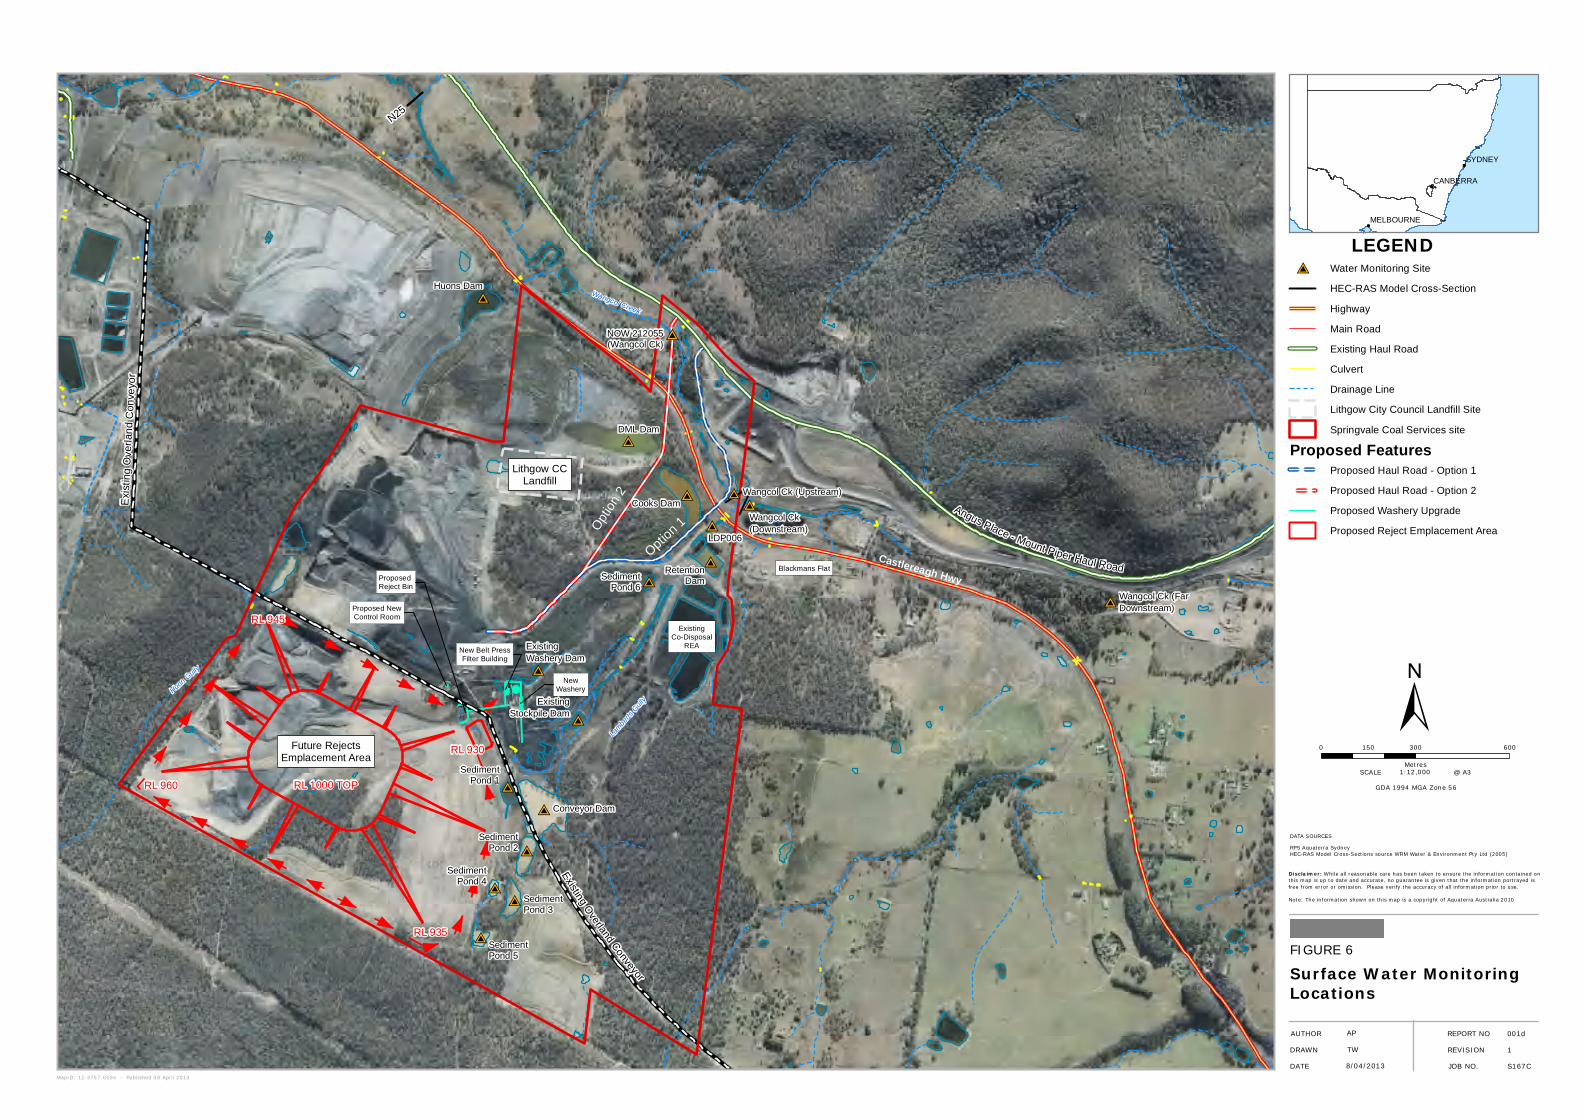
MapID: 12-3757-003e - Published 08 April 2013
0 300 600150
Metres
!
!
!SYDNEY
CANBERRA
MELBOURNE
#V
#V#V
#V
#V
#V
#V
#V
#V
#V#V
#V
#V
#V
#V
#V
#V
#V
Wangcol Creek
Huon Gully
Lamber
ts Gully
Blackmans Flat
NewWashery
ExistingCo-Disposal
REA
Proposed NewControl Room
New Belt PressFilter Building
Proposed Reject Bin
Option
1Opt
ion
2
Future RejectsEmplacement Area
RL 960 RL 1000 TOP
RL 935
RL 930
RL 945
Castlereagh Hwy
LDP006
Wangcol Ck (Upstream)
Wangcol Ck(Downstream)
NOW 212055(Wangcol Ck)
Cooks Dam
RetentionDam
Conveyor Dam
SedimentPond 1
SedimentPond 2
SedimentPond 3
SedimentPond 4
SedimentPond 5
SedimentPond 6
DML Dam
Huons Dam
ExistingWashery Dam
ExistingStockpile Dam
Wangcol Ck (FarDownstream)
Existing
Overland
Conveyor
Exi
sti n
g O
ver l
and
Con
veyo
r
Angus Place - Mount Piper Haul Road
N25
Lithgow CCLandfill
±
FIGURE 6Surface Water MonitoringLocations
LEGEND#V Water Monitoring Site
HEC-RAS Model Cross-Section
Highway
Main Road
Existing Haul Road
Culvert
Drainage Line
Lithgow City Council Landfill Site
Springvale Coal Services site
Proposed FeaturesProposed Haul Road - Option 1
Proposed Haul Road - Option 2
Proposed Washery Upgrade
Proposed Reject Emplacement Area
DATA SOURCES
AUTHORDRAWNDATE JOB NO.
APTW8/04/2013 S167C
REPORT NO REVISION
SCALE
001d1
RPS Aquaterra SydneyHEC-RAS Model Cross-Sections source WRM Water & Environment Pty Ltd (2005)
@ A3
Disclaimer: While all reasonable care has been taken to ensure the information contained onthis map is up to date and accurate, no guarantee is given that the information portrayed isfree from error or omission. Please verify the accuracy of all information prior to use.
Note: The information shown on this map is a copyright of Aquaterra Australia 2010
1:12,000GDA 1994 MGA Zone 56
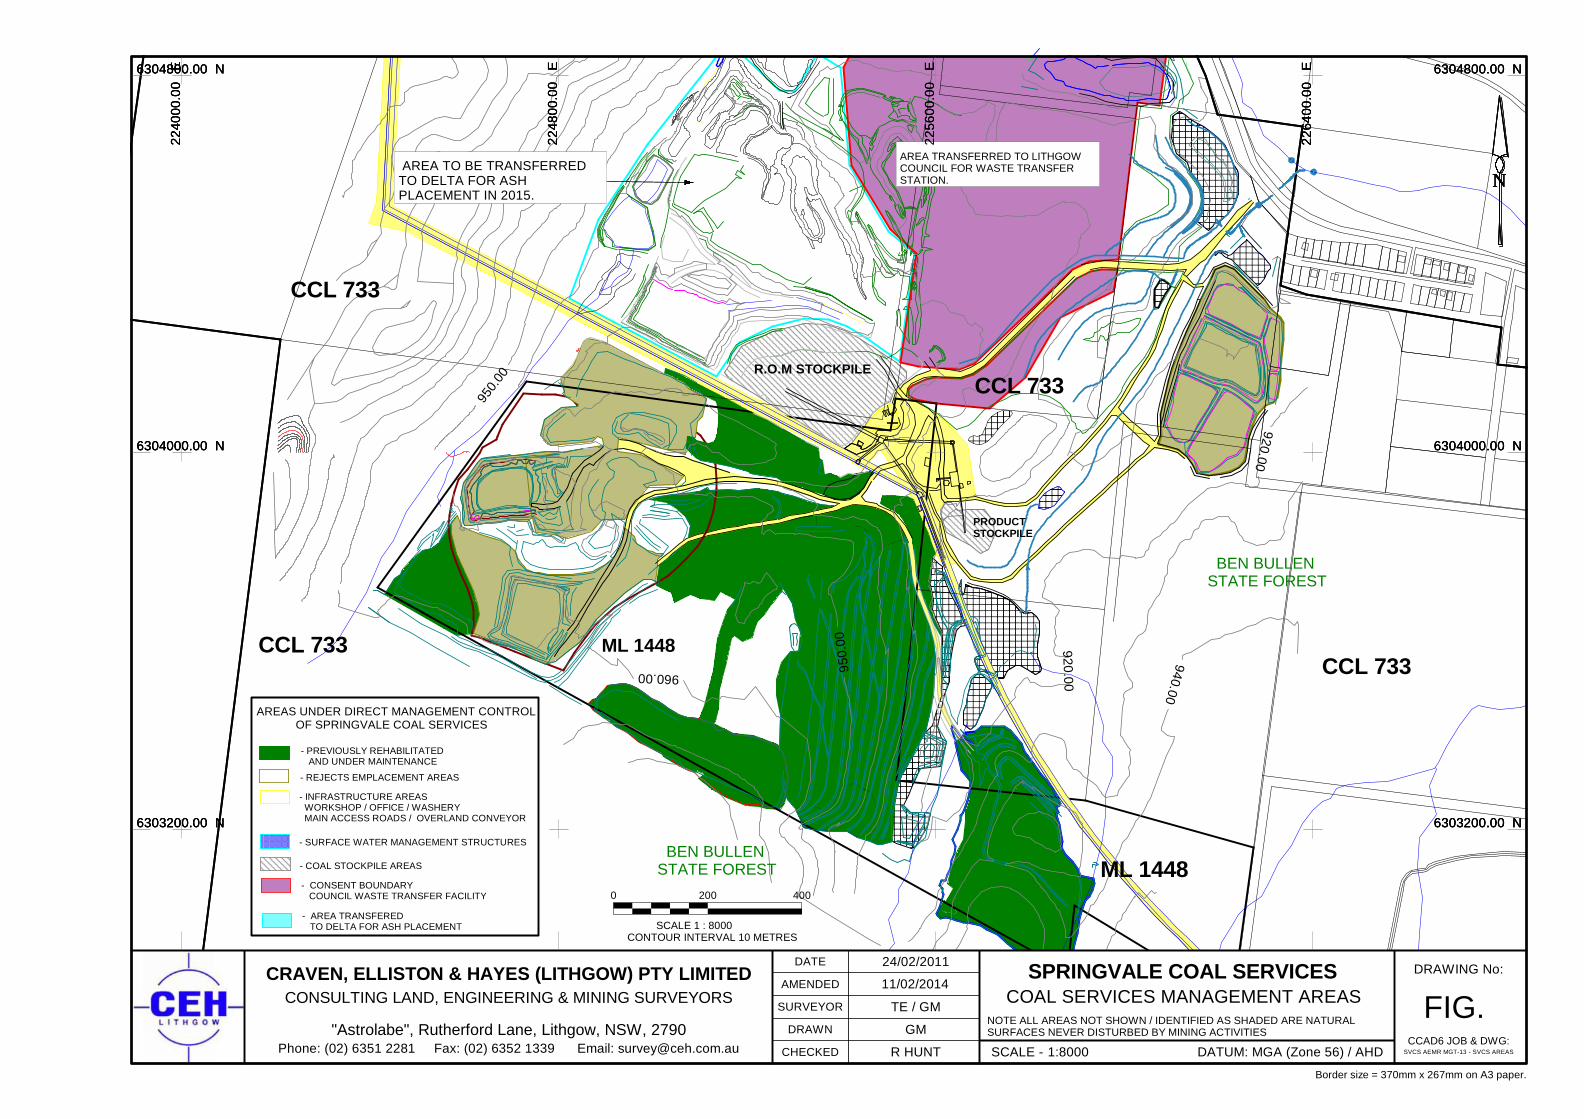
2240
00.0
0 E
2248
00.0
0 E
2256
00.0
0 E
2264
00.0
0 E
6303200.00 N 6303200.00 N
6304000.00 N 6304000.00 N
6304800.00 N 6304800.00 N
N
920.00
920.00
940.00
950.
00
950.
00
960.00
BEN BULLEN STATE FOREST
BEN BULLEN STATE FOREST
CCL 733CCL 733
CCL 733
ML 1448
CCL 733
ML 1448
AREAS UNDER DIRECT MANAGEMENT CONTROL OF SPRINGVALE COAL SERVICES
- REJECTS EMPLACEMENT AREAS
- INFRASTRUCTURE AREAS WORKSHOP / OFFICE / WASHERY MAIN ACCESS ROADS / OVERLAND CONVEYOR
- SURFACE WATER MANAGEMENT STRUCTURES
- COAL STOCKPILE AREAS
- CONSENT BOUNDARY COUNCIL WASTE TRANSFER FACILITY
- AREA TRANSFERED TO DELTA FOR ASH PLACEMENT
- PREVIOUSLY REHABILITATED AND UNDER MAINTENANCE
R.O.M STOCKPILE
PRODUCTSTOCKPILE
15
2240
00.0
0 E
2248
00.0
0 E
2256
00.0
0 E
2264
00.0
0 E
6303200.00 N 6303200.00 N
6304000.00 N 6304000.00 N
6304800.00 N 6304800.00 N
N
0 200 400
SCALE 1 : 8000 CONTOUR INTERVAL 10 METRES
NOTE ALL AREAS NOT SHOWN / IDENTIFIED AS SHADED ARE NATURALSURFACES NEVER DISTURBED BY MINING ACTIVITIES
AREA TRANSFERRED TO LITHGOW COUNCIL FOR WASTE TRANSFER STATION.
SPRINGVALE COAL SERVICESCOAL SERVICES MANAGEMENT AREAS
AREA TO BE TRANSFERRED TO DELTA FOR ASH PLACEMENT IN 2015.
11/02/2014CRAVEN, ELLISTON & HAYES (LITHGOW) PTY LIMITED
CONSULTING LAND, ENGINEERING & MINING SURVEYORS
"Astrolabe", Rutherford Lane, Lithgow, NSW, 2790Phone: (02) 6351 2281 Fax: (02) 6352 1339 Email: [email protected] SCALE - DATUM: MGA (Zone 56) / AHD1:8000
DRAWING No:24/02/2011
TE / GM
GM
R HUNT
DATE
AMENDED
SURVEYOR
DRAWN
CHECKED
Border size = 370mm x 267mm on A3 paper.
CCAD6 JOB & DWG:SVCS AEMR MGT-13 - SVCS AREAS
FIG.
2240
00.0
0 E
2248
00.0
0 E
2256
00.0
0 E
2264
00.0
0 E
6303200.00 N 6303200.00 N
6304000.00 N 6304000.00 N
6304800.00 N 6304800.00 N
N