Embed Size (px)
Citation preview
Volume 1 Issue 1 2008 Hyderabad Pages 32 July
Spurt in Crude Oil Prices - Reasons & Repercussions
Spurt in Crude Oil Prices - Reasons & Repercussions
Karvy Comtrade's Invest and Harvest
A C o m p r e h e n s i v e E n g l i s h M o n t h l y M a g a z i n e o n C o m m o d i t y F u t u r e s
Article - ATF
Article - Monsoon
Bullion & Metals Review
Agri Market Review & Outlook
National Spot Exchange
Article - ATF
National Spot Exchange
Article - Monsoon
Bullion & Metals Review
Agri Market Review & Outlook

Editorial |
Dear Reader,
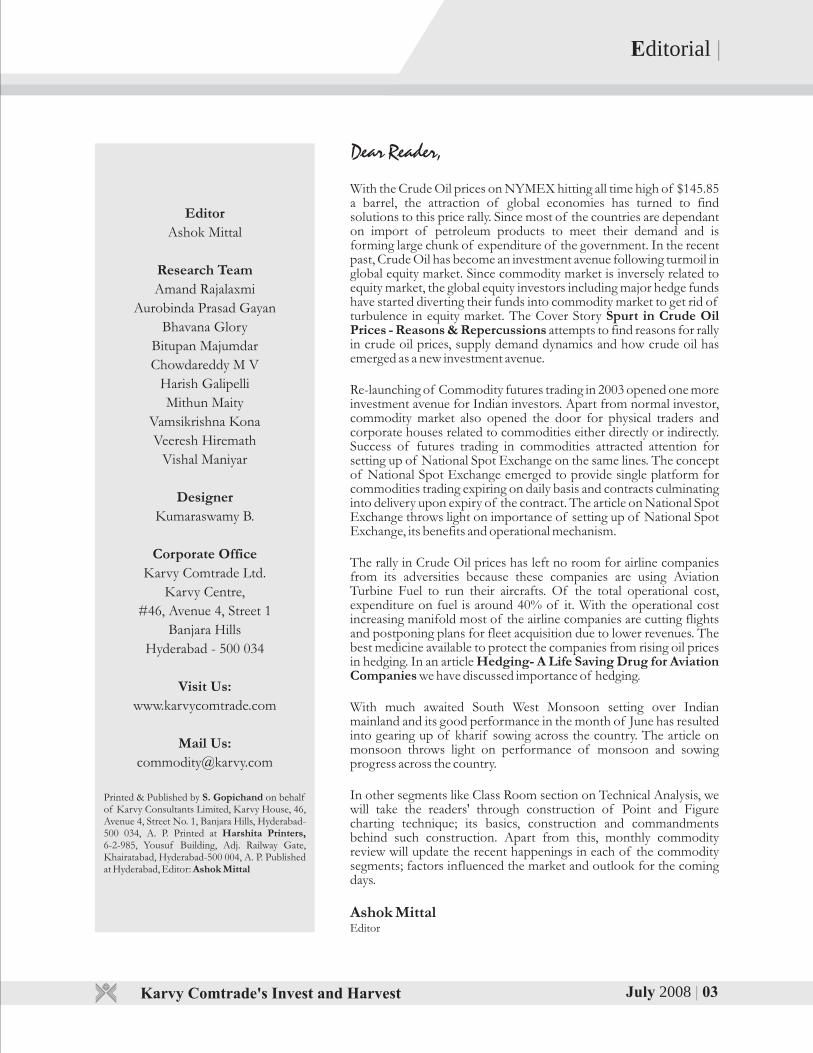
With the Crude Oil prices on NYMEX hitting all time high of $145.85 a barrel, the attraction of global economies has turned to find solutions to this price rally. Since most of the countries are dependant on import of petroleum products to meet their demand and is forming large chunk of expenditure of the government. In the recent past, Crude Oil has become an investment avenue following turmoil in global equity market. Since commodity market is inversely related to equity market, the global equity investors including major hedge funds have started diverting their funds into commodity market to get rid of turbulence in equity market. The Cover Story Spurt in Crude Oil Prices - Reasons & Repercussions attempts to find reasons for rally in crude oil prices, supply demand dynamics and how crude oil has emerged as a new investment avenue.
Re-launching of Commodity futures trading in 2003 opened one more investment avenue for Indian investors. Apart from normal investor, commodity market also opened the door for physical traders and corporate houses related to commodities either directly or indirectly. Success of futures trading in commodities attracted attention for setting up of National Spot Exchange on the same lines. The concept of National Spot Exchange emerged to provide single platform for commodities trading expiring on daily basis and contracts culminating into delivery upon expiry of the contract. The article on National Spot Exchange throws light on importance of setting up of National Spot Exchange, its benefits and operational mechanism.
The rally in Crude Oil prices has left no room for airline companies from its adversities because these companies are using Aviation Turbine Fuel to run their aircrafts. Of the total operational cost, expenditure on fuel is around 40% of it. With the operational cost increasing manifold most of the airline companies are cutting flights and postponing plans for fleet acquisition due to lower revenues. The best medicine available to protect the companies from rising oil prices in hedging. In an article Hedging- A Life Saving Drug for Aviation Companies we have discussed importance of hedging.
With much awaited South West Monsoon setting over Indian mainland and its good performance in the month of June has resulted into gearing up of kharif sowing across the country. The article on monsoon throws light on performance of monsoon and sowing progress across the country.
In other segments like Class Room section on Technical Analysis, we will take the readers' through construction of Point and Figure charting technique; its basics, construction and commandments behind such construction. Apart from this, monthly commodity review will update the recent happenings in each of the commodity segments; factors influenced the market and outlook for the coming days.
Ashok MittalEditor
July 2008 | 03
Editor
Ashok Mittal
Research Team
Amand Rajalaxmi
Aurobinda Prasad Gayan
Bhavana Glory
Bitupan Majumdar
Chowdareddy M V
Harish Galipelli
Mithun Maity
Vamsikrishna Kona
Veeresh Hiremath
Vishal Maniyar
Designer
Kumaraswamy B.
Corporate Office
Karvy Comtrade Ltd.
Karvy Centre,
#46, Avenue 4, Street 1
Banjara Hills
Hyderabad - 500 034
Visit Us:
www.karvycomtrade.com
Mail Us:
Printed & Published by S. Gopichand on behalf of Karvy Consultants Limited, Karvy House, 46, Avenue 4, Street No. 1, Banjara Hills, Hyderabad-500 034, A. P. Printed at Harshita Printers, 6-2-985, Yousuf Building, Adj. Railway Gate, Khairatabad, Hyderabad-500 004, A. P. Published at Hyderabad, Editor: Ashok Mittal
Invest & Harvest March 2008 15| “Karvy Centre”, 46, Avenue 4, Street No.1, Banjara Hills, Hyderabad - 500 034.Tel: 040-23388707/23431569/23440653, Fax : 040 - 6625 9955.
An ISO 9001:2000 company
When you trade with Karvy, you trade with a trusted name in the Commodities Market.
Visit us at: www.karvycomtrade.com, email: [email protected]
It’s all about turning the right opportunity into gold
COMTRADE LIMITED
Karvy Comtrade's Invest and Harvest
The Karvy Advantages
Member of NCDEX and MCXNational networkPersonalized servicesBacked by researchSMS alertsDealing facility during night sessionsSingle access number anywhere in India
Editorial |
Dear Reader,
With the Crude Oil prices on NYMEX hitting all time high of $145.85 a barrel, the attraction of global economies has turned to find solutions to this price rally. Since most of the countries are dependant on import of petroleum products to meet their demand and is forming large chunk of expenditure of the government. In the recent past, Crude Oil has become an investment avenue following turmoil in global equity market. Since commodity market is inversely related to equity market, the global equity investors including major hedge funds have started diverting their funds into commodity market to get rid of turbulence in equity market. The Cover Story Spurt in Crude Oil Prices - Reasons & Repercussions attempts to find reasons for rally in crude oil prices, supply demand dynamics and how crude oil has emerged as a new investment avenue.
Re-launching of Commodity futures trading in 2003 opened one more investment avenue for Indian investors. Apart from normal investor, commodity market also opened the door for physical traders and corporate houses related to commodities either directly or indirectly. Success of futures trading in commodities attracted attention for setting up of National Spot Exchange on the same lines. The concept of National Spot Exchange emerged to provide single platform for commodities trading expiring on daily basis and contracts culminating into delivery upon expiry of the contract. The article on National Spot Exchange throws light on importance of setting up of National Spot Exchange, its benefits and operational mechanism.
The rally in Crude Oil prices has left no room for airline companies from its adversities because these companies are using Aviation Turbine Fuel to run their aircrafts. Of the total operational cost, expenditure on fuel is around 40% of it. With the operational cost increasing manifold most of the airline companies are cutting flights and postponing plans for fleet acquisition due to lower revenues. The best medicine available to protect the companies from rising oil prices in hedging. In an article Hedging- A Life Saving Drug for Aviation Companies we have discussed importance of hedging.
With much awaited South West Monsoon setting over Indian mainland and its good performance in the month of June has resulted into gearing up of kharif sowing across the country. The article on monsoon throws light on performance of monsoon and sowing progress across the country.
In other segments like Class Room section on Technical Analysis, we will take the readers' through construction of Point and Figure charting technique; its basics, construction and commandments behind such construction. Apart from this, monthly commodity review will update the recent happenings in each of the commodity segments; factors influenced the market and outlook for the coming days.
Ashok MittalEditor
July 2008 | 03
Editor
Ashok Mittal
Research Team
Amand Rajalaxmi
Aurobinda Prasad Gayan
Bhavana Glory
Bitupan Majumdar
Chowdareddy M V
Harish Galipelli
Mithun Maity
Vamsikrishna Kona
Veeresh Hiremath
Vishal Maniyar
Designer
Kumaraswamy B.
Corporate Office
Karvy Comtrade Ltd.
Karvy Centre,
#46, Avenue 4, Street 1
Banjara Hills
Hyderabad - 500 034
Visit Us:
www.karvycomtrade.com
Mail Us:
Printed & Published by S. Gopichand on behalf of Karvy Consultants Limited, Karvy House, 46, Avenue 4, Street No. 1, Banjara Hills, Hyderabad-500 034, A. P. Printed at Harshita Printers, 6-2-985, Yousuf Building, Adj. Railway Gate, Khairatabad, Hyderabad-500 004, A. P. Published at Hyderabad, Editor: Ashok Mittal
Invest & Harvest March 2008 15| “Karvy Centre”, 46, Avenue 4, Street No.1, Banjara Hills, Hyderabad - 500 034.Tel: 040-23388707/23431569/23440653, Fax : 040 - 6625 9955.
An ISO 9001:2000 company
When you trade with Karvy, you trade with a trusted name in the Commodities Market.
Visit us at: www.karvycomtrade.com, email: [email protected]
It’s all about turning the right opportunity into gold
COMTRADE LIMITED
Karvy Comtrade's Invest and Harvest
The Karvy Advantages
Member of NCDEX and MCXNational networkPersonalized servicesBacked by researchSMS alertsDealing facility during night sessionsSingle access number anywhere in India
Cover Story |
July 02008 5|
Spurt in Crude Oil Prices - Reasons & Repercussions
uman beings are selfish by Nature. According Hto Adam Smith, founder of Capitalism, if each
and every individual tries to maximize their welfare,
then the social welfare will be maximized. Few of us
may not agree with this view as we still believe in a
socialist action. The recent oil price spike explains
basic human behavior - profit motive or in social
term - welfare. From a country perspective, we need
energy resources to sustain in a globalized world.
But the concern is how much oil is left to consume
and how long we can sustain the growth? Many
Capitalists write, the increased consumption in
India and China is leading to supply demand
mismatch in Crude oil. However, if we look at
figures, India and China consume 10% and 36%
respectively of what USA as a country consumes.
However, China and India are the drivers of Asian
growth story and most importantly they need
energy resources to sustain the level. But when the
energy resources are very highly priced it is difficult
for a developing country to look at its country's
balance sheet and adjust the items.
West Texas light crude oil prices rose to historic
highs of $145.85 per barrel after a series of geo-
political tensions stir up in Nigeria, Iraq, Turkey,
Iran and Venezuela and increasing investment flows
into commodities segment. Now, at a time when
entire world economy is struggling to curtail the
inflation caused by higher oil prices, it would be
important to understand the causes of this rally and
possible future course of action.
What caused the price rally? The price of any commodity is determined by
assessing the demand – supply situation and the
perception of market participants. To understand
the rally in Crude prices, we must also look at the
activity of market participants like commercials and
non commercials along with the supply-demand
dynamics. The oil supply side can be determined by
considering two cartels, The OPEC and Non
OPEC.
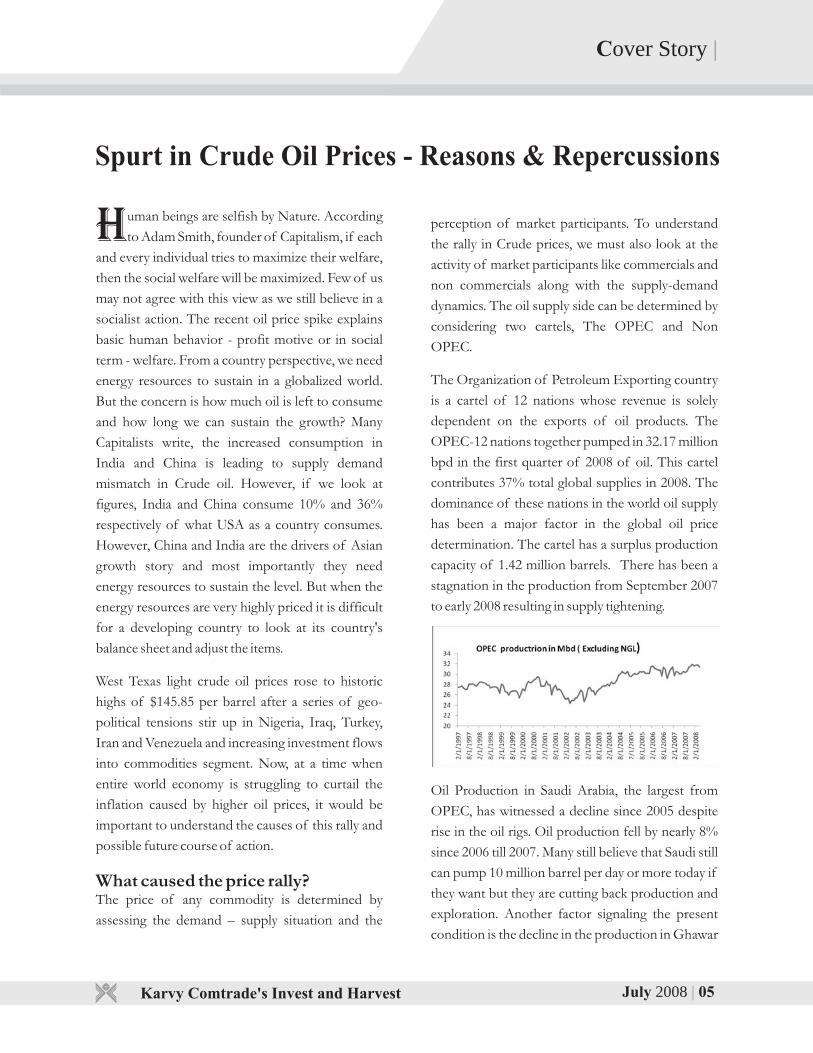
The Organization of Petroleum Exporting country
is a cartel of 12 nations whose revenue is solely
dependent on the exports of oil products. The
OPEC-12 nations together pumped in 32.17 million
bpd in the first quarter of 2008 of oil. This cartel
contributes 37% total global supplies in 2008. The
dominance of these nations in the world oil supply
has been a major factor in the global oil price
determination. The cartel has a surplus production
capacity of 1.42 million barrels. There has been a
stagnation in the production from September 2007
to early 2008 resulting in supply tightening.
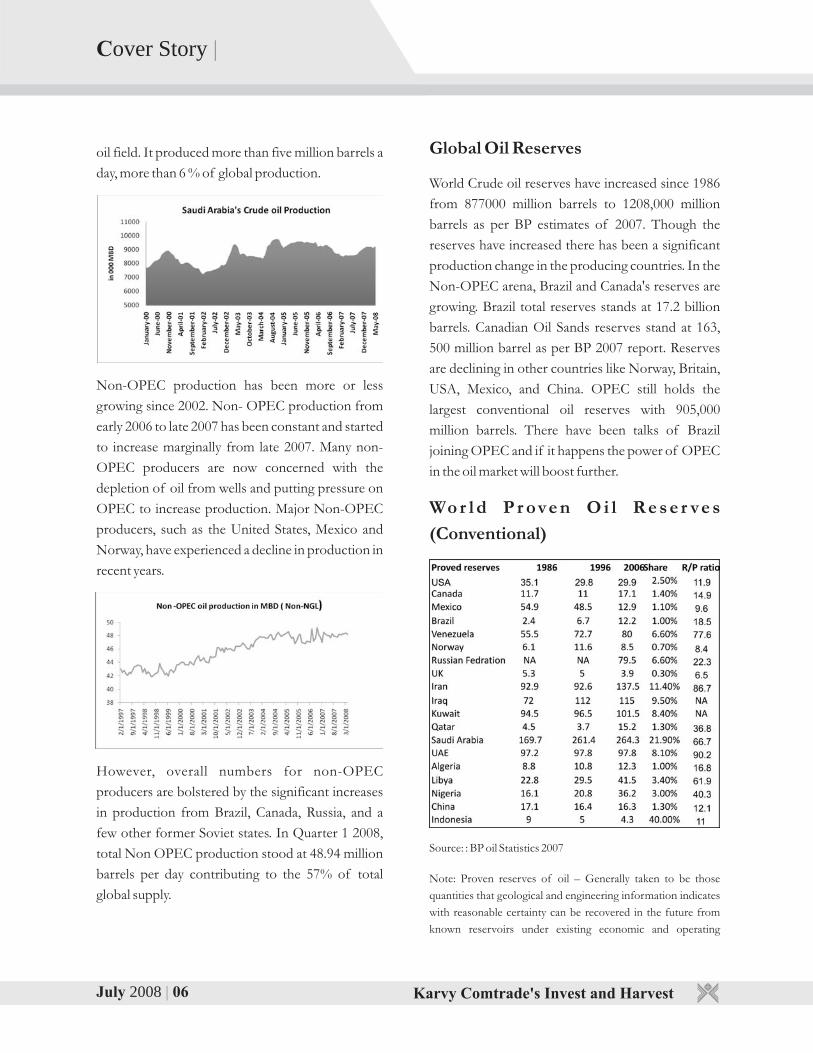
Oil Production in Saudi Arabia, the largest from
OPEC, has witnessed a decline since 2005 despite
rise in the oil rigs. Oil production fell by nearly 8%
since 2006 till 2007. Many still believe that Saudi still
can pump 10 million barrel per day or more today if
they want but they are cutting back production and
exploration. Another factor signaling the present
condition is the decline in the production in Ghawar
Contents |
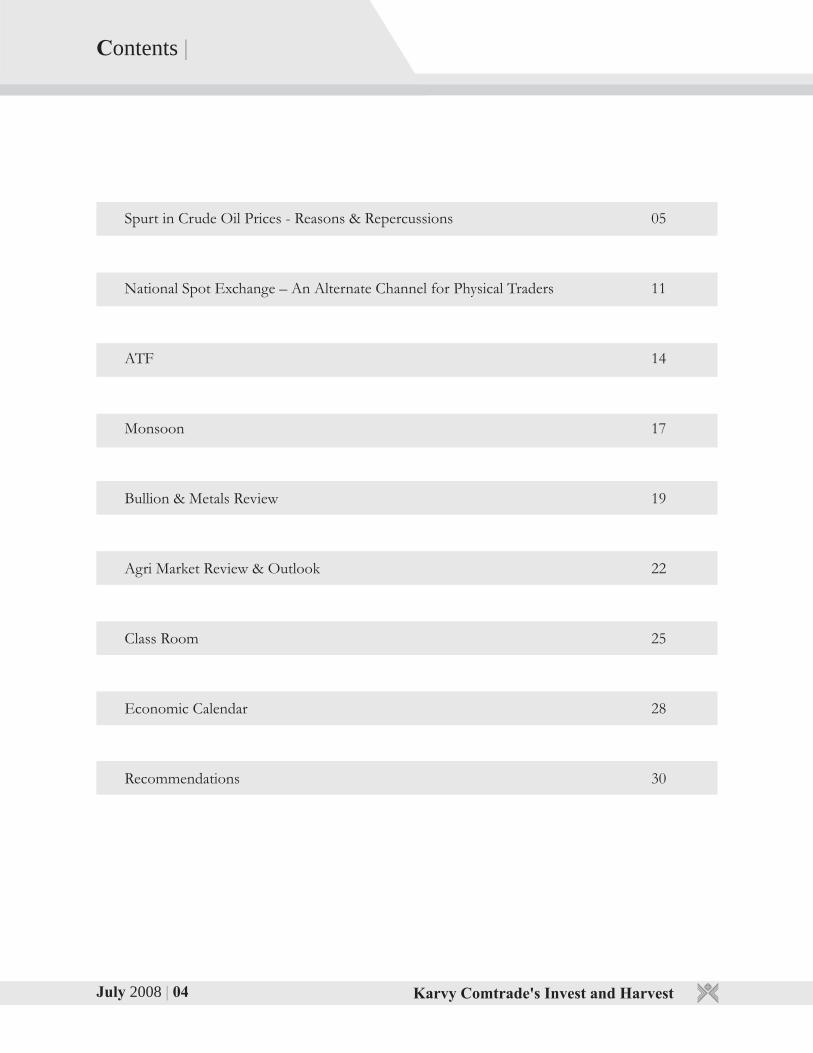
Spurt in Crude Oil Prices - Reasons & Repercussions 05
National Spot Exchange – An Alternate Channel for Physical Traders 11
ATF 14
Monsoon 17
Bullion & Metals Review 19
Agri Market Review & Outlook 22
Class Room 25
Economic Calendar 28
Recommendations 30
July 2008 04| Karvy Comtrade's Invest and Harvest Karvy Comtrade's Invest and Harvest
Cover Story |
July 02008 5|
Spurt in Crude Oil Prices - Reasons & Repercussions
uman beings are selfish by Nature. According Hto Adam Smith, founder of Capitalism, if each
and every individual tries to maximize their welfare,
then the social welfare will be maximized. Few of us
may not agree with this view as we still believe in a
socialist action. The recent oil price spike explains
basic human behavior - profit motive or in social
term - welfare. From a country perspective, we need
energy resources to sustain in a globalized world.
But the concern is how much oil is left to consume
and how long we can sustain the growth? Many
Capitalists write, the increased consumption in
India and China is leading to supply demand
mismatch in Crude oil. However, if we look at
figures, India and China consume 10% and 36%
respectively of what USA as a country consumes.
However, China and India are the drivers of Asian
growth story and most importantly they need
energy resources to sustain the level. But when the
energy resources are very highly priced it is difficult
for a developing country to look at its country's
balance sheet and adjust the items.
West Texas light crude oil prices rose to historic
highs of $145.85 per barrel after a series of geo-
political tensions stir up in Nigeria, Iraq, Turkey,
Iran and Venezuela and increasing investment flows
into commodities segment. Now, at a time when
entire world economy is struggling to curtail the
inflation caused by higher oil prices, it would be
important to understand the causes of this rally and
possible future course of action.
What caused the price rally? The price of any commodity is determined by
assessing the demand – supply situation and the
perception of market participants. To understand
the rally in Crude prices, we must also look at the
activity of market participants like commercials and
non commercials along with the supply-demand
dynamics. The oil supply side can be determined by
considering two cartels, The OPEC and Non
OPEC.
The Organization of Petroleum Exporting country
is a cartel of 12 nations whose revenue is solely
dependent on the exports of oil products. The
OPEC-12 nations together pumped in 32.17 million
bpd in the first quarter of 2008 of oil. This cartel
contributes 37% total global supplies in 2008. The
dominance of these nations in the world oil supply
has been a major factor in the global oil price
determination. The cartel has a surplus production
capacity of 1.42 million barrels. There has been a
stagnation in the production from September 2007
to early 2008 resulting in supply tightening.
Oil Production in Saudi Arabia, the largest from
OPEC, has witnessed a decline since 2005 despite
rise in the oil rigs. Oil production fell by nearly 8%
since 2006 till 2007. Many still believe that Saudi still
can pump 10 million barrel per day or more today if
they want but they are cutting back production and
exploration. Another factor signaling the present
condition is the decline in the production in Ghawar
Contents |
Spurt in Crude Oil Prices - Reasons & Repercussions 05
National Spot Exchange – An Alternate Channel for Physical Traders 11
ATF 14
Monsoon 17
Bullion & Metals Review 19
Agri Market Review & Outlook 22
Class Room 25
Economic Calendar 28
Recommendations 30
July 2008 04| Karvy Comtrade's Invest and Harvest Karvy Comtrade's Invest and Harvest
July 02008 7|
Cover Story |
conditions. Reserves-to-production (R/P) ratio– If the
reserves remaining at the end of any year are divided by the
production in that year, the result is the length of time that those
remaining reserves would last if production were to continue at
that rate.
Ceteris paribus the proven conventional oil reserves
can serve the world one more century with present
production capacity. However, there can be likely
addition in the oil reserves in the coming days with
advancement of technology and rise in the prices.
And at the same time we may see a growing
popularity of other alternative sources of energy
with crude oil as a scare resource.
Demand Dynamics
Like Supply, demand for Crude oil has witnessed
sharp increase in the last three decades. Overall,
Global Oil demand has increased by nearly 11.40%
since 2000, 28% since 1990 and more than 80%
since 1970.
Crude oil demand from 2003 has increased annually
by 1.68 %. Demand from OECD countries
increased by 0.13 % and 3.98 % from Non-OECD
countries. Major growth is seen from China where
demand averaged at 7.20 million barrels per day in
2007 with CAGR of 7.51 % since 2003. Demand
from USA the world largest consumer averaged at
20.70 million barrels per day in 2007 with a CAGR
of marginal 0.63%.
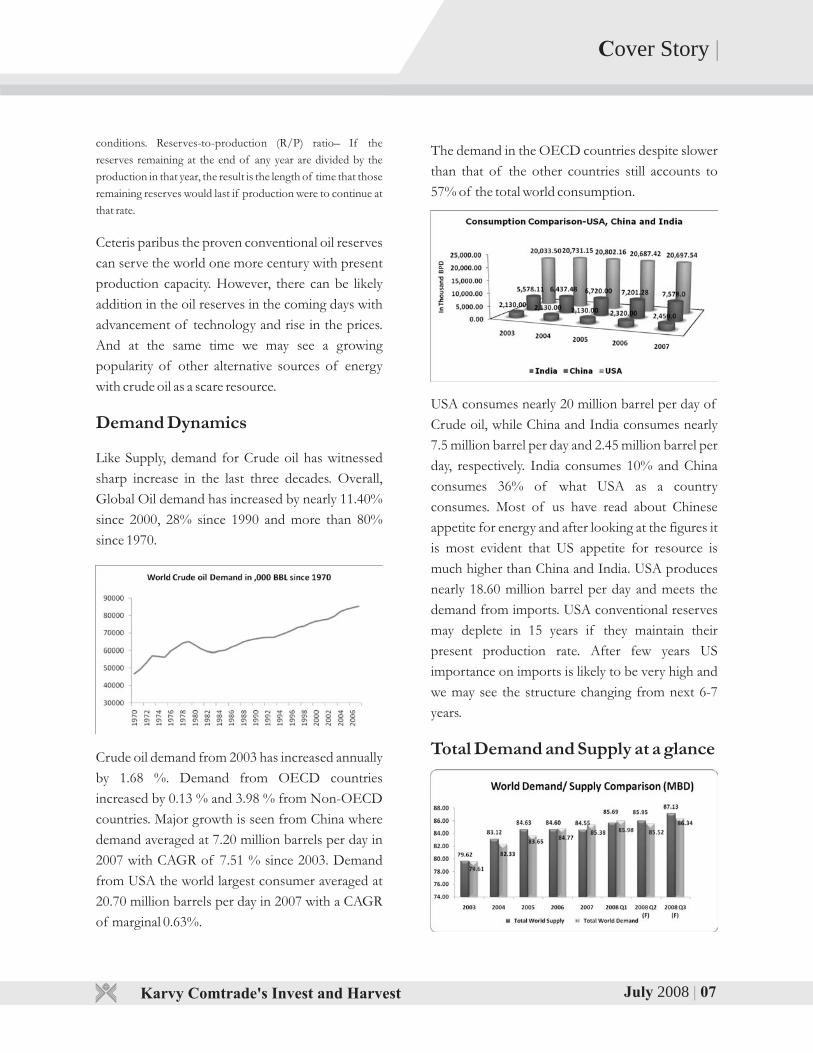
The demand in the OECD countries despite slower
than that of the other countries still accounts to
57% of the total world consumption.
USA consumes nearly 20 million barrel per day of
Crude oil, while China and India consumes nearly
7.5 million barrel per day and 2.45 million barrel per
day, respectively. India consumes 10% and China
consumes 36% of what USA as a country
consumes. Most of us have read about Chinese
appetite for energy and after looking at the figures it
is most evident that US appetite for resource is
much higher than China and India. USA produces
nearly 18.60 million barrel per day and meets the
demand from imports. USA conventional reserves
may deplete in 15 years if they maintain their
present production rate. After few years US
importance on imports is likely to be very high and
we may see the structure changing from next 6-7
years.
Total Demand and Supply at a glance
Cover Story |
oil field. It produced more than five million barrels a
day, more than 6 % of global production.
Non-OPEC production has been more or less
growing since 2002. Non- OPEC production from
early 2006 to late 2007 has been constant and started
to increase marginally from late 2007. Many non-
OPEC producers are now concerned with the
depletion of oil from wells and putting pressure on
OPEC to increase production. Major Non-OPEC
producers, such as the United States, Mexico and
Norway, have experienced a decline in production in
recent years.
However, overall numbers for non-OPEC
producers are bolstered by the significant increases
in production from Brazil, Canada, Russia, and a
few other former Soviet states. In Quarter 1 2008,
total Non OPEC production stood at 48.94 million
barrels per day contributing to the 57% of total
global supply.
Global Oil Reserves
World Crude oil reserves have increased since 1986
from 877000 million barrels to 1208,000 million
barrels as per BP estimates of 2007. Though the
reserves have increased there has been a significant
production change in the producing countries. In the
Non-OPEC arena, Brazil and Canada's reserves are
growing. Brazil total reserves stands at 17.2 billion
barrels. Canadian Oil Sands reserves stand at 163,
500 million barrel as per BP 2007 report. Reserves
are declining in other countries like Norway, Britain,
USA, Mexico, and China. OPEC still holds the
largest conventional oil reserves with 905,000
million barrels. There have been talks of Brazil
joining OPEC and if it happens the power of OPEC
in the oil market will boost further.
Wo r l d P r ove n O i l Re s e r ve s
(Conventional)
Source:
Note: Proven reserves of oil – Generally taken to be those
quantities that geological and engineering information indicates
with reasonable certainty can be recovered in the future from
known reservoirs under existing economic and operating
: BP oil Statistics 2007
July 2008 06| Karvy Comtrade's Invest and Harvest Karvy Comtrade's Invest and Harvest
July 02008 7|
Cover Story |
conditions. Reserves-to-production (R/P) ratio– If the
reserves remaining at the end of any year are divided by the
production in that year, the result is the length of time that those
remaining reserves would last if production were to continue at
that rate.
Ceteris paribus the proven conventional oil reserves
can serve the world one more century with present
production capacity. However, there can be likely
addition in the oil reserves in the coming days with
advancement of technology and rise in the prices.
And at the same time we may see a growing
popularity of other alternative sources of energy
with crude oil as a scare resource.
Demand Dynamics
Like Supply, demand for Crude oil has witnessed
sharp increase in the last three decades. Overall,
Global Oil demand has increased by nearly 11.40%
since 2000, 28% since 1990 and more than 80%
since 1970.
Crude oil demand from 2003 has increased annually
by 1.68 %. Demand from OECD countries
increased by 0.13 % and 3.98 % from Non-OECD
countries. Major growth is seen from China where
demand averaged at 7.20 million barrels per day in
2007 with CAGR of 7.51 % since 2003. Demand
from USA the world largest consumer averaged at
20.70 million barrels per day in 2007 with a CAGR
of marginal 0.63%.
The demand in the OECD countries despite slower
than that of the other countries still accounts to
57% of the total world consumption.
USA consumes nearly 20 million barrel per day of
Crude oil, while China and India consumes nearly
7.5 million barrel per day and 2.45 million barrel per
day, respectively. India consumes 10% and China
consumes 36% of what USA as a country
consumes. Most of us have read about Chinese
appetite for energy and after looking at the figures it
is most evident that US appetite for resource is
much higher than China and India. USA produces
nearly 18.60 million barrel per day and meets the
demand from imports. USA conventional reserves
may deplete in 15 years if they maintain their
present production rate. After few years US
importance on imports is likely to be very high and
we may see the structure changing from next 6-7
years.
Total Demand and Supply at a glance
Cover Story |
oil field. It produced more than five million barrels a
day, more than 6 % of global production.
Non-OPEC production has been more or less
growing since 2002. Non- OPEC production from
early 2006 to late 2007 has been constant and started
to increase marginally from late 2007. Many non-
OPEC producers are now concerned with the
depletion of oil from wells and putting pressure on
OPEC to increase production. Major Non-OPEC
producers, such as the United States, Mexico and
Norway, have experienced a decline in production in
recent years.
However, overall numbers for non-OPEC
producers are bolstered by the significant increases
in production from Brazil, Canada, Russia, and a
few other former Soviet states. In Quarter 1 2008,
total Non OPEC production stood at 48.94 million
barrels per day contributing to the 57% of total
global supply.
Global Oil Reserves
World Crude oil reserves have increased since 1986
from 877000 million barrels to 1208,000 million
barrels as per BP estimates of 2007. Though the
reserves have increased there has been a significant
production change in the producing countries. In the
Non-OPEC arena, Brazil and Canada's reserves are
growing. Brazil total reserves stands at 17.2 billion
barrels. Canadian Oil Sands reserves stand at 163,
500 million barrel as per BP 2007 report. Reserves
are declining in other countries like Norway, Britain,
USA, Mexico, and China. OPEC still holds the
largest conventional oil reserves with 905,000
million barrels. There have been talks of Brazil
joining OPEC and if it happens the power of OPEC
in the oil market will boost further.
Wo r l d P r ove n O i l Re s e r ve s
(Conventional)
Source:
Note: Proven reserves of oil – Generally taken to be those
quantities that geological and engineering information indicates
with reasonable certainty can be recovered in the future from
known reservoirs under existing economic and operating
: BP oil Statistics 2007
July 2008 06| Karvy Comtrade's Invest and Harvest Karvy Comtrade's Invest and Harvest
July 02008 9| July 2008 08|
Cover Story |
Inspite of demand crunch experienced in the
OECD countries the total demand for oil still
exceeds the supply supporting the higher oil prices.
In Q1 2008 the demand outpaced supply by 0.29
million barrels per day. Hence any supply disrutpion
to the existing sources is likely to cause an uptrend
in prices.
Investment Demand
Commodities as an asset class have returns
independent to the other asset classes. They are
positively correlated with inflation unlike equities
being negatively correlated. Hence, a completely
new dimension to the fundamentals of
commodities prices has evolved. Apart from the
demand and supply being neck on neck, the factors
like flow of investment into commodities by large
hedge funds, pension funds have given a new
dimension to the market. This has majorly
accounted to the surge in prices apart from the usual
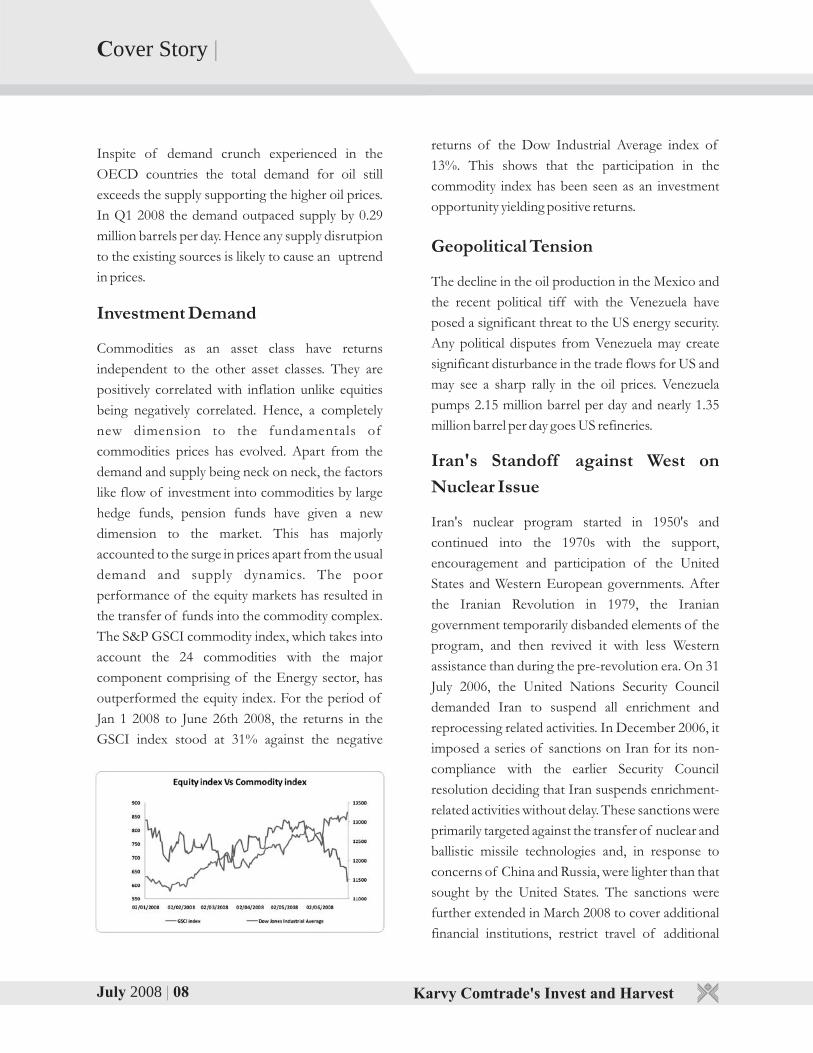
demand and supply dynamics. The poor
performance of the equity markets has resulted in
the transfer of funds into the commodity complex.
The S&P GSCI commodity index, which takes into
account the 24 commodities with the major
component comprising of the Energy sector, has
outperformed the equity index. For the period of
Jan 1 2008 to June 26th 2008, the returns in the
GSCI index stood at 31% against the negative
returns of the Dow Industrial Average index of
13%. This shows that the participation in the
commodity index has been seen as an investment
opportunity yielding positive returns.
Geopolitical Tension
The decline in the oil production in the Mexico and
the recent political tiff with the Venezuela have
posed a significant threat to the US energy security.
Any political disputes from Venezuela may create
significant disturbance in the trade flows for US and
may see a sharp rally in the oil prices. Venezuela
pumps 2.15 million barrel per day and nearly 1.35
million barrel per day goes US refineries.
Iran's Standoff against West on
Nuclear Issue
Iran's nuclear program started in 1950's and
continued into the 1970s with the support,
encouragement and participation of the United
States and Western European governments. After
the Iranian Revolution in 1979, the Iranian
government temporarily disbanded elements of the
program, and then revived it with less Western
assistance than during the pre-revolution era. On 31
July 2006, the United Nations Security Council
demanded Iran to suspend all enrichment and
reprocessing related activities. In December 2006, it
imposed a series of sanctions on Iran for its non-
compliance with the earlier Security Council
resolution deciding that Iran suspends enrichment-
related activities without delay. These sanctions were
primarily targeted against the transfer of nuclear and
ballistic missile technologies and, in response to
concerns of China and Russia, were lighter than that
sought by the United States. The sanctions were
further extended in March 2008 to cover additional
financial institutions, restrict travel of additional
Karvy Comtrade's Invest and Harvest Karvy Comtrade's Invest and Harvest
persons, and bar exports of nuclear- and missile-
related dual-use goods to Iran.
The recent political comment from the western
leaders and most recently from Israel is creating
nervous market sentiments. Iran is the fourth largest
producer and also ranks fourth in world's oil reserve.
Iran is producing nearly 3.8 million barrels per day
which is near to 5% of the world oil production. Any
possible attack on Iran may lead to shortage of
crude oil in the world energy market.
Nigerian Oil crisis
The extraction and drilling of petroleum in Nigeria
is the largest industry and main generator of GDP in
the West Africa. Nigeria holds nearly 3.6 billion
barrels of crude oil which makes it the tenth most
petroleum-rich nation. Most of the country's
reserves are concentrated in and around the delta of
the Niger River. The Nigerian government, along
with foreign oil companies, has reaped enormous
profits over the years from the sale of oil and gas
reserves, while the residents of the Niger Delta live
in abject poverty. This has resulted in agitation by
the MEND against the oil fields. Successive military
dictatorships have been accused by Nigeria's anti-
corruption commission of embezzling $400bn in
oil windfalls. According to the Berlin-based anti-
corruption watchdog Transparency International,
Nigeria is one of the most corrupt countries in the
world - where graft is seen as "rampant". Political
instability and attack on oil facilities by the Nigerian
rebels has resulted significant disruption of Crude
oil last year. The frequent attacks of rebels had sent
25 % of oil production offline last year. The
continuing geopolitical tensions in the Niger belt
have resulted in Angola taking its position as the
largest producing African nation.
Weakness of American Dollar
US dollar has depreciated significantly against all
other major European and Asian currencies. The
housing woes, Credit market turmoil, rising
unemployment led the US dollar to depreciate to
historic lows against Euro, 11 years low against JPY
and near 7 years low against GBP. Crude oil is priced
in Dollar in major international trading and volatility
in the USD rates may cause considerable effect on
prices. Recent surge in oil prices is also attributed to
the decline in the USD apart from ongoing geo-
political tensions. In 2008, Light sweet oil prices in
Dollar terms went up by 40.81 % while it has
declined in euro terms by nearly 5.85 % and rose
nearly 34 % in terms of JPY.
Conclusion
The geo-political tension and falling dollar is
guiding string of fund based investment in the
commodities market. There has not been actual
deficiency in the oil supply and market players are
betting on the potential supply disruption which is
creating risk premium to the prices. However,
whether the price is justified or not but it is causing
serious consequences to the global economy. In the
futures market, Crude oil prices are trading above
$140 dollar a barrel and market players are betting
on $200 a barrel in the near future is having its
serious repercussion on the global growth rate. With
the majority of nation's dependant on imports for
their energy uses the continuous rise in prices is
burdening these governments in order to meet their
needs. It seems unbearable for oil importing
countries like USA, Japan, China, and India to bear
such a high prices. It leads to high consumer
inflation with trickle down effect. The increase in
price to $140 levels are on back of the geopolitical
Cover Story |
July 02008 9| July 2008 08|
Cover Story |
Inspite of demand crunch experienced in the
OECD countries the total demand for oil still
exceeds the supply supporting the higher oil prices.
In Q1 2008 the demand outpaced supply by 0.29
million barrels per day. Hence any supply disrutpion
to the existing sources is likely to cause an uptrend
in prices.
Investment Demand
Commodities as an asset class have returns
independent to the other asset classes. They are
positively correlated with inflation unlike equities
being negatively correlated. Hence, a completely
new dimension to the fundamentals of
commodities prices has evolved. Apart from the
demand and supply being neck on neck, the factors
like flow of investment into commodities by large
hedge funds, pension funds have given a new
dimension to the market. This has majorly
accounted to the surge in prices apart from the usual
demand and supply dynamics. The poor
performance of the equity markets has resulted in
the transfer of funds into the commodity complex.
The S&P GSCI commodity index, which takes into
account the 24 commodities with the major
component comprising of the Energy sector, has
outperformed the equity index. For the period of
Jan 1 2008 to June 26th 2008, the returns in the
GSCI index stood at 31% against the negative
returns of the Dow Industrial Average index of
13%. This shows that the participation in the
commodity index has been seen as an investment
opportunity yielding positive returns.
Geopolitical Tension
The decline in the oil production in the Mexico and
the recent political tiff with the Venezuela have
posed a significant threat to the US energy security.
Any political disputes from Venezuela may create
significant disturbance in the trade flows for US and
may see a sharp rally in the oil prices. Venezuela
pumps 2.15 million barrel per day and nearly 1.35
million barrel per day goes US refineries.
Iran's Standoff against West on
Nuclear Issue
Iran's nuclear program started in 1950's and
continued into the 1970s with the support,
encouragement and participation of the United
States and Western European governments. After
the Iranian Revolution in 1979, the Iranian
government temporarily disbanded elements of the
program, and then revived it with less Western
assistance than during the pre-revolution era. On 31
July 2006, the United Nations Security Council
demanded Iran to suspend all enrichment and
reprocessing related activities. In December 2006, it
imposed a series of sanctions on Iran for its non-
compliance with the earlier Security Council
resolution deciding that Iran suspends enrichment-
related activities without delay. These sanctions were
primarily targeted against the transfer of nuclear and
ballistic missile technologies and, in response to
concerns of China and Russia, were lighter than that
sought by the United States. The sanctions were
further extended in March 2008 to cover additional
financial institutions, restrict travel of additional
Karvy Comtrade's Invest and Harvest Karvy Comtrade's Invest and Harvest
persons, and bar exports of nuclear- and missile-
related dual-use goods to Iran.
The recent political comment from the western
leaders and most recently from Israel is creating
nervous market sentiments. Iran is the fourth largest
producer and also ranks fourth in world's oil reserve.
Iran is producing nearly 3.8 million barrels per day
which is near to 5% of the world oil production. Any
possible attack on Iran may lead to shortage of
crude oil in the world energy market.
Nigerian Oil crisis
The extraction and drilling of petroleum in Nigeria
is the largest industry and main generator of GDP in
the West Africa. Nigeria holds nearly 3.6 billion
barrels of crude oil which makes it the tenth most
petroleum-rich nation. Most of the country's
reserves are concentrated in and around the delta of
the Niger River. The Nigerian government, along
with foreign oil companies, has reaped enormous
profits over the years from the sale of oil and gas
reserves, while the residents of the Niger Delta live
in abject poverty. This has resulted in agitation by
the MEND against the oil fields. Successive military
dictatorships have been accused by Nigeria's anti-
corruption commission of embezzling $400bn in
oil windfalls. According to the Berlin-based anti-
corruption watchdog Transparency International,
Nigeria is one of the most corrupt countries in the
world - where graft is seen as "rampant". Political
instability and attack on oil facilities by the Nigerian
rebels has resulted significant disruption of Crude
oil last year. The frequent attacks of rebels had sent
25 % of oil production offline last year. The
continuing geopolitical tensions in the Niger belt
have resulted in Angola taking its position as the
largest producing African nation.
Weakness of American Dollar
US dollar has depreciated significantly against all
other major European and Asian currencies. The
housing woes, Credit market turmoil, rising
unemployment led the US dollar to depreciate to
historic lows against Euro, 11 years low against JPY
and near 7 years low against GBP. Crude oil is priced
in Dollar in major international trading and volatility
in the USD rates may cause considerable effect on
prices. Recent surge in oil prices is also attributed to
the decline in the USD apart from ongoing geo-
political tensions. In 2008, Light sweet oil prices in
Dollar terms went up by 40.81 % while it has
declined in euro terms by nearly 5.85 % and rose
nearly 34 % in terms of JPY.
Conclusion
The geo-political tension and falling dollar is
guiding string of fund based investment in the
commodities market. There has not been actual
deficiency in the oil supply and market players are
betting on the potential supply disruption which is
creating risk premium to the prices. However,
whether the price is justified or not but it is causing
serious consequences to the global economy. In the
futures market, Crude oil prices are trading above
$140 dollar a barrel and market players are betting
on $200 a barrel in the near future is having its
serious repercussion on the global growth rate. With
the majority of nation's dependant on imports for
their energy uses the continuous rise in prices is
burdening these governments in order to meet their
needs. It seems unbearable for oil importing
countries like USA, Japan, China, and India to bear
such a high prices. It leads to high consumer
inflation with trickle down effect. The increase in
price to $140 levels are on back of the geopolitical
Cover Story |
July 2008 11| July 2008 10| Karvy Comtrade's Invest and Harvest Karvy Comtrade's Invest and Harvest
Focus |
Re-launching of Commodity futures trading in 2003
opened one more investment avenue for Indian
investors. Apart from normal investor, commodity
market also opened the door for physical traders and
corporate houses related to commodities either
directly or indirectly. Success of futures trading in
commodities attracted attention for setting up of
National Spot Exchange on the same lines.
The concept of National Spot Exchange emerged
to provide single platform for commodities trading
expiring on daily basis and contracts culminating
into delivery upon expiry of the contract. This
concept is intended to meet needs of physical
traders. It is national level institutionalized,
electronic and transparent exchange. It is a state-of
the-art unique market place providing customized
solutions to various problems faced by the farmers,
traders, processors, exporters, importers,
arbitrageurs, investors and the general mass.
Promoters
The National Spot Exchange is promoted by Multi
Commodity Exchange of India, Financial
Technologies India Ltd. and National Agricultural
Cooperative Marketing Federation of India Ltd.
MCX (Multi Commodity Exchange of India
Limited), the leading commodity exchange in India,
provides futures trading in more than 70
commodities. It is also amongst the top three
Exchanges in the world in bullion futures.
FTIL (Financial Technologies India Limited) is
among the very few companies globally that offers
exhaustive solutions library for Exchanges, provides
technology solutions to financial markets and
facilitates expansion of stock broking terminals.
NAFED (National Agricultural Cooperative
Marketing Federation of India Limited), the leading
Government agency, engages in food procurement,
distribution and storage activities.
Objectives
1. To develop a Common Indian Market, by
setting up a national level electronic spot
market and providing a state of art trading,
delivery and settlement facilities in various
commodities, which can be accessed from
across the country.
2. To provide an effective method of spot price
discovery in various commodities, in a
transparent manner from across the country.
3. To create a market where farmers can sell their
produce and realize sale proceeds at the best
prevailing price.
4. To create a market where the processors, end
users, exporters, corporates (both private and
government) and other upcountry traders can
procure agricultural produces at the most
competitive price, without any counter party
and quality risk.
5. To create a transparent market where financiers,
investors and arbitrageurs can invest money in
buying various commodities across the country
without going through the hassles of physical
market.
6. To provide authentic spot price of various
commodities that can be used by the futures
market as the benchmark price for settlement
of their contracts on the date of expiry.
National Spot Exchange – An Alternate Channel for Physical Traders
Subscribe for commodity alerts
through SMS
Logon to www.karvycomtrade.com
tension in the oil exporting nations thereby spurting
the supply concerns. In tune it's leading to the rise in
fuel costs across the world hence impacting the
growth rates by increasing inflationary pressures.
A global standoff on the higher oil prices is likely to
come by if there is a continued increase in prices.
This might lead to use of alternatives or discover
the new sources of energy. Will this hold ahead a
future for innovation or substitution of oil for the
energy consumption is yet to be discovered.
Cover Story |
July 2008 13| July 2008 12| Karvy Comtrade's Invest and Harvest Karvy Comtrade's Invest and Harvest
Focus |
7. To help the futures exchanges, Forward
Markets Commission (FMC) and the
Government in achieving the target of
compulsory delivery in all agricultural produces
by way of creating a structured and
standardized spot market. 8. To promote grading and standardization of
agricultural produces and create a market,
where banks and money lending agencies can
provide warehouse receipt financing to farmers
and traders.
Facilities
National Spot Exchange offers electronic spot
trading facility in multiple commodities with
specific delivery centers. The exchange assures
deliver of quality produce to the buyers as it has
system of grading, quality certification and
standardization of commodities. It also facilitates
collateral financing and borrowing against
warehouse receipts. The participants in this
exchange are eligible to get customized services like
storage, transportation, logistics handling and
shipment of the produce. Through this exchange
participants can procure and dispose commodities
through online trading system.
Benefits
National Spot Exchange is beneficial for number of
participants in agri business starting from farmers
to end users. Through this exchange, farmers of the
country will come to know about prevailing price
for his crop in major trading centres at the time of
sale. Since the Indian farmers are prone to
exploitation by market middlemen, this exchange
tries to remove this system by way of guaranteeing
trade and payment. Till date, the farmer of
particular locality are selling his produce in nearby
market but with the commencement of spot
exchange he will be able to access national level
transparent market where direct selling to
processors or end users would be feasible. The
exchange increases the holding capacity due to
acceptance of warehouse receipt for financing.
Since the producer can view prevailing price for his
crop in major trading centres of the country he can
bargain best price in his nearby physical market.
On the other hand of physical trade, traders are
buyers of produce from farmers. Once the spot
exchange comes into operation, it will provide series
of benefits to traders. This exchange will provide
common platform for traders to buy and sell
commodities and there will not be counterparty risk
as the exchange assures payment in due course of
time.
Corporate houses/Exporters/Importers engaged
in agri based business can procure the produce in
bulk without counterparty risk zregarding payment
and the company will get assured quality of the
produce. Along with above mentioned facility, spot
exchange also provided storage and logistic services.
This system completely removes bottlenecks
relating to physical market operations.
The benefits of National Spot Exchange are
extended to Arbitrageurs as well by way cash futures
arbitrage on electronic platform. Arbitrageurs can
offload the deliveries received on futures market.
As an exchange, it also has few benefits like
transparent spot price for Due Date Rate
calculation. Ease of moving towards compulsory
delivery contracts through structured spot market.
Healthy growth of futures market ensured through
development of the structured spot market.
Conclusion
Exchange markets and operations will undergo a
paradigm shift in their behavior and would be
increasingly driven for providing integrated
processes and services to the trading community.
Moreover, Exchanges need to deliver highest levels
of service backed by strong technology to bring
increased participation at lowest possible cost.
National Spot Exchange gets the strategic
advantage of having Financial Technologies (India)
Ltd. as its technology partner for delivering
technologically advanced solutions to market
participants. FTIL is proven class of end-to-end
Exchange Trading technologies, addressing Trading
/ Surveillance / Clearing and Settlement
operations. It would deliver a cutting-edge to the
National Spot Exchange Trade Life Cycle i.e. Pre-
Trade, Trade and Post-Trade operations.
Online Commodity
Trading
Logon to www.karvycomtrade.com
Focus |
July 2008 15|
come from excellent academic background and have
vast experience. So was it a fear of accounting for
“Hedging loss” in the books of accounts? The
important point to remember here is that hedging is
a tool that neither gives profits nor makes losses but
fixes the cost and protects the margins. If they had
fixed the cost of ATF to some extent they not only
could have continued their operations with cost
almost fixed for their operations but also kept their
customers happy offering them very competitive
prices. Almost 74% of 40% that is about 30% of the
total operational cost (which is the cost of fuel)
would have been fixed and there was no need to
worry for increase/ decrease or volatility in aviation
fuel prices. Most of the other costs any way are fixed
in terms of ground handling cost, manpower cost,
lease and rentals etc.
So how can airlines hedge their ATF risks especially
when ATF is not traded on any commodity
exchange across the world? The answer lies in
surrogate hedging which basically means choosing
an alternate commodity which has a high degree of
price correlation with the original commodity. In
this case since ATF is unavailable, we will have to
look forwards to hedging in either crude oil or
heating oil.
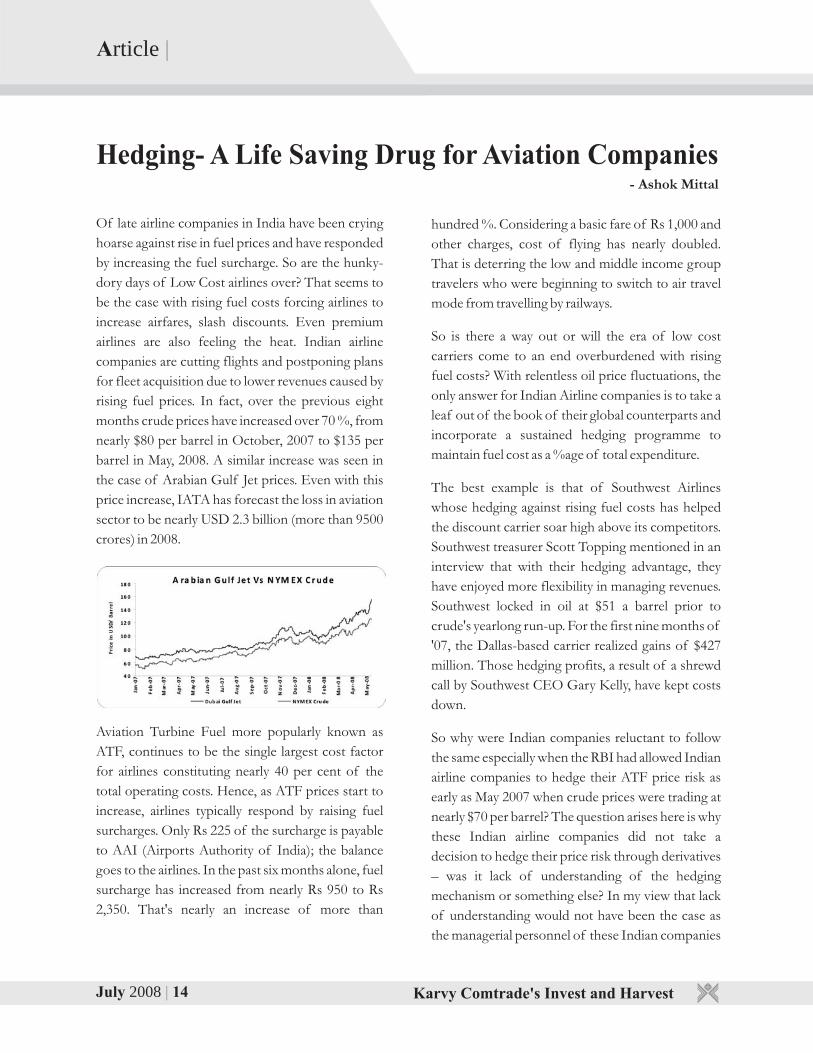
The viability of surrogate hedging can be
established from the fact that there is strong
correlation between Arabian Gulf Jet Fuel Prices
(this is the basis taken by India oil marketing
companies for declaring their ATF prices) and
NYMEX WTI Crude prices. The price correlation
between these two has ranged from 0.96 to 0.98 over
the previous five years. In the case of Indian airline
companies, they should go for surrogate hedging on
MCX Crude Oil contracts, because hedging on the
NYMEX would also involve hedging foreign
currency risk thereby involving additional costing.
MCX is India's largest commodity exchange, and in
terms of liquidity is the fourth largest commodity
exchange in the world as far as volumes in crude oil
is concerned. Indian airline companies willing to
hedge on MCX Crude will be exposed to the same
volatility as NYMEX WTI Crude as the price
correlation between these two has ranged from 0.97
to 0.99 over the past three years since the launch of
crude contracts on the MCX platform.
However, before an airline undertakes a programme
of hedging or surrogate hedging as the case may be,
it has to understand that surrogate hedging in crude
will not fully cover the ATF price risk, as nearly 74
per cent of ATF price contribution is directly linked
to an international benchmark, while 19 per cent is
indirectly linked to it, as the other components are
computed as a notional %age while pricing.
So how will an Indian airline company go about
designing its hedging programme? Primarily the
company has to calculate the hedge ratio (a
statistical calculation which decides on the number
of contracts to be traded in the futures market). In
this case the hedge ratio will be based on surrogate
hedging. Once the number of contracts has been
decided, the company will have to buy an equivalent
number of MCX Crude Oil contracts to safeguard
against ATF price volatility. The day the airline
companies will get to know the monthly average
price decided by the Indian Oil Marketing
companies, they will have to square off all the future
contracts on the MCX platform.
All the above is fine in case Crude prices go up.
However if crude prices come down, there will be a
loss in the derivatives transaction and people may
worry about a “Hedge Loss” as was recently
mentioned in media in regards to Larsen & Toubro.
Hedge programme results in neither a profit nor
loss. Even if crude prices had gone up, there would
July 2008 14|
Of late airline companies in India have been crying
hoarse against rise in fuel prices and have responded
by increasing the fuel surcharge. So are the hunky-
dory days of Low Cost airlines over? That seems to
be the case with rising fuel costs forcing airlines to
increase airfares, slash discounts. Even premium
airlines are also feeling the heat. Indian airline
companies are cutting flights and postponing plans
for fleet acquisition due to lower revenues caused by
rising fuel prices. In fact, over the previous eight
months crude prices have increased over 70 %, from
nearly $80 per barrel in October, 2007 to $135 per
barrel in May, 2008. A similar increase was seen in
the case of Arabian Gulf Jet prices. Even with this
price increase, IATA has forecast the loss in aviation
sector to be nearly USD 2.3 billion (more than 9500
crores) in 2008.
Aviation Turbine Fuel more popularly known as
ATF, continues to be the single largest cost factor
for airlines constituting nearly 40 per cent of the
total operating costs. Hence, as ATF prices start to
increase, airlines typically respond by raising fuel
surcharges. Only Rs 225 of the surcharge is payable
to AAI (Airports Authority of India); the balance
goes to the airlines. In the past six months alone, fuel
surcharge has increased from nearly Rs 950 to Rs
2,350. That's nearly an increase of more than
hundred %. Considering a basic fare of Rs 1,000 and
other charges, cost of flying has nearly doubled.
That is deterring the low and middle income group
travelers who were beginning to switch to air travel
mode from travelling by railways.
So is there a way out or will the era of low cost
carriers come to an end overburdened with rising
fuel costs? With relentless oil price fluctuations, the
only answer for Indian Airline companies is to take a
leaf out of the book of their global counterparts and
incorporate a sustained hedging programme to
maintain fuel cost as a %age of total expenditure.
The best example is that of Southwest Airlines
whose hedging against rising fuel costs has helped
the discount carrier soar high above its competitors.
Southwest treasurer Scott Topping mentioned in an
interview that with their hedging advantage, they
have enjoyed more flexibility in managing revenues.
Southwest locked in oil at $51 a barrel prior to
crude's yearlong run-up. For the first nine months of
'07, the Dallas-based carrier realized gains of $427
million. Those hedging profits, a result of a shrewd
call by Southwest CEO Gary Kelly, have kept costs
down.
So why were Indian companies reluctant to follow
the same especially when the RBI had allowed Indian
airline companies to hedge their ATF price risk as
early as May 2007 when crude prices were trading at
nearly $70 per barrel? The question arises here is why
these Indian airline companies did not take a
decision to hedge their price risk through derivatives
– was it lack of understanding of the hedging
mechanism or something else? In my view that lack
of understanding would not have been the case as
the managerial personnel of these Indian companies
Karvy Comtrade's Invest and Harvest Karvy Comtrade's Invest and Harvest
Article | Article |
Hedging- A Life Saving Drug for Aviation Companies- Ashok Mittal
July 2008 15|
come from excellent academic background and have
vast experience. So was it a fear of accounting for
“Hedging loss” in the books of accounts? The
important point to remember here is that hedging is
a tool that neither gives profits nor makes losses but
fixes the cost and protects the margins. If they had
fixed the cost of ATF to some extent they not only
could have continued their operations with cost
almost fixed for their operations but also kept their
customers happy offering them very competitive
prices. Almost 74% of 40% that is about 30% of the
total operational cost (which is the cost of fuel)
would have been fixed and there was no need to
worry for increase/ decrease or volatility in aviation
fuel prices. Most of the other costs any way are fixed
in terms of ground handling cost, manpower cost,
lease and rentals etc.
So how can airlines hedge their ATF risks especially
when ATF is not traded on any commodity
exchange across the world? The answer lies in
surrogate hedging which basically means choosing
an alternate commodity which has a high degree of
price correlation with the original commodity. In
this case since ATF is unavailable, we will have to
look forwards to hedging in either crude oil or
heating oil.
The viability of surrogate hedging can be
established from the fact that there is strong
correlation between Arabian Gulf Jet Fuel Prices
(this is the basis taken by India oil marketing
companies for declaring their ATF prices) and
NYMEX WTI Crude prices. The price correlation
between these two has ranged from 0.96 to 0.98 over
the previous five years. In the case of Indian airline
companies, they should go for surrogate hedging on
MCX Crude Oil contracts, because hedging on the
NYMEX would also involve hedging foreign
currency risk thereby involving additional costing.
MCX is India's largest commodity exchange, and in
terms of liquidity is the fourth largest commodity
exchange in the world as far as volumes in crude oil
is concerned. Indian airline companies willing to
hedge on MCX Crude will be exposed to the same
volatility as NYMEX WTI Crude as the price
correlation between these two has ranged from 0.97
to 0.99 over the past three years since the launch of
crude contracts on the MCX platform.
However, before an airline undertakes a programme
of hedging or surrogate hedging as the case may be,
it has to understand that surrogate hedging in crude
will not fully cover the ATF price risk, as nearly 74
per cent of ATF price contribution is directly linked
to an international benchmark, while 19 per cent is
indirectly linked to it, as the other components are
computed as a notional %age while pricing.
So how will an Indian airline company go about
designing its hedging programme? Primarily the
company has to calculate the hedge ratio (a
statistical calculation which decides on the number
of contracts to be traded in the futures market). In
this case the hedge ratio will be based on surrogate
hedging. Once the number of contracts has been
decided, the company will have to buy an equivalent
number of MCX Crude Oil contracts to safeguard
against ATF price volatility. The day the airline
companies will get to know the monthly average
price decided by the Indian Oil Marketing
companies, they will have to square off all the future
contracts on the MCX platform.
All the above is fine in case Crude prices go up.
However if crude prices come down, there will be a
loss in the derivatives transaction and people may
worry about a “Hedge Loss” as was recently
mentioned in media in regards to Larsen & Toubro.
Hedge programme results in neither a profit nor
loss. Even if crude prices had gone up, there would
July 2008 14|
Of late airline companies in India have been crying
hoarse against rise in fuel prices and have responded
by increasing the fuel surcharge. So are the hunky-
dory days of Low Cost airlines over? That seems to
be the case with rising fuel costs forcing airlines to
increase airfares, slash discounts. Even premium
airlines are also feeling the heat. Indian airline
companies are cutting flights and postponing plans
for fleet acquisition due to lower revenues caused by
rising fuel prices. In fact, over the previous eight
months crude prices have increased over 70 %, from
nearly $80 per barrel in October, 2007 to $135 per
barrel in May, 2008. A similar increase was seen in
the case of Arabian Gulf Jet prices. Even with this
price increase, IATA has forecast the loss in aviation
sector to be nearly USD 2.3 billion (more than 9500
crores) in 2008.
Aviation Turbine Fuel more popularly known as
ATF, continues to be the single largest cost factor
for airlines constituting nearly 40 per cent of the
total operating costs. Hence, as ATF prices start to
increase, airlines typically respond by raising fuel
surcharges. Only Rs 225 of the surcharge is payable
to AAI (Airports Authority of India); the balance
goes to the airlines. In the past six months alone, fuel
surcharge has increased from nearly Rs 950 to Rs
2,350. That's nearly an increase of more than
hundred %. Considering a basic fare of Rs 1,000 and
other charges, cost of flying has nearly doubled.
That is deterring the low and middle income group
travelers who were beginning to switch to air travel
mode from travelling by railways.
So is there a way out or will the era of low cost
carriers come to an end overburdened with rising
fuel costs? With relentless oil price fluctuations, the
only answer for Indian Airline companies is to take a
leaf out of the book of their global counterparts and
incorporate a sustained hedging programme to
maintain fuel cost as a %age of total expenditure.
The best example is that of Southwest Airlines
whose hedging against rising fuel costs has helped
the discount carrier soar high above its competitors.
Southwest treasurer Scott Topping mentioned in an
interview that with their hedging advantage, they
have enjoyed more flexibility in managing revenues.
Southwest locked in oil at $51 a barrel prior to
crude's yearlong run-up. For the first nine months of
'07, the Dallas-based carrier realized gains of $427
million. Those hedging profits, a result of a shrewd
call by Southwest CEO Gary Kelly, have kept costs
down.
So why were Indian companies reluctant to follow
the same especially when the RBI had allowed Indian
airline companies to hedge their ATF price risk as
early as May 2007 when crude prices were trading at
nearly $70 per barrel? The question arises here is why
these Indian airline companies did not take a
decision to hedge their price risk through derivatives
– was it lack of understanding of the hedging
mechanism or something else? In my view that lack
of understanding would not have been the case as
the managerial personnel of these Indian companies
Karvy Comtrade's Invest and Harvest Karvy Comtrade's Invest and Harvest
Article | Article |
Hedging- A Life Saving Drug for Aviation Companies- Ashok Mittal
have been a profit in the derivatives position but a
simultaneous loss would have occurred in the Spot
market for ATF. Hence, in case crude prices comes
down, there would be a loss in the futures market
but the company will get compensated for that by
getting a benefit in the spot market as they will buy
ATF at a lesser rate. As per the recent guidelines of
the ICAI any profit/ loss on account of hedging
transactions in relation to the company's business
can be setoff against normal business profit/ loss
(AS 30). This point was also clarified by the L&T
management that losses on account of their
hedging strategy had not hit their balance sheets or
profitability.
To conclude we can say that in an era of volatile
crude prices, an airline company has no option but
to opt for a hedging programme. It is as necessary as
an insurance programme for the company's flights.
Therefore if low cost carriers - or for that matter all
the airline companies - desire to maintain
uninterrupted operations and keep the costs stable,
they must adopt a Hedging strategy after taking into
account the hedge ratio and other parameters which
will allow them to lock in the cost of ATF and then
decide their pricing policies without the fear of
uncertain fuel prices. Fixing the cost and margins
irrespective of fuel price volatility would not burden
the customer every time in the form of a fuel
surcharge. This would be a win-win situation for
everyone be it an airline company the Government
or the customer.
This article originally published in The Economic Times
dated 13th June 2008
July 2008 17| July 2008 16| Karvy Comtrade's Invest and Harvest Karvy Comtrade's Invest and Harvest
South West Monsoon – Farmers' Fortune in Thin Air
Article |
Introduction
India is the major agrarian economy growing at the
rate of 8.5% year on year basis. Its farming
community is getting ready to bet their luck on South
West Monsoon, which is lifeline of millions of
farmers. Till date, India is largely dependant on
monsoon for its large chunk of food grain
production to feed the growing population. The SW
monsoon season starts from June and continue till
September month. These four months are popularly
called as rainy season in common nomenclature,
kharif season in agriculture terminology. On an
average India receives 110-120 cm of rain in a year
and South West Monsoon alone accounts for 88-90
cm. The country witnesses two monsoons every year
namely, South West Monsoon and North East
Monsoon. Of these two monsoons, South West
brings maximum rainfall to the country than that of
other. It plays a crucial role in deciding overall
agriculture growth of the country. South West
Monsoon normally hits the Indian mainland on June
1st and covers entire India by July 15th every year.
The other North East monsoon hits India in
October and terminates in the month of December.
Northeast Monsoon season is the major period of
rainfall activity over south peninsula, particularly in
Coastal Andhra Pradesh, Rayalaseema and
Tamilnadu-Pondicherry. For Tamilnadu this is the
main rainy season accounting for about 48% of the
annual rainfall.
Monsoon 2007
In the last couple of years, South West monsoon is
hitting Indian subcontinent few days prior to normal
date of its commencement. In 2007, the monsoon
hit Kerala coast on May 28th, four days prior to
normal onset date. The country had received 105%
Long Period Average rainfall during 2007. The 2007
monsoon seasonal rainfall over the country was
more than the predicted value. Despite the adequate
rains the states like West Uttar Pradesh, Haryana,
Chandigarh and Delhi, Punjab, Himachal Pradesh
and East Madhya Pradesh experienced moderate
drought conditions (rainfall deficiency of 26% to
50%) at the end of the season. The southwest
monsoon covered the entire country on 4th July
2007. Timely arrival and well distribution of rainfall
in 2007 has resulted into bumper harvest of most of
the crops like Maize, Paddy, Sugar Cane and
Oilseeds.
Monsoon 2008
Before start of each monsoon season, the Indian
Meteorological Department, a premiere weather
forecasting agency in India, releases its rainfall
forecast report in the month of April based on
statistical analysis. For the current year, it has
projected 99% Long Period Average rainfall for the
country as a whole against 95% projected for 2007.
This forecast sent relief signal to the farmers and
encouraged them to grow more food grains. At the
same time, it also offered comfort to the
government to fight against the higher inflation and
soaring food prices. The onset of the monsoon over
Kerala coast was 1 day prior to normal date. Though
its progress towards north was rapid, it failed to
bring enough rainfall because of unfavourable
climatic conditions. For the better harvest, crops
require equivalent distribution throughout its crop
cycle.
The unequal distribution of rainfall has dual effect.
The region that receives higher rainfall may lead to
flooding condition which in turn wash away already
sown crop. These areas may not be congenial
sowing as this condition might results into outbreak
Article |
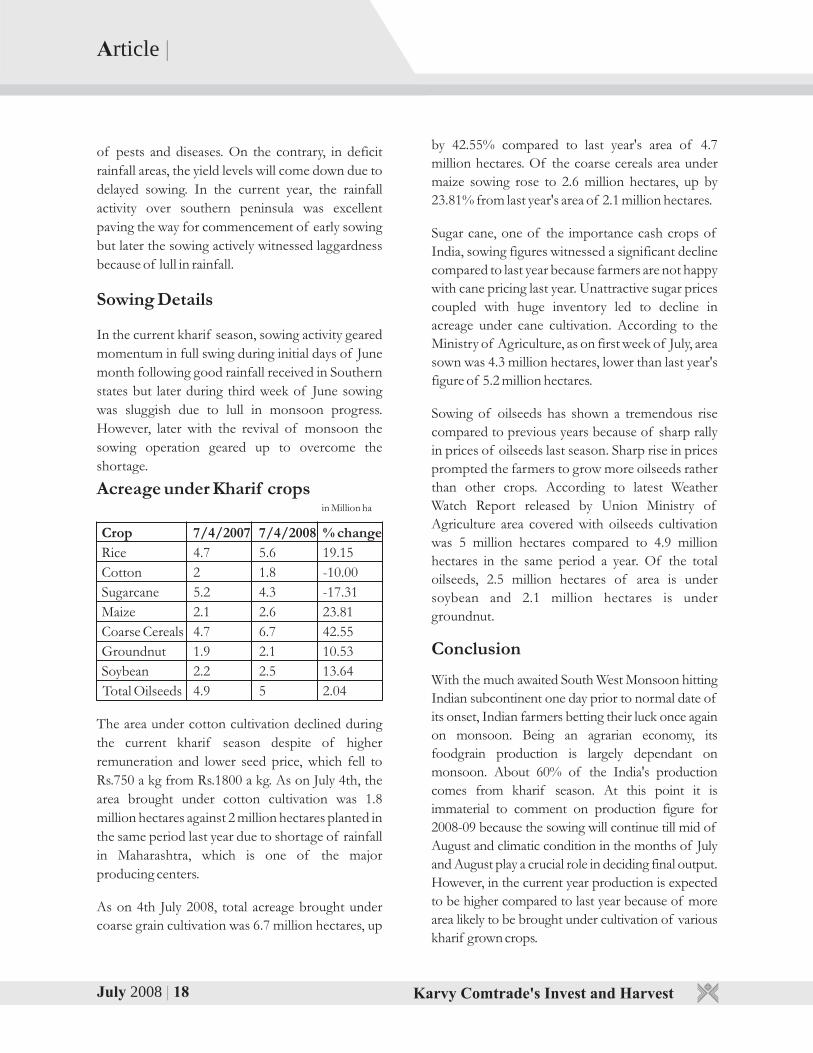
July 2008 19| July 2008 18| Karvy Comtrade's Invest and Harvest Karvy Comtrade's Invest and Harvest
Market Review |
Bullion
Bullion prices were seen trading range bound in the
month of June before making a high of $937.70 per
troy ounce surpassing the previous month's high of
$935.The appeal of the metal as an alternative
investment was enhanced due to the weakening U.S
dollar as U.S economy gripped under the dark
gloom. However, with the economic indices
showing a recovery the U.S dollar was seen to uplift
from its lows against the majors. The economic
indices for the month of June were seen to have a
mixed impact on the markets. The ISM
manufacturing and the services for the month of
May were seen showing signs of recovery. The
housing sector was still in the shackles recording a
poor performance. The housing starts decline to
925K from previous levels of 1,008K along with
lower number of building permits being submitted.
The unemployment rate for the month of May
increased substantially to 5.5% shattered the
performance of the Job market. On back of all this
the increasing inflation numeral posed a threat to the
economic growth, driving economy into stagflation.
The consumer price Index recorded a YoY increase
of 4.2% against the previous levels of 3.90% and
PPI from the 6.50% to 7.20%. These rising numbers
increased the bets of an interest rate hike by the
FOMC leading to an appreciating dollar and
resulting in dip in bullion prices. However, with the
industrial indices for the month of June like the
Empire manufacturing falling to yearly lows along
with declining housing index and lower consumer
confidence weighed down the stance of the Fed, as
they leave the interest rates steady at 2.00%.
Nevertheless, the Fed's comments not pointing
towards any eminent rate hike in near future, dollar
was seen losing its sheen. This coupled with record
Bullion, Energy & Base Metals Review
crude oil prices, which went up to $145.85 per barrel
in the month led to a major rebound in bullion
prices. Until June 30th 2008, gold futures gained by
4.6% to make a closing at $928.30. Silver also mirrored
gold's move to close at $17.42 gaining by 3.2%.
Outlook
Gold prices are expected to trade on a firm note in
near term supported by the crude oil and continued
geopolitical tension which would instigate
investment demand into the metal. With the
European Central Bank likely to increase rates
leading to greater yield differentials, euro is likely to
gain against the dollar. Moreover, growth rate of
major economies still being in the gloom, bullion is
likely to emerge as an alternative investment. On the
technical front the supports are seen at $890, $845
resistances are at $960 and $1000.
Crude oil
Crude oil prices spiked to a new life time high of
$145.85 per barrel amid increasing geopolitical and
supply concerns followed by a weakening US dollar.
During the month, the International Energy
Agency lowered its estimates for Non-OPEC
production by 300,000 bpd to 50.4 million bpd.
Though the global oil demand was revised lower by
70,000 bpd to 86.77 million bpd, the series of
production losses in Nigeria raised supply concerns.
The increasing production in Saudi Arabia on June
22nd by 200,000 bpd has been offset by the decline
in production in Nigeria due to the ongoing
geopolitical tension. It is estimated that Nigeria's
output has been cut by around 300,000 barrels a day
as a result of the violence. The series of decline in
this output has now resulted in Angola taking over
as the largest producer in Africa.
of pests and diseases. On the contrary, in deficit
rainfall areas, the yield levels will come down due to
delayed sowing. In the current year, the rainfall
activity over southern peninsula was excellent
paving the way for commencement of early sowing
but later the sowing actively witnessed laggardness
because of lull in rainfall.
Sowing Details
In the current kharif season, sowing activity geared
momentum in full swing during initial days of June
month following good rainfall received in Southern
states but later during third week of June sowing
was sluggish due to lull in monsoon progress.
However, later with the revival of monsoon the
sowing operation geared up to overcome the
shortage.
Acreage under Kharif crops
Crop 7/4/2007 7/4/2008 % change
Rice 4.7 5.6 19.15
Cotton 2 1.8 -10.00
Sugarcane 5.2 4.3 -17.31
Maize 2.1 2.6 23.81
Coarse Cereals 4.7 6.7 42.55
Groundnut 1.9 2.1 10.53
Soybean 2.2 2.5 13.64
Total Oilseeds 4.9 5 2.04
The area under cotton cultivation declined during
the current kharif season despite of higher
remuneration and lower seed price, which fell to
Rs.750 a kg from Rs.1800 a kg. As on July 4th, the
area brought under cotton cultivation was 1.8
million hectares against 2 million hectares planted in
the same period last year due to shortage of rainfall
in Maharashtra, which is one of the major
producing centers.
As on 4th July 2008, total acreage brought under
coarse grain cultivation was 6.7 million hectares, up
in Million ha
by 42.55% compared to last year's area of 4.7
million hectares. Of the coarse cereals area under
maize sowing rose to 2.6 million hectares, up by
23.81% from last year's area of 2.1 million hectares.
Sugar cane, one of the importance cash crops of
India, sowing figures witnessed a significant decline
compared to last year because farmers are not happy
with cane pricing last year. Unattractive sugar prices
coupled with huge inventory led to decline in
acreage under cane cultivation. According to the
Ministry of Agriculture, as on first week of July, area
sown was 4.3 million hectares, lower than last year's
figure of 5.2 million hectares.
Sowing of oilseeds has shown a tremendous rise
compared to previous years because of sharp rally
in prices of oilseeds last season. Sharp rise in prices
prompted the farmers to grow more oilseeds rather
than other crops. According to latest Weather
Watch Report released by Union Ministry of
Agriculture area covered with oilseeds cultivation
was 5 million hectares compared to 4.9 million
hectares in the same period a year. Of the total
oilseeds, 2.5 million hectares of area is under
soybean and 2.1 million hectares is under
groundnut.
Conclusion
With the much awaited South West Monsoon hitting
Indian subcontinent one day prior to normal date of
its onset, Indian farmers betting their luck once again
on monsoon. Being an agrarian economy, its
foodgrain production is largely dependant on
monsoon. About 60% of the India's production
comes from kharif season. At this point it is
immaterial to comment on production figure for
2008-09 because the sowing will continue till mid of
August and climatic condition in the months of July
and August play a crucial role in deciding final output.
However, in the current year production is expected
to be higher compared to last year because of more
area likely to be brought under cultivation of various
kharif grown crops.
Article |
July 2008 21| July 2008 20| Karvy Comtrade's Invest and Harvest Karvy Comtrade's Invest and Harvest
However, the rise in production by Saudi Arabia
along with the increase in fuel prices in developing
nations like China, limited the uptrend in prices. The
rising fuel prices send a signal of potential change in
consumption patterns in these nations which were
forecasted to account for the increase in demand.
Hence any setback in the demand from the
developing nations limited the uptrend in prices.
Nevertheless, the brewing geopolitical tension
between Iran and Israel with threats of attacks on
Iran due to uranium enrichment program increased
worries of the Middle Eastern supplies. The
potential threat caused to the OPEC second largest
producer has resulted in surge in prices to record
high levels.
During the month the DOE crude oil inventory levels
declined by 1.6% to stand at 301 million barrels which
is below the three year simple average until May. This
along with declining gasoline stocks which fell by
0.15% to 208 million bpd supported the uptrend in
prices.
Outlook
Crude oil futures are likely to stay firm in the wake
of the continuing geopolitical tension in the oil
producing nations. The rising concern of the
stability in oil supplies will continue to work as a
premium for the prices. On the technical front,
strong supports are seen at $130 and resistances are
at $148 then $155 per barrel.
Base Metals
Base metals were mostly mixed in the month of June
with Copper and Aluminium favoring bulls, while
others residing in the bear's home.
LME 3 month forward copper increased
substantially by 7.24% to $8510 per ton as labor
unions in Peru announced a nationwide strike,
demanding for better pay benefits. Operations at
Peru's biggest copper and zinc pit, Anta Mina,
owned by BHP Billiton and Xstrata were halted. This
followed by a potential supply disruption in Mexican
copper mines fueled the rally in copper prices.
Earlier in the month supply issues in Peru like strike
at Southern Copper's Cuajone mine provided a
strong support to the copper prices.
Moreover, declining LME and Shanghai inventories
(down by 1.88% and 27% respectively) followed
with a weakening greenback, which had shed over
1.25% of its value against Euro, led to the bullish
sentiment in world copper market. A weakening
American currency attracts overseas demand for the
metal like copper, as then the metal will become
cheaper for the holder of foreign currency.
On the production front, Chile produced 463,233
tons of the metal in May, down 3.8 % from the same
month last year. During the month, International
Copper Study Group (ICSG) reported that the
world consumption of refined copper exceeded
production by 67,000 tons in the first quarter of the
current year. However, the poor Chinese refined
copper imports figures which fell by 26.4 % on
month and 19 % on year in May, acted as a limiting
factor for the upside movement in prices.
Aluminium was seen gaining this month after
electricity costs and outages have shuttered more
smelters worldwide. Aluminium moved to $3,169
per ton due to higher electricity costs which accounts
for about one-third of aluminum's total production
cost. U.S. based aluminum giant Alcoa temporarily
halted half of the production at its Rockdale, Texas,
cutting three of its six operating pot lines - a cut of
about 120,000 metric tons per year of production -
after its dedicated power supply was unable to keep
power to those lines. Additionally hike in power fee
Market Review | Market Review |
in China coupled with record high crude oil prices
supported the ongoing momentum in aluminum
prices.
Nickel prices remained on the lower side and went
down by 0.68% to $21,950 per ton as China cuts its
production of stainless steel, a key demand driver.
However, prices initially saw a jump towards $24,000
levels after a gas explosion in Western Australia
resulted in closure of BHP Billiton's Kalgoorlie
nickel smelter, thereby reducing nickel output by
around 28,000 tons or 2 % of global supplies.
Lead and Zinc were driven down mainly because of
their rising stockpiles at London Metal Exchange
warehouses which in 2008 alone have risen by
around 124% and 72% respectively. In its latest
monthly report, International Lead and Zinc Study
Group (ILZSG) pointed out that the global zinc
market was in surplus by 78,000 tons during the first
four months of this year and during the same period
lead supply deficit was narrowed to 8,000 tons. The
deficit was 20,000 tons in the same period of 2007.
Outlook
In July, base metals such as copper and aluminium
look fundamentally strong backed by the prevailing
supply side problems. Zinc is expected to be on a
sideways move on account of reduced demand and
potential output disruption in Latin American
countries. Lead and Nickel are expected to be in the
downside territory. However, any short covering in
these metals can result in to a pullback towards
higher side.
Clearing &Forwarding
ServicesLogon to www.karvycomtrade.com
July 2008 22|
Market Review |
July 2008 23|
Market Review |
Karvy Comtrade's Invest and Harvest Karvy Comtrade's Invest and Harvest
Logon towww.karvycomtrade.com
Jeera
Jeera prices have gained about 15% in the month of
June on strong export demand and declined arrivals
in physical markets. Most active September contract
moved up from Rs.11200 to Rs.12800 a quintal
levels. Initially, prices were moving in range bound
level and a good technical break out has resulted into
sharp rally in later part of the month. In spot
markets, improved demand with declining arrivals
and higher export demand boosted the price rally.
Daily average arrivals fell below 10000 bags at Unjha
spot market compared to 18000 bags in previous
month. According to latest trade estimates, India has
produced about 1.35 lakh tons (22.5 lakh bags) of
jeera higher than last year's output of 0.96 lakh
tonnes (15-16 lakh bags). Earlier in the beginning of
the season, domestic output was estimated higher at
1.5-1.7 lakh tonnes (25-28 lakh bags). Meantime,
trade sources are projecting global jeera production
would fall by 30% to 1.69 lakh tons due to lesser
acreage and crop loss in Syria and Turkey due to
weather vagaries. Syria output is likely to decline to
6000 tonnes from normal output of 28000 tonnes.
Turkey production also estimated lower at 6000
tonnes compared to normal production of 10000
tonnes. Output in other countries like Iran,
Afghanistan and China estimated at 3000, 4000 and
12000 tons respectively. Global output other than
India is estimated at 34000 tons in the current year.
World market other than India annually requires
about 98000 tons of Jeera and a shortage of nearly
64000 tons is anticipated in the current year. India
has exported about 28000 tons during 2007-08, up
by 8 % from previous year. Arrivals in domestic
markets stood at 20 lakh bags till end of June. Due to
global shortage with declining output in Syria and
Turkey, exporters in India are getting better
opportunities in the current year. Prices in other
Agri Market Review
major producing countries also increased sharply
towards $3800-4000 per tonne, while export prices
from India quoting at $2800 per tonne.
Price outlook
Prices may gain further in the month of July on
higher export demand and poor arrivals.
Meanwhile, fresh arrival in Turkey starts in next
couple of weeks and may hinder sharp rise as seen
last month. Broad range for September NCDEX is
seen at Rs.12200-13500 per quintal. Any fresh
trigger or trading above Rs.13500 levels may lead to
sharp rally towards Rs.15000 per quintal. We
recommend staying on buying side for coming
weeks.
Guar seed
Guar seed prices continued to trade in sideways
direction tracking monsoon progress. Most active
September contract Guar Seed futures traded in the
range of Rs.1775-1935 for most part of last month.
Market participants were closely watching progress
of monsoon, which gave no major trigger to the
market. Indian Meteorological Department (IMD)
has released its update on southwest monsoon
forecast for 2008-09 on 30th of June. It has
increased the southwest monsoon (June-
September) forecast to 100% of LPA with model
error of ±4% from earlier forecast of 99% of LPA.
Rainfall the country as a whole for month of July is
forecasted at 98% with model error of ±9%. For
northwest region, where guar seed is mostly
cultivated, it has forecasted rainfall at 96% of LPA
with model error of ±8%.
Southwest monsoon set over Kerala on 31st of
May, which is almost normal, but moved rapidly
into mainland and covered most of the country two
weeks earlier than normal schedule. Monsoon has
covered half of Rajasthan by 16th of June which is
almost two weeks earlier than normal schedule.
This rapid movement in monsoon led to
inequitable distribution over most parts of the
country.
Most parts of guar seed cultivation states have
received early rains in the current year and sowing
has already started in Haryana and northern
Rajasthan. Haryana Department of Agriculture
has estimated production at 400000 bags, up by
nearly 18% from last year. Sowing in Rajasthan
especially western and central parts is yet to pick
up and sowing in these regions can be seen in mid-
July. Rainfall in July month is crucial for total
sowing. According to trade sources, area is likely to
decline in the current year due to anticipated shift
to other Kharif crops especially oil seeds. Prices of
most of the Kharif crops have doubled in last one
year, while guar seed prices are still quoting at two
years low. Farmers may shift to these Kharif crops,
which gives better returns.
Government has said export of guar gum for
human and animal consumption will have to
undergo quality check before export to Europe.
This clearance would be given by Shellac and
Forest Products Export Promotion Council, a
nodal agency for promoting export of forest
processed products including guar gum.
Meanwhile, exporters have opposed this move,
since this procedure takes long time. Europe had
banned import of guar gum last year after reports
of gum had excess dioxin and later accepted with
quality certification from laboratories. Export
demand remained higher especially from China
that is buying good amount of guar gum. Rupee
has depreciated once again and fell to below
INR43 levels against USD. This depreciation
supported export of guar gum.
Outlook
Guar seed prices are likely to remain range bound with marginal upside bias on good buying support at these lower levels. However, progress in monsoon may have major impact on price movement on daily basis. Major decline is not seen even monsoon progresses well due to expected decline in sowing area and lack of selling from traders below Rs.1600 levels. Rupee depreciation against USD is also providing some support to prices. Government clarification on quality certification on export of guar gum is likely to benefit the exporters in long term. Broad range for September NCDEX contract is seen at Rs.1750-2100 levels for this month. In case of insufficient rains in July month may lead to further upside rally towards Rs.2200 levels.
Maize
Maize prices are trading at historical highs in
domestic as well as international market on the
shadow of other cereals like rice, wheat and barley.
Dwindling inventories coupled with escalating
demand from food, feed and fuel sector and lower
production forecast due to unfavourable weather
condition supported the surge in maize prices. Most
of the developed countries are using food based bio-
fuel as an alternate to crude oil. Maize is one of such
crops that is used in manufacturing of bio-fuel.
Robust demand for corn for bio-fuel resulted into
unprecedented rally in its prices on Chicago Board
of Trade to historical highs of $7.66 a bushel in the
month of June. Domestically, the rally in maize
prices started in the month of May following
emergence of fresh export demand from Middle
East and South East Asian countries.
On supply side, major global corn producers
stopped shipment of corn to contain price rise in
their countries. This gave an excellent opportunity
for Indians to take advantage of global supply
shortage creating tremendous export avenues for
Indian maize. Till June 2008, India had exported 2.5
million tons of corn compared to 0.45 million tons
shipped in the same period a year ago. Though
India's production has been projected higher at 18.5
million tons, prices were on higher side because of
strong demand from poultry feed manufacturers.
Spot prices in Nizamabad market went up by Rs.50
to test highest level of Rs.960 a quintal on strong
demand from Poultry Feed Manufactures and
starch industry. On NCDEX, the active July
contract futures surged sharply to 993 levels from
930 levels taking strong cues from physical market.
After testing high of 993 levels, prices fell
moderately following long liquidation on fears of
government intervention due to higher inflation
and on fears of export ban on Maize. But prices
failed to sustain at lower levels and once again
resumed their bullish trend on strong buying
interest. However, quick decision taken by the
government to ban export of maize till October
15th, 2008 created panic situation the market
thereby resulting into sharp fall in prices.
Outlook
Maize prices are forecast to continue its downward
trend following government move to ban export of
maize. Stockists who are hoarding the stock in
anticipation of excellent export opportunities may
release the inventory into the market, which will
create supply glut in the market.
Soybean
Soybean futures staged a strong rally in the month
of June taking strong cues from international
market coupled with strong soy meal prices. The
global benchmark CBOT soybean futures
continued its upward trend on supply worries and
on forecast of tight ending stocks. Incessant
precipitation in Midwest region of US has adversely
affected the sown area and also resulted into delay in
further sowing in the region. United States
Department of Agriculture has projected crop loss
to the extent of 20%. Though progressive planting
report released in the month of March showed a
record planting of soybean, final production is likely
to lower due to fall in yield levels. On the other
hand, tug of war between farmers and government
in Argentina over export tax on farm products also
supported the price rally. Along with supply
constraint, unprecedented rally in Crude Oil prices
attracted appeal of oilseeds based bio-fuel as an
alternate energy source boosted the price rally in oil
and oilseeds prices across the board. NYMEX
Crude Oil prices tested all time high of $145.85 a
barrel. On domestic front, robust demand for
Indian soy meal from South East Asian countries
created additional demand for soybean from
crushers. Normally, demand for Indian soy meal
eases from June onwards as the fresh harvesting
commences in South American countries. But the
month long farmers' agitation resulted into supply
disruption thereby creating an opportunity of India
to export more soy meal to South East Asian
countries. As a result of continued buying, soy meal
prices in Indian market tested a whopping Rs.20000
a ton level. At the same, commencement of kharif
season in India resulted into robust demand for
seeds for sowing purpose.
Outlook
Soybean futures are forecast to trade on negative
note in the current month on account of long
liquidation coupled with emergence of selling
pressure on speculation of record bean sowing.
Since the Indian Meteorological Department has
projected 100% Long Period Average rainfall,
Indian farmers may plant more soybeans. Record
prices seen for previous season crop is attracting
farmers to grow more soybeans. According to latest
Weather Watch Report released by Union Ministry
of Agriculture, till July 4th, area brought under
soybean cultivation is 2.5 million hectares
compared to 2.2 million hectares sown in the same
period a year ago.
July 2008 24|
Market Review |
July 2008 25|
Class Room |
Karvy Comtrade's Invest and Harvest Karvy Comtrade's Invest and Harvest
In our previous issue we had discussed about the
basics of Technical Analysis and implications of
various moving averages in the technical charts. We
also commenced a topic on Point & Figure chart and
why it's legendary in financial markets. In this issue
we will be looking into the detailed construction of
Point & Figure charts and its analytics.
Point & Figure Chart
Outline of Point & Figure Chart
A point and figure chart is used for technical analysis
of securities. Unlike most other investment charts,
point and figure charts do not present a linear
representation of time. Instead, they show trends in
price. The aim of point and figure charting is to filter
out the unimportant price movement and focus on
the main direction of the price trend and normally
used for longer term price movements. The P&F
chart shows only the underlying supply and demand
of the security. There are two typical ways to plot
point and figure charts - using closing prices, or with
high/low prices. The most common method
nowadays is high/low prices of specific timeframe,
normally daily prices.
Construction of P&F Chart
Point and figure charts are composed of a number
of columns that either consists of a series of
stacked Xs or Os. A column of Xs is used to
illustrate a rising price, while Os represent a falling
price. This type of chart is used to filter out non-
significant price movements, and enables the trader
to easily determine critical support and resistance
levels. Traders will place orders when the price
moves beyond identified support/resistance levels.
Class Room Series on Technical Analysis
Additional points are added to the chart once the
price changes by more than a predefined amount
(known as the box size). For example, if the box size
is set to equal one and the price of the asset is 50,
then another X would be added to the stack of Xs
once the price surpasses 51. Each column consists
of only one letter (either X or O) - never both. New
columns are placed to the right of the previous
column and are only added once the price changes
direction by more than a predefined reversal
amount. Since only price changes are recorded, if no
price change occurs then the chart is left untouched.
Key Points:
X's represent increasing prices (demand). O's
represent decreasing prices (supply).
You can only have X's or Os in any one column, not
both.
The reversal distance is equal to the box size
multiplied by the reversal amount
The best way to really understand P&F charts is to
create one by hand. All you need is a grid (graph
paper is perfect), a pencil, and stock quotes. Only
high and low prices are charted - the open and close
are ignored.
Example:
Note: Prices are into a minor down trend
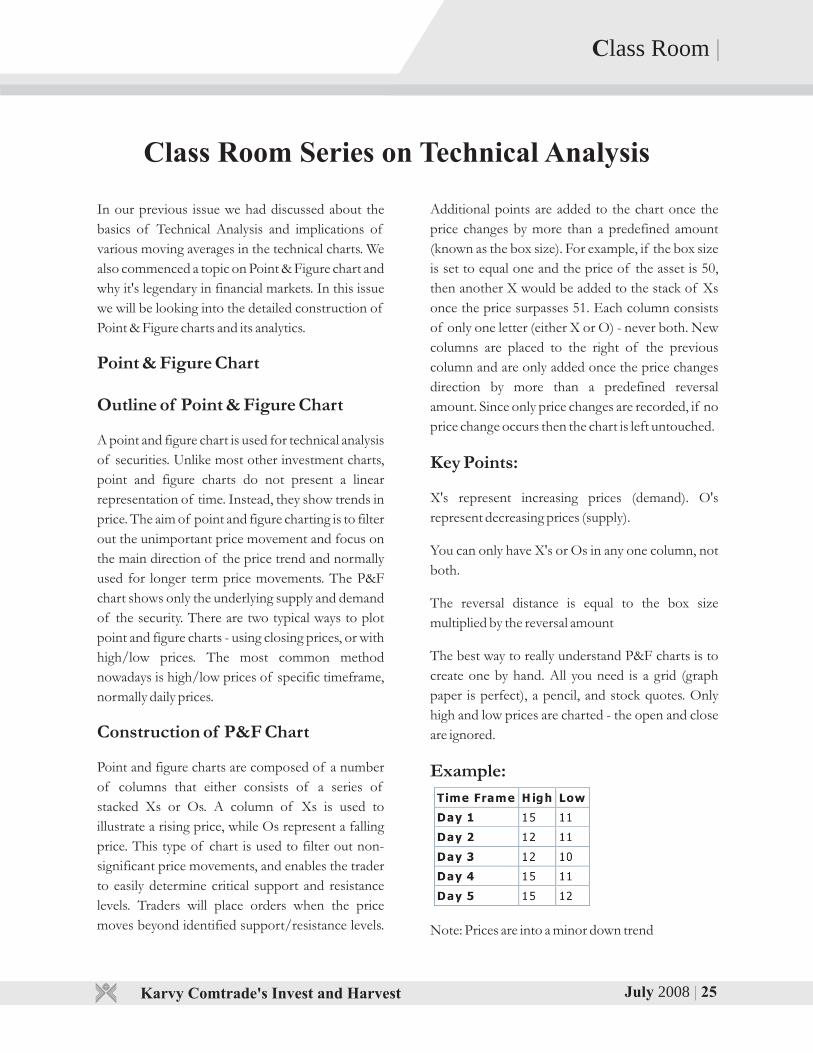
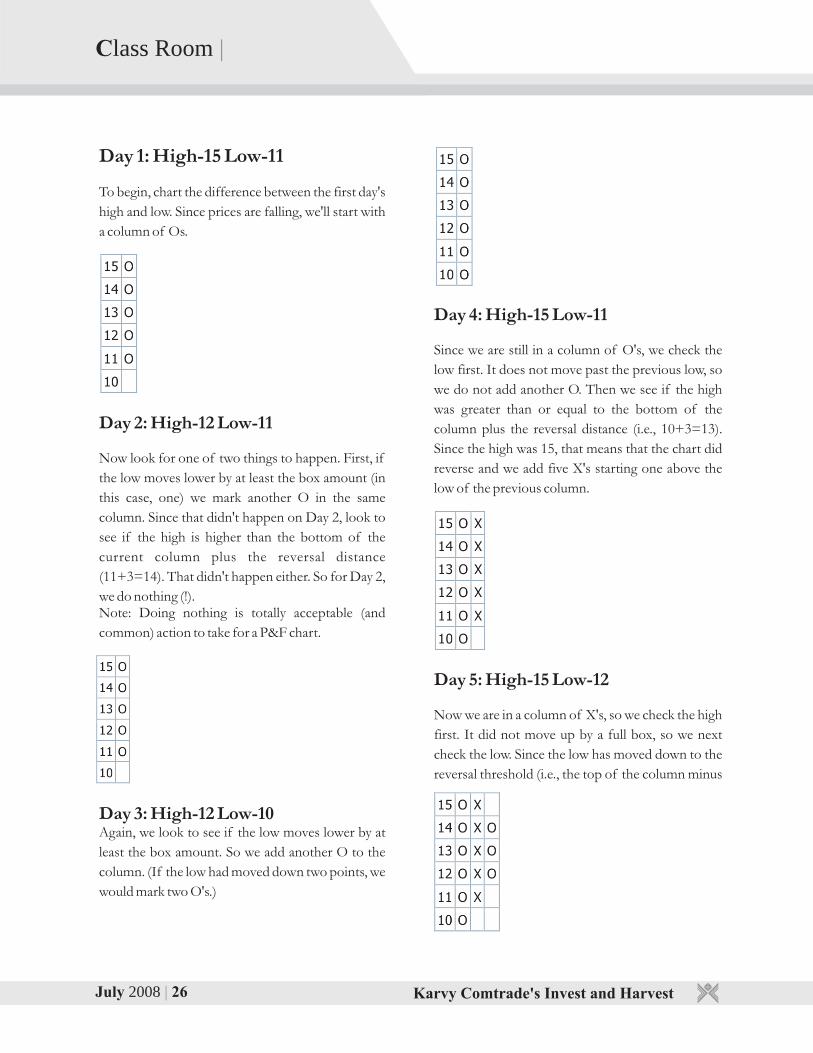
July 2008 26| July 2008 27|
Class Room | Class Room |
Karvy Comtrade's Invest and Harvest Karvy Comtrade's Invest and Harvest
Day 1: High-15 Low-11
To begin, chart the difference between the first day's
high and low. Since prices are falling, we'll start with
a column of Os.
Day 2: High-12 Low-11
Now look for one of two things to happen. First, if
the low moves lower by at least the box amount (in
this case, one) we mark another O in the same
column. Since that didn't happen on Day 2, look to
see if the high is higher than the bottom of the
current column plus the reversal distance
(11+3=14). That didn't happen either. So for Day 2,
we do nothing (!).Note: Doing nothing is totally acceptable (and
common) action to take for a P&F chart.
Day 3: High-12 Low-10 Again, we look to see if the low moves lower by at
least the box amount. So we add another O to the
column. (If the low had moved down two points, we
would mark two O's.)
Day 4: High-15 Low-11
Since we are still in a column of O's, we check the
low first. It does not move past the previous low, so
we do not add another O. Then we see if the high
was greater than or equal to the bottom of the
column plus the reversal distance (i.e., 10+3=13).
Since the high was 15, that means that the chart did
reverse and we add five X's starting one above the
low of the previous column.
Day 5: High-15 Low-12
Now we are in a column of X's, so we check the high
first. It did not move up by a full box, so we next
check the low. Since the low has moved down to the
reversal threshold (i.e., the top of the column minus
the reversal distance (15-3=12)), we reverse one
more time and add three O's to the next column.
Over time, our chart might look something like this:
This is important to remember that P&F charts do
not show time in a linear fashion. Each column can
represent one day, or many days, depending on the
price movement. Because P&F charts filter out the
noise associated with more traditional charting
methods, every mark on the chart is significant. Four Things to look for:
• Support levels• Resistance levels• Upward trend lines• Downward trend lines
Support and resistance levels are always horizontal
lines and trend lines always appear at 45° angles. We
can spot support levels on P&F charts by looking for
a horizontal row of Os that each marks the bottom
of their respective columns.
Like support levels, resistance levels are horizontal
lines on P&F charts. They mark the upper level for
trading, or a price at which sellers typically
outnumber buyers. Find them by looking for a row
of X's.
Upward Trend Lines
To plot an upward trend line, first put a + under the
first column of Os. Then move over one box and up
one box and draw another +. Repeat this until you
hit another column of Os followed by a row of X's
which does not continue the pattern.
Downward Trend Lines
Let's look for a downward trend line. Start at a wall
of X's, and use the same plotting technique as
before, but at a downward angle. Remember, trend
lines always appear at a 45° angle.
Note: Point & Figure charts can be constructed on
normal as well as Logarithm scale.
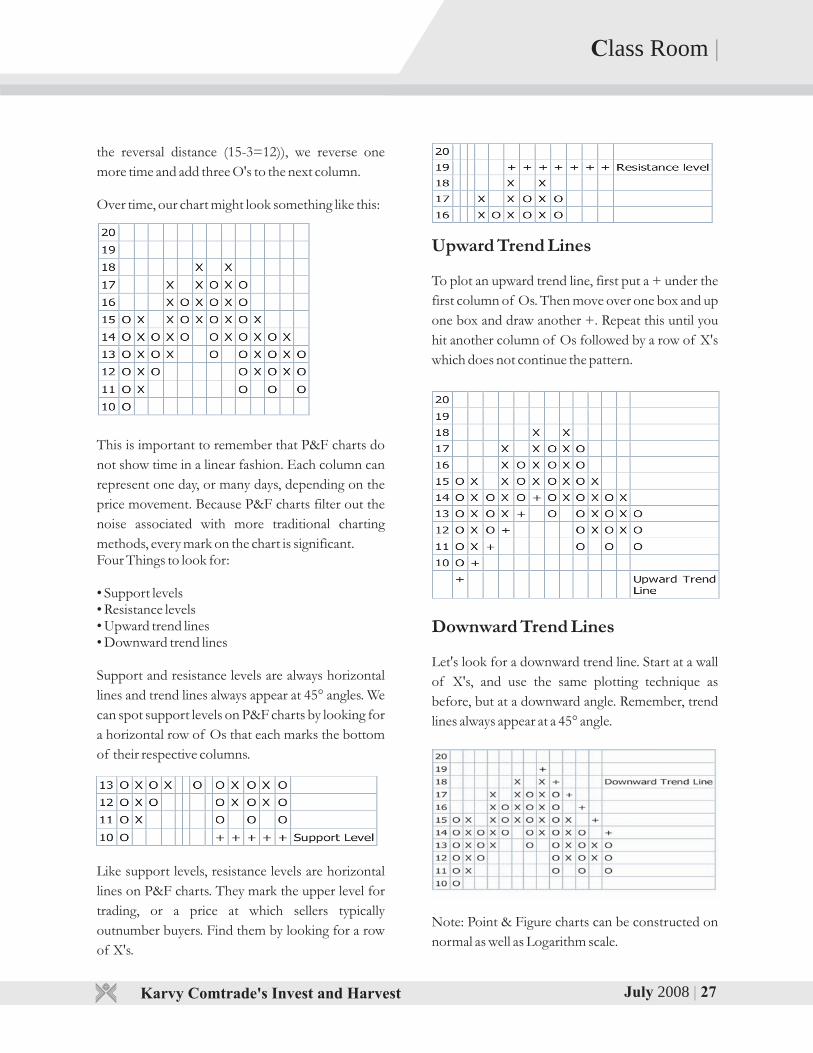
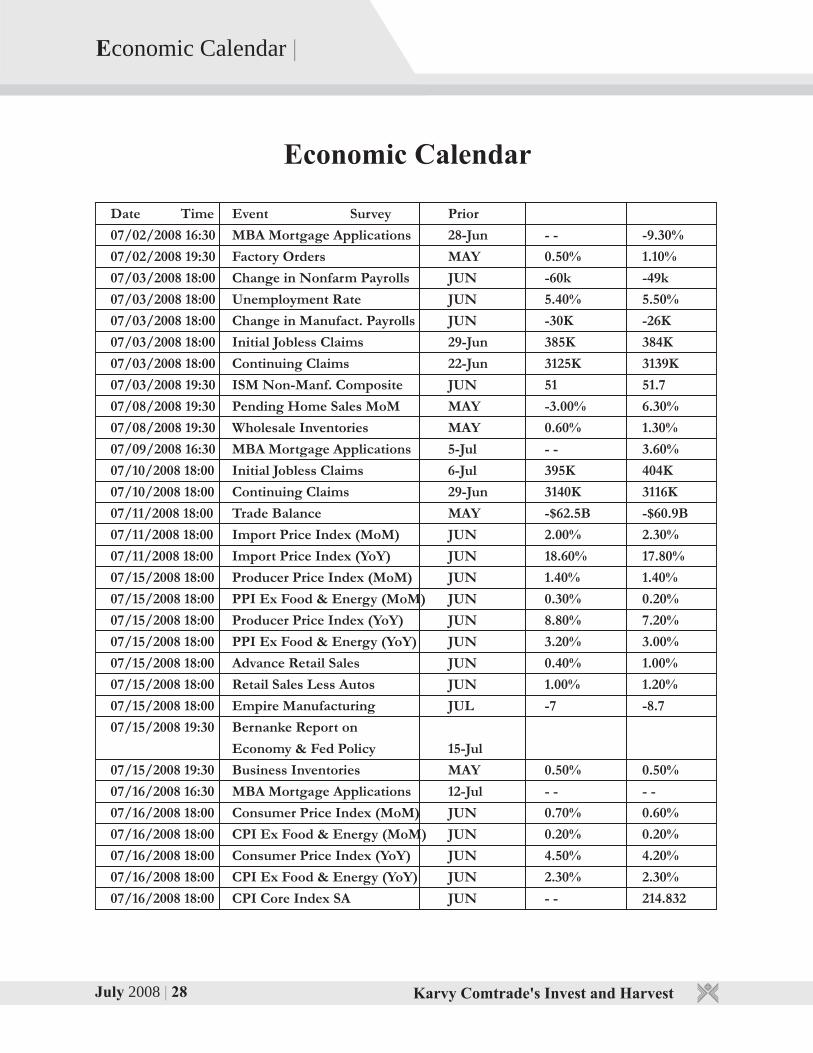
July 2008 28| July 2008 29|
Economic Calendar |
Economic Calendar
Date Time Event Survey Prior
07/02/2008 16:30 MBA Mortgage Applications 28-Jun - - -9.30%
07/02/2008 19:30 Factory Orders MAY 0.50% 1.10%
07/03/2008 18:00 Change in Nonfarm Payrolls JUN -60k -49k
07/03/2008 18:00 Unemployment Rate JUN 5.40% 5.50%
07/03/2008 18:00 Change in Manufact. Payrolls JUN -30K -26K
07/03/2008 18:00 Initial Jobless Claims 29-Jun 385K 384K
07/03/2008 18:00 Continuing Claims 22-Jun 3125K 3139K
07/03/2008 19:30 ISM Non-Manf. Composite JUN 51 51.7
07/08/2008 19:30 Pending Home Sales MoM MAY -3.00% 6.30%
07/08/2008 19:30 Wholesale Inventories MAY 0.60% 1.30%
07/09/2008 16:30 MBA Mortgage Applications 5-Jul - - 3.60%
07/10/2008 18:00 Initial Jobless Claims 6-Jul 395K 404K
07/10/2008 18:00 Continuing Claims 29-Jun 3140K 3116K
07/11/2008 18:00 Trade Balance MAY -$62.5B -$60.9B
07/11/2008 18:00 Import Price Index (MoM) JUN 2.00% 2.30%
07/11/2008 18:00 Import Price Index (YoY) JUN 18.60% 17.80%
07/15/2008 18:00 Producer Price Index (MoM) JUN 1.40% 1.40%
07/15/2008 18:00 PPI Ex Food & Energy (MoM) JUN 0.30% 0.20%
07/15/2008 18:00 Producer Price Index (YoY) JUN 8.80% 7.20%
07/15/2008 18:00 PPI Ex Food & Energy (YoY) JUN 3.20% 3.00%
07/15/2008 18:00 Advance Retail Sales JUN 0.40% 1.00%
07/15/2008 18:00 Retail Sales Less Autos JUN 1.00% 1.20%
07/15/2008 18:00 Empire Manufacturing JUL -7 -8.7
07/15/2008 19:30 Bernanke Report on
Economy & Fed Policy 15-Jul
07/15/2008 19:30 Business Inventories MAY 0.50% 0.50%
07/16/2008 16:30 MBA Mortgage Applications 12-Jul - - - -
07/16/2008 18:00 Consumer Price Index (MoM) JUN 0.70% 0.60%
07/16/2008 18:00 CPI Ex Food & Energy (MoM) JUN 0.20% 0.20%
07/16/2008 18:00 Consumer Price Index (YoY) JUN 4.50% 4.20%
07/16/2008 18:00 CPI Ex Food & Energy (YoY) JUN 2.30% 2.30%
07/16/2008 18:00 CPI Core Index SA JUN - - 214.832
Karvy Comtrade's Invest and Harvest Karvy Comtrade's Invest and Harvest
Economic Calendar |
Date Time Event Survey Prior
07/16/2008 18:00 Consumer Price Index NSA JUN 217.9 216.632
07/16/2008 18:30 Net Long-term TIC Flows MAY - - $115.1B
07/16/2008 18:30 Total Net TIC Flows MAY - - $60.6B
07/16/2008 18:45 Industrial Production JUN 0.10% -0.20%
07/16/2008 18:45 Capacity Utilization JUN 79.40% 79.40%
07/16/2008 23:30 Minutes of June 24-25
FOMC Meeting 16-Jul
07/17/2008 18:00 Housing Starts JUN 965K 975K
07/17/2008 18:00 Initial Jobless Claims 13-Jul - - - -
07/17/2008 18:00 Building Permits JUN 970K 969K
07/17/2008 18:00 Continuing Claims 6-Jul - - - -
07/21/2008 19:30 Leading Indicators JUN - - 0.10%
07/23/2008 16:30 MBA Mortgage Applications 19-Jul - - - -
07/24/2008 18:00 Initial Jobless Claims 20-Jul - - - -
07/24/2008 18:00 Continuing Claims 13-Jul - - - -
07/24/2008 19:30 Existing Home Sales JUN - - 4.99M
07/24/2008 19:30 Existing Home Sales MoM JUN - - 2.00%
07/25/2008 18:00 Durable Goods Orders JUN - - 0.00%
07/25/2008 18:00 Durables Ex Transportation JUN - - -0.90%
07/25/2008 19:30 New Home Sales JUN - - 512K
07/25/2008 19:30 New Home Sales MoM JUN - - -2.50%
07/29/2008 19:30 Consumer Confidence JUL - - 50.4
07/30/2008 16:30 MBA Mortgage Applications 26-Jul - - - -
07/31/2008 18:00 GDP QoQ (Annualized) 2Q A - - 1.00%
07/31/2008 18:00 Personal Consumption 2Q A - - 1.10%
07/31/2008 18:00 GDP Price Index 2Q A - - 2.70%
07/31/2008 18:00 Core PCE QoQ 2Q A - - 2.30%
07/31/2008 18:00 Initial Jobless Claims 27-Jul - - - -
07/31/2008 18:00 Continuing Claims 20-Jul - - - -
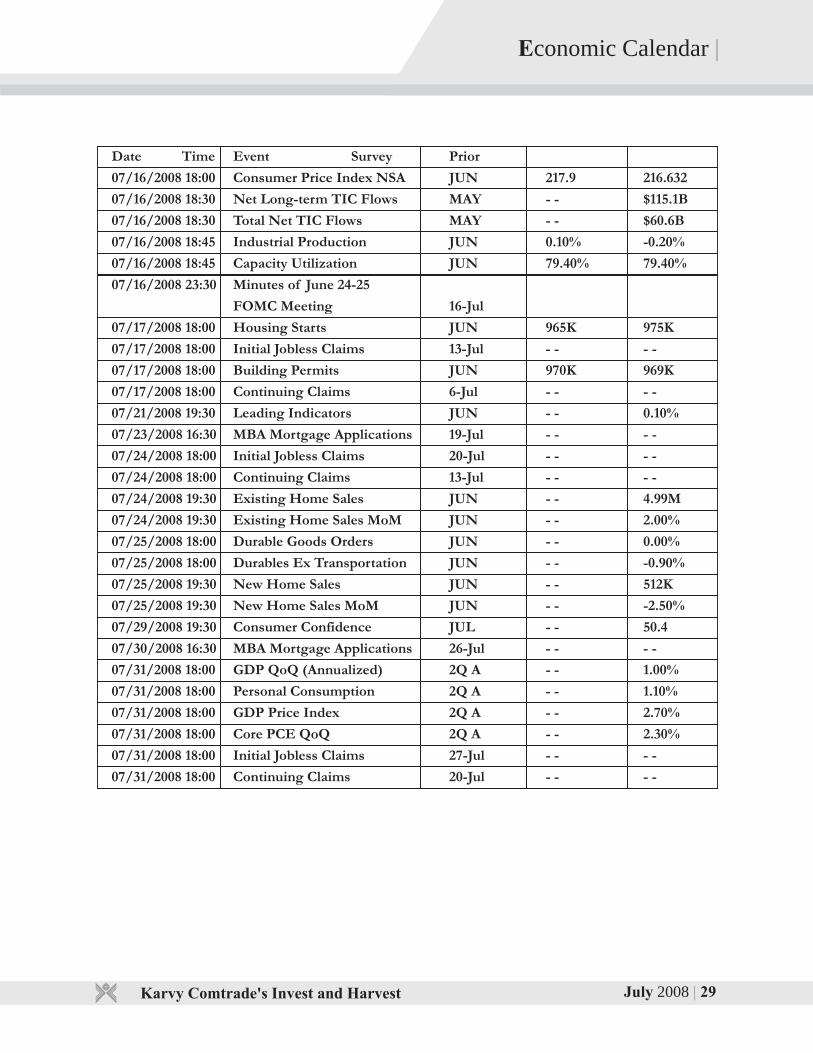
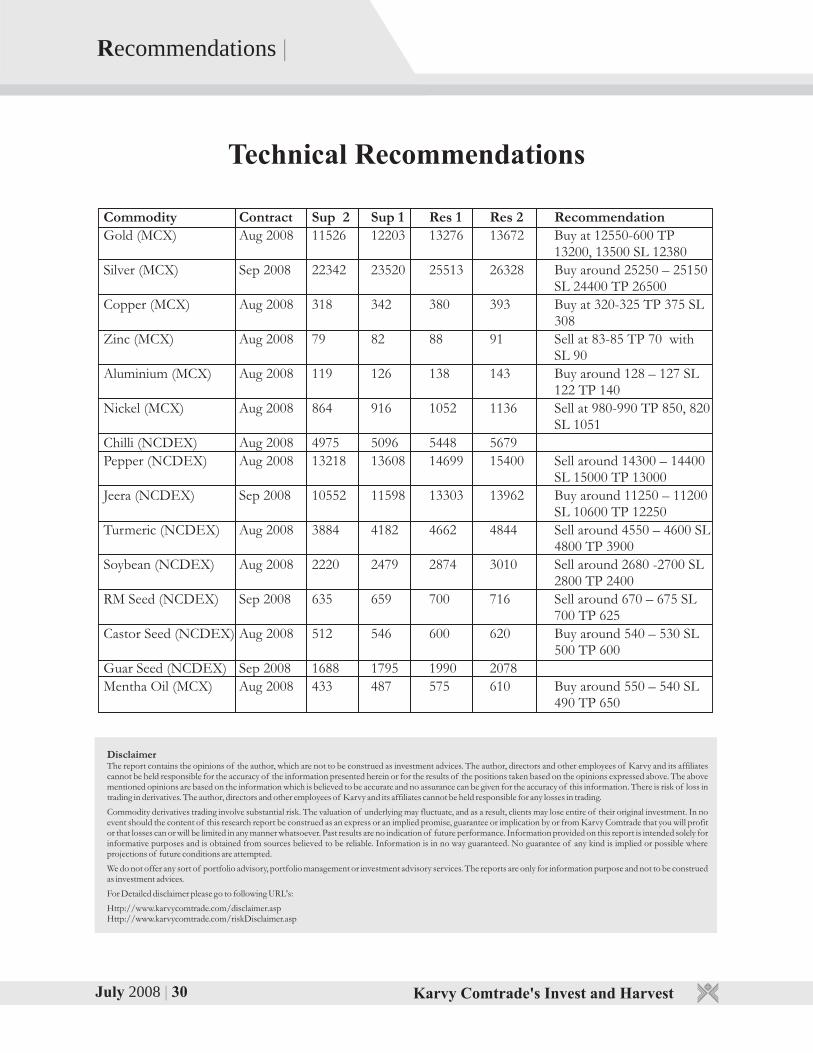
July 2008 30|
Recommendations |
Technical Recommendations
DisclaimerThe report contains the opinions of the author, which are not to be construed as investment advices. The author, directors and other employees of Karvy and its affiliates cannot be held responsible for the accuracy of the information presented herein or for the results of the positions taken based on the opinions expressed above. The above mentioned opinions are based on the information which is believed to be accurate and no assurance can be given for the accuracy of this information. There is risk of loss in trading in derivatives. The author, directors and other employees of Karvy and its affiliates cannot be held responsible for any losses in trading.
Commodity derivatives trading involve substantial risk. The valuation of underlying may fluctuate, and as a result, clients may lose entire of their original investment. In no event should the content of this research report be construed as an express or an implied promise, guarantee or implication by or from Karvy Comtrade that you will profit or that losses can or will be limited in any manner whatsoever. Past results are no indication of future performance. Information provided on this report is intended solely for informative purposes and is obtained from sources believed to be reliable. Information is in no way guaranteed. No guarantee of any kind is implied or possible where projections of future conditions are attempted.
We do not offer any sort of portfolio advisory, portfolio management or investment advisory services. The reports are only for information purpose and not to be construed as investment advices.
For Detailed disclaimer please go to following URL's:
Http://www.karvycomtrade.com/disclaimer.asp Http://www.karvycomtrade.com/riskDisclaimer.asp
Karvy Comtrade's Invest and Harvest
Commodity Contract Sup 2 Sup 1 Res 1 Res 2 RecommendationGold (MCX) Aug 2008 11526 12203 13276 13672 Buy at 12550-600 TP
13200, 13500 SL 12380Silver (MCX) Sep 2008 22342 23520 25513 26328 Buy around 25250 – 25150
SL 24400 TP 26500Copper (MCX) Aug 2008 318 342 380 393 Buy at 320-325 TP 375 SL
308Zinc (MCX) Aug 2008 79 82 88 91 Sell at 83-85 TP 70 with
SL 90 Aluminium (MCX) Aug 2008 119 126 138 143 Buy around 128 – 127 SL
122 TP 140Nickel (MCX) Aug 2008 864 916 1052 1136 Sell at 980-990 TP 850, 820
SL 1051 Chilli (NCDEX) Aug 2008 4975 5096 5448 5679Pepper (NCDEX) Aug 2008 13218 13608 14699 15400 Sell around 14300 – 14400
SL 15000 TP 13000Jeera (NCDEX) Sep 2008 10552 11598 13303 13962 Buy around 11250 – 11200
SL 10600 TP 12250Turmeric (NCDEX) Aug 2008 3884 4182 4662 4844 Sell around 4550 – 4600 SL
4800 TP 3900Soybean (NCDEX) Aug 2008 2220 2479 2874 3010 Sell around 2680 -2700 SL
2800 TP 2400RM Seed (NCDEX) Sep 2008 635 659 700 716 Sell around 670 – 675 SL
700 TP 625Castor Seed (NCDEX) Aug 2008 512 546 600 620 Buy around 540 – 530 SL
500 TP 600Guar Seed (NCDEX) Sep 2008 1688 1795 1990 2078Mentha Oil (MCX) Aug 2008 433 487 575 610 Buy around 550 – 540 SL
490 TP 650
Trust someone who knows the market inside outWhen you trade with Karvy, you trade with a trusted name in the Commodities Market.
The Karvy Advantages
Member of NCDEX and MCXNational networkPersonalized servicesBacked by researchSMS alertsDealing facility during night sessionsSingle access number anywhere in India
Visit us at: www.karvycomtrade.com email: [email protected]
“Karvy House”, 46, Avenue 4, Street No.1 Banjara Hills, Hyderabad - 500 034
Tel: 040 - 23388707 / 23431569 Fax: 040 - 66259955
An ISO 9001 :2000 company
COMTRADE LIMITED

Do you want to venture into booming Commodity Market?Are you ready to join hands with one of the leading Commodity Broking House?
Partnering Towards Growth...Join Hands for Better Future...
Then here's your opportunity to join hands with one
of the leading commodity broking. Karvy, with over
550 offices in over 375 locations, will help you
accelerate the growth of your business.
You get the advantage of leveraging upon our strong
brand, cutting edge technology infrastructure and
dedicated team for Fundamental and Technical
research that deliver unmatched investment advice.
Apart from broking, Karvy also offers Clearing &
Forwarding Services in Commodities. Karvy
Comtrade Limited offer offline online and mobile
trading to its customers.
An ISO 9001:2000 company
COMTRADE LIMITED
Vijay Kumar Reddy M“Karvy Centre”, 46, Avenue 4, Street No.1
Banjara Hills, Hyderabad - 500 034Mobile: +91-9347780980
Fax : 040 - 6625 9955Visit us at: www.karvycomtrade.com
email: [email protected]
For Details write to us at:
Member of MCX & NCDEXExchange Registration
NCDEX Code: 00236, MCX Code: 10775 FMC Registration
MCX/TCM/CORP/0021, NCDEX/TCM/CORP/0306
Karvy Comtrade's Invest and Harvest July 2008