Embed Size (px)
Citation preview

Supernovae and theirprogenitors
Supernovae (SNe) mark the violenttermination of a star’s life in an explo-sion. They are classified according totheir light curve as type I or II, with thetype I SNe producing very similar lightcurves, while the SNe type II are morediverse. Spectroscopic observations re-veal the presence of hydrogen in SNetype II, while no hydrogen lines are de-tectable in SNe type I. According totheir spectral appearance the type Iclass can be further subdivided into Ia,Ib, and Ic.
SNe type II and Ib,c are observedonly in spiral galaxies and irregulargalaxies containing young stellar popu-lations. This indicates that their progen-itors are short-lived massive stars(masses above 8 M�). Indeed, the oc-currence of SN explosions and the for-mation of a neutron star remnant at theend of the nuclear lifetime of a massivestar are now relatively well understoodprocesses.
However, the question of SN Ia pro-genitors is not yet settled (e.g. Livio
2000). SN Ia are observed in all types ofgalaxies, including elliptical galaxiescontaining only old stellar populations.The light curves of SN Ia are dominatedby the decay of the radioactive materialsynthesized in the explosion (mainlynickel). The 56Ni isotope sits at the topof a decay chain leading to 56Co (half-life 6.1 days) and to stable 56Fe (half-life77 days). The rapid evolution of SN Ialight curves indicates that the precur-sors of these supernovae must be com-pact objects of small mass with very lit-tle mass holding back the gamma-raysproduced by the radioactive decay. Theonly candidate, which can fulfill the ob-servational constraints, is the thermo-nuclear explosion of a white dwarf.
Since type Ia supernovae were identi-fied as excellent distance indicators forcosmology and have provided indica-tions of cosmic acceleration, it is ex-tremely important to have a better un-derstanding of their explosions and thesystems that lead up to them. While it ispossible to test the quality of the dis-tance indicator in the nearby universeby checking the linear Hubble expan-sion, one has to rely on the accuracy ofthe distance indicator to go beyond thelinear Hubble flow and probe the red-shift regime, where the cosmologicalmodels differ in their predictions. At thispoint, other signatures of the reliabilityof the distance indicator have to be se-cured. With lookback times of about half
25
SPY — The ESO Supernovae Type IaProgenitor SurveyR. NAPIWOTZKI1, N. CHRISTLIEB2, H. DRECHSEL1, H.-J. HAGEN2, U. HEBER1, D. HOMEIER4, C. KARL1, D. KOESTER3, B. LEIBUNDGUT5, T.R. MARSH6,S. MOEHLER3, G. NELEMANS7, E.-M. PAULI1, D. REIMERS2, A. RENZINI5, L. YUNGELSON8
1Dr. Remeis-Sternwarte, Universität Erlangen-Nürnberg, Bamberg, Germany; 2Hamburger Sternwarte,Hamburg, Germany; 3Institut für Theoretische Physik und Astrophysik, Universität Kiel, Germany; 4Department ofPhysics & Astronomy, University of Georgia, USA; 5European Southern Observatory, Garching, Germany;6Department of Physics & Astronomy, University of Southampton, UK; 7Institute of Astronomy, Cambridge, UK;8Institute of Astronomy of the Russian Academy of Sciences, Moscow, Russia
Figure 1: Possible evolutionary channels forthe formation of a SN Ia progenitor via thedouble degenerate (DD) and the single de-generate (SD) scenarios. In both scenariosthe evolution starts with a binary of two mainsequence (MS) stars. The more massivestar becomes a red giant and its envelope isejected in a common envelope event. In theDD scenario the second MS star evolves toa red giant with a second common envelopeevent and the formation of a close binary oftwo white dwarfs (WD). If the DD system isclose enough and massive enough, gravita-tional wave radiation will cause it to mergeand explode as a SN Ia. In the two variantsof the SD scenario the secondary fills itsRoche lobe while i) close to the main se-quence or as red giant (RG) or ii) as a He-star after another common envelope phase.Mass is transferred onto the WD star and in-creases the WD mass until theChandrasekhar limit is reached. Note thatthe SD scenarios predict the survival of thecompanion star.

the current age of the universe, one hasto make sure that evolution of the dis-tance indicator is not mimicking a cos-mological effect. To do this reliably onehas to try to understand the distance in-dicator in as many aspects as possible.One of the shortcomings of type Ia su-pernovae is our ignorance of the pro-genitor systems and the exact explo-sion mechanism. By identifying theseprogenitors we should be able to con-strain possible evolutionary effects onthe cosmological result.
While the cosmic microwave back-ground experiments have provided aphenomenal accuracy of the integratedcosmological parameters, they cannotprovide the more detailed measure-ments to explore the expansion historyof the universe, i.e. the equation of stateparameter. Only distance indicators,like type Ia supernovae, can yield thisinformation. But the systematics ofthese derivations have to be assessedas precisely as possible. The knowl-edge of the precursor state and thephysics of the transformation to the su-pernova are hence vital ingredients forour understanding of cosmology.
Most stars (i.e. all stars with a massbelow about 8 solar masses) will endtheir lives as white dwarfs. These aresmall cooling bodies consisting mainlyof carbon and oxygen with thin layers ofhydrogen and/or helium on top, sup-ported by degenerate electron gas.They will cool for billions of years anddisappear as small cold clumps into thecosmic background without signs oftheir once glorious lives. Some whitedwarfs will, however, destroy them-selves in a gigantic thermonuclear ex-plosion. To do so, they have to beforced into a density and temperatureregime, where carbon and oxygen burnexplosively and disrupt the star. Abovethe Chandrasekhar mass (1.4 M�) theelectron degeneracy can no longer sup-port white dwarfs. At this point the whitedwarf either has to collapse to a neutronstar or explode as a supernova. Since
no physical process is known whichleads to such conditions in a singlewhite dwarf, a companion star has tohelp. This general picture of binarywhite dwarfs as the progenitor stars fortype Ia supernovae is the most com-monly held view today.
The growth of a white dwarf toChandrasekhar mass is a long-standingproblem of observational astrophysics.Several channels have been identifiedas possibly yielding such a critical mass(Fig. 1). They can broadly be groupedinto two classes (e.g. Livio 2000). Thesingle degenerate (SD) channel inwhich the white dwarf is accompaniedby a regular star, either a main se-
quence star, a (super)giant, or a heliumstar, as mass donor and the double de-generate (DD) channel where the com-panion is another white dwarf. CloseDDs radiate gravitational waves, whichresults in a shrinking orbit due to theloss of energy and angular momentum.If the initial separation is close enough(orbital periods below 10 h), a DD sys-tem could merge within a Hubble time,and if the combined mass exceeds theChandrasekhar limit the DD would qual-ify as a potential SN Ia progenitor.
The double degenerate scenario forthe progenitors was proposed manyyears ago. So far, no SN Ia progenitorhas been identified, which is not really
26
Figure 3: UVESspectrum of the DAwhite dwarf WD1026+023. The up-per three panelscorrespond to theblue channel and toboth parts of the redchannel covered bydifferent CCDs. Thespectra weresmoothed to a reso-lution of 1 Å. Two reduction arti-facts are indicatedby asterisks.The lower panelshows the unbinnedspectra of the Hαand Hβ line cores.
Figure 2: Distribution of allknown white dwarfs southof δ = +25° and brighterthan V = 16.5. Redsquares indicate whitedwarfs with two spectrataken by SPY. A second spectrumremains to be collected forthe green triangles, whilethe black dots are the re-maining objects without aSPY observation. The yel-low band indicates the po-sition of the Galactic disk(|b| < 20°).
surprising considering the rareness ofSNe Ia and the small volume that canbe surveyed for white dwarfs. The or-bital velocity of white dwarfs in potentialSN Ia progenitor systems must be large(>150 km/s) making radial velocity (RV)surveys of white dwarfs the most prom-ising detection method. Several sys-tematic RV searches for DDs were un-dertaken starting in the mid 1980’s.Before 2001, combining all the surveys,� 200 white dwarfs were checked forRV variations with sufficient accuracyyielding 18 DDs with periods P < 6.3 d(Marsh 2000 and references therein).None of the 18 systems seems massiveenough to qualify as a SN Ia precursor.This is not surprising, as theoreticalsimulations suggest that only a few per-cent of all DDs are potential SN Ia pro-genitors (Iben, Tutukov & Yungelson1997; Nelemans et al. 2001). It is obvi-ous that larger samples are needed forstatistically significant tests.
The surveys mentioned above wereperformed with 3–4-m class telescopes.A significant extension of the samplesize without the use of larger telescopeswould be difficult due to the limited num-ber of bright white dwarfs. This situationchanged after the ESO VLT becameavailable. In order to perform a defini-tive test of the DD scenario we haveembarked on a large spectroscopic sur-vey of more than 1000 white dwarfs us-ing the UVES spectrograph at the UT2telescope (Kueyen) of VLT to search forRV variable white dwarfs (ESO SN IaProgenitor surveY – SPY). SPY willovercome the main limitation of all ef-forts so far to detect DDs that are plau-sible SN Ia precursors: the samples ofsurveyed objects were too small.
The survey
As outlined above, we need a verylarge input sample of white dwarfs,which are bright enough (B �16.5) totake high-resolution spectra with a suf-ficiently high signal-to-noise ratio. Themost complete catalogue of spectro-scopically confirmed white dwarfs is theactual version of the McCook & Sion(1999) catalogue. However, it contains“only” 918 white dwarfs brighter thanB = 16.5 south of δ = +25°. Since weneeded a larger input sample, weadded more objects from recent sur-veys: the Hamburg-ESO survey (HES),the Hamburg-Quasar survey (HQS), theMontreal-Cambridge-Tololo survey (MCT),and the Edinburgh-Cape survey (EC). Amap of all known white dwarfs (ob-served and unobserved by SPY) fulfill-ing our criteria is shown in Fig. 2. A strik-ing feature is a lack of white dwarfs inthe Galactic plane. This cannot be ex-plained by interstellar extinction, be-cause bright white dwarfs are nearbyobjects. However, all major surveys dur-ing the last decades (including the sur-veys mentioned above) were aimed at
the detection of galaxies and quasarsand restricted to high Galactic latitudes.
Spectra were taken with the UV-Visual Echelle Spectrograph (UVES) ofthe UT2 telescope (Kueyen) of the ESOVLT. UVES is a high resolution Echellespectrograph, which can reach a reso-lution of 110,000 in the red region witha narrow slit. Our instrument set-up(Dichroic 1, central wavelengths 3900Å and 5640 Å) uses UVES in a dichroicmode. Nearly complete spectral cover-age from 3200 Å to 6650 Å with only tworoughly 80 Å wide gaps at 4580 Å and5640 Å is achieved.
Our programme was implemented asa large programme in service mode. Ittakes advantage of those observingconditions, which are not usable bymost other programmes (moon, badseeing, clouds) and keeps the VLT busywhen other programmes are not feasi-ble. A wide slit (2.1�) is used to minimizeslit losses and a 2 x 2 binning is appliedto the CCDs to reduce read out noise.Our wide slit reduces the spectral reso-lution to R = 18,500 (0.36 Å at Hα) orbetter, if seeing discs were smaller thanthe slit width. Depending on the bright-ness of the objects, exposure times be-tween 5 min and 10 min were chosen.The S/N per binned pixel (0.03 Å) of theextracted spectrum is usually 15 orhigher. Due to the nature of the project,two spectra at different, “random”epochs separated by at least one dayare observed.
ESO provides a data reductionpipeline for UVES, based on MIDASprocedures. The quality of the reduced
spectra is in most cases very good; es-pecially the removal of the interordersensitivity variation and merging of theorders works very well. Sometimes thereduction pipeline produces artifacts ofvarying strength, e.g. a quasiperiodicpattern in the red region similar in ap-pearance to a fringing pattern. In a fewcases either the blue or the red part ofthe spectrum has extremely strong arti-facts of unknown origin. This pipelinereduction was extremely useful for afast selection of RV variable DDs for fol-low-up observations (described below).In the meantime we have produced asemi-automatic set of procedures forthe reduction of our UVES spectra. A re-reduction of the survey data is alreadycompleted and yielded a large set ofgood quality white dwarf spectra.
As an example of the quality achiev-able the spectrum of a hydrogen-richDA white dwarf is shown in Fig. 3. Acharacteristic feature of white dwarfsare the very broad spectral lines causedby the high densities in their atmos-pheres. Obviously, broad lines are veryill-suited for RV measurements. Howe-ver, deviations from local thermal equi-librium (LTE) produce sharp NLTEcores of the Hα lines in the atmos-pheres of hydrogen-rich DA whitedwarfs (Fig. 3), which allow accurateRV measurements. This feature is notpresent in non-DA white dwarfs (spec-tral types DB, DO) with hydrogen-pooratmospheres, but the use of several he-lium-lines enables us to reach a similaraccuracy.
Since SPY produces a large number
27
Figure 4: Three single-lined RV variable DDsfrom our VLT survey. Thevertical line marks therest wavelength of Hα.The spectra are slightlyrebinned (0.1 Å) withoutdegrading the resolution.

of spectra, which have to be checkedfor RV variations, a fast and reliable al-gorithm to measure RV shifts is neces-sary. We apply a “cross-correlation”routine based on a χ2 test (descriptionin Napiwotzki et al. 2001). The RV shiftis evaluated from the minimum χ2. Errormargins can be estimated from the χ2
statistics as well. One great advantageof our procedure is its flexibility and thatit can easily be applied to measure RVshifts in stars of different spectral types(Balmer lines of DA white dwarfs, HeIlines of DBs, HeII and metal lines of hotDO white dwarfs). We routinely meas-ure RVs with an accuracy of about 2km/s, therefore running only a verysmall risk of missing a merger precur-sor, which have orbital velocities of 150km/s or higher.
The large programme was finished atthe end of last semester. A total of 1014stars were observed (Fig. 2). This cor-responds to 75% of the known whitedwarfs accessible by VLT and brighterthan B =16.5. A second spectrum is stilllacking for 242 white dwarfs, but timehas been granted to complete these ob-servations. Currently we could check772 stars for RV variations, and detect-ed 121 new DDs, 16 are double-linedsystems (only 6 were known before).The great advantage of double-lined bi-naries is that they provide us with a welldetermined total mass. Since it is likelythat the SPY sample contains evenmore double-lined systems (with a faintsecondary), we will check follow-up ob-servations of apparently single-linedsystems for the signature of the sec-
ondary. Our sample includes manyshort period binaries (some examplesare discussed in the next section), sev-eral with masses closer to theChandrasekhar limit than any systemknown before. In addition, we detected19 RV variable systems with a coolmain sequence companion (pre-cata-clysmic variables; pre-CVs). Some ex-amples of single-lined and double-linedDDs are shown in Fig. 4 and 7. Our ob-servations have already increased theDD sample by a factor of seven. Aftercompletion, a final sample of about 150DDs is expected.
Follow-up observations of this sam-ple are mandatory to exploit its full po-tential. Periods and white dwarf param-eters must be determined to find poten-tial SN Ia progenitors among the candi-dates. Good statistics of a large DDsample will also set stringent con-straints on the evolution of close bina-ries, which will dramatically improve ourunderstanding of this phase of stellarevolution. During our follow-up observa-
tions we have detected a very promis-ing potential SN Ia precursor candidate.However, some additional observationsare necessary to verify our RV curve so-lution.
Although important information likethe periods, which can only be derivedfrom follow-up observations, are pre-sently lacking for most of the stars, thelarge sample size already allows us todraw some conclusions. (Note that fun-damental white dwarf parameters likemasses are known from the spectralanalysis described below). One inter-esting aspect concerns white dwarfs ofnon-DA classes (basically the helium-rich spectral types DB, DO, and DZ, incontrast to the hydrogen-rich DAs).SPY is the first RV survey which per-forms a systematic investigation of bothclasses of white dwarfs: DAs and non-DAs. Previous surveys were restrictedto DA white dwarfs. Our result is that thebinary frequency of the non-DA whitedwarfs is equal to the value determinedfor the DA population within the statisti-cal accuracy.
Parameters of double degenerates
Once the binaries in the white dwarfsample have been revealed, follow-upobservations are necessary to deter-mine the system parameters of theDDs. We concentrated on candidateswith high RV variations, indicating shortperiods, because the probability to findpotential SN Ia candidates is highestamong these systems. However, let usnote that probably some of the “smallRV” DDs could be short period systems(possibly even SN Ia progenitors) withlow inclination angles and/or un-favourable phase differences of theSPY observations.
The secondary of most DD systems
28
Figure 6: Periods (P) and system masses(Mtotal) determined from follow-up observa-tions of DDs from SPY. Results for double-lined systems (black circles) are comparedto previously known systems (green circles).The other DD systems are single-lined (tri-angles: WD primaries; diamonds: sdB pri-maries). The masses of the unseen com-panions are estimated from the mass func-tion for the expected average inclination an-gle (i = 52 °).
Figure 5: Mass deter-mination of (single andbinary) DA whitedwarfs. Temperatureand gravity, determinedfrom a modelatmosphere analysis ofthe UVES spectra(Koester et al., 2001)are compared to cool-ing sequences of whitedwarfs (Blöcker et al.,1997) for a range ofwhite dwarf masses.
has already cooled down to invisibility.These DDs are single-lined spectro-scopic binaries (SB1). Our spectroscop-ic follow-up observations allow us to de-termine the orbit of the primary compo-nent (i.e. the period P and the radial ve-locity amplitude K1). The mass of theprimary M1 is known from a model at-mosphere analysis (Fig. 5). Cons-traints on the mass of the secondary M2
can be derived from the mass function:M2
3sin
3i / (M1 + M2)
2= K1
3P/(2πG). (1)
For a given inclination angle i themass of the secondary can be comput-ed. However, i is rarely known, but theresult for i = 90° yields a lower mass lim-it. For a statistical analysis it is useful toadopt the most probable inclination i =52°. We have plotted the single-linedsystems with the resulting system massin Fig. 6. Note that two binaries haveprobably combined masses in excess ofthe Chandrasekhar limit. However, theperiods are rather long preventingmerging within a few Hubble times.
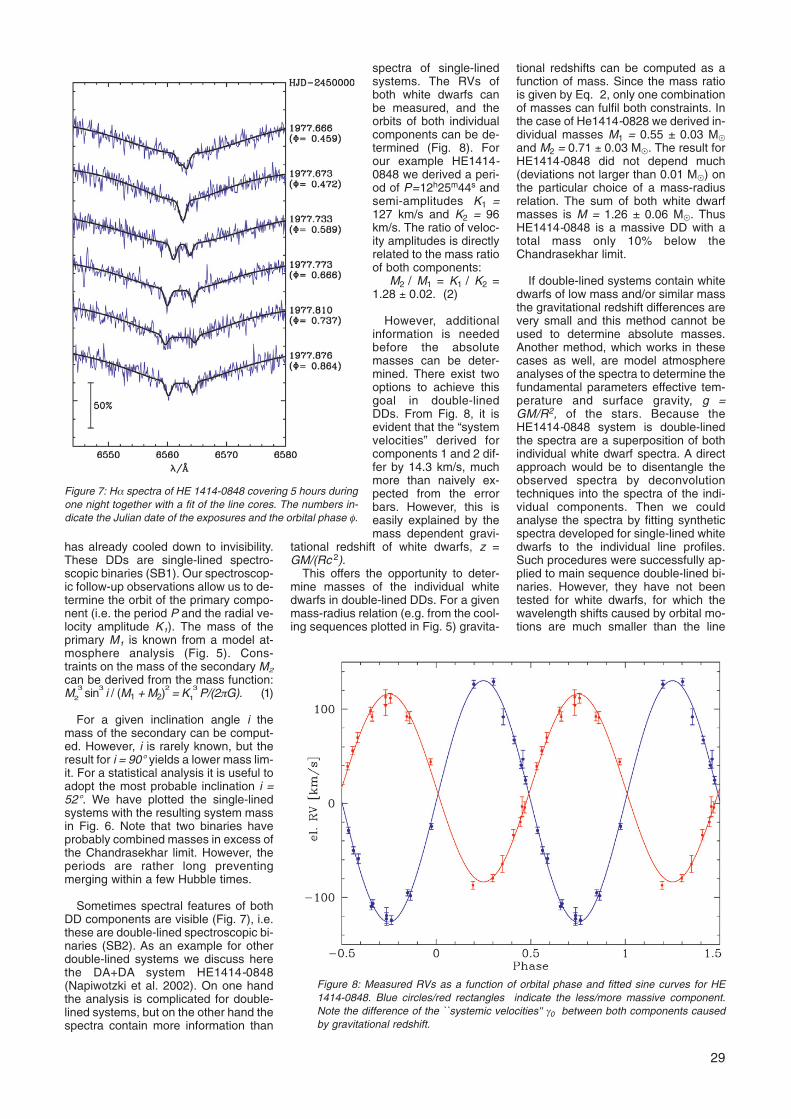
Sometimes spectral features of bothDD components are visible (Fig. 7), i.e.these are double-lined spectroscopic bi-naries (SB2). As an example for otherdouble-lined systems we discuss herethe DA+DA system HE1414-0848(Napiwotzki et al. 2002). On one handthe analysis is complicated for double-lined systems, but on the other hand thespectra contain more information than
spectra of single-linedsystems. The RVs ofboth white dwarfs canbe measured, and theorbits of both individualcomponents can be de-termined (Fig. 8). Forour example HE1414-0848 we derived a peri-od of P=12h25m44s andsemi-amplitudes K1 =127 km/s and K2 = 96km/s. The ratio of veloc-ity amplitudes is directlyrelated to the mass ratioof both components:
M2 / M1 = K1 / K2 =1.28 ± 0.02. (2)
However, additionalinformation is neededbefore the absolutemasses can be deter-mined. There exist twooptions to achieve thisgoal in double-linedDDs. From Fig. 8, it isevident that the “systemvelocities” derived forcomponents 1 and 2 dif-fer by 14.3 km/s, muchmore than naively ex-pected from the errorbars. However, this iseasily explained by themass dependent gravi-
tational redshift of white dwarfs, z =GM/(Rc 2).
This offers the opportunity to deter-mine masses of the individual whitedwarfs in double-lined DDs. For a givenmass-radius relation (e.g. from the cool-ing sequences plotted in Fig. 5) gravita-
tional redshifts can be computed as afunction of mass. Since the mass ratiois given by Eq. 2, only one combinationof masses can fulfil both constraints. Inthe case of He1414-0828 we derived in-dividual masses M1 = 0.55 ± 0.03 M�
and M2 = 0.71 ± 0.03 M�. The result forHE1414-0848 did not depend much(deviations not larger than 0.01 M�) onthe particular choice of a mass-radiusrelation. The sum of both white dwarfmasses is M = 1.26 ± 0.06 M�. ThusHE1414-0848 is a massive DD with atotal mass only 10% below theChandrasekhar limit.
If double-lined systems contain whitedwarfs of low mass and/or similar massthe gravitational redshift differences arevery small and this method cannot beused to determine absolute masses.Another method, which works in thesecases as well, are model atmosphereanalyses of the spectra to determine thefundamental parameters effective tem-perature and surface gravity, g =GM/R2, of the stars. Because theHE1414-0848 system is double-linedthe spectra are a superposition of bothindividual white dwarf spectra. A directapproach would be to disentangle theobserved spectra by deconvolutiontechniques into the spectra of the indi-vidual components. Then we couldanalyse the spectra by fitting syntheticspectra developed for single-lined whitedwarfs to the individual line profiles.Such procedures were successfully ap-plied to main sequence double-lined bi-naries. However, they have not beentested for white dwarfs, for which thewavelength shifts caused by orbital mo-tions are much smaller than the line
29
Figure 8: Measured RVs as a function of orbital phase and fitted sine curves for HE1414-0848. Blue circles/red rectangles indicate the less/more massive component.Note the difference of the ``systemic velocities'' γ0 between both components causedby gravitational redshift.
Figure 7: Hα spectra of HE 1414-0848 covering 5 hours duringone night together with a fit of the line cores. The numbers in-dicate the Julian date of the exposures and the orbital phase φ.

widths of the broad Balmer lines.Therefore we choose a different ap-proach for our analysis of double-linedDD systems. We used the programmeFITSB2, which performs a spectralanalysis of both components of double-lined systems. It is based on a χ2 mini-mization technique using a simplex al-gorithm. The fit is performed on all avail-able spectra covering different spectralphases simultaneously, i.e. all availablespectral information is combined intothe parameter determination procedure.
The total number of fit parameters(stellar and orbital) is high. Thereforewe fixed as many parameters as possi-ble before performing the model atmos-phere analysis. We have kept the radialvelocities of the individual componentsfixed according to the radial velocitycurve. Since the mass ratio is alreadyaccurately determined from the radialvelocity curve we fixed the gravity ratio.The remaining fit parameters are the ef-fective temperatures of both compo-nents and the gravity of the primary.The gravity of the secondary is adjustedaccording to the primary value duringthe fitting procedure. The surface gravi-ties also determine the relative weightof the two model spectra from the ra-dius, obtained from mass-radius rela-tions. The flux ratio in the V-band is cal-culated from the actual parameters andthe model fluxes are scaled according-ly. The individual contributions are up-dated consistently as part of the itera-tion procedure.
The results for HE1414-0848 areTeff/log g = 8380 K/7.83 and 10900K/8.14 for components 1 and 2. A sam-ple fit is shown in Fig. 9. The derived logg values are in good agreement with thevalues corresponding to the masses de-rived from the RV curves: log g = 7.92and 8.16, respectively.
We have plotted HE1414-0848 aswell as our other results on double-linedsystems in Fig. 6. Note that one double-lined system is probably a SN Ia pro-genitor. However, the RV curve of thehotter component is very difficult tomeasure causing the large error bars.Observing time with the far-UV satelliteFUSE has been allocated, which willenable us to measure more accurateRVs.
Concluding remarks
The large programme part of SPYhas now been completed with some ob-servations underway to complete theobservations of the white dwarfs withonly one spectrum taken during the sur-vey. We increased the number of whitedwarfs checked for RV variablity from200 to 1000 and multiplied the numberof known DDs by a factor of seven (from18 to 139) compared to the resultsachieved during the last 20 years. Oursample includes many short period bi-naries (Fig. 6), several with masses
closer to the Chandrasekhar limit thanany system known before, greatly im-proving the statistics of DDs. We expectthis survey to produce a sample ofabout 150 DDs.
This will allow us not only to find sev-eral of the long sought potential SN Iaprecursors (if they are DDs), but willalso provide a census of the final bina-ry configurations, hence an importanttest for the theory of close binary starevolution after mass and angular mo-mentum losses through winds and com-mon envelope phases, which are verydifficult to model. An empirical calibra-tion provides the most promising ap-proach. A large sample of binary whitedwarfs covering a wide range in param-eter space is the most important ingre-dient for this task.
Our ongoing follow-up observationsalready revealed the existence of threeshort period systems with masses closeto the Chandrasekhar limit, which willmerge within 4 Gyrs to two Hubbletimes. Even if it will finally turn out thatthe mass of our most promising SN Iaprogenitor candidate system is slightlybelow the Chandrasekhar limit, our re-sults already allow a qualitative evalua-tion of the DD channel. Since the for-mation of a system slightly belowChandrasekhar limit is not very differentfrom the formation of a system abovethis limit, the presence of these threesystems alone provides evidence (al-though not final proof) that potential DDprogenitors of SN Ia do exist.
Spin-off resultsSPY produces an immense, unique
sample of very high resolution whitedwarf spectra. This database will havea large impact on many fields of whitedwarf science. It will allow us for the first
time to tackle many longstanding ques-tions on a firm statistical basis. Amongthose are the mass distribution of whitedwarfs, the kinematical properties of thewhite dwarf population, surface compo-sitions, luminosity function, rotationalvelocities, and detection of weak mag-netic fields. A first part of the SPY sam-ple was published in a recent paper ofKoester et al. (2001), covering observa-tions of about 200 white dwarfs of spec-tral types DA and DB. For all spin-off op-portunities mentioned above the statis-tics will be dramatically improved by thefinal white dwarf spectra database. Weare exploiting the SPY sample for twospin-off projects, which take advantageof the high spectral resolution: the kine-matics of white dwarfs (Pauli et al.2003) and their rotational velocities. Amore detailed description of ongoingspin-off activity is given in Napiwotzki etal. (2001).
References
Blöcker, T., Herwig, F., Driebe, T., Bramkamp,H., Schönberner D.1997, in: White dwarfs,eds. J. Isern, M. Hernanz, E. Garcia-Berro, Kluwer, Dordrecht, p.57
Iben, I. Jr., Tutukov, A. V., Yungelson, L. R.,1997, ApJ, 475, 291
Koester, D., Napiwotzki, R., Christlieb, N., etal., 2001, A&A, 378, 556
Livio, M., 2000, in: “Type Ia Supernovae:Theory and Cosmology”, Cambridge Univ.Press, p. 33
Marsh, T. R., 2000, NewAR, 44, 119 McCook, G. P., Sion, E. M., 1999, ApJS, 121, 1Napiwotzki, R., Christlieb, N., Drechsel, H.,
et al. 2001, AN, 322, 201 Napiwotzki, R., Koester, K., Nelemans, G., et
al., 2002, A&A, 386, 957 Nelemans, G., Yungelson, L. R., Portegies
Zwart, S. F., Verbunt, F., 2001, A&A, 365, 491Pauli, E.-M., Napiwotzki, R., Altmann, M. et
al., 2003, A&A, 400, 877
30
Figure 9: Modelatmosphere fit of theBalmer series of HE1414-0848 withFITSB2. This is only asample fit. Allavailable spectra,covering different or-bital phases, wereused simultaneously.