Embed Size (px)
Citation preview
SQL Server Analysis Services 2012 Cube Development Cookbook
Baya Dewald
Steve Hughes
Paul Turley
Chapter No. 9
"Using Tabular Models"
In this package, you will find: A Biography of the authors of the book
A preview chapter from the book, Chapter NO.9 "Using Tabular Models"
A synopsis of the book’s content
Information on where to buy this book
About the Authors Baya Dewald has been working with Microsoft SQL Server for over 15 years and with
Analysis Services since its debut in 1999. He has architected, developed, and
administered databases with millions of users and cubes measured in terabytes.
Throughout his career, he has held various certifications, including Microsoft Certified
Solution Developer, Microsoft Certified Systems Engineer, and Microsoft Certified
Database Administrator. He has managed DBA teams and published over 100 technical
articles in SQL Server Magazine, SQL Professional, Tech Target, and InformIT. He has
also contributed to several technical books as a co-author and technical reviewer. He can
be reached at .
First and foremost, I'd like to thank my family for allowing me to
dedicate long hours to working on this book. I am also thankful to my
friend Scot Reagin for his encouragement and support while writing
this book and to my friend and mentor Kevin Kline who helped me
find excellent co-authors. Thanks too to all reviewers, particularly to
Dan English, for their useful and thought-provoking comments that
helped to make this book more useful to the readers.
For More Information: www.packtpub.com/sql-server-analysis-services-2012-cube-development-
cookbook/book
Paul Turley is a mentor with SolidQ and is a Microsoft SQL Server MVP. He consults,
writes, speaks, teaches, and blogs about business intelligence and reporting solutions. He
works with companies around the world to visualize and deliver critical information to
make informed business decisions. He is the director of the Oregon SQL PASS chapter
and user group, and the lead author of Professional SQL Server 2012 Reporting Services
and 11 other books by Wrox and Microsoft Press. Paul blogs at
.
Special thanks to my wife and daughters for their support and
understanding. Thanks to all the mentors and staff at SolidQ, a truly
world-class organization.
Steve Hughes is a Practice Lead at Magenic. In his current role, he develops strategy and
helps guide data, business intelligence, collaboration, and data integration development
using Microsoft technologies, including SQL Server, SharePoint, and BizTalk. He
continues to deliver data and business intelligence solutions using these platforms. He has
been working with technology for over 15 years with much of that time spent on creating
business intelligence solutions. He is passionate about using data effectively and helping
customers understand that data is valuable and profitable. He also has experience working
with a large software company as a service vendor and there received awards for
customer satisfaction and engineering excellence.
In 2010, he received the Consultant of the Year honor at Magenic. He has delivered
multiple presentations on SQL server, data architecture, and business intelligence over
the years. Steve can often be found at Professional Association for SQL Server (PASS)
events where he serves as a regional mentor and is active with the Minnesota SQL
Server User Group (MNPASS). He shares his insights from the field on his blog at
I want to thank my wife, Sheila, and our four children—Kristyna,
Alex, Andrew, and Mikayla—for their patience as I worked on this
project. Their support has been awesome in this and my other
endeavors. I also want to thank the team at Packt Publishing and the
reviewers for their guidance throughout the writing of this book as it
has allowed us to put together a better product for all of you. Finally, I
dedicate all my efforts to my father-in-law, Ed Jankowski, without
whom I would have never been involved in software at all. We all
miss you, Ed.
For More Information: www.packtpub.com/sql-server-analysis-services-2012-cube-development-
cookbook/book
SQL Server Analysis Services 2012 Cube Development Cookbook SQL Server Analysis Services 2012 Cube Development Cookbook is a friendly
companion to individuals implementing and managing business intelligence applications
using Microsoft's flagship product, SQL Server Analysis Services. The book provides
step-by-step recipes for developing Analysis Service s objects. Readers will learn how to
develop business intelligence solutions using the Analysis Services multidimensional
model as well as the Tabular Model. In addition to development recipes, the book also
includes recipes for administering, securing, monitoring, troubleshooting, and scaling
Analysis Services solutions. The book discusses methods beyond the initial cube design,
exploring cube maintenance with partitions and designing effective aggregations, as well
as options for synchronizing analytics solutions. Filled with tips and recommended best
practices based on years of experience, the book is designed to quickly get the reader
from beginner level to the point of comfortably architecting solutions.
What This Book Covers Chapter 1, Introduction to Multidimensional Data Model Design, discusses the value of
business intelligence as well as challenges faced when undertaking a business
intelligence project and how to overcome them. You will learn high-level differences
between Analysis Services tabular and multidimensional models and when each is
appropriate. Finally, you will learn the differences between star and snowflake schemas
for dimensional modeling.
Chapter 2, Defining Analysis Services Dimensions, starts off by explaining how to define
data sources and data source views. You will learn how to extend data source views
beyond the model available in the relational database. The chapter's main focus is on
teaching you how to build and customize most commonly encountered dimensions within
the Analysis Services multidimensional model.
Chapter 3, Creating Analysis Services Cubes, explains how to define measure groups and
measures while setting appropriate properties. You will learn how to relate database
dimensions to each measure group and implement basic as well as advanced measure
aggregation functions, including distinct count and semi-additive measures. The chapter
also discusses cube fi le structures and teaches the most effective strategies for measure
group partitioning and building aggregations. Finally, you will learn various methods of
deploying your multidimensional projects to your Analysis Services instances.
For More Information: www.packtpub.com/sql-server-analysis-services-2012-cube-development-
cookbook/book
Chapter 4, Extending and Customizing Cubes, builds on the foundation of cube
development laid in Chapter 3, Creating Analysis Services Cubes. You will learn how to
make your solutions more useful to the business by adding calculated measures, named
sets, actions, key performance indicators, perspectives, translations, and measure
expressions to your cubes.
Chapter 5, Optimizing Dimension and Cube Processing, teaches basic and advanced
options for processing multidimensional objects through XMLA, SQL Server client tools,
as well as using SQL Server Integration Services (SSIS). This chapter also demonstrates
how you should monitor and tune processing performance.
Chapter 6, MDX, explains how to write the most commonly encountered
Multidimensional Expressions (MDX) queries and calculations. You will learn how to
return data on query axes, limit and sort query output, define calculations and named
sets, and navigate dimension hierarchies. The chapter also explains the basic functions
used within MDX scripts and introduces the framework for monitoring and tuning
MDX queries.
Chapter 7, Analysis Services Security, teaches how to manage multidimensional model
security at the Analysis Services instance, database, cube, dimension, and cell levels. In
addition to basic role-based security, the chapter also includes a recipe for implementing
dynamic security.
Chapter 8, Administering and Monitoring Analysis Services, starts off by providing an
overview of Analysis Services configuration options. Next, you learn how to create and
drop databases, monitor and troubleshoot Analysis Services instances, and check the size
of each object. Additionally, you will learn various methods for scaling out your
multidimensional business intelligence solutions using backup and restore,
synchronization, and the detach and attach options.
Chapter 9, Using Tabular Models, teaches you how to define data sources and models
and load data into Tabular Models. You will learn how to define hierarchies, define
calculated measures, and extend the Tabular model using key performance indicators.
The chapter also explains recommended strategies for processing, partitioning, and
securing Tabular Models.
Chapter 10, DAX Calculations and Queries, introduces the reader to Data Analysis
Expressions (DAX) fundamentals as it applies to defining calculations within the Tabular
Model and querying the model. You will learn how to write calculated columns and
measures in the Tabular Model designer and DAX queries within SQL Server
Management Studio.
For More Information: www.packtpub.com/sql-server-analysis-services-2012-cube-development-
cookbook/book
9Using Tabular Models
In this chapter, we will cover:
Creating a Tabular Model
Working with data sources and loading data
Modeling the data
Creating a hierarchy
Creating a calculated measure
Creating a calculated column
Creating a KPI
Analyzing your model in Excel
Deploying Tabular Models
Scripting Tabular Models using XMLA
Processing Tabular Models
Partitioning Tabular Models
Implementing perspectives
Implementing security in Tabular Models
Automating Tabular Model processing
For More Information: www.packtpub.com/sql-server-analysis-services-2012-cube-development-
cookbook/book
Using Tabular Models
224
IntroductionThis chapter covers the concepts of creating SQL Server Analysis Services (SSAS) Tabular Models that are included in SQL Server 2012. Tabular Models are the enterprise implementation of the xVelocity In-Memory Analytics Engine models that were introduced with Power Pivot and SQL Server 2008 R2. Often, Tabular Models are the result of working with Power Pivot models. The Power Pivot and Tabular Models are built on the same technology. However, there are some features which are not included in Power Pivot but are available in Tabular such as DirectQuery, partitions, and higher-level security. In this chapter, we will focus on building Tabular Models in SSAS using Visual Studio.
We will be using SQL Server Data Tools (SSDT) in this chapter to create our model. Much of the work that we do in the initial creation of the model can also be done using Microsoft Excel 2010 or Microsoft Excel 2013 with the Power Pivot add-in. The design interface is very similar, so you will be able to use much of what you learn here to create Power Pivot models as well. As a result, I will be calling out those features that are exclusively the domain of SSAS so that you are able to understand the expanded capabilities of the Tabular Model.
In this chapter, we will be using the SQL Server sample database, AdventureWorksDW2012, which can be downloaded from www.codeplex.com. The sample work in this chapter will focus on the Internet Sales fact table (factInternetSales) and its related dimension tables.
Creating a Tabular ModelIn this recipe, we will walk through creating a Tabular Model database project using SSDT. As you begin working with Tabular Models, you will see that some of the complexities in setting up a good multidimensional model do not apply. While working with multidimensional models, you typically need all of the data organized and ready for consumption by Analysis Services. However, Tabular Models are much more forgiving. The key design requirement to take into consideration is: What data does the business need? As a result, we will create a model database here and work through model modifi cations in the following recipes.
Getting readyBefore you create your fi rst Tabular Model database, you must have an installation of Analysis Services with a Tabular Model instance available to you. This can be a local installation or a network installation. This is required because a Tabular Model database is developed in real time using the xVelocity In-Memory Analytics Engine and RAM to store the database while you are working with it.
For More Information: www.packtpub.com/sql-server-analysis-services-2012-cube-development-
cookbook/book
Chapter 9
225
How to do it…Let's get started on our Tabular Model by performing the following steps:
1. Using SSDT, choose to create a new project. This will bring up the New Project dialog. From this dialog, there are three methods to create a new Tabular project. Two of them are import options: Import from PowerPivot and Import from Server (Tabular). Although they are not the subject of this recipe, I do want to call these options out. The Import from Power Pivot option is particularly effective while upgrading a Power Pivot model to take advantage of the Tabular Model features in Analysis Services. This usually includes expanded requirements such as security, processing, and partitioning. You can create a Tabular Model that serves as a template that can be modifi ed to meet any business needs. This makes the Import from Server (Tabular) option compelling for scenarios that can use baseline models for targeted analysis.
2. We are going to pursue the fi rst option in the list that allows us to build a Tabular Model using Visual Studio. Select Analysis Services Tabular Project, give the new project a name, and set a location that will work for you.
3. Once you have set these details, click on OK to create the project. This will create a new solution, a new project, and a development database on your tabular instance.
If you have a local Tabular Model instance of SSAS, the project will point to that. However, if the project cannot discover the tabular instance, you will be prompted to select the instance to be used for the project.
4. In the project's solution explorer, you will see your project and a Model.bim fi le. This fi le is the container for your Tabular Model. However, as I mentioned before, the actual development requires a tabular instance.
Only one BIM file will exist in the project. Tabular database projects only support one model.
For More Information: www.packtpub.com/sql-server-analysis-services-2012-cube-development-
cookbook/book
Using Tabular Models
226
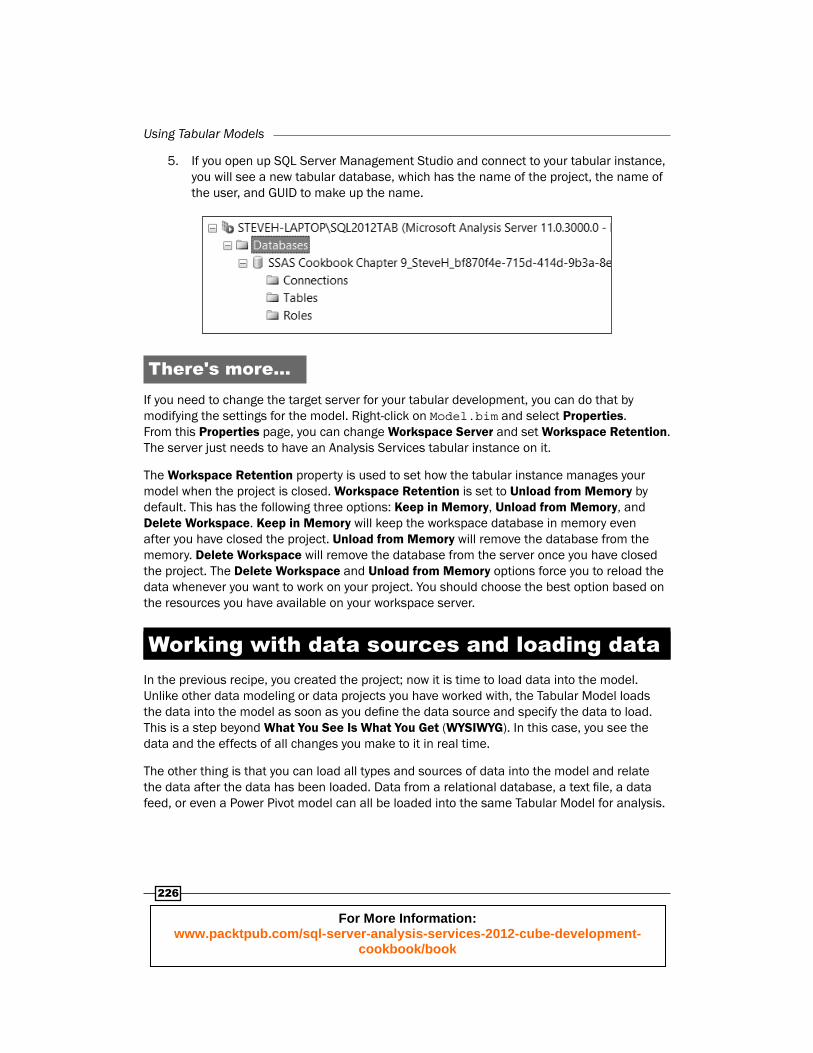
5. If you open up SQL Server Management Studio and connect to your tabular instance, you will see a new tabular database, which has the name of the project, the name of the user, and GUID to make up the name.
There's more…If you need to change the target server for your tabular development, you can do that by modifying the settings for the model. Right-click on Model.bim and select Properties. From this Properties page, you can change Workspace Server and set Workspace Retention. The server just needs to have an Analysis Services tabular instance on it.
The Workspace Retention property is used to set how the tabular instance manages your model when the project is closed. Workspace Retention is set to Unload from Memory by default. This has the following three options: Keep in Memory, Unload from Memory, and Delete Workspace. Keep in Memory will keep the workspace database in memory even after you have closed the project. Unload from Memory will remove the database from the memory. Delete Workspace will remove the database from the server once you have closed the project. The Delete Workspace and Unload from Memory options force you to reload the data whenever you want to work on your project. You should choose the best option based on the resources you have available on your workspace server.
Working with data sources and loading dataIn the previous recipe, you created the project; now it is time to load data into the model. Unlike other data modeling or data projects you have worked with, the Tabular Model loads the data into the model as soon as you defi ne the data source and specify the data to load. This is a step beyond What You See Is What You Get (WYSIWYG). In this case, you see the data and the effects of all changes you make to it in real time.
The other thing is that you can load all types and sources of data into the model and relate the data after the data has been loaded. Data from a relational database, a text fi le, a data feed, or even a Power Pivot model can all be loaded into the same Tabular Model for analysis.
For More Information: www.packtpub.com/sql-server-analysis-services-2012-cube-development-
cookbook/book
Chapter 9
227
In multidimensional models, you will create a data source and then a data source view. The next step is to fi nish designing the dimensions and measure groups. Once you have completed the design, you will load data. In a Tabular Model, creating the data source and loading the data are done simultaneously.
In our example, we will be loading tables from the AdventureWorksDW2012 database. We will be using the project that was created in the previous recipe as the target for our recipe.
How to do it…In your project, you will notice that there is no concept of creating a data source:
1. Open the model by double-clicking on Model.bim or choose Open from the context menu. Once the model is open, you will be looking at a blank tab in the Visual Studio IDE.
2. From the MODEL menu at the top of the IDE, choose Import from Data Source. As you can see, there is no create data source option. Instead, once you select your data, it will be loaded into memory on the target Tabular Model instance.
It is very important to understand the size of the data you are planning to work with in your Tabular Model. If you have a lot of rows, very wide rows, or a combination thereof, you may need to start with a sample set or a filtered set of data to keep the loading time shorter and to manage memory consumption better during the development process.
3. Once you click on Import from Data Source, you will open the Connect to a Data Source dialog. In our example, we will be using Microsoft SQL Server to connect to our AdventureWorksDW2012 database. However, many different data sources are supported by Tabular Models, and while the process may vary from source to source, the result is the same—data is imported into your model.
4. Once you have selected your data source, click on Next, and you will be prompted to fi ll out the connection information.
5. As you complete the connection information, Microsoft will create a name based on the properties you have specifi ed, such as SqlServer ServerNameSQL2012DB AdventureWorksDW2012 in our case. As you can see, it concatenated the data source, server name, and database name. While being informative, something like Adventure Works DW would also be easier to understand and work with. This also solves an issue where you need to change the server name at a later time, but you want to keep the same connection name.
For More Information: www.packtpub.com/sql-server-analysis-services-2012-cube-development-
cookbook/book
Using Tabular Models
228
6. On the next dialog, you will be prompted for the impersonation information. The purpose of this information is to set a user or a set of credentials that can be used by the tabular instance to refresh the data. You can specify a user account or use the service account if your instance's service account has access to the data source.
7. Our next step allows us to choose the data. There are two ways to get data from a relational data source: you can choose from a list of tables and views, or you can write a query. In most cases, you will fi nd that selecting from tables and views will be a quicker solution.
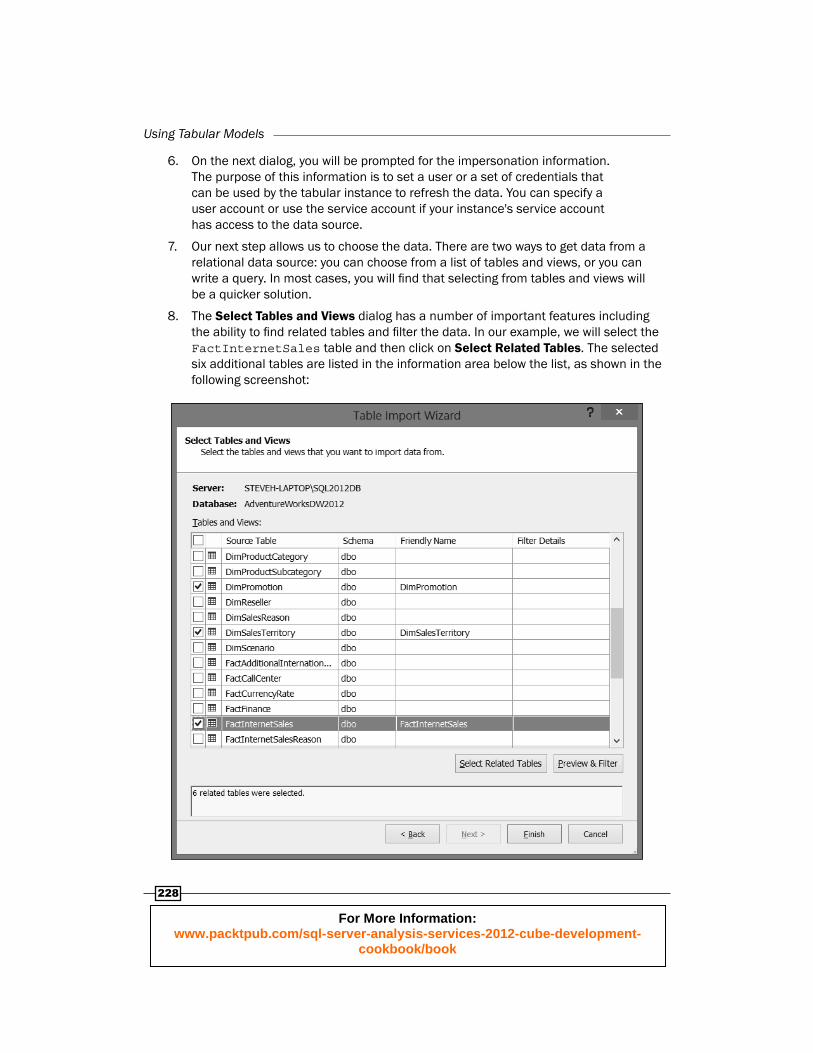
8. The Select Tables and Views dialog has a number of important features including the ability to fi nd related tables and fi lter the data. In our example, we will select the FactInternetSales table and then click on Select Related Tables. The selected six additional tables are listed in the information area below the list, as shown in the following screenshot:
For More Information: www.packtpub.com/sql-server-analysis-services-2012-cube-development-
cookbook/book
Chapter 9
229
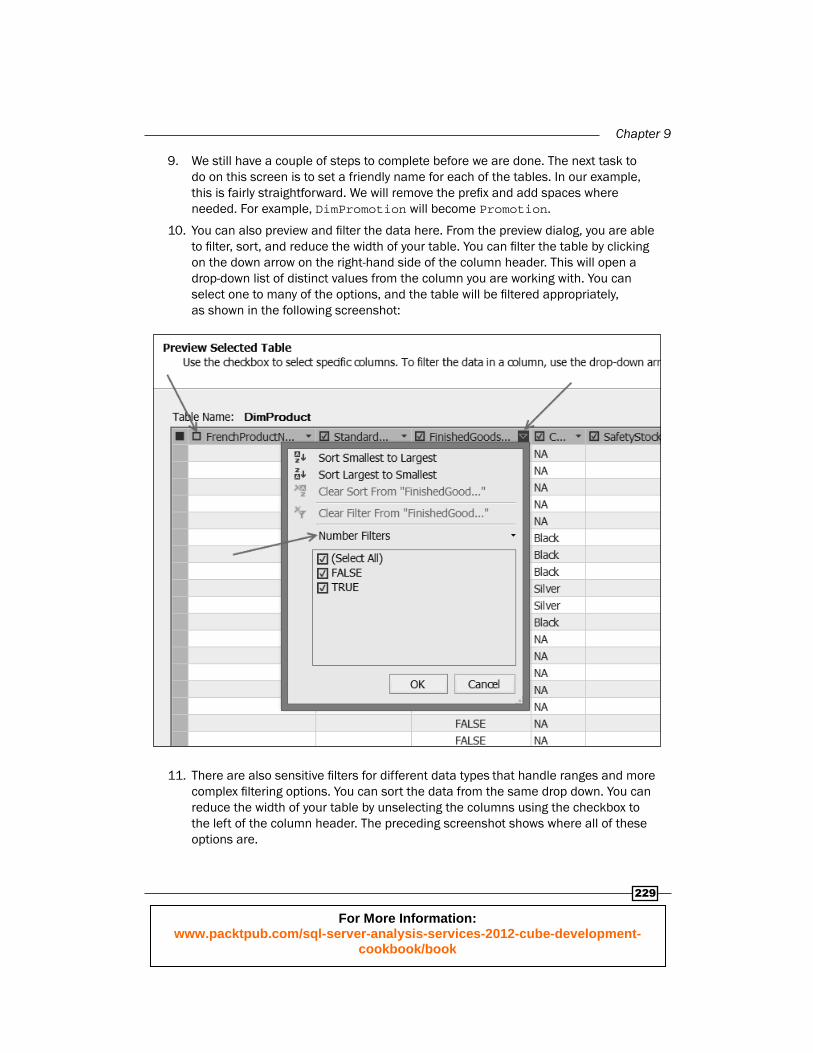
9. We still have a couple of steps to complete before we are done. The next task to do on this screen is to set a friendly name for each of the tables. In our example, this is fairly straightforward. We will remove the prefi x and add spaces where needed. For example, DimPromotion will become Promotion.
10. You can also preview and fi lter the data here. From the preview dialog, you are able to fi lter, sort, and reduce the width of your table. You can fi lter the table by clicking on the down arrow on the right-hand side of the column header. This will open a drop-down list of distinct values from the column you are working with. You can select one to many of the options, and the table will be fi ltered appropriately, as shown in the following screenshot:
11. There are also sensitive fi lters for different data types that handle ranges and more complex fi ltering options. You can sort the data from the same drop down. You can reduce the width of your table by unselecting the columns using the checkbox to the left of the column header. The preceding screenshot shows where all of these options are.
For More Information: www.packtpub.com/sql-server-analysis-services-2012-cube-development-
cookbook/book
Using Tabular Models
230
12. Once the data has been selected and fi ltered, click on Finish. The data will start importing, showing the current table being imported and the number of rows transferred to the model.
Reducing columns at the data source will help improve performance during the design process and ultimately in the final model.
13. After the data has been successfully loaded, you will see an Excel-like display of the imported data. At this point, you should save the model so that you do not lose your work.
There's more…Not only can you select tables, you can also create a query. When you choose to create a query, you will be asked to set a friendly name (which is Query by default) and enter the SQL statement. In our case, we will use a query to bring in the contents of the ProductCategory and ProductSubCategory tables. A designer is available by clicking on the Design button, but I would recommend that you use a query tool, such as SQL Server Management Studio, to do the initial design work on your query.
We are going to use the following query to create a ProductCategory table in our model:
select pc.ProductCategoryKey ,pc.EnglishProductCategoryName as CategoryName ,psc.ProductSubcategoryKey ,psc.EnglishProductSubcategoryName as SubcategoryNamefrom DimProductCategory pcinner join DimProductSubcategory psc on pc.ProductCategoryKey = psc.ProductCategoryKey
In the query import, you do not have preview or fi ltering options. You can validate the syntax from here though. Once your query is ready, click on Finish to load the data into the model. The import dialog is the same as that for the tables but will only contain one work item in this case. Once it is done, your data has been loaded into the model.
If you need to add more tables or queries from the same data source, you can use the Existing Connections button on the toolbar or the MODEL menu. This will open up a dialog with the data sources you have already created. By naming your connections in a meaningful way, this dialog will allow you to add data easily from the existing connections in your model.
For More Information: www.packtpub.com/sql-server-analysis-services-2012-cube-development-
cookbook/book
Chapter 9
231
Modeling the dataNow that the data has been loaded, there are a few modeling techniques that should be applied to the model. Due to the mash up nature of the Tabular Models, you will likely need to do the following common clean up operations:
Update column names
Fix data types and formats
Add relationships
You will learn how to do each of these in this recipe.
Getting readyBefore you can model data, you will need data in your model. If you have not loaded data yet, refer to the previous recipe on loading data.
How to do it…You will be working in SSDT to make the changes.
1. Our fi rst change is to update the column names. The column names should be user-friendly and easy to understand.
2. You can rename the column by right-clicking on the column and selecting Rename Column from the shortcut menu. In some complex scenarios, you may be required to rename all of the columns. In particular, this will likely be required for text loads that may be loaded with column names; for example, Column1, Column2, and so on.
As a best practice, you should update column names when the data is loaded and before you begin updating the model. This will prevent issues with calculations that are added to the model later and are dependent on the column names.
3. It is also important to verify and fi x any data types that were not properly identifi ed during the load. While loading from relational data sources is usually not a problem, it is a common issue from fi le-based or feed-based sources.
4. You can change the data type in the Properties page of the selected column. In the Basic section, you will see the Data Type property, which has a drop-down list of the supported types.
For More Information: www.packtpub.com/sql-server-analysis-services-2012-cube-development-
cookbook/book
Using Tabular Models
232
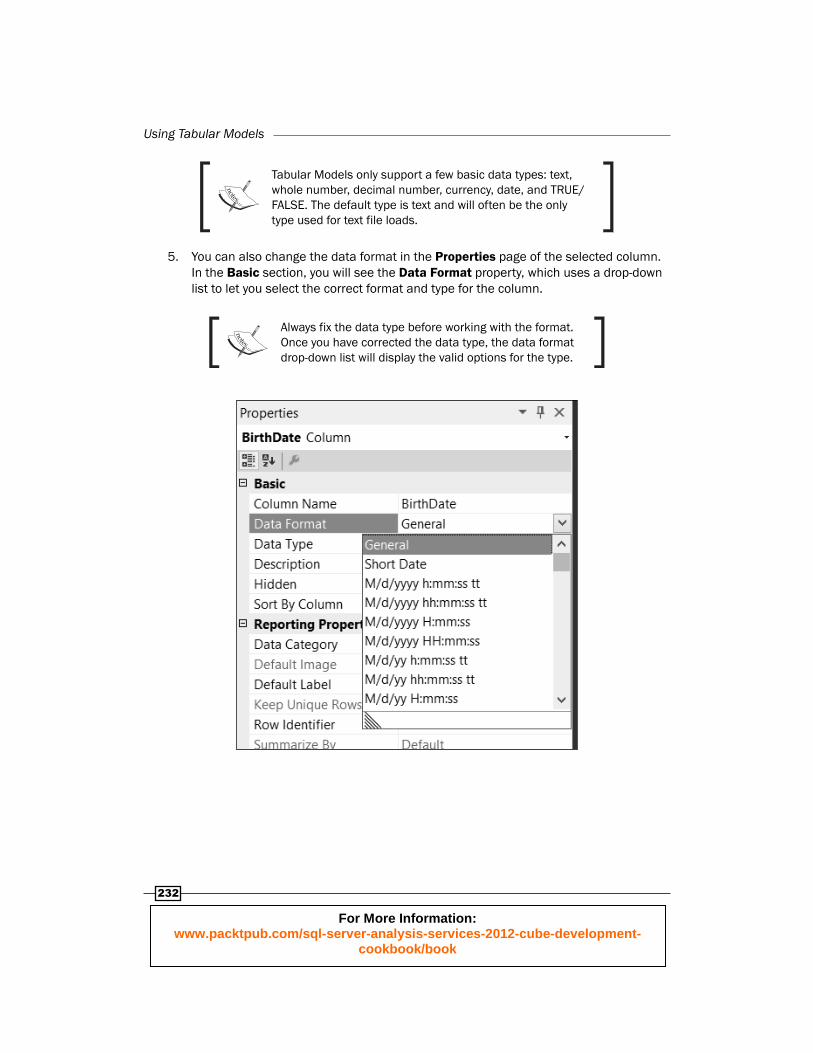
Tabular Models only support a few basic data types: text, whole number, decimal number, currency, date, and TRUE/FALSE. The default type is text and will often be the only type used for text file loads.
5. You can also change the data format in the Properties page of the selected column. In the Basic section, you will see the Data Format property , which uses a drop-down list to let you select the correct format and type for the column.
Always fix the data type before working with the format. Once you have corrected the data type, the data format drop-down list will display the valid options for the type.
For More Information: www.packtpub.com/sql-server-analysis-services-2012-cube-development-
cookbook/book
Chapter 9
233
6. The third model modifi cation is adding relationships. Relationship building is likely the most important part of the modeling process as it allows the user to interact with the data in interesting ways. However, you should fi x columns and data types prior to working with the relationships.
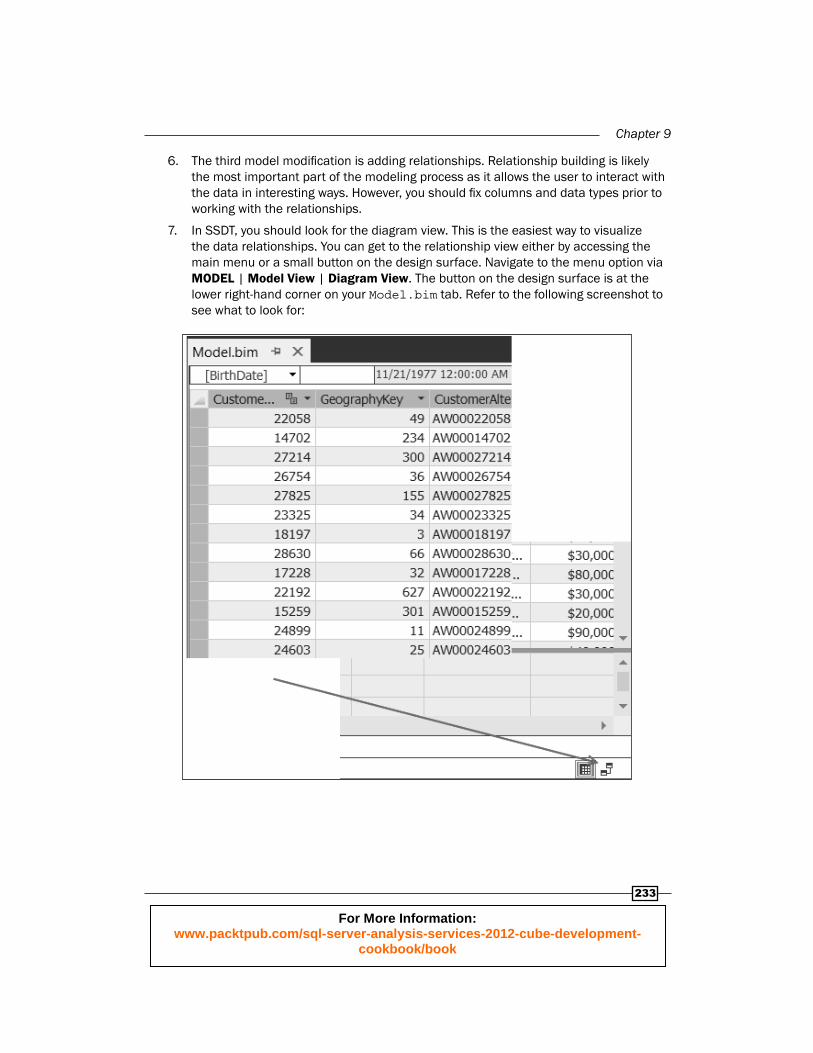
7. In SSDT, you should look for the diagram view. This is the easiest way to visualize the data relationships. You can get to the relationship view either by accessing the main menu or a small button on the design surface. Navigate to the menu option via MODEL | Model View | Diagram View. The button on the design surface is at the lower right-hand corner on your Model.bim tab. Refer to the following screenshot to see what to look for:
For More Information: www.packtpub.com/sql-server-analysis-services-2012-cube-development-
cookbook/book
Using Tabular Models
234
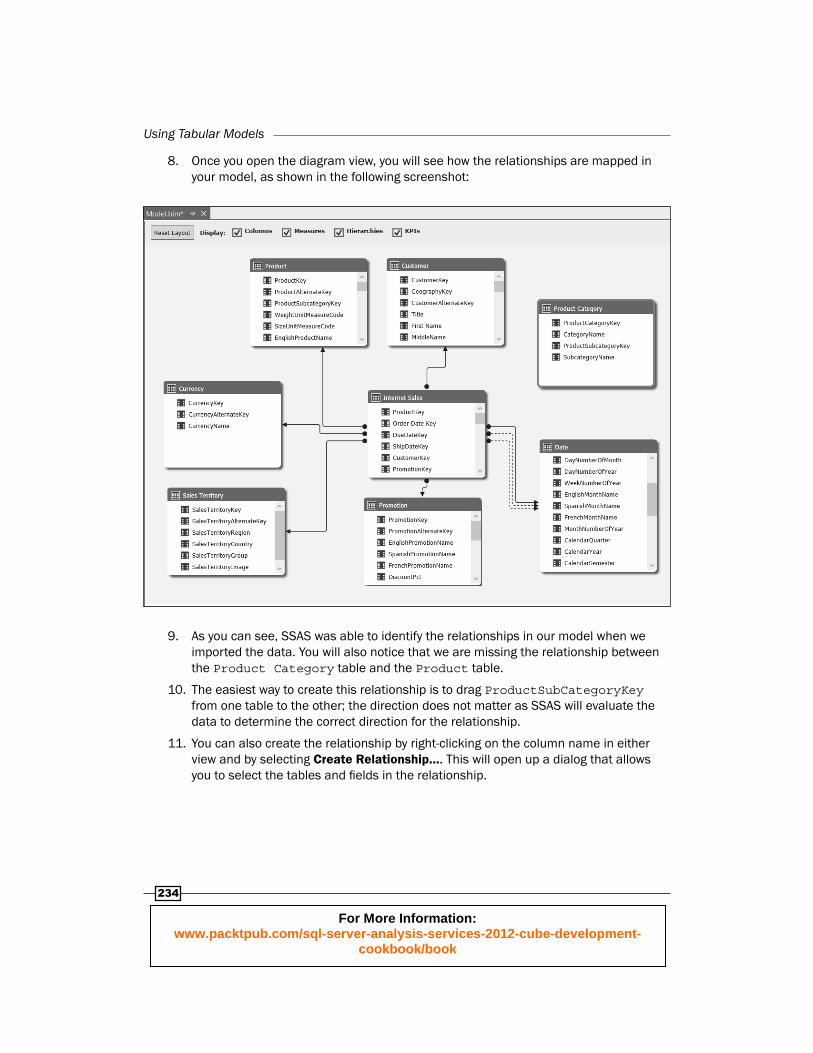
8. Once you open the diagram view, you will see how the relationships are mapped in your model, as shown in the following screenshot:
9. As you can see, SSAS was able to identify the relationships in our model when we imported the data. You will also notice that we are missing the relationship between the Product Category table and the Product table.
10. The easiest way to create this relationship is to drag ProductSubCategoryKey from one table to the other; the direction does not matter as SSAS will evaluate the data to determine the correct direction for the relationship.
11. You can also create the relationship by right-clicking on the column name in either view and by selecting Create Relationship…. This will open up a dialog that allows you to select the tables and fi elds in the relationship.
For More Information: www.packtpub.com/sql-server-analysis-services-2012-cube-development-
cookbook/book
Chapter 9
235
12. You need to be aware of a couple of restrictions around relationship building. The Tabular Model does not support a multifi eld relationship. Tabular Models also do not support role-playing dimensions. If you look at the preceding screenshot, you can see that the relationships between the Date table and the Internet Sales tables include dotted lines. These represent nonactive relationships in the model. Only active relationships can be used in major parts of the data analysis natively.
Inactive relationships can still be used through DAX. Refer to Chapter 10, DAX Calculations and Queries, to see how DAX can be used to extend the model.
How it works…While loading the data, SSAS evaluates the data and sets the settings (previously discussed) based on what it can learn from the data source. For instance, if foreign keys are discovered in the incoming data, and the related tables are also imported at the same time, relationships will be added to the model during the initial load. (Subsequent loads with new tables will not include the relationships.) The model will also evaluate data types during this initial load and set them in the model. These features work well with metadata-rich data sources such as relational databases. However, some sources provide little to no information during the load process, such as text fi les, and need to be reconciled as previously mentioned.
There's more…Actually, there are many other options you can use to refi ne your model. The following are just a few additional options you should consider while you are fi nishing your model:
Specifying the date table
Setting the default columns
Hiding the columns from client tools
Hiding the tables from client tools
You should note that the sorting and filtering of data within the design surface of SSDT does not affect the data presented to the user. These features help you as a designer to view relevant data during the modeling process.
Once the date table is specifi ed, time intelligence can be applied to the data. You can specify a table as a date table by navigating to TABLE | Date | Mark As Date Table when the table is selected. In our example, select the Date table and then set it as the Date table for the model. Usually, this will detect and set the date column of this table as well, but it is always good to verify that the correct column was identifi ed.
For More Information: www.packtpub.com/sql-server-analysis-services-2012-cube-development-
cookbook/book
Using Tabular Models
236
You can also designate certain columns as part of the Default Field Set property. This can be done from the Properties page for a column or a table. In the Reporting Properties section, click on the ellipse button to the right of the Default Field Set property. This will allow you to select the fi elds and the order of those fi elds that represent the default view of the table. This can be used by some client tools that enable you to select a table instead of individual fi elds while creating visualizations.
Often, there are fi elds included in the model that do not need to be seen or used by the users. You can hide these by using the Context menu on a column and selecting the Hide from Client Tools option, or by changing the value of the Hidden property on the Properties page. The same options work for tables; you just need to select the table instead of the column.
See also If you need to use a multifi eld relationship between tables within the model, checkout
the Creating a calculated column recipe. Calculated columns can reshape the data to make relationships work.
Creating a hierarchyAs with multidimensional models, hierarchies can be helpful while defi ning the relationship between the fi elds in a table. The Tabular Model allows you to add hierarchies that can be used by client tools.
How to do it…You will need to open the diagram view (MODEL | Model View | Diagram View) in order to work with hierarchies. In this recipe, we will be using the Date table and creating a calendar and fi scal hierarchy, which are used pretty commonly, by performing the following steps:
1. In the diagram view, you need to click on the Create Hierarchy button on the Date table. This will add a hierarchy section to the bottom of the table. You will assign a name to the hierarchy here and then drag fi elds to add to the hierarchy.
2. Our hierarchy will be fairly simple. Drag the columns down to the hierarchy. You need to drag the fi rst column directly on to the hierarchy name.
3. Each column thereafter, you will drag and place in the preferred order of the hierarchy. I would recommend that you drag the columns by always adding new columns to the bottom of the fi eld list; for example, CalendarYear, CalendarQuarter, EnglishMonthName, FullDateAlternateKey.
For More Information: www.packtpub.com/sql-server-analysis-services-2012-cube-development-
cookbook/book
Chapter 9
237
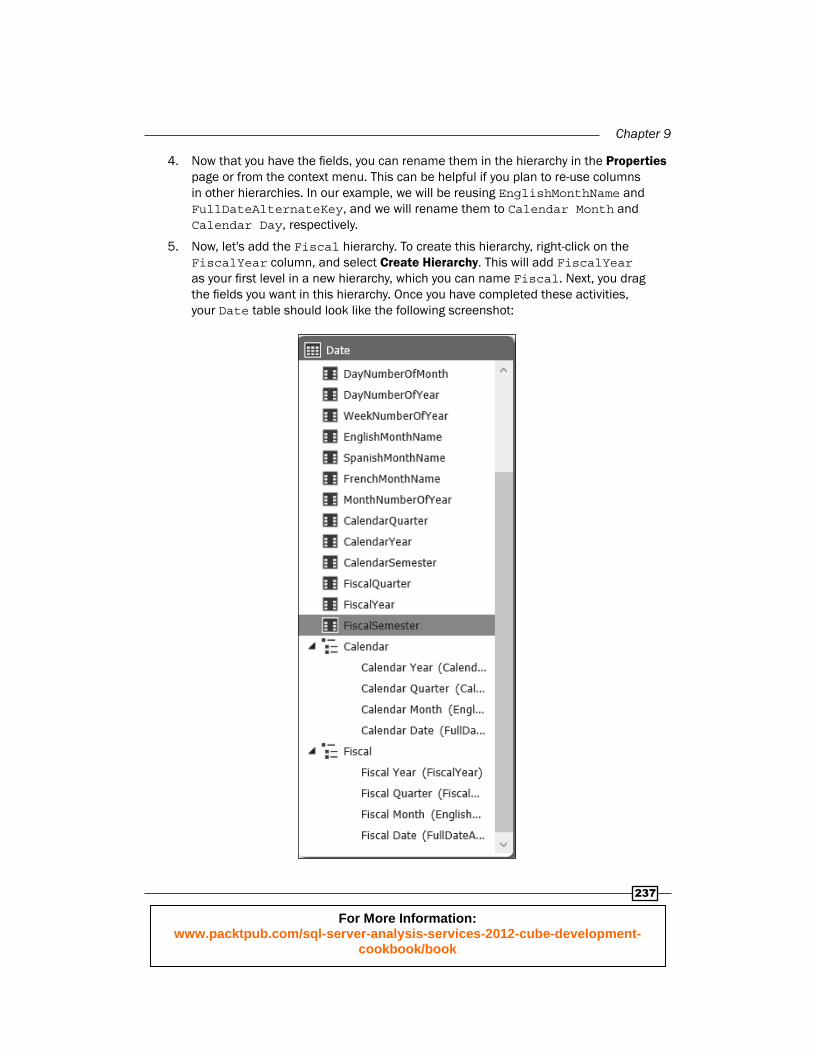
4. Now that you have the fi elds, you can rename them in the hierarchy in the Properties page or from the context menu. This can be helpful if you plan to re-use columns in other hierarchies. In our example, we will be reusing EnglishMonthName and FullDateAlternateKey, and we will rename them to Calendar Month and Calendar Day, respectively.
5. Now, let's add the Fiscal hierarchy. To create this hierarchy, right-click on the FiscalYear column, and select Create Hierarchy. This will add FiscalYear as your fi rst level in a new hierarchy, which you can name Fiscal. Next, you drag the fi elds you want in this hierarchy. Once you have completed these activities, your Date table should look like the following screenshot:
For More Information: www.packtpub.com/sql-server-analysis-services-2012-cube-development-
cookbook/book
Using Tabular Models
238
There's more…You can modify the hierarchies later as needed. From the Context menu on the hierarchy, you can change the order of the fi elds in the hierarchy or remove fi elds that no longer fi t in your hierarchy. For example, if you wanted to add the semester levels to the hierarchies, you can drop those anywhere into the hierarchy and move them to the proper location.
Creating a calculated measureOne of the great strengths in a model is the ability to create calculated measures and calculated columns. This recipe will cover calculated measures, and the next recipe will discuss calculated columns. However, this is a good place to differentiate between the two.
A good example of a calculated measure would be the sum of sales in our sample model. In this case, we will want to slice the sum by many different values within the model, such as date, customer, and product. A calculated measure will use these values to create a slice of references that are used to get the sum of sales.
One example of a calculated member is a formatted customer name such as Last name, first name. In this case, you need to use the context of the row in the table as part of the calculation because each row will use its values in the calculation. More on calculated columns can be found in the next recipe.
In this recipe, you will learn how to create calculated measures within the model.
Getting readyYou need to have the data view of the model open. Open the Internet Sales table and we will begin.
How to do it…In the Internet Sales table, select the SalesAmount column. The quickest way to add a calculated measure is by using the Aggregation button on the toolbar, which also looks like a sum symbol. Because the most common aggregation used in analytic models is sum, it is therefore the default option. However, the drop down will create averages, counts, distinct counts, max, and min aggregations for the selected column as well.
For More Information: www.packtpub.com/sql-server-analysis-services-2012-cube-development-
cookbook/book
Chapter 9
239
1. Select the Sales Amount column, and then click on the sum symbol. This will create a new calculated measure in the measure grid below the column. If you click on the cell in the measure grid, you will see the DAX formula used to create the calculation. It should be similar to the following formula:
Sum of SalesAmount:=SUM([SalesAmount])
2. If you want to change the name, you can change it in the formula bar or in the Properties page using the Measure Name property . The name precedes the colon and equal sign. The expression would look like the following, when the name is changed to Total Sales:
Total Sales:=SUM([SalesAmount])
One of the key differences between the Tabular Model and the multidimensional model is its support for distinct counts. Distinct counts require additional work in multidimensional models, whereas this is not required in the Tabular Models.
3. You can also add calculations based on multiple columns. In our next example, we will calculate the effective tax rate by dividing the tax amount by the sales amount. As a calculated measure, we want this to still be a sliceable value. To create this calculation, we will add a formula anywhere in the measure grid at the bottom of the design surface. The formula we will add is as follows:
=SUM('Internet Sales'[TaxAmt])/ SUM('Internet Sales'[SalesAmount])
4. When you add this formula in the measure grid, it is assigned a generic name such as Measure 1. As previously mentioned, you can and should change the name. You can also change the formatting in the Properties page. This measure should be in the percent format.
See also For a more detailed discussion on DAX, refer to Chapter 10, DAX Calculations and
Queries, where more complex DAX calculations will be discussed.
For More Information: www.packtpub.com/sql-server-analysis-services-2012-cube-development-
cookbook/book
Using Tabular Models
240
Creating a calculated columnUnlike calculated measures, calculated columns use row context with the formula. Calculated columns also are helpful for nonaggregated calculations such as concatenated text values like formatted full names (Last Name, First Name).
How to do it…Using the data grid design view, there are a couple of ways to add the column. You can right-click on a column header, and use the Insert Column option to add a column to the left of the selected column. The other option is to go to the far right of the data grid, and you will see an undefi ned column with Add Column in the header:
1. Let's create a full name column in the Customer table for reporting. Click on the Add Column header at the end of the grid.
2. In the formula bar at the top of the grid, add an equal sign. To add the last name to the formula, scroll over to the left and select any value in the LastName column. This will add [LastName] to the formula.
While not applicable here, you can also change tables and select columns from other tables to add to the formula. This works best with related tables.
3. After adding the last name, add the following characters & ", " & and then type "[F", and you should see [FirstName] in the intellisense list. Click on [FirstName] and hit Enter. This will add the column at the end of the data grid. The completed formula is [LastName] & ", " & [FirstName].
Be aware that hitting Enter while the item is highlighted in the intellisense list will complete the entry and build the column. If you are not done creating the formula, you may find this frustrating. Use the Tab key instead while writing formulas to avoid this issue.
4. Once you have completed the formula, you should rename the column to Full Name.
For More Information: www.packtpub.com/sql-server-analysis-services-2012-cube-development-
cookbook/book
Chapter 9
241
There's more…In the Modeling the data recipe, I mentioned that data can be related using calculated columns. This is important while working with data from different sources where the data may not be naturally related. You can resolve this issue by using calculated columns which will support relationships. A quick example would be bringing in an external ZIP code reference table named ZipCode. If your Address table had the ZIP+4 format, (55778-4224) and the new ZipCode table only had ZIP codes without the "+4" (55778), you could create a calculated column on the Address table to strip those extra fi ve characters off (=Right([Address].[ZipCode],5)). Now, a relationship is possible between the new column in Address and the existing column in ZipCode.
See also Check out more options for creating calculated columns in Chapter 10, DAX
Calculations and Queries, in the section on DAX formulas.
Creating a KPIKey Performance Indicators (KPIs) are used to visualize specifi c metrics that represent the overall health of what is being measured, such as sales or growth. The Tabular Model supports the creation of KPIs that can be used in various client tools.
Getting readyYou need to fi rst create a calculated measure. We will use two new calculations for this KPI in the Internet Sales table. In Measure Grid, create a new measure in the Total Product Cost column, named Total Cost. You can do this by simply clicking on a cell in the column in Measure Grid in the Total Product Cost column. Next, use the aggregation shortcut on the toolbar to create a SUM measure and rename the column Total Cost.
Once you have Total Cost created, you will use Total Cost and Total Sales created in the previous recipe to create a new measure named Cost Percent. In Measure Grid, click on a cell and add the following expression to the formula bar:
Cost Percent:=[Total Cost] / [Total Sales]
All that is left is to set the format for this new calculation to percentage with two decimal places. This will help with the presentation of the new calculation.
As mentioned previously, it is very important that you use good names and formatting as you create measures. Consider this as a best practice, and make it a habit when designing Tabular Models.
For More Information: www.packtpub.com/sql-server-analysis-services-2012-cube-development-
cookbook/book
Using Tabular Models
242
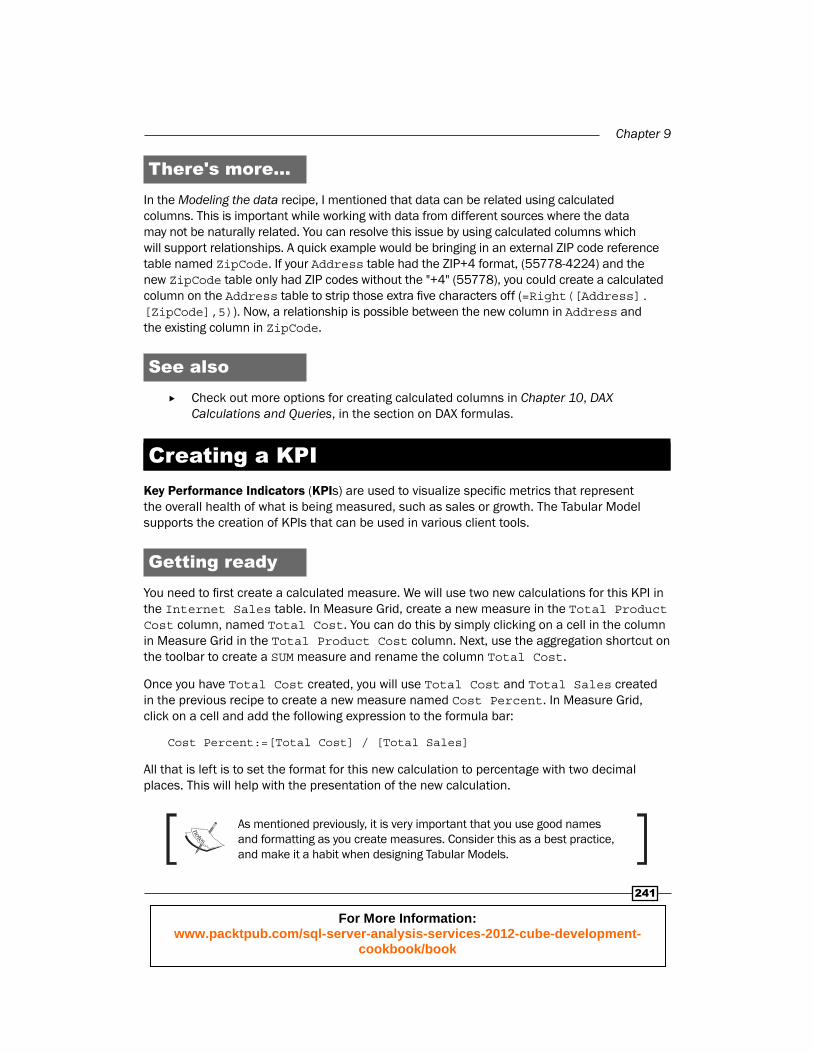
How to do it…Now that we have the supporting measures created, we can add the KPI by performing the following steps:
1. You can add a KPI by right-clicking on the calculated measure or using the Create KPI icon on the ribbon. This will open the following screenshot:
If you look at the preceding screenshot, you will notice the four key elements that make up a KPI: KPI base measure, target value, status thresholds, and icon style. Let's work through each element.
For More Information: www.packtpub.com/sql-server-analysis-services-2012-cube-development-
cookbook/book
Chapter 9
243
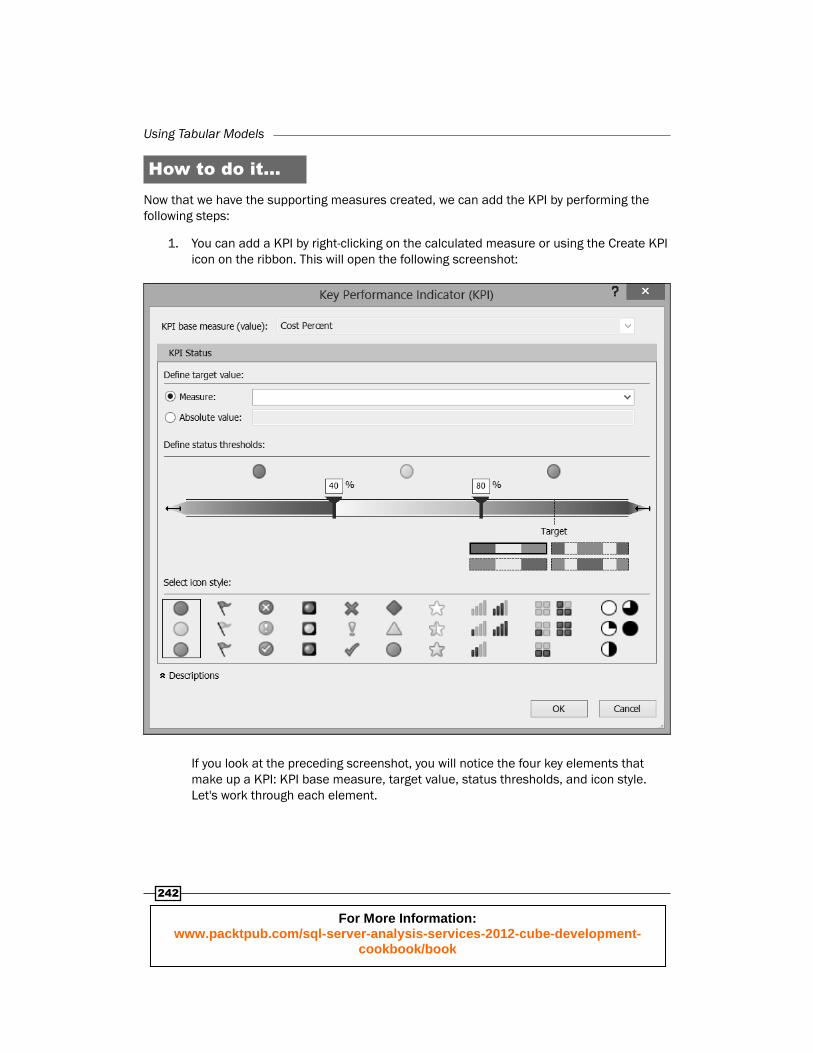
2. When you create the KPI, you select a calculated measure in the measure grid. This becomes the base measure. The role of the base measure is the value which will be measured against the target value. In our example, Cost Percent is our KPI base measure.
3. The target value can be sourced from one of two areas. The fi rst option is to use another calculated measure. You would use that option when you can use calculation for targets. For instance, if you created a calculation to represent the previous year's sales, you could use that as the target. In our example, we are using a percentage value, which lends itself well to using the other option, an absolute value. Let's say that you set a target of 50 percent of the total cost for all sales. Then you would select the Absolute value option and put 0.5 into the textbox.
4. Next, you need to defi ne the status thresholds. There are four sample color grids in the lower right-hand side of the threshold defi nition. These represent your options to create your thresholds. They represent how to display the KPI based on the distance from the target. The threshold options will change based on the icon set selected.
5. Select the fi rst icon set, which has the red, yellow, and green circles.
6. Next, you need to select the threshold style in the lower left-hand corner, which has three colors in the order green, yellow, and red. This lets us represent lower cost percentages as good and higher percentages as bad. At this point, you would notice a dotted line on the threshold bar named Target. This bar represents the target value.
7. Our next decision is to split the threshold among our three options. Drag the left-most marker to the Target bar. It should now have 0.5 as the value above it. This means that we are marking our target or lower as "good" or green.
8. Next, we need to determine what the range for "concerned" or yellow should be. You can set this at 0.6. Even if you do not see that much room on the right-hand side of the threshold bar, keep moving the marker as it will expand as you need it to. You can also enter values directly into the white boxes above the markers.
For More Information: www.packtpub.com/sql-server-analysis-services-2012-cube-development-
cookbook/book
Using Tabular Models
244
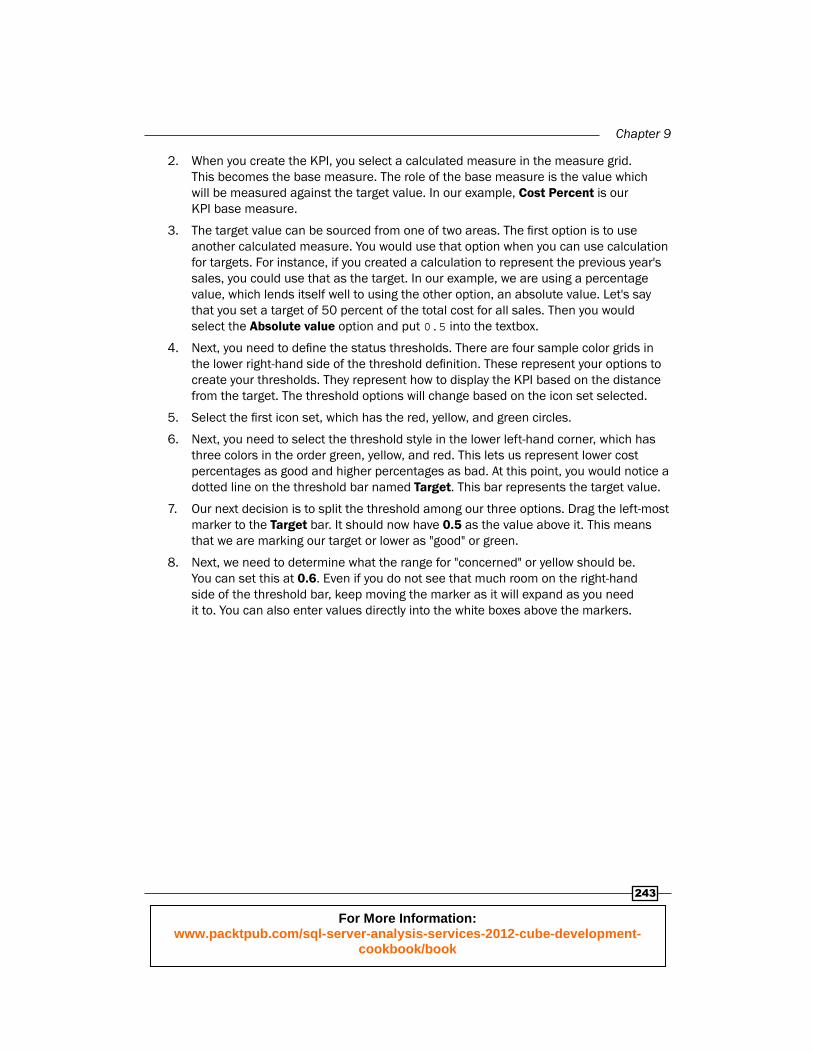
9. Your fi nished dialog should look like the following screenshot:
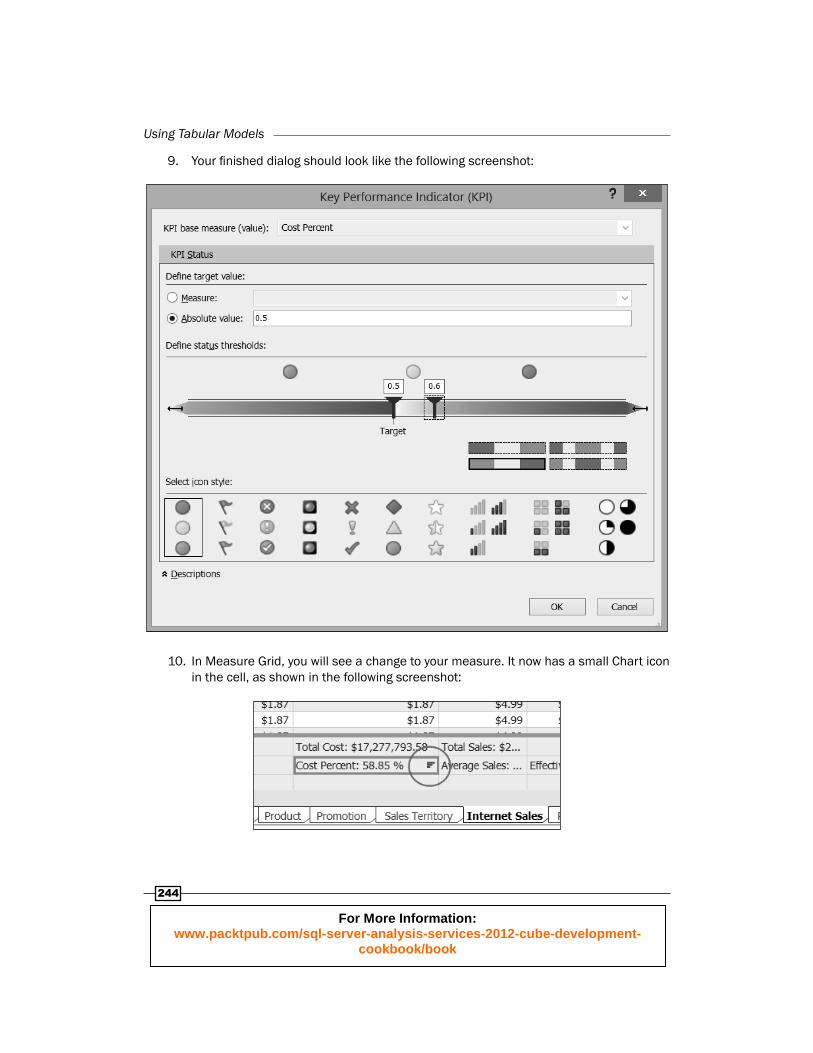
10. In Measure Grid, you will see a change to your measure. It now has a small Chart icon in the cell, as shown in the following screenshot:
For More Information: www.packtpub.com/sql-server-analysis-services-2012-cube-development-
cookbook/book
Chapter 9
245
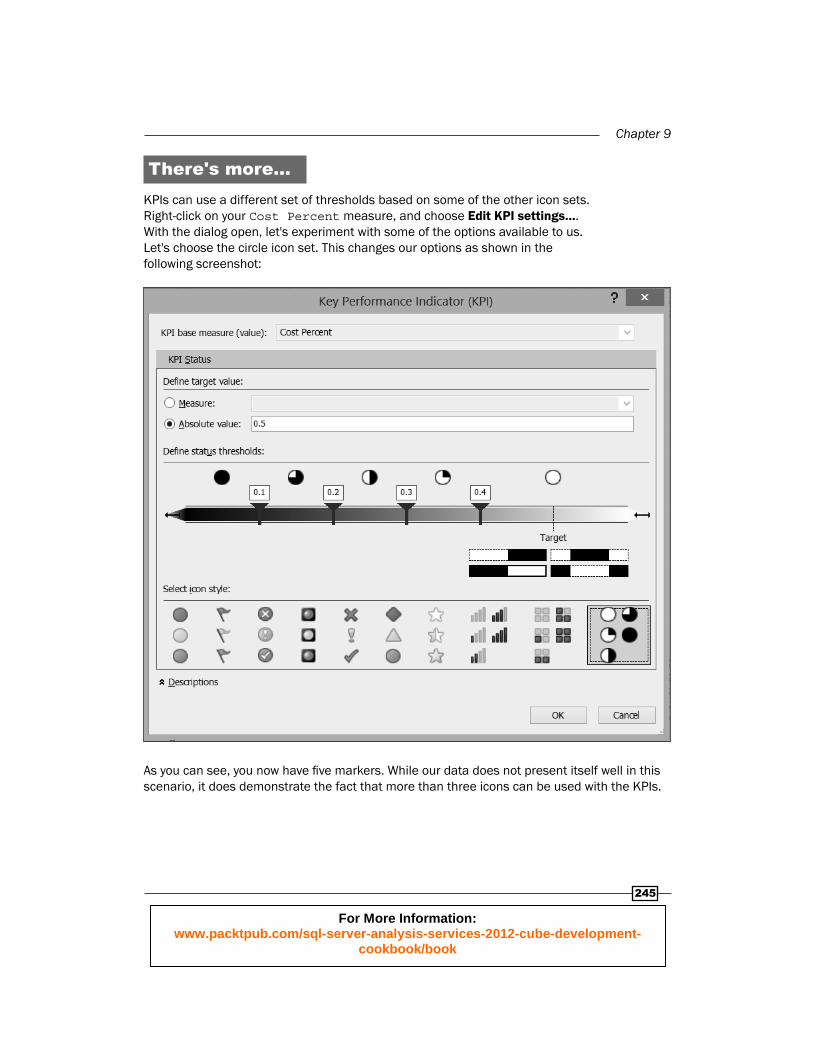
There's more…KPIs can use a different set of thresholds based on some of the other icon sets. Right-click on your Cost Percent measure, and choose Edit KPI settings…. With the dialog open, let's experiment with some of the options available to us. Let's choose the circle icon set. This changes our options as shown in the following screenshot:
As you can see, you now have fi ve markers. While our data does not present itself well in this scenario, it does demonstrate the fact that more than three icons can be used with the KPIs.
For More Information: www.packtpub.com/sql-server-analysis-services-2012-cube-development-
cookbook/book
Using Tabular Models
246
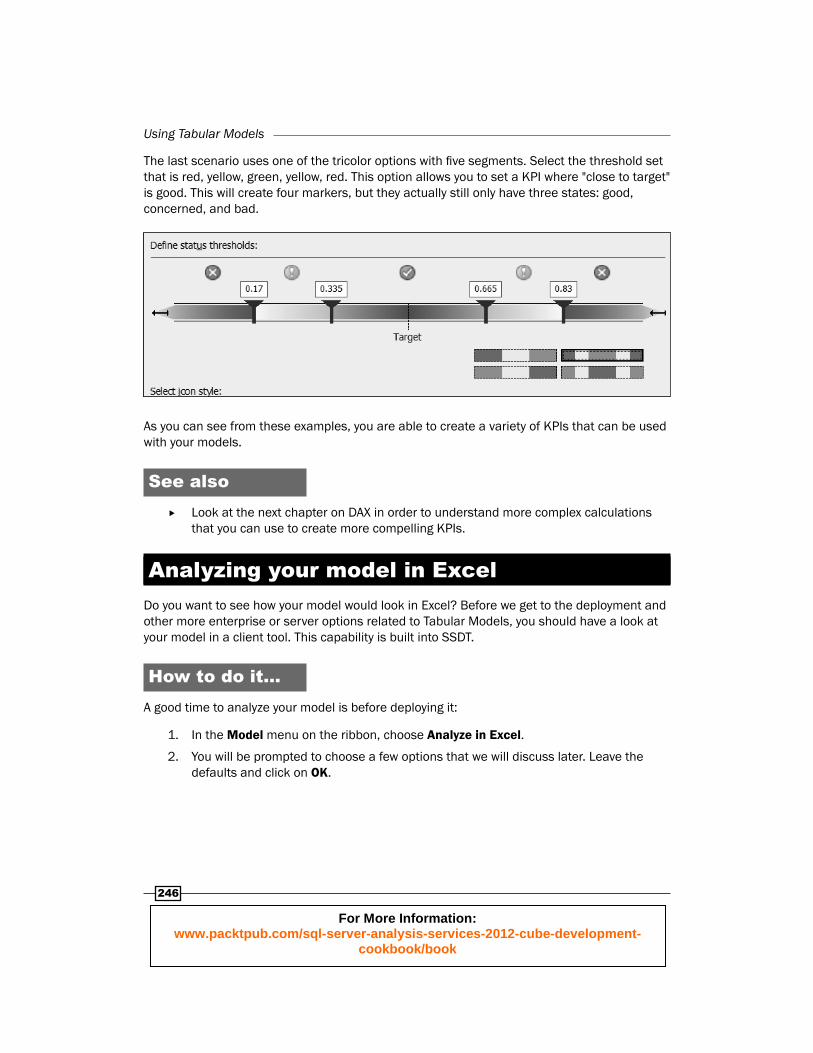
The last scenario uses one of the tricolor options with fi ve segments. Select the threshold set that is red, yellow, green, yellow, red. This option allows you to set a KPI where "close to target" is good. This will create four markers, but they actually still only have three states: good, concerned, and bad.
As you can see from these examples, you are able to create a variety of KPIs that can be used with your models.
See also Look at the next chapter on DAX in order to understand more complex calculations
that you can use to create more compelling KPIs.
Analyzing your model in ExcelDo you want to see how your model would look in Excel? Before we get to the deployment and other more enterprise or server options related to Tabular Models, you should have a look at your model in a client tool. This capability is built into SSDT.
How to do it…A good time to analyze your model is before deploying it:
1. In the Model menu on the ribbon, choose Analyze in Excel.
2. You will be prompted to choose a few options that we will discuss later. Leave the defaults and click on OK.
For More Information: www.packtpub.com/sql-server-analysis-services-2012-cube-development-
cookbook/book
Chapter 9
247
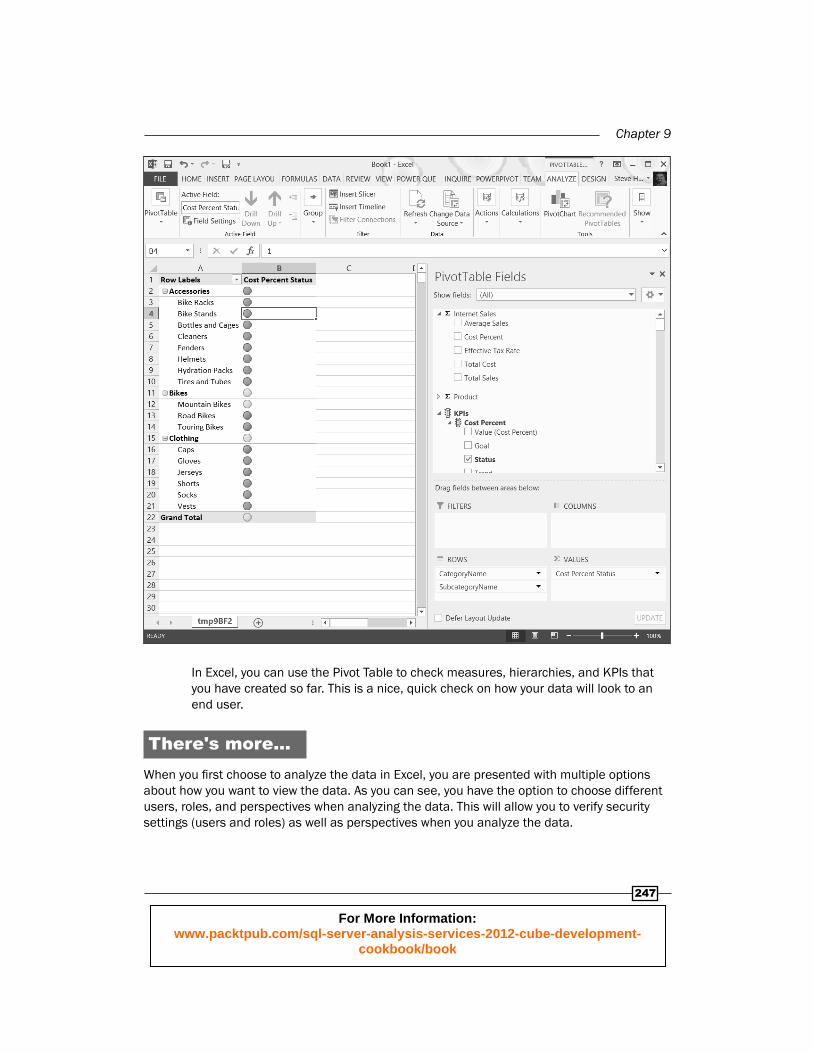
In Excel, you can use the Pivot Table to check measures, hierarchies, and KPIs that you have created so far. This is a nice, quick check on how your data will look to an end user.
There's more…When you fi rst choose to analyze the data in Excel, you are presented with multiple options about how you want to view the data. As you can see, you have the option to choose different users, roles, and perspectives when analyzing the data. This will allow you to verify security settings (users and roles) as well as perspectives when you analyze the data.
For More Information: www.packtpub.com/sql-server-analysis-services-2012-cube-development-
cookbook/book
Using Tabular Models
248
See also For more information on security, see the Implementing security in Tabular Models
recipe. You can also check out perspectives in the Implementing perspectives recipe.
Deploying Tabular ModelsNext up is deploying your model. There are a number of clickable methods to deploy your model.
Getting readyBefore you start deploying your model, it is important to set your deployment settings. This allows you to set the target server for deployment. You will fi nd the deployment confi guration in the project's properties. You can change the Deployment Server settings here. You are also able to set up multiple deployment confi gurations, such as test, development, and even production using the Confi guration dropdown.
How to do it…The following steps will describe how to deploy your model using SSDT, the deployment wizard, and the deployment utility:
1. You can deploy to a server using SSDT by right-clicking on the project and choosing Deploy. This will deploy the project to the targeted, actively confi gured deployment server.
2. As you can see from the dialog, metadata is deployed fi rst, and then each table is loaded.
3. Open up Microsoft SQL Server Management Studio to see the deployed database. You will see that the connection and table folders have content.
According to Microsoft documentation, you should not use the SSDT option for production deployment. Some properties will be overwritten in this scenario. See http://technet.microsoft.com/en-us/library/gg492138.aspx for more details.
4. The quickest way to get to the deployment wizard is to use Search in Windows 7 or Windows 8. Click on the Deployment Wizard result to open up Analysis Services Deployment Wizard.
For More Information: www.packtpub.com/sql-server-analysis-services-2012-cube-development-
cookbook/book
Chapter 9
249
5. On the next dialog, you will be asked to select a database to deploy. This database can be found in the bin folder in your SSAS Cookbook Chapter 9 project folder, if you have built your project.
6. If you did not change the Model.bim fi le, your database will be named Model.asdatabase. Click on OK and then on Next.
7. This opens up the dialog for the installation target. In this dialog box, you need to specify the server and the database you plan to deploy. If your active confi guration has the correct target, you should be able to click on Next and move the Specify Options for Partitions and Roles dialog. Leave the default settings at this point and click on Next.
8. In the Specify Confi guration Properties dialog, you can change the connection information as well as the impersonation information for the confi guration. These are currently based on the settings you set up before. In our case, you can select the fi rst two checkboxes, which will retain your deployment settings.
This allows you to change these properties prior to a production deployment. It will allow your DBAs or similar roles to set credentials upon the deployment, which helps meet a number of compliance considerations in various industries.
9. The next dialog, Select Processing Options, we will also leave it with its default settings.
10. Finally, in the next dialog, you have one last chance to back out as you will overwrite the existing database with the same name. Once you click on Next here, you will deploy the database. After it is complete, you have one more dialog box, which will close the dialog.
11. The Deployment utility is a command-line deployment option. This option uses the ASDATABASE fi le as well. So let's open command prompt and deploy the database using this option. You will fi nd the executable here:
C:\ProgramFiles(x86)\MicrosoftSQLServer\110\Tools\Binn\ManagementStudio
If you only have one installation of SSAS on your server, you can just use the executable directly as follows:
C:\>AnalysisServices.Deployment.exe
If you just run the executable file, it will open up an instance of the Deployment Wizard UI.
For More Information: www.packtpub.com/sql-server-analysis-services-2012-cube-development-
cookbook/book
Using Tabular Models
250
How it works…When the project is deployed for the fi rst time, the database is created and will be loaded into memory. As part of your planning, you will need to make sure you have enough memory on the server to support all of the models you are deploying and developing.
Subsequent deployments will update the schema of the database and fully reload the data in the database on the server.
When the server is shut down, all of the Tabular Model databases are written to a disk so that they are not lost. Once the server is restarted, the models are loaded back from the disk, but not refreshed. When deploying the models to the server, you need to plan for the space needed to hold the models as well as the time required to write and read the models during the service start-up and shut-down cycles.
There's more…One key advantage of using the Deployment utility is that it gives you the ability to deploy in silent mode, which suppresses the dialogs during deployment.
You will need to use the s switch. You have the option of adding a location to write a log fi le out as well. Here is the full command line to use when deploying in silent mode with a log fi le:
C:\>"C:\Program Files (x86)\Microsoft SQL Server\110\Tools\Binn\ManagementStudio\Microsoft.AnalysisServices.Deployment.exe" "C:\Source\SSAS Cookbook\SSAS Cookbook Chapter 9\SSAS Cookbook Chapter 9\bin\Model.asdatabase" /s:"C:\Source\Logs\SSAS Cookbook Chapter 9.log"
This will deploy and fully reprocess the database and send the log information to the fi le as specifi ed.
See also You can also use XMLA, AMO, synchronization, and backup-restore to deploy
models. For more information on these options check out the Tabular Model Solution Deployment at http://technet.microsoft.com/en-us/library/gg492138.aspx.
Check out the next recipe to learn more about using XMLA with Tabular Models.
For More Information: www.packtpub.com/sql-server-analysis-services-2012-cube-development-
cookbook/book
Chapter 9
251
Scripting Tabular Models using XMLAIn this recipe, you will learn how to create XMLA fi les that can be used for a variety of purposes including deploying and processing.
Getting readyUnlike most of our work to this point, we will now be working primarily out of SQL Server Management Studio. We will also be working with a deployed Tabular Model database. If you have not deployed your database yet, refer to the previous recipe for deployment options.
How to do it…While XMLA can defi nitely look daunting, generating XMLA scripts is quite easy, as shown in the following steps:
1. Open up Microsoft SQL Server Management Studio, and connect to the tabular instance you are using for development.
2. Right-click on the database and navigate to the following sequence of options: Script | Script Database as | CREATE To | New Query Editor Window. This will generate the XMLA script to create the database in the query window. If you want to create a new database on a different server, you can use this script.
3. The same technique can be used to generate multiple XMLA scripts for use in other tools. For instance, right-click on the database and select Process from the menu. This will open a dialog box for processing the database (reloading the data). You can set the properties you would like, and then instead of clicking on OK, use the Script button at the top of the dialog box to generate XMLA to process the database using the selected options.
Any script created here can be executed in SQL Server Management Studio or any other tool that can execute XMLA.
There's more…You can also use the Deployment utility to generate XMLA for deployment. You need to use the d and o switches. The o switch is used to generate output fi les, which is exactly what we need in this case. The d switch tells the utility not to connect to the specifi ed targets to create the script that is needed to generate the create database script. Here is the command line:
C:\>"C:\Program Files (x86)\Microsoft SQL Server\110\Tools\Binn\ManagementStudio\Microsoft.AnalysisServices.Deployment.exe" "C:\Source\SSAS Cookbook\SSAS Cookbook Chapter 9\SSAS Cookbook Chapter 9\bin\Model.asdatabase" /d /o:"C:\Source\SSAS Cookbook\SSAS Cookbook Chapter 9\SSAS Cookbook Chapter 9\bin\Model.xmla"
For More Information: www.packtpub.com/sql-server-analysis-services-2012-cube-development-
cookbook/book
Using Tabular Models
252
Processing Tabular ModelsOnce a Tabular Model has been loaded initially, you may need to reload the data to pick up new data or handle data source refi nements. Unlike a multidimensional model, which does not need data to work, the Tabular Model starts out in a processed state.
How to do it…The Processing primarily occurs during development, while using Microsoft SQL Server Management Studio:
1. In order to process the database, individual tables, or partitions, you merely need to right-click on the object and select the Process option. This will open the Process dialog box.
2. From here you will pick your processing option and click on OK to process the selected object.
How it works…Processing the model refreshes the data or the metadata depending on the processing option chosen.
As you can see Process Default is available to all objects. This will process any table or partition that is currently unprocessed and update the internal structures including calculations and hierarchies. Process Full replaces all components, data, and internal structures. Process Clear does the opposite and removes all data in the database, table, or partition. Process Data will reload the data in the selected table or partition. After either a Process Clear or Process Data option is run, you should run a Process Recalc option, which will rebuild all of the calculations, relationships, and other structures used in the model.
If you process a partition fully or incrementally, you may get an error which refers to duplicate keys. This will happen when the data you add causes a duplicate key to appear in tables or relationships that require unique values within the model.
Process Defrag optimizes the table structures within the model. This is essentially a clean-up operation that should be run occasionally to keep the solution running smoothly.
Finally, the Process Add option only applies to the Process Partition option. This option allows you to add only new data. SSAS does not check the existing data, so you are responsible for making sure the partition can accept new rows and not run into duplicates.
For More Information: www.packtpub.com/sql-server-analysis-services-2012-cube-development-
cookbook/book
Chapter 9
253
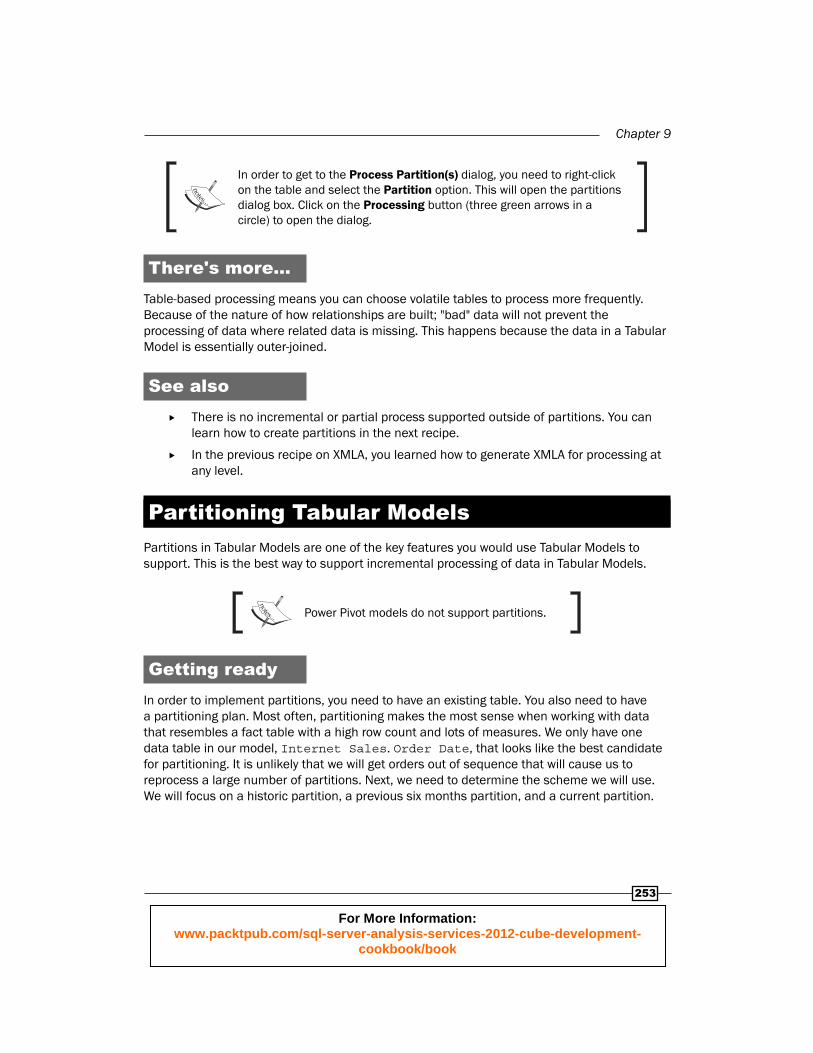
In order to get to the Process Partition(s) dialog, you need to right-click on the table and select the Partition option. This will open the partitions dialog box. Click on the Processing button (three green arrows in a circle) to open the dialog.
There's more…Table-based processing means you can choose volatile tables to process more frequently. Because of the nature of how relationships are built; "bad" data will not prevent the processing of data where related data is missing. This happens because the data in a Tabular Model is essentially outer-joined.
See also There is no incremental or partial process supported outside of partitions. You can
learn how to create partitions in the next recipe.
In the previous recipe on XMLA, you learned how to generate XMLA for processing at any level.
Partitioning Tabular ModelsPartitions in Tabular Models are one of the key features you would use Tabular Models to support. This is the best way to support incremental processing of data in Tabular Models.
Power Pivot models do not support partitions.
Getting readyIn order to implement partitions, you need to have an existing table. You also need to have a partitioning plan. Most often, partitioning makes the most sense when working with data that resembles a fact table with a high row count and lots of measures. We only have one data table in our model, Internet Sales. Order Date, that looks like the best candidate for partitioning. It is unlikely that we will get orders out of sequence that will cause us to reprocess a large number of partitions. Next, we need to determine the scheme we will use. We will focus on a historic partition, a previous six months partition, and a current partition.
For More Information: www.packtpub.com/sql-server-analysis-services-2012-cube-development-
cookbook/book
Using Tabular Models
254
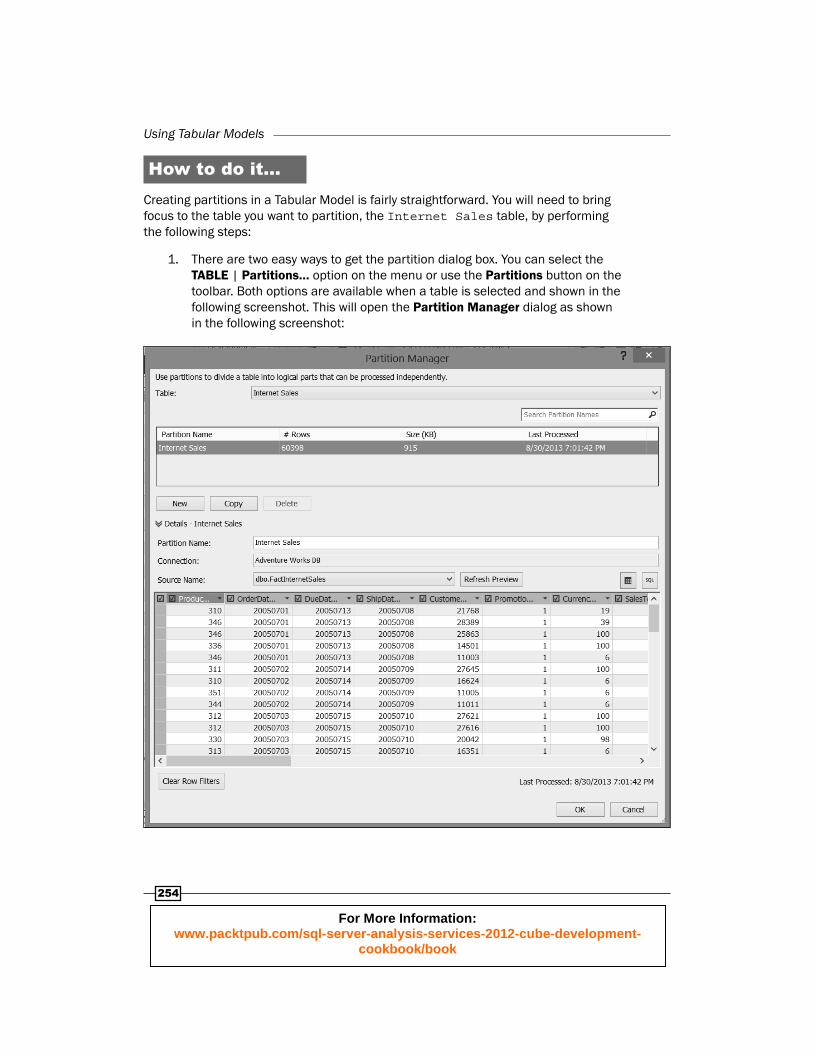
How to do it…Creating partitions in a Tabular Model is fairly straightforward. You will need to bring focus to the table you want to partition, the Internet Sales table, by performing the following steps:
1. There are two easy ways to get the partition dialog box. You can select the TABLE | Partitions… option on the menu or use the Partitions button on the toolbar. Both options are available when a table is selected and shown in the following screenshot. This will open the Partition Manager dialog as shown in the following screenshot:
For More Information: www.packtpub.com/sql-server-analysis-services-2012-cube-development-
cookbook/book
Chapter 9
255
2. As you can see, here every table exists as a single partition that contains all of the data. Our next step is to create a new partition by clicking on the New button. You will now see that a new partition has been added named Internet Sales. It is currently exactly the same as the initial partition.
If we stop here, it will duplicate the data in our table. There is nothing here that will magically prevent the duplication of the data. This is the responsibility of the modeler.
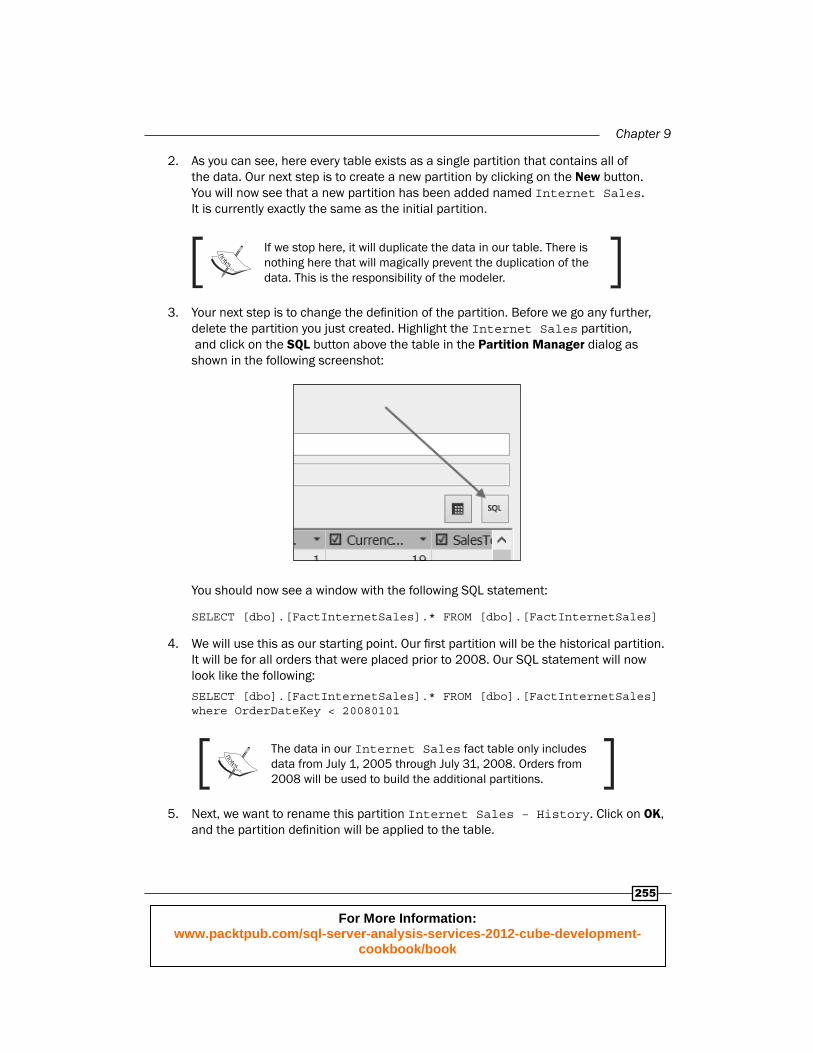
3. Your next step is to change the defi nition of the partition. Before we go any further, delete the partition you just created. Highlight the Internet Sales partition, and click on the SQL button above the table in the Partition Manager dialog as shown in the following screenshot:
You should now see a window with the following SQL statement:
SELECT [dbo].[FactInternetSales].* FROM [dbo].[FactInternetSales]
4. We will use this as our starting point. Our fi rst partition will be the historical partition. It will be for all orders that were placed prior to 2008. Our SQL statement will now look like the following:
SELECT [dbo].[FactInternetSales].* FROM [dbo].[FactInternetSales] where OrderDateKey < 20080101
The data in our Internet Sales fact table only includes data from July 1, 2005 through July 31, 2008. Orders from 2008 will be used to build the additional partitions.
5. Next, we want to rename this partition Internet Sales – History. Click on OK, and the partition defi nition will be applied to the table.
For More Information: www.packtpub.com/sql-server-analysis-services-2012-cube-development-
cookbook/book
Using Tabular Models
256
6. You will notice that the data has not been refreshed. Navigate to MODEL | Process Table … to reprocess the data. The rows processed have been decreased to around 30,000 and only include orders prior to 2008.
7. You will now add the next two partitions: Internet Sales – 6 Months and Internet Sales – Current. Open the Partition Manager dialog again. Now, we will copy the partition using the Copy button. Click on that twice and two new partitions will be created: Internet Sales – History Copy and Internet Sales – History Copy - Copy.
8. Click on either one, and we will modify it to become our six-month partition by renaming it to Internet Sales – 6 Months and changing the Where clause in the SQL Statement to the following:
Where OrderDate between 20080101 and 20080630
This will create a partition to cover the fi rst six months of 2008.
9. Click on the unmodifi ed copy and change its name to Internet Sales – Current, and set its Where clause to:
Where OrderDate > 20080630
This will create the fi nal partition for you, and you will now have three partitions you can use to manage processing or data reloads.
10. Click on OK and reprocess the table.
The last-processed information does not come from your development model; it comes from the deployed model. To see accurate processing information from your development model, you will need to use Microsoft SQL Server Management Studio. Right-click on the Internet Sales table and select Partitions. This will open the Partitions dialog from the selected model. Remember that your development model has a GUID as part of its name.
There's more…Partition management is a key part of your model design. What if you wanted to move the data from the six-month partition into your historical partition? Partitioning supports merging partitions. To do this, open up Microsoft SQL Server Management Studio and right-click on the table. Select the Partitions option from the context menu, and it will open a dialog that is shown in the following screenshot.
For More Information: www.packtpub.com/sql-server-analysis-services-2012-cube-development-
cookbook/book
Chapter 9
257
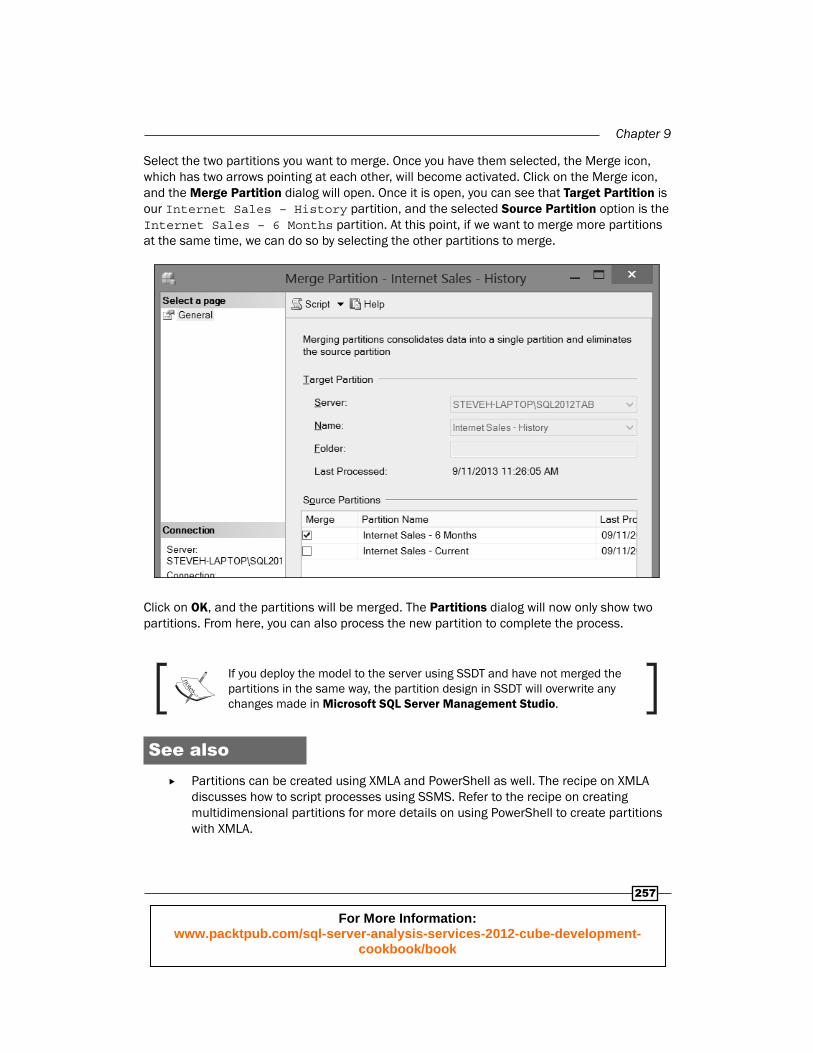
Select the two partitions you want to merge. Once you have them selected, the Merge icon, which has two arrows pointing at each other, will become activated. Click on the Merge icon, and the Merge Partition dialog will open. Once it is open, you can see that Target Partition is our Internet Sales – History partition, and the selected Source Partition option is the Internet Sales – 6 Months partition. At this point, if we want to merge more partitions at the same time, we can do so by selecting the other partitions to merge.
Click on OK, and the partitions will be merged. The Partitions dialog will now only show two partitions. From here, you can also process the new partition to complete the process.
If you deploy the model to the server using SSDT and have not merged the partitions in the same way, the partition design in SSDT will overwrite any changes made in Microsoft SQL Server Management Studio.
See also Partitions can be created using XMLA and PowerShell as well. The recipe on XMLA
discusses how to script processes using SSMS. Refer to the recipe on creating multidimensional partitions for more details on using PowerShell to create partitions with XMLA.
For More Information: www.packtpub.com/sql-server-analysis-services-2012-cube-development-
cookbook/book
Using Tabular Models
258
Implementing perspectivesPerspectives are similar to views in relational databases. Perspectives allow you to create views of the model that may serve a specifi c function or help a specifi c user group. For instance, you could create perspectives that only show fi nance measures and dimensions. You can reduce the number of visible tables and the fi elds for users to make the user experience better.
While tempting, you should not use perspectives as a security tool. They are not designed for security but for ease of use and visual organization of the model.
Getting readyYou will be expanding on the model we have been working on throughout this chapter. We will be creating a perspective that focuses on product orders and hides most of the customer data.
How to do it…Similar to partitions in the previous recipe, you can open the Perspectives dialog from the toolbar or menu and then perform the following steps:
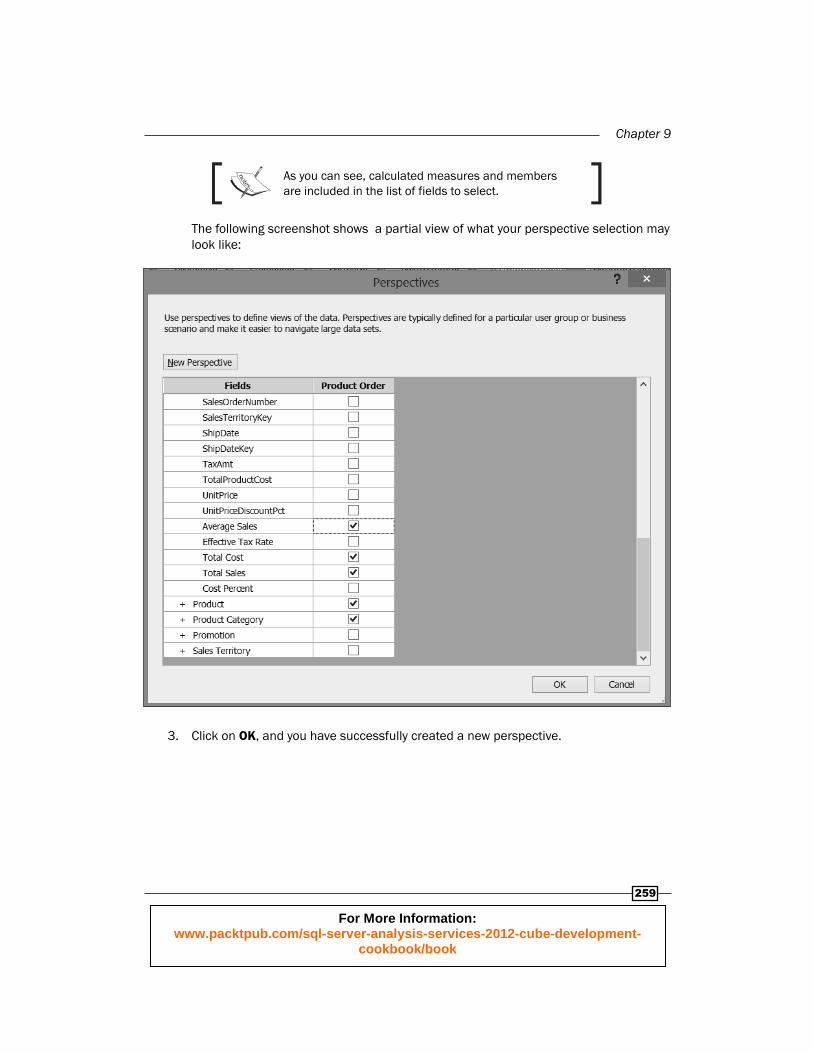
1. In the Perspectives dialog, click on the New Perspective button. You can name this perspective Product Order. There is a series of checkboxes in the new column next to the table and the fi eld defi nition on the right.
2. Because this perspective focuses on products, select the Product and Product Category tables. If you expand the Product table, you will see that all fi elds have been selected. Next, expand the Internet Sales table, and select some fi elds that you feel are relevant to this perspective, such as Order Date, Order Quantity, Sales Amount, Average Sales, Total Cost, and Total Sales.
For More Information: www.packtpub.com/sql-server-analysis-services-2012-cube-development-
cookbook/book
Chapter 9
259
As you can see, calculated measures and members are included in the list of fields to select.
The following screenshot shows a partial view of what your perspective selection may look like:
3. Click on OK, and you have successfully created a new perspective.
For More Information: www.packtpub.com/sql-server-analysis-services-2012-cube-development-
cookbook/book
Using Tabular Models
260
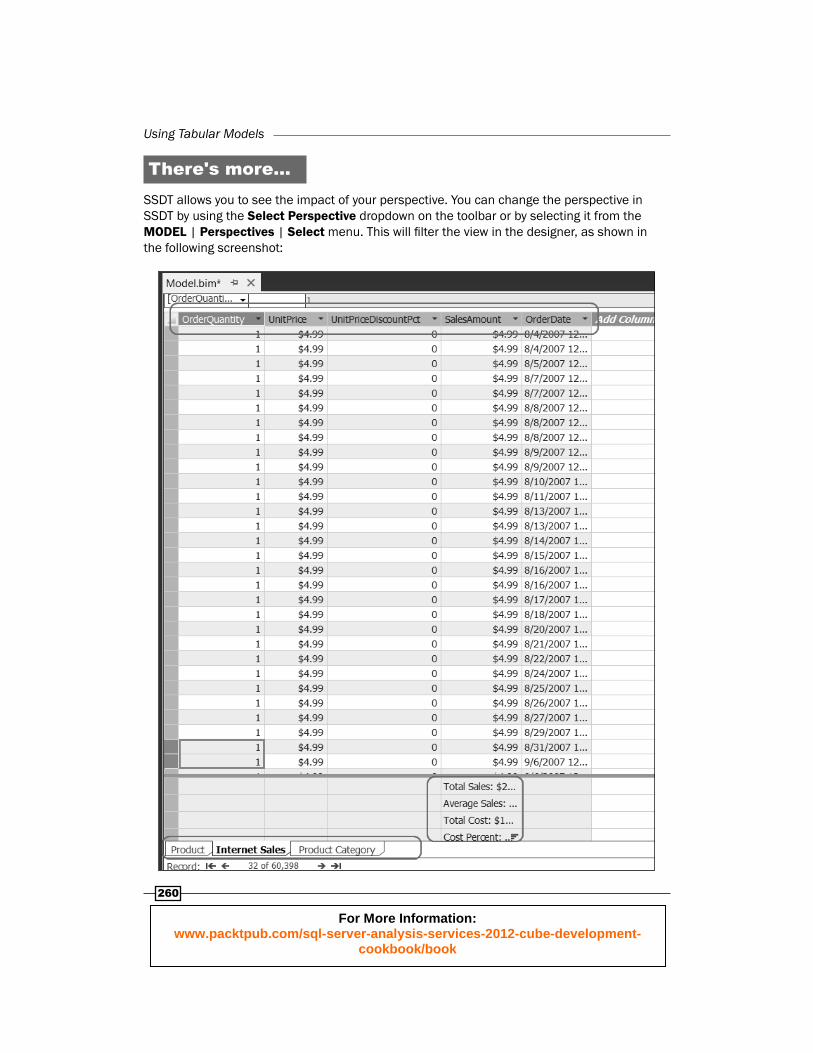
There's more…SSDT allows you to see the impact of your perspective. You can change the perspective in SSDT by using the Select Perspective dropdown on the toolbar or by selecting it from the MODEL | Perspectives | Select menu. This will fi lter the view in the designer, as shown in the following screenshot:
For More Information: www.packtpub.com/sql-server-analysis-services-2012-cube-development-
cookbook/book
Chapter 9
261
See also Check the effect of your perspectives from your user's viewpoint using the Analyze in
Excel feature mentioned in the previous recipe.
Implementing security in Tabular ModelsOne of the key differentiators or reasons to move Power Pivot models into SQL Server Analysis Services is security . Tabular Models support a much more robust security model than what is available in Power Pivot in Excel or SharePoint.
Getting readyIn order to work with security, you will need some users that you can assign to the roles. In my solution, I have added SteveReader and SteveFiltered to my local computer. Normally, you would be using Active Directory users and groups to manage your security. If you have a test or development environment with users at your disposal, use them. In either case, you will need users to complete this next recipe.
How to do it…You can open the Role Manager dialog by clicking on the Roles button on the toolbar or the Roles option in the MODEL menu item. This will open the Role Manager dialog . You will be creating a read-only role, which will prevent a user from reloading data or making changes to the model:
1. This can be done by clicking on the New button, which will add a new role. Rename the role Read Only and select the Read permissions from the dialog.
2. Next, click on the Members tab in the lower half of the dialog, and add the user or group to which you want to give Read Only permissions to your model. Now the dialog should show your changes.
As you likely would have noticed, there are other permissions available. Here is a brief breakdown of these permissions and what they allow:
None: No permissions assigned
Read: Read data
Read and Process: Read data and reload data
Process: Reload data, but no ability to read
Administrator: Full access
For More Information: www.packtpub.com/sql-server-analysis-services-2012-cube-development-
cookbook/book
Using Tabular Models
262
3. We also made no changes in the Row Filters tab when we created the Read Only user. As a result, the permissions that were assigned apply to the entire model. By assigning a group to our Read Only role, that group would be able to use our entire model in their analysis.
4. Let's add a fi ltered role that only allows the role to see data related to a specifi c sales territory, that is, Central. This territory is defi ned in the Sales Territory table. Once again, you open the Role Manager dialog . Add a new role named Central Sales. Assign the Read permission to the new role, and add your fi ltered user to the Members area.
5. Now, you double-click on the DAX Filter cell by Sales Territory. You get no help at all. So, you will need to create the fi lter by hand. Add the following fi lter to the dialog:
=[SalesTerritoryRegion]="Central"
You need a DAX formula that will return a Boolean value . In this case, the formula tests the name of the region and sets the result to TRUE or FALSE.
In order to create this formula, I created it as a calculated member in the model. This allowed me to verify the results and the syntax. Once I was done, I removed the column.
Now you have a role that will only show data that is available based on that fi lter in related tables. In this case, your Sales table will be fi ltered. If you want to have this fi lter apply to other lists, you could create a lookup table that associates data such as customers directly with the sales territories, which would result in a fi ltered customer list as well.
How it works…Role-based security in the Tabular Model is very similar to role-based security in multidimensional models. Permissions within the model are additive, which means user permissions are accumulative across all the roles they belong to. For instance, this means that administrators cannot be limited in their ability to see the data even if that user has read-only permissions on a table.
There's more…You want to verify that your roles and users have the expected permissions. You can do this using the Analyze with Excel feature . When you open the Analyze with Excel dialog, you can see that you have the option to select users, roles, and even perspectives. If you use the Central Sales role you created and click on OK, you will see the effect of the role using Excel. This helps administrators test security during development and helps verify the results, which are what you need to support the role you created.
For More Information: www.packtpub.com/sql-server-analysis-services-2012-cube-development-
cookbook/book
Chapter 9
263
Automating Tabular Model processingPower Pivot models in Excel are manually processed only, and Power Pivot models in SharePoint can be scheduled at the data source level. Tabular Models take this one step further by allowing you to process partitions in your model. This allows you to use partitions to keep processing windows short and your model impact low.
Getting readyIn order to work with automation, you should have a deployed version of your Tabular Model to work with. To see how to deploy your model, see the previous recipe on the subject. You should also have a scheduling tool, preferably SQL Server Agent, available to create the job.
How to do i t…1. In Microsoft SQL Server Management Studio, open the tabular instance of SQL
Server Analysis Services. Right-click on the database you would like to process, and click on the Process Database option on the shortcut menu. In the Process Database dialog, choose the processing mode you would like to use. (I will be using Default for the examples.) Then click on the Script button at the top. This will open a new query window with XMLA in it.
<Process xmlns = "http://schemas.microsoft.com/ analysisservices/2003/engine"> <Type>ProcessDefault</Type> <Object> <DatabaseID>SSAS Cookbook Chapter 9</DatabaseID> </Object></Process>
2. Next, we need to create the job in SQL Server Agent. Open up a new job in SQL Server Agent. Give the job a name such as Process SSAS Cookbook Model.
3. Next, select the Steps page and click on New to create a new step. In this step, set the following properties:
Step Name: Process Model
Type: SQL Server Analysis Services Query
Run As: Choose a Run As account with permissions to the database
Server: Server name
Database: SSAS Cookbook Chapter 9
Command: Use the preceding code
4. Click on OK, and this will save the step. You can then set the schedule as needed to process the database.
For More Information: www.packtpub.com/sql-server-analysis-services-2012-cube-development-
cookbook/book
Using Tabular Models
264
There's more…You can also follow the same steps and process individual tables and partitions. This allows you the fl exibility to only process those objects which have changes in them.
My preference is to use the Full processing mode when processing SSAS objects. This requires the least amount of overall maintenance. I only move away from this when processing times interfere with usage.
See also There are a couple of projects on CodePlex that describe other automation
techniques using AMO and PowerShell. Check these out if using SQL Server Agent is not a possibility:
Tabular Database PowerShell Cmdlets at http://tabularcmdlets.codeplex.com/
Tabular AMO 2012 at http://tabularamo2012.codeplex.com/
For More Information: www.packtpub.com/sql-server-analysis-services-2012-cube-development-
cookbook/book
Where to buy this book You can buy SQL Server Analysis Services 2012 Cube Development Cookbook from the
Packt Publishing website:
.
Free shipping to the US, UK, Europe and selected Asian countries. For more information, please
read our shipping policy.
Alternatively, you can buy the book from Amazon, BN.com, Computer Manuals and
most internet book retailers.
www.PacktPub.com
For More Information: www.packtpub.com/sql-server-analysis-services-2012-cube-development-
cookbook/book