Embed Size (px)
Citation preview

Sri Lanka Samanalawewa Hydroelectric Power Project (I) (II) (III) and
Samanalawewa Hydroelectric Project (Reservoir Remedial Works)
External Evaluator: Hiroyuki Shindo (Incorporated Administrative Agency, Japan Water Agency)
Field Survey: October and December 2006 1. Project Profile and Japan’s ODA Loan
ス
プロジェクトサイト
インド
コロンボ
ス
プロジェクトサイト
インド
コロンボColombo
Project site
India
Map of project
1.1 Background Sri Lanka is poor in fossil fu
water and biomass as energy soupotential in Sri Lanka and the ggeneration by implementing laMahaweli and Laxapana river sy
When this project was being increasing, marking an 8.2% anduring the 1980–1985 period, ameasure to cope with the increasto start operating a large-scale cowas likely to begin far later than demand was expected to becomThis project was planned with situation for electricity. 1.2 Objective
This project aimed to address a reservoir-type hydroelectric po
リランカリランカSri Lanka
area Samanalawewa Hydroelectric Power Station Control Building
el resources such as oil, coal and natural gas and relies on rces. Particularly, water is the energy resource with the most overnment has been actively promoting hydroelectric power rge-scale hydroelectric power development projects in the stems. planned, the demand for electricity in Sri Lanka was rapidly nual increase in the volume of electricity sales on average
nd was predicted to further increase on a steady basis. As a e in electricity demand, the government of Sri Lanka planned al-fired power plant. However, as coal-fired power generation scheduled in 1985, the balance between electricity supply and e increasingly disproportionate in the first half of the 1990s. the aim of alleviating the disproportionate supply-demand
the shortage of electricity supply in Sri Lanka by constructing wer plant with a maximum output of 120 MW in the upstream
1
of Walawe River, approximately 160 km southeast of Colombo, thereby contributing to the economic development and improvement of the welfare of Sri Lanka. 1.3 Borrower/Executing Agency Democratic Socialist Republic of Sri Lanka/Ceylon Electricity Board (CEB) 1.4 Outline of Loan Agreement
Project Name Hydroelectric Power Project Reservoir Remedial Works
Phase I Phase II Phase III Loan Amount / Loan Disbursed Amount
14,500 million yen14,500 million yen
13,920 million yen13,920 million yen
3,264 million yen 3,264 million yen
5,282 million yen 3,134 million yen
Exchange of Notes / Loan Agreement
July 1986 September 1986
July 1987 October 1987
January 1991 March 1991
July 1995 August 1995
Terms and Conditions -Interest Rate -Repayment Period (Grace Period) -Procurement
3.25% 30 years (10 years)
General untied
2.75% 30 years (10 years)
General untied
2.50% 30 years (10 years)
General untied
2.60% 30 years (10 years)
General untied Final Disbursement Date September 1992 April 1994 March 1995 March 2005
Main Contractors
Hazama Corporation/Kumagai Gumi Co., Ltd., Kumagai Gumi Co., Ltd./Hazama Corporation/Kajima Corporation, Mitsui & Co., Ltd., Sumitomo Corporation/Mitsubishi Heavy Industries, Ltd./Kurimoto, Ltd./Marushima Aqua System Corp.
Consultant Services Nippon Koei Co., LTD, Electrowatt Engineering Services (Switzerland)
Feasibility Study (F/S), etc.
1978 F/S: CECB (Sri Lanka)/Soviet Union 1984 Technical report: British consortium group 1985 Technical report: CEB/CECB
1.5 Process of the Loan
This project was co-financed by Japanese ODA loan and loans provided by the U.K. With an estimated total project cost of 60,176 million yen, the project started in 1986. It was planned that the Japanese ODA loans (28,420 million yen) be provided in two phases. Actual disbursement of the loan for the first phase began in 1986 and that for the second phase began in 1987. The Japanese ODA loans mainly covered the portions of the project involving the construction of the dam, diversion tunnels, hydraulic turbine and penstock, and construction management.
As a highly permeable section was found in the ground of the right bank in 1988 during the construction of the dam, the project plan was modified to add cut-off works (curtain grouting1), etc. on the right bank. As a result, the estimated total project cost was changed to 74,313 million yen (Japanese ODA loan portion: 31, 664 million yen) and the remaining amount
1 In this case, injecting cement milk in the ground to form a curtain-like impervious zone in order to prevent water
running through the bedrock from leaking.
2
(equivalent to the increased amount of loans) was disbursed as the third phase of the Japanese ODA loan.
After the completion of the cut-off works on the right bank in October 1992, while the water was filling in the reservoir, a large amount of water leakage occurred from the right bank into the downstream areas. The government of Sri Lanka set up an “International Panel” consisting of experts to discuss measures to address this problem. As result, it was decided to implement the wet blanketing method2 (remedial works) as a countermeasure. For the remedial works, Japanese ODA loan was disbursed starting from 1995. Note) In this report, the projects covered by the loans for the first to third phases are referred to as the
“hydroelectric power project” and these projects and the remedial works are collectively referred to as “this
project”.
For this ex-post evaluation, the hydroelectric power project and the remedial works were evaluated as one
project. The relevance of the investigation and study on the original plan is excluded from this ex-post
evaluation because it was already evaluated at the time of appraisal.
2. Evaluation Result 2.1 Relevance 2.1.1 Relevance at the time of appraisal
At the time of appraisal of this project (1985), most domestic electricity (97.2%) was supplied by hydroelectric power generation. During the period from 1980 to 1985, which was prior to the project, the demand for electricity in Sri Lanka increased rapidly, marking an 8.2% annual increase in the volume of electricity sales on average, and was predicted to further increase on a steady basis.
As a measure to cope with the increasing electricity demand, the government of Sri Lanka planned to start operating a large-scale coal-fired power plant in 1993. According to the electric power development plan of Sri Lanka, it was assumed that the primary source of electricity would be hydroelectric power generation during the late 1980s and it would be replaced by coal-fired power generation in the 1990s. However, at the time of appraisal, coal-fired power generation was likely to begin far later than scheduled because of racial conflict at the proposed construction site. Therefore, the balance between electricity supply and demand was expected to be seriously disproportionate in the first half of the 1990s.
This project was implemented during the period when the primary power source was shifting from hydroelectric power generation to coal-fired power generation. The project was considered as an electric power development project aiming at alleviating the expected situation of supply-demand imbalance for electricity in the first half of the 1990s. Also, it was
2 A method of reducing water leakage by covering the leakage point with sand and gravel poured into the reservoir
from the water surface.
3

supposed to be the largest in scale and the most economically efficient among the hydroelectric power generation projects under CEB’s long-term electric power development plan.
Thus, this project was recognized to be the most economical and effective measure to cope with shortage of electricity supply expected for the first half of the 1990s and was expected to make a great contribution to the national economy and improvement of the welfare of Sri Lanka. Therefore, this project was deemed to be of high priority.
Studies for this project have been made by several institutions since the 1950s. In 1978, a feasibility study (F/S) including detailed design and some preparatory works was conducted by CECB (Sri Lankan technical consultant company) and the Soviet Union. However, these preparatory works were suspended in 1979. Then, technical reports were prepared by a British consortium group in 1984 and by CEB and CECB in 1985, respectively. 2.1.2 Relevance at the time of evaluation
In “Victory for Sri Lanka (2005),” the policy paper of the government of Sri Lanka, securing energy supply is listed as one of the most significant policies. CEB’s “Long Term Generation Expansion Plan 2006–2020” sets out a future plan based on the assumption that stable electricity supply by the existing hydroelectric power plants would continue. Electricity demand in Sri Lanka sharply increased by an average of 6.4% annually during 1986–2004 and this increase is further predicted.
On the supply side, the planned coal-fired power generation has not begun to date (the first coal-fired power plant of the country is scheduled to start operation in 2011). In order to meet the growing demand for electricity, more importance has been placed upon oil-fired power generation since around 2000. As Sri Lanka relies on imported oil, the cost of oil fuel has become one of the major factors pushing up the cost of power generation.
Considering that securing energy supply is an important policy for Sri Lanka, steady increase in electricity demand is predicted, and hydroelectric power generation is an economical source for domestic electricity supply, hydroelectric power generation remains highly important today.
When it started operation (1993), Samanalawewa Power Station generated 8.8% (16.1% at peak times) of the total electricity generated in the whole nation. The share of this electricity generation has decreased relative to total production of electricity in Sri Lanka, which has increased, but, in 2004 it still generated 2.9% (8.2% at peak times) of total electricity. In terms of the electric generation operation, it has been operated as a supplemental power supply at peak times with advantage characteristic of reservoir-type power generation.
Samanalawewa Power Station is greatly contributing to electric power supply in Sri Lanka and this project is deemed to remain highly relevant at the time of evaluation.
4

Figure 1: Increase in Power Generation and Share of Hydroelectric Power Generation in Sri Lanka
0
1,000
2,000
3,000
4,000
5,000
6,000
7,000
8,000
9,000
1980
1981
1982
1983
1984
1985
1986
1987
1988
1989
1990
1991
1992
1993
1994
1995
1996
1997
1998
1999
2000
2001
2002
2003
2004
0
10
20
30
40
50
60
70
80
90
100
サマナラウェア 水力 火力 その他 水力の割合(%)(GWh)
Share of hydroelectric Others ThermalHydro-
electricSamanalawewa
2.2 Efficiency 2.2.1 Outputs
The major outputs of this project (the portion covered by Japanese ODA loan) are shown in the table below.
The major outputs of the hydroelectric power project were generated almost as planned including the British financing portion (within a 20% range of increase/decrease). As high permeability was detected inside the ground of the right bank during the construction of the dam, the cut-off works were additionally implemented. It should be noted that there was a difference between the planned and actual effective storage capacity of the reservoir (the capacity between that at the lowest water level and that at the highest water level) even though there was no change in the highest water level (EL. 460 m) and the lowest water level (EL. 424 m) both at time of planning and after completion. The reason for this inconsistency could not be discovered by checking the existing materials or interviewing CEB.
As for the outputs of the remedial works, the main blanket was completed with a volume 15% smaller than planned. The follow-up blanketing was cancelled as recommended by the International Panel.
Table 1: Comparison of Planned and Actual Major Outputs (Japanese ODA loan portion) Item Plan Actual
5
[Hydroelectric Power Project]
Diversion tunnels (2) Length: 520 m and 545 m Length: 482 m and 502 m Dam Height: 103.5 m
Length: 529 m Effective storage capacity: 254 million m3
Height: 100 m Length: 530 m Effective storage capacity: 218.2 million m3
(Added at the time of phase III appraisal) Right bank cut-off works
Hydroelectric turbines Francis turbines - turbine discharge: 42.0 m3/s
As planned
Penstock Length: 648 m Length: 670 m [Remedial Works] Main blanket Input: 500,000 m3 Input: 426,030 m3
Follow-up blanket Input: 500,000 m3 Cancelled Note) The planned figures for the hydroelectric power project are as of the time of phase I appraisal (1986) and
those for the remedial works are as of the time of phase III appraisal (1995).
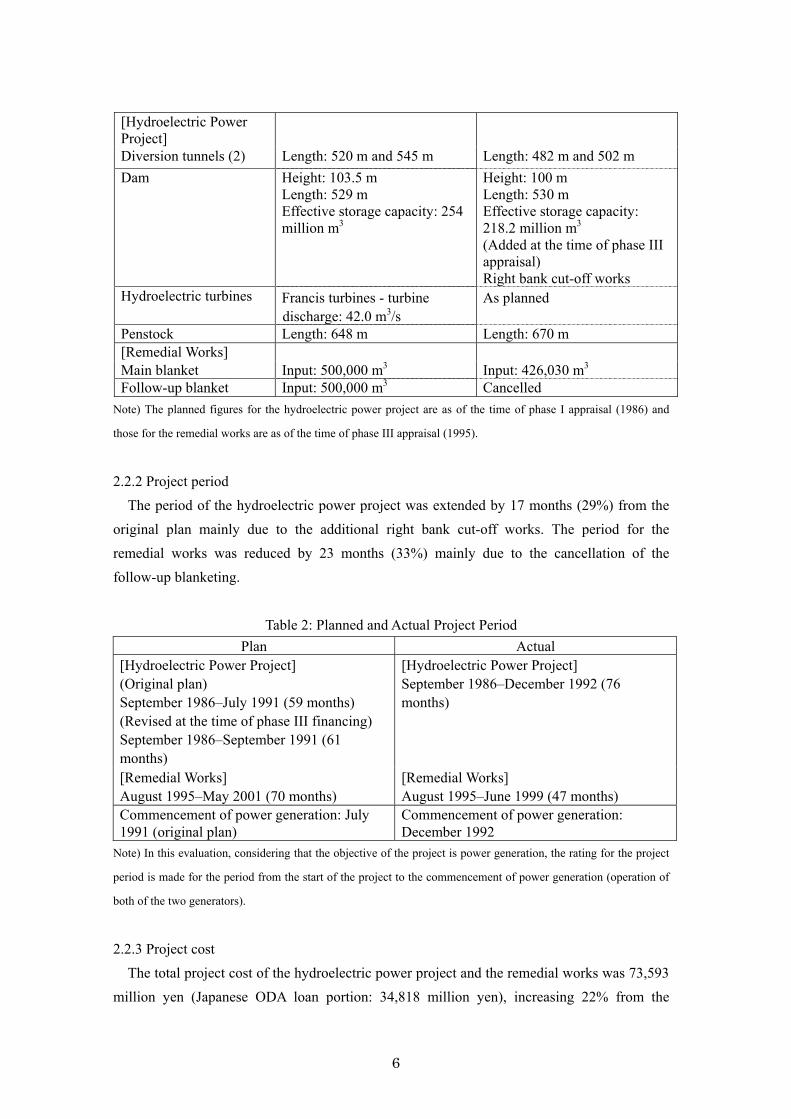
2.2.2 Project period
The period of the hydroelectric power project was extended by 17 months (29%) from the original plan mainly due to the additional right bank cut-off works. The period for the remedial works was reduced by 23 months (33%) mainly due to the cancellation of the follow-up blanketing.
Table 2: Planned and Actual Project Period Plan Actual
[Hydroelectric Power Project] (Original plan) September 1986–July 1991 (59 months) (Revised at the time of phase III financing) September 1986–September 1991 (61 months)
[Hydroelectric Power Project] September 1986–December 1992 (76 months)
[Remedial Works] August 1995–May 2001 (70 months)
[Remedial Works] August 1995–June 1999 (47 months)
Commencement of power generation: July 1991 (original plan)
Commencement of power generation: December 1992
Note) In this evaluation, considering that the objective of the project is power generation, the rating for the project
period is made for the period from the start of the project to the commencement of power generation (operation of
both of the two generators).
2.2.3 Project cost
The total project cost of the hydroelectric power project and the remedial works was 73,593 million yen (Japanese ODA loan portion: 34,818 million yen), increasing 22% from the
6
originally estimated cost of 60,176 million yen (Japanese ODA loan portion: 28, 420 million yen). Of the total increase in the cost of the hydroelectric power project (17%), the increase of the Japanese ODA loan portion was mainly caused by the additional right bank cut-off works. For the increased amount of the diversion tunnels for power generation (covered by British financing) by approximately 10,000 million yen, there remain no records indicating why it was required, but it is assumed the quantity of works increased substantially because the geological conditions were worse than expected, according to the interviews of those who were working there at that time.
The cost of the remedial works was 48% less than the original plan because of cancellation of the originally planned follow-up blanketing.
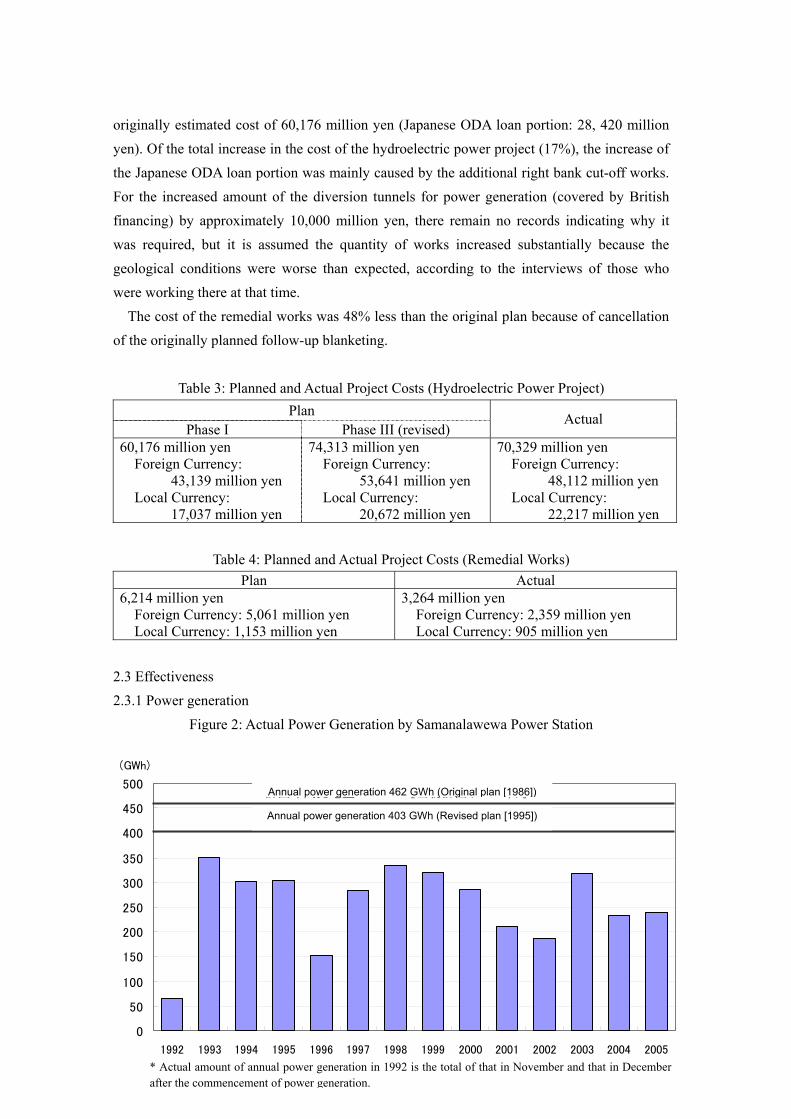
Table 3: Planned and Actual Project Costs (Hydroelectric Power Project) Plan
Phase I Phase III (revised) Actual
60,176 million yen Foreign Currency:
43,139 million yen Local Currency:
17,037 million yen
74,313 million yen Foreign Currency:
53,641 million yen Local Currency:
20,672 million yen
70,329 million yen Foreign Currency:
48,112 million yen Local Currency:
22,217 million yen
Table 4: Planned and Actual Project Costs (Remedial Works) Plan Actual
6,214 million yen Foreign Currency: 5,061 million yen Local Currency: 1,153 million yen
3,264 million yen Foreign Currency: 2,359 million yen Local Currency: 905 million yen
2.3 Effectiveness 2.3.1 Power generation
Figure 2: Actual Power Generation by Samanalawewa Power Station
Planned annual power genPlanned annual power gen
0
50
0
0
0
0
300
0
0
450
500
1992 1993 1994
(GWh)
計
計A
40
35
25
20
15
10
*after the commencement
eration 462 GWh [original plan (1986)] eration 402 GWh [(revised plan (1995))
1995 1996 1997 1998 1999 2000 2001 2002 2003 2004 2005
画年間発電量 462GWh [当初計画(1986年)]
画年間発電量 403GWh [見直し計画(1995年)]nnual power generation 403 GWh (Revised plan [1995])
Annual power generation 462 GWh (Original plan [1986])
7※1992年は発電運転開始以降(11~12月)の2ヶ月間の実績 (年) Actual amount of annual power generation in 1992 is the total of that in November and that in December
of power generation.

The annual power generation was originally planned at 462 GWh/year at the time of phase I
appraisal and was revised to 403 GWh/year at the time of appraisal for the remedial works. The actual annual power generation was 271 GWh/year (1993–2005 average), which was 59% of the originally planned amount and 67% of the revised planned amount.
There are no records/documents related to the calculation basis of these two different figures (462 GWh/year and 403 GWh/year.) It made us difficult to directly compare the actual power generation to the original plan. That is why an analysis was made based on available materials.
Figure 3: Comparison of Average Inflow into the Reservoir before and after the Project 月別貯水池流入量
0.0
5.0
10.0
15.0
20.0
25.0
30.0
35.0
Jan Feb Mar Apr May Jun Jul Aug Sep Oct Nov Dec
(m3/s) Monthly Inflow into the Reservoir
事業実施以前実測1959-1966,1973-1979) (
Actual values before the project (1959–1966, 1973–1979)
発電運転開始後実績(1996,1998-1999,2001-2005)
After the start of power generation (1996, 1998–1999, 2001–2005)
Average Inflow Actual value before project 18.5 m3/s After the start of power generation 13.2 m3/s Original plan (*) 17.9 m3/s
(*) Calculated based on the annual inflow 563*106 (m3)
Figure 4: Comparison of Annual Rainfall in the Basin Before and After the Project
(At the observation point in Balangoda)
月間降雨量(Balangoda地点)
0
50
100
150
200
250
300
350
400
450
Jan Feb Mar Apr May Jun Jul Aug Sep Oct Nov Dec
mm) Monthly Rainfall (Balangoda) (
事業実施以前(1959-1979)
Before the project (1959–1979)
発電運転開始後(1996-2005)
After the start of power generation (1996–2005)
8
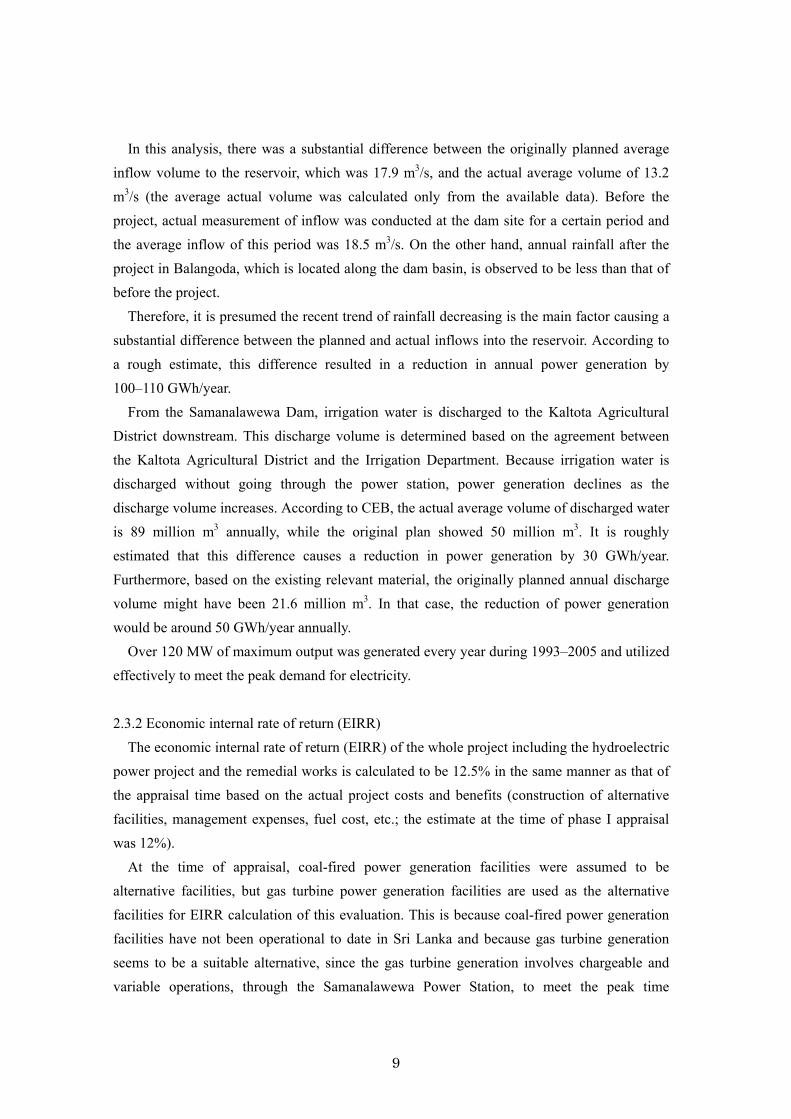
In this analysis, there was a substantial difference between the originally planned average
inflow volume to the reservoir, which was 17.9 m3/s, and the actual average volume of 13.2 m3/s (the average actual volume was calculated only from the available data). Before the project, actual measurement of inflow was conducted at the dam site for a certain period and the average inflow of this period was 18.5 m3/s. On the other hand, annual rainfall after the project in Balangoda, which is located along the dam basin, is observed to be less than that of before the project.
Therefore, it is presumed the recent trend of rainfall decreasing is the main factor causing a substantial difference between the planned and actual inflows into the reservoir. According to a rough estimate, this difference resulted in a reduction in annual power generation by 100–110 GWh/year.
From the Samanalawewa Dam, irrigation water is discharged to the Kaltota Agricultural District downstream. This discharge volume is determined based on the agreement between the Kaltota Agricultural District and the Irrigation Department. Because irrigation water is discharged without going through the power station, power generation declines as the discharge volume increases. According to CEB, the actual average volume of discharged water is 89 million m3 annually, while the original plan showed 50 million m3. It is roughly estimated that this difference causes a reduction in power generation by 30 GWh/year. Furthermore, based on the existing relevant material, the originally planned annual discharge volume might have been 21.6 million m3. In that case, the reduction of power generation would be around 50 GWh/year annually.
Over 120 MW of maximum output was generated every year during 1993–2005 and utilized effectively to meet the peak demand for electricity. 2.3.2 Economic internal rate of return (EIRR)
The economic internal rate of return (EIRR) of the whole project including the hydroelectric power project and the remedial works is calculated to be 12.5% in the same manner as that of the appraisal time based on the actual project costs and benefits (construction of alternative facilities, management expenses, fuel cost, etc.; the estimate at the time of phase I appraisal was 12%).
At the time of appraisal, coal-fired power generation facilities were assumed to be alternative facilities, but gas turbine power generation facilities are used as the alternative facilities for EIRR calculation of this evaluation. This is because coal-fired power generation facilities have not been operational to date in Sri Lanka and because gas turbine generation seems to be a suitable alternative, since the gas turbine generation involves chargeable and variable operations, through the Samanalawewa Power Station, to meet the peak time
9

electricity demand. The EIRR was calculated by taking into account the higher cost of diesel fuel for gas
turbine generation relative to the cost of coal, while also accounting for the lower-than-planned actual power generation. These two factors cancel each other out, resulting in an EIRR that is almost the same value as the original estimate. 2.3.3 Financial internal rate of return (FIRR)
As with EIRR, the financial internal rate of return (FIRR) of the whole project is calculated to be 7.1 % in the same manner as that of the appraisal time based on the actual project costs and benefits (revenue from sales of electricity based on the actual power generation, etc.; the estimate at the time of phase I appraisal was 8.8 %).
This difference between the planned and actual value is mostly attributable to the fact that the amount of electricity actually generated is less than the planned amount (the power generation is supposed to remain at the present level in the future). If calculated based on the planned amount, FIRR would be 9.0%, which is closer to the original estimate.
Although the unit selling price of electricity (per 1 KWh) at the time of evaluation was 10.75 rupees, the calculation is made on an assumption that the unit selling price will be 12.25 rupees for 2008 and after in accordance with CEB’s review. 2.3.4 Other qualitative effects
In addition to the above, other qualitative effects were expected such as (1) reinforcement of the electric power supply system through the joint operation with reservoirs of other river systems, (2) contribution to irrigation in the basin of Walawe River, (3) convenience for the residents brought by the access road, and (4) creation of employment opportunities in the implementation of this project.
As for (1), no specific effect of the joint operation has been observed probably because the need for joint operation (mutual complementation) has decreased, as the structure of power sources had been changing such as the increase of thermal power generation since around 2000. Detailed effects of (2), (3), (4) will be mentioned in the following section. 2.4 Impact 2.4.1 Contribution to stable power supply
In comparison between 1986 when the project started and 2004, domestic annual power generation increased 3.1 times and the household electrification ratio increased 4.2 times. This project has been playing a role of one of the national electric power supply facilities to meet the rapidly increasing demand for electricity in Sri Lanka. Taking advantage of the characteristics of reservoir-type power generation, the power station constructed under this
10
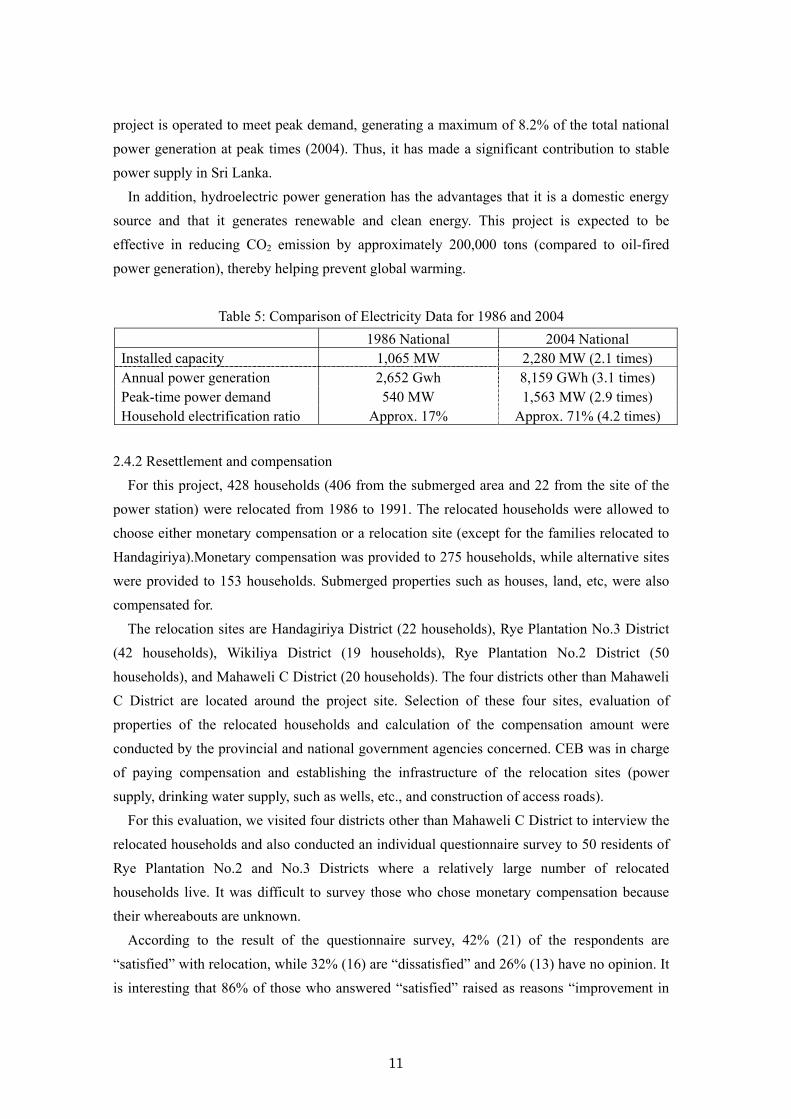
project is operated to meet peak demand, generating a maximum of 8.2% of the total national power generation at peak times (2004). Thus, it has made a significant contribution to stable power supply in Sri Lanka.
In addition, hydroelectric power generation has the advantages that it is a domestic energy source and that it generates renewable and clean energy. This project is expected to be effective in reducing CO2 emission by approximately 200,000 tons (compared to oil-fired power generation), thereby helping prevent global warming.
Table 5: Comparison of Electricity Data for 1986 and 2004 1986 National 2004 National Installed capacity 1,065 MW 2,280 MW (2.1 times) Annual power generation 2,652 Gwh 8,159 GWh (3.1 times) Peak-time power demand 540 MW 1,563 MW (2.9 times) Household electrification ratio Approx. 17% Approx. 71% (4.2 times)
2.4.2 Resettlement and compensation
For this project, 428 households (406 from the submerged area and 22 from the site of the power station) were relocated from 1986 to 1991. The relocated households were allowed to choose either monetary compensation or a relocation site (except for the families relocated to Handagiriya).Monetary compensation was provided to 275 households, while alternative sites were provided to 153 households. Submerged properties such as houses, land, etc, were also compensated for.
The relocation sites are Handagiriya District (22 households), Rye Plantation No.3 District (42 households), Wikiliya District (19 households), Rye Plantation No.2 District (50 households), and Mahaweli C District (20 households). The four districts other than Mahaweli C District are located around the project site. Selection of these four sites, evaluation of properties of the relocated households and calculation of the compensation amount were conducted by the provincial and national government agencies concerned. CEB was in charge of paying compensation and establishing the infrastructure of the relocation sites (power supply, drinking water supply, such as wells, etc., and construction of access roads).
For this evaluation, we visited four districts other than Mahaweli C District to interview the relocated households and also conducted an individual questionnaire survey to 50 residents of Rye Plantation No.2 and No.3 Districts where a relatively large number of relocated households live. It was difficult to survey those who chose monetary compensation because their whereabouts are unknown.
According to the result of the questionnaire survey, 42% (21) of the respondents are “satisfied” with relocation, while 32% (16) are “dissatisfied” and 26% (13) have no opinion. It is interesting that 86% of those who answered “satisfied” raised as reasons “improvement in
11

infrastructure and access to society” brought about by the relocation to suburban areas, while 88% of those who answered “dissatisfied” raised as reasons “loss of self-sufficient economy and rural life,” showing that reaction to the change in environment caused by the relocation from rural to suburban areas varies by resident. It is presumed that dissatisfaction or “loss of self-sufficient economy and rural life” is caused by financial difficulty such as difficulty in finding jobs and low cash income. If measures had been taken to support settlement such as vocational training in addition to compensation, there would have been less dissatisfaction.
Of all respondents (50), 92% (46) answered that “supply of electricity“ is “better than before relocation” and 96% answered that “access to school” is “better than before relocation,” while 98% (49) answered that “securing drinking water” is “worse than before relocation.”
Shortage of water for drinking and cultivation due to wells drying up during the dry season was pointed out as a serious problem also in the interviews with the residents living at the relocation sites. According to the provincial government, drought in the dry season is a common problem widely faced in not only the relocation sites but also the surrounding regions. As a countermeasure, the government is working on the establishment of small water supply systems though the progress is slow because of budget limitations of the provincial government.
We received an impression that the standard of living is the lowest in the Handagiriya District among all relocation sites. In the interview survey, many people in Handagiriya expressed dissatisfaction with insufficient infrastructure.
The compensation for submerged properties was provided in accordance with the legal system of Sri Lanka at that time. However, many respondents of the questionnaire (74%) said they were “dissatisfied” with the compensation. Payment of compensation was delayed in the Handagiriya District because it took time to clarify land ownership.
In the interview and questionnaire surveys, improvement of access to medical services and markets was appreciated as a benefit of relocation. On the other hand, increase of living expenses, lack of opportunities to earn cash income, no allocation of land for paddy cultivation, and lack of land to distribute to their children were raised as problems, which caused dissatisfaction among the relocated households.
In the Imbulpe District upstream of the reservoir, the procedure of relocation compensation (monetary compensation) is currently under way for 49 households that have difficulty in accessing the community road when the reservoir is full. However, actual relocation has not yet taken place. For a tentative measure, CEB has constructed an access road and provided them boats to cross the reservoir. 2.4.3 Removal of vegetation inside the reservoir
It was found necessary to remove vegetation inside the reservoir in order to prevent water
12
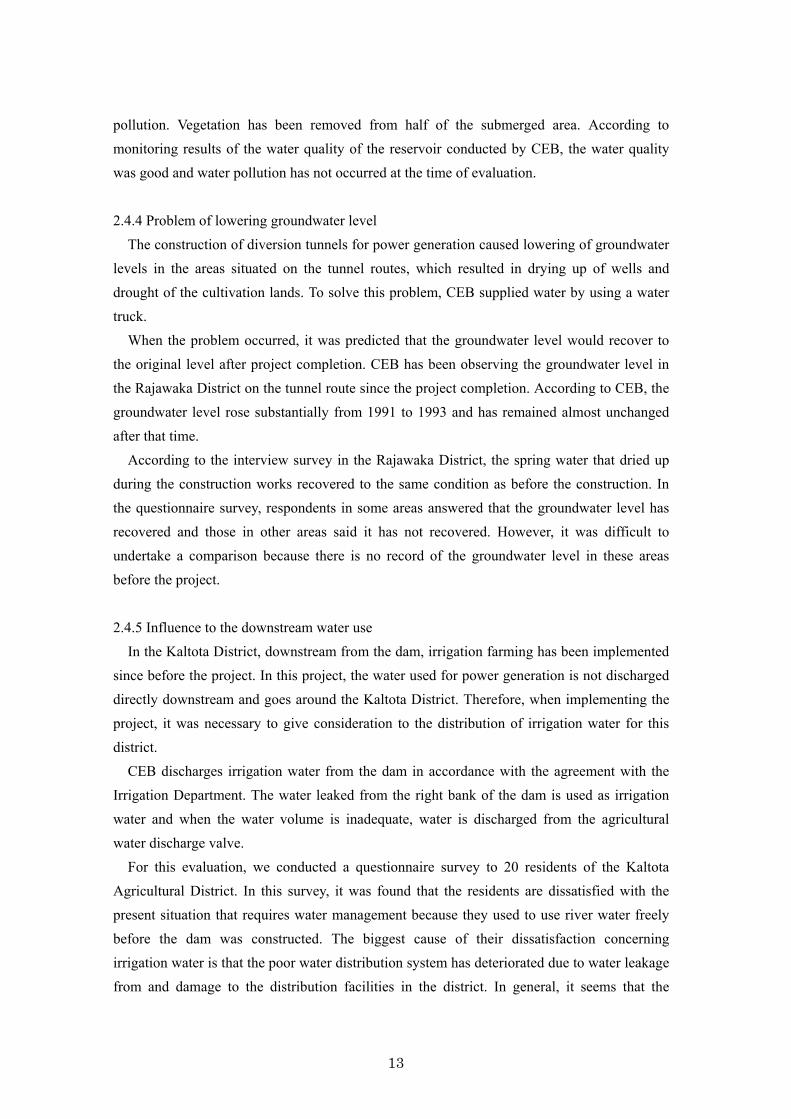
pollution. Vegetation has been removed from half of the submerged area. According to monitoring results of the water quality of the reservoir conducted by CEB, the water quality was good and water pollution has not occurred at the time of evaluation. 2.4.4 Problem of lowering groundwater level
The construction of diversion tunnels for power generation caused lowering of groundwater levels in the areas situated on the tunnel routes, which resulted in drying up of wells and drought of the cultivation lands. To solve this problem, CEB supplied water by using a water truck.
When the problem occurred, it was predicted that the groundwater level would recover to the original level after project completion. CEB has been observing the groundwater level in the Rajawaka District on the tunnel route since the project completion. According to CEB, the groundwater level rose substantially from 1991 to 1993 and has remained almost unchanged after that time.
According to the interview survey in the Rajawaka District, the spring water that dried up during the construction works recovered to the same condition as before the construction. In the questionnaire survey, respondents in some areas answered that the groundwater level has recovered and those in other areas said it has not recovered. However, it was difficult to undertake a comparison because there is no record of the groundwater level in these areas before the project. 2.4.5 Influence to the downstream water use
In the Kaltota District, downstream from the dam, irrigation farming has been implemented since before the project. In this project, the water used for power generation is not discharged directly downstream and goes around the Kaltota District. Therefore, when implementing the project, it was necessary to give consideration to the distribution of irrigation water for this district.
CEB discharges irrigation water from the dam in accordance with the agreement with the Irrigation Department. The water leaked from the right bank of the dam is used as irrigation water and when the water volume is inadequate, water is discharged from the agricultural water discharge valve.
For this evaluation, we conducted a questionnaire survey to 20 residents of the Kaltota Agricultural District. In this survey, it was found that the residents are dissatisfied with the present situation that requires water management because they used to use river water freely before the dam was constructed. The biggest cause of their dissatisfaction concerning irrigation water is that the poor water distribution system has deteriorated due to water leakage from and damage to the distribution facilities in the district. In general, it seems that the
13
necessary amount of irrigation water is supplied with the discharge from the dam. According to the Irrigation Department, irrigation water consumption per unit area in the
district is much larger than the average in Sri Lanka because of the nature of the paddy fields soil with a high underground seepage rate and the geographical features that hamper repeated use of irrigation water. Also, great loss of water due to the poor water distribution system is also one of the reasons. CEB provides support for the promotion of efficient water use in the Kaltota Agricultural District in cooperation with organizations concerned and also supports water supply in the adjacent Katupath Oya Agricultural District by constructing water channels to direct the water used for power generation.
In times when there is a lack of water during the dry season, irrigation water of the amount exceeding the inflow to the reservoir is discharged from the dam, showing that this project contributes to the prevention of damage from water shortage in the Kaltota Agricultural District. It was feared that power generation might decrease if the water discharged from the dam increases with the increase in the demand for irrigation water in this district. However, considering that the most of Kaltota is already used for paddy fields, it is unlikely that the demand for irrigation water will increase substantially.
In addition, according to CEB, power generation using the reservoir water results in an increase in the water flow downstream during the dry season, thereby contributing to irrigation in the basin of Walawe River. 2.4.6 Impact on the ecosystem
In Sri Lanka, the provisions concerning environmental planning under the Environmental Impact Assessment Law were established in 1988. Because this project started before that time, environmental research was not conducted prior to the implementation of the project. Prior to filling the reservoir (1992), an environmental study was conducted by CEB. According to this research, the vegetation similar to that which would be submerged was distributed throughout the surrounding areas. As for animals, some indigenous reptiles and amphibious species that inhabited the forest along the riverbank to be submerged were expected to be affected.
Since a monitoring survey of the impact on the ecosystem was not conducted after the project completion, it was difficult to perform a comparative evaluation. However, no serious impact on the ecosystem has been reported from the interview with CEB, etc. Although we (external evaluators) also tried to conduct an interview survey of academic experts who are knowledgeable about the natural environment of the area around the project site, we could not find any suitable persons.
According to CEB, the forest in the basin is deteriorating due to the increase in the population, expansion of the cultivated area, and advancement of regional development
14

including road construction, though they are not direct effects of the project. To address this issue, the government of Sri Lanka is carrying out the “Upper River Basin Management Project” aimed at preserving the environment of the highland area including the upstream site of this dam, in which CEB is taking part. 2.4.7 Convenience for the local residents brought by the access road
In this project, a 23 km road for construction work was built under the project between the dam and the power station. After the completion of the project, this road is used as a general road and forms part of the public bus route. Thus the road is used by the local residents in their daily lives. Residencess have been built in some areas along the road. 2.4.8 Employment creation effect of the project
According to CEB, 2,000–3,000 jobs were created during the implementation of the project. After the project completion, about 150 persons were employed for this project and related activities. Using the land and buildings used for the project, public facilities such as a university (Sabaragamuwa University) and a training center for local government employees have been constructed and about 1,000 jobs have been created, according to CEB. 2.5 Sustainability 2.5.1 Technical Capacity
All of the engineers who have control over the Electrical, Mechanical and Civil Maintenance Sections as well as the Operations Section of the power station are highly educated and the employees supervising each section have adequate technical education background and experience. Most of the repair persons and workers of each section are also well educated in technical fields and have more than 10 years of experience.
Technical training is provided annually in a systematic manner and is deemed to contribute to the improvement of the technical skills of employees. The Chief Engineer who has general supervision over the power station has been involved in this project from the construction stage and is playing a main role in the operation of the power station with detailed knowledge and experience. Therefore, the project is deemed highly sustainable from a technical perspective. 2.5.2 Operation and maintenance system
Figure 5: Organization Structure of Samanalawewa Power Station
15
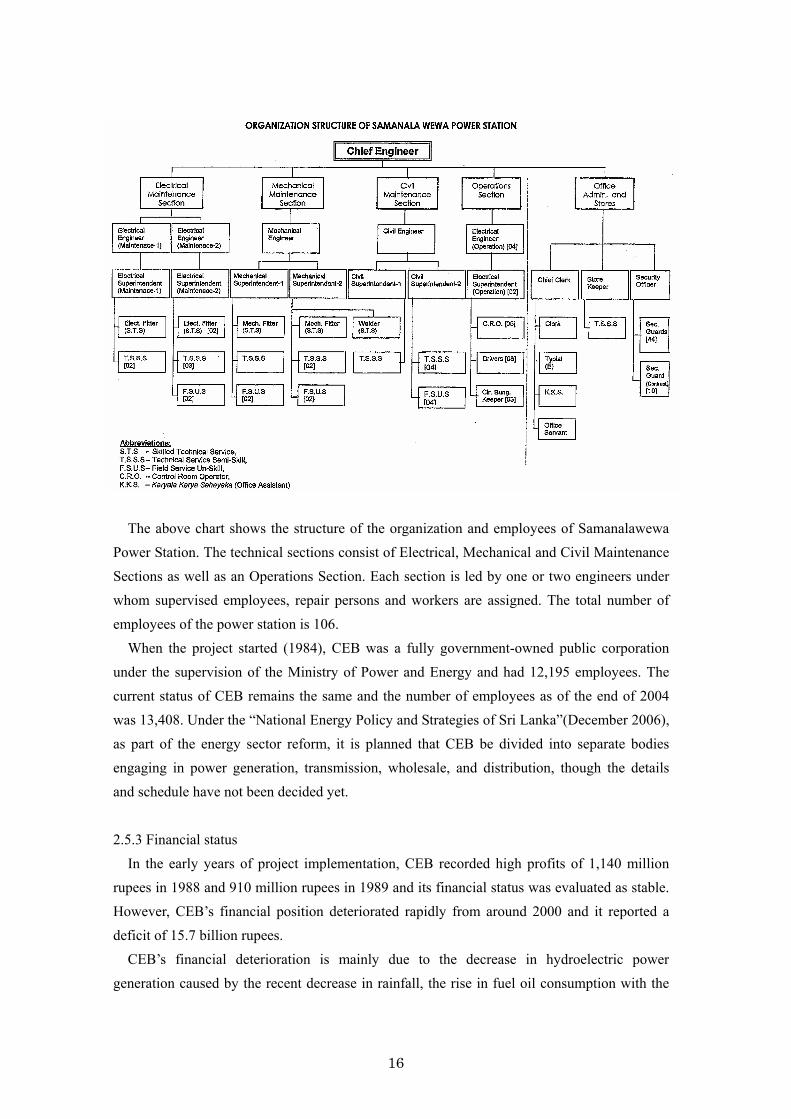
The above chart shows the structure of the organization and employees of Samanalawewa
Power Station. The technical sections consist of Electrical, Mechanical and Civil Maintenance Sections as well as an Operations Section. Each section is led by one or two engineers under whom supervised employees, repair persons and workers are assigned. The total number of employees of the power station is 106.
When the project started (1984), CEB was a fully government-owned public corporation under the supervision of the Ministry of Power and Energy and had 12,195 employees. The current status of CEB remains the same and the number of employees as of the end of 2004 was 13,408. Under the “National Energy Policy and Strategies of Sri Lanka”(December 2006), as part of the energy sector reform, it is planned that CEB be divided into separate bodies engaging in power generation, transmission, wholesale, and distribution, though the details and schedule have not been decided yet. 2.5.3 Financial status
In the early years of project implementation, CEB recorded high profits of 1,140 million rupees in 1988 and 910 million rupees in 1989 and its financial status was evaluated as stable. However, CEB’s financial position deteriorated rapidly from around 2000 and it reported a deficit of 15.7 billion rupees.
CEB’s financial deterioration is mainly due to the decrease in hydroelectric power generation caused by the recent decrease in rainfall, the rise in fuel oil consumption with the
16

sharp increase in oil-fired power generation, oil price hikes, and the increase in payment to independent power producers (IPP).
Even after CEB’s financial position deteriorated, it has been allocating the necessary amount of funds for the operation and maintenance of the power station with a high level of priority. No problems have occurred in the operation and maintenance of the power station due to a shortage of funding. CEB says it intends to continue allocating the necessary amount of funds for the operation and maintenance of the power station with a high level of priority.
Figure 6: Changes in Revenue and Expenditure of CEB (Graph prepared by CEB)
0
20
40
60
80
100
120
1998 1999 2000 2001 2002 2003 2004 2005 2006Year
Rs.
Bill
ions
IPP PaymentsFuel CostsFinance CostsDepreciationMaterial & OHsPersonal Costs
収入
支出
0
20
40
60
80
100
120
1998 1999 2000 2001 2002 2003 2004 2005 2006Year
Rs.
Bill
ions
IPP PaymentsFuel CostsFinance CostsDepreciationMaterial & OHsPersonal Costs
収入Revenue
支出Expenditure
2.5.4 Operation and maintenance status CEB obtained ISO 9001 certification and an O&M manual has been created. Therefore, it is
considered to perform high-quality operation and maintenance activities. The operation and maintenance of the power station under this project is highly evaluated in Sri Lanka and received the “National Productivity and Quality Award for the Public Sector” in December 2006. The biggest concern in operation and maintenance is the procurement of foreign spare parts for the repair and upgrading of facilities and machinery. CEB has been making efforts to procure such parts by seeking new purchasing channels and so on.
There is no specific problem with sand accretion in the reservoir at present, though CEB has not conducted any monitoring. 2.5.5 Engineering stability of the dam
For this evaluation, we inspected the dam and analyzed the data on infiltration from the dam,
17

change in the shape of dam body, etc. As a result, it is considered that the dam is in a stable condition and has no major problem. Some parts of the dam surface where hydrothermally-altered rock material is used have deteriorated due to weathering and CEB applied rocks to fill the deteriorated areas. This filling work is thought to be necessary in the future on a continuous basis. 2.5.6 Water leakage from the right bank of the dam
As the measures against water leakage from the right bank of the dam, work to cut off the right bank (curtain grouting) was performed with the phase III loan and the wet blanketing was performed under the remedial work project. To solve the leakage problem, the government of Sri Lanka set up the “Third-party Review Committee” and “International Panel” and sought their advice on the selection of work method and construction technique. The Overseas Economic Cooperation Fund (former JBIC) also established the “Spring Water Issue Study Meeting” attended by Japanese experts. The leakage amount and the level of groundwater in the right bank have been monitored since the project completion.
The effectiveness of the work to cut off the right bank has not been clearly identified as of the time of evaluation because a large-scale water leakage occurred after the completion and the intended result of the groundwater level being lowered due to the grout curtain has not been observed (if the curtain is effective in terms of seepage control, there should be a difference in the groundwater level between the upstream and the downstream of the curtain).
The remedial works were implemented for the purpose of controlling water leakage to some extent. As a result of the wet blanketing performed in 1998, the amount of water leakage has been reduced and the International Panel evaluated these works as successful. The amount of water leakage when the reservoir is full decreased from 2.8 m3 per second before the remedial works to 2.2 m3 per second. Since then, the amount of water leakage had been stable at around 1.5–2 m3/second depending on the reservoir water level.
However, on December 3, 2006, the amount of water leakage surged to over 5 m3 per second. After that, as the groundwater level in the right bank and the reservoir water level lowered, the amount of water leakage has decreased to 2.9 m3 per second (as of March 12, 2007), which is still larger than that prior to the implementation of the remedial works. Therefore, it can be said that the purpose of the remedial works had been achieved until December 2006. However, the remedial works are no longer working as intended at the time of evaluation, considering that the amount of water leakage has increased more than prior to the implementation of the remedial works.
In light of the movement of the groundwater level at the time when water leakage increased, it is presumed that the increase in water leakage was caused by the destruction of the inside of the bank that occurred near the leakage point and that the seepage control effect of the wet
18
blanket is still maintained. 3. Feedback 3.1 Lessons Learned N.A. 3.2 Recommendations
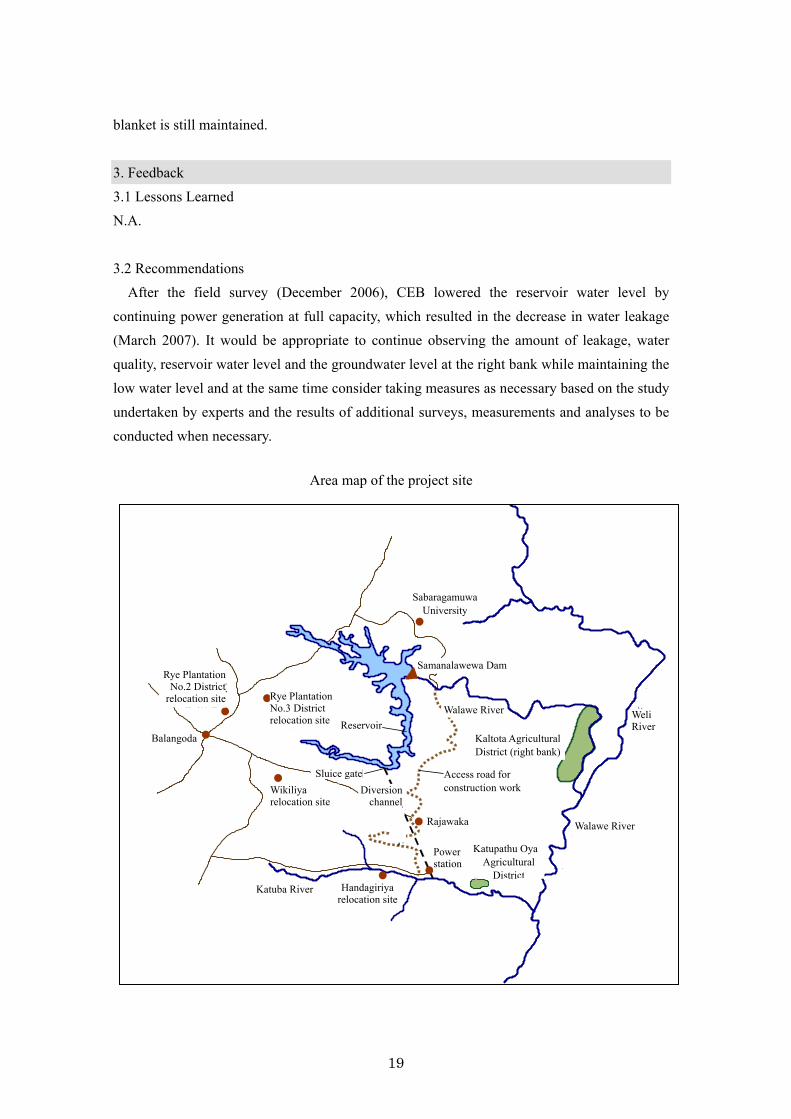
After the field survey (December 2006), CEB lowered the reservoir water level by continuing power generation at full capacity, which resulted in the decrease in water leakage (March 2007). It would be appropriate to continue observing the amount of leakage, water quality, reservoir water level and the groundwater level at the right bank while maintaining the low water level and at the same time consider taking measures as necessary based on the study undertaken by experts and the results of additional surveys, measurements and analyses to be conducted when necessary.
Area map of the project site
バランゴーダ
カツバル川
貯水池
ハンダギリヤ移転地
移転地
移転地
導水トン
ヤ
ネル
ウィッキリ移転地
Balangoda
Wikiliya relocation site
RNr Reservoir
Diversion channel
Katuba River Handagiriya relocation site
19
サバラガムワ学大
Sabaragamuwa University
発電所
ワラウェ川
ワラウェ川
ウェ
集落
ル川
ラジャワカ
カルトタ農業地区(右岸)
アクセス道路
サマナラウェアダムサマナラウェアダム
Weli River
Power station
K
District
Rajawaka
Aconstruction work
Walawe River
Kaltota Agricultural District (right bank)
Walawe River
Samanalawewa Dam
工事用ccess road for
農カツパスオヤ
業地区
atupathu OyaAgricultural
取水口Sluice gate
レイ農園No2地区
Rye Plantation No.2 District
relocation site
レイ農園No3地区ye Plantation o.3 Districtelocation site

Comparison of Original and Actual Scope Item Plan Actual
(1) Outputs [Hydroelectric Power Project] Diversion tunnels (2) (JP) Dam (JP) Diversion tunnel (UK) Hydroelectric turbines (JP) Power generator (UK) Penstock (JP) Transmission line (other)
[Hydroelectric Power Project] Length: 520 m and 545 m Height: 103.5 m, Length: 529 mEffective storage capacity: 254 million m3
Length: 5,150 m Turbine discharge: 42.0 m3/s 120 MW (60 MW×2) Length: 648 m 17 km (power station–Balangoda)
[Hydroelectric Power Project] Length: 482 m and 502 m Height: 100 m, Length: 530 m Effective storage capacity: 218.2 million m3
Right bank cut-off works Length: 5,159 m As planned As planned Length: 670 m 19 km (power station–Balangoda) 39 km (power station–Embilipitiya)
[Remedial Works] Main blanket (JP) Follow-up blanket (JP)
[Remedial Works] Input: 500,000 m3
Input: 500,000 m3
[Remedial Works] Input: 426,030 m3
Cancelled (2) Project Period [Hydroelectric Power Project]
[Hydroelectric Power Project] Sep. 1986–Jul. 1991 (59 months)
[Hydroelectric Power Project] Sep. 1986–Dec. 1992 (76 months)
[Remedial Works]
[Remedial Works] Aug. 1995–May 2001 (70 months)
[Remedial Works] Aug. 1995–Jun. 1999 (47 months)
(3) Project Cost [Hydroelectric Power Project] Foreign Currency Local Currency Total Japanese ODA loan Portion Exchange Rate
[Hydroelectric Power Project] 43,139 million yen 17, 037 million yen (2,433.8 million rupees) 60,176 million yen 28,420 million yen 1 rupee=7 yen (as of April 1986)
[Hydroelectric Power Project] 48,112 million yen 22,217 million yen (5,660 million rupees) 70,329 million yen 31,684 million yen 1 rupee=3.93 yen (1986–1995)
[Remedial Works] Foreign Currency Local Currency Total Japanese ODA loan Portion Exchange Rate
[Remedial Works] 5,061 million yen 1,153 million yen (568 million rupees) 6,214 million yen 5,282 million yen 1Rs=2.03 yen (as of February 1995)
[Remedial Works] 2,359 million yen 905 million yen (453 million rupees) 3,264 million yen 3,134 million yen 1Rs=2.00 yen (1996–1999)
Note) The planned figures for the hydroelectric power project are as of the time of phase I appraisal (1986) and those for the remedial works are as of the time of phase III appraisal (1995).
20
[Reference-1]
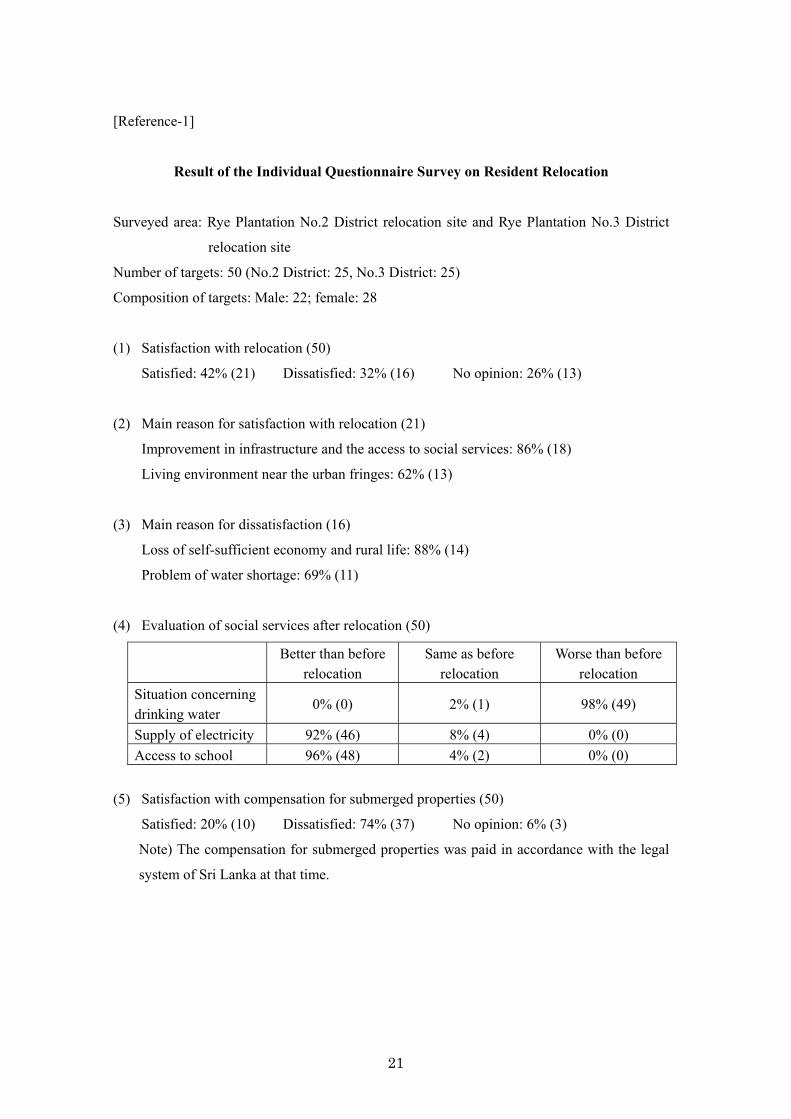
Result of the Individual Questionnaire Survey on Resident Relocation
Surveyed area: Rye Plantation No.2 District relocation site and Rye Plantation No.3 District
relocation site
Number of targets: 50 (No.2 District: 25, No.3 District: 25)
Composition of targets: Male: 22; female: 28
(1) Satisfaction with relocation (50)
Satisfied: 42% (21) Dissatisfied: 32% (16) No opinion: 26% (13)
(2) Main reason for satisfaction with relocation (21)
Improvement in infrastructure and the access to social services: 86% (18)
Living environment near the urban fringes: 62% (13)
(3) Main reason for dissatisfaction (16)
Loss of self-sufficient economy and rural life: 88% (14)
Problem of water shortage: 69% (11)
(4) Evaluation of social services after relocation (50)
Better than before
relocation Same as before
relocation Worse than before
relocation Situation concerning drinking water
0% (0) 2% (1) 98% (49)
Supply of electricity 92% (46) 8% (4) 0% (0) Access to school 96% (48) 4% (2) 0% (0)
(5) Satisfaction with compensation for submerged properties (50)
Satisfied: 20% (10) Dissatisfied: 74% (37) No opinion: 6% (3)
Note) The compensation for submerged properties was paid in accordance with the legal
system of Sri Lanka at that time.
21
[Reference-2]
Results of the Interview Survey on Resident Relocation
(Comments from relocated residents)
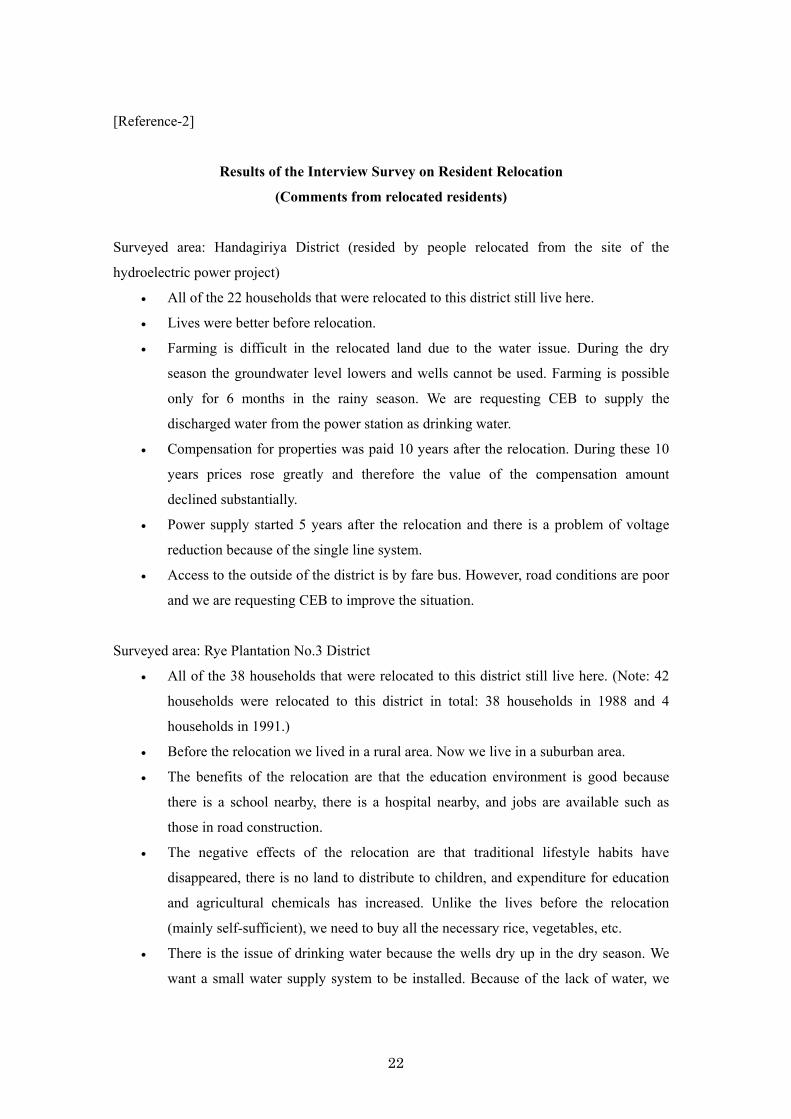
Surveyed area: Handagiriya District (resided by people relocated from the site of the
hydroelectric power project)
• All of the 22 households that were relocated to this district still live here.
• Lives were better before relocation.
• Farming is difficult in the relocated land due to the water issue. During the dry
season the groundwater level lowers and wells cannot be used. Farming is possible
only for 6 months in the rainy season. We are requesting CEB to supply the
discharged water from the power station as drinking water.
• Compensation for properties was paid 10 years after the relocation. During these 10
years prices rose greatly and therefore the value of the compensation amount
declined substantially.
• Power supply started 5 years after the relocation and there is a problem of voltage
reduction because of the single line system.
• Access to the outside of the district is by fare bus. However, road conditions are poor
and we are requesting CEB to improve the situation.
Surveyed area: Rye Plantation No.3 District
• All of the 38 households that were relocated to this district still live here. (Note: 42
households were relocated to this district in total: 38 households in 1988 and 4
households in 1991.)
• Before the relocation we lived in a rural area. Now we live in a suburban area.
• The benefits of the relocation are that the education environment is good because
there is a school nearby, there is a hospital nearby, and jobs are available such as
those in road construction.
• The negative effects of the relocation are that traditional lifestyle habits have
disappeared, there is no land to distribute to children, and expenditure for education
and agricultural chemicals has increased. Unlike the lives before the relocation
(mainly self-sufficient), we need to buy all the necessary rice, vegetables, etc.
• There is the issue of drinking water because the wells dry up in the dry season. We
want a small water supply system to be installed. Because of the lack of water, we
22
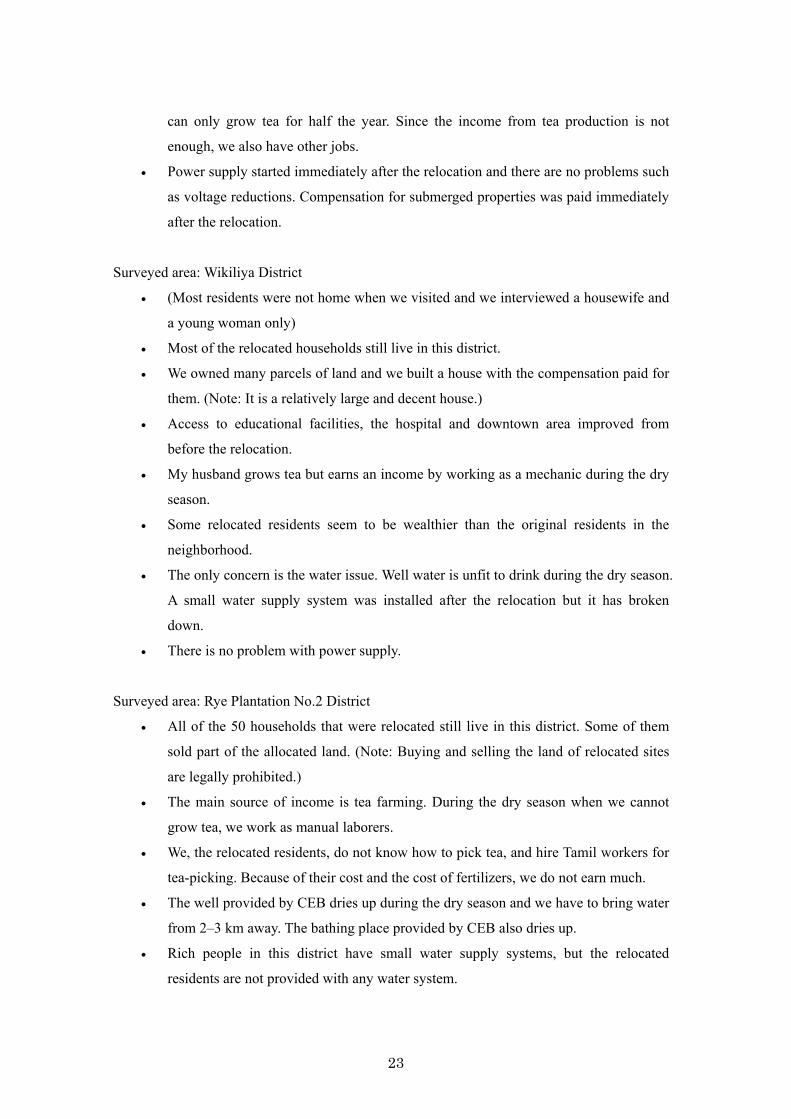
can only grow tea for half the year. Since the income from tea production is not
enough, we also have other jobs.
• Power supply started immediately after the relocation and there are no problems such
as voltage reductions. Compensation for submerged properties was paid immediately
after the relocation.
Surveyed area: Wikiliya District
• (Most residents were not home when we visited and we interviewed a housewife and
a young woman only)
• Most of the relocated households still live in this district.
• We owned many parcels of land and we built a house with the compensation paid for
them. (Note: It is a relatively large and decent house.)
• Access to educational facilities, the hospital and downtown area improved from
before the relocation.
• My husband grows tea but earns an income by working as a mechanic during the dry
season.
• Some relocated residents seem to be wealthier than the original residents in the
neighborhood.
• The only concern is the water issue. Well water is unfit to drink during the dry season.
A small water supply system was installed after the relocation but it has broken
down.
• There is no problem with power supply.
Surveyed area: Rye Plantation No.2 District
• All of the 50 households that were relocated still live in this district. Some of them
sold part of the allocated land. (Note: Buying and selling the land of relocated sites
are legally prohibited.)
• The main source of income is tea farming. During the dry season when we cannot
grow tea, we work as manual laborers.
• We, the relocated residents, do not know how to pick tea, and hire Tamil workers for
tea-picking. Because of their cost and the cost of fertilizers, we do not earn much.
•
from 2–3 km away. The bathing place provided by CEB also dries up.
Rich people in this district have small water supply systems, but the rel
The well provided by CEB dries up during the dry season and we have to bring water
• ocated
residents are not provided with any water system.
23

• The access to the hospital, school and downtown area has improved. However, our
lives are not stable.
• There is no problem with power supply.
• We are worried about the future because we have no land to pass on to the next
generation. We want land for growing rice.
24
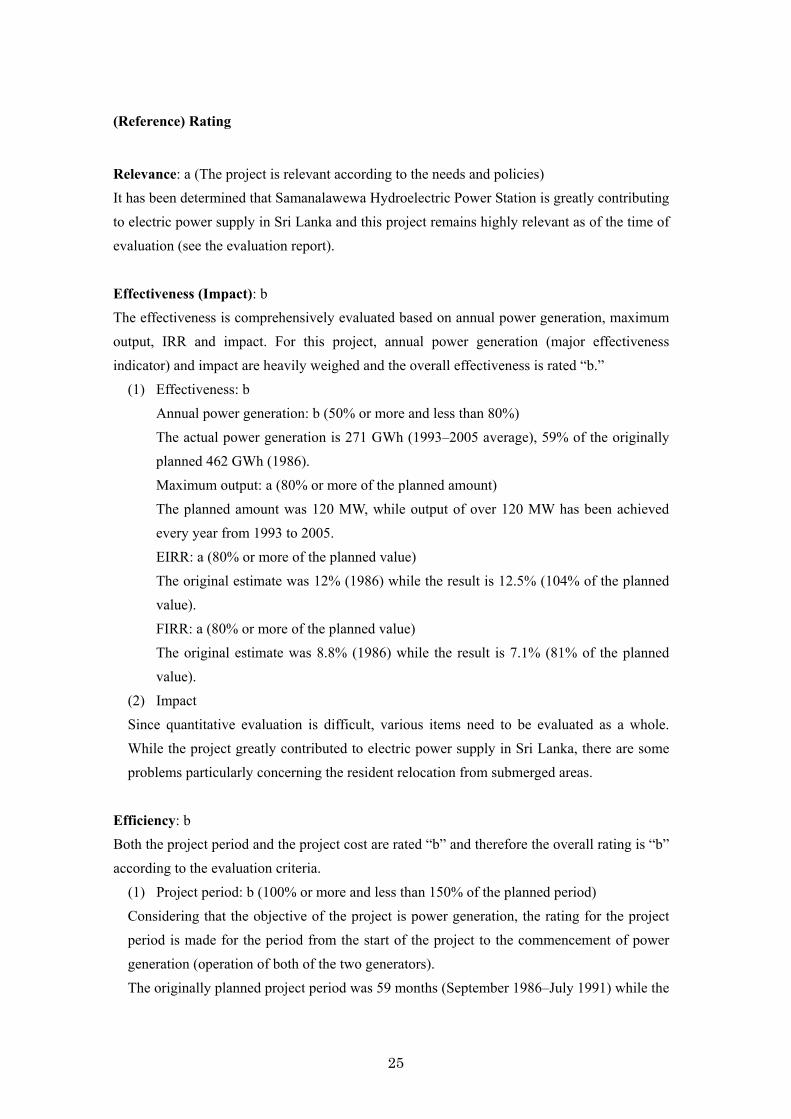
(Reference) Rating
Relevance: a (The project is relevant according to the needs and policies) It has been determined that Samanalawewa Hydroelectric Power Station is greatly contributing to electric power supply in Sri Lanka and this project remains highly relevant as of the time of evaluation (see the evaluation report).
Effectiveness (Impact): b The effectiveness is comprehensively evaluated based on annual power generation, maximum output, IRR and impact. For this project, annual power generation (major effectiveness indicator) and impact are heavily weighed and the overall effectiveness is rated “b.”
(1) Effectiveness: b Annual power generation: b (50% or more and less than 80%) The actual power generation is 271 GWh (1993–2005 average), 59% of the originally planned 462 GWh (1986). Maximum output: a (80% or more of the planned amount) The planned amount was 120 MW, while output of over 120 MW has been achieved every year from 1993 to 2005. EIRR: a (80% or more of the planned value) The original estimate was 12% (1986) while the result is 12.5% (104% of the planned value). FIRR: a (80% or more of the planned value) The original estimate was 8.8% (1986) while the result is 7.1% (81% of the planned value).
(2) Impact Since quantitative evaluation is difficult, various items need to be evaluated as a whole. While the project greatly contributed to electric power supply in Sri Lanka, there are some problems particularly concerning the resident relocation from submerged areas.
Efficiency: b Both the project period and the project cost are rated “b” and therefore the overall rating is “b” according to the evaluation criteria.
(1) Project period: b (100% or more and less than 150% of the planned period) Considering that the objective of the project is power generation, the rating for the project period is made for the period from the start of the project to the commencement of power generation (operation of both of the two generators). The originally planned project period was 59 months (September 1986–July 1991) while the
25
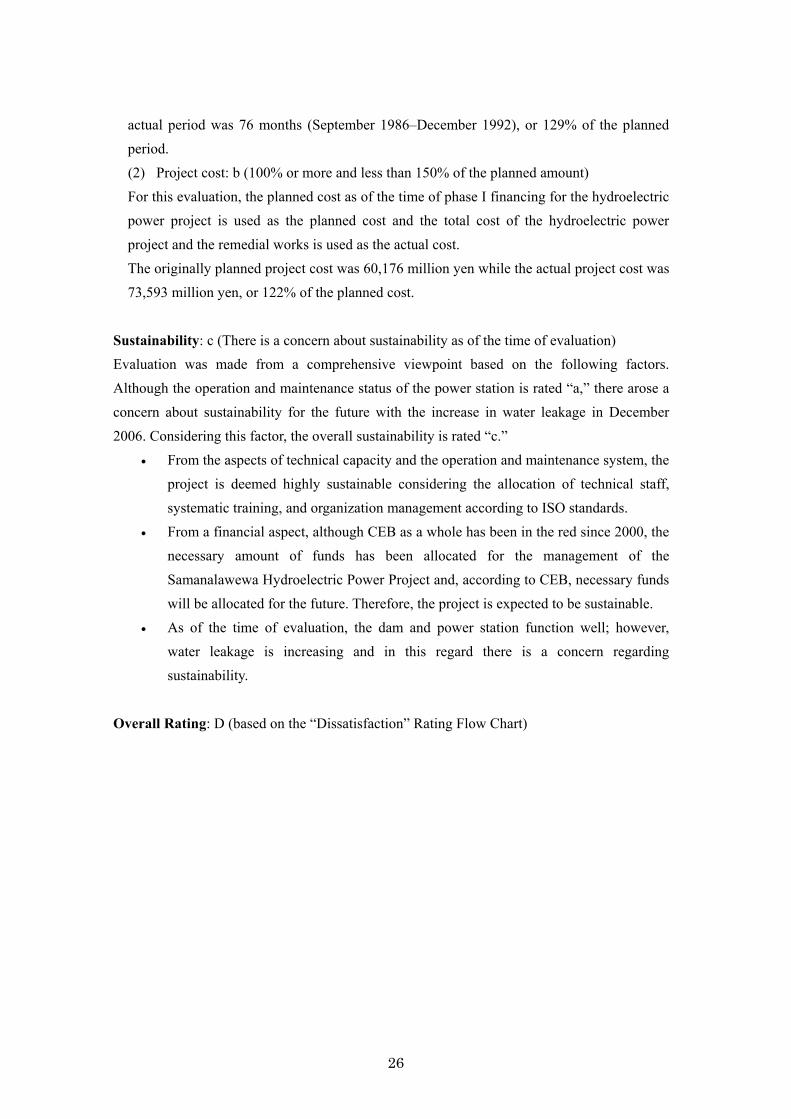
actual period was 76 months (September 1986–December 1992), or 129% of the planned period. (2) Project cost: b (100% or more and less than 150% of the planned amount) For this evaluation, the planned cost as of the time of phase I financing for the hydroelectric power project is used as the planned cost and the total cost of the hydroelectric power project and the remedial works is used as the actual cost. The originally planned project cost was 60,176 million yen while the actual project cost was 73,593 million yen, or 122% of the planned cost.
Sustainability: c (There is a concern about sustainability as of the time of evaluation) Evaluation was made from a comprehensive viewpoint based on the following factors. Although the operation and maintenance status of the power station is rated “a,” there arose a concern about sustainability for the future with the increase in water leakage in December 2006. Considering this factor, the overall sustainability is rated “c.”
• From the aspects of technical capacity and the operation and maintenance system, the project is deemed highly sustainable considering the allocation of technical staff, systematic training, and organization management according to ISO standards.
• From a financial aspect, although CEB as a whole has been in the red since 2000, the necessary amount of funds has been allocated for the management of the Samanalawewa Hydroelectric Power Project and, according to CEB, necessary funds will be allocated for the future. Therefore, the project is expected to be sustainable.
• As of the time of evaluation, the dam and power station function well; however, water leakage is increasing and in this regard there is a concern regarding sustainability.
Overall Rating: D (based on the “Dissatisfaction” Rating Flow Chart)
26