Embed Size (px)
Citation preview

ScienceAsia 31 (2005): 91-97
SSLP-based Linkage Map Construction inBlack Tiger Shrimp (Penaeus monodon Fabricius)Suwit Wuthisuthimethaveea,b*, Prajuab Lumubolc, Theerayut Toojindaa,d, SomvongTragoonrunga,b and Apichart Vanavichita,d
a Interdisciplinary Graduate Program of Genetic Engineering, Faculty of Graduate School, KasetsartUniversity, Bangkok 10900, Thailand.
b DNA Technology Laboratory, National Center for Genetic Engineering and Biotechnology, KasetsartUniversity, Kamphaengsaen Campus, Nakorn Pathom 73140, Thailand.
c Marine Science Department, Fisheries Faculty, Kasetsart University, Bangkok 10900, Thailand.d Rice Genes Discovery Unit, National Center for Genetic Engineering and Biotechnology, Kasetsart
University, Kamphaengsaen Campus, Nakorn Pathom 73140, Thailand.
* Corresponding author, E-mail: [email protected]
Received 30 Sep 2004Accepted 29 Oct 2004
ABSTRACT: Microsatellites represent an abundant source for genetic markers in eukaryotic genomes. We developedmicrosatellite or simple sequence length polymorphism (SSLP) markers for the black tiger shrimp geneticimprovement programs. Construction of a genetic linkage map was initiated for Penaeus monodon using 57SSLPs, EST and SCAR markers with 76 individuals of an F1 inter-cross family. Segregation markers werescored and analyzed with the JoinMap 2.0 program. A total of 50 markers, confirmed with expected Mendeliansegregation ratios of 1:1 or 1:1:1:1 (χ2-test at the α = 0.01 level), were grouped with a LOD score of 5.0.Results showed that 27 loci formed 9 linkage groups and there were 23 unlinked loci. The largest group had7 markers spanning 29.5 cM. The average distance between markers was 3.8 cM. This linkage map covereda total genetic distance of 103.6 cM.
KEYWORDS: Linkage map, Penaeus monodon, SSLP markers.
INTRODUCTION
Previous studies suggest that microsatellites areabundant and widely distributed in the genomes ofshrimps.1-6 This class of co-dominant DNA markerdetects higher levels of allelic variation than randomlyamplified polymorphic DNA(RAPD) markers, and canbe easily assayed by the polymerase chain reaction(PCR). However, difficulties encountered in the isolationand analysis of microsatellites from penaeids limits thenumber of microsatellite markers available for linkagemapping and quantitative trait loci (QTL) detectionstudies.3
A gene map can be used for the identification ofQTLs controlling economically important characters,such as growth and disease resistance, and thedevelopment of marker-assisted breeding programsfor strain improvement. A linkage map based onAmplified Fragment Length Polymorphism (AFLP) hasbeen reported for Penaeus japonicus.3,7 Efforts have alsobeen made to develop a preliminary genetic linkagemap for the most important cultured species, blacktiger shrimp, P. monodon.8
In this study, we aimed to construct a linkage mapof P. monodon using microsatellite or simple sequencelength polymorphism (SSLP) markers9, a P. monodon
expressed sequence tag (EST) marker (an EST whichmatched a gene encoding an anti-microbial peptide ofLitopenaeus setiferus; Pmpsb) and a SCAR marker (anAFLP-derived PCR marker from a low- and high-growthP. monodon polymorphism; Tag4), with an F1 inter-crossfamily.
MATERIALS AND METHODS
Production of reference family and DNA isolationProduction of reference family and DNA isolationProduction of reference family and DNA isolationProduction of reference family and DNA isolationProduction of reference family and DNA isolationOne F1 inter-cross pedigreed family was produced
by artificial insemination from the research project “recurrent selection of black tiger shrimp (Penaeusmonodon Fabricius) under low salinity culture” fundedby the National Research Coucil of Thailand. Thepleopods of parents were preserved at the time ofspawning. The offspring was cultured under low salinityconditions (5 ppt). One hundred samples wererandomly selected, with offspring being preserved in95% ethanol for future DNA preparation. Total genomicDNA was isolated from alcohol-fixed tissue via DNATrap(DNATEC, Nakorn Pathom, Thailand.), according tothe manufacturer’s instruction.
SSLP genotypingSSLP genotypingSSLP genotypingSSLP genotypingSSLP genotypingA total of 57 SSLP (Table 1), 1 EST and 1 SCAR

Table 1. Microsatellite markers of Penaeus monodon.
Locus Locus Locus Locus Locus a a a a a CloneCloneCloneCloneClone GenBank GenBank GenBank GenBank GenBank Repeat Repeat Repeat Repeat Repeat RepeatsRepeatsRepeatsRepeatsRepeats Primer sequence Primer sequence Primer sequence Primer sequence Primer sequence Acc. no Acc. no Acc. no Acc. no Acc. no type type type type type b b b b b
DPm101 B0311 AY189723 C (GA) 48
+ (GACA)7
+ (GAAA)6
ggtcttgcttccctaacctgtccattctcttcatctttccgagtctgc
DPm103 B14-2/6 AY188966 C (GA)6+ (GACA)
4+ (GATA)
21+ (GTCA)
31tgttcccctcactgtgtcctacgggaagcgcctgtagagtagag
DPm104 T-221 AY188967 C (CAGT)23
+ (TC)11
aggacctgcatttgtgtcgatggcgagacaaggttcg
DPm105 B14-12/1 AY188968 C (TATC)4+ (TCTG)
6 + (CAGT)
10+ (GAGT)
3tgcatacctaacgtacctacacaaagctgaatgcaggtcgagt
DPm107 T-419 AY188969 C (CTC)9
(CAT)31
(CATCATC)3+ (CATCAAT)
3+ (CAT)
21ccagtgaaggatatgaggaagcgccacacgaaacctctactgc
DPm108 T-518 AY188970 C (GA)10
(GACA)3(GAGACA)
4(CATT)
3+ (CATT)
3cggatgaactgtcagtggacttagccacggaagaagcact
DPm109 T-603 AY188971 C (CAGT)42
(CACT)5
tttaaggactttcgcaatggcgcattccaactgctcatag
DPm110 T-611 AY188972 C (TTC)10
TTTT (TTC)17
(TAC)25
agtcaccaaggaatcggagttaaatcgtcggcaaatgtca
DPm111 T-607 AY188973 C (CAT)12
+(CAT)25
(CAA)10
+(CAG)9+(CAT)
9ttcagggattctctgctgga
(CAG)7
gcgagataaggatgctggagDPm112 T-614 AY188974 C (CAGT)
48 + (GAAT)
4ctgtgtaatgggcttgtggaaaagcagcaacgagaggaag
DPm113 B12-/8 AY752996 C (CAGT)48
+(GAAT)4
ttattccctggagccaagaccacgtgataatgcagtagtttcag
DPm114 Ct-108 AY752997 C (TCC)8+(CAT)
25ccagcgcattcttccttatctccagaaaagggatgggaat
DPm115 ZT-112 AY188975 C (CTC)9(CAT)
85catgtaccgcccactcatcgccaacacgaaactctactgc
DPm116 T-507 AY752998 C (GACT)5+(GACT)
3+(GACT)
5+(GACT)
15+ cttgggggaagaatatttctgag
(GATT)3+ (GACT)
11+(GACT)
3gagagaaaaggaagatgagacga
DPm117 T-1309 AY188976 C (GCAC)4+(CA)
4+(CA)
46+(CA)
5+(CA)
3+ (TC)
3tatgaagataagacgcgctcaagcgtacatttgttgtttattgaggag
DPm119 T-1307 AY188977 C (GA)3+(AG)
8+(GA)
3+(GACT)
4+(GACT)
4+(GACT)
4+ attggaaaagcttgaggatgg
(GACT)3+(AGAC)
3+(ACAG)
3+(AG)
3+(GACA)
3+ atgatgaaatgagtcgactgtca
(ACAG)4+(AGAC)
5
DPm120 T-1401 AY188978 C (AG)11
+(TGAC)4+(TGAC)
24ttatccgtatagccgcgttatcttacaggacctgcatttgtgtc
DPm121 T-1410 AY188979 C (GTT)3
+ (TCA)21
+ (CAT)3
+(TGA)3
aatcactgacttgcacaacctcggtgacgttataaggcaagt
DPm125 T-706 AY188980 C (CAT)13
+(CAT)25
+(CAA)20
+(CAT)4+ ggatttagagagtgggctgtctt
(CTTCAT)3+(CAT)
4+(CATCAG)
3+(CAG)
10+(CAT)
9+ gagataaggatgctggagattga
(CAG)7
DPm127 T-1103 AY753003 C (GTT)3+(TG)
3+(CA)
3+(CT)
7+(CT)
10+ gtggttgttgcaaatgtggt
(CTCG)5+ (CT)
14+(TC)4+(CA)
24ctgaaatcgtgcttttgtgc
DPm130 T-417 AY188982 C (GTC)25
+(GAA)17
gaatcggagtcggtgtcttccaagcaaacaaccgaacaag
DPm131 T-812 AY753005 C (GC)11
+(GACT)24
cgttatccgcacgttattcgaggacctgcatttgtgtcg
DPm132 T-1503 AY753006 C (GACT)21
+(TC)5
ccgtaaacatccttctcaacgatgtagtcatcgccacaaactcc
DPm137 T-2106 AY753010 C (TC)23
+(CA)7
tgttggcattacttctgcatacgtcgggctcataaagtttcgta
DPm138 T-1603 AY753011 C (CATA)24
+(CATA)35
+(CA)5+(CA)
8acatccattcacagacatacgcgatactctttacaactgcgacca
DPm139 T-1617 AY753012 C (CAGT)23
+(TC)12
ttacaggacctgcatttgtgtcttatccgtatagccgcgttatc
DPm140 T-1903 AY753013 C (CAT)26
+(CAA)9+CAG)
10ctggatttagagagtgggctgtgagattgaatagcggatgcac
DPm141 T-1604 AY753014 C (CAGT)3+(GACA)
84tgctgactgattgactgatctccttcgtccccsatctaatcc
DPm142 T-1708 AY189725 C (CACG)11
+(CA)21
tgagatagctaatttaggtgtaccttc ggacaagaaataacacacttaaaggtc
92 ScienceAsia ScienceAsia ScienceAsia ScienceAsia ScienceAsia 31 (2005)31 (2005)31 (2005)31 (2005)31 (2005)

Table 1. Cont’d.
Locus Locus Locus Locus Locus a a a a a CloneCloneCloneCloneClone GenBank GenBank GenBank GenBank GenBank Repeat Repeat Repeat Repeat Repeat RepeatsRepeatsRepeatsRepeatsRepeats Primer sequence Primer sequence Primer sequence Primer sequence Primer sequence Acc. no Acc. no Acc. no Acc. no Acc. no type type type type type b b b b b
DPm145 T-1807 AY753017 C (GCT)7+(GAT)
9ggagattgaataacggatgcacctggatttagagagtgggctgt
DPm148 T-1904 AY753020 C (GA)44
+(GACT)17
ttatccgtatagccgcgttatcttacaggacctgcatttgtgtc
DPm151 T-2801 AY753023 C (TC)9+(CAT)
12+(CAG)
7cgttagtgctgtttcctgtgtcgtgatggtaatggtggtgatga
DPm152 T-2803 AY753024 C (CA)5+(TA)
6+(GA)
38+(GACT)
36actgacactcactcgtgcacttggattttattcgtacgtgacttcag
DPm153 T-516 AY753025 C (CATCGT)7+(CAT)
23ttacaggacctgcatttgtgtcttatccgtatagccgcgttatc
DPm154 T-1814 AY753026 C (CAGT)3+(TC)
11tttatttgtgcttgactggcactatggtgatgatgattgatgacg
DPm203 B2 AY187720 P (CA)46
ctcccattaatcctgtcctgaatgttgggggatagggaatagat
DPm205 CT-106 AY188983 P (TC)7
acgacgacgtcaaagtctcacagacaaacggacaaagacg
DPm206 T-520 AY753030 P (CA)6TA(CA)
30TA(CA)
9TA(CA)
8AA(CA)
8ctttgctttgtgctacatacccggggaatcaagtgaacaagg
DPm207 T-809 AY753031 P (CA)45
ctgggaagagcgtggtgtagaggcataatgaagggcatgg
DPm208 T-620 AY753032 P (CA)3
tattccacttgaccattacacgagccgatagtgttgtttggtagag
DPm210 T-1105 AY753034 P (TC)46
tctaattacacggacacacatcggcaagaatctcctaaaactctgc
DPm211 T-408 AY753035 I (TC)9+(GA)
33atcacagcgtaatgaaagcctggacctgtaaggatcccagtcgt
DPm212 T-1305 AY753036 P (TA)3
tcggagtagttaagggtgatttggccacgccattagagactaca
DPm217 T-1607 AY189726 P (CA)8
tctattgtctgccagtttgtcctagcacgggatttatgaagtga
DPm218 T-1711 AY189727 P (TC)19
attccgcaatatatcggtttccaatgtttccatttcatgcttcg
DPm219 T-1808 AY753041 I (GA)13
taaatgtcagccctgaagctcatcccaacgattactcaaacctc
DPm223 T-2504 AY753045 P (TA)5
tcagaactacgatatggattataggtggtaggtagattccatggggttg
DPm302 T-513 AY753051 P (CAT)6GT(CAT)
25gctccgtttaatgaggtcgtcgcgtatcgatgaatgagag
DPm303 T-609 AY188984 I (TAC)9+ (TAC)
24tgccttgtattttgacgatcagttggagtagcaacagcggta
DPm308 T-1413 AY188985 P (CAT)9
actcgcgtttactttccttcgcgagaatcacgaagaagatgc
DPm310 CT-102 AY753056 I (CAT)16
aaggctgatttatcgcttgcttcccgtgaataccaatgc
DPm313 T-1809 AY189728 P (GAT)23
tgggaaattatgtaagggctgtattcctccacacgacttactgc
DPm315 T-1908 AY753060 I (CAG)6
aagccacagaatctgaacctagaaaccggtaggctcccaagtc
DPm316 T-1912 AY753061 P (GAT)11
ggagtagacccgagagtgtcagacctccactggtaattcctcct
DPm317 T-2603 AY753062 P (CAT)25
tatttcgtagacctttggcacaccggtgaaggtaaacaatacca
DPm401 T-904 AY753063 P (CAGT)13
tcaggttatgaagagagaatggacgttgtgtttaacccgaga
DPm402 T-622 AY188987 P (CAGT)19
ccactctaactccgccagtctccctaccccactatcatcg
a Microsatellite or SSLP locus: DPm = DNA Technology Laboratory Penaeus monodon.b Repeat types: P = perfect repeats, I = imperfect repeats and C = compound repeats.
ScienceAsia ScienceAsia ScienceAsia ScienceAsia ScienceAsia 31 (2005)31 (2005)31 (2005)31 (2005)31 (2005) 93

94 ScienceAsia ScienceAsia ScienceAsia ScienceAsia ScienceAsia 31 (2005)31 (2005)31 (2005)31 (2005)31 (2005)
φ
xHin
fI1 2 3 4 5 6 7 8 9 10 11 12 13 14 15 16 17 18 19 20 21 22 23 24 25 26 27 28 29 30 31 32 33 34 35 36 37 38 39 40 41 42 43 44 45 46 47 48 49 50 51 52 53 54 55 56 57 58 59 60 61 62 63 64 65 66 67 68 69 70 71 72 73 74 75 76 77 78 79 80 81 82 83 φ
xHin
fI
φxH
infI
1 2 3 4 5 6 7 8 9 10 11 12 13 14 15 16 17 18 19 20 21 22 23 24 25 26 27 28 29 30 31 32 33 34 35 36 37 38 39 40 41 42 43 44 45 46 47 48 49 50 51 52 53 54 55 56 57 58 59 60 61 62 63 64 65 66 67 68 69 70 71 72 73 74 75 76 77 78 79 80 81 82 83 φxH
infI
markers were used to genotype the parents and 79progeny individuals. The reaction was performed in a10 ul mixture containing 5 ng genomic DNA, 2.5 pmolof each primer, 200 mM dNTP, 90 mM Tris-Cl (pH 9),20 mM (NH
4)
2SO
4, 2 mM MgCl
2, and 0.2 unit Taq DNA
polymerase (Promega, Madison, WI, USA).Amplification was carried out on a GeneAmp 9700thermal cycler (Applied Biosystem, Foster City, CA,USA) with the following PCR conditions: 1 cycle of 94oC for 3 min, 35 cycles of 94 oC for 30 s, 55 oC for 30s, 72 oC for 1 min and a final cycle of 72 oC for 5 min.PCR products were added to an equal volume of stopsolution (98% deionized formamide, 2 mM EDTA,0.05% bromophenol blue, 0.05% xylene cyanol) andheated at 94 oC for 3 min. A 3 ml aliquot of each PCRproduct mixture was analyzed on a 4.5% denaturing
polyacrylamide gel. DNA fragments were visualized bysilver staining.
Linkage analysisLinkage analysisLinkage analysisLinkage analysisLinkage analysisThe notation of segregation markers follows that of
Wu et al.10 using different characters to denote differentalleles of a marker locus including ‘0’ for a null allele.The left of the ‘x’ is the genotype of the mother, and theright of the father. Segregation types “ab x ac” and “abx cd” are used for markers segregating in a 1:1:1:1 ratioin the progeny; “ab x ab” is used for markers whereparents were both heterozygous with the same twoalleles and the segregation ratio of 1:2:1.
Single-locus analysis, grouping of markers andmapping were performed with JoinMap version 2.011,which permits linkage analysis in outbred progenies
Fig 1. Segregation patterns of a Penaeus monodon family amplified by DPm302 SSLP marker. The arrows indicated alleles fromparents (sample no. 82 and 83) segregated into progenies (sample no. 1-81; except 31,47, 65, 66, 69).
Table 2. Summary of the segregation patterns applied for mapping analysis.
Parent Parent Parent Parent Parent ProgenyProgenyProgenyProgenyProgeny No. of lociNo. of lociNo. of lociNo. of lociNo. of loci Band Band Band Band Band genotypegenotypegenotypegenotypegenotype Observed bandObserved bandObserved bandObserved bandObserved band GenotypeGenotypeGenotypeGenotypeGenotype SegregationSegregationSegregationSegregationSegregation
DamDamDamDamDam SireSireSireSireSire
aa x oo a, o 1 : 1 4
oo x aa a, o 1 : 1 3
ab x oo a, b 1 : 1 2
ao x bo ab, a, b , o 1 : 1 : 1: 1 5
ab x cd ac, ad, bc, bd 1 : 1 : 1 : 1 38

Group1DPm10DPm143.5DPm130.0DPm120.0DPm130.0DPm150.0
DPm31
26.0
Group2DPm10DPm11
0.0Group3
DPm11DPm12
0.7
DPm140.0
DPm141.5
DPm119.1
Group4DPm11DPm134.1
DPm14
24.7
Group5
DPm11DPm14
5.3
Group6
DPm11
DPm11
13.8
Group7
DPm12
Tag46.2
Group8
DPm13DPm1322.8DPm1320.0
Group9
DPm205
DPm115.9
involving markers with different segregation types.Goodness of fit of observed-to-expected allelic ratioswas analyzed using the c2-test. Markers were definedas polymorphic alleles if they did not significantly departfrom Mendelian ratios at the a = 0.01 level. Alleles withsignificant segregation distortion were discarded priorto the linkage analyzes. Data were then analyzed byusing the “cross pollination” (“CP”) population-typeoption according to the JoinMap program’s instructions.Map distances expressed in centiMorgans (cM) werecalculated by the Kosambi function.12
RESULTS
Marker segregationMarker segregationMarker segregationMarker segregationMarker segregationOf a total of 59 marker loci genotyped, 52 loci
(88.1%) were clearly scorable whereas 7 (11.9%) failedto give any segregation banding patterns. Among thescorable loci, 9 markers followed 1:1 segregation ratiosand 43 markers 1:1:1:1 ratios (Fig. 1, Table 2). From 9loci with 1:1 segregation ratio, alleles of each 7 SSLPswere scored and analyzed separately. Because null alleleswere found, an additional designation of a, b, c or d wasgiven to the markers (e.g. DPm132a, DPm132b). Forthe EST and SCAR markers, only one allele was foundin each locus, the dam allele for Pmpsb and sire allelefor Tag4.
Single-locus analysisSingle-locus analysisSingle-locus analysisSingle-locus analysisSingle-locus analysisSegregation ratios that departed from the Mendelian
expectation of 1:1:1:1 for two heterozygous alleles in
each parent and 1:1 for an individual allele scored aspresence/absence at α = 0.01 were detected in 2 markerloci (DPm113 and DPm208). Only markers that passedthe single-locus segregation test were initially used inthe linkage analysis.
Map constructionMap constructionMap constructionMap constructionMap constructionFor initial grouping of markers, the LOD score was
set up between 3.0 and 8.0 with steps of 0.5. At thelower LOD scores, especially below 4.0, occasionalspurious linkages resulted in the agglomeration of somelinkage groups, while increasing LOD scores beyond5.0 resulted in consistency of the major linkage groups.
Two-point linkage analysis using the LOD score of5.0 resulted in 9 linkage groups (Fig. 2). All linkagegroups combined markers heterozygous in the parents.Of 50, 27 marker loci were mapped with a total genomelength of 103.6 cM. The maximum number of markersin a linkage group was seven in the group 1. There werecases of zero recombination between markers, (e.g.DPm107 and DPm115 in linkage group 2).
DISCUSSION
In order to investigate gene locations in the genomeof shrimp, the first genetic linkage map of P. monodonwas constructed using AFLP markers.8 However, the P.monodon genome is presumably complicated and itssize has been physically estimated to be about 70% thatof the human genome.13 These results imply that thegenome mapping of this species requires more DNA
Fig 2. Linkage relationship of 27 SSLP markers in 9 linkage groups of Penaeus monodon.
ScienceAsia ScienceAsia ScienceAsia ScienceAsia ScienceAsia 31 (2005)31 (2005)31 (2005)31 (2005)31 (2005) 95
96 ScienceAsia ScienceAsia ScienceAsia ScienceAsia ScienceAsia 31 (2005)31 (2005)31 (2005)31 (2005)31 (2005)
markers in order to identify genes of interests. Thelinkage map for P. monodon that was generated in thisstudy could be considered as the first linkage mapconstructed with a large number of SSLP markers.
An F1 population obtained by crossing two highlyheterozygous parents, characterized for their differentreproductive behavior, was studied assuming that anon inbred population would not only provide aneffective strategy for limiting segregation distortion,but also give better estimates of linkage distances.14 Toa certain degree, this depends on the size of a populationunder study and it is only true if a large population isused. In fact, 96% of marker loci (50 out of 52)segregated according to a Mendelian ratio of 1:1 or1:1:1:1 and only 3.9% (2 out of 52) exhibited segregationdistortion (for P<0.01). Interestingly, there was quite ahigh number of SSLP loci (12/50) that had null allelesor nonamplifying alleles. In theory, null alleles arecommon and the flanking sequences for priming sitesare possibly polymorphic. However, null alleles couldbe revealed either by lowering priming stringency (toaccommodate sequence mismatches) or redesigningprimers (to avoid polymorphic sites).15
In this study, we used a full-sib family derived fromheterozygous parents and highly polymorphic markers,SSLPs (up to four marker alleles). However, this datacan be analyzed based on the analysis of Wu et al.10 Wesymbolized alleles by a, b, c, and d, when they were co-dominant with respect to the others but dominant tothe null allele, symbolized by o. Simple sequencerepeats, such as microsatellites, consisting of tandemlyrepeated multiple copies of mono-, di-, tri-, ortetranucleotide motifs, provide an ideal tool tocharacterize polymorphic variation in outcrossingpopulations.16 To increase the resolution of genomecharacterization for a given outcrossing species, thesehighly polymorphic microsatellites should be combinedwith EST markers and other dominant markers toconstruct a single consensus map.17,18
In our study, the number of marker loci used wasrelatively low. A total of 59, instead of 102 loci developedfrom Wuthisuthimethavee et al.9, were used toinvestigate whether SSLP markers can be mapped witha full-sib family of two- generation information. Resultshave demonstrated that 9 linkage groups wereconstructed with the total genetic distance of 103.6 cM(Fig. 2). The average space between two markers wasapproximately 3.8 cM. The size of linkage groups rangedfrom 0 to 29.5 cM, with an average of 3 SSLP loci perlinkage group. There were 10 loci mapped at the sameposition (with zero recombination, see group 1). Infact, all markers were verified to be different clones.This event is usually observed in maps with a smallnumber of marker loci or small population sizes.However a cluster of markers may indicate lack of
recombination in the region of the chromosome inwhich they are found. Furthermore, linkage group 8showed 2 linked marker loci consisting of DPm138and DPm132 with allelic complement of the DPm132locus (DPm132a and DPm132b) that eventually wasmapped at the same location. There were 23 (46%)unlinked marker loci in this study. The high proportionof markers that were unlinked suggests the number ofmarker loci used.
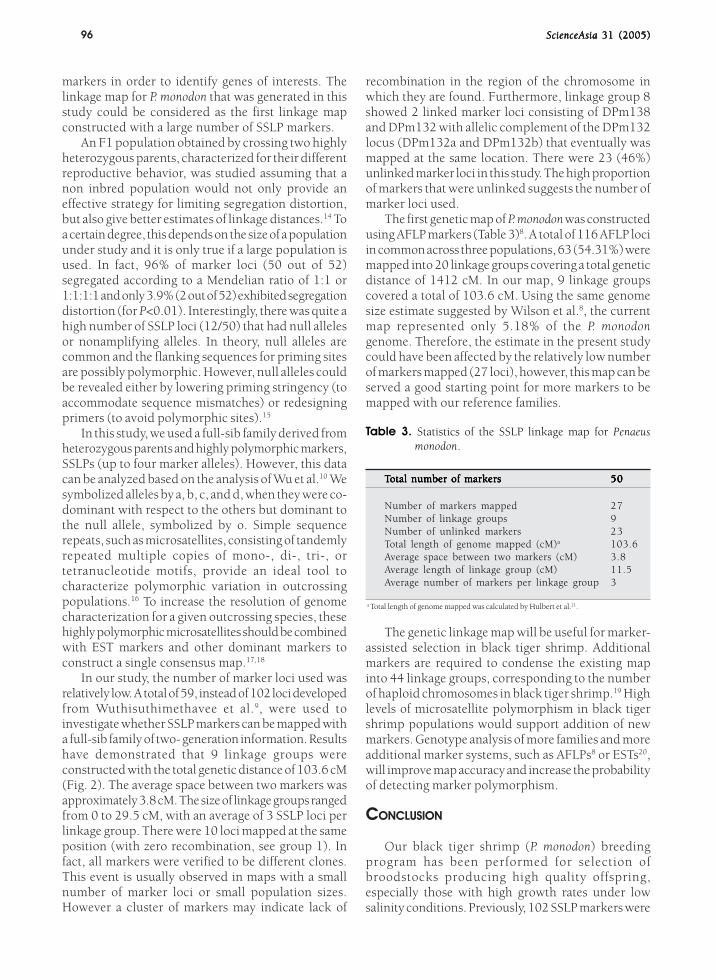
The first genetic map of P. monodon was constructedusing AFLP markers (Table 3)8. A total of 116 AFLP lociin common across three populations, 63 (54.31%) weremapped into 20 linkage groups covering a total geneticdistance of 1412 cM. In our map, 9 linkage groupscovered a total of 103.6 cM. Using the same genomesize estimate suggested by Wilson et al.8, the currentmap represented only 5.18% of the P. monodongenome. Therefore, the estimate in the present studycould have been affected by the relatively low numberof markers mapped (27 loci), however, this map can beserved a good starting point for more markers to bemapped with our reference families.
Table 3. Statistics of the SSLP linkage map for Penaeusmonodon.
TTTTTotal number of markersotal number of markersotal number of markersotal number of markersotal number of markers 5050505050
Number of markers mapped 27Number of linkage groups 9Number of unlinked markers 23Total length of genome mapped (cM)a 103.6Average space between two markers (cM) 3.8Average length of linkage group (cM) 11.5Average number of markers per linkage group 3
a Total length of genome mapped was calculated by Hulbert et al.21.
The genetic linkage map will be useful for marker-assisted selection in black tiger shrimp. Additionalmarkers are required to condense the existing mapinto 44 linkage groups, corresponding to the numberof haploid chromosomes in black tiger shrimp.19 Highlevels of microsatellite polymorphism in black tigershrimp populations would support addition of newmarkers. Genotype analysis of more families and moreadditional marker systems, such as AFLPs8 or ESTs20,will improve map accuracy and increase the probabilityof detecting marker polymorphism.
CONCLUSION
Our black tiger shrimp (P. monodon) breedingprogram has been performed for selection ofbroodstocks producing high quality offspring,especially those with high growth rates under lowsalinity conditions. Previously, 102 SSLP markers were

ScienceAsia ScienceAsia ScienceAsia ScienceAsia ScienceAsia 31 (2005)31 (2005)31 (2005)31 (2005)31 (2005) 97
developed for family genotyping. In this study, weinitiated constructing a genetic linkage map for P.monodon using 57 SSLP, 1 STS, 1 SCAR markers and 76individuals of a F1 inter-cross family. Segregating markerdata was scored and analyzed with the JoinMap 2.0program. A total of 50 marker loci confirmed to followMendelian segregation ratios (c2-test at the a = 0.01level) were grouped with a LOD score of 5.0. Theresults showed 9 linkage groups with 27 loci and 23unlinked loci. This linkage map covered a total geneticdistance of 103.6 cM. This genetic linkage map servesa good starting point for mapping more markers on theP. monodon genome with our reference families.
ACKNOWLEDGMENTS
This work was funding supported by the NationalResearch Council of Thailand. We would like toacknowledge the Golden Jubilee PhD program for thepartial research support to S.W. We would like to thankMs. Kaewalee Viboonkij for her assistance in samplecollection and Ms. Kantiporn Pungnapakaew for herassistance in DNA preparation, PCR and gelelectrophoresis.
REFERENCES
1. Wolfus GM, Garcia DK and Alcivar-Warren A (1997)Application of microsatellite technique for analysing geneticdiversity in shrimp breeding programs. Aquaculture 152152152152152,35-47.
2. Tassanakajon A, Tiptawonnukul A, Supunkul P,Rimphanitchayakit V, Cook D, Jarayabhand P, Klinbunga Sand Boonsaeng V (1998) Isolation and characterization ofmicrosatellite markers in the black tiger prawn Penaeusmonodon. Mol. Mar. Biol. Biotechnol. 77777, 55-61.
3. Moore SS, Whan V, Davis GP, Byrne K, Hetzel DJS and PrestonN (1999)
The development and application of genetic markers for theKuruma prawn Penaeus japonicus. Aquaculture 173173173173173, 19-32.
4. Xu Z, Dhar AK, Wyrzykowski J and Alcivar-Warren A (1999)Identification of abundant and informative microsatellitesfrom shrimp (Penaeus monodon). Anim. Genet. 3030303030, 150-6.
5. Bierne N, Beuzart I, Vonau V, Bonhomme F, Bedier E andAQUACOP (2000) Microsatellite-associated heterosis inhatchery-propagated stocks of the shrimp Penaeus stylirostris.Aquaculture 184184184184184, 203-19.
6. Pongsomboon S, Whan V, Moore SS and Tassanakajorn A(2000) Characterization of tri- and tetranucleotidemicrosatellites in the black tiger prawn, Penaeus monodon.ScienceAsia 2626262626, 1-8.
7. Lin J-Z and Ritland K (1996) Construction of a genetic mapin the wild plant Mimulus using RAPD and isozyme markers.Genome 3939393939, 63–70.
8. Wilson K, Li Y, Whan V, Lehnert S, Byrne K, Moore SS,Pongsomboon S and Tassanakajon A, et al (2002) Geneticmapping of the black tiger shrimp Penaeus monodon withamplified fragment length polymorphism. Aquaculture 204204204204204,297-309.
9. Wuthisuthimethavee S, Lumobol P, Vanavichit A and
Tragoonrung S (2003) Development of microsatellite markersin the black tiger shrimp (Penaeus monodon Fabricius).Aquaculture 224224224224224, 39-50.
10. Wu R, Ma C-X, Painter I and Zeng Z-B (2002) Simultaneousmaximum likelihood estimation of linkage and linkage phasesin outcrossing species. Theor. Popul. Biol. 6161616161, 349-63.
11. Stam P, V. Ooijen JW (1995) JoinMapTM version 2.0: softwarefor the calculation of genetic linkage maps. CPRO-DLO,Wageningen.
12. Kosambi DD (1944) The estimation of map distance fromrecombination values. Ann Eugen 1212121212,172–5.
13. Chow S, Dougherty WJ and Sanfer PA (1990) Meitoticchromosome complements and nuclear DNA contents offour species of shrimps of the genus Penaeus. J. CrustaceanBiol. 1010101010, 29-36.
14. Tavoletti S, Bingham ET, Yandell BS, Veronesi F and OsbornTC (1996) Halt tetrad analysis in alfalfa using multiplerestriction fragment length polymorphism markers. Proc.Natl. Acad. Sci. USA. 9393939393, 10918-22.
15. Pemberton JM, Slate J, Bancroft DR and Barrett JA (1995)Nonamplifying alleles at microsatellite loci: a caution forparentage and population studies. Mol. Ecol. 44444, 249-52.
16. Olson M, Hood L, Cantor C and Botstein D (1989) Acommon language for physical mapping of the humangenome, Science 245245245245245, 1434–5.
17. Barreneche T, Bodenes C, Lexer C, Trontin JF, Fluch S, StreiffR, Plomion C and Roussel G, et al (1998) A genetic linkagemap of Quercus robur L. (pedunculate oak) based on RAPD,SCAR, microsatellite, minisatellite, isozyme and 5S rDNAmarkers. Theor. Appl. Genet. 9797979797, 1090–103.
18. Paglia GP, Olivieri AM and Morgante M (1998) Towardssecond-generation STS (sequence-tagged sites) linkage mapsin conifers: A genetic map of Norway spruce (Picea abies K.).Mol. Gen. Genet. 258258258258258, 466–78.
19. Xiang J-H, Liu R-Y and Zhou L-H (1993) Chromosomes ofmarine shrimps with special reference to different techniques.Aquaculture 111111111111111, 321.
20. Tong J, Lehnert SA, Byrne K, Kwan HS and Chu KH (2002)Development of polymorphic EST markers in Penaeusmonodon: applications in penaeid genetics. Aquaculture208208208208208, 69-79.
21. Hulbert SH, Ilott TW, Legg EJ, Lincoln SE, Lander ES andMichelmore RW (1988) Genetic analysis of the fungus, Bremislactucae, using restriction fragment length polymorphisms.Genetics 120120120120120, 947-58.