Embed Size (px)
Citation preview
1
SSR markers linked to kernel weight and tiller number in sorghum
identified by association mapping
Hari D. Upadhyaya, Yi-Hong Wang, Shivali Sharma, Sube Singh and Karl H. Hasenstein
H. D. Upadhyaya, S. Sharma, S. Singh
Gene Bank, International Crops Research Institutefor the Semi Arid Tropics (ICRISAT),
Patancheru 502 324, Andhra Pradesh, India
Y.-H. Wang (&) K. H. Hasenstein
Department of Biology, University of Louisiana at Lafayette, Lafayette, LA 70504, USA
e-mail: [email protected]
Euphytica, Online First™, 5 June 2012
DOI: http://dx.doi.org/10.1007/s10681-012-0726-9 This is author version post print archived in the official Institutional Repository of ICRISAT
www.icrisat.org
SSR markers linked to kernel weight and tiller number in sorghum identified by association
mapping
Hari D Upadhyaya†1, Yi-Hong Wang†*
2, Shivali Sharma
1, Sube Singh
1, Karl H Hasenstein
2
† Contribute equally to this work
1
Gene Bank, International Crops Research Institute for the Semi Arid Tropics (ICRISAT),
Patancheru 502 324, Andhra Pradesh, India.
2 Department of Biology, University of Louisiana at Lafayette, Lafayette, LA 70504, USA.
* Corresponding author: [email protected]. Fax: 1 337 482-5395

2
3
Abstract
Sorghum is an energy crop with high biomass production potential and low input requirement.
To identify markers linked to grain and biomass production traits, 43 SSR markers were mapped
for association with tiller number and kernel weight using the sorghum mini core of 242
landraces. While kernel weight was evaluated in two environments, tiller number was evaluated
in four environments. The number of SSR alleles was positively correlated with polymorphism
information content (PIC) for the markers. Association mapping found one marker (4-162)
linked to kernel weight and two (40-1896 and 81-108) to tiller numbers. 4-162 and 40-1896 co-
localized with previously mapped quantitative trait loci. Localized association mapping around
81-108 identified an amino-cyclopropane-carboxylate (ACC) oxidase gene as a candidate for
tiller number. ACC oxidase is an ethylene forming enzyme and increased ethylene level has been
shown to increase the number of tillers in the grass family. The results provide the groundwork
to identify genes regulating kernel weight and tiller number in sorghum in the future.
Key words: sorghum breeding, association mapping, SSR marker, tiller number, kernel weight,
linkage disequilibrium
4
Introduction
Sorghum (Sorghum bicolor (L.) Moench) is a versatile crop in terms of biofuel production: it
produces starch in its grains, free sugars in its stalks, and cellulose/hemicelluoses in its
stalks/leaves, all of which can be converted to biofuels (Rooney et al. 2007). The plant is also
efficient in water use and is known to tolerate extreme drought through various features. These
include a dense and deep root system, ability to reduce transpiration through leaf rolling and
stomatal closure under drought, using waxy leaves to prevent water loss, and ability to reduce
metabolic processes to near dormancy under extreme drought (Martin et al. 2004). It is also
closely related to other C4 high biomass producers such as sugarcane and maize, sharing a
significant amount of sequence homology (Paterson et al. 2009). All these characteristics make
sorghum an attractive model for bioenergy research. Currently, sorghum is a cereal food crop for
millions of peoples in the developing world and is used as animal feed in developed countries
especially in the United States (Martin et al. 2004).
This study focused on identifying markers linked to kernel weight and the number of
basal tillers using the ICRISAT sorghum mini core collection (Upadhyaya et al. 2009). Kernel
weight and size can affect germination and seedling establishment. Large-seeded sorghum
varieties may produce higher yield through enhanced germination, establishment, seedling
growth and vigor, and stress tolerance (Swanson and Hunter 1936; Maranville and Clegg 1977;
Amthor 1983). Kernel weight is also highly correlated with height, i.e., larger seeds lead to taller
plants which in turn produce more biomass. Correlation between height and kernel weight was
0.66 in a study of 415 sorghum varieties (Ayana and Bekele 2000) and 0.56 when 150 varieties
were analyzed (Elangovan et al. 2007). The correlation is also significant in three RIL mapping
population as well, with coefficient of 0.44 and 0.627 (Brown et al. 2008; Rami et al.1998). Not
surprisingly, kernel weight is also correlated with panicle yield (Tesso et al. 2011; Upadhyaya et
5
al. 2009) or grain yield (Murray et al. 2008b; Rami et al. 1998) and more seeds per panicle
(Rami et al. 1998). The number of tillers in sorghum is also related to biomass production. More
tillers means thinner stems but higher total biomass yield (Murray et al. 2008b) which could
mean more juice (Shiringani et al. 2010) although smaller seeds and lower grain yield
(Upadhyaya et al. 2009). Correlations of tiller number with height and time to maturity were also
highly significant (Murray et al. 2008b).
Tillering in sorghum is one of the most plastic traits affecting affecting biomass
accumulation. Therefore, tillering was reported by Murray et al. (2008b) to have lower
heritability (0.54) than kernel weight (0.79). Other recent published heritability values for
sorghum kernel weight range from 0.76 (Rami et al. 1998) and 0.85 (Brown et al. 2006) to 0.865
(Srinivas et al. 2009), which are as high or higher than those for highly heritable plant height
(0.82) and time to maturity (0.758), but marginally lower than that for time to anthesis (0.88)
(Srinivas et al. 2009). These data suggest kernel weight is strongly influenced by major genes.
Genetic studies of kernel weight and basal tiller number have not been as extensive as
those of flowering time and plant height in sorghum. Published studies indicate that even these
traits are largely controlled by a few major QTLs, although the small sizes of mapping
populations used to date do not permit detection of QTLs of small effect. For example, Hart et al.
(2001) identified three QTLs for the number of basal tillers with heads; Murray et al. (2008b)
found two QTLs and Shiringani et al. (2010) mapped six for tiller numbers. Similarly, major
QTLs also control kernel weight. Feltus et al. (2006) mapped three kernel weight QTLs using the
(BTx623/IS3620C)-derived RIL population (Burow et al. 2011), on SBI-04, SBI-06 and SBI-10,
and seven using the (BTx623/Sorghum propinquum)-derived RIL population (Paterson et al.
1995b), on SBI-01, SBI-02, SBI-03, SBI-04, SBI-06, SBI-07, and SBI-08. Two of these kernel
6
weight QTLs were common across the two mapping populations. Three sorghum kernel weight
QTLs were mapped by Rami et al. (1998) to SBI-01, SBI-03, and SBI-07; by Brown et al. (2006)
to SBI-04, SBI-08, and SBI-09; by Srinivas et al. (2009) to SBI-01, SBI-04, and SBI-06; and by
Pereira et al. (1995) to SBI-01, SBI-09, and SBI-010; while Paterson et al. (1995a) and Pereira et
al. (1995) each mapped six QTLs for this trait and Murray et al. (2008a) found seven such QTLs
mapped to SBI-01, SBI-06 (3), SBI-08 (2), and SBI-09. Of the ten sorghum kernel weight QTLs
reported by Feltus et al. (2006), three explained 35% of its additive genetic variance among the
(BTx623/IS3620C)-derived RILs, and seven explained 49% of its additive genetic variance in
the (BTx623/S. propinquum)-based mapping population).
The sorghum mini core collection was developed at Patancheru, India by the
International Crops Research Institute for the Semi-Arid Tropics (ICRISAT). ICRISAT
assembled a collection of 22,473 sorghum landrace accessions which are representative of
traditional cultivated sorghum varieties globally. Based mainly on maturity and height, a core
collection of 2,247 landraces was selected from the collection (Grenier et al. 2001a). From the
core collection, 242 sorghum landraces were selected based on 11 qualitative and 10 quantitative
traits (Upadhyaya et al. 2009). Both core and mini core collections represent the original
collection in all phenotypic traits measured (Grenier et al. 2001b; Upadhyaya et al. 2009). Using
the mini core, we have previously identified markers linked to height/maturity by screening
height/maturity DNA pools (Wang et al. 2012). The purpose of this study was to test the
association of these SSR markers with kernel weight and tiller number since these traits were
correlated with height/maturity. For tightly linked markers additional SSRs were used to identify
candidate genes.
7
Materials and methods
Plant material and field evaluation
Two hundred forty two mini core accessions plus three control varieties were grown on Vertisol
soils at Patancheru, India (17°53' N and 78.27° E) for five seasons. Field evaluations for tiller
number were made from 2008 to 2010 in both the rainy (2008R, 2009R, and 2010R) and the
post-rainy (2009PR) seasons and kernel weight in the 2010 post-rainy season (2010PR) (the
2005PR data were from Upadhyaya et al. (2009). The rainy season was during long days (June–
September) while the post-rainy season was during short days (September–April). The
experiment was sown in an alpha design with two replications except 2010R when three
replications were used. Each plot was single-row, 4 m long, with a row-to-row spacing of 75 cm,
and plant-to-plant spacing within a row of 10 cm. Ammonium phosphate was applied at the rate
of 150 kg/ha as a basal dose, and 100 kg/ha of urea was applied as top dressing after 3 wk of
planting. Two to three irrigations in the rainy and five in post-rainy seasons (each with 7 m
water) were provided to support the crop. For the post-rainy season environments, five
irrigations (each with 7 cm water) were provided at equal intervals until grain maturity. All
accessions germinated well and produced panicles. Number of basal tillers was measured on ten
plants in the field in all environments. After harvest, 100-kernel weight (g; kernel weight) were
measured for 2010PR.
DNA isolation and marker genotyping
8
Leaves from one plant for each field-grown accession were harvested and dried at room
temperature. Total genomic DNA was isolated as described by Wang et al. (2011) based on
Klein et al. (2000) and Williams and Ronald (1994) with modifications. Dried leaves were cut
into small pieces (about 2 mm2) and filled into a 1.5 ml microcentrifuge tube followed by adding
1.4 ml extraction buffer containing 100 mM Tris pH 8.0, 10 mM EDTA pH 8.0, 700 mM NaCl,
and 12.5 mM potassium ethyl xanthogenate (PEX). Samples were incubated at 65°C for 30 min
with occasional mixing in a dry heat block before centrifugation at 15000 g for 5 min. After
centrifugation, 700 µl of supernatant was transferred to a new 1.5 ml tube containing 700 µl of
isopropanol and 70 µl of 3 M sodium acetate pH 5.2, mixed and centrifuged again at 15000 g for
5 min. The precipitated DNA was washed twice with 70% ethanol, air dried and resuspended in
70 µl water containing 100 ng RNase A for at least 30 min at room temperature. The samples
were centrifuged again at 15000 g for 5 min to remove impurities. The supernatant containing
DNA was transferred to a new tube and quantified using a NanoDrop 2000 (Thermo Scientific,
Waltham, MA). DNA concentration was adjusted to 40 ng/µl for all PCR reactions.
PCR was performed in a 5 μl reaction volume that contained 2.5 μl 2x 360 AmpliTaq
Master Mix from Applied Biosystems (ABI, Carlsbad, CA), 10 ng each of the two primers and
40 ng of template DNA. Thermocycling was initiated with 95°C/5 min followed by 30 cycles of
95°C/20 s, 56°C/20 s, 72°C/1 min and final extension of 72°C/7 min in either an ABI 2720 or
Veriti® thermocycler. The PCR samples were electrophoresized in a LabChip Microfluidic Gel
Electrophoresis System (LabChip 90) from Caliper Life Sciences (Hopkinton, MA) with 1 K HT
DNA Assay Kit according to the manufacturer’s protocol. Total PCR reaction volume was
adjusted to 15 μl with sterile water for all samples before loading into LabChip 90. The default
setting for LabChip 90 was used, except that the sipper height was adjusted to 1 mm. PCR
product size and virtual gel image were generated automatically using LabChip GX 2.3 software
9
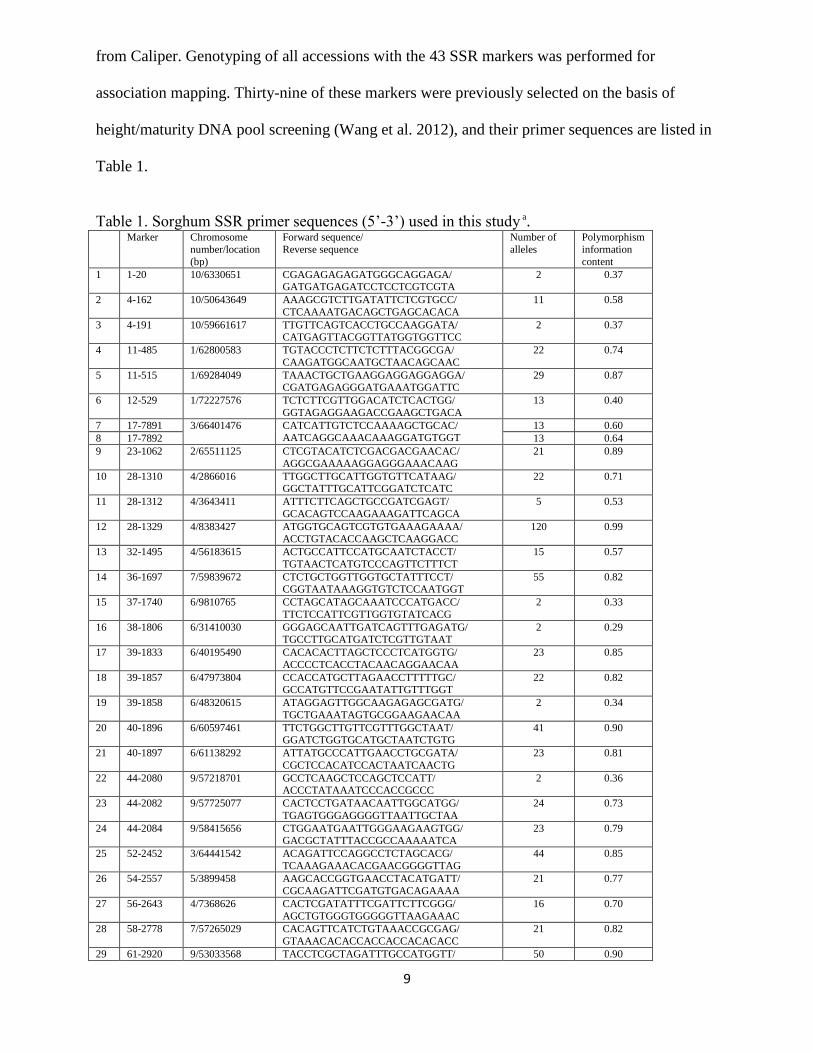
from Caliper. Genotyping of all accessions with the 43 SSR markers was performed for
association mapping. Thirty-nine of these markers were previously selected on the basis of
height/maturity DNA pool screening (Wang et al. 2012), and their primer sequences are listed in
Table 1.
Table 1. Sorghum SSR primer sequences (5’-3’) used in this study a. Marker Chromosome
number/location
(bp)
Forward sequence/
Reverse sequence
Number of
alleles
Polymorphism
information
content
1 1-20 10/6330651 CGAGAGAGAGATGGGCAGGAGA/ GATGATGAGATCCTCCTCGTCGTA
2 0.37
2 4-162 10/50643649 AAAGCGTCTTGATATTCTCGTGCC/
CTCAAAATGACAGCTGAGCACACA
11 0.58
3 4-191 10/59661617 TTGTTCAGTCACCTGCCAAGGATA/ CATGAGTTACGGTTATGGTGGTTCC
2 0.37
4 11-485 1/62800583 TGTACCCTCTTCTCTTTACGGCGA/
CAAGATGGCAATGCTAACAGCAAC
22 0.74
5 11-515 1/69284049 TAAACTGCTGAAGGAGGAGGAGGA/ CGATGAGAGGGATGAAATGGATTC
29 0.87
6 12-529 1/72227576 TCTCTTCGTTGGACATCTCACTGG/
GGTAGAGGAAGACCGAAGCTGACA
13 0.40
7 17-7891 3/66401476 CATCATTGTCTCCAAAAGCTGCAC/ AATCAGGCAAACAAAGGATGTGGT
13 0.60
8 17-7892 13 0.64
9 23-1062 2/65511125 CTCGTACATCTCGACGACGAACAC/
AGGCGAAAAAGGAGGGAAACAAG
21 0.89
10 28-1310 4/2866016 TTGGCTTGCATTGGTGTTCATAAG/ GGCTATTTGCATTCGGATCTCATC
22 0.71
11 28-1312 4/3643411 ATTTCTTCAGCTGCCGATCGAGT/
GCACAGTCCAAGAAAGATTCAGCA
5 0.53
12 28-1329 4/8383427 ATGGTGCAGTCGTGTGAAAGAAAA/
ACCTGTACACCAAGCTCAAGGACC
120 0.99
13 32-1495 4/56183615 ACTGCCATTCCATGCAATCTACCT/
TGTAACTCATGTCCCAGTTCTTTCT
15 0.57
14 36-1697 7/59839672 CTCTGCTGGTTGGTGCTATTTCCT/ CGGTAATAAAGGTGTCTCCAATGGT
55 0.82
15 37-1740 6/9810765 CCTAGCATAGCAAATCCCATGACC/
TTCTCCATTCGTTGGTGTATCACG
2 0.33
16 38-1806 6/31410030 GGGAGCAATTGATCAGTTTGAGATG/ TGCCTTGCATGATCTCGTTGTAAT
2 0.29
17 39-1833 6/40195490 CACACACTTAGCTCCCTCATGGTG/
ACCCCTCACCTACAACAGGAACAA
23 0.85
18 39-1857 6/47973804 CCACCATGCTTAGAACCTTTTTGC/ GCCATGTTCCGAATATTGTTTGGT
22 0.82
19 39-1858 6/48320615 ATAGGAGTTGGCAAGAGAGCGATG/
TGCTGAAATAGTGCGGAAGAACAA
2 0.34
20 40-1896 6/60597461 TTCTGGCTTGTTCGTTTGGCTAAT/ GGATCTGGTGCATGCTAATCTGTG
41 0.90
21 40-1897 6/61138292 ATTATGCCCATTGAACCTGCGATA/
CGCTCCACATCCACTAATCAACTG
23 0.81
22 44-2080 9/57218701 GCCTCAAGCTCCAGCTCCATT/ ACCCTATAAATCCCACCGCCC
2 0.36
23 44-2082 9/57725077 CACTCCTGATAACAATTGGCATGG/
TGAGTGGGAGGGGTTAATTGCTAA
24 0.73
24 44-2084 9/58415656 CTGGAATGAATTGGGAAGAAGTGG/ GACGCTATTTACCGCCAAAAATCA
23 0.79
25 52-2452 3/64441542 ACAGATTCCAGGCCTCTAGCACG/
TCAAAGAAACACGAACGGGGTTAG
44 0.85
26 54-2557 5/3899458 AAGCACCGGTGAACCTACATGATT/
CGCAAGATTCGATGTGACAGAAAA
21 0.77
27 56-2643 4/7368626 CACTCGATATTTCGATTCTTCGGG/
AGCTGTGGGTGGGGGTTAAGAAAC
16 0.70
28 58-2778 7/57265029 CACAGTTCATCTGTAAACCGCGAG/
GTAAACACACCACCACCACACACC
21 0.82
29 61-2920 9/53033568 TACCTCGCTAGATTTGCCATGGTT/ 50 0.90
10
GGAAATGACTTGGTTACAGGCTGG
30 66-140 1/48232114 CTGCTTAATGAAATACGCACCTCG/
CTGGGCATTAGGTTTTGGTTCTCA
2 0.27
31 67-167 1/65629929 TGCGTTACTACGAGATATCAGGATGA/
ATGTCAGCTTTGAGGTTTGTGCAT
32 0.87
32 69-273 3/73689614 GCGTTGTCATCGTTGCTCACTAAG/
CTACGGCGACAAATTAAGGAGGTG
56 0.76
33 73-446 4/10330872 CCCCCGAGTCACCGTAGATACATA/
ACCGTAGCAGCAGCAGGTTTACAG
27 0.91
34 74-504 4/60332982 GCCCTATTCTTCAATCCATGCAAC/
ACTCAGGACCGCGAAATACTGAAA
2 0.31
35 74-506 4/62174477 TTGAGACTGCGATATGGAGAGCTG/
AAGCCTCACAACTGAGGGGAAAAT
27 0.88
36 74-508a 4/63798505 TTTCGCTACCCGGTGAGTTTACTT/
GTCTCTTTGGATCCCAGCTACCCT
2 0.37
37 74-508b 2 0.37
38 74-508c 5 0.24
39 80-799 3/7254839 TCTCCCTCTCCCTCAATCCCTATC/ TTAGGAGGGCTTTAAGCACCACAG
16 0.62
40 81-108 10/50657108 CGGAGGTTGTGGTTTGCACTAGAT/
AAGGGCCATCACATCACAGGTAGT
30 0.25
Additional SSR primers for localizing candidate genes
41 M648 10/50592648 CCTATAGCTCCCATGTCTGCCATC/ CCGATCCATAGCTCAGACTGCTTT
23 0.91
42 M716 10/50650716 CATTCGCTGCAGGTTTTATCAGTG/
CGTACTTTATCCCTGCAAGATGCC
54 0.83
43 M817 10/50731817 CTGCGCAGTCTGACCTAGGATTTT/ CATGAGCCAAGTTCGTGAAACTGT
14 0.60
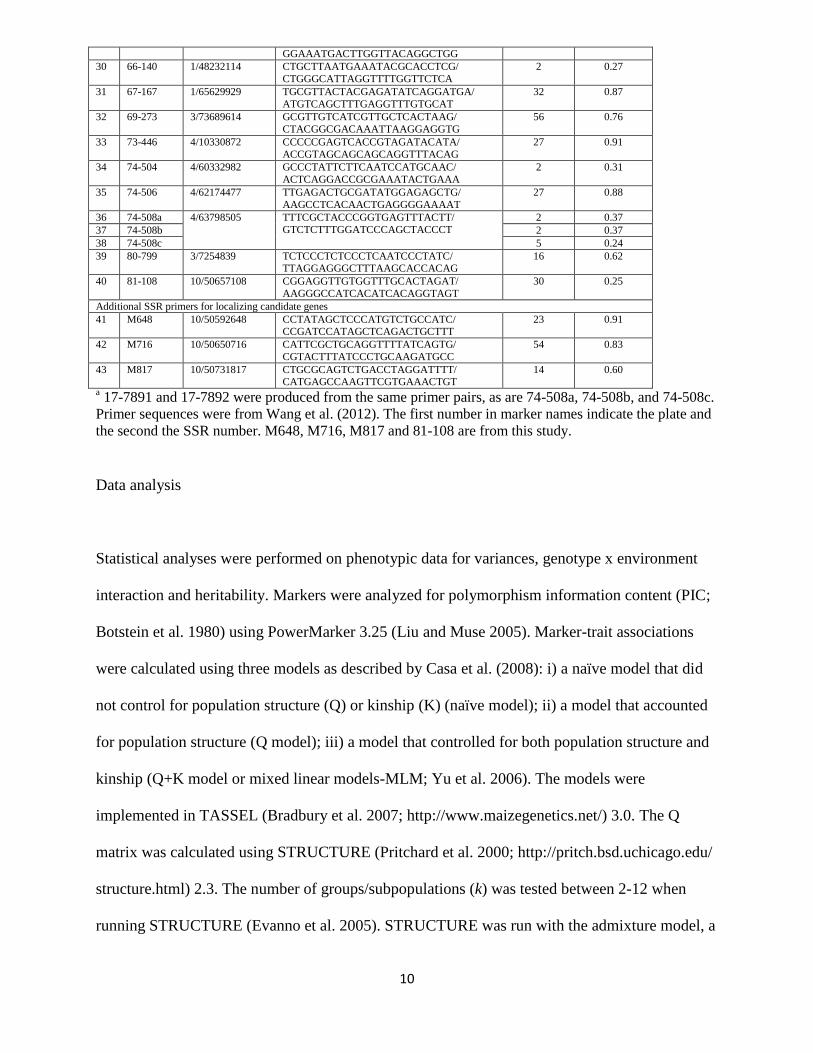
a 17-7891 and 17-7892 were produced from the same primer pairs, as are 74-508a, 74-508b, and 74-508c.
Primer sequences were from Wang et al. (2012). The first number in marker names indicate the plate and
the second the SSR number. M648, M716, M817 and 81-108 are from this study.
Data analysis
Statistical analyses were performed on phenotypic data for variances, genotype x environment
interaction and heritability. Markers were analyzed for polymorphism information content (PIC;
Botstein et al. 1980) using PowerMarker 3.25 (Liu and Muse 2005). Marker-trait associations
were calculated using three models as described by Casa et al. (2008): i) a naïve model that did
not control for population structure (Q) or kinship (K) (naïve model); ii) a model that accounted
for population structure (Q model); iii) a model that controlled for both population structure and
kinship (Q+K model or mixed linear models-MLM; Yu et al. 2006). The models were
implemented in TASSEL (Bradbury et al. 2007; http://www.maizegenetics.net/) 3.0. The Q
matrix was calculated using STRUCTURE (Pritchard et al. 2000; http://pritch.bsd.uchicago.edu/
structure.html) 2.3. The number of groups/subpopulations (k) was tested between 2-12 when
running STRUCTURE (Evanno et al. 2005). STRUCTURE was run with the admixture model, a
11
burn-in period of 10,000 and 10,000 Markov Chain Monte Carlo repetitions (Evanno et al.
2005), and the data from 29 unlinked SSR markers. The K matrix was generated in TASSEL for
MLM analysis in the Q+K model. MLM reduces Type I error in association mapping with
complex pedigrees, families, founding effects and population structure (Yu et al. 2006).
Significance of associations between markers and traits was based on the F-test with p values
calculated by TASSEL.
Marker localization
SSR markers associated with height or maturity were localized to the sorghum chromosomes
either in http://www.plantgdb.org/SbGDB/ or http://www.phytozome.net/sorghum. Markers
previously identified as linked to tiller number, panicle width, or kernel weight in sorghum were
localized to the genome based sequence information of relevant markers provided in Map
Viewer in the NCBI website (http://www.ncbi.nlm.nih.gov/mapview/). For pSB RFLP markers,
sorghum marker sequences available from Map Viewer were searched against the sorghum
genome presented in either http://www.plantgdb.org/SbGDB/ or
http://www.phytozome.net/sorghum to determine their physical locations. For RFLP markers
with sequence from other grasses, the sequence was used to search the sorghum nucleotide/EST
database in GenBank. Top-match sorghum sequence was then used to place that marker as
above. For SSR markers, if their position was not given in Map Viewer, their primer sequences
were then used to search the genome database in http://www.phytozome.net/sorghum for
physical localization. Alternatively, chromosome location of some markers was provided by
Ramu et al. (2010). Maps that also identified markers linked to the above traits but for which
sequencing information of these markers were not available in Map Viewer were not used in this
12
study. Maps used were those in Map Viewer from Chittenden et al. (1994), Boivin et al. (1999),
Peng et al. (1999), Bhattramakki et al. (2000), Kong et al. (2000), and Bowers et al. (2003).
Localization of some QTLs was based on Mace and Jordan (2011). Maps of chromosomes based
on the physical distances in Mb were were drawn using MapDraw 2.2 (Liu et al. 2003).
13
Results and discussion
Phenotypic analysis showed that there is a low level but significant genotype x environment
interaction as represented by σ2
ge for both till number and kernel weight, which were 0.02 and
0.15, respectively. However, it was not clear what environmental factors contributed to variation
especially in tiller number. Previous studies have shown that tiller number is most significantly
affected by stand density (Murray et al. 2008ab) which was not a variable in this study.
Heritability was 0.78 for tiller number and 0.89 for kernel weight. Marker analysis indicated that
the number of alleles ranged from 2-120 and was significantly correlated with PIC with a
correlation coefficient of 0.67 (Table 1).
Association with tiller number and kernel weight
To take into account the population structure of the sorghum mini core collection, and thereby
reduce the likelihood of detection of false-positive associations of the 43 SSR markers with the
traits under consideration in this study, the number of sub-populations (k) in this mini core was
first estimated by calculating the posterior probability (ln(P(D)) for all possible k values between
2 and 12 in the Q+K model. The "true" value of k was taken as that at which ln(P(D)) stopped
increasing and plateaued, as described by Casa et al. (2008). This k value was 4, and this
information was used by the TASSEL software to account for the population structure while
assessing the significance of marker-trait associations using the combined marker genotype and
phenotype data sets. This linkage disequilibrium mapping exercise identified two markers (40-
1896 and 81-108) associated with basal tiller number, and one marker (4-162) associated with
kernel weight, with p-values below 0.01. Results from the naïve and Q models were also
14
presented (Table 2). Controlling for population structure and kinship may reduce type 1 error
(Yu et al. 2006) but it also significantly reduced the strength of association (Table 2).
To better examine patterns of association across different environments, associations with
p-values between 0.05 and 0.01 were also shown. As discussed earlier, sorghum tiller number is
one of the most plastic traits that allow the plant to exploit its environment for maximum
biomass production. Because of this, phenotypic expression of tiller number varied from
environment to environment. Phenotypic variance as a measure of the tiller number variation was
0.04, 0.18, 0.13, and 0.02 for 2008R, 2009R, 2009PR, and 2010R, respectively. Consequently,
2009R and 2009PR are the better environments for association mapping of tiller number because
this trait was expressed more fully in those environments. One of the two tiller number markers,
40-1896, was associated with the trait most strongly in 2009R, followed by 2009PR and 2008R.
In this case, strength of the association was correlated with the variation of the trait. 81-108, on
the other hand, was strongly associated with tiller number, but only in 2009R. Its association
with the trait in other environment was not significant, suggesting that the association seemed to
require fuller expression of tiller number in the mini core (Table 2).
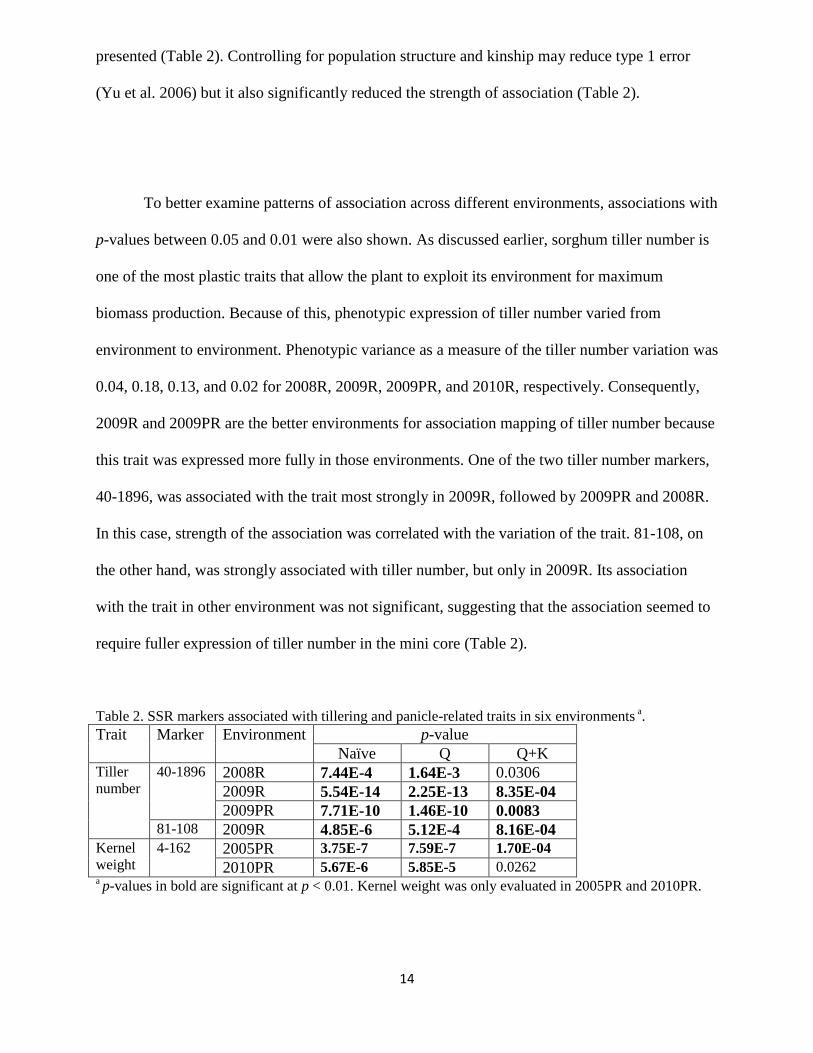
Table 2. SSR markers associated with tillering and panicle-related traits in six environments a.
Trait Marker Environment p-value
Naïve Q Q+K Tiller
number 40-1896 2008R 7.44E-4 1.64E-3 0.0306
2009R 5.54E-14 2.25E-13 8.35E-04
2009PR 7.71E-10 1.46E-10 0.0083 81-108 2009R 4.85E-6 5.12E-4 8.16E-04
Kernel
weight 4-162 2005PR 3.75E-7 7.59E-7 1.70E-04
2010PR 5.67E-6 5.85E-5 0.0262 a p-values in bold are significant at p < 0.01. Kernel weight was only evaluated in 2005PR and 2010PR.
15
Only one marker (4-162) was significantly associated with kernel weight. 4-162 was
most strongly associated with kernel weight in 2005PR. Its association with kernel weight was
not significant at p < 0.01 in 2010PR (Table 2). The reason that only one marker was associated
with kernel weight was probably because inadequate coverage of the genome by the markers
used in this study. Previous studies mapped the number of QTL controlling kernel weight at
three (Brown et al. 2006; Feltus et al. 2006; Rami et al. 1998; Pereira et al. 1995; Srinivas et al.
2009) or six (Paterson et al. 1995a; Pereira et al. 1995) and seven (Feltus et al. 2006; Murray et
al. 2008b).
Alleles in each marker that contributed the most to the traits were also identified using
TASSEL. For kernel weight, the alleles of 320 and 340 of 4-162 reduced the weight by
approximately 1 g each in 91 and 27 landraces, respectively in 2005R. For tiller number, the
absence of the 81-108 marker in 116 landraces reduced tiller number by 0.22 and the 299 allele
of 40-1896 increased tiller number in 13 landraces by 0.29 in 2009R.
Co-localization with previously mapped QTLs
To validate the association between markers identified in this study and those mapped in
previous studies, we physically localized our markers and previously mapped QTLs to the
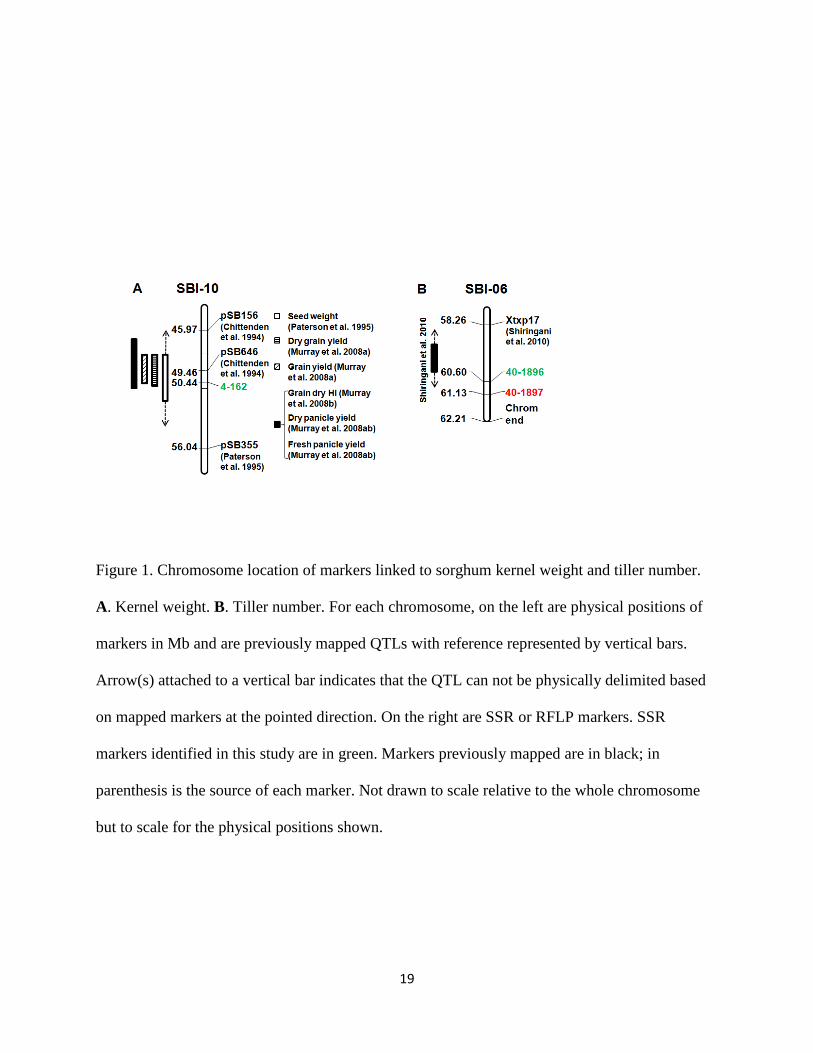
sorghum chromosomes. The results show that 4-162 co-localized with kernel weight QTL
mapped by Paterson et al. (1995a). This QTL was localized based on pSB428b close to the peak
of the QTL and pSB355 which defines one end of the QTL (Paterson et al. 1995a). While
pSB355 was located at 56.04 Mb, pSB428b could not be localized. But in Chittenden et al.’s
(1994) map, pSB428b was in the middle between pSB156 at 45.97 Mb and pSB646 at 49.46 Mb
16
(Fig. 1A). Furthermore, based on genetic and physical information by Mace and Jordan (2011),
4-162 also co-localized with QTLs for fresh/dry grain and panicle yield and dry grain harvest
index mapped by Murray et al. (2008ab) (Fig. 1A). The kernel weight QTL mapped by Feltus et
al. (2006), QKwt.txs-G, was flanked by Xcdo516.2 at 65.96 Mb and Xisu136.2 which could not
be physically placed. The marker that could be placed was Xcdo475 which was farther away
from QKwt.txs-G (Feltus et al. 2006) at 2.73 Mb on chromosome 10. Marker 81-108 was not
associated with kernel weight in either of the two environments in which this trait was observed
despite its close physical proximity to 4-162.
One tiller number marker, 40-1896, was clustered with a tiller number QTL mapped by
Shiringani et al. (2010). One end of the QTL was delimited by marker Xtxp17 at 58.26 Mb on
chromosome 6 which ends at 62.21 Mb. The position of the QTL, therefore, starts from 58.26
Mb and extends toward the chromosome end. The extension may be beyond 40-1896 although
there is no evidence for or against the scenario. But it may not extend beyond 40-1897 at 61.13
Mb because 40-1897 was not associated with tiller number in our analysis (data not shown) (Fig.
1B).
A candidate gene for tiller number
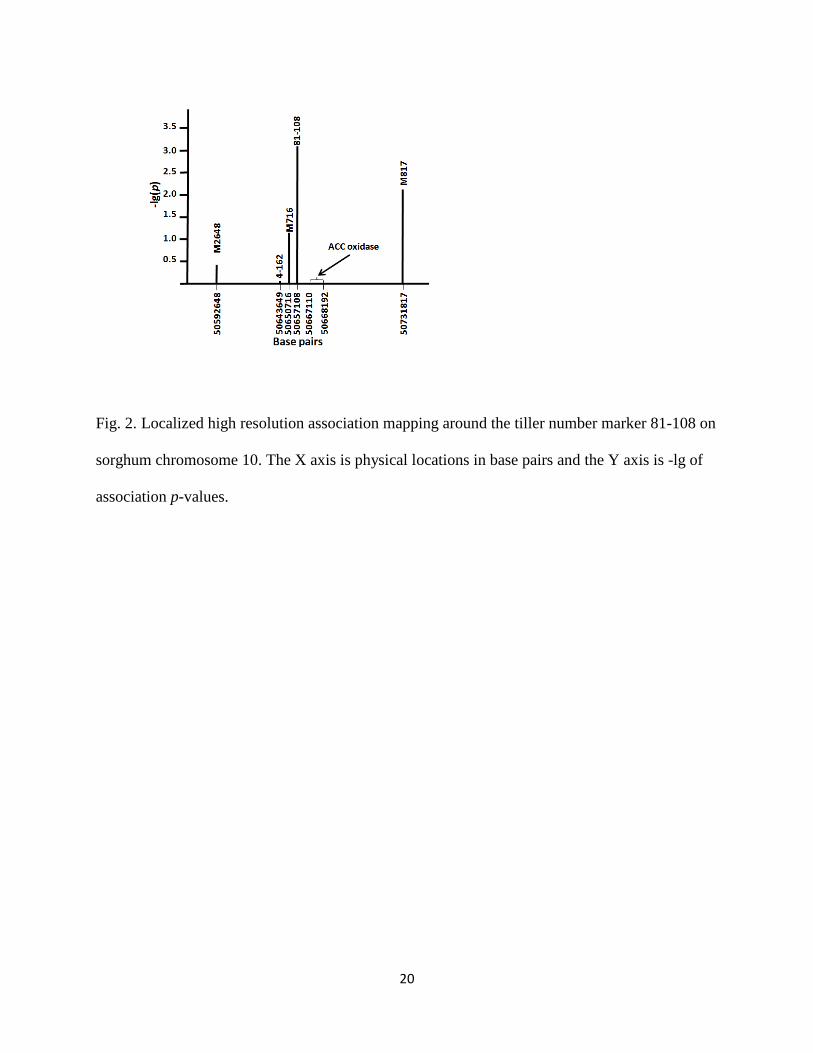
Marker 81-108 was chosen to find potential genes in the region that could affect this trait
because one allele of this marker reduced the tiller number in the most landraces (116 of 242)
from the mini core. Three additional markers were analyzed which made total number of
markers in the region of 1.39 Mb to five: M648, 4-162, and M716 on one side of 81-108 and
M817 on the other side (Fig. 2). There were two markers with p < 0.01 in this region: 81-108 and
17
the adjacent M817. It is possible that genes between these two markers affect tiller number in
sorghum. Based on the annotated sorghum genome from phytozome.net and plantgdb.org, there
are six putative genes in this 74 kb region of the aligned genome sequence of SBI-10: β-
galactosidase 1, AT4G29560 unknown protein, amino-cyclopropane-carboxylate oxidase (ACC
oxidase), AT2G34910 unknown protein, hypothetical protein, and AT3G50180 unknown
protein. The gene in this region that appears most likely to impact tillering is that for ACC
oxidase (Sb10g022640).
In plants, ACC oxidase catalyzes the last step of ethylene biosynthesis converting 1-
amino-cyclopropane-1-carboxylic acid to ethylene (Hamilton et al. 1990) and ethylene is known
to promote tiller formation in the grasses. In barley, exogenous application of ethylene
(ethephon) through injection into base stems and spray on foliages increased tillering (Foster et
al. 1992). In bermudagrass, ethephon treatment increased the number of tillers up to 10-fold
(Shatters et al. 1998). Similar results were also reported in rice. Increased CO2 concentration in
the rice growing environment stimulated a 2-3-fold increase in endogenous and ACC-mediated
ethylene release which consequently increased grain yield by 56% through increased tiller
number (Seneweera et al. 2003). Therefore, it is likely that ACC oxidase regulates tiller numbers
in sorghum. Testing of this gene is currently underway.
Conclusion
In this study, we identified two markers (40-1896 and 81-108) linked to tiller number and one (4-
162) to kernel weight. SSR markers 40-1896 and 4-162 co-localized with previously mapped
18
QTLs for tiller number and kernel weight, respectively. However, SSR marker 81-108, which
was located near to 4-162, did not co-localize with any previously reported QTL for basal tiller
number. Candidate gene (Sb10g022640), for ACC oxidase, positioned between SSR markers in
this regions that were significantly associated with basal tiller number, namely 81-108 and
M817. ACC oxidase catalyzes the last step of ethylene biosynthesis and increased ethylene level
promotes tiller formation in the grasses. Further experiment to verify functional effect of the
gene is underway. The results provide the groundwork to identify genes regulating kernel weight
and tiller number in sorghum in the future.
Acknowledgements
This study was supported by the University of Louisiana at Lafayette and the International Crops
Research Institute for the Semi-Arid Tropics. We thank the reviewers for their critical comments
to improve the manuscript.
19
Figure 1. Chromosome location of markers linked to sorghum kernel weight and tiller number.
A. Kernel weight. B. Tiller number. For each chromosome, on the left are physical positions of
markers in Mb and are previously mapped QTLs with reference represented by vertical bars.
Arrow(s) attached to a vertical bar indicates that the QTL can not be physically delimited based
on mapped markers at the pointed direction. On the right are SSR or RFLP markers. SSR
markers identified in this study are in green. Markers previously mapped are in black; in
parenthesis is the source of each marker. Not drawn to scale relative to the whole chromosome
but to scale for the physical positions shown.
20
Fig. 2. Localized high resolution association mapping around the tiller number marker 81-108 on
sorghum chromosome 10. The X axis is physical locations in base pairs and the Y axis is -lg of
association p-values.
21
References
Amthor JS (1983) Sorghum seedling growth as a function of sodium chloride salinity and seed
size. Ann Bot 52:915–917
Ayana A, Bekele E (2000) Geographical patterns of morphological variation in sorghum
(Sorghum bicolor (L.) Moench) germplasm from Ethiopia and Eritrea: Quantitative characters.
Euphytica 115:91–104
Bhattramakki D, Dong J, Chhabra K, Hart GE (2000) An integrated SSR and RFLP linkage map
of Sorghum bicolor (L.) Moench. Genome 43: 988–1002
Boivin K, Deu M, Rami JF, Trouche G, Hamon P (1999) Towards a saturated sorghum map
using RFLP and AFLP markers. Theor Appl Genet 98:320-328
Botstein D, White RL, Skolnick M, Davis RW (1980) Construction of a genetic linkage map in
man using restriction fragment length polymorphisms. Am J Hum Genet 32:314-331
Bowers JE, Abbey C, Anderson S, Chang C, Draye X, Hoppe AH, Jessup R, Lemke C,
Lennington J, Li Z, Lin YR, Liu SC, Luo L, Marler BS, Ming R, Mitchell SE, Qiang D,
Reischmann K, Schulze SR, Skinner DN, Wang YW, Kresovich S, Schertz KF, Paterson AH
(2003) A high-density genetic recombination map of sequence-tagged sites for sorghum, as a
framework for comparative structural and evolutionary genomics of tropical grains and grasses.
Genetics 165:367-386
22
Bradbury PJ, Zhang Z, Kroon DE, Casstevens TM, Ramdoss Y, Buckler ES (2007) TASSEL:
software for association mapping of complex traits in diverse samples. Bioinformatics 23:2633-
2635
Brown PJ, Klein PE, Bortiri E, Acharya CB, Rooney WL, Kresovich S (2006) Inheritance of
inflorescence architecture in sorghum. Theor Appl Genet 113:931–942
Brown PJ, Rooney WL, Franks C, Kresovich S (2008) Efficient mapping of plant height
quantitative trait loci in a sorghum association population with introgressed dwarfing genes.
Genetics 180:629-637
Burow GB, Klein RR, Franks CD, Klein PE, Schertz KF, Pederson GA, Xin Z, Burke JJ (2011)
Registration of the BTx623/IS3620C recombinant inbred mapping population of sorghum. J
Plant Registrations 5:141-145
Casa AM, Pressoir GH, Brown PJ, Mitchell SE, Rooney WL, Tuinstra MR, Franks CD,
Kresovich S (2008) Community resources and strategies for association mapping in sorghum.
Crop Sci. 48:30-40
Chittenden LM, Schertz KF, Lin YR, Wing RA, Paterson AH (1994) A detailed RFLP map of
Sorghum bicolor × S. propinquum, suitable for high-density mapping, suggests ancestral
duplication of sorghum chromosomes or chromosomal segments. Theor Appl Genet 87:925-933
Elangovan M, Prabhakar, Reddy DCS (2007) Characterization and evaluation of sorghum
[Sorghum bicolor (L.)] germplasm from Karnataka, India. Karnataka J Agric Sci 20:840-842
23
Evanno G, Regnaut S, Goudet J (2005) Detecting the number of clusters of individuals using the
software STRUCTURE: a simulation study. Mol Ecol 14:2611–2620
Feltus FA, Hart GE, Schertz KF, Casa AM, Kresovich S, Abraham S, Klein PE, Brown PJ,
Paterson AH (2006) Alignment of genetic maps and QTLs between inter- and intra-specific
sorghum populations. Theor Appl Genet 112:1295–1305
Foster KR, Reid DM, Pharis RP (1992) Ethylene biosynthesis and ethephon metabolism and
transport in barley. Crop Sci 32: 1345-1352.
Grenier C, Bramel-Cox PJ, Hamon P (2001a) Core collection of sorghum: I. Stratification based
on eco-geographical data. Crop Sci 41:234–240
Grenier C, Hamon P, Bramel-Cox PJ (2001b) Core collection of sorghum: II. Comparison of
three random Sampling strategies. Crop Sci 41:234–240
Hamilton AJ, Lycett GW, Grierson D (1990) Antisense gene that inhibits synthesis of the
hormone ethylene in transgenic plants. Nature 346: 284-287
Hart GE, Schertz KF, Peng Y, Syed NH (2001) Genetic mapping of Sorghum bicolor (L.)
Moench QTLs that control variation in tillering and other morphological characters. Theor Appl
Genet 103:1232–1242
24
Klein PE, Klein RR, Cartinhour SW, Ulanch PE, Dong J, Obert JA, Morshige DT, Schlueter SD,
Childs KL, Ale M, Mullet JE (2000) A high-throughput AFLP-based method for constructing
integrated genetic and physical maps: Progress toward a sorghum genome map. Genome Res 10:
789-807
Klein RR, Rodriguez-Herrera R, Schlueter JA, Klein PE, Yu ZH, Rooney WL (2001)
Identification of genomic regions that affect grain-mould incidence and other traits of agronomic
importance in sorghum. Theor Appl Genet 102:307–319
Kong L, Dong L, Hart GE (2000) Characteristics, linkage-map positions, and allelic
differentiation of Sorghum bicolor (L.) Moench DNA simple-sequence repeats (SSRs). Theor
Appl Genet 101:438-448
Liu RH, Meng JL (2003) MapDraw: a Microsoft Excel macro for drawing genetic linkage maps
based on given genetic linkage data. Hereditas (Beijing) 25:317-321
Liu K, Muse SV (2005) PowerMarker: an integrated analysis environment for genetic marker
analysis. Bioinformatics 21:2128-2129
Mace ES, Jordan DR (2011) Integrating sorghum whole genome sequence information with a
compendium of sorghum QTL studies reveals uneven distribution of QTL and of gene-rich
regions with significant implications for crop improvement. Theor Appl Genet 123:169-191
Maranville JW, Clegg MD (1977) Influence of seed size and density on germination, seedling
emergence, and yield of grain sorghum. Agron J 69:329-330
25
Martin JH, Waldren RP, Stamp DL (2004) Principles of Field Crop Production. Chapter 13.
Pearson/Prentice Hall, Upper Saddle River, New Jersey. pp 341-366
Murray SC, Sharma A, Rooney WL, Klein PE, Mullet JE, Mitchell SE, Kresovich S (2008a)
Genetic improvement of sorghum as a biofuel feedstock: I. QTL for stem sugar and grain
nonstructural carbohydrates. Crop Sci 48:2165-2179
Murray SC, Rooney WL, Mitchell SE, Sharma A, Klein PE, Mullet JE, Kresovich S (2008b)
Genetic improvement of sorghum as a biofuel feedstock: II. QTL for stem and leaf structural
carbohydrates. Crop Sci 48:2180-2193
Paterson AH, Lin YR, Li Z, Schertz KF, Doebley JF, Pinson SRM, Liu SC, Stansel JW, Irvine
JE (1995a) Convergent domestication of cereal crops by independent mutations at corresponding
genetic loci. Science 269:1714-1717
Paterson AH, Schertz KF, Lin YR, Liu SC, Chang YL (1995b) The weediness of wild plants:
Molecular analysis of genes influencing dispersal and persistence of johnsongrass, Sorghum
halepense (L.). Proc Natl Acad Sci USA 92:6127-6131
Peng Y, Schertz KF, Cartinhour S, Hart GE (1999) Comparative genome mapping of Sorghum
bicolor (L.) Moench using an RFLP map constructed in a population of recombinant inbred
lines. Plant Breeding 118:225-235
26
Pereira MG, Ahnert D, Lee M, Klier K (1995) Genetic-mapping of quantitative trait loci for
panicle characteristics and kernel weight in sorghum. Braz J Genet 18:249–257
Pritchard JK, Stephens M, Donnelly P (2000) Inference of population structure using multilocus
genotype data. Genetics 155:945–959
Rami JF, Dufour P, Trouche G, Fliedel G, Mestres C, Davrieux F, Blanchard P, Hamon P (1998)
Quantitative trait loci for grain quality, productivity, morphological and agronomical traits in
sorghum (Sorghum bicolor L. Moench). Theor Appl Genet 97:605–616
Ramu P, Deshpande SP, Senthilvel S, Jayashree B, Billot C, Deu M, Ananda Reddy L, Hash CT
(2010) In silico mapping of important genes and markers available in the public domain for
efficient sorghum breeding. Mol Breed 26:409-418
Rooney WL, Blumenthal J, Bean B, Mullet JE (2007) Designing sorghum as a dedicated
bioenergy feedstock. Biofuels Bioprod Bioref 1:147–157
Seneweera S, Aben SK, Basra AS, Jones B, Conroy JP (2003) Involvement of ethylene in the
morphological and developmental response of rice to elevated atmospheric CO2 concentrations.
Plant Growth Regulation 39:143-153
Shatters RG Jr, Wheeler R, West SH (1998) Ethephon induced changes in vegetative growth of
'Tifton 85' bermudagrass. Crop Sci 38:97-103
27
Shiringani AL, Frisch M, Friedt W (2010) Genetic mapping of QTLs for sugar-related traits in a
RIL population of Sorghum bicolor L. Moench. Theor Appl Genet 121:323–336
Srinivas G, Satish K, Madhusudhana R, Reddy RN, Mohan SM, Seetharama N (2009)
Identification of quantitative trait loci for agronomically important traits and their association
with genic-microsatellite markers in sorghum. Theor Appl Genet 118:1439–1454
Swanson AF, Hunter R (1936) Effect of germination and seed size on sorghum stands. J Amer
Soc Agron 28:997–1004
Upadhyaya HD, Pundir RPS, Dwivedi SL, Gowda CLL, Reddy VG, Singh S (2009) Developing
a mini core collection of sorghum for diversified utilization of germplasm. Crop Sci 49:1769–
1780
Tesso T, Tirfessa A, Mohammed H (2011) Association between morphological traits and yield
components in the durra sorghums of Ethiopia. Hereditas 148:98-109
Wang YH, Bible P, Loganantharaj R, Upadhyaya HD (2012) Identification of SSR markers
associated with height using pool-based genome-wide association mapping in sorghum. Mol
Breed DOI: 10.1007/s11032-011-9617-3
Williams CE, Ronald PC (1994) PCR template-DNA isolated quickly from monocot and dicot
leaves without tissue homogenization. Nucleic Acids Res 22 1917–1918
28
Yu JM, Pressoir G, Briggs WH, Bi IV, Yamasaki M, Doebley JF, McMullen MD, Gaut BS,
Nielsen DM, Holland JB, Kresovich S, Buckler ES (2006) A unified mixed-model method for
association mapping that accounts for multiple levels of relatedness. Nature Genet 38:203-208