Embed Size (px)
Citation preview
ÖSSUR Q3 RESULTS 2016
Highlights Q3 2016
• Sales amounted to USD 129 million compared to USD 117 million in Q3 2015, corresponding to local currencygrowth of 11% and 5% organic growth.
• Gross profit amounted to USD 81 million or 63% of sales, compared to USD 74 million or 63% of sales in Q32015.
• EBITDA amounted to USD 24 million or 19% of sales compared to USD 25 million or 22% of sales in Q3 2015.• Net profit amounted to USD 13 million or 10% of sales, compared to USD 14 million or 12% of sales in Q3
2015.• Cash generated by operations amounted to USD 27 million or 21% of sales, compared to USD 23 million or
20% of sales in Q3 2015.• On September 1, Össur acquired Medi Prosthetics. The income statement for Q3 2016 therefore includes Medi
Prosthetics for the month of September only.• Össur acquired 301,621 of own shares in Q3 2016 for approximately USD 1.2 million.
Financial Guidance for 2016
We are revising the financial guidance for the full year of 2016. Due to recent acquisitions we are upgrading sales growth measured in local currency from the range of 7-9% to the range of 8-10%. Adjusted EBITDA margin is now expected to be approximately 19%. The downwards revision of the EBITDA margin is mainly due to adverse currency movements, specifically the strengthening of the ISK, and impact from the Medi Prosthetics acquisition which is expected to be temporary while the acquired business is being integrated and synergies realized. The revised guidance is as follows:
• Sales growth LCY in the range of 8-10% (previously 7-9%)• Organic sales growth LCY in the range of 3-5% (unchanged)• Adjusted EBITDA margin around 19% of sales (previously 20-21%)• Capital expenditures 5% of sales (unchanged)• Effective tax rate around 26% (unchanged)
Jon Sigurdsson, President & CEO, comments:
“The sales growth in the quarter was good. Prosthetics growth was excellent, driven by bionics and newly launched products. In September we acquired Medi Prosthetics. Medi Prosthetics is a global provider of mechanical limb prosthetic components. This acquisition enables us to take another step to complete our prosthetics offering and further strengthen our global market position. Due to adverse currency movements, mainly the strengthening of the ISK, and temporary impact from the Medi Prosthetics acquisition we have revised our guidance for the full year.”
Announcement from Össur hf. No. 88/2016 Reykjavík, 26 October 2016
Conference Call Össur will host a conference call on Thursday October 27 2016 at 9:00 CET/ 7:00 GMT/ 3:00 EDT. To participate in the call please dial: Europe: + 45 3544 5580, +44 (0) 203 364 5374 or +46 (0) 8 505 564 74, The United States: + 1 855 753 2230, Iceland: +354 800 7417
Financial Highlights
*Financial ratios for Q3 2016 and Q3 2015 are based on operations for the preceding 12 months.
USD m Q3 2016 Q3 2015 2015 2014 2013 2012
Income Statement
Net sales 129 117 483 509 436 399
Gross profit 81 74 303 323 270 248
Operating expenses (excl. other income) 62 53 226 237 210 191
EBIT 19 20 77 86 60 57
Net profit 13 14 51 59 41 38
EBITDA 24 25 97 104 75 70
EBITDA adjusted 24 25 99 104 80 70
Sales growth
Sales growth USD % 10 (7) (5) 17 9 0
Growth breakdown:
Organic growth in LCY % 5 3 5 5 2 3
Currency effect % (1) (10) (10) (1) 1 (3)
Acquired/divested business % 6 0 1 13 6 1
Balance Sheet
Total assets 755 661 653 678 706 591
Equity 466 461 463 442 448 408
Net interest-bearing debt (NIBD) 139 69 58 93 108 82
Cash Flow
Cash generated by operations 27 23 84 98 73 71
Free cash flow 16 14 42 68 49 43
Key ratios
Gross profit margin % 63 63 63 63 62 62
EBIT margin % 15 17 16 17 14 14
EBITDA margin % 19 22 20 20 17 18
EBITDA adjusted margin % 19 22 20 20 18 18
Equity ratio % 62 70 71 65 63 69
Net debt to EBITDA * 1.5 0.7 0.6 0.9 1.4 1.2
Effective tax rate % 26 23 25 24 26 26
Return on equity * % 11 12 11 13 10 10
CAPEX / Net sales % 4.7 4.0 4.9 3.3 3.9 3.6
Market
Market value of equity 1,709 1,402 1,546 1,311 880 606
Number of shares Millions 443 446 446 454 454 454
Price/earnings ratio, (P/E) * 34.7 26.2 30.2 22.1 21.7 15.8
Diluted EPS US cent 3.0 3.1 11.5 13.1 9.1 8.4
Diluted cash EPS US cent 4.2 4.1 16.0 17.2 12.5 11.3
Management’s Report
Q3 HIGHLIGHTS
Sales Performance Sales amounted to USD 129 million compared to USD 117 million in Q3 2015, corresponding local currency growth of 11% and 5% organic growth. Due to primarily the appreciation of the ISK against the USD and the depreciation of the GBP against the USD, currency movements in Q3 2016 compared to Q3 2015 impacted the operating results negatively; sales by USD 1 million and EBITDA by USD 1 million.
Sales by Segments and Regions in Q3 2016
Bracing and supports
Bracing and supports sales grew by 1% measured in local currency. High end innovative products continued to contribute positively. We continued building our newly launched Form Fit® line by releasing 6 new Form Fit® products in the quarter. The Form Fit® line is a comprehensive collection of quality support solutions that is a part of the injury solutions product portfolio. Sales growth was entirely driven by EMEA with good performance in France. Sales were flat in Americas with positive outlook going forward. Sales in APAC were soft in the quarter. Sales performance in APAC has historically been volatile between quarters due to relatively high sales to few large distributors.
Prosthetics
Prosthetics sales grew by 25% and 11% organic, both measured in local currency. Sales growth was strong in bionics, with good contribution from the RHEO KNEE® 3 XC that was launched in Q2 2016. EMEA and Americas both had an excellent quarter where bionics and newly launched products performed well. Sales in APAC continue to be affected by a change in sales model in China. In Q3 of 2015 Medicare contractors announced a draft of a proposal to change certain elements of the reimbursement framework for lower-limb prosthetics. The draft met heavy resistance from the industry. In Q4 of 2015 Medicare announced that it was not adopting the draft which means that, in the short term, there are no changes pending in the reimbursement system. However, Medicare has formed a workgroup to draft a proposal describing current best practices in prosthetic care and identifying research evidence gaps. No new information has been made public regarding this matter since Medicare announced that it was not adopting the draft.
Sales of bionic products in the quarter amounted to 23% of prosthetics component sales, compared to 15% in Q3 2015. The increase in relative share of bionics sales is related to the acquisition of Touch Bionics, as the vast majority of Touch Bionics sales are bionics as well as good growth in the existing bionic products.
Gross Profit Gross profit amounted to USD 81 million or 63% of sales, compared to USD 74 million or 63% of sales in Q3 2015. Product mix impact from prosthetics was positive driven by bionics and newly launched products. Product mix impact from B&S was neutral despite good growth in sales of high end B&S products as other lower margin products showed good growth in the quarter as well. The net effect of currency movement affects gross profit margin negatively by 20 basis points, mainly as a result of depreciation of the GBP and appreciation of the ISK.
USD m Q3 2016 % of sales
Sales growth
USD
Sales growth
LCY
Organicsales
growth LCY
EMEA 58 45% 8% 11% 5%
Americas 62 48% 14% 14% 8%
APAC 9 7% -2% -3% -3%
Total 129 100% 10% 11% 5%
USD m Q3 2016 % of sales
Sales growth
USD
Sales growth
LCY
Organicsales
growth LCY
Bracing and supports 66 51% 0% 1% 1%
Prosthetics 63 49% 24% 25% 11%
Other 0 0% -55% -54% -54%
Total 129 100% 10% 11% 5%
EBITDA EBITDA amounted to USD 24 million or 19% of sales, compared to USD 25 million or 22% of sales in Q3 2015. EBITDA grew 2% in the quarter measured in local currency. Currency movements affected the EBITDA margin negatively by about 80 basis points, furthermore the consolidation of the recently acquired companies affected the EBITDA margin negatively by about 90 basis points as the EBITDA margin is lower in the Medi Prosthetics and Touch Bionics business. Growth in operating expenses exceeded organic sales growth and therefore had a negative effect on both EBITDA growth and EBITDA margin in the quarter. Investment in process improvements and other projects with focus on future improvements were the main reason for the aforementioned growth. We expect growth in operating expenses in both Q4 and for the full year to be more in line with sales growth.
Financial Items, Tax and Net Profit Net financial expenses amounted to USD 1.2 million compared to USD 1.6 million in Q3 2015. Net exchange rate difference was negative by USD 0.4 million compared to negative USD 1.0 million in Q3 2015. Income tax amounted to USD 4 million, corresponding to 26% effective tax rate, compared to USD 4 million and 23% effective tax rate in Q3 2015. Net profit amounted to USD 13 million or 10% of sales, compared to USD 14 million or 12% of sales in Q3 2015.
Cash Flow Cash generated by operations in the quarter amounted to USD 27 million or 21% of sales, compared to USD 23 million or 20% of sales in Q3 2015. Cash generated by operations in the quarter was good. Furthermore, contribution from working capital in the quarter was positive, returning to more normalized level compared to Q2 2016. Capital expenditure amounted to USD 6 million or 5% of sales, compared to USD 5 million or 4% of sales in Q3 2015. Capital expenditure in 2016 will be above the normalized level and the historical average. Full year capital expenditure is expected to be 5% of sales but is expected to return back to the historical average (3-4% of sales) in 2017. The main reasons for higher capital expenditure in 2016 are; a move to new facilities in EMEA, new datacenter, and investments in new manufacturing capabilities and machinery in our Mexico manufacturing facility.
Capital Structure, Share Buybacks and Dividends Össur’s Capital Structure and Dividend policy was updated in February 2016 by the Board of Directors.
The Capital Structure and Dividend Policy
Össur’s policy is to maintain a healthy balance sheet and a level of net interest bearing debt of 0.5x-1.5x to EBITDA. Excess capital is returned to shareholders via annual cash dividends and/or purchase of own shares. Össur’s policy is to distribute a relatively stable cash dividend. The cash dividends will be decided annually in DKK per share. Return of capital to shareholders is based on objectives of maintaining a solid financial position, operational outlook and investment requirements.
Share Buybacks and proposal to reduce share capital
In December 2015, Össur initiated a “Safe Harbor” share buyback program on NASDAQ Copenhagen that will be carried out in accordance with the provisions of the European commission’s Regulations No. 2273/2003. The purpose of the program is to reduce the Company’s share capital and adjust the capital structure by distributing capital to shareholders in line with the Company’s Capital Structure and Dividend Policy. The Company may purchase up to 20,000,000 shares under the program. The total consideration for shares purchased under the program shall not exceed USD 40 million. The daily purchase shall not exceed 50% of the average volume in the 20 trading days before the purchase. The program will end no later than 1 December 2016, but the company is entitled to discontinue the program at any time. Össur also reserves the right to buy back shares in block trades outside the “Safe Harbor” program with the aim to maintain the desired capital level of net interest bearing debt. Such transactions will only be made in “open windows”, i.e. within six weeks from the publication of Össur’s financial results, and when no insider information is available. The Board of Directors proposed to the Annual General Meeting in 2016 to reduce the share capital by ISK 3,292,688 by way of canceling 3,292,688 of the Company’s own shares of ISK 1 nominal value each. The motion was approved by the Annual General Meeting. The capital reduction was completed on 21 March 2016. The share capital of Össur is now ISK 443,000,557. At quarter end the Company held 5,655,090 of own shares. Össur acquired 301,621 of own shares in Q3 2016 for approximately USD 1.2 million.
Acquisition of Medi Prosthetics On September 1 2016 Össur acquired Medi Prosthetics from Medi. Medi Prosthetics is a global provider of mechanical lower limb prosthetic components, located in Bayreuth, Germany. In 2015 total sales amounted to EUR 15 million (USD 17 million). The integration of the business is expected to be concluded in 2017.
This acquisition enables Össur to take another step to complete its prosthetics offering and further strengthen its global market position. Medi Prosthetics offers a well-respected mechanical product line with strongholds in the knee and liner segment.
Acquisition of Touch Bionics On April 11 2016 Össur acquired Touch Bionics for GBP 27.5 million (USD 40 million) on debt and cash free basis. Touch Bionics is a leading global provider of innovative upper limb prosthesis and supporting services. The acquisition was financed through existing loan facilities. The acquisition does not affect the existing share buyback program. Touch Bionics has over 120 employees with operations in Scotland, Germany, and the United States. In 2015, total sales amounted to GBP 15 million (USD 21 million) with an adjusted EBITDA of GBP 0.9 million (USD 1.3 million).
With this acquisition Össur enters into the upper limb prosthetic market enabling the Company to offer a complete bionic product portfolio to customers in the prosthetic industry. Together, both companies are well positioned to further strengthen their worldwide market position in both lower and upper limb prosthetics. The acquisition of Touch Bionics is a further display of Össur’s commitment to upgrading prosthetic technology resulting in effective clinical outcomes and improved quality of life. Synergies between the operations of Össur and Touch Bionics are expected to be achieved over the next 2-3 years, ultimately increasing the EBITDA margin of Touch Bionics to a similar level as for Össur.
Revised Guidance The financial guidance for the full year of 2016 has been revised.
Due to recent acquisitions we are upgrading sales growth measured in local currency from the range of 7-9% to the range of 8-10%. Adjusted EBITDA margin is now expected to be approximately 19%. The downwards revision of the EBITDA margin is mainly due to adverse currency movements, specifically the strengthening of the ISK, and impact from the Medi Prosthetics acquisition which is expected to be temporary while the acquired business is being integrated and synergies realized. Capital expenditures and effective tax rate are expected to be the same, 5% and 26% respectively, for the full year.
General Update FX Matters
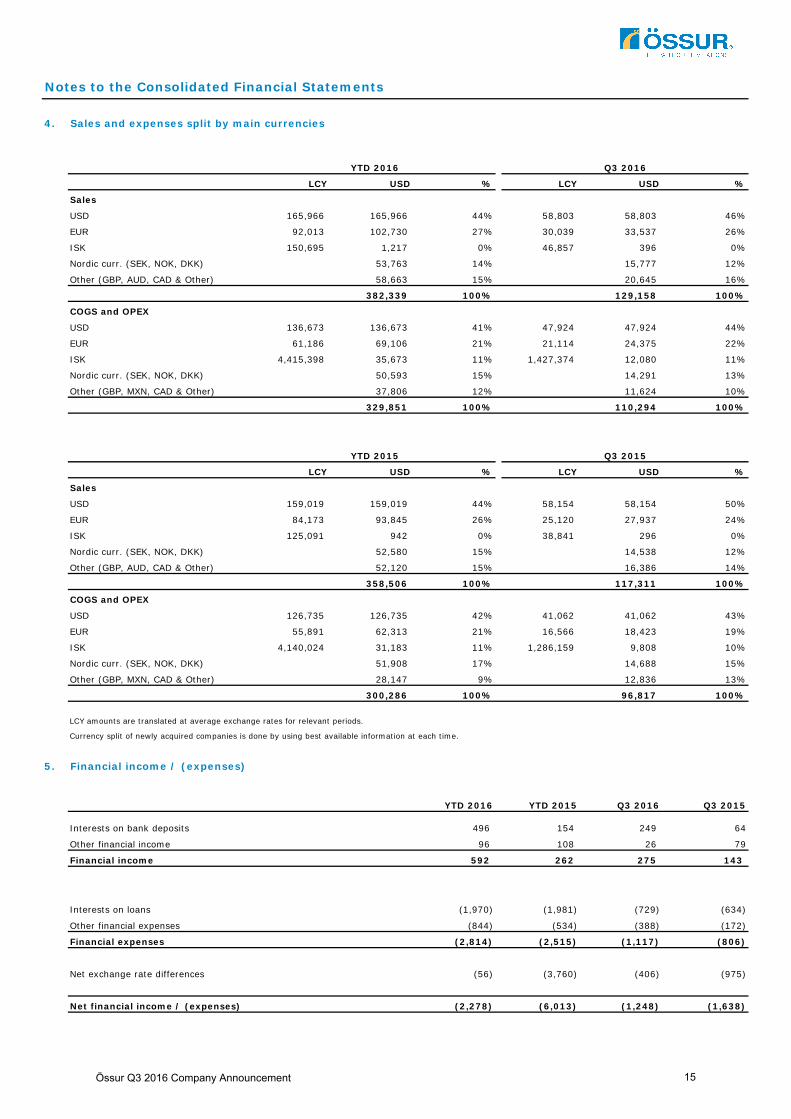
The financials in the quarter are affected negatively by currency movements. Mainly due to the depreciation of the GBP against the USD and the appreciation of the ISK against the USD. Split of sales and expenses by main currencies can be found in note 4 in the accompanying Consolidated Financial Statements. As can be seen in the note, the EBITDA margin is fairly well hedged for currency movements and one of the key variables for this hedge to hold is that the EUR and the ISK move in tandem to the USD. However, in Q3 the ISK has strengthened versus the USD proportionately more than other major operating currencies, including the EUR, resulting in a negative impact on profitability.
Products
In Q3 2016, 20 new products and product upgrades were introduced to the market; 18 bracing and supports products and 2 prosthetics products. Product highlights during the quarter include:
Form Fit® Walker
The Form Fit® Walker provides immobilization for patients suffering from soft tissue injury; grades 2 and 3 strains and sprains; and stable fractures. Features and benefits include; High and low top versions, shock absorbing sole that reduces impact during heel strike, low and wide rocker bottom that promotes a stable and natural gate, and a breathable, seamless liner.
Form Fit® Universal Wrist & Thumb
The Form Fit® Universal Wrist & Thumb products are designed to restrict motion of the wrist and the thumb. Providing immobilization of the wrist and thumb makes the product ideal during the rehabilitation and healing of injuries to the wrist and thumb. This brace is ideal for mild to moderate sprains and strains, tendonitis, post-cast healing, and other selected soft tissue injuries.
Financial Calendar and Upcoming Events and Conferences
Financial Calendar
Q4 2016 Results February 7 2017
2017 Annual General Meeting (IS) March 9 2017
Upcoming Events and Conferences
Danske Bank Copenhagen Winter Seminar November 30 2016
SEB Nordic Seminar
Carnegie Healthcare Seminar
January 10-11 2017
March 16 2017
InvestorDagen – Copenhagen March 21 2017
Further information: Jon Sigurdsson, President & CEO Tel: +354 515 1300 Sveinn Solvason, CFO Tel: +354 515 1300 Oskar Marus Dadason, IR Manager Tel: +1 949 220 4550
Össur press releases by e-mail
If you wish to receive Össur press releases by e-mail please register at the web-site: www.ossur.com/investormailings.
About Össur
Össur (NASDAQ: OSSR) is a global leader in non-invasive orthopedics that helps people live a life without limitations. Its business is focused on improving people’s mobility through the delivery of innovative technologies within the fields of braces, supports, prosthetic limbs and compression therapy. A recognized “Technology Pioneer”, Össur invests significantly in research and product development; its award-winning designs ensuring a consistently strong position in the market. Successful patient and clinical outcomes are further empowered via Össur’s educational programs and business solutions. Headquartered in Iceland, Össur has major operations in the Americas, Europe and Asia, with additional distributors worldwide. www.ossur.com
Forward-Looking Statements
This press release includes "forward-looking statements" which involve risks and uncertainties that could cause actual results to differ materially from results expressed or implied by these statements. Össur hf. undertakes no obligation and does not intend to update these forward-looking statements to reflect events or circumstances occurring after this press release. You are cautioned not to place undue reliance on these forward-looking statements, which speak only as of the date of this press release. All forward-looking statements are qualified in their entirety by this cautionary statement.
Date
Statement by the Board of Directors, President and CEO
Reykjavík, 26 October 2016
Board of Directors
Niels JacobsenChairman of the Board
Arne Boye Nielsen Kristján T. Ragnarsson
Guðbjörg Edda Eggertsdóttir Svafa Grönfeldt
President and CEO
Jón Sigurðsson
The Condensed Interim Consolidated Financial Statements of Össur hf. for the period from 1 January to 30September 2016 consist of the Financial Statements of Össur hf. and its subsidiaries. The Condensed InterimConsolidated Financial Statements are prepared in accordance with International Financial Reporting Standards forInterim Financial Reporting, IAS 34, as adopted by the EU. The Condensed Interim Consolidated Financial Statementsare neither audited nor reviewed by the Company's auditors.
The total sales of the Össur Consolidation amounted to USD 382.3 million and the net profit amounted to USD 36.5million. Össur's Consolidated total assets amounted to USD 755.0 million at the end of period, liabilities were USD289.4 million, and equity was USD 465.6 million.
It is our opinion that these Condensed Interim Consolidated Financial Statements present all the informationnecessary to give a true and fair view of the Company's financial position at 30 September 2016 and operatingperformance of the period ended 30 September 2016.
The Board of Directors and the President and CEO of Össur hf. have today discussed the Condensed InterimConsolidated Financial Statements for the period from 1 January to 30 September 2016 and confirm them by meansof their signatures.
Össur Q3 2016 Company Announcement 7
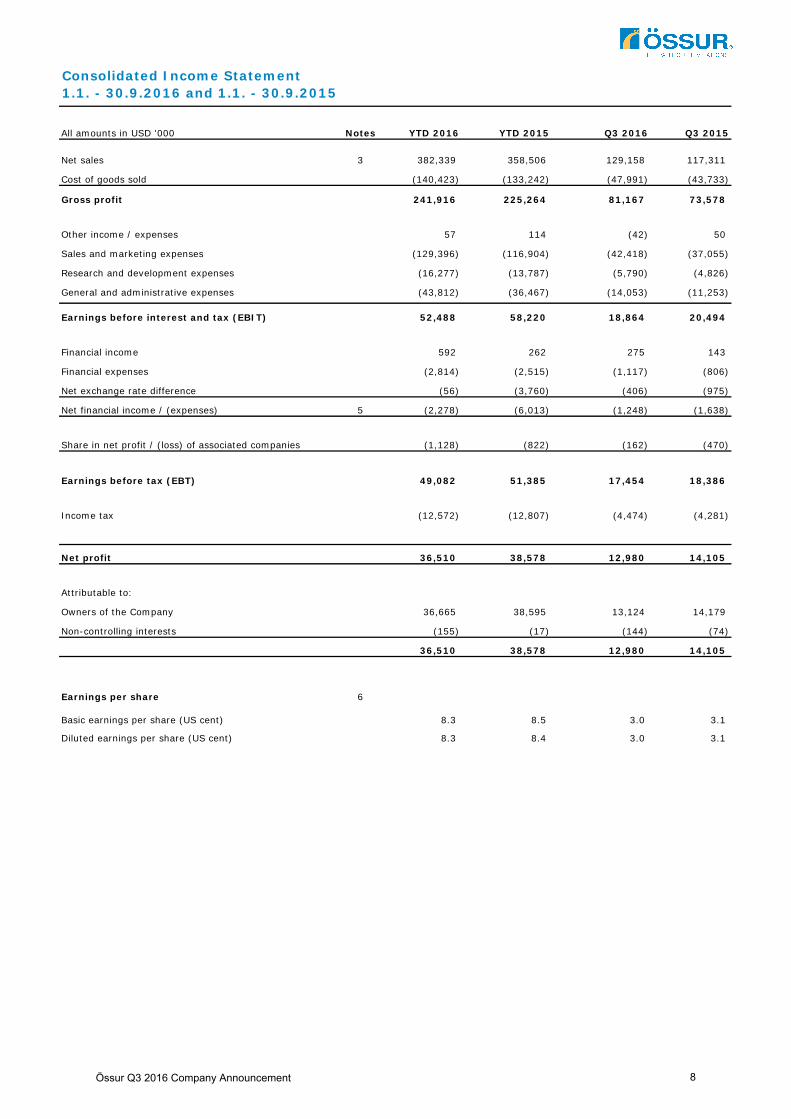
All amounts in USD '000 Notes YTD 2016 YTD 2015 Q3 2016 Q3 2015
3 382,339 358,506 129,158 117,311
(140,423) (133,242) (47,991) (43,733)
Gross profit 241,916 225,264 81,167 73,578
57 114 (42) 50
(129,396) (116,904) (42,418) (37,055)
(16,277) (13,787) (5,790) (4,826)
(43,812) (36,467) (14,053) (11,253)
Earnings before interest and tax (EBIT) 52,488 58,220 18,864 20,494
592 262 275 143
(2,814) (2,515) (1,117) (806)
(56) (3,760) (406) (975)
5 (2,278) (6,013) (1,248) (1,638)
(1,128) (822) (162) (470)
Earnings before tax (EBT) 49,082 51,385 17,454 18,386
(12,572) (12,807) (4,474) (4,281)
Net profit 36,510 38,578 12,980 14,105
Attributable to:
36,665 38,595 13,124 14,179
(155) (17) (144) (74)
36,510 38,578 12,980 14,105
Earnings per share 6
8.3 8.5 3.0 3.1
8.3 8.4 3.0 3.1
Net sales
Consolidated Income Statement 1.1. - 30.9.2016 and 1.1. - 30.9.2015
Owners of the Company
Non-controlling interests
Basic earnings per share (US cent)
Share in net profit / (loss) of associated companies
Net financial income / (expenses)
Diluted earnings per share (US cent)
Income tax
Cost of goods sold
Other income / expenses
Sales and marketing expenses
Research and development expenses
General and administrative expenses
Financial income
Financial expenses
Net exchange rate difference
Össur Q3 2016 Company Announcement 8
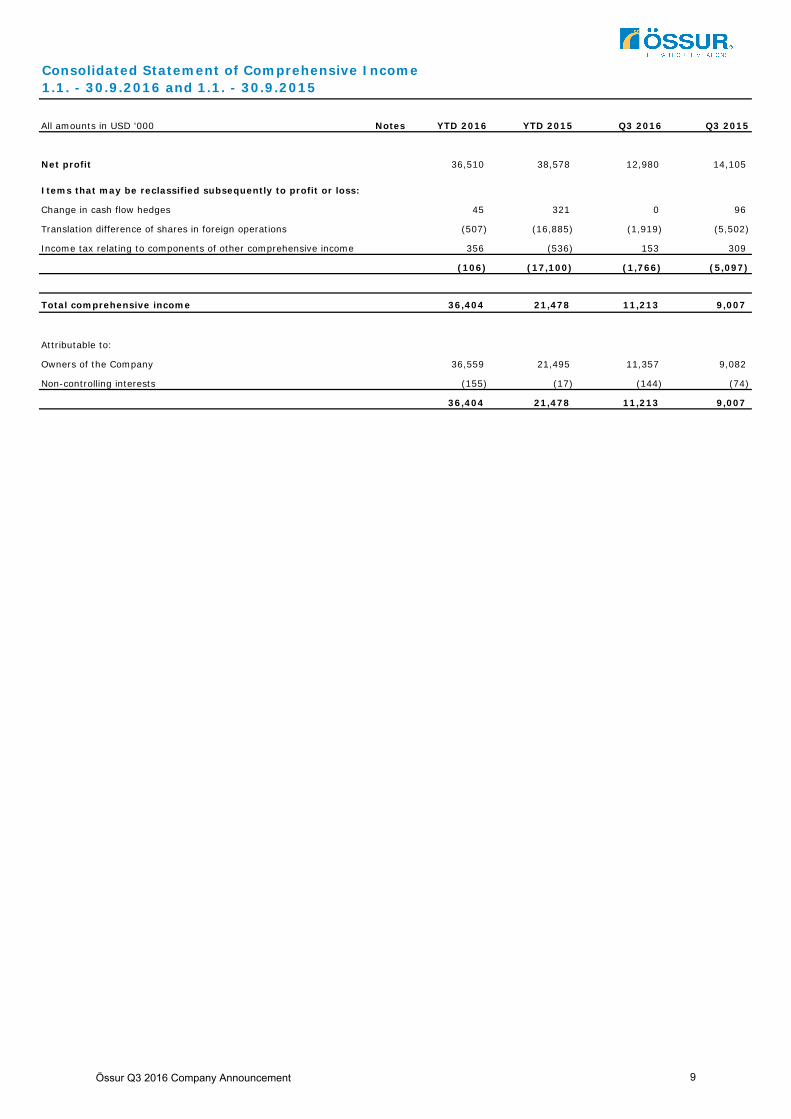
All amounts in USD '000 Notes YTD 2016 YTD 2015 Q3 2016 Q3 2015
Net profit 36,510 38,578 12,980 14,105
Items that may be reclassified subsequently to profit or loss:
45 321 0 96
(507) (16,885) (1,919) (5,502)
356 (536) 153 309
(106) (17,100) (1,766) (5,097)
Total comprehensive income 36,404 21,478 11,213 9,007
Attributable to:
36,559 21,495 11,357 9,082
(155) (17) (144) (74)
36,404 21,478 11,213 9,007
Consolidated Statement of Comprehensive Income1.1. - 30.9.2016 and 1.1. - 30.9.2015
Translation difference of shares in foreign operations
Change in cash flow hedges
Income tax relating to components of other comprehensive income
Owners of the Company
Non-controlling interests
Össur Q3 2016 Company Announcement 9
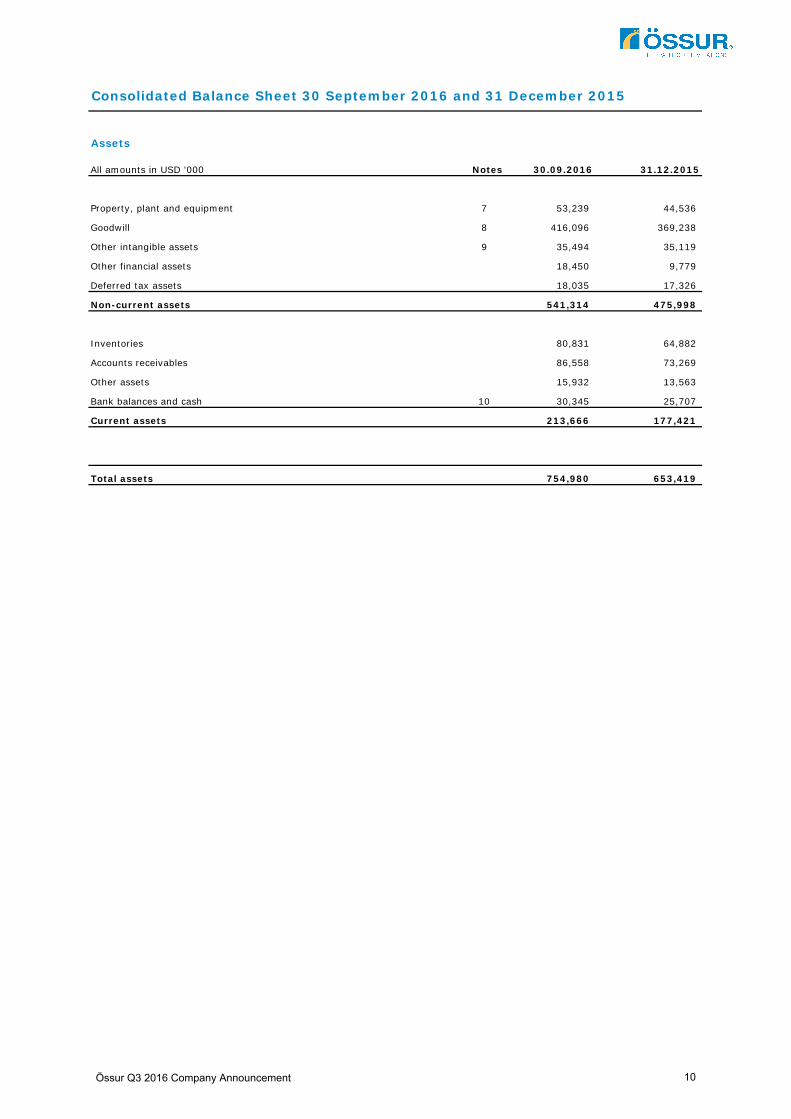
Consolidated Balance Sheet 30 September 2016 and 31 December 2015
Assets
All amounts in USD '000 Notes 30.09.2016 31.12.2015
7 53,239 44,536
8 416,096 369,238
9 35,494 35,119
18,450 9,779
18,035 17,326
Non-current assets 541,314 475,998
80,831 64,882
86,558 73,269
15,932 13,563
10 30,345 25,707
Current assets 213,666 177,421
Total assets 754,980 653,419
Property, plant and equipment
Goodwill
Other intangible assets
Other financial assets
Deferred tax assets
Inventories
Accounts receivables
Other assets
Bank balances and cash
Össur Q3 2016 Company Announcement 10
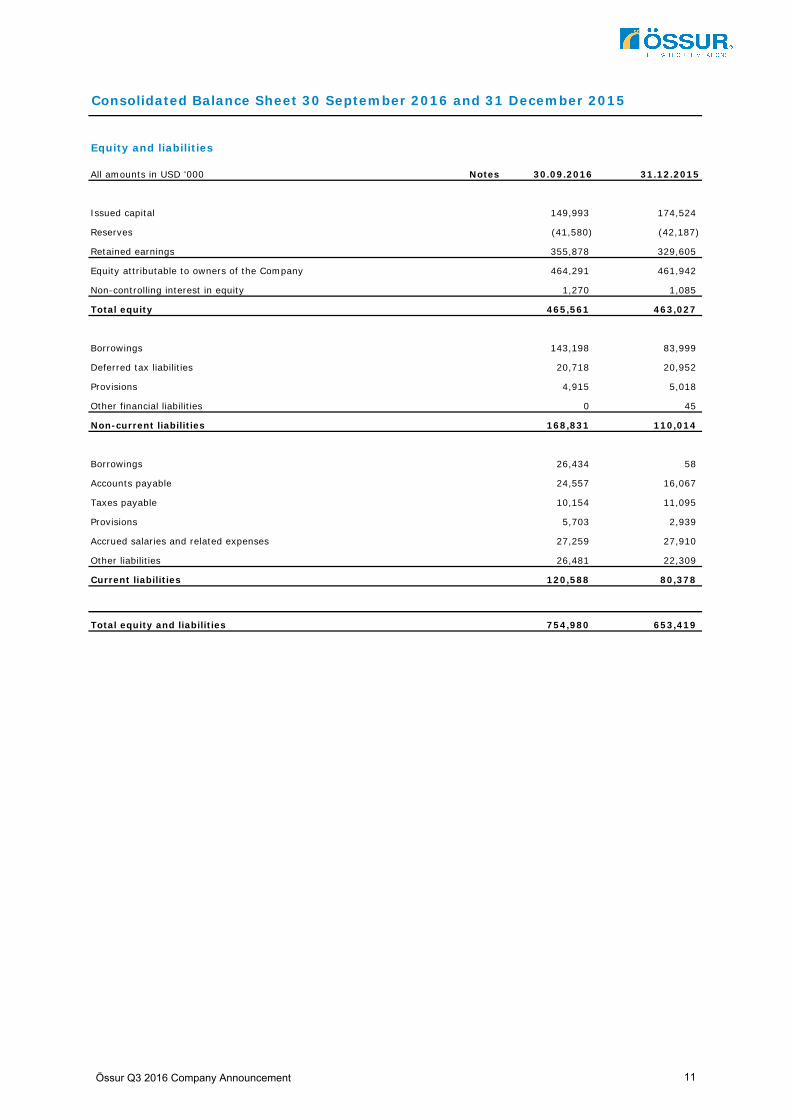
Consolidated Balance Sheet 30 September 2016 and 31 December 2015
Equity and liabilities
All amounts in USD '000 Notes 30.09.2016 31.12.2015
149,993 174,524
(41,580) (42,187)
355,878 329,605
Equity attributable to owners of the Company 464,291 461,942
1,270 1,085
Total equity 465,561 463,027
143,198 83,999
20,718 20,952
4,915 5,018
0 45
Non-current liabilities 168,831 110,014
26,434 58
24,557 16,067
10,154 11,095
5,703 2,939
27,259 27,910
26,481 22,309
Current liabilities 120,588 80,378
Total equity and liabilities 754,980 653,419
Other liabilities
Retained earnings
Non-controlling interest in equity
Borrowings
Deferred tax liabilities
Provisions
Other financial liabilities
Borrowings
Accounts payable
Taxes payable
Provisions
Accrued salaries and related expenses
Reserves
Issued capital
Össur Q3 2016 Company Announcement 11
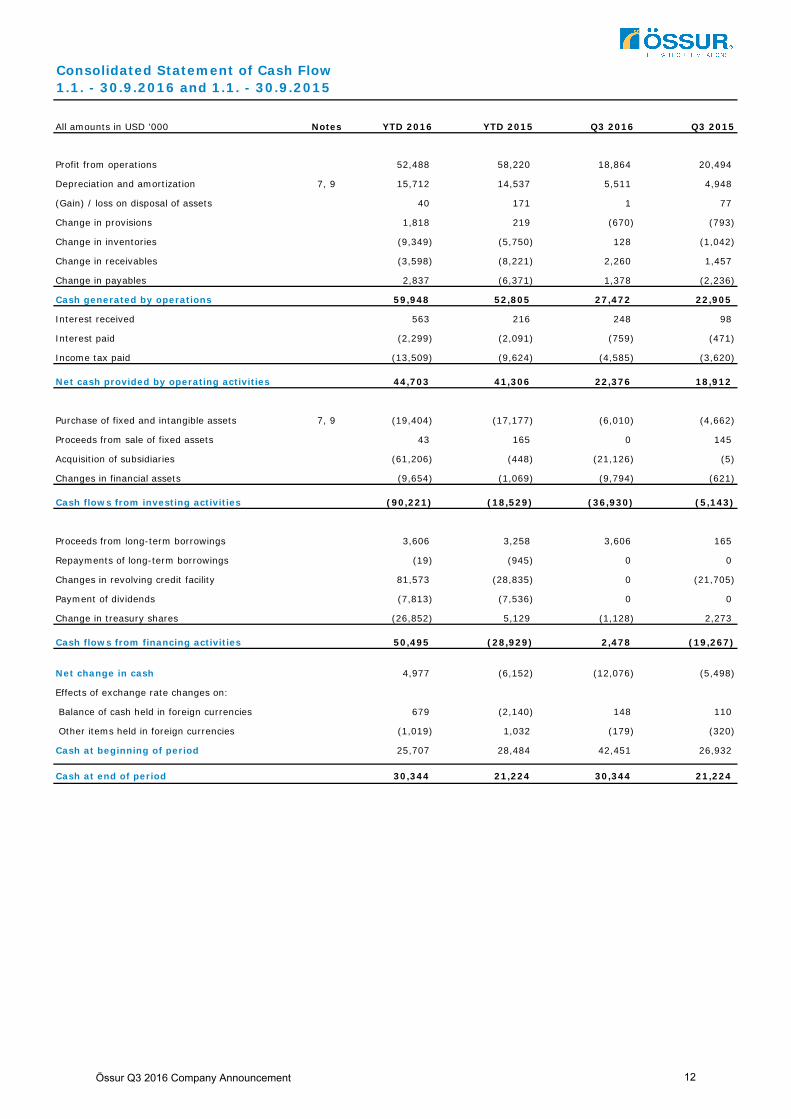
All amounts in USD '000 Notes YTD 2016 YTD 2015 Q3 2016 Q3 2015
52,488 58,220 18,864 20,494
7, 9 15,712 14,537 5,511 4,948
40 171 1 77
1,818 219 (670) (793)
(9,349) (5,750) 128 (1,042)
(3,598) (8,221) 2,260 1,457
2,837 (6,371) 1,378 (2,236)
Cash generated by operations 59,948 52,805 27,472 22,905
563 216 248 98
(2,299) (2,091) (759) (471)
(13,509) (9,624) (4,585) (3,620)
Net cash provided by operating activities 44,703 41,306 22,376 18,912
7, 9 (19,404) (17,177) (6,010) (4,662)
43 165 0 145
(61,206) (448) (21,126) (5)
(9,654) (1,069) (9,794) (621)
Cash flows from investing activities (90,221) (18,529) (36,930) (5,143)
3,606 3,258 3,606 165
(19) (945) 0 0
81,573 (28,835) 0 (21,705)
(7,813) (7,536) 0 0
(26,852) 5,129 (1,128) 2,273
Cash flows from financing activities 50,495 (28,929) 2,478 (19,267)
4,977 (6,152) (12,076) (5,498)
679 (2,140) 148 110
(1,019) 1,032 (179) (320)
25,707 28,484 42,451 26,932
Cash at end of period 30,344 21,224 30,344 21,224
Consolidated Statement of Cash Flow 1.1. - 30.9.2016 and 1.1. - 30.9.2015
Changes in revolving credit facility
Changes in financial assets
Interest paid
Income tax paid
Purchase of fixed and intangible assets
Proceeds from sale of fixed assets
Acquisition of subsidiaries
Interest received
Profit from operations
Depreciation and amortization
(Gain) / loss on disposal of assets
Change in provisions
Change in payables
Change in inventories
Change in receivables
Effects of exchange rate changes on:
Balance of cash held in foreign currencies
Proceeds from long-term borrowings
Repayments of long-term borrowings
Payment of dividends
Change in treasury shares
Other items held in foreign currencies
Cash at beginning of period
Net change in cash
Össur Q3 2016 Company Announcement 12
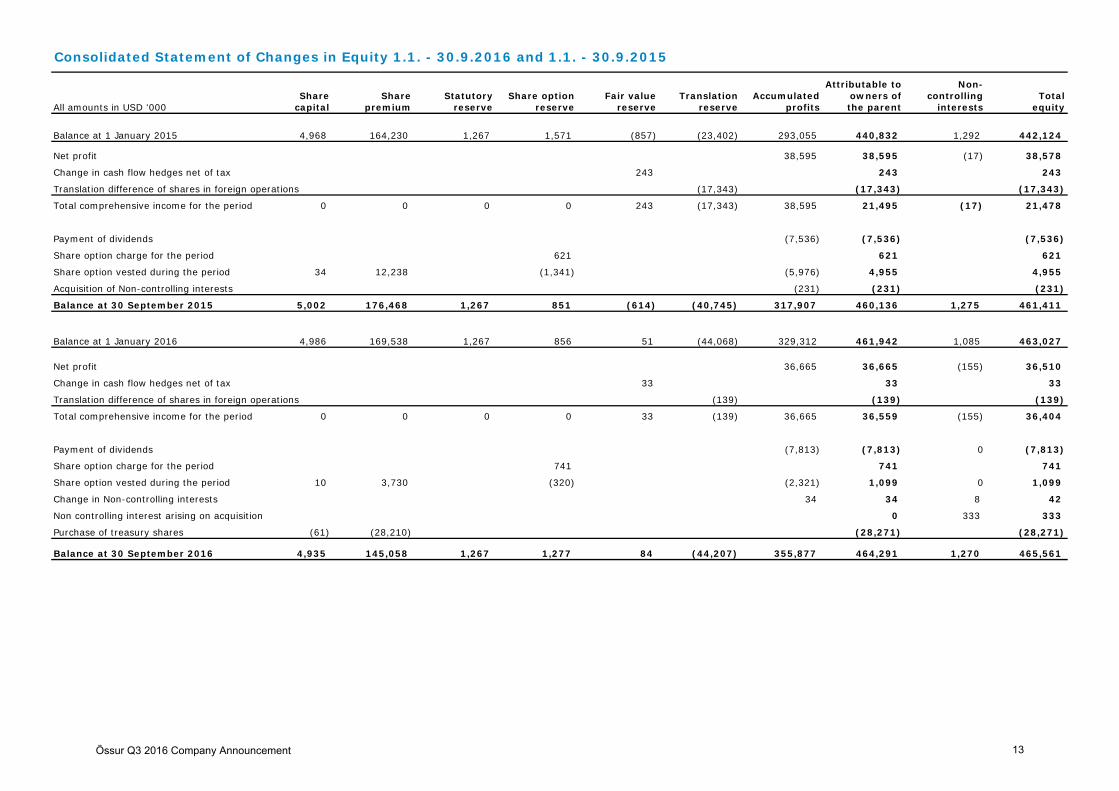
Consolidated Statement of Changes in Equity 1.1. - 30.9.2016 and 1.1. - 30.9.2015
Attributable to Non-Share Share Statutory Share option Fair value Translation Accumulated owners of controlling Total
All amounts in USD '000 capital premium reserve reserve reserve reserve profits the parent interests equity
Balance at 1 January 2015 4,968 164,230 1,267 1,571 (857) (23,402) 293,055 440,832 1,292 442,124
Net profit 38,595 38,595 (17) 38,578
Change in cash flow hedges net of tax 243 243 243
Translation difference of shares in foreign operations (17,343) (17,343) (17,343)
Total comprehensive income for the period 0 0 0 0 243 (17,343) 38,595 21,495 (17) 21,478
Payment of dividends (7,536) (7,536) (7,536)
Share option charge for the period 621 621 621
Share option vested during the period 34 12,238 (1,341) (5,976) 4,955 4,955
Acquisition of Non-controlling interests (231) (231) (231)
Balance at 30 September 2015 5,002 176,468 1,267 851 (614) (40,745) 317,907 460,136 1,275 461,411
Balance at 1 January 2016 4,986 169,538 1,267 856 51 (44,068) 329,312 461,942 1,085 463,027
Net profit 36,665 36,665 (155) 36,510
Change in cash flow hedges net of tax 33 33 33
Translation difference of shares in foreign operations (139) (139) (139)
Total comprehensive income for the period 0 0 0 0 33 (139) 36,665 36,559 (155) 36,404
Payment of dividends (7,813) (7,813) 0 (7,813)
Share option charge for the period 741 741 741
Share option vested during the period 10 3,730 (320) (2,321) 1,099 0 1,099
Change in Non-controlling interests 34 34 8 42
Non controlling interest arising on acquisition 0 333 333
Purchase of treasury shares (61) (28,210) (28,271) (28,271)
Balance at 30 September 2016 4,935 145,058 1,267 1,277 84 (44,207) 355,877 464,291 1,270 465,561
Össur Q3 2016 Company Announcement 13
Notes to the Consolidated Financial Statements
1. Summary of Significant Accounting Policies
1.1 Statement of compliance
1.2 Basis of preparation
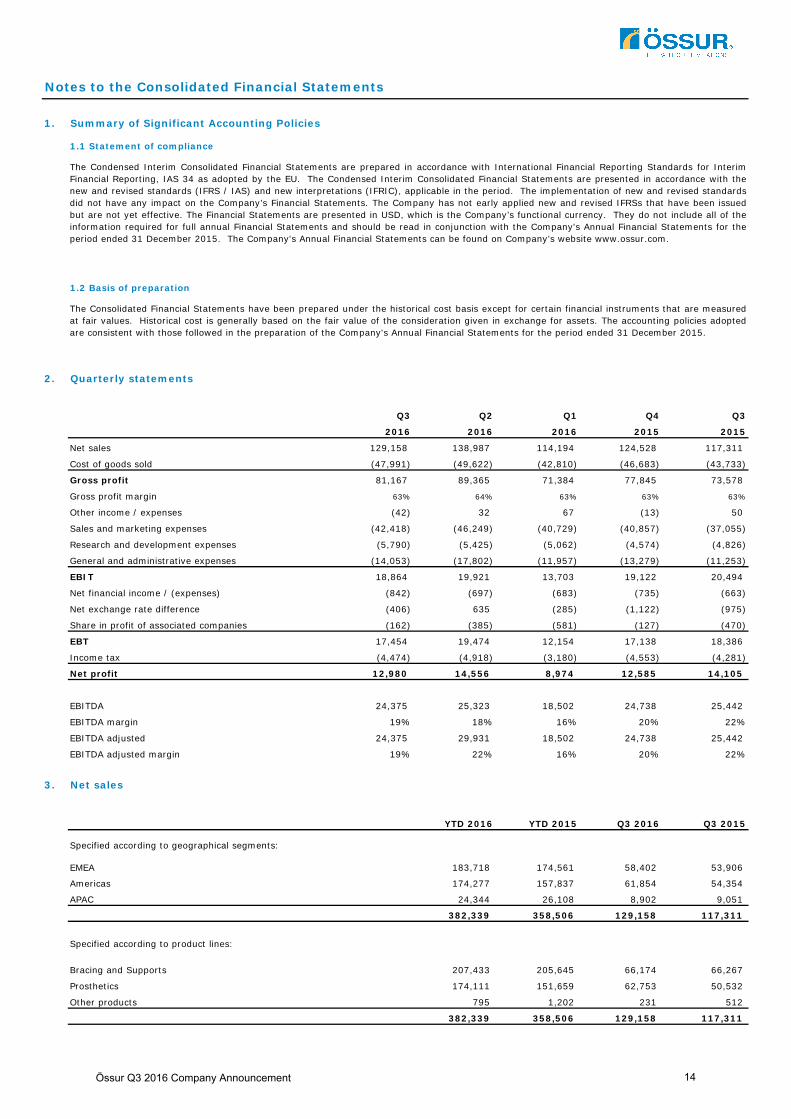
2. Quarterly statements
Q3 Q2 Q1 Q4 Q3
2016 2016 2016 2015 2015
Net sales 129,158 138,987 114,194 124,528 117,311
Cost of goods sold (47,991) (49,622) (42,810) (46,683) (43,733)
Gross profit 81,167 89,365 71,384 77,845 73,578
Gross profit margin 63% 64% 63% 63% 63%
Other income / expenses (42) 32 67 (13) 50
Sales and marketing expenses (42,418) (46,249) (40,729) (40,857) (37,055)
Research and development expenses (5,790) (5,425) (5,062) (4,574) (4,826)
General and administrative expenses (14,053) (17,802) (11,957) (13,279) (11,253)
EBIT 18,864 19,921 13,703 19,122 20,494
Net financial income / (expenses) (842) (697) (683) (735) (663)
Net exchange rate difference (406) 635 (285) (1,122) (975)
Share in profit of associated companies (162) (385) (581) (127) (470)
EBT 17,454 19,474 12,154 17,138 18,386
Income tax (4,474) (4,918) (3,180) (4,553) (4,281)
Net profit 12,980 14,556 8,974 12,585 14,105
EBITDA 24,375 25,323 18,502 24,738 25,442
EBITDA margin 19% 18% 16% 20% 22%
EBITDA adjusted 24,375 29,931 18,502 24,738 25,442
EBITDA adjusted margin 19% 22% 16% 20% 22%
3. Net sales
YTD 2016 YTD 2015 Q3 2016 Q3 2015
EMEA 183,718 174,561 58,402 53,906
Americas 174,277 157,837 61,854 54,354
APAC 24,344 26,108 8,902 9,051
382,339 358,506 129,158 117,311
Bracing and Supports 207,433 205,645 66,174 66,267
Prosthetics 174,111 151,659 62,753 50,532
Other products 795 1,202 231 512
382,339 358,506 129,158 117,311
The Condensed Interim Consolidated Financial Statements are prepared in accordance with International Financial Reporting Standards for InterimFinancial Reporting, IAS 34 as adopted by the EU. The Condensed Interim Consolidated Financial Statements are presented in accordance with thenew and revised standards (IFRS / IAS) and new interpretations (IFRIC), applicable in the period. The implementation of new and revised standardsdid not have any impact on the Company’s Financial Statements. The Company has not early applied new and revised IFRSs that have been issuedbut are not yet effective. The Financial Statements are presented in USD, which is the Company’s functional currency. They do not include all of theinformation required for full annual Financial Statements and should be read in conjunction with the Company's Annual Financial Statements for theperiod ended 31 December 2015. The Company's Annual Financial Statements can be found on Company’s website www.ossur.com.
The Consolidated Financial Statements have been prepared under the historical cost basis except for certain financial instruments that are measuredat fair values. Historical cost is generally based on the fair value of the consideration given in exchange for assets. The accounting policies adoptedare consistent with those followed in the preparation of the Company's Annual Financial Statements for the period ended 31 December 2015.
Specified according to product lines:
Specified according to geographical segments:
Össur Q3 2016 Company Announcement 14
Notes to the Consolidated Financial Statements
4. Sales and expenses split by main currencies
LCY USD % LCY USD %
Sales
USD 165,966 165,966 44% 58,803 58,803 46%
EUR 92,013 102,730 27% 30,039 33,537 26%
ISK 150,695 1,217 0% 46,857 396 0%
Nordic curr. (SEK, NOK, DKK) 53,763 14% 15,777 12%
Other (GBP, AUD, CAD & Other) 58,663 15% 20,645 16%
382,339 100% 129,158 100%
COGS and OPEX
USD 136,673 136,673 41% 47,924 47,924 44%
EUR 61,186 69,106 21% 21,114 24,375 22%
ISK 4,415,398 35,673 11% 1,427,374 12,080 11%
Nordic curr. (SEK, NOK, DKK) 50,593 15% 14,291 13%
Other (GBP, MXN, CAD & Other) 37,806 12% 11,624 10%
329,851 100% 110,294 100%
LCY USD % LCY USD %
Sales
USD 159,019 159,019 44% 58,154 58,154 50%
EUR 84,173 93,845 26% 25,120 27,937 24%
ISK 125,091 942 0% 38,841 296 0%
Nordic curr. (SEK, NOK, DKK) 52,580 15% 14,538 12%
Other (GBP, AUD, CAD & Other) 52,120 15% 16,386 14%
358,506 100% 117,311 100%
COGS and OPEX
USD 126,735 126,735 42% 41,062 41,062 43%
EUR 55,891 62,313 21% 16,566 18,423 19%
ISK 4,140,024 31,183 11% 1,286,159 9,808 10%
Nordic curr. (SEK, NOK, DKK) 51,908 17% 14,688 15%
Other (GBP, MXN, CAD & Other) 28,147 9% 12,836 13%
300,286 100% 96,817 100%
LCY amounts are translated at average exchange rates for relevant periods.
Currency split of newly acquired companies is done by using best available information at each time.
5. Financial income / (expenses)
YTD 2016 YTD 2015 Q3 2016 Q3 2015
496 154 249 64
96 108 26 79
Financial income 592 262 275 143
(1,970) (1,981) (729) (634)
(844) (534) (388) (172)
Financial expenses (2,814) (2,515) (1,117) (806)
(56) (3,760) (406) (975)
Net financial income / (expenses) (2,278) (6,013) (1,248) (1,638)
Other financial income
Interests on loans
Other financial expenses
Net exchange rate differences
Q3 2015
YTD 2016 Q3 2016
YTD 2015
Interests on bank deposits
Össur Q3 2016 Company Announcement 15
Notes to the Consolidated Financial Statements
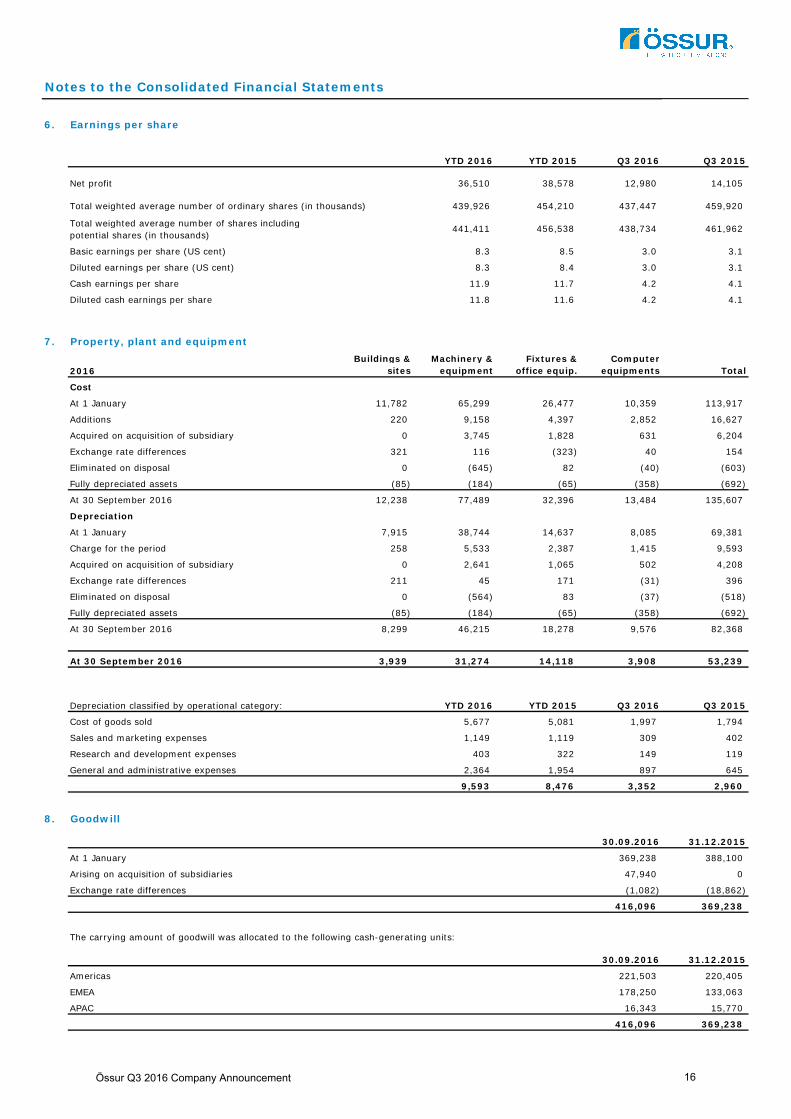
6. Earnings per share
YTD 2016 YTD 2015 Q3 2016 Q3 2015
36,510 38,578 12,980 14,105
Total weighted average number of ordinary shares (in thousands) 439,926 454,210 437,447 459,920
441,411 456,538 438,734 461,962
8.3 8.5 3.0 3.1
8.3 8.4 3.0 3.1
11.9 11.7 4.2 4.1
11.8 11.6 4.2 4.1
7. Property, plant and equipment
2016Buildings &
sitesMachinery &
equipmentFixtures &
office equip.Computer
equipments Total
Cost
At 1 January 11,782 65,299 26,477 10,359 113,917
Additions 220 9,158 4,397 2,852 16,627
Acquired on acquisition of subsidiary 0 3,745 1,828 631 6,204
Exchange rate differences 321 116 (323) 40 154
Eliminated on disposal 0 (645) 82 (40) (603)
Fully depreciated assets (85) (184) (65) (358) (692)
At 30 September 2016 12,238 77,489 32,396 13,484 135,607
Depreciation
At 1 January 7,915 38,744 14,637 8,085 69,381
Charge for the period 258 5,533 2,387 1,415 9,593
Acquired on acquisition of subsidiary 0 2,641 1,065 502 4,208
Exchange rate differences 211 45 171 (31) 396
Eliminated on disposal 0 (564) 83 (37) (518)
Fully depreciated assets (85) (184) (65) (358) (692)
At 30 September 2016 8,299 46,215 18,278 9,576 82,368
At 30 September 2016 3,939 31,274 14,118 3,908 53,239
Depreciation classified by operational category: YTD 2016 YTD 2015 Q3 2016 Q3 2015
Cost of goods sold 5,677 5,081 1,997 1,794
Sales and marketing expenses 1,149 1,119 309 402
Research and development expenses 403 322 149 119
General and administrative expenses 2,364 1,954 897 645
9,593 8,476 3,352 2,960
8. Goodwill
30.09.2016 31.12.2015
At 1 January 369,238 388,100
Arising on acquisition of subsidiaries 47,940 0
Exchange rate differences (1,082) (18,862)
416,096 369,238
The carrying amount of goodwill was allocated to the following cash-generating units:
30.09.2016 31.12.2015
Americas 221,503 220,405
EMEA 178,250 133,063
APAC 16,343 15,770
416,096 369,238
Diluted earnings per share (US cent)
Total weighted average number of shares including potential shares (in thousands)
Cash earnings per share
Diluted cash earnings per share
Net profit
Basic earnings per share (US cent)
Össur Q3 2016 Company Announcement 16
Notes to the Consolidated Financial Statements
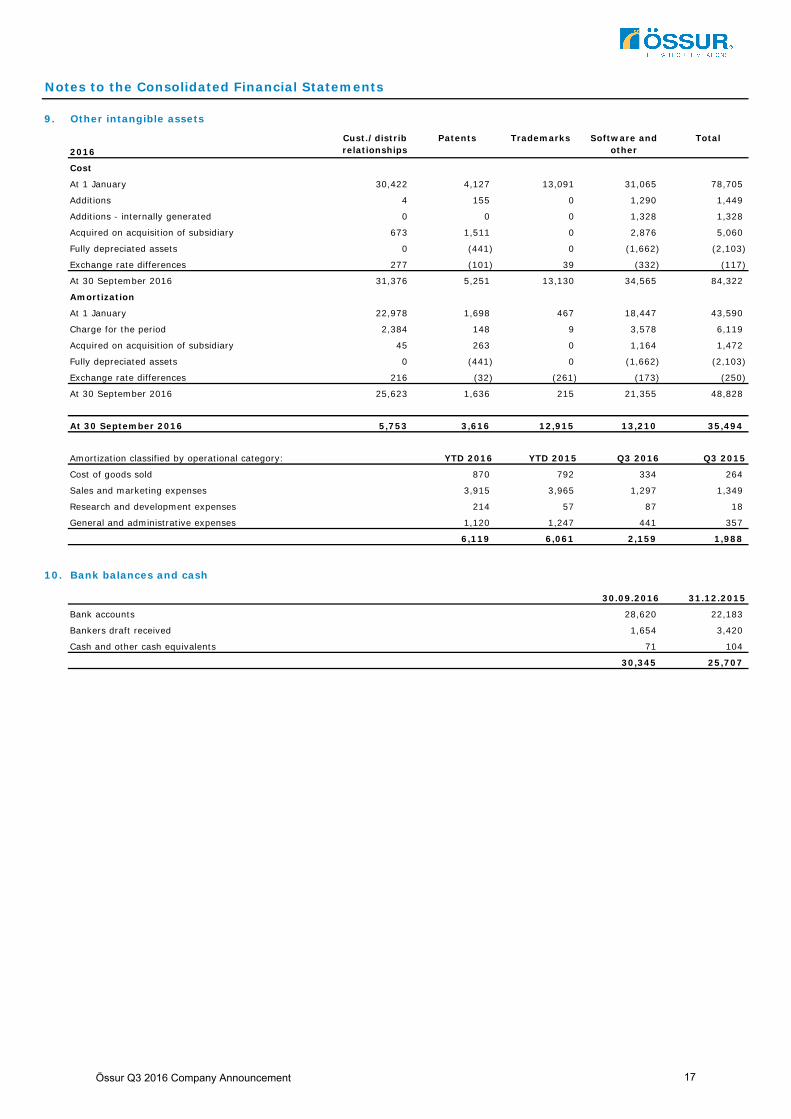
9. Other intangible assets
2016Cust./distrib relationships
Patents Trademarks Software and other
Total
Cost
At 1 January 30,422 4,127 13,091 31,065 78,705
Additions 4 155 0 1,290 1,449
Additions - internally generated 0 0 0 1,328 1,328
Acquired on acquisition of subsidiary 673 1,511 0 2,876 5,060
Fully depreciated assets 0 (441) 0 (1,662) (2,103)
Exchange rate differences 277 (101) 39 (332) (117)
At 30 September 2016 31,376 5,251 13,130 34,565 84,322
Amortization
At 1 January 22,978 1,698 467 18,447 43,590
Charge for the period 2,384 148 9 3,578 6,119
Acquired on acquisition of subsidiary 45 263 0 1,164 1,472
Fully depreciated assets 0 (441) 0 (1,662) (2,103)
Exchange rate differences 216 (32) (261) (173) (250)
At 30 September 2016 25,623 1,636 215 21,355 48,828
At 30 September 2016 5,753 3,616 12,915 13,210 35,494
Amortization classified by operational category: YTD 2016 YTD 2015 Q3 2016 Q3 2015
Cost of goods sold 870 792 334 264
Sales and marketing expenses 3,915 3,965 1,297 1,349
Research and development expenses 214 57 87 18
General and administrative expenses 1,120 1,247 441 357
6,119 6,061 2,159 1,988
10. Bank balances and cash
30.09.2016 31.12.2015
Bank accounts 28,620 22,183
Bankers draft received 1,654 3,420
Cash and other cash equivalents 71 104
30,345 25,707
Össur Q3 2016 Company Announcement 17
Notes to the Consolidated Financial Statements
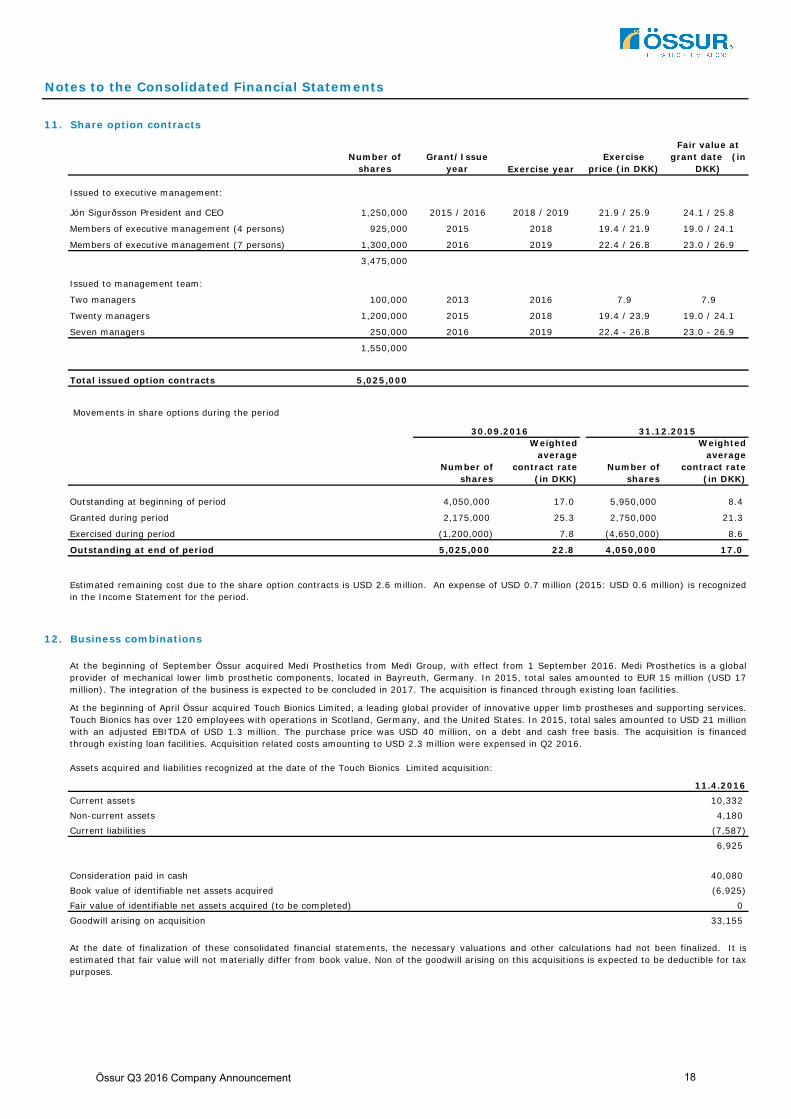
11. Share option contracts
Number of shares
Grant/Issue year Exercise year
Exercise price (in DKK)
Fair value at grant date (in
DKK)
Issued to executive management:
Jón Sigurðsson President and CEO 1,250,000 2015 / 2016 2018 / 2019 21.9 / 25.9 24.1 / 25.8
Members of executive management (4 persons) 925,000 2015 2018 19.4 / 21.9 19.0 / 24.1
Members of executive management (7 persons) 1,300,000 2016 2019 22.4 / 26.8 23.0 / 26.9
3,475,000
Issued to management team:
Two managers 100,000 2013 2016 7.9 7.9
Twenty managers 1,200,000 2015 2018 19.4 / 23.9 19.0 / 24.1
Seven managers 250,000 2016 2019 22.4 - 26.8 23.0 - 26.9
1,550,000
Total issued option contracts 5,025,000
Movements in share options during the period
Number of shares
Weighted average
contract rate (in DKK)
Number of shares
Weighted average
contract rate (in DKK)
4,050,000 17.0 5,950,000 8.4
2,175,000 25.3 2,750,000 21.3
(1,200,000) 7.8 (4,650,000) 8.6
5,025,000 22.8 4,050,000 17.0
12. Business combinations
11.4.2016Current assets 10,332 Non-current assets 4,180 Current liabilities (7,587)
6,925
Consideration paid in cash 40,080 Book value of identifiable net assets acquired (6,925)Fair value of identifiable net assets acquired (to be completed) 0 Goodwill arising on acquisition 33,155
Outstanding at end of period
Granted during period
Exercised during period
Estimated remaining cost due to the share option contracts is USD 2.6 million. An expense of USD 0.7 million (2015: USD 0.6 million) is recognizedin the Income Statement for the period.
30.09.2016 31.12.2015
Outstanding at beginning of period
At the beginning of April Össur acquired Touch Bionics Limited, a leading global provider of innovative upper limb prostheses and supporting services.Touch Bionics has over 120 employees with operations in Scotland, Germany, and the United States. In 2015, total sales amounted to USD 21 millionwith an adjusted EBITDA of USD 1.3 million. The purchase price was USD 40 million, on a debt and cash free basis. The acquisition is financedthrough existing loan facilities. Acquisition related costs amounting to USD 2.3 million were expensed in Q2 2016.
Assets acquired and liabilities recognized at the date of the Touch Bionics Limited acquisition:
At the date of finalization of these consolidated financial statements, the necessary valuations and other calculations had not been finalized. It isestimated that fair value will not materially differ from book value. Non of the goodwill arising on this acquisitions is expected to be deductible for taxpurposes.
At the beginning of September Össur acquired Medi Prosthetics from Medi Group, with effect from 1 September 2016. Medi Prosthetics is a globalprovider of mechanical lower limb prosthetic components, located in Bayreuth, Germany. In 2015, total sales amounted to EUR 15 million (USD 17million). The integration of the business is expected to be concluded in 2017. The acquisition is financed through existing loan facilities.
Össur Q3 2016 Company Announcement 18


![Announces Q3 results [Result]](https://img.pdfslide.net/doc/110x75/577ca58e1a28abea748b9591/announces-q3-results-result.jpg)