Embed Size (px)
Citation preview
St. Lawrence County Agricultural Development Plan
Draft Elements for Public Comment December 30, 2015
Send your comments to:
Keith J. Zimmerman, Director St. Lawrence County Planning Office 48 Court Street ▪ Canton, NY 13617
Tel: (315) 379-2292 Fax: (315) 379-2252
Acknowledgements:Project SponsorsProject Contributors
Section: Pages:Economic Profile 1 to 7Land Analysis 8 to 12Public Forums 13 to 23Online Survey Analysis toGoals and Strategies toBibliography toAppendix to
St. Lawrence CountyAgricultural Development Plan
Draft Elements as of December 30, 2015
Table of Contents
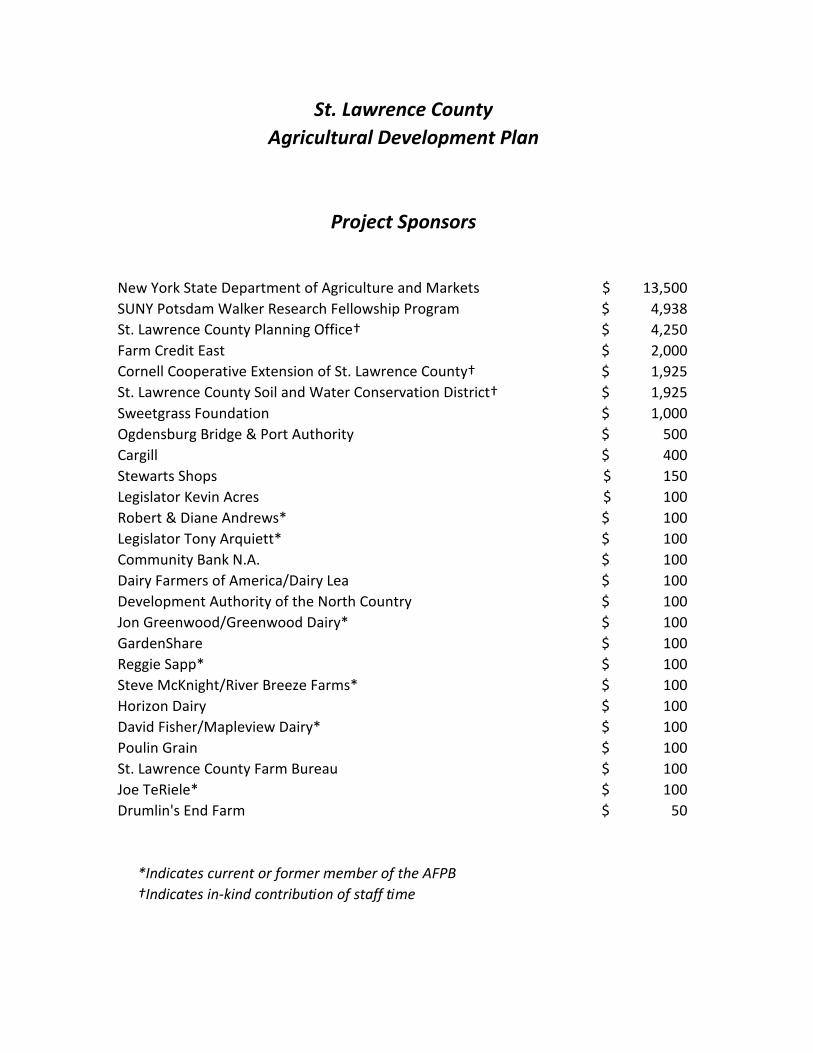
New York State Department of Agriculture and Markets 13,500$ SUNY Potsdam Walker Research Fellowship Program 4,938$ St. Lawrence County Planning Office† 4,250$ Farm Credit East 2,000$ Cornell Cooperative Extension of St. Lawrence County† 1,925$ St. Lawrence County Soil and Water Conservation District† 1,925$ Sweetgrass Foundation 1,000$ Ogdensburg Bridge & Port Authority 500$ Cargill 400$ Stewarts Shops 150$ Legislator Kevin Acres 100$ Robert & Diane Andrews* 100$ Legislator Tony Arquiett* 100$ Community Bank N.A. 100$ Dairy Farmers of America/Dairy Lea 100$ Development Authority of the North Country 100$ Jon Greenwood/Greenwood Dairy* 100$ GardenShare 100$ Reggie Sapp* 100$ Steve McKnight/River Breeze Farms* 100$ Horizon Dairy 100$ David Fisher/Mapleview Dairy* 100$ Poulin Grain 100$ St. Lawrence County Farm Bureau 100$ Joe TeRiele* 100$ Drumlin's End Farm 50$
*Indicates current or former member of the AFPB†Indicates in-kind contribution of staff time
St. Lawrence CountyAgricultural Development Plan
Project Sponsors
St. Lawrence County Agricultural Development Plan
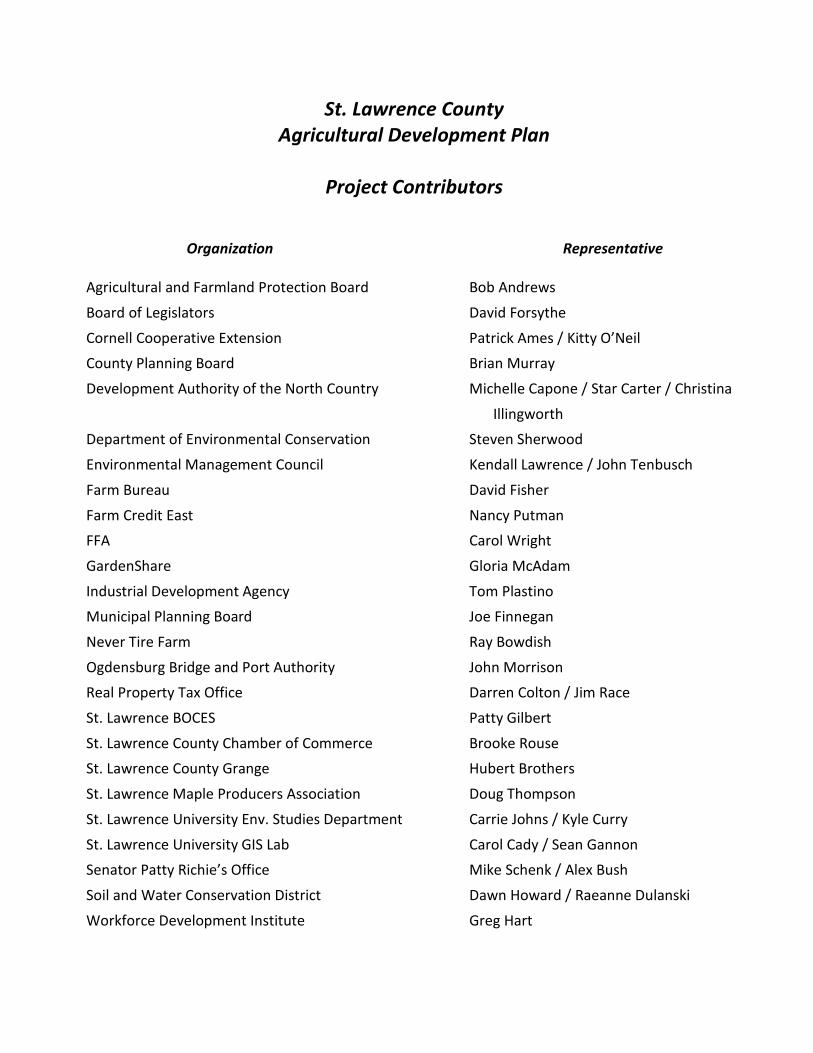
Project Contributors
Organization Representative
Agricultural and Farmland Protection Board Bob Andrews
Board of Legislators David Forsythe
Cornell Cooperative Extension Patrick Ames / Kitty O’Neil
County Planning Board Brian Murray
Development Authority of the North Country Michelle Capone / Star Carter / Christina
Illingworth Department of Environmental Conservation Steven Sherwood
Environmental Management Council Kendall Lawrence / John Tenbusch
Farm Bureau David Fisher
Farm Credit East Nancy Putman FFA Carol Wright
GardenShare Gloria McAdam
Industrial Development Agency Tom Plastino Municipal Planning Board Joe Finnegan
Never Tire Farm Ray Bowdish
Ogdensburg Bridge and Port Authority John Morrison
Real Property Tax Office Darren Colton / Jim Race
St. Lawrence BOCES Patty Gilbert
St. Lawrence County Chamber of Commerce Brooke Rouse
St. Lawrence County Grange Hubert Brothers
St. Lawrence Maple Producers Association Doug Thompson
St. Lawrence University Env. Studies Department Carrie Johns / Kyle Curry
St. Lawrence University GIS Lab Carol Cady / Sean Gannon
Senator Patty Richie’s Office Mike Schenk / Alex Bush
Soil and Water Conservation District Dawn Howard / Raeanne Dulanski
Workforce Development Institute Greg Hart
1
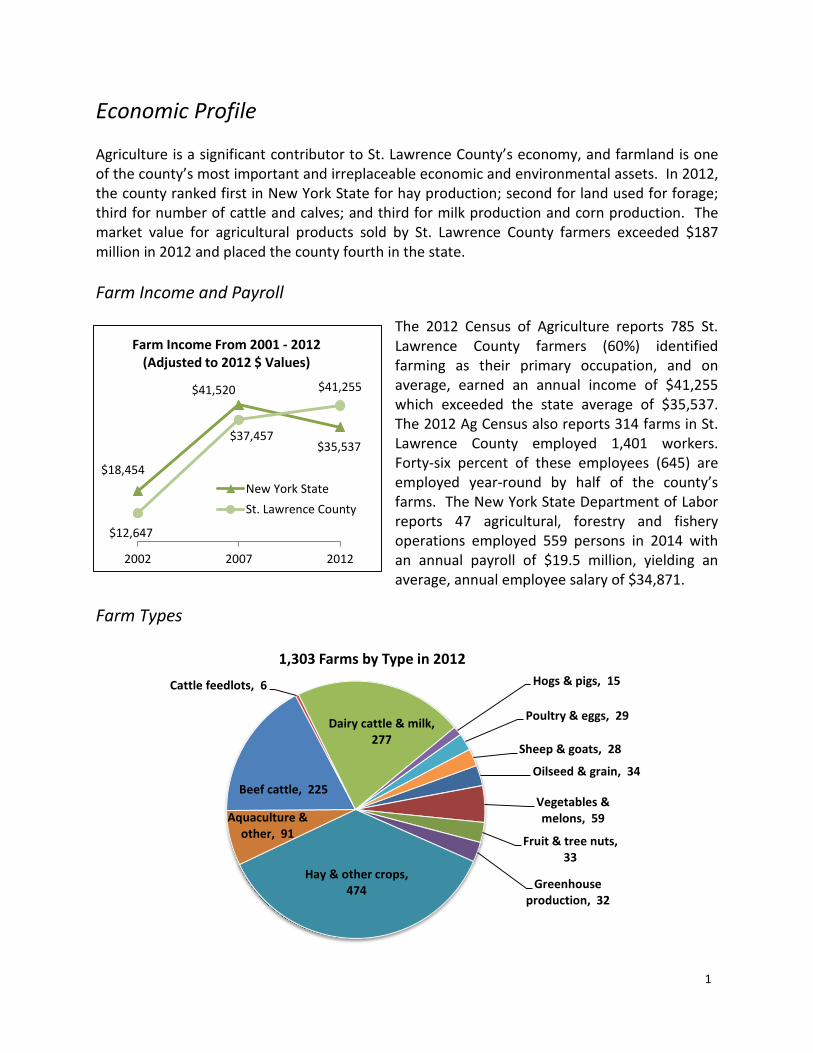
Economic Profile Agriculture is a significant contributor to St. Lawrence County’s economy, and farmland is one of the county’s most important and irreplaceable economic and environmental assets. In 2012, the county ranked first in New York State for hay production; second for land used for forage; third for number of cattle and calves; and third for milk production and corn production. The market value for agricultural products sold by St. Lawrence County farmers exceeded $187 million in 2012 and placed the county fourth in the state. Farm Income and Payroll
The 2012 Census of Agriculture reports 785 St. Lawrence County farmers (60%) identified farming as their primary occupation, and on average, earned an annual income of $41,255 which exceeded the state average of $35,537. The 2012 Ag Census also reports 314 farms in St. Lawrence County employed 1,401 workers. Forty-six percent of these employees (645) are employed year-round by half of the county’s farms. The New York State Department of Labor reports 47 agricultural, forestry and fishery operations employed 559 persons in 2014 with an annual payroll of $19.5 million, yielding an average, annual employee salary of $34,871.
Farm Types
Oilseed & grain, 34
Vegetables & melons, 59
Fruit & tree nuts, 33
Greenhouse production, 32
Hay & other crops, 474
Aquaculture & other, 91
Beef cattle, 225
Cattle feedlots, 6
Dairy cattle & milk, 277
Hogs & pigs, 15
Poultry & eggs, 29
Sheep & goats, 28
1,303 Farms by Type in 2012
$18,454
$41,520
$35,537
$12,647
$37,457
$41,255
2002 2007 2012
Farm Income From 2001 - 2012 (Adjusted to 2012 $ Values)
New York StateSt. Lawrence County
2
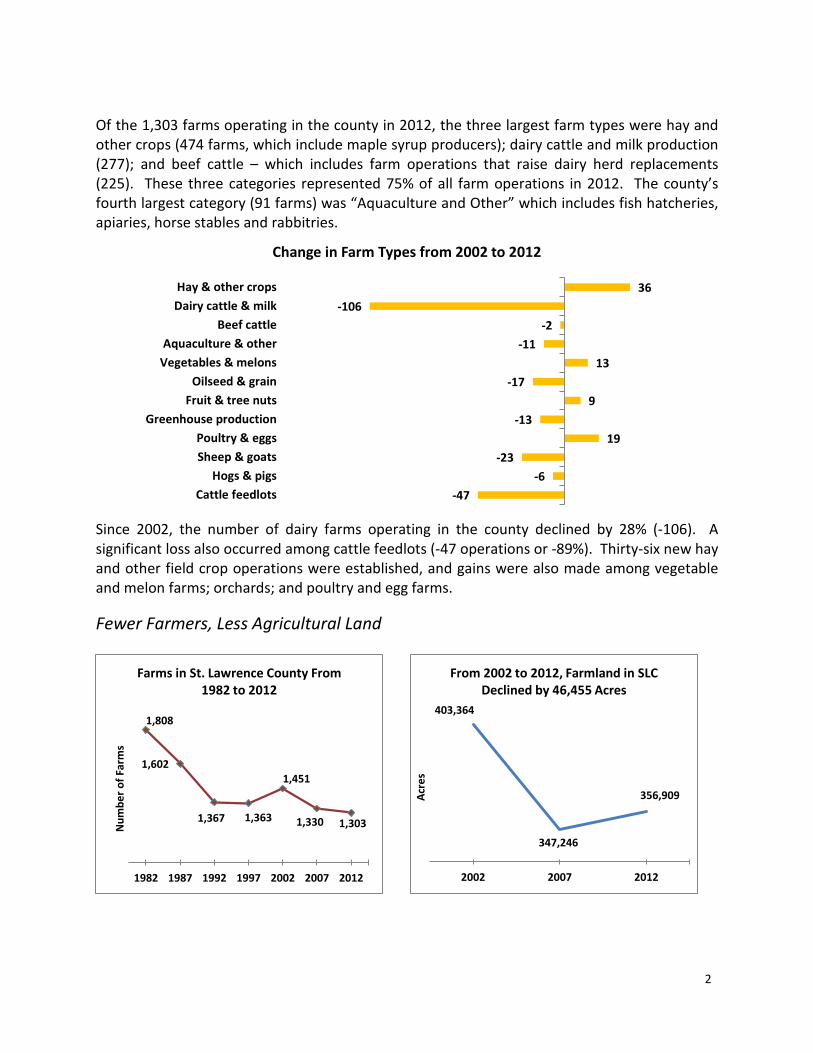
Of the 1,303 farms operating in the county in 2012, the three largest farm types were hay and other crops (474 farms, which include maple syrup producers); dairy cattle and milk production (277); and beef cattle – which includes farm operations that raise dairy herd replacements (225). These three categories represented 75% of all farm operations in 2012. The county’s fourth largest category (91 farms) was “Aquaculture and Other” which includes fish hatcheries, apiaries, horse stables and rabbitries.
Since 2002, the number of dairy farms operating in the county declined by 28% (-106). A significant loss also occurred among cattle feedlots (-47 operations or -89%). Thirty-six new hay and other field crop operations were established, and gains were also made among vegetable and melon farms; orchards; and poultry and egg farms.
Fewer Farmers, Less Agricultural Land
36 -106
-2 -11
13 -17
9 -13
19 -23
-6 -47
Hay & other cropsDairy cattle & milk
Beef cattleAquaculture & other
Vegetables & melonsOilseed & grain
Fruit & tree nutsGreenhouse production
Poultry & eggsSheep & goats
Hogs & pigsCattle feedlots
Change in Farm Types from 2002 to 2012
1,808
1,602
1,367 1,363
1,451
1,330 1,303
1982 1987 1992 1997 2002 2007 2012
Num
ber o
f Far
ms
Farms in St. Lawrence County From 1982 to 2012
403,364
347,246
356,909
2002 2007 2012
Acre
s
From 2002 to 2012, Farmland in SLC Declined by 46,455 Acres
3
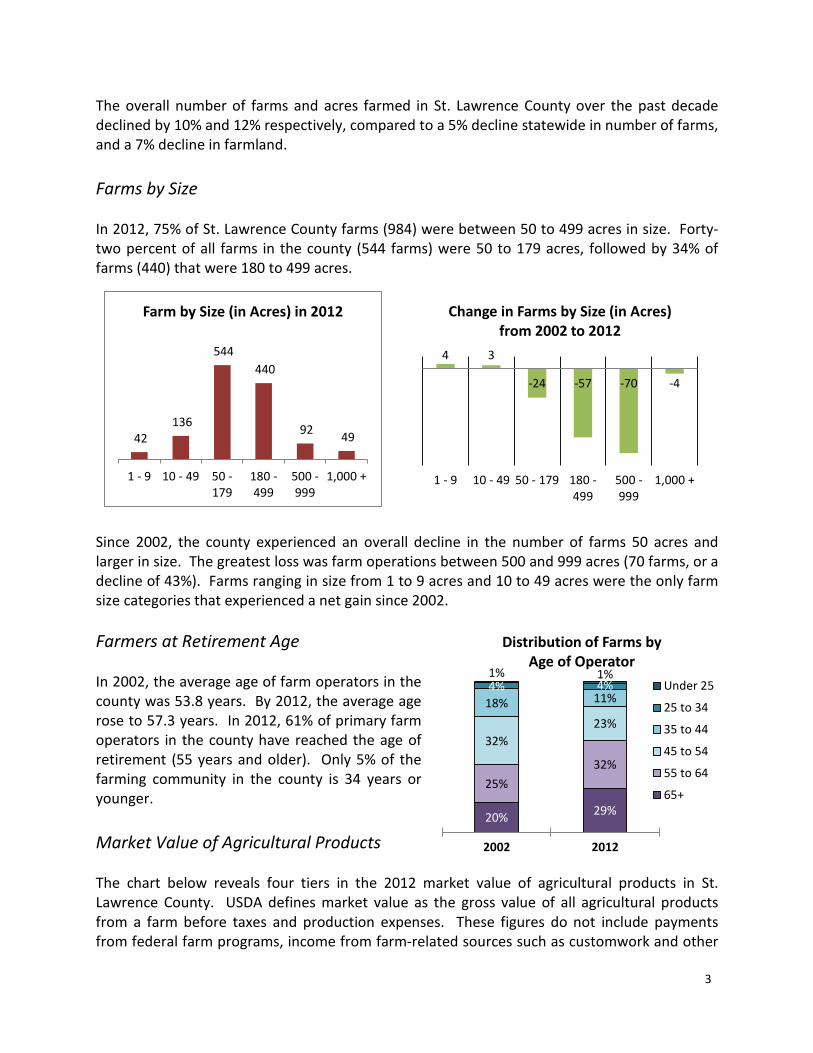
The overall number of farms and acres farmed in St. Lawrence County over the past decade declined by 10% and 12% respectively, compared to a 5% decline statewide in number of farms, and a 7% decline in farmland. Farms by Size In 2012, 75% of St. Lawrence County farms (984) were between 50 to 499 acres in size. Forty-two percent of all farms in the county (544 farms) were 50 to 179 acres, followed by 34% of farms (440) that were 180 to 499 acres.
Since 2002, the county experienced an overall decline in the number of farms 50 acres and larger in size. The greatest loss was farm operations between 500 and 999 acres (70 farms, or a decline of 43%). Farms ranging in size from 1 to 9 acres and 10 to 49 acres were the only farm size categories that experienced a net gain since 2002. Farmers at Retirement Age In 2002, the average age of farm operators in the county was 53.8 years. By 2012, the average age rose to 57.3 years. In 2012, 61% of primary farm operators in the county have reached the age of retirement (55 years and older). Only 5% of the farming community in the county is 34 years or younger. Market Value of Agricultural Products The chart below reveals four tiers in the 2012 market value of agricultural products in St. Lawrence County. USDA defines market value as the gross value of all agricultural products from a farm before taxes and production expenses. These figures do not include payments from federal farm programs, income from farm-related sources such as customwork and other
42 136
544 440
92 49
1 - 9 10 - 49 50 -179
180 -499
500 -999
1,000 +
Farm by Size (in Acres) in 2012
4 3
-24 -57 -70 -4
1 - 9 10 - 49 50 - 179 180 -499
500 -999
1,000 +
Change in Farms by Size (in Acres) from 2002 to 2012
20% 29%
25% 32%
32% 23%
18% 11% 4% 4% 1% 1%
2002 2012
Distribution of Farms by Age of Operator
Under 25
25 to 34
35 to 44
45 to 54
55 to 64
65+
4
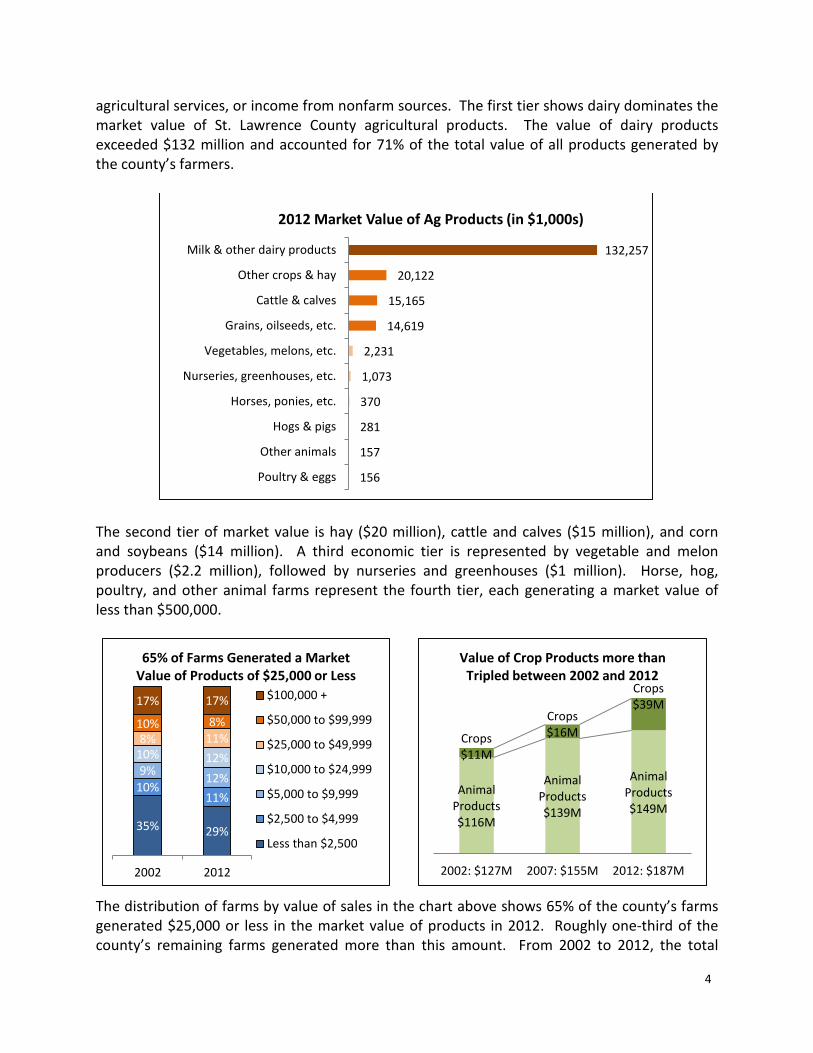
agricultural services, or income from nonfarm sources. The first tier shows dairy dominates the market value of St. Lawrence County agricultural products. The value of dairy products exceeded $132 million and accounted for 71% of the total value of all products generated by the county’s farmers.
The second tier of market value is hay ($20 million), cattle and calves ($15 million), and corn and soybeans ($14 million). A third economic tier is represented by vegetable and melon producers ($2.2 million), followed by nurseries and greenhouses ($1 million). Horse, hog, poultry, and other animal farms represent the fourth tier, each generating a market value of less than $500,000.
The distribution of farms by value of sales in the chart above shows 65% of the county’s farms generated $25,000 or less in the market value of products in 2012. Roughly one-third of the county’s remaining farms generated more than this amount. From 2002 to 2012, the total
156
157
281
370
1,073
2,231
14,619
15,165
20,122
132,257
Poultry & eggs
Other animals
Hogs & pigs
Horses, ponies, etc.
Nurseries, greenhouses, etc.
Vegetables, melons, etc.
Grains, oilseeds, etc.
Cattle & calves
Other crops & hay
Milk & other dairy products
2012 Market Value of Ag Products (in $1,000s)
35% 29%
10% 11%
9% 12%
10% 12% 8% 11%
10% 8%
17% 17%
2002 2012
65% of Farms Generated a Market Value of Products of $25,000 or Less
$100,000 +
$50,000 to $99,999
$25,000 to $49,999
$10,000 to $24,999
$5,000 to $9,999
$2,500 to $4,999
Less than $2,500
Animal Products $116M
Animal Products $139M
Animal Products $149M
Crops $11M
Crops $16M
Crops $39M
2002: $127M 2007: $155M 2012: $187M
Value of Crop Products more than Tripled between 2002 and 2012
5
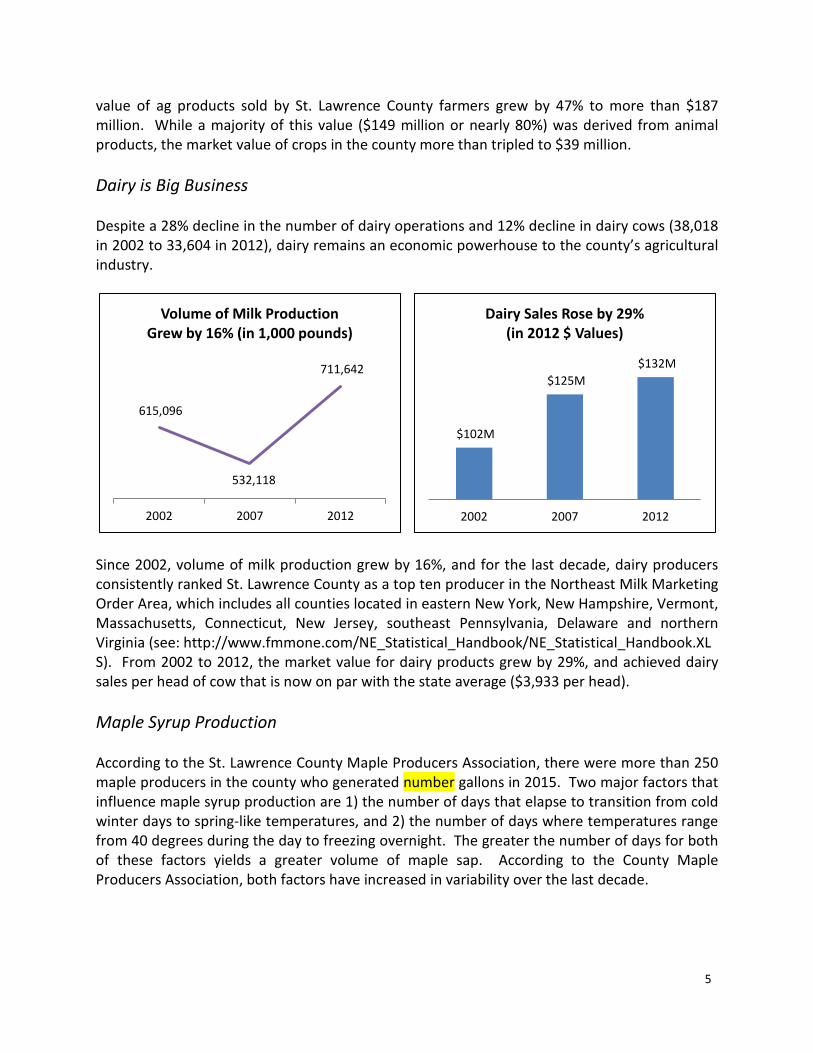
value of ag products sold by St. Lawrence County farmers grew by 47% to more than $187 million. While a majority of this value ($149 million or nearly 80%) was derived from animal products, the market value of crops in the county more than tripled to $39 million. Dairy is Big Business Despite a 28% decline in the number of dairy operations and 12% decline in dairy cows (38,018 in 2002 to 33,604 in 2012), dairy remains an economic powerhouse to the county’s agricultural industry.
Since 2002, volume of milk production grew by 16%, and for the last decade, dairy producers consistently ranked St. Lawrence County as a top ten producer in the Northeast Milk Marketing Order Area, which includes all counties located in eastern New York, New Hampshire, Vermont, Massachusetts, Connecticut, New Jersey, southeast Pennsylvania, Delaware and northern Virginia (see: http://www.fmmone.com/NE_Statistical_Handbook/NE_Statistical_Handbook.XL S). From 2002 to 2012, the market value for dairy products grew by 29%, and achieved dairy sales per head of cow that is now on par with the state average ($3,933 per head). Maple Syrup Production According to the St. Lawrence County Maple Producers Association, there were more than 250 maple producers in the county who generated number gallons in 2015. Two major factors that influence maple syrup production are 1) the number of days that elapse to transition from cold winter days to spring-like temperatures, and 2) the number of days where temperatures range from 40 degrees during the day to freezing overnight. The greater the number of days for both of these factors yields a greater volume of maple sap. According to the County Maple Producers Association, both factors have increased in variability over the last decade.
615,096
532,118
711,642
2002 2007 2012
Volume of Milk Production Grew by 16% (in 1,000 pounds)
$102M
$125M $132M
2002 2007 2012
Dairy Sales Rose by 29% (in 2012 $ Values)
6
Organic Farm Operations In 2014, New York State ranked third in the United States for number of certified and exempt organic farms (917 out of 14,093 farms). The most current county-level data for organic farming comes from the 2012 Ag Census, which reported 981 (certified and exempt) organic farm operations in the State. Sixty-one of these farms are in St. Lawrence County – the 2nd highest of any county in the state – and generated more than $7 million in value of organic sales. While the distribution of organic farms by farm type is not available at the county level, data for New York State show 28% of organic producers cultivate hay and other crops, and an additional 28% raise beef cattle. Eighteen percent raise other animals such as bison, fish, bees and rabbits, and 11% grow fruit and tree nuts. Based on USDA’s 2014 Organic Survey, 72% of organic sales in New York were through wholesale channels including processors, millers and packers, and organic cooperatives. Twenty-three percent of organic sales in New York are direct to consumer through farm stands, farmers’ markets, Community Supported Agriculture (CSAs) or other similar arrangements. The remaining 5% were direct to retail or institutions such as natural food stores, supermarkets, restaurants, universities and hospitals. The first point of sales for 57% of New York organic producers is within 100 miles of their farm operation. The first point of sales for 40% of state organic producers is sold regionally (101 - 500 miles), and 3% of farmers sell nationally (further than 500 miles). An assumption is made that a similar distribution of sales exists for organic operators in St. Lawrence County. Amish Population A distinguishing characteristic of the county’s farming industry is the presence of Amish households and farms that are found across its landscape. The Young Center for Anabaptist and Pietist Studies at Elizabethtown College in Pennsylvania estimates New York’s Amish population grew by 44% (5,265 persons) from 2010 to 2015, and is now home to 17,280 Amish residents (http://groups.etown.edu/amishstudies/statistics/population-by-state/). The 2010 US Religion Census commissioned by the Association of Statisticians of American Religious Bodies provides a county-by-county enumeration of religious practices in the US. This survey reported St. Lawrence County was home to 13 Amish congregations with 1,840 adherents, the highest number of any county in New York. Based on this data, an Ohio State University publication ranked St. Lawrence County 24th in the US for largest Amish population. This report also calculated the Village of Heuvelton’s surrounding Amish community to include 11 Amish church districts where 1,671 Amish persons reside, and ranked it the 16th largest Amish community in the nation. The Young Center identifies six factors that influence new Amish settlement growth: 1) fertile farmland at reasonable prices; 2) non-farm work in specialized occupations; 3) rural isolation that supports their traditional, family-based lifestyle; 4) environment that is conducive to their
7
way of life; 5) proximity to family and other similar Amish church groups, and 6) a successful method that is used to resolve church or leadership conflicts.
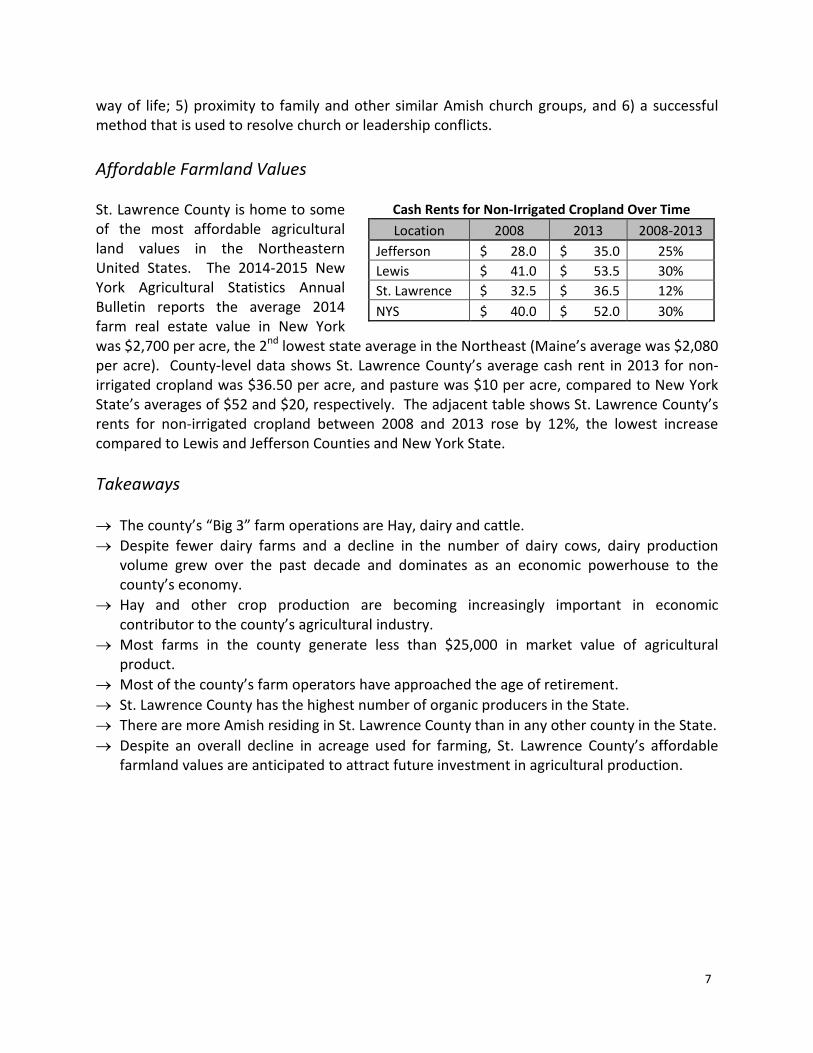
Affordable Farmland Values St. Lawrence County is home to some of the most affordable agricultural land values in the Northeastern United States. The 2014-2015 New York Agricultural Statistics Annual Bulletin reports the average 2014 farm real estate value in New York was $2,700 per acre, the 2nd lowest state average in the Northeast (Maine’s average was $2,080 per acre). County-level data shows St. Lawrence County’s average cash rent in 2013 for non-irrigated cropland was $36.50 per acre, and pasture was $10 per acre, compared to New York State’s averages of $52 and $20, respectively. The adjacent table shows St. Lawrence County’s rents for non-irrigated cropland between 2008 and 2013 rose by 12%, the lowest increase compared to Lewis and Jefferson Counties and New York State. Takeaways → The county’s “Big 3” farm operations are Hay, dairy and cattle. → Despite fewer dairy farms and a decline in the number of dairy cows, dairy production
volume grew over the past decade and dominates as an economic powerhouse to the county’s economy.
→ Hay and other crop production are becoming increasingly important in economic contributor to the county’s agricultural industry.
→ Most farms in the county generate less than $25,000 in market value of agricultural product.
→ Most of the county’s farm operators have approached the age of retirement. → St. Lawrence County has the highest number of organic producers in the State. → There are more Amish residing in St. Lawrence County than in any other county in the State. → Despite an overall decline in acreage used for farming, St. Lawrence County’s affordable
farmland values are anticipated to attract future investment in agricultural production.
Cash Rents for Non-Irrigated Cropland Over Time Location 2008 2013 2008-2013
Jefferson $ 28.0 $ 35.0 25% Lewis $ 41.0 $ 53.5 30% St. Lawrence $ 32.5 $ 36.5 12% NYS $ 40.0 $ 52.0 30%
8
Land Analysis To quantify the availability of farmland that is suitable for cultivation, the USDA Natural Resources Conservation Service (NRCS) categorizes soil into eight classes. The lower the soil class, the more suitable the soil is for agricultural production; the higher the soil class number, the severity of limitations increases. Soil classes are also grouped into two categories to indicate cultivation suitability. Soil classes 1 to 4 are suitable for cultivation, while classes 5 to 8 are not. Locations that are not assigned a soil class are often identified as urban areas, gravel and sand pits or quarries, and reservoir dams.
Soils Suitable for Cultivation:
Class 1 Few limitations that restrict use Class 2 Some limitations that reduce choice of plants or require moderate conservation practices Class 3 Severe limitations that reduce choice of plants, or require special conservation practices,
or both Class 4 Very severe limitations that restrict choice of plants, or require very careful management,
or both
Soils Not Suitable for Cultivation:
Class 5 Little or no erosion hazard, but other limitations that are impractical to remove and limit their use mainly to pasture, range, forestland, or wildlife food and cover
Class 6 Severe limitations and generally unsuitable for cultivation, and limit their use mainly to pasture, range, forestland, or wildlife food and cover
Class 7 Very severe limitations and unsuitable for cultivation, and restrict their use mainly to grazing, forestland, or wildlife
Class 8 Limitations that preclude use for commercial crop production and restricted in use to recreation, wildlife, or water supply or for esthetic purposes
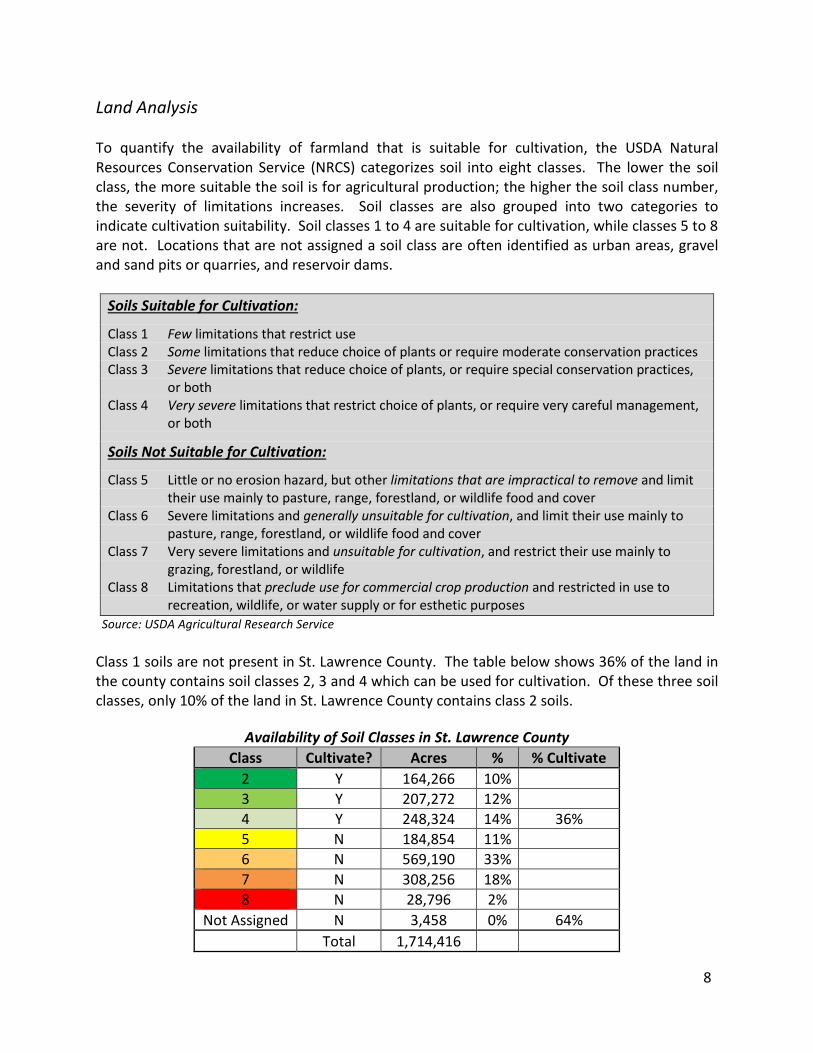
Source: USDA Agricultural Research Service Class 1 soils are not present in St. Lawrence County. The table below shows 36% of the land in the county contains soil classes 2, 3 and 4 which can be used for cultivation. Of these three soil classes, only 10% of the land in St. Lawrence County contains class 2 soils.
Availability of Soil Classes in St. Lawrence County Class Cultivate? Acres % % Cultivate
2 Y 164,266 10% 3 Y 207,272 12% 4 Y 248,324 14% 36%
5 N 184,854 11% 6 N 569,190 33% 7 N 308,256 18% 8 N 28,796 2% Not Assigned N 3,458 0% 64%
Total 1,714,416
9
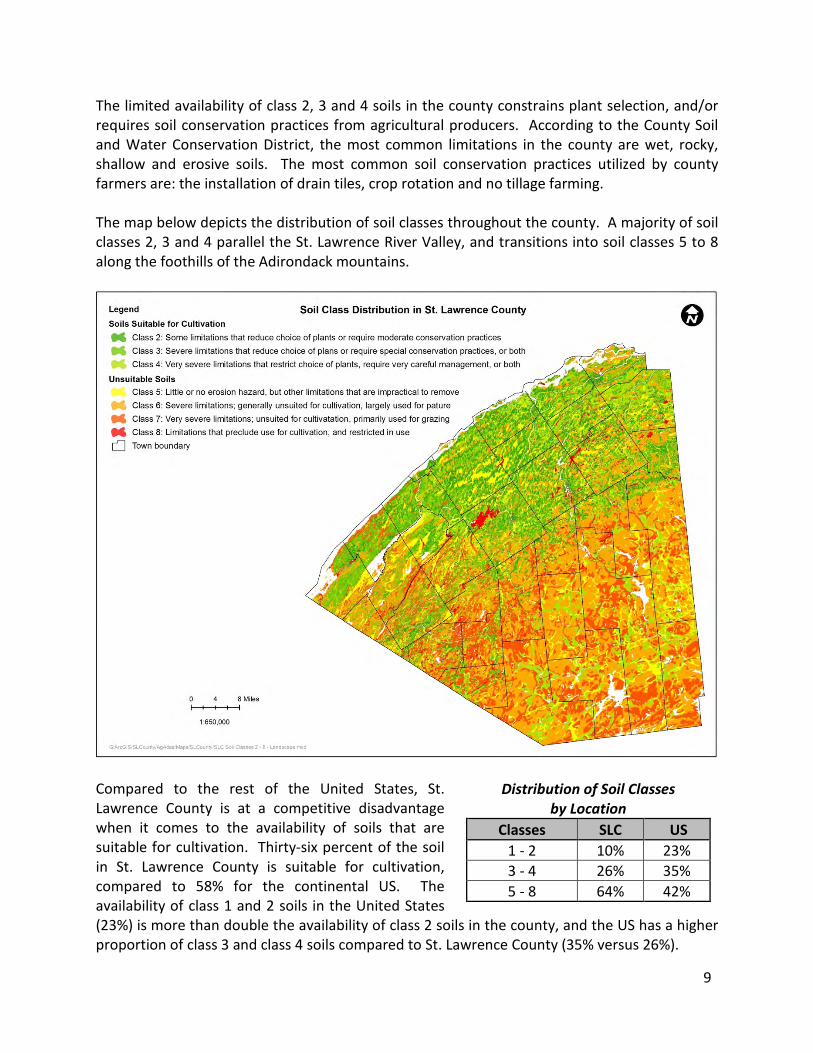
The limited availability of class 2, 3 and 4 soils in the county constrains plant selection, and/or requires soil conservation practices from agricultural producers. According to the County Soil and Water Conservation District, the most common limitations in the county are wet, rocky, shallow and erosive soils. The most common soil conservation practices utilized by county farmers are: the installation of drain tiles, crop rotation and no tillage farming. The map below depicts the distribution of soil classes throughout the county. A majority of soil classes 2, 3 and 4 parallel the St. Lawrence River Valley, and transitions into soil classes 5 to 8 along the foothills of the Adirondack mountains.
Compared to the rest of the United States, St. Lawrence County is at a competitive disadvantage when it comes to the availability of soils that are suitable for cultivation. Thirty-six percent of the soil in St. Lawrence County is suitable for cultivation, compared to 58% for the continental US. The availability of class 1 and 2 soils in the United States (23%) is more than double the availability of class 2 soils in the county, and the US has a higher proportion of class 3 and class 4 soils compared to St. Lawrence County (35% versus 26%).
Distribution of Soil Classes by Location
Classes SLC US 1 - 2 10% 23% 3 - 4 26% 35% 5 - 8 64% 42%
10
Prime Farmland
The USDA NRCS also designates which class 2, 3 and 4 soils contain characteristics that are ideal for agricultural production. These soils are defined as: Prime farmland; prime farmland if drained; or farmland of statewide importance.
Prime farmland presents the best combination of physical and chemical characteristics that are needed to produce food, feed forage, fiber, and oilseed crops. It possesses an adequate and dependable supply of moisture; a favorable temperature and growing season; acceptable acidity and
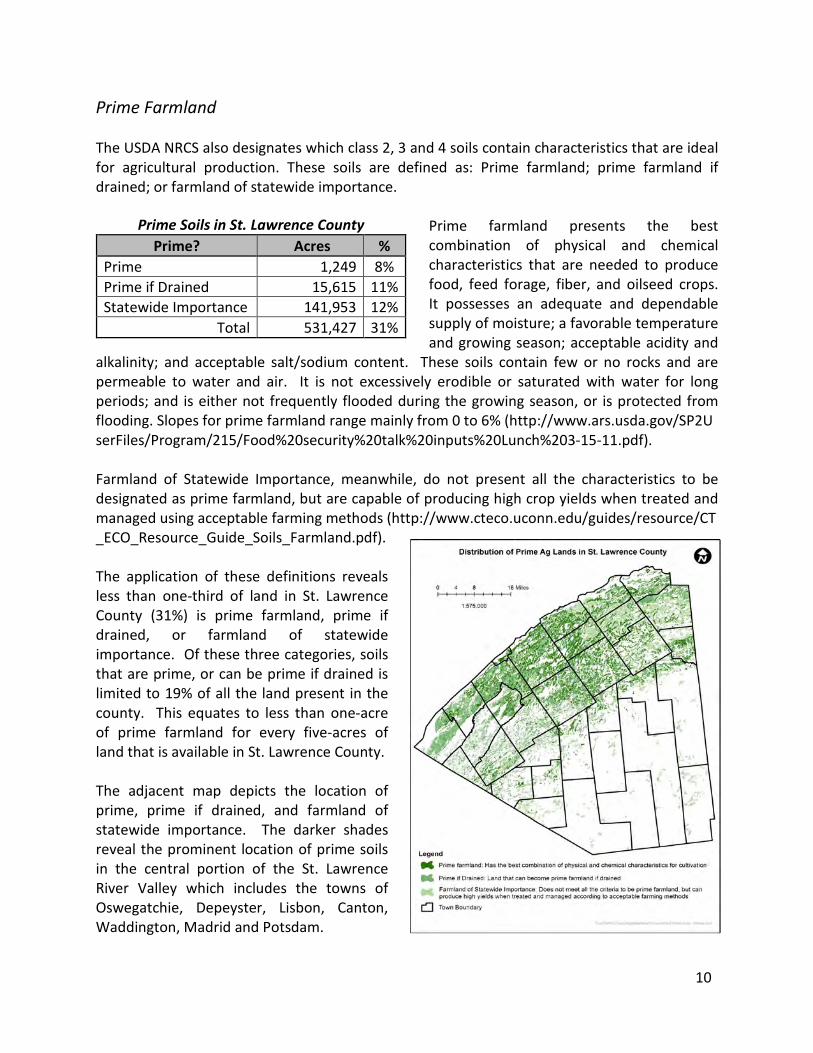
alkalinity; and acceptable salt/sodium content. These soils contain few or no rocks and are permeable to water and air. It is not excessively erodible or saturated with water for long periods; and is either not frequently flooded during the growing season, or is protected from flooding. Slopes for prime farmland range mainly from 0 to 6% (http://www.ars.usda.gov/SP2U serFiles/Program/215/Food%20security%20talk%20inputs%20Lunch%203-15-11.pdf). Farmland of Statewide Importance, meanwhile, do not present all the characteristics to be designated as prime farmland, but are capable of producing high crop yields when treated and managed using acceptable farming methods (http://www.cteco.uconn.edu/guides/resource/CT _ECO_Resource_Guide_Soils_Farmland.pdf). The application of these definitions reveals less than one-third of land in St. Lawrence County (31%) is prime farmland, prime if drained, or farmland of statewide importance. Of these three categories, soils that are prime, or can be prime if drained is limited to 19% of all the land present in the county. This equates to less than one-acre of prime farmland for every five-acres of land that is available in St. Lawrence County. The adjacent map depicts the location of prime, prime if drained, and farmland of statewide importance. The darker shades reveal the prominent location of prime soils in the central portion of the St. Lawrence River Valley which includes the towns of Oswegatchie, Depeyster, Lisbon, Canton, Waddington, Madrid and Potsdam.
Prime Soils in St. Lawrence County Prime? Acres %
Prime 1,249 8% Prime if Drained 15,615 11% Statewide Importance 141,953 12%
Total 531,427 31%
11
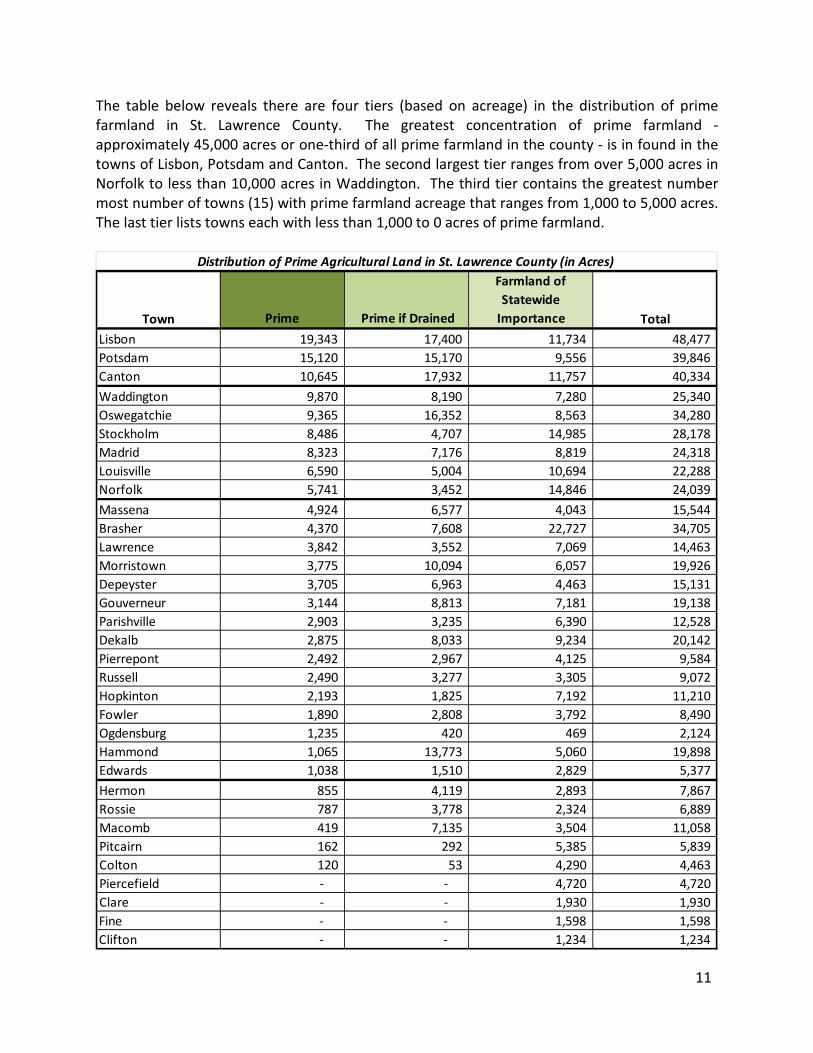
The table below reveals there are four tiers (based on acreage) in the distribution of prime farmland in St. Lawrence County. The greatest concentration of prime farmland - approximately 45,000 acres or one-third of all prime farmland in the county - is in found in the towns of Lisbon, Potsdam and Canton. The second largest tier ranges from over 5,000 acres in Norfolk to less than 10,000 acres in Waddington. The third tier contains the greatest number most number of towns (15) with prime farmland acreage that ranges from 1,000 to 5,000 acres. The last tier lists towns each with less than 1,000 to 0 acres of prime farmland.
Town Prime Prime if Drained
Farmland of Statewide
Importance TotalLisbon 19,343 17,400 11,734 48,477 Potsdam 15,120 15,170 9,556 39,846 Canton 10,645 17,932 11,757 40,334 Waddington 9,870 8,190 7,280 25,340 Oswegatchie 9,365 16,352 8,563 34,280 Stockholm 8,486 4,707 14,985 28,178 Madrid 8,323 7,176 8,819 24,318 Louisville 6,590 5,004 10,694 22,288 Norfolk 5,741 3,452 14,846 24,039 Massena 4,924 6,577 4,043 15,544 Brasher 4,370 7,608 22,727 34,705 Lawrence 3,842 3,552 7,069 14,463 Morristown 3,775 10,094 6,057 19,926 Depeyster 3,705 6,963 4,463 15,131 Gouverneur 3,144 8,813 7,181 19,138 Parishville 2,903 3,235 6,390 12,528 Dekalb 2,875 8,033 9,234 20,142 Pierrepont 2,492 2,967 4,125 9,584 Russell 2,490 3,277 3,305 9,072 Hopkinton 2,193 1,825 7,192 11,210 Fowler 1,890 2,808 3,792 8,490 Ogdensburg 1,235 420 469 2,124 Hammond 1,065 13,773 5,060 19,898 Edwards 1,038 1,510 2,829 5,377 Hermon 855 4,119 2,893 7,867 Rossie 787 3,778 2,324 6,889 Macomb 419 7,135 3,504 11,058 Pitcairn 162 292 5,385 5,839 Colton 120 53 4,290 4,463 Piercefield - - 4,720 4,720 Clare - - 1,930 1,930 Fine - - 1,598 1,598 Clifton - - 1,234 1,234
Distribution of Prime Agricultural Land in St. Lawrence County (in Acres)
12
Protecting a Limited and Valuable Resource With only 31% of land in the county that is prime farmland, prime if drained, or farmland of statewide importance warrants its protection as a limited resource that serves as the economic foundation of the county’s agricultural industry. Promoting the continued use of prime farmland for agricultural production; preventing its conversion into non-farm uses; and minimizing conflicts between agricultural activities and non-farm uses are three actions that can support the advancement and diversification of the St. Lawrence County’s farming economy. The loss of prime farmland places pressure on marginal lands that are generally are more erodible, droughty, and less productive, and creates environmental and economic consequences for the county as a whole. The use of marginal soils for agricultural production requires additional time and energy from farmers, which raises the business expenses of the farming industry and places it at an economic disadvantage compared to other regions where prime farmland is reserved and protected for agricultural uses. Forestry Analysis To be written in spring 2016 Compatibility with Land Use Regulations To be written in spring 2016
13
Outreach through Public Forums As part of St. Lawrence County’s public outreach efforts, three forums were held in March 2015 to receive input on issues the new Plan should emphasize. Meetings were held on the 9th at the Stockholm Municipal Building; the 18th at the Lisbon School Auditorium; and on the 23rd at the Gouverneur Village Court Room. All meetings were held from 7:00 pm to 8:30 pm. Participants were asked to discuss: 1) assets, 2) barriers to progress, and 3) opportunities to strengthen and diversify the county’s agricultural industry. In some instances, stakeholders assisting with the creation of the Plan attended more than one forum to hear first-hand what the agricultural community had to say about the future direction of farming in St. Lawrence County. Meeting Process Each meeting began with an overview of the intent for creating a new Agricultural Development Plan; the reasons for the meeting; and an overview of what would be discussed. Specifically, meeting participants were asked to: Describe agricultural assets by answering:
− What the agricultural community in St. Lawrence County is good at; − What the industry’s strengths are; − What distinguished agriculture in the county from other places; and − What are the advantages of farming in the county
When discussing barriers, participants were asked to identify:
− What the farming community could do a better job at; − What are the areas for improvement; − What needs to change for the better; and − What is getting in the way of success
Finally, attendees were asked to identify opportunities by discussing:
− What the ag community cannot afford to pass by, and − What the ag community must do to advance farming in the county
Prioritizing Recommendations After identifying assets, barriers and opportunities, participants were asked to prioritize these issues based on the availability of resources such as: time, local capacity, funding, and anticipated outcome from addressing these efforts. Each participant was given five votes to prioritize issues based on these parameters.
14
After tallying votes and grouping similar issues together, three themes emerged from the forums:
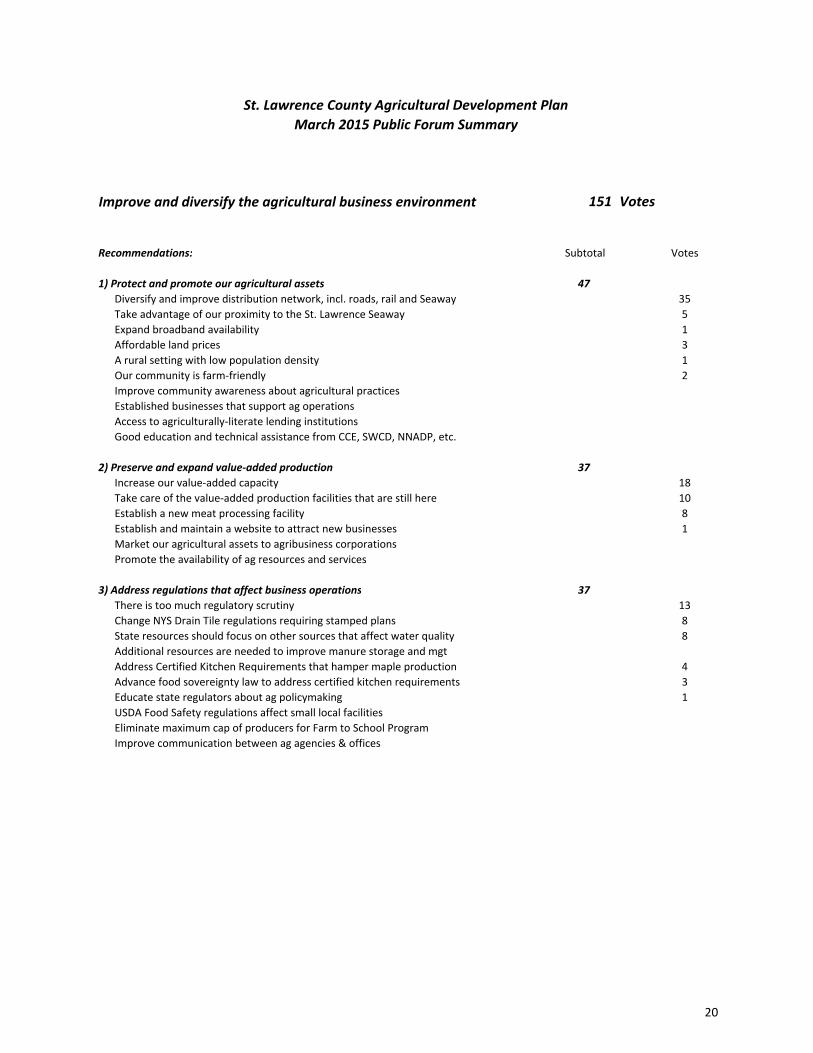
1) Improve and diversify the agricultural business environment – 151 votes total
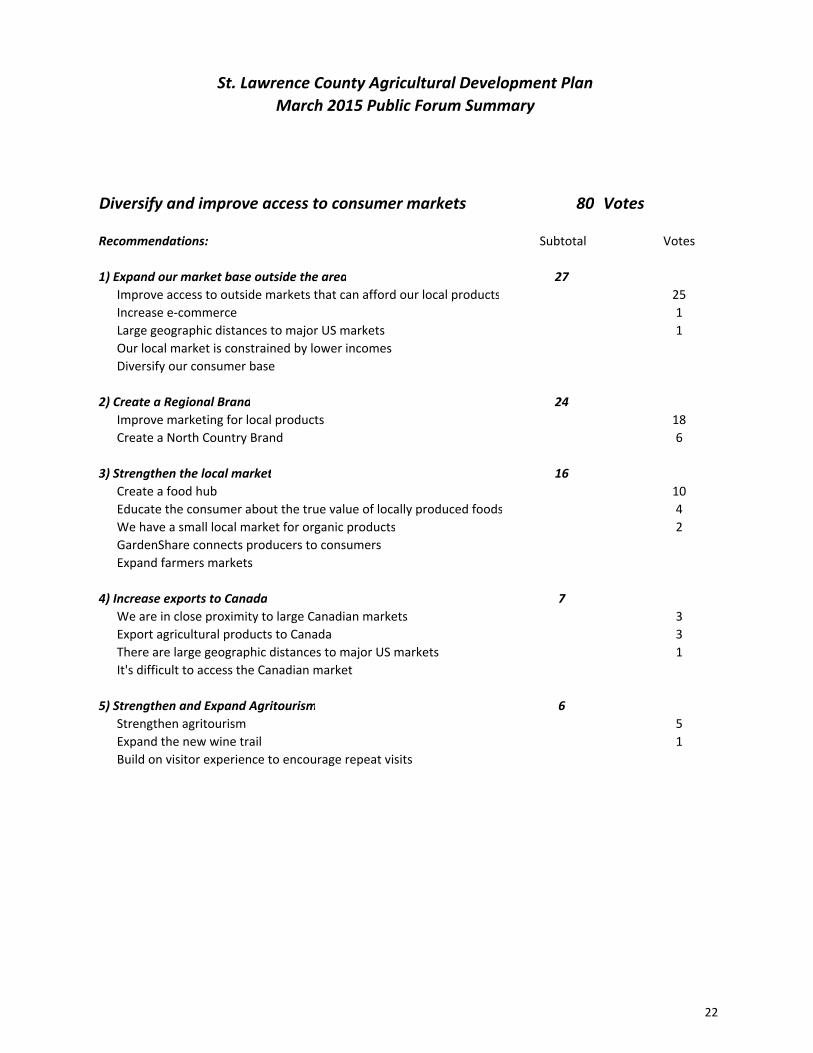
2) Diversify and improve access to consumer markets – 80 votes
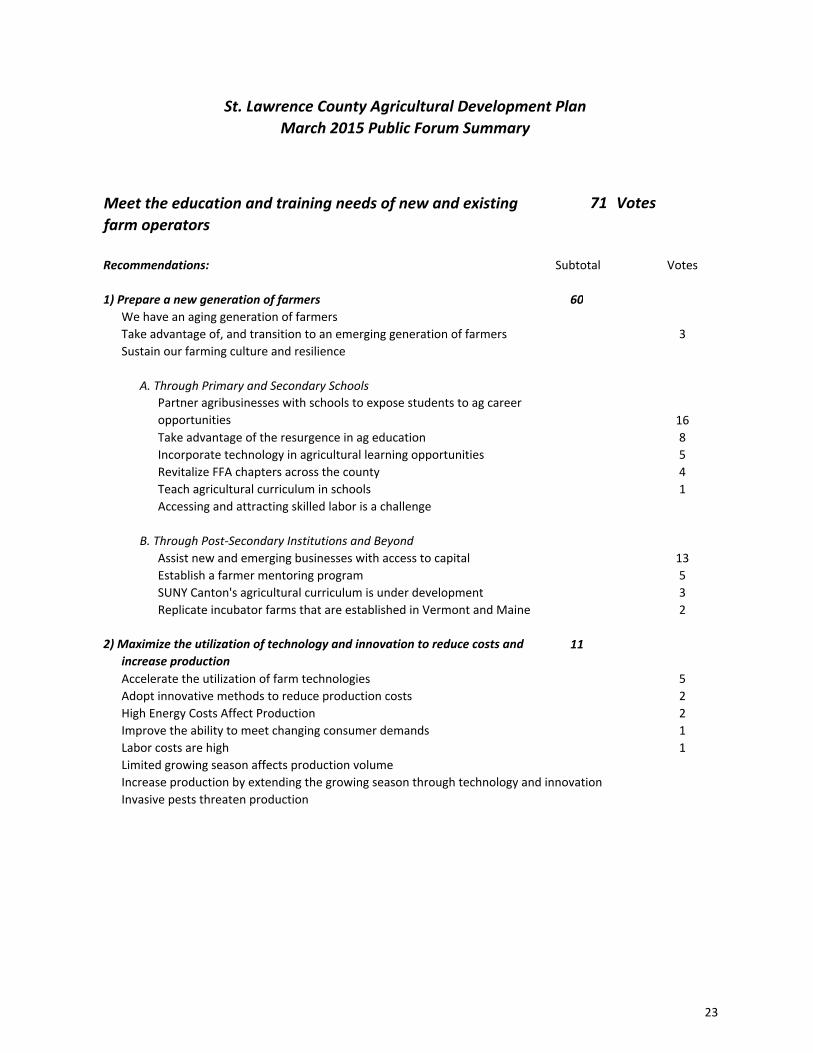
3) Meet the education and training needs of new and existing farm operators – 71 votes
Key messages to improve and diversify the agricultural business environment:
→ Protect and promote our agricultural assets by investing in our transportation infrastructure
The county’s agricultural industry as a whole benefits from an established business network that supports agricultural operations. In addition to operating in a farm-friendly setting, St. Lawrence County’s agricultural producers have access to agriculturally-literate lending institutions and receive quality technical assistance from service organizations such as Cornell Cooperative Extension, the Soil and Water Conservation District, and the Northern New York Agricultural Development Program. The county also offers some of the most affordable land prices in the Northeastern US, and its rural setting has helped minimize the rapid conversion of agricultural lands into non-agricultural uses that have occurred elsewhere in the state.
In spite of these assets, the success of the county’s agricultural producers relies on the ability to distribute goods to market. The county’s established dairy industry in particular depends on the existing road network to deliver milk products and livestock for processing.
It is for these reasons that it is essential to provide access to a diversified and well-maintained transportation network, which includes highways, rail and the St. Lawrence Seaway.
→ Preserve and expand value-added production
The current value-added production capacity in the county must be sustained and expanded. This capacity ranges from food, feed and forestry processing plants that provide valued jobs to the community, to local producers who engage in direct marketing with consumers, retailers, institutions and
15
restaurants. Approaches to sustain and increase value-added production across the spectrum of the ag industry will maximize revenue for the county’s agricultural producers. Specific references were made to establish a new meat processing facility in the county. Other recommendations included marketing the county’s agricultural assets to attract new processors and agribusiness corporations.
→ Address regulations that affect business operations
There are regulations in place that hinder production and place farm operations at a competitive disadvantage. Two specific examples include: Maple producers in Vermont who process and sell value-added maple products at their farms are not subject to state certified kitchen requirements that are imposed on maple producers in New York. A second example is the installation of subsurface drain tiling requires stamped plans by a state-licensed engineer. In the past, Soil and Water Conservation Districts prepared drainage plans in collaboration with USDA-NRCS engineering staff. That is no longer the case. To resume this service, efforts are currently underway for SWCDs to obtain certification under a new partnership with State Department of Agriculture and Markets staff. Both examples point to examining opportunities where regulations can be reformed to benefit the agricultural community while protecting the health and interest of the general public, and to find ways to help the ag community comply with the regulations that are in place.
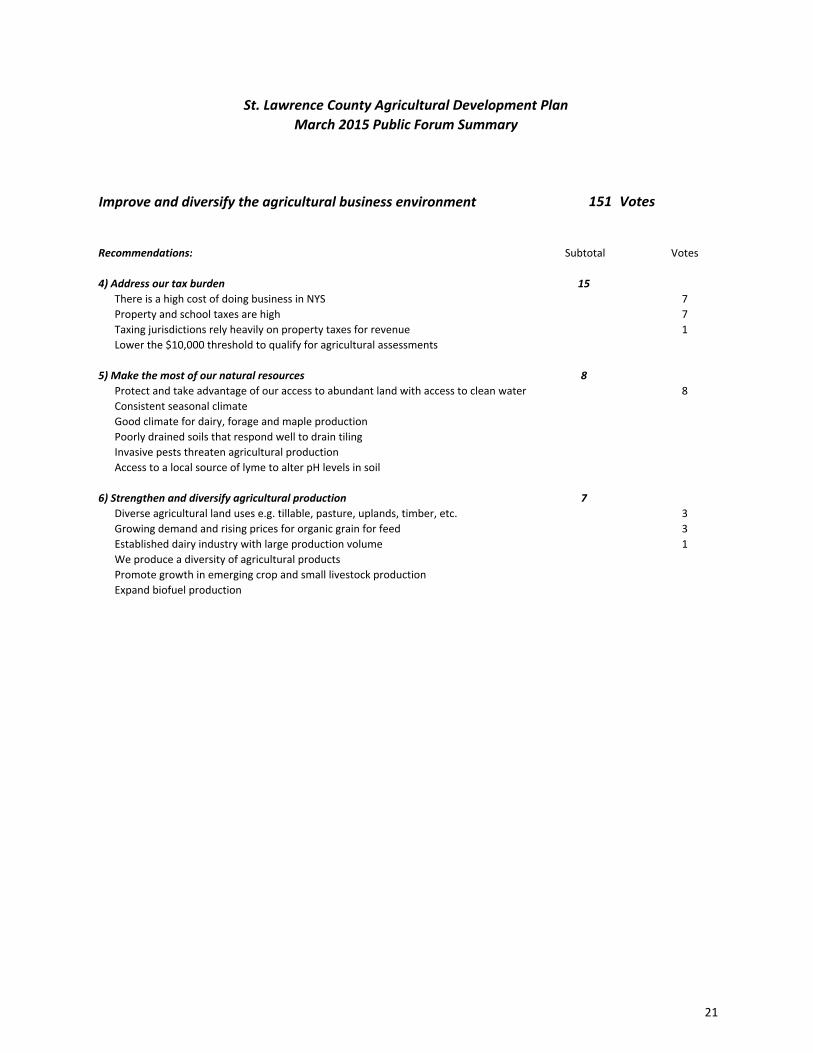
→ Address our tax burden
There is a high cost of doing business in New York. St. Lawrence County is consistently challenged with providing essential services to a population that experiences some of the highest unemployment and poverty rates in the State, and must generate property tax revenue from some of the lowest housing and land values in New York. In addition to raising sufficient funds to provide local services, the State’s current tax system requires municipalities to allocate local revenue to support state programs, or is responsible for administering unfunded mandates. At the county level, for instance, county governments must help pay for Medicaid, preschool special education, public assistance and other programs that county governments elsewhere in the nation do not pay for.
16
Two approaches can be employed to address taxes that affect agricultural production: advocating for State tax reform, and maximizing participation in tax relief programs that are available to agricultural producers, including: sales tax exemptions, agricultural assessments, school property tax credit, and farm property tax exemptions for capital projects.
→Make the most of our natural resources Land in the county is used for diverse agricultural practices such as tillable acreage, pasture, uplands and timber stands, and the seasonal climate is consistent and ideal for dairy, forage and maple production. Poorly drained soils in the county respond well to drain tiling to maximize production yields, and local producers benefit from the presence of a local source of Lyme to amend soil conditions. In response to declining aquifers and
multi-year droughts that affect other agricultural regions in the US, the county’s agricultural industry should take advantage of its access to abundant sources of clean water.
Forum attendees also acknowledged invasive species threaten the county’s agricultural production and timber stands. Invasive species such as the Emerald Ash Borer, the Asian Longhorned Beetle, and the Hemlock Wooly Adelgid can decimate maple, ash and hemlock tree species throughout the county, while the Alfalpha Snout Beetle, Late Blight, Spotted Wing Drosophila and Swede Midge are detrimental to alfapha, fruit and vegetable production.
→ Strengthen and diversify agricultural production
Dairy is a major contributor to the farming industry as it accounts for 71% ($132 million) of the market value of products that are generated by the county’s farm operations. The significance of the dairy industry’s role in the county’s economy warrants strategies to sustain its economic position, and identifying measures to minimize vulnerability to global fluctuations in demand and pricing. The county’s agricultural industry should also be diversified to take advantage of emerging niches in biofuel, organic, poultry, livestock, and
crop production. These circumstances call for developing strategies to sustain and strengthen the county’s dairy operations, and accelerate growth in agricultural diversification.
17
Key messages to diversify and strengthen consumer markets: Median incomes for year-round residents have historically been lower in the county than elsewhere in the state, which constrains the local market’s ability and willingness to afford higher-priced, locally-grown products. Public forum attendees identified the county’s geographic location which increases time and fuel costs to deliver goods to consumers with higher incomes in major US population centers.
→Improve access to consumer markets outside the area
To strengthen producer access to markets outside the county, consolidate producer distribution efforts to reduce the cost of accessing larger markets elsewhere in the state, and support the expansion of the regional broadband network to maximize e-commerce activity.
→Create a regional “North Country” brand to market locally-produced
products that are sold in the county, throughout the state, and Canada; and educate
consumers about the value of purchasing locally. Other suggestions include creating a food hub to provide a centralized location for local products; utilizing GardenShare to connect producers to local consumers including area institutions, retailers, and food
establishments; and increase the presence of farmers markets where seasonal residents spend their summers.
→Take advantage of the county’s proximity to major Canadian
markets, and address actual or perceived barriers to exporting products to Canada – America’s largest trading partner. Strategies must also be developed to help producers raise production volumes to satisfy growth in consumer demand.
→Expand and enhance agri-tourism opportunities to attract
new and repeat customers. Give customers the opportunity to visit a farm or business operation to learn about, and sample local products which enhances a visitor’s overall experience of St. Lawrence County. Prime agri-tourism candidates include the St.
18
Lawrence Wine Trail; members of the Maple Producers Association; u-pick establishments; roadside stands and orchards.
Key messages to meet the education and training needs of farm operators: →Prepare a new generation of farmers
The current generation of farmers in St. Lawrence County has approached the age of retirement and only 5% of the county’s farms are operated by persons under the age 34. To sustain and advance the county’s agricultural economy, the industry must prepare to transition to a new generation of farmers. Preparing this new generation involves renewed partnerships with area school districts to
expose students to agricultural careers, revitalize FFA chapters across the county, and incorporate technology in agricultural learning opportunities. At the post-secondary level, SUNY Canton is resurrecting its agriculture program. To complement the completion of a two or four-year degree that leads to an agricultural
career, potential services for new farm operators include creating a farmer mentoring program, establishing an incubator farm program, and
assisting emerging farm operations with agricultural business planning to successfully access start-up capital.
→Utilize technology and innovation to increase production
In addition to raising consumer demand for agricultural products made in St. Lawrence County, revenues for farm operations can also be increased by reducing business expenses and improving operation efficiencies to increase production. This requires
accelerating the utilization of farm technologies. This includes
adopting innovative methods to extend the growing season, and to minimize the risks of invasive species. Farm operators and employees are expected to be familiar with the operation and maintenance of modern farm equipment that relies on wireless technology, and upgrading or replacing hardware

19
and software systems. High energy costs affect production. As fuel prices continue to rise,
it will become necessary for local producers to transition to local, renewable energy resources.
St. Lawrence County Agricultural Development Plan
March 2015 Public Forum Summary
151 Votes
Recommendations: Subtotal Votes
1) Protect and promote our agricultural assets 47
Diversify and improve distribution network, incl. roads, rail and Seaway 35
Take advantage of our proximity to the St. Lawrence Seaway 5
Expand broadband availability 1
Affordable land prices 3
A rural setting with low population density 1
Our community is farm‐friendly 2
Improve community awareness about agricultural practices
Established businesses that support ag operations
Access to agriculturally‐literate lending institutions
Good education and technical assistance from CCE, SWCD, NNADP, etc.
2) Preserve and expand value‐added production 37
Increase our value‐added capacity 18
Take care of the value‐added production facilities that are still here 10
Establish a new meat processing facility 8
Establish and maintain a website to attract new businesses 1
Market our agricultural assets to agribusiness corporations
Promote the availability of ag resources and services
3) Address regulations that affect business operations 37
There is too much regulatory scrutiny 13
Change NYS Drain Tile regulations requiring stamped plans 8
State resources should focus on other sources that affect water quality 8
Additional resources are needed to improve manure storage and mgt
Address Certified Kitchen Requirements that hamper maple production 4
Advance food sovereignty law to address certified kitchen requirements 3
Educate state regulators about ag policymaking 1
USDA Food Safety regulations affect small local facilities
Eliminate maximum cap of producers for Farm to School Program
Improve communication between ag agencies & offices
Improve and diversify the agricultural business environment
20
St. Lawrence County Agricultural Development Plan
March 2015 Public Forum Summary
151 Votes
Recommendations: Subtotal Votes
Improve and diversify the agricultural business environment
4) Address our tax burden 15
There is a high cost of doing business in NYS 7
Property and school taxes are high 7
Taxing jurisdictions rely heavily on property taxes for revenue 1
Lower the $10,000 threshold to qualify for agricultural assessments
5) Make the most of our natural resources 8
Protect and take advantage of our access to abundant land with access to clean water 8
Consistent seasonal climate
Good climate for dairy, forage and maple production
Poorly drained soils that respond well to drain tiling
Invasive pests threaten agricultural production
Access to a local source of lyme to alter pH levels in soil
6) Strengthen and diversify agricultural production 7
Diverse agricultural land uses e.g. tillable, pasture, uplands, timber, etc. 3
Growing demand and rising prices for organic grain for feed 3
Established dairy industry with large production volume 1
We produce a diversity of agricultural products
Promote growth in emerging crop and small livestock production
Expand biofuel production
21
St. Lawrence County Agricultural Development Plan
March 2015 Public Forum Summary
Diversify and improve access to consumer markets 80 Votes
Recommendations: Subtotal Votes
1) Expand our market base outside the area 27
Improve access to outside markets that can afford our local products 25
Increase e‐commerce 1
Large geographic distances to major US markets 1
Our local market is constrained by lower incomes
Diversify our consumer base
2) Create a Regional Brand 24
Improve marketing for local products 18
Create a North Country Brand 6
3) Strengthen the local market 16
Create a food hub 10
Educate the consumer about the true value of locally produced foods 4
We have a small local market for organic products 2
GardenShare connects producers to consumers
Expand farmers markets
4) Increase exports to Canada 7
We are in close proximity to large Canadian markets 3
Export agricultural products to Canada 3
There are large geographic distances to major US markets 1
It's difficult to access the Canadian market
5) Strengthen and Expand Agritourism 6
Strengthen agritourism 5
Expand the new wine trail 1
Build on visitor experience to encourage repeat visits
22
St. Lawrence County Agricultural Development Plan
March 2015 Public Forum Summary
71 Votes
Recommendations: Subtotal Votes
1) Prepare a new generation of farmers 60
We have an aging generation of farmers
Take advantage of, and transition to an emerging generation of farmers 3
Sustain our farming culture and resilience
A. Through Primary and Secondary Schools
Partner agribusinesses with schools to expose students to ag career
opportunities 16
Take advantage of the resurgence in ag education 8
Incorporate technology in agricultural learning opportunities 5
Revitalize FFA chapters across the county 4
Teach agricultural curriculum in schools 1
Accessing and attracting skilled labor is a challenge
B. Through Post‐Secondary Institutions and Beyond
Assist new and emerging businesses with access to capital 13
Establish a farmer mentoring program 5
SUNY Canton's agricultural curriculum is under development 3
Replicate incubator farms that are established in Vermont and Maine 2
2) Maximize the utilization of technology and innovation to reduce costs and 11
increase production
Accelerate the utilization of farm technologies 5
Adopt innovative methods to reduce production costs 2
High Energy Costs Affect Production 2
Improve the ability to meet changing consumer demands 1
Labor costs are high 1
Limited growing season affects production volume
Increase production by extending the growing season through technology and innovation
Invasive pests threaten production
Meet the education and training needs of new and existing
farm operators
23
24
Online Survey Analysis
To be written in Spring and Summer 2015
Goals and Strategies
To be developed in Summer 2015
Bibliography “2014 Organic Survey, Certified and Exempt Organic Farm Data, Complete Report.” United States Department
of Agriculture National Agricultural Statistics Service. http://www.agcensus.usda.gov/Publications/2012/Online_Resources/Organics/
“2014-2015 Agricultural Statistics Annual Bulletin, New York.” 2014 New York Agricultural Statistics. USDA
National Agricultural Statistics Service. http://www.nass.usda.gov/Statistics_by_State/New_York/Publications/Annual_Statistical_Bulletin/
“Agricultural Capability of United States Soils.” ESRI ArcGIS Resource Center.
http://resources.arcgis.com/en/communities/soils/02ms00000005000000.htm “Amish Population Change 2010-2015.” Young Center for Anabaptist and Pietist Studies, Elizabethtown College.
https://groups.etown.edu/amishstudies/files/2015/08 /Population_Change_2010-2015.pdf “Amish Population Profile 2015.” Young Center for Anabaptist and Pietist Studies, Elizabethtown College.
http://groups.etown/edu/amishstudies/statistics/amish-population-profile-2015 “Farmland Soils.” Connecticut Environmental Conditions Online.
http://www.cteco.uconn.edu/guides/resource/CT_ECO_Resource_Guide_Soils_Farmland.pdf “New York Volume 1, Complete Report, All Tables.” 2002 Census Volume 1, Chapter 2: County Level Data New
York. USDA National Agricultural Statistics Service. http://www.agcensus.usda.gov/Publications/2002/Volume_1,_Chapter_2_County_Level/New_York/
“New York Volume 1, Complete Report, All Tables.” 2012 Census Volume 1, Chapter 2: County Level Data New
York. USDA National Agricultural Statistics Service. http://www.agcensus.usda.gov/Publications/2012/Full_Report/Volume_1,_Chapter_2_County_Level/New_York/
“Northeast Milk Marketing Area Statistical Handbook.” Northeast Marketing Area, Federal Milk Marketing Order
1. USDA Agriculture Marketing Service Dairy Program. http://www.fmmone.com/NE_Statistical_Handbook/NE_Statistical_Handbook.XLS
“Quarterly Census of Employment and Wages (QCEW).” New York State Department of Labor Labor Statistics.
http://labor.ny.gov/stats/LSQCEW.shtm “RI Soil Survey - Capability Classes and Subclasses.” USDA Natural Resources Conservation Service Rhode Island.
http://www.nrcs.usda.gov/wps/portal/nrcs/detail/ri/soils/?cid=nrcs144p2_016628 “US Land Use and Soil Classification.” USDA Agricultural Research Service.
http://www.ars.usda.gov/SP2UserFiles/Program/215/Food%20security%20talk%20inputs%20Lunch%203-15-11.pdf


![Thurston County Agricultural Land Pocket Gopher Evaluation · [THURSTON COUNTY AGRICULTURAL LAND POCKET GOPHER EVALUATION] March 30, 2014 3 Thurston County Agricultural Land Pocket](https://img.pdfslide.net/doc/110x75/5b00b2377f8b9a256b90627a/thurston-county-agricultural-land-pocket-gopher-evaluation-thurston-county-agricultural.jpg)