Embed Size (px)
Citation preview
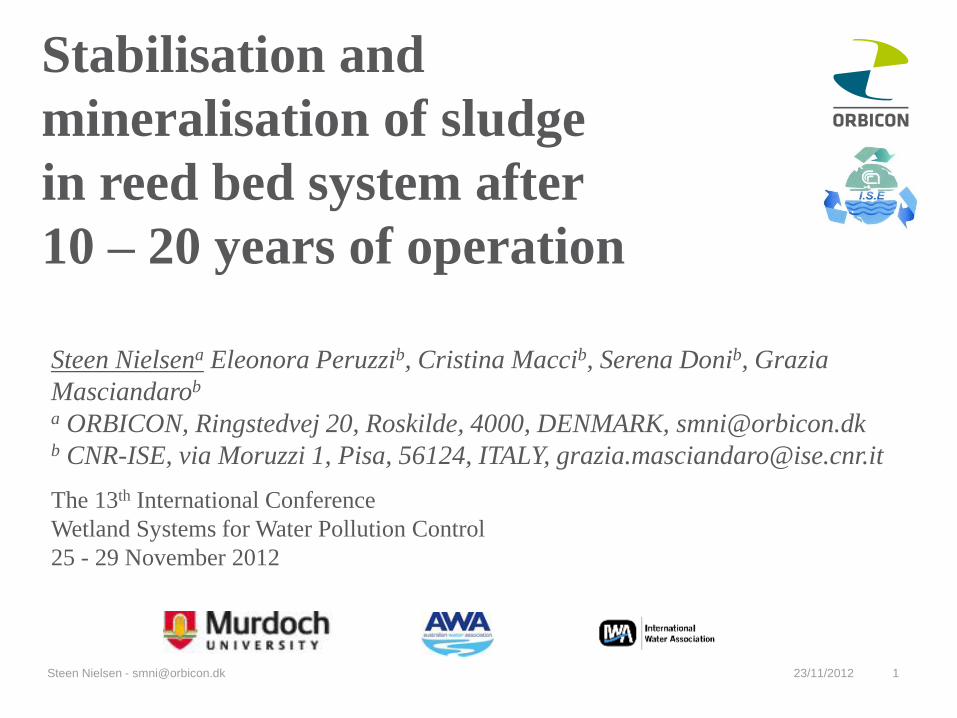
Stabilisation and
mineralisation of sludge
in reed bed system after
10 – 20 years of operation
Steen Nielsen - [email protected] 23/11/2012 1
Steen Nielsena Eleonora Peruzzib, Cristina Maccib, Serena Donib, Grazia
Masciandarob a ORBICON, Ringstedvej 20, Roskilde, 4000, DENMARK, [email protected] b CNR-ISE, via Moruzzi 1, Pisa, 56124, ITALY, [email protected]
The 13th International Conference
Wetland Systems for Water Pollution Control
25 - 29 November 2012
Investigation of stabilisation of sludges
in three Danish STRBS:
Helsinge, Nordborg and Nakskov.
• To evaluate the sludge quality after treatment in STRBS, comparing
also the different pathways by which of stabilisation occurred.
• The efficiency in sludge stabilisation in the sludge residue within the
STRBS after periods of operation between 9 – 21 years.
• Is it possible to hypothesise a connection between the sludge quality
applied to the (STRBS) and different ways of stabilising
(mineralisation or huminification) the sewage sludge accumulated in
vertical profile.
To achieve this purpose, parameters correlated to biochemical properties
of organic sludge matter have been determined.
Steen Nielsen - [email protected] 23/11/2012 2
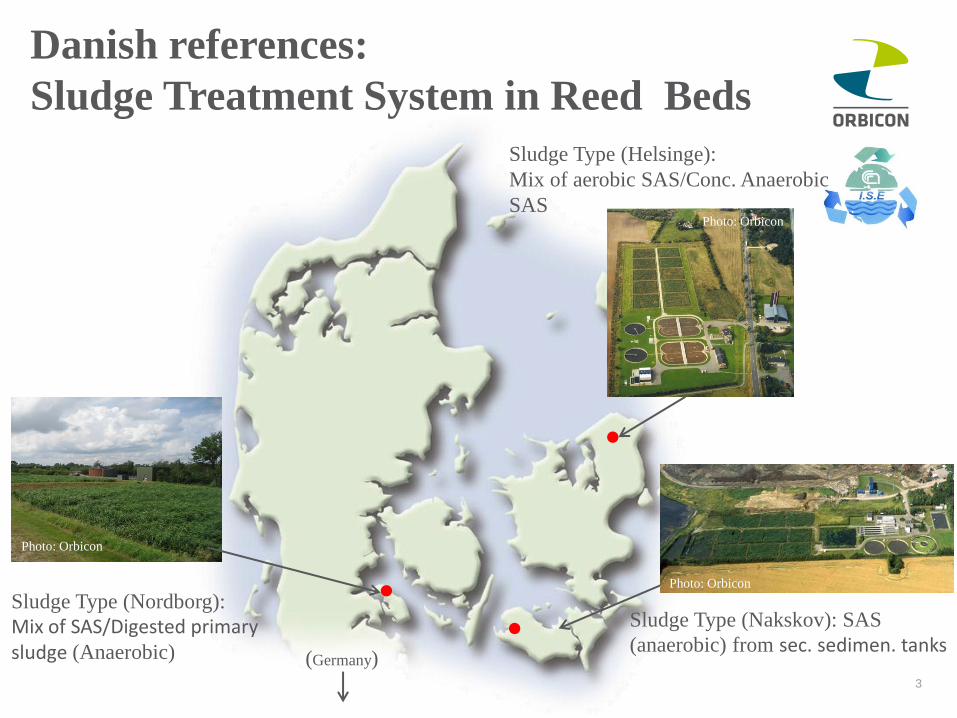
Danish references:
Sludge Treatment System in Reed Beds
3
Sludge Type (Helsinge):
Mix of aerobic SAS/Conc. Anaerobic
SAS
Sludge Type (Nakskov): SAS
(anaerobic) from sec. sedimen. tanks
Sludge Type (Nordborg):
Mix of SAS/Digested primary sludge (Anaerobic)
(Germany)
Photo: Orbicon
Photo: Orbicon
Photo: Orbicon
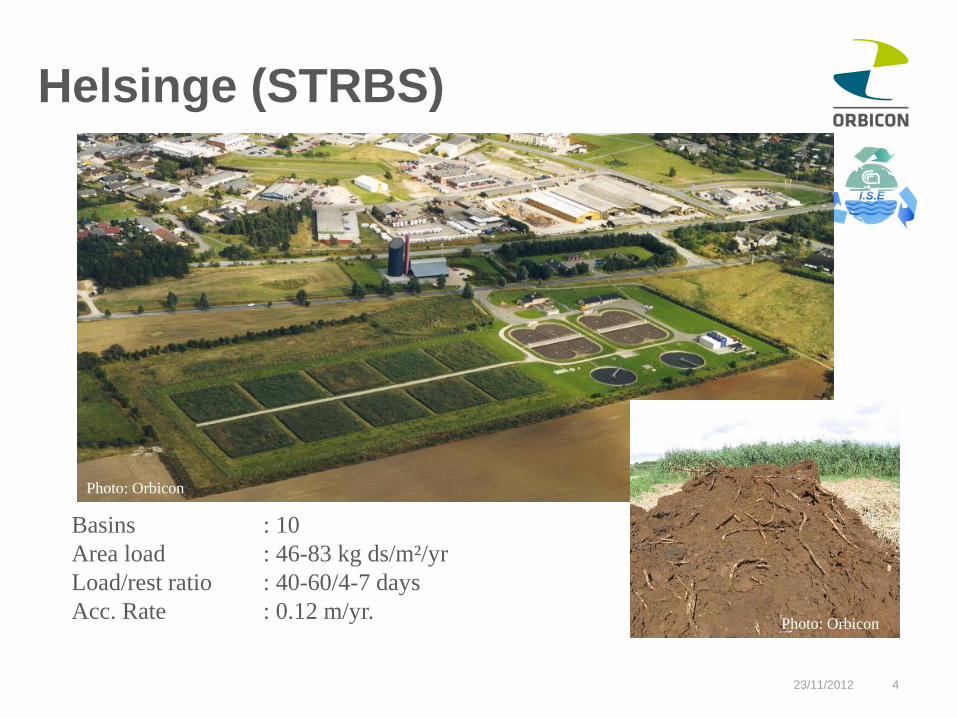
Helsinge (STRBS)
23/11/2012 4
Basins : 10
Area load : 46-83 kg ds/m²/yr
Load/rest ratio : 40-60/4-7 days
Acc. Rate : 0.12 m/yr.
Photo: Orbicon
Photo: Orbicon
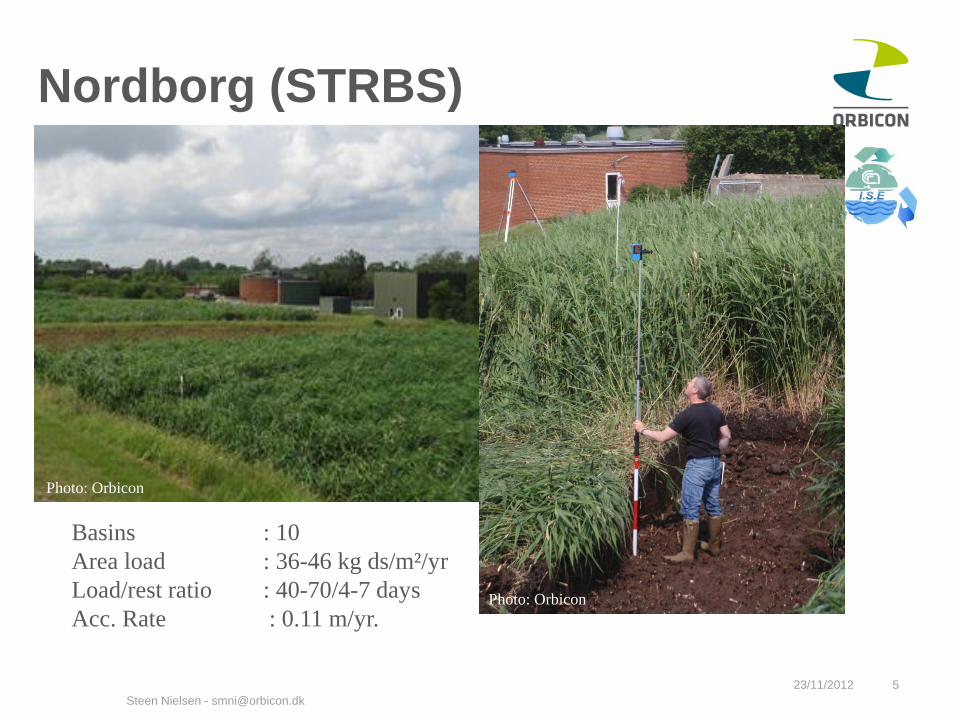
Nordborg (STRBS)
Steen Nielsen - [email protected]
23/11/2012 5
Basins : 10
Area load : 36-46 kg ds/m²/yr
Load/rest ratio : 40-70/4-7 days
Acc. Rate : 0.11 m/yr.
Photo: Orbicon
Photo: Orbicon
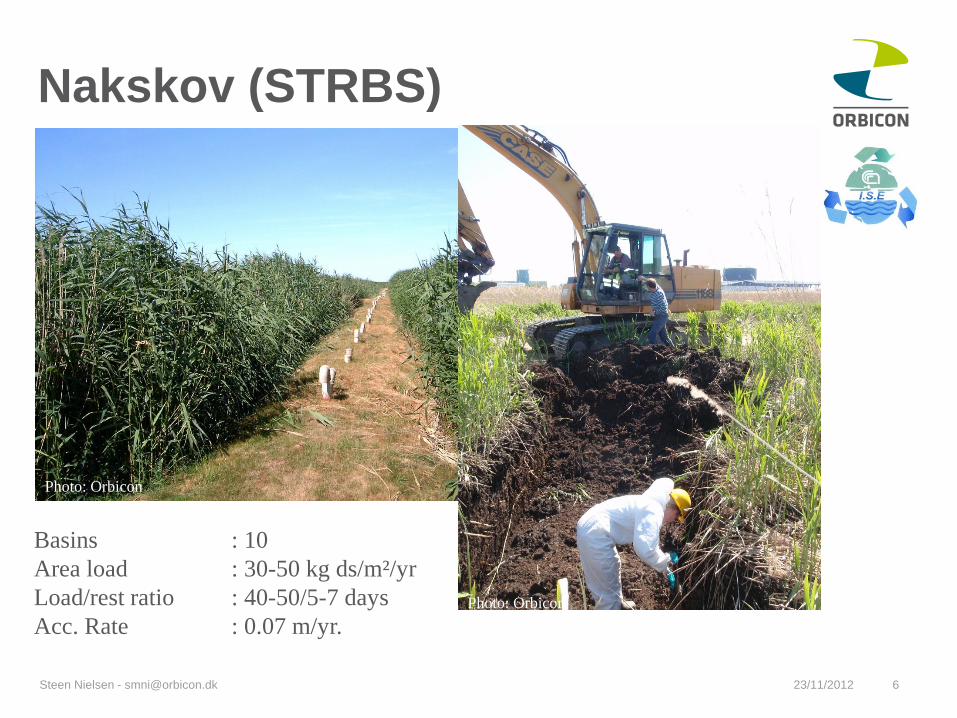
Nakskov (STRBS)
Steen Nielsen - [email protected] 23/11/2012 6
Basins : 10
Area load : 30-50 kg ds/m²/yr
Load/rest ratio : 40-50/5-7 days
Acc. Rate : 0.07 m/yr.
Photo: Orbicon
Photo: Orbicon
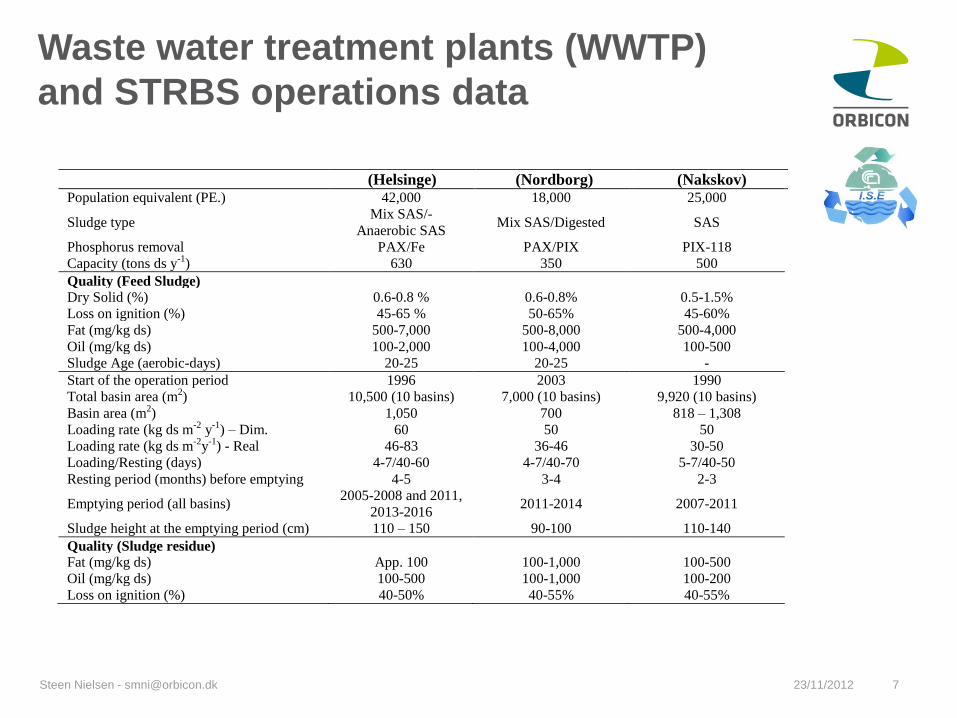
Waste water treatment plants (WWTP)
and STRBS operations data
23/11/2012 7
(Helsinge) (Nordborg) (Nakskov) Population equivalent (PE.) 42,000 18,000 25,000
Sludge type Mix SAS/-
Anaerobic SAS Mix SAS/Digested SAS
Phosphorus removal PAX/Fe PAX/PIX PIX-118
Capacity (tons ds y-1) 630 350 500
Quality (Feed Sludge)
Dry Solid (%) 0.6-0.8 % 0.6-0.8% 0.5-1.5%
Loss on ignition (%) 45-65 % 50-65% 45-60%
Fat (mg/kg ds) 500-7,000 500-8,000 500-4,000
Oil (mg/kg ds) 100-2,000 100-4,000 100-500
Sludge Age (aerobic-days) 20-25 20-25 -
Start of the operation period 1996 2003 1990
Total basin area (m2) 10,500 (10 basins) 7,000 (10 basins) 9,920 (10 basins)
Basin area (m2) 1,050 700 818 – 1,308
Loading rate (kg ds m-2 y-1) – Dim. 60 50 50
Loading rate (kg ds m-2y-1) - Real 46-83 36-46 30-50
Loading/Resting (days) 4-7/40-60 4-7/40-70 5-7/40-50
Resting period (months) before emptying 4-5 3-4 2-3
Emptying period (all basins) 2005-2008 and 2011,
2013-2016 2011-2014 2007-2011
Sludge height at the emptying period (cm) 110 – 150 90-100 110-140
Quality (Sludge residue)
Fat (mg/kg ds) App. 100 100-1,000 100-500
Oil (mg/kg ds) 100-500 100-1,000 100-200
Loss on ignition (%) 40-50% 40-55% 40-55%
Steen Nielsen - [email protected]
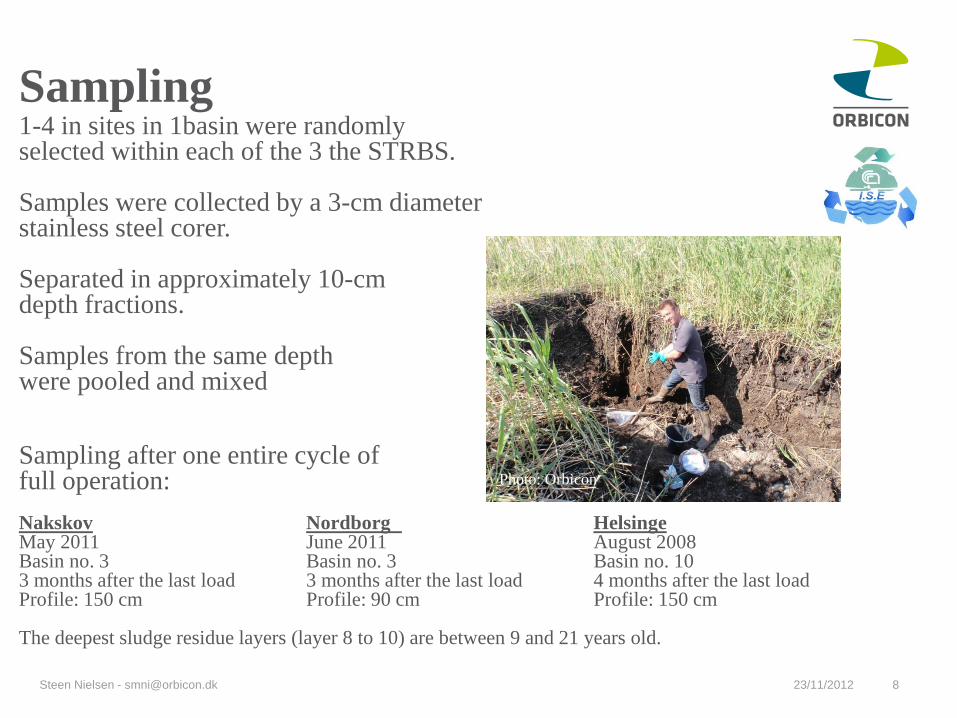
Sampling
Steen Nielsen - [email protected] 23/11/2012 8
1-4 in sites in 1basin were randomly selected within each of the 3 the STRBS. Samples were collected by a 3-cm diameter stainless steel corer. Separated in approximately 10-cm depth fractions. Samples from the same depth were pooled and mixed Sampling after one entire cycle of full operation: Nakskov Nordborg Helsinge May 2011 June 2011 August 2008 Basin no. 3 Basin no. 3 Basin no. 10 3 months after the last load 3 months after the last load 4 months after the last load Profile: 150 cm Profile: 90 cm Profile: 150 cm The deepest sludge residue layers (layer 8 to 10) are between 9 and 21 years old.
Photo: Orbicon
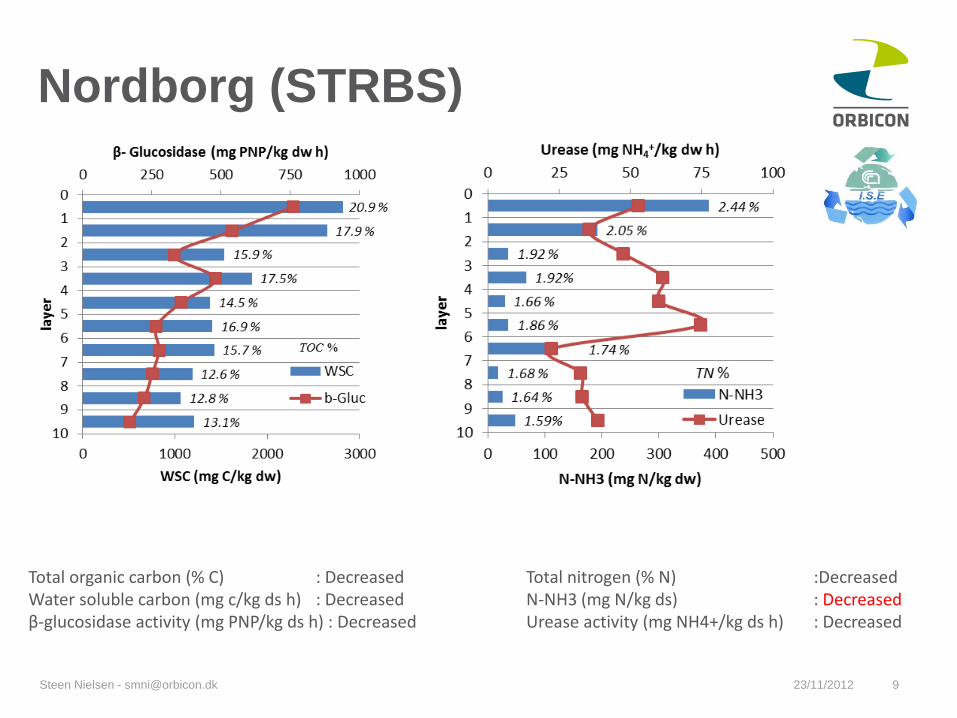
Nordborg (STRBS)
Steen Nielsen - [email protected] 23/11/2012 9
Total organic carbon (% C) : Decreased Water soluble carbon (mg c/kg ds h) : Decreased β-glucosidase activity (mg PNP/kg ds h) : Decreased
Total nitrogen (% N) :Decreased N-NH3 (mg N/kg ds) : Decreased Urease activity (mg NH4+/kg ds h) : Decreased
Helsinge (STRBS)
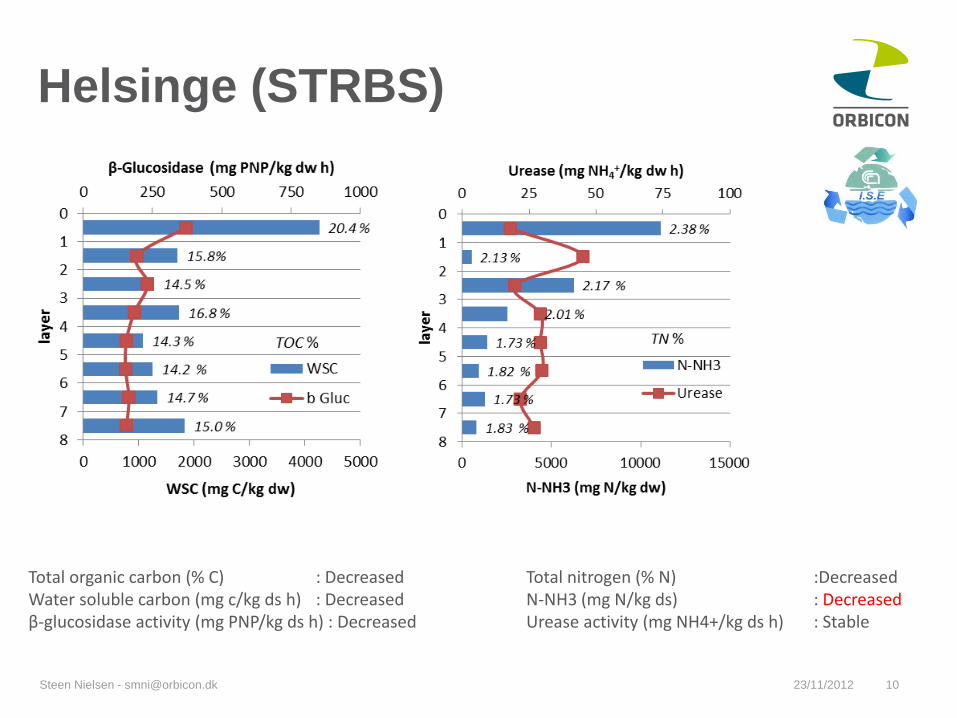
Steen Nielsen - [email protected] 23/11/2012 10
Total organic carbon (% C) : Decreased Water soluble carbon (mg c/kg ds h) : Decreased β-glucosidase activity (mg PNP/kg ds h) : Decreased
Total nitrogen (% N) :Decreased N-NH3 (mg N/kg ds) : Decreased Urease activity (mg NH4+/kg ds h) : Stable
Nakskov (STRBS)
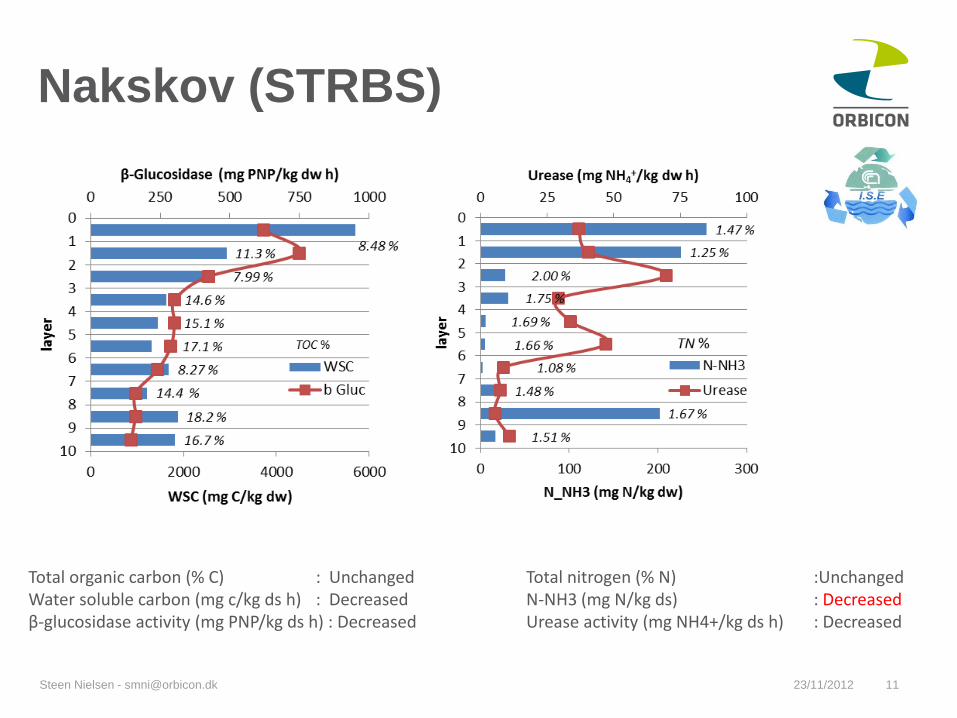
Steen Nielsen - [email protected] 23/11/2012 11
Total organic carbon (% C) : Unchanged Water soluble carbon (mg c/kg ds h) : Decreased β-glucosidase activity (mg PNP/kg ds h) : Decreased
Total nitrogen (% N) :Unchanged N-NH3 (mg N/kg ds) : Decreased Urease activity (mg NH4+/kg ds h) : Decreased
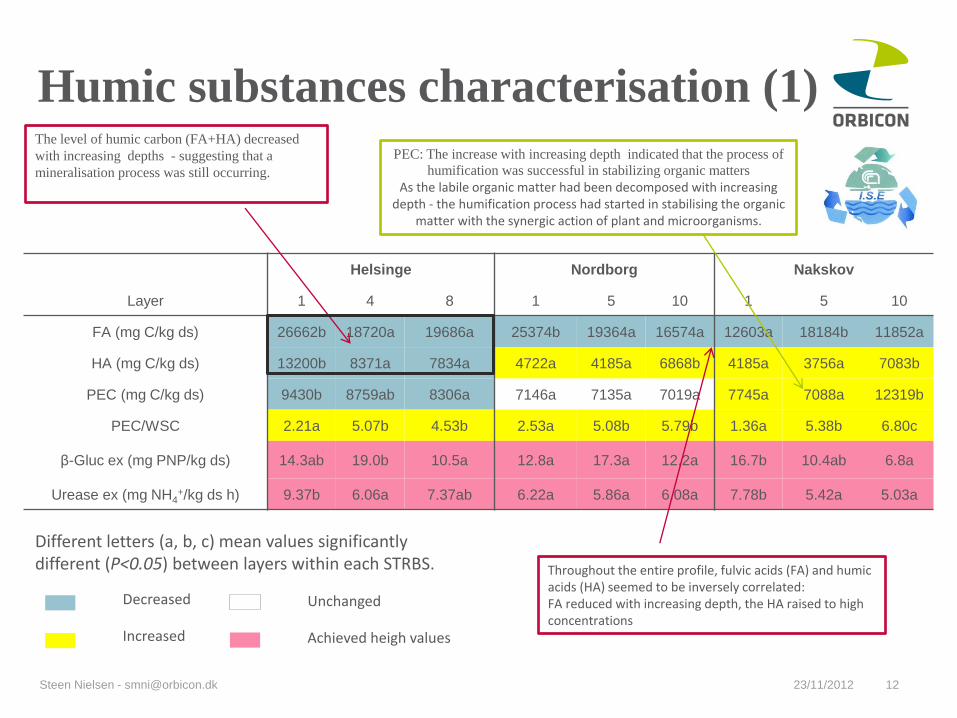
Humic substances characterisation (1)
23/11/2012 12 Steen Nielsen - [email protected]
Different letters (a, b, c) mean values significantly different (P<0.05) between layers within each STRBS.
Helsinge Nordborg Nakskov
Layer 1 4 8 1 5 10 1 5 10
FA (mg C/kg ds) 26662b 18720a 19686a 25374b 19364a 16574a 12603a 18184b 11852a
HA (mg C/kg ds) 13200b 8371a 7834a 4722a 4185a 6868b 4185a 3756a 7083b
PEC (mg C/kg ds) 9430b 8759ab 8306a 7146a 7135a 7019a 7745a 7088a 12319b
PEC/WSC 2.21a 5.07b 4.53b 2.53a 5.08b 5.79b 1.36a 5.38b 6.80c
β-Gluc ex (mg PNP/kg ds) 14.3ab 19.0b 10.5a 12.8a 17.3a 12.2a 16.7b 10.4ab 6.8a
Urease ex (mg NH4+/kg ds h) 9.37b 6.06a 7.37ab 6.22a 5.86a 6.08a 7.78b 5.42a 5.03a
Decreased
Increased
Unchanged
Achieved heigh values
The level of humic carbon (FA+HA) decreased
with increasing depths - suggesting that a
mineralisation process was still occurring.
PEC: The increase with increasing depth indicated that the process of
humification was successful in stabilizing organic matters As the labile organic matter had been decomposed with increasing
depth - the humification process had started in stabilising the organic matter with the synergic action of plant and microorganisms.
Throughout the entire profile, fulvic acids (FA) and humic acids (HA) seemed to be inversely correlated: FA reduced with increasing depth, the HA raised to high concentrations
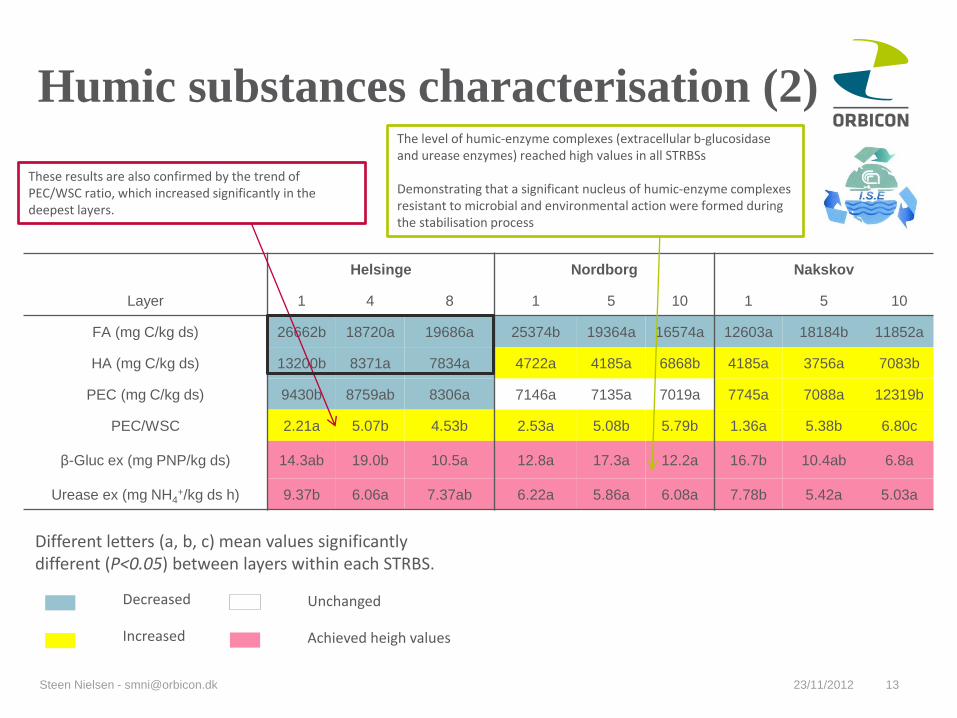
Humic substances characterisation (2)
23/11/2012 13 Steen Nielsen - [email protected]
Different letters (a, b, c) mean values significantly different (P<0.05) between layers within each STRBS.
Helsinge Nordborg Nakskov
Layer 1 4 8 1 5 10 1 5 10
FA (mg C/kg ds) 26662b 18720a 19686a 25374b 19364a 16574a 12603a 18184b 11852a
HA (mg C/kg ds) 13200b 8371a 7834a 4722a 4185a 6868b 4185a 3756a 7083b
PEC (mg C/kg ds) 9430b 8759ab 8306a 7146a 7135a 7019a 7745a 7088a 12319b
PEC/WSC 2.21a 5.07b 4.53b 2.53a 5.08b 5.79b 1.36a 5.38b 6.80c
β-Gluc ex (mg PNP/kg ds) 14.3ab 19.0b 10.5a 12.8a 17.3a 12.2a 16.7b 10.4ab 6.8a
Urease ex (mg NH4+/kg ds h) 9.37b 6.06a 7.37ab 6.22a 5.86a 6.08a 7.78b 5.42a 5.03a
Decreased
Increased
Unchanged
Achieved heigh values
The level of humic-enzyme complexes (extracellular b-glucosidase and urease enzymes) reached high values in all STRBSs Demonstrating that a significant nucleus of humic-enzyme complexes resistant to microbial and environmental action were formed during the stabilisation process
These results are also confirmed by the trend of PEC/WSC ratio, which increased significantly in the deepest layers.
23/11/2012 14
1
2
3
6 7 4
5
10
9 8
1
2
3
4
5
7
6 8
3 2
1 4
6
5
7
8
9
10
-3,0
0,0
3,0
-3,0 -1,5 0,0 1,5
PC
2
PC 1
Nordborg
Helsinge
Nakskov
PC 1 PC 2
Total Organic Carbon -0.17 0.55
Total Nitrogen 0.26 0.78*
Water Soluble Carbon 0.40 0.19
N-NH3 0.01 0.91*
-glucosidase 0.81* -0.12
Urease 0.84* 0.10
Fulvic Acids 0.40 0.59
Humic Acids -0.49 0.78*
PEC -0.81* 0.28
-glucosidase ex 0.74* 0.25
Urease ex 0.40 0.62*
Prp.Tot. 0.31 0.30
a) b)
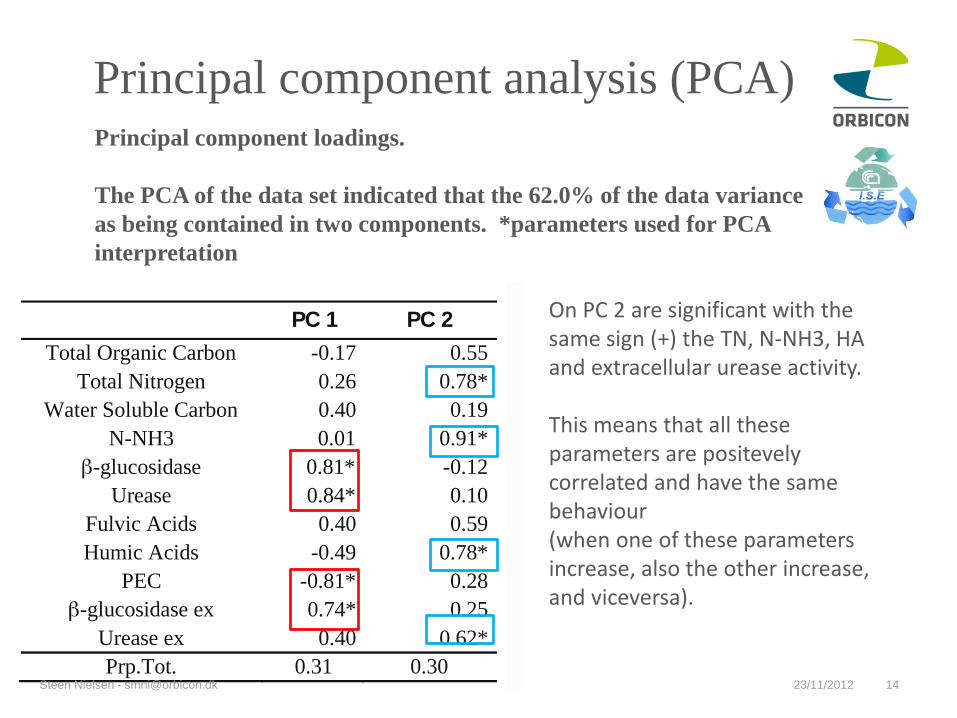
Principal component analysis (PCA)
Steen Nielsen - [email protected]
Principal component loadings.
The PCA of the data set indicated that the 62.0% of the data variance
as being contained in two components. *parameters used for PCA
interpretation
On PC 2 are significant with the same sign (+) the TN, N-NH3, HA and extracellular urease activity. This means that all these parameters are positevely correlated and have the same behaviour (when one of these parameters increase, also the other increase, and viceversa).
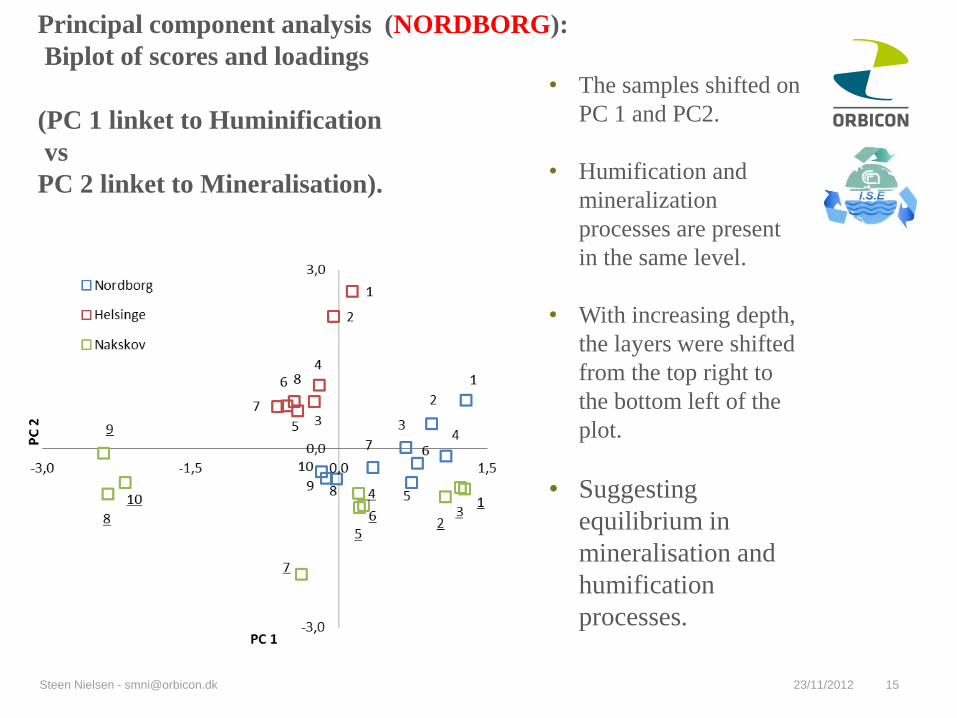
Principal component analysis (NORDBORG):
Biplot of scores and loadings
(PC 1 linket to Huminification
vs
PC 2 linket to Mineralisation).
23/11/2012 15 Steen Nielsen - [email protected]
• The samples shifted on
PC 1 and PC2.
• Humification and
mineralization
processes are present
in the same level.
• With increasing depth,
the layers were shifted
from the top right to
the bottom left of the
plot.
• Suggesting
equilibrium in
mineralisation and
humification
processes.
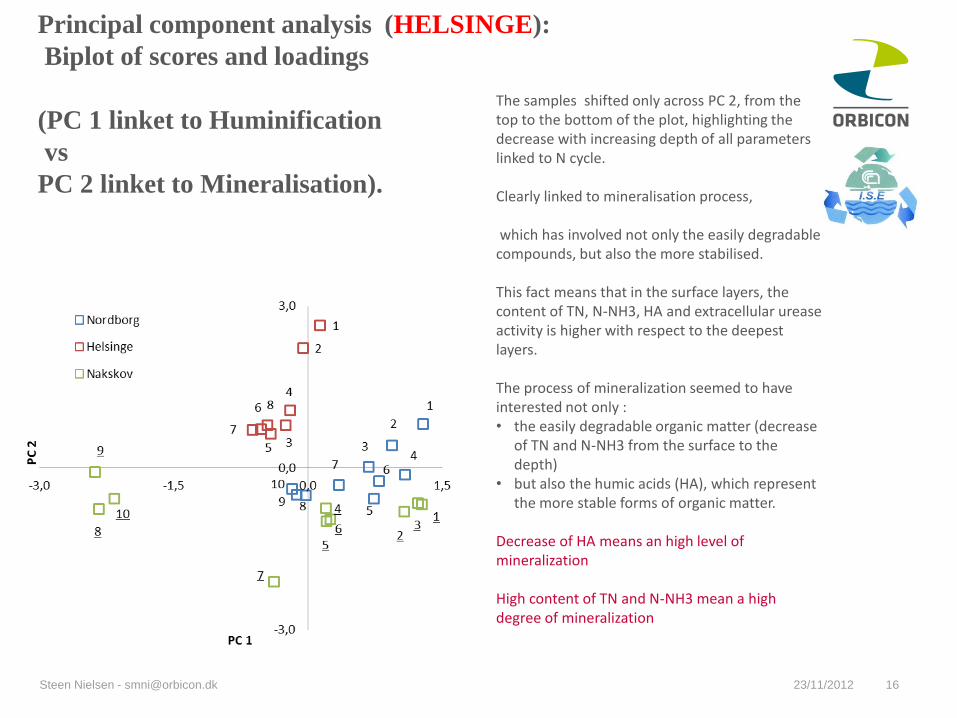
Principal component analysis (HELSINGE):
Biplot of scores and loadings
(PC 1 linket to Huminification
vs
PC 2 linket to Mineralisation).
23/11/2012 16 Steen Nielsen - [email protected]
The samples shifted only across PC 2, from the top to the bottom of the plot, highlighting the decrease with increasing depth of all parameters linked to N cycle. Clearly linked to mineralisation process, which has involved not only the easily degradable compounds, but also the more stabilised. This fact means that in the surface layers, the content of TN, N-NH3, HA and extracellular urease activity is higher with respect to the deepest layers. The process of mineralization seemed to have interested not only : • the easily degradable organic matter (decrease
of TN and N-NH3 from the surface to the depth)
• but also the humic acids (HA), which represent the more stable forms of organic matter.
Decrease of HA means an high level of mineralization High content of TN and N-NH3 mean a high degree of mineralization
23/11/2012 17 Steen Nielsen - [email protected]
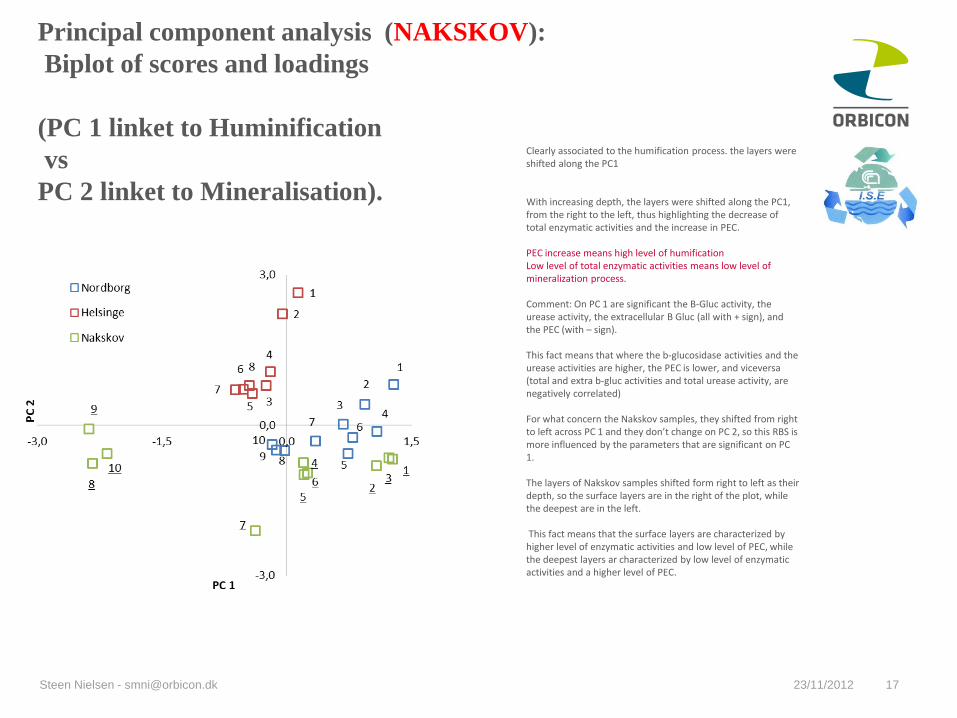
Clearly associated to the humification process. the layers were shifted along the PC1 With increasing depth, the layers were shifted along the PC1, from the right to the left, thus highlighting the decrease of total enzymatic activities and the increase in PEC. PEC increase means high level of humification Low level of total enzymatic activities means low level of mineralization process. Comment: On PC 1 are significant the B-Gluc activity, the urease activity, the extracellular B Gluc (all with + sign), and the PEC (with – sign). This fact means that where the b-glucosidase activities and the urease activities are higher, the PEC is lower, and viceversa (total and extra b-gluc activities and total urease activity, are negatively correlated) For what concern the Nakskov samples, they shifted from right to left across PC 1 and they don’t change on PC 2, so this RBS is more influenced by the parameters that are significant on PC 1. The layers of Nakskov samples shifted form right to left as their depth, so the surface layers are in the right of the plot, while the deepest are in the left. This fact means that the surface layers are characterized by higher level of enzymatic activities and low level of PEC, while the deepest layers ar characterized by low level of enzymatic activities and a higher level of PEC.
Principal component analysis (NAKSKOV):
Biplot of scores and loadings
(PC 1 linket to Huminification
vs
PC 2 linket to Mineralisation).
Conclusions (1 – 2)
Stabilisation of sludges was investigated in three different Danish STRBSs
(Helsinge, Nordborg, Nakskov).
• The study demonstrated the successful stabilisation of organic matter in the
three systems.
• The quality of sludge applied did not affect the process of stabilisation, even
though different pathways were followed.
• On the basis of the biochemical characterisation of sludge residue
• It is, in fact, possible to firmly establish a connection between the sludge
quality applied (deriving from different treatment aerobic and/or anaerobic
processes) to the STRBSs and the different pathways of organic matter
stabilsation (humification and/or mineralisation processes).
23/11/2012 18 Steen Nielsen - [email protected]
Conclusions (2 – 2)
The presence/absence of anaerobic sludge seemed to have a considerable
influence on the stabilisation occurring in the STRBSs:
In the case of:
Aerobic sludges, the humification process will be prevalent
Anaerobic sludges, the mineralisation process is likely to override the other
processes of stabilisation.
The STRB is, if the system has the right dimensioning, design and operation in
relation to the sludge quality, a feasible technology for sludge treatment and
stabilisation before its final land disposal.
23/11/2012 19 Steen Nielsen - [email protected]
THANK YOU FOR YOUR ATTENTION
Steen Nielsen - [email protected] 23/11/2012 20
ACKNOWLEDGEMENTS
Thanks to the different partners involved in this study:
CNR- ISE - National Research Council
Istitute for Ecosystem Study – Pisa
Grazia Masciandaro
Eleonora Peruzzi
Photo: Orbicon


![Performance Evaluation of Waste Stabilisation Ponds · of proper operation and maintenance, improper positioning of inlet and outlet and sludge accumulation amongst others 2]. WSP](https://img.pdfslide.net/doc/110x75/5ea4b67c2b478c02ae55be12/performance-evaluation-of-waste-stabilisation-ponds-of-proper-operation-and-maintenance.jpg)