Embed Size (px)
Citation preview

Stabilisation of water-in-oil emulsions to improve the
emollient properties of Lipstick
A dissertation submitted in partial fulfilment of the requirement for the degree of
MRes Chemical Engineering Science at the University of Birmingham
By: Mark Stewart Taylor
School of Chemical Engineering
The University of Birmingham
January 2011

University of Birmingham Research Archive
e-theses repository This unpublished thesis/dissertation is copyright of the author and/or third parties. The intellectual property rights of the author or third parties in respect of this work are as defined by The Copyright Designs and Patents Act 1988 or as modified by any successor legislation. Any use made of information contained in this thesis/dissertation must be in accordance with that legislation and must be properly acknowledged. Further distribution or reproduction in any format is prohibited without the permission of the copyright holder.

i
Abstract
The stabilisation of water-in-oil (W/O) emulsion lipstick with up to 40% aqueous
phase has been investigated. The intention is to use these emulsions to deliver
moisture, active hydrophilic ingredients and humectants to the lips.
Three lipophilic non-ionic emulsifiers were used to stabilise the water droplets,
PGPR (HLB 1.5 ± 0.5), Span 80 (HLB 4.3) and a blend of Span 80 with Tween 80
(HLB 5). These were investigated with or without crystalline particles of
microcrystalline and carnauba wax. Emulsification was carried out using high shear
(high energy/ short time via a Silverson L4 RT High shear laboratory mixer). The
emulsions were produced at 95 to 100 °C to ensure that no crystals were present
during droplet formation. This was then followed by rapid cooling to -20 °C over a
period of 20 minutes using refrigeration. Emulsion stability and droplet size
distribution were determined using pNMR in conjunction with optical microscopy and
cryo-SEM. A comparison of the physical and viscoelastic properties of the emulsion
lipstick formulations was made with a conventional lipstick. Penetrometer,
compression and rheological non-destructive oscillation testing were used for this
comparison.
Emulsions prepared with PGPR were shown to be more stable and had smaller
droplet sizes and droplet size distributions than those prepared with Span 80 and the
blend of Span 80 with Tween 80. As the water content increased the ‘lipsticks’
softened and became less elastic. This trend could be removed using additional
crystalline solids in the continuous phase.
Keywords: Cosmetic; Crystalline; HLB; Lipstick; Non-ionic Emulsifiers; PGPR;
pNMR; Span 80; Stabilisation; Tween 80; Water-in-oil (W/O) emulsions; Waxes.

ii
Acknowledgements
The work was carried out within the Centre for Formulation Engineering, School of
Chemical Engineering, University of Birmingham. I wish to express my sincere
gratitude to my supervisors, Professor Ian T. Norton and Dr. Benjamin Le Reverend
for their valuable and constructive advice throughout the entire period of the project. I
am deeply grateful to programme manager Dr. Richard Greenwood for the
endorsement of the MRes and for his invaluable help during the write up phase of
the project.
Very special thanks to the following staff and postgraduate students for technical
help within the department; Sala Odeen, Asja Pörtsch, Roman Pichot, Sarah Frasch-
Melnik, Jennifer Norton, Aleksandra Pawlik, Fideline Tchuenbou and Georgina
Porras Parral, alongside Theresa Morris from Metallurgy and Materials Engineering.
Finally I want to express my appreciation to Wilma O’Leary technical expert in
Cosmetics, Boots’ HQ for her initial help with formulation and providing the
necessary materials (waxes and oils) throughout the duration of the project.

iii
Contents
1 Introduction ......................................................................................................... 1
1.1 Layout of the Thesis ..................................................................................... 4
2 Literature Review ................................................................................................ 5
2.1 Lipstick ......................................................................................................... 5
2.1.1 Brief History ............................................................................................ 5
2.1.2 Ingredients & Product Composition ........................................................ 5
2.2 Waxes ........................................................................................................ 11
2.2.1 Beeswax ............................................................................................... 12
2.2.2 Berry Wax ............................................................................................. 13
2.2.3 Carnauba Wax ...................................................................................... 13
2.2.4 Hard Paraffin ........................................................................................ 13
2.2.5 Microcrystalline Waxes and Multiwax ................................................... 14
2.3 Emollients .................................................................................................. 14
2.4 Lip Physiology & Emollient Therapy ........................................................... 15
2.5 Emulsions, Emulsifiers & Interfacial Tension ............................................. 17
2.6 HLB System ............................................................................................... 21
2.7 Emulsion stability & instability .................................................................... 24
2.8 Crystal Stabilisation ................................................................................... 27
2.9 Microbial stability & Origin of Contamination .............................................. 34
2.10 Emulsion Processing ................................................................................. 35

iv
2.11 Characterisation & Analysis of microcrystalline structure ........................... 37
2.11.1 Rheology & Texture ........................................................................... 37
2.11.2 Differential Scanning Colorimetry - DSC ........................................... 39
2.11.3 Pulsed Nuclear Magnetic Resonance – pNMR ................................. 40
2.11.4 Cryogenic Scanning Electron Microscopy - Cryo-SEM ..................... 41
3 Materials ........................................................................................................... 42
3.1 Waxes & Emulsifiers .................................................................................. 42
3.2 Emulsifier Selection ................................................................................... 42
3.2.1 Emulsifier Blend Calculations ............................................................... 44
4 Research Methodology ..................................................................................... 45
4.1 Differential Scanning Colourimetry – DSC & Enthalpy calclations ............. 45
4.2 Sample Formulation 1 - Basic Lipstick Preparation .................................... 47
4.3 Interfacial Tension and Surface Excess Concentration .............................. 48
4.3.1 IFT Plate Measurement principle .......................................................... 51
4.4 Sample Formulation 2 - Emulsion Lipstick Preparation .............................. 52
4.5 Pulsed Nuclear Magnetic Resonance – pNMR; Emulsion stability & Droplet
size distribution ..................................................................................................... 54
4.5.1 Droplet Size Distribution measurement ................................................ 57
4.6 Microscopy ................................................................................................. 58
4.6.1 Optical Microscopy ............................................................................... 58
4.6.2 Cryo-Scanning Electron Microscopy – Cryo-SEM ................................ 59
4.7 Texture Profile Analysis - TA ..................................................................... 60

v
4.7.1 Penetrometer Test ................................................................................ 60
4.7.2 Compression Test ................................................................................ 62
4.7.3 Rheology .............................................................................................. 64
5 Results, Data Analysis & Discussion ................................................................. 65
5.1 Introduction ................................................................................................ 65
5.2 Interfacial tension ....................................................................................... 65
5.3 Thermo-physical Characteristics using Differential Scanning Colorimetry –
DSC on Raw Waxes & Basic Lipstick Formula ..................................................... 73
5.3.1 Thermo-physical Characteristics – DSC on Waxes .............................. 73
5.3.2 Wax selection for Simplified Basic Lipstick Formula & Thermo-physical
Characteristics – DSC Basic Lipstick Formula .................................................. 74
5.3.3 Thermo-physical Characteristics – DSC on Emulsions ........................ 76
5.4 Emulsion Stability ....................................................................................... 83
5.4.1 Coalescence and Droplet Evolution ...................................................... 83
5.5 Emulsifier, Droplet Size Distribution & Microscopy .................................... 86
5.5.1 Size Distribution and Mophology .......................................................... 86
5.6 Texture Profile Analysis - TA ..................................................................... 99
5.6.1 Introduction ........................................................................................... 99
5.6.2 Penetration and Compression .............................................................. 99
5.7 Rheology .................................................................................................. 105
5.7.1 Introduction ......................................................................................... 105
5.7.2 Viscoelasticity ..................................................................................... 105

vi
6 Conclusions .................................................................................................... 111
7 Further Work ................................................................................................... 113
Appendix .................................................................................................. 114
References .............................................................................................. 120

vii
Figures
Fig. 1.1. The global cosmetics industry segmented market. ....................................... 3
Fig. 1.2. The Top 10 Global Players in the cosmetics industry. .................................. 3
Fig. 2.1. Ricinoleic acid; the main fatty acid in Castor Oil (85%). Hydroxyl fuctional
group gives Castor oil its unusual polar qualities. .................................................... 10
Fig. 2.2. Castor Oil – main triglyceride polar structure with Ricinoleic acid. ............... 8
Fig. 2.3. Pigments & Dyes. ......................................................................................... 9
Fig. 2.4. Carnauba Wax main ester structure. .......................................................... 12
Fig. 2.5. Structural physiology of the Lips, showing the cells of the epidermis and
dermis ...................................................................................................................... 16
Fig. 2.6. Crystallized triacylglycerols (TAG), (a) molecular structure, (b) tuning fork
conformation and (c) chair conformation. ................................................................. 29
Fig. 2.7. Double chain length structures, (a) alpha (α) tuning fork, (b) beta prime (β’)
tilted tuning fork and (c) beta (β) stacked chair. ....................................................... 30
Fig. 2.8. Triple chain length structures, (a) alpha (α) tuning fork, (b) beta prime (β’)
tilted tuning fork and (c) beta (β) stacked chair. ....................................................... 31
Fig. 4.1. Flow Chart for the Preparation of Basic Lipstick. ........................................ 47
Fig. 4.2. Flow Chart for the Preparation of Emulsion Lipstick ................................... 53
Fig. 4.3. Profile of Penetrometer Test ...................................................................... 61
Fig. 4.4. Profile of Compression Firmness Test conducted ...................................... 63
Fig. 5.1. Isotherms of equilibrium Interfacial Tension (mN/m) vs Concentration of
Emulsifier (mg/L), between Castor oil and water (de-ionised), measured by Kruss

viii
Standard Plate (Pt). Emulsifiers tested: Span 80 (HLB = 4.3), PGPR (HLB = 1.5 ±
0.5) and a blend of Span 80 with Tween 80 (HLB = 5). ............................................ 67
Fig. 5.2. Isotherms of equilibrium Interfacial Tension vs concentration natural
logarithm - ln Conc. (mg/L) between Castor oil and water (de-ionised), measured by
Kruss Standard Plate (Pt). Emulsifiers tested: Span 80 (HLB = 4.3), PGPR (HLB =
1.5 ± 0.5) and a blend of Span 80 with Tween 80 (HLB = 5). Showing only the linear
regression portion approaching the surface saturation critical micelle concentration
points........................................................................................................................ 68
Fig. 5.3. Molecular structure of Polyglycerol polyricinoleate – PGPR. ...................... 69
Fig. 5.4. Schematic orientation of two PGPR molecules in a W/O emulsion adsorbed
at the oil-water interface. .......................................................................................... 69
Fig. 5.5. Molecular structure of Sorbitan monooleate – Span 80. ............................. 70
Fig. 5.6. Schematic orientation of two Span 80 molecules in a W/O emulsion
adsorbed at the oil-water interface. .......................................................................... 70
Fig. 5.8. Schematic orientation of Span 80 and Tween 80 molecules in a W/O
emulsion adsorbed at the oil-water interface. ........................................................... 72
Fig. 5.15. DSC Thermogram for the Basic Lipstick formula (Melting Point Range)
containing 7.1 wt% Carnauba wax, 15.98 wt% Microcrystalline wax and 76.92 wt%
Castor oil. ................................................................................................................. 75
Fig. 5.16. DSC Thermograms for the Basic Lipstick formula and Emulsion Lipstick
Formulas 10, 20, 30 and 40 wt% water with 1 wt% PGPR. ...................................... 77
Fig. 5.17. DSC Thermograms for the Basic Lipstick formula and Emulsion Lipstick
Formulas 10, 20, 30 and 40 wt% water with 2 wt% PGPR. ...................................... 78

ix
Fig. 5.18. DSC Thermograms for the Basic Lipstick formula and Emulsion Lipstick
Formulas 10, 20, 30 and 40 wt% water with 1 wt% Span 80 with Tween 80. ........... 78
Fig. 5.19. DSC Thermograms for the Basic Lipstick formula and Emulsion Lipstick
Formulas 10, 20, 30 and 40 wt% water with 2 wt% Span 80 with Tween 80. ........... 79
Fig. 5.20. DSC Thermograms for the Basic Lipstick formula and Emulsion Lipstick
Formulas 10, 20, 30 and 40 wt% water with 1 wt% Span 80. ................................... 79
Fig. 5.21. DSC Thermograms for the Basic Lipstick formula and Emulsion Lipstick
Formulas 10, 20, 30 and 40 wt% water with 2 wt% Span 80. ................................... 80
Fig. 5.22. DSC Thermograms for the Basic Lipstick formula and Hard Paraffin
Emulsion Lipstick Formulas containing 40 wt% water with 1 wt% Emulsifiers PGPR,
Blend of Span 80 with Tween 80 and Span 80. ....................................................... 80
Fig. 5.23. DSC Thermograms for the Basic Lipstick formula and Hard Paraffin
Emulsion Lipstick Formulas containing 40 wt% water with 4 wt% Emulsifiers PGPR,
Blend of Span 80 with Tween 80 and Span 80. ....................................................... 81
Fig. 5.24. Stability (evolution) of the volume-weighted mean droplet diameter D3.3, for
40 wt% water and 1 wt% emulsifier over a period of 127 days. ............................... 83
Fig. 5.25. Stability (evolution) of the volume-weighted mean droplet diameter D3.3
frequency distributions for 40 wt% water, 1 wt% Span 80 with Tween 80 (HLB = 5) at
0 and 127days. ......................................................................................................... 84
Fig. 5.26. Stability (evolution) of the volume-weighted mean droplet diameter D3.3
frequency distributions for 40 wt% water, 1 wt% Span 80 (HLB = 4.3) at 0 and
127days. ................................................................................................................... 84

x
Fig. 5.27. Stability (evolution) of the volume-weighted mean droplet diameter D3.3
frequency distributions for 40 wt% water, 1 wt% PGPR (HLB = 1.5 ± 0.5) at 0 and
127days. ................................................................................................................... 85
Fig. 5.28. Photomicrographs of 20 wt% water with 1 wt% PGPR, showing droplets
with diameter D1,0 5 μm and smaller. ....................................................................... 95
Fig. 5.29. 30 wt% water with 1 wt% Span 80, showing droplets with diameter D1,0 20
μm and smaller. Droplet coalescence can also be observed for droplets around 5
μm... ......................................................................................................................... 96
Fig. 5.30. 40 wt% water with 1 wt% Span 80 with Tween 80, showing droplets with a
droplet diameter D1,0 spread above 10 μm and smaller than 5 μm. ......................... 96
Fig. 5.31. Cryo-SEM micrograph of Basic Sample (7.1 wt% Carnauba, 15.98 wt%
Microcrystalline wax and 76.92 wt% Castor oil) with a pure crystalline structure. .... 97
Fig. 5.32. Cryo-SEM micrograph of 40 wt % water with 1 wt% PGPR showing a
droplet D1,0 of 5 μm surrounded by smaller droplets at pits. Continuous oil and
crystalline phase can be seen encasing the droplets. .............................................. 97
Fig. 5.33. Cryo-SEM micrograph of Hard paraffin formula containing 40 wt% water
with 1 wt% Span 80 with Tween 80. A couple of water droplets can be seen around
D1,0 = 20 μm in diameter encased in surface active wax crystals. ............................ 98
Fig. 5.34. Texture profile penetrometer test on Basic Lipstick and Emulsions samples
containing 10, 20, 30 & 40 wt% water with 1 wt% Emulsifiers. ............................... 101
Fig. 5.35. Compression firmness test on Basic Lipstick and Emulsions samples
containing 10, 20, 30 & 40 wt% water with 1 wt% Emulsifiers. ............................... 103
xi
Fig. 5.36. Changes in the viscoelastic Storage (elastic) G’ and Loss (viscous) G’’
moduli vs. changes in the emulsion water content for 1 wt% PGPR, comparisons
with a conventional lipstick and the basic lipstick. .................................................. 107
Fig. 5.37. Changes in the viscoelastic Storage (elastic) G’ and Loss (viscous) G’’
moduli vs. changes in the emulsion water content for 1 wt% Span 80 with Tween 80,
comparisons with a conventional lipstick and the basic lipstick. ............................. 108
Fig. 5.38. Changes in the viscoelastic Storage (elastic) G’ and Loss (viscous) G’’
moduli vs. changes in the emulsion water content for 1 wt% Span 80, comparisons
with a conventional lipstick and the basic lipstick. .................................................. 109
Fig. 5.9. Differential Scanning Colorimetric Thermogram for Beeswax
(10 to 120°C). ......................................................................................................... 114
Fig. 5.10. Differential Scanning Colorimetric Thermogram for Berry wax (10 to
120°C). ................................................................................................................... 115
Fig. 5.11. Differential Scanning Colorimetric Thermogram for Carnauba wax (10 to
120°C). ................................................................................................................... 116
Fig. 5.12. Differential Scanning Colorimetric Thermogram for Hard Paraffin (10 to
120°C). ................................................................................................................... 117
Fig. 5.13. Differential Scanning Colorimetric Thermogram for Microcrystalline Wax
(10 to 120°C). ......................................................................................................... 118
Fig. 5.14. Differential Scanning Colorimetric Thermogram for Multiwax (10 to
120°C). ................................................................................................................... 118

xii
Tables
Table. 2.1. HLB Correlations. ................................................................................... 22
Table. 4.1. DSC Program settings (Software used - Pyris for Windows, Version
3.04.) ........................................................................................................................ 46
Table. 4.2. IFT Procedure settings ........................................................................... 50
Table. 4.3. Lipstick Formulations .............................................................................. 52
Table. 4.4. pNMR Instrument settings (software version V2.2) ................................ 56
Table. 4.5. Acquisition parameters for W/O droplet size analysis ............................ 56
Table. 4.6. TA settings Exponent Stable Micro Systems version 4,0,13,0 ............... 60
Table. 4.7. TA settings Exponent Stable Micro Systems version 4,0,13,0 ............... 62
Table. 4.8. Viscoelastic – Dynamic oscillation sweep settings (Stress controlled) ... 64
Table. 5.1. Surface activity of Emulsifiers and blend at 31.0°C. ............................... 68
Table. 5.2. Thermo-physical Characteristics of Waxes using Differential Scanning
Colorimetry. .............................................................................................................. 73
Table. 5.3. Thermo-physical characteristics comparisons for Basic Lipstick and
Emulsion samples .................................................................................................... 82
Table. 5.4. Emulsion based Lipsticks, initial approach with 10 & 20 wt% water
content and 1 wt% Emulsifiers. Volume-weighted mean droplet diameter D3.3 and the
calculated surface-weighted mean droplet diameter D3.2. ........................................ 88
Table. 5.5. Emulsion based Lipsticks, second approach with 10, 20, 30 & 40 wt%
water content and 1 & 2 wt% PGPR (HLB = 1.5 ± 0.5). Volume-weighted mean
droplet diameter D3.3 and calculated surface-weighted mean droplet diameter D3.2. 89
xiii
Table. 5.6. Emulsion based Lipsticks, second approach with 10, 20, 30 & 40 wt%
water content and 1 & 2 wt% Span 80 (HLB = 4.3). Volume-weighted mean droplet
diameter D3.3 and calculated surface-weighted mean droplet diameter D3.2. ............ 90
Table. 5.7. Emulsion based Lipsticks, second approach with 10, 20, 30 & 40 wt%
water content and 1 & 2 wt% Span 80 with Tween 80 (HLB = 5). Volume-weighted
mean droplet diameter D3.3 and calculated surface-weighted mean droplet diameter
D3.2. 91
Table. 5.8. Emulsion based Lipsticks containing Hard Paraffin, final approach with 40
wt% water content and 1 & 4 wt% Emulsifiers. Volume-weighted mean droplet
diameter D3.3 and calculated surface-weighted mean droplet diameter D3.2. ............ 92
Table. 5.9. Texture profile penetrometer data for all samples. ............................... 102
Table. 5.10. Compression firmness data for all samples. ....................................... 104
Table. 5.11. Viscoelastic moduli, G’ (Storage) & G’’ (Loss) data for all samples. ... 110

xiv
Abbreviations aw Water activity
BHT Butylated Hydroxytoluene
CMC Critical Micelle Concentration
cryo-SEM Cryogenic Scanning Electron Microscopy
D1.0 Number-length mean droplet diameter
D3.2 Surface-weighted mean droplet diameter
D3.3 Volume-weighted mean droplet diameter
Ds Self-diffusion coefficient
DSC Differential Scanning Colorimetry
Endo Endothermic
Exo Exothermic
F Force (on the balance)
G’ Storage (elastic) modulus
G’’ Loss (viscous) modulus
HLB Hydrophile-Lipophile Balance
L Length of Kruss Standard Plate
Avagadro’s constant
O/W Oil-in-water
O/W/O Oil-in-water-in-oil
PGPR Polyglycerol polyricinoleate
pNMR Pulsed Nuclear Magnetic Resonance
Span 80 Sorbitan monooleate
TAG Triacylglycerols
Tween 80 Polyoxyethylene sorbitan monooleate
W/O Water-in-oil
W/O/W Water-in-oil-in-water
wt% & w/w % Weight percent

xv
Symbols α Alpha
β Beta
β’ Beta prime
θ Contact angle
Г Surface excess concentration
Acid number & Area per molecule
Bulk concentration
Universal gas constant
Saponification number
Temperature
Interfacial/ Surface tension

1
1 Introduction
The cosmetic industry is a huge global economy worth approximate £26 billion
(Barton, 2008) of which lipstick together with decorative cosmetics occupies 13% of
the market (see Figure 1.1). The top 10 global players as illustrated in Figure 1.2
hold 60% of a very competitive market share (Weber & de Villebonne, 2002). There
is a direct link between the function and quality of the lipstick and the ingredients
used during formulation.
Moisture along with oils, are two of the principal components required to minimise
the onset of dry unsightly wrinkled chapped lips (Cannon, 2008). Avoidance of
overexposure to UV sunlight along with any infectious pathogens are also paramount
along with increasing the lips antioxidant status to neutralize any free radicals activity
(Halliwell, 1994; Bagchi and Puri, 1998).
What has prompted this research is to provide a medium in the form of a cosmetic
lipstick capable of providing all or most of these properties for the purpose of mainly
appearance, health and beauty.
With so much emphasis being placed on aesthetic appearance and youth, together
with anti-aging products, any innovative product which promotes the bodies’
resistance to aging, looking healthier and younger is of great benefit to the cosmetics
industry. Within the cosmetics industry the combination of product quality, backed up
with scientific data followed by good marketing must be compelling to gain shelf
space and consumer attention.
Although there are a large number of lip products available to the consumer
including Lip balm, gloss, plumpers, stain, treatment and pencils, none provide all of
the aforementioned properties. The supposition is, by adding water to typical
conventional lipstick products, in the form of a water-in-oil emulsion will not only

2
provide additional moisture for the lips but will also provide a medium through which
any additional active healing ingredients including humectants could then be added
and therefore delivered to the lips by way of microencapsulation (Cannon, 2008).
Microencapsulation provides an ideal sheath medium enabling the isolation of any
active healing ingredients, thus providing ideal protection from evaporation;
maintaining potency and guarding against deterioration (Guiqin et al., 1997).
As cosmetic emulsions have been predominantly the best delivery system for
conditioners to the skin (Rawlings, Canestrari, & Dobkowski, 2004; Kumar 2005; Teo
et al., 2010), the initial part of this research is to formulate water-in-oil (W/O)
emulsion lipsticks, with a view to deliver not only moisture but also hydrophilic
ingredients to the lips, producing stable products with up to 40% water content.
Whilst this may appear to be practicable, the predicament is to achieve this with
emulsifiers that are ingestible and dermatologically safe to use on the lips, in addition
to producing a product that not only resembles a typical conventional lipstick in terms
of its physicochemistry, organoleptic qualities, specifically texture and feel, but also
has a stable shelf life.
The final challenge is to ensure the active water soluble ingredients in the emulsion
products are delivered effectively to the surface of the lips by way of the emulsion
droplets breaking after application. Assuming the emulsion was to break during
application due to the delivery mechanical stress, this would look and feel
unpleasant, however if it was to break too slowly again the product is of minimal use.

3
Fig. 1.1. The global cosmetics industry segmented market. (Adapted: Weber &
de Villebonne, 2002).
Fig. 1.2. The Top 10 Global Players in the cosmetics industry. (Adapted: Weber
& de Villebonne, 2002; Groves, 2008).
Sun Care: 2%Baby Care: 4% Mens' Toiletries: 4%Deodorants: 5%Bath & Shower: 10%Oral Hygiene: 12%Fragrances: 12%Lipstick & Makeup: 13%Skin Care: 16%Hair Care: 22%
L'Oreal: 14.2%Procter & Gamble: 13.2% Unilever: 7.5%Shiseido: 4.7%Estee Lauder: 4.6%Avon: 4.2%Beiersdorf AG: 3.5%Johnson & Johnson: 3.2%Alberto-Culver: 2.5%Kao: 2.4%Others: 40.0%

4
1.1 Layout of the Thesis
This Thesis consists of seven chapters. This chapter, Chapter 1, gives a brief
introduction to the cosmetic industry and introduces the research topic. Chapter 2
gives a thorough methodical literature review of the research topic. Chapter 3
outlines the materials used in the experiments followed by Chapter 4 which outlines
the research methodology. A breakdown of the results, data analysis and discussion
are detailed in Chapter 5. Chapter 6 summarises, evaluates and reemphasizes the
significance of the findings followed by Chapter 7 which suggests an outline of any
future research.

5
2 Literature Review
2.1 Lipstick
2.1.1 Brief History
Cosmetics including lipstick, although originally developed by the Egyptians as
ointments and ritual oils for the dead, eventually came to be used to soothe, adorn,
accentuate and treat the skin of the living and are currently used by over 90% of the
female population. This association of cosmetics and medicines has continued to the
present where beauty products are frequently advertised as having healing
properties (Donsky, 1985; Brumberg, 1986; Mulhern et al., 2003). Lipsticks have
emerged from a jumble of primitive ingredients such as vermilion - a naturally
occurring ore of mercury (red mercury (II) sulphide HgS), seaweed and mulberry,
into the sophisticated products used today, containing mainly oils, fats and waxes
(Cohen & Kozlowski, 1998).
2.1.2 Ingredients & Product Composition
Lipstick is a solid fatty based cosmetic product made up of waxes and oils, with
dissolved or suspended coloured pigments and emollients that apply colour and
texture to the lips (Ryu et al., 2005). A good lipstick must possess an ideal minimum
and maximum thixotropy. Its viscosity must be high enough in order to produce a
moulded stick product, however being thixotropic it must undergo a reduction in
viscosity when mechanically disturbed via spreading on application at 32°C (lip
temperature) to produce a smooth even layer on the lips with minimum pressure
(Salvador & Chisvert, 2007). The applied film must also be impervious to the mild
abrasions encountered during eating, drinking and smoking and should ideally last
for at least 4 – 6hrs, a period considered reasonably permanent and not requiring

6
more than 2 to 3 applications daily (Harry & Wilkinson 1973; McKetta Jr., 1993). It
should be of such composition as to cover only the portion of the lips up to the
vermilion border and not bleed into the surrounding skin regions. Softening
temperature should not be confused with melting point temperature. Whilst it should
soften at 32°C, the actual melting point range should be between 55 to 75°C
(McKetta Jr., 1993).
When producing a lip product with emollient properties not only should the product
possess many if not all of the physicochemical organoleptic characteristics of a
typical standard lipstick product, but in addition any additions to the formula must be
safe to use on the lips and must not be unpleasant to taste.
Lipsticks usually contain three basic ingredients (Harry & Wilkinson 1973; Rajin,
Bono & Mun, 2007):
Oil (30-80%)
Wax (5-25%)
Colouring, pigment & Dyes (1-10%)
Oil (refined) is one of the main ingredients used when formulating a lipstick. The oil is
required to blend with the waxes to provide a suitable film when applied to the lips. It
also acts as a dispersing agent for insoluble pigments. The most common types of
oils used in lipstick production are castor, mineral, lanolin, jojoba and vegetable oil.
Oils in general are treated with BHT - Butylated Hydroxytoluene, an anti-oxidant
used to extend the shelf life and delay rancidity of oils and fats in foods and
cosmetics. Castor oil (Figure 2.1), being unusually polar compared to other natural
oils is traditionally used for its ability to dissolve bromoacid dyes (Figure 2.2). This is

7
due to the high content of ricinoleic acid (Figure 2.3) which contains a hydroxyl
functional group unique among similar natural triglycerides. In addition other
properties include a high viscosity, even when warm, which delays pigment settling
and a degree of oiliness which helps with gloss and emollience (Harry & Wilkinson,
1973).

8
O
O
O
O
CH3
OH
O
CH3
OH
O
CH3
OH
Molecular Formula = C57H104O9
Fig. 2.1. Castor Oil – main triglyceride polar structure with Ricinoleic acid.
(Source Structure: Drawn – Advanced Chemistry Development ACD/ChemSketch
Product Version 12.01)
9
OO
OH
OH
O
Fluorescein (a)
O
O
OHOH
O
Br
Br
Br
Br Eosin Y (b)
O
O
OHOH
O
Br
Br
N+
O-
O
N+O
-
O
Eosin B (c)
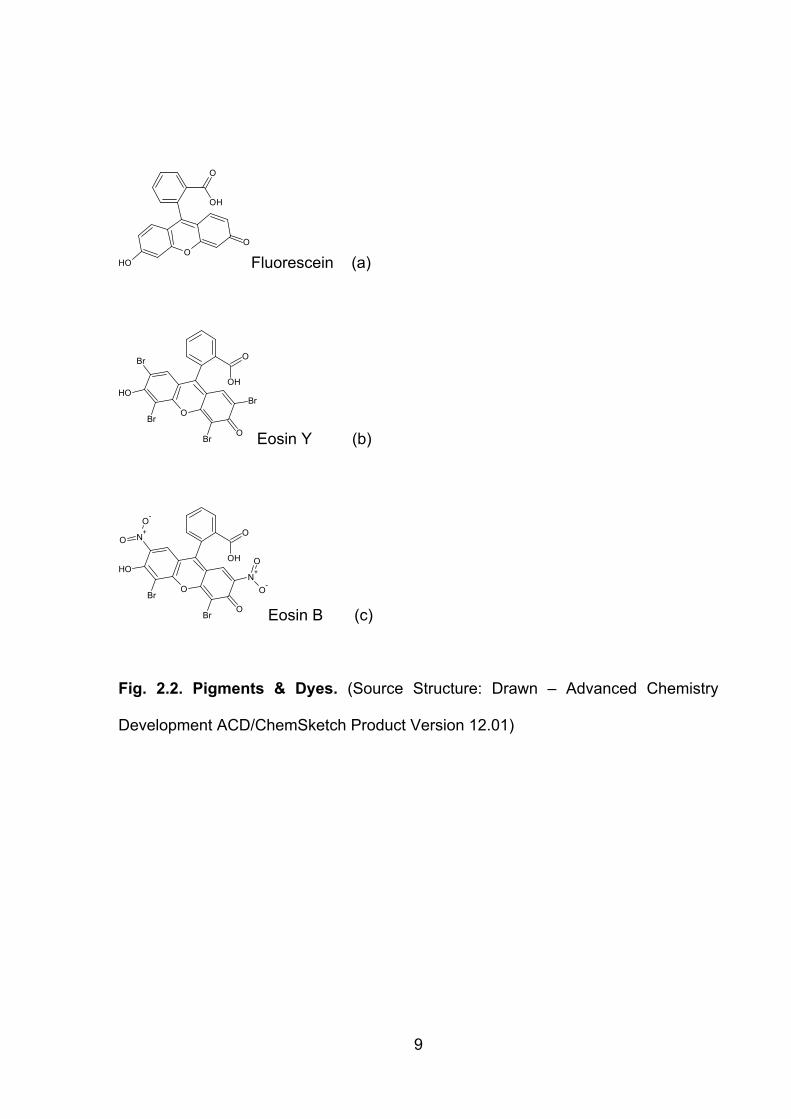
Fig. 2.2. Pigments & Dyes. (Source Structure: Drawn – Advanced Chemistry
Development ACD/ChemSketch Product Version 12.01)

10
OH
O
CH3
OH
Molecular Formula = C18H34O3
Fig. 2.3. Ricinoleic acid; the main fatty acid in Castor Oil (85%). Hydroxyl
fuctional group gives Castor oil its unusual polar qualities. (Source Structure:
Drawn – Advanced Chemistry Development ACD/ChemSketch Product Version
12.01)
Dyes in the form of bromo acids - bromo derivatives of fluorescein (Figure 2.2a), are
the main common additives used as pigments in lipsticks. Eosin is a fluorescent dye
produced by reacting bromine with fluorescein. There are two types used as
pigments, Eosin Y (Figure 2.2b) and Eosin B (Figure 2.2c). Eosin Y is a tetrabromo
derivate of fluorescein which produces a purple stain while Eosin B is a dibromo
dinitro derivate which produced a yellow-red stain. The two are normally used in
combination with each other. Whilst Eosin forms the red pigment in lipstick products
its intensity increases when it reacts with the NH2 groups in proteins on the surface
of the skin.
In recent years, ingredients such as jojoba oil, sunflower oil, chamomile oil, shea
butter vitamin E, aloe vera, collagen, amino acids, and sunscreen have been added

11
to lipstick. These extra components are used to keep lips soft, moist, and to provide
added protection from the sun and dryness.
2.2 Waxes
Waxes are used to give and impart gloss and hardness to the product, to stabilise
the stick and allow it to be moulded into shape and enable application. The ideal
characteristics are obtained by using a mixture of waxes of different melting points
and adjusting the final melting point by incorporating a sufficient amount of high
melting point wax e.g. carnauba wax, beeswax and candelilla wax (Harry &
Wilkinson 1973; Salvador & Chisvert, 2007).
Waxes are water-resistant materials made up of various substances including
hydrocarbons (alkanes and alkenes, branched or normal), ketones, alcohols,
aldehydes, sterol esters, alkanoic acids, terpenes, and monoesters with molecular
chain length ranging from C12 to C38. More commonly waxes are esters of a long
chain alcohol other than glycerol and a long chain acid as illustrated in Figure 2.4
with the wax ester of Carnauba.

12
CH3
O
O
CH3
Molecular Formula = C60H120O2
Fig. 2.4. Carnauba Wax main ester structure. (Source Structure: Drawn –
Advanced Chemistry Development ACD/ChemSketch Product Version 12.01)
2.2.1 Beeswax
Beeswax (Cera alba), with its unique biologically active characteristics, is one of
Natures’ oldest ingredients. It can be used as a thickening agent, emollient,
emulsifier and humectant. Its antiseptic and wound healing properties makes it an
ideal ingredient to use in cosmetics such as lipsticks. It is secreted by the honeybee
(Apis Mellifera), to build the walls of the honeycomb. When secreted it is initially a
transparent colourless liquid, which turns into a semi-solid substance on contact with
the atmosphere (Peters Rit et al., 1990; Adamczyk et al., 2010).

13
2.2.2 Berry Wax
Berry wax obtained from its namesake the female wax berry plant (Morella
cordifolia). The process of obtaining the wax was first noted by Thunberg in 1772;
where the wax was and still is obtain by means of boiling the berries in water and
skimming off the wax, followed by sun bleaching. It’s primarily used in polish,
ointments for wound dressing, candles and soaps. Like beeswax it has antiseptic
and wound healing properties making it ideal for cosmetics.
2.2.3 Carnauba Wax
Carnauba wax is obtained from the leaves of the Brazilian palm tree (Copernicia
cerifera), also referred to as the “Tree of Life”. Due to the regional equatorial climate,
the palm tree secretes the wax through the petioles of the leaves to protect against
dehydration. This wax is obtained from the leaves by either scrapping or mechanical
thrashing. Being one of the hardest naturally occurring waxes, when applied to
vehicles and floors and tables it is able to create a durable, lasting, glossy finish. It is
also used in lipsticks to prevent the oil from separating and to add structure to the
final product. Being a plant based substance and safe for human consumption it is
also used in a variety of foods as a coating candy and an anti-caking agent (Kelly,
1948; Melo et al., 1998; Milanovic et al., 2010).
2.2.4 Hard Paraffin
Hard Paraffin otherwise known as paraffin wax is essentially a mixture of long chain
high molecular weight alkanes of the order C20H42 to C40H82 inclusively, obtained
from crude petroleum. Whilst short chain low molecular weight alkanes are liquids at
room temperatures, paraffin wax is a solid due to the cross-linked arrangement of

14
the long chains. Due to its structure and physicochemistry it is used extensively in
pharmaceutical and cosmetic industries. Other applications include water proofing,
cork, paper, floor polishes, electric insulators, and leather finishing (Nhlapo, Luyt, &
Vosloo, 1998).
2.2.5 Microcrystalline Waxes and Multiwax
Microcrystalline (Cera Microcristallina) waxes differ from refined paraffin wax in that
the molecular structure is more branched and the hydrocarbon chains are longer
(higher molecular weight). Therefore the crystal structure is much finer than paraffin
wax, and this directly impacts many of the physical properties. The wax is a refined
mixture of solid, saturated aliphatic hydrocarbons, and is produced by de-oiling
certain fractions from the petroleum refining process. They are tougher, more flexible
and generally higher in melting point than paraffin waxes. Having a finer crystalline
structure also enables the wax to bind solvents or oil, and thus prevent the sweating-
out of compositions. These characteristic properties would make it an ideal base
material for cosmetics such as lipsticks (Crowley & Laefer, 2008).
2.3 Emollients
Emollients have been part of human life for centuries. The Greeks used wool fat on
their skin as early as 700 BC (Ersser et al., 2009). Medical grade lanolin is also used
in the formulation of many lip products, used to prevent chapped lips due to its
hypoallergenic and bacteriostatic properties.
The terms emollient and moisturiser have a tendency to be used synonymously.
However technically an emollient is a product that smoothes and softens the skin via

15
occlusion, whereby a moisturisers is a product that adds moisture to the skin (Choi et
al., 2005; Ersser et al., 2009).
Emollients have three basic properties (Rawlings et al., 2004):
Occlusion – traps water in the skin via a layer of oil on the surface preventing
transepidermal water loss, thus increase the moisture content of the stratum
corneum (outer layer of skin).
Humectants – substances with water-attracting properties that increase the
water holding capacity of the stratum corneum (outer layer of skin). By either
attracting moisture from the dermis to the epidermis or attracting moisture
from the environment to the epidermis.
Lubrication - adding slip or glide across the skin.
2.4 Lip Physiology & Emollient Therapy
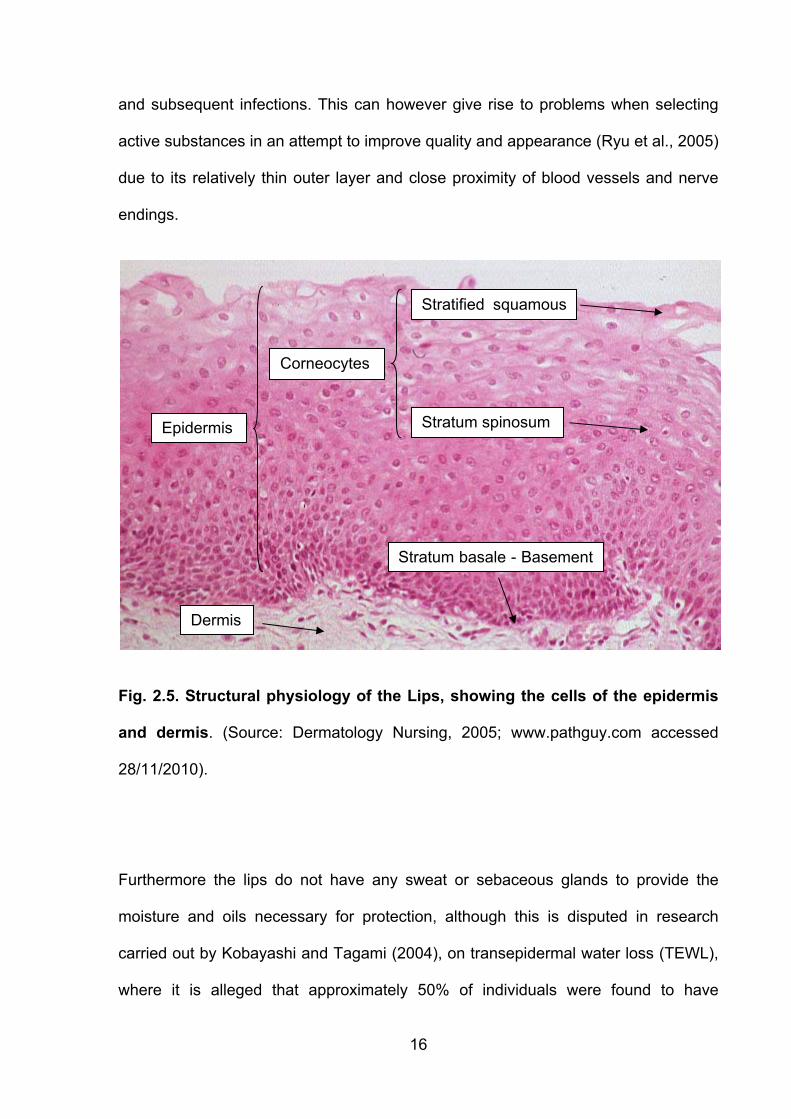
The outer layer of the lips (stratified squamous epithelium), as shown in Figure. 2.5,
is devoid of the horny stratum corneum layer according to Harry and Wilkinson,
(1973); whilst Ryu et al., (2005) state that the stratum corneum is relatively thin in
comparison to facial skin. Either way, as a result the lips appear translucent and red
due to underlying blood vessels and a lack of keratin (Kobayashi & Tagami, 2004).
As a consequence of this deficiency in keratin (partially-keratinised), these outer
cells known as corneocytes must be kept moist in order to prevent drying, wrinkling
16
and subsequent infections. This can however give rise to problems when selecting
active substances in an attempt to improve quality and appearance (Ryu et al., 2005)
due to its relatively thin outer layer and close proximity of blood vessels and nerve
endings.
Fig. 2.5. Structural physiology of the Lips, showing the cells of the epidermis
and dermis. (Source: Dermatology Nursing, 2005; www.pathguy.com accessed
28/11/2010).
Furthermore the lips do not have any sweat or sebaceous glands to provide the
moisture and oils necessary for protection, although this is disputed in research
carried out by Kobayashi and Tagami (2004), on transepidermal water loss (TEWL),
where it is alleged that approximately 50% of individuals were found to have
Stratified squamous
Dermis
Stratum basale - Basement
Stratum spinosum Epidermis
Corneocytes

17
sebaceous glands after adolescence at the vermilion border. Additionally, whereby in
the case of skin occlusive materials, e.g. barrier creams, which work by physically
trapping transepidermal water loss (TEWL) from the dermal layer of the skin (Wolf,
Orion & Davidovici, 2007). To facilitate similar additional protection to the lips; to
prevent or decrease cracking which could possibly lead to bacterial infections via
bacterial colonisation (Brown & Butcher, 2005), moisturisers and humectants are
essential. Humectants have an additional value, drawing moisture into the lips from
the environment. An additional point made by Kobayashi & Tagami (2004) is that the
transepidermal water loss (TEWL) on the lips is much higher than that compared
with the skin, to put it simply, its water-holding capacity is much less, in which case
moisturisers and humectants along with occlusive protection is necessary. In spite of
this, research conducted by Wolf et al (2007) state that reducing the transepidermal
water loss brings with it the disadvantage of slowing down tissue repair. This
however can be counteracted according to Rawling et al., (2004) as some oils
reduce transepidermal water loss by 98% whilst other only reduce it by 20-30%. The
formulation of an emollient, water-in-oil emulsion in lipstick form with the correct
amount of added humectants forms the basis of this research.
2.5 Emulsions, Emulsifiers & Interfacial Tension
An emulsion is traditionally defined as a dispersion of droplets of one liquid in
another, when the two liquids are immiscible. Many products can exist as emulsions,
including cosmetics, insecticides, crude oil and some pharmaceuticals (Rousseau,
2000).

18
In order to attain a state of minimum energy the surface of any liquid will always
orientate itself to the smallest possible area. In order to increase this surface area
work documented as free surface or free interfacial surface energy must be
expended, this energy, numerically is equal to the surface or interfacial tension.
Surface tension refers to liquids in contact with air or their saturated vapour, whereas
interfacial tension refers to two immiscible liquids in contact with each other.
Interfacial tensions are less than surface tensions, because the adhesive forces
between the molecules of the two phases forming the interface are greater than the
adhesive forces between molecules in a liquid phase interacting with molecules in a
gaseous phase. Increasing the adhesive force will give rise to a decrease in the
surface tension.
As emulsions are thermodynamically unstable systems (Krog, 1977), they tend to
phase separate quickly. Stabilisation is usually achieved by the addition of a protein
or an emulsifier or surfactant (surface active agent) (Wolf et al., 2007), however the
coexistence of both proteins and emulsifiers could lead to destabilisation and partial
coalescence as the proteins and emulsifiers will compete for space at the interface,
which can be beneficial in the production complex food colloids like ice cream
(Dickinson, Ritzoulis & Povey, 1999). Small molecular surfactants/ emulsifiers are
preferentially adsorbed at the interface displacing proteins and in the process
weakening the membrane causing destabilisation and partial coalescence. This
partial coalescence is essential to enable the fat globules to produce a structured
network in the frozen product to entrap the air bubbles (Goff, 1997).
A surfactant lowers the interfacial tension between the two immiscible phases via
adsorption at the interface (Everett, 1988) thus forming a mechanically cohesive
interfacial film around the droplets after emulsification, preventing coalescence

19
(Rousseau, 2000). It is important to stress that cohesive forces are the forces that
exist between molecules of one phase, whilst adhesive forces are the forces that
exist between molecules of two different phases. As the interfacial tension can be
defined as the work required in producing or creating a unit area of surface; by
reducing the interfacial tension, stable droplets of higher overall surface area can be
produced. The nature of the interface established through the adsorption of
emulsifiers, influences the two immiscible liquids to such an extent that one breaks
up during the emulsification process to form droplets (disperse phase) while the
other retains its continuity (continuous phase). How and why this occurs is due to the
fact that the emulsifiers at the interface are wetted by both liquids which individually
have different surface tensions on either side. As a result of this the interface will
always bend so that the side with the higher surface tension becomes concave, thus
producing droplets giving rise to either a water-in-oil (W/O) or an oil-in-water (O/W)
emulsion (Bancroft, 1913; Griffin, 1949). In order to maintain stability, the interfacial
film should be firm and permanent. Likewise, the electric charge produced on the
surface of the droplets is important, as its presence will produce repulsion between
any approaching droplets thus increasing stability. These two factors are
predominantly important during emulsification in order to reduce droplet flocculation,
film drainage and subsequent rupture of the interface as droplets formed during the
emulsification process will inevitably collide with one another giving rise to incessant
coalescence. With regards to solid water-in-oil (W/O) emulsions they carry less
significance after the crystallisation/ solidification of the continuous phase as the
solid matrix will inevitably help to stabilise the lipstick emulsion. In oil-in-water (O/W)
emulsions where the interfacial film is electrically charged this produces an overall
charge on the oil droplets balanced by the total charge in the double layer within

20
which there is an excess of oppositely charged ions (counter-ions). This is known as
the electric diffuse double layer or ionising atmosphere, produced by the ionised
water continuous phase. If however the oil were the continuous phase the dispersed
water droplets would be susceptible to flocculation and coalescence due to the oil
being a non-ionising medium absent of any electric diffuse double layer or ionising
atmosphere (Schulman & Cockbain, 1939; Pink, 1940).
The most common emulsions are oil-in-water (O/W), where the water constitutes the
continuous phase and the oil the dispersed phase; and the reverse, water-in-oil
(W/O), where the oil constitutes the continuous phase and the water the dispersed
phase. It is also possible to stabilize multiple (double) water-in-oil-in-water (W/O/W)
emulsions using a 2-step method and a combination of hydrophilic and hydrophobic
surfactants (Jiao & Burgess, 2003), and similarly oil-in-water-in-oil (O/W/O)
emulsions (Jahaniaval, Kakuda & Abraham, 2003). The latter (O/W/O) could be
beneficial for the delivery of fat-soluble active ingredients in cosmetic lipsticks.
However for the purpose of this research and the production of cosmetic emulsion
lipsticks only water-in-oil (W/O) emulsions will be investigated.
Emulsifiers and surfactants vary widely and can be classified as anionic (negatively
charged), cationic (positively charged), amphoteric or zwitterionic (both positively
and negatively charged) or non-ionic (no charge). Additionally they are all
amphiphilic molecules, meaning they have a distinct hydrophobic (oil-soluble water-
hating) part and a distinct hydrophilic (water-soluble water-loving) part. The charged
substances usually contain a polar group attached to a hydrocarbon chain, thus
exhibiting both hydrophobic (hydrocarbon chain portion) and hydrophilic (polar
group) characteristics (Holmberg, 2002). An additional important point to mention
with regards to anionic and cationic surfactants is their ability to form these specific

21
charges in aqueous solution. Amphoteric surfactants behave like cationic surfactants
at low pH, and like anionic surfactants at high pH. At medium pH, they carry both
positive and negative charges and they have the structure of a bipolar ion. Non-ionic
emulsifiers tend to be condensation products of long chain alcohols with ethylene
oxide for example, where the ethylene oxide is hydrophilic and the hydrocarbon
chain hydrophobic. With regards to formulation the choice is heavily dependent on
the type of emulsion required, the ingredients in the product and its intended use
(Rawlings et al., 2004).
2.6 HLB System
Whilst there are hundreds of emulsifiers to choose from the HLB (Hydrophile-
Lipophile Balance) system enables one to assign a number to the emulsifier or
emulsifier blend. This number indicates or expresses the relative simultaneous
attraction of the emulsifier or emulsifier blend for water (hydrophilic), oil (lipophilic) or
the two phases to be emulsified. While the theory of the system sounds simple, in
practice the task unfortunately is not so clear-cut, as emulsifier classification via HLB
only permits some prediction of behaviour (Griffin, 1949).
Prior to making use of the HLB system for selecting a satisfactory emulsifier or blend
of emulsifiers, it is imperative to evaluate exactly what is required. Issues such as; is
the required emulsion water-in-oil or oil-in-water? How stable does one require the
emulsion to be during storage and in use? Must it be non-toxic or non-irritant to the
skin? These are some of the factors that will help to eliminate certain types and
groups of emulsifiers and aid one in selecting others.

22
By applying the HLB system, one will be able to obtain an indication of what the
emulsifier will do. That is, produce a water-in-oil (W/O) or oil-in-water (O/W) emulsion
or behave as a detergent or solubilizing agent. It is important to note that the correct
chemical type is just as important when selecting emulsifiers. As detailed in Table
2.1 an emulsifier that is hydrophilic in character and water soluble is assigned a high
HLB number (above 11.0) and will produce an O/W emulsion. One that is lipophilic
and oil soluble is assigned a low HLB number (below 9.0) and will produce a W/O
emulsion. Two or more emulsifiers can also be blended to achieve an ideal HLB;
these blends usually work best in achieving stable emulsions (ICI Americas Inc;
Pasquali, Sacco & Bregni, 2009). For the purpose of this research and the
production of cosmetic emulsion lipsticks, emulsifiers with HLB values below 9.0 will
be utilised to produce W/O emulsions.
Table. 2.1. HLB Correlations.
HLB Correlations HLB Range Use
4-6 W/O Emulsifiers 7-9 Wetting agents
8-18 O/W emulsifiers 13-15 Detergents 10-18 Solubilizers
Source: ICI Americas Inc., The HLB System: A Time-saving Guide to Emulsifier
Selection (1980) (Wilmington, DE 19897, USA)

23
HLB Theoretical and Analytical Calculation for each Emulsifier
For the majority of non-ionic emulsifiers the HLB is purely an indication of the
percentage weight of the hydrophilic portion of the emulsifier molecule multiplied by
1/5 for the purpose of convenience as indicated in Equation 2.1 (Pasquali, Taurozzi
& Bregni, 2008).
5 2.1
Where the Hydrophilic Group is defined as hydroxyl, sorbitan or polyoxyethylene.
Although this formula works for most non-ionic emulsifiers, for those where the
molecular formula is an approximation of the actual composition the method leads to
considerable errors. In these cases values are best obtained by means of analytical
data using Equation 2.2 (Pasquali, Taurozzi & Bregni, 2008):
20 1 2.2
Where = Saponification number of the ester and = Acid number of the recovered
acid.

24
2.7 Emulsion stability & instability
Whilst it is well documented that the role of an emulsifier is to lower the interfacial
tension between the oil and the water phase by forming a mechanically cohesive
interfacial film around the droplets thus aiding in the droplet fragmentation during
emulsification and preventing subsequent coalescence, very little is mentioned about
(the need for) stabilisation, both transient (during emulsion formation) and long-term
(shelf-life). During emulsification, transient droplet stability is of paramount
importance in order to reduce re-coalescence during processing (Darling & Birkett,
1987), which in turn determines the final droplet size distribution.
The stability of an emulsion is important in understanding its formation, as its stability
is the endpoint or measurement of the entire process (Fingas & Fieldhouse, 2004).
There are five main mechanisms that can contribute to emulsion instability: (1)
creaming and sedimentation (Binks, 1995); (2) flocculation (Binks, 1995; Dickinson,
Ritzoulis & Povey, 1999); (3) Ostwald ripening (Dickinson, Ritzoulis & Povey, 1999);
(4) coalescence (Boode & Walstra, 1993; Goff, 1997); and (5) phase inversion
(Dickinson, Ritzoulis & Povey, 1999; Rousseau, 2000). Ideally all of the factors need
to be minimised or prevented in order to produce a stable emulsion cosmetic lipstick.
Creaming and sedimentation (Binks, 1995) is separation due to the differences in
density between the two phases under the influence of gravity, leading to phase
separation where either a cream or a sediment layer is produced. The creaming and
sedimentation rate is proportional to the difference in density of the two phases and
can therefore be minimised by using phases with similar densities (relative ρ ≈ 1).
This would be impossible to achieve as the wax and oil phase would always have a
lower density than the aqueous phase. However the high viscosity crystalline wax
within the continuous phase would form a solid matrix around the dispersed water

25
droplets, minimising the chances of any creaming or sedimentation. Additionally as
the rate is also proportional to the square of the droplet radius; reducing the droplet
size would also help minimize this effect.
Flocculation is the aggregation of particles without destruction of their individuality
(producing flocs which may or may not separate out) due to their interaction energy
(Binks 1995; Dickinson, Ritzoulis & Povey, 1999). This energy is the balance
between the weak attractive (London-van der Waals) forces between the colloidal
droplets and the electrostatic repulsion due to charged surfactants present at the
emulsion interface as described by Derjaguin, Landau, Verwey and Overbeek
(DLVO theory). Whilst the DLVO theory for predicting behaviour of charged particles
in an ionic environment is well recognised, very few colloids rely exclusively on
electrostatic repulsion forces for stability. Likewise these emulsion systems will rely
more on the crystalline wax matrix for stability as opposed to droplet repulsion. There
are two main types of flocculation; bridging and depletion. An example of bridging
flocculation is where the ends of separate segments of a high-molecular weight
polymer in a good solvent adsorbs to different particles drawing them together
(Everett, 1988). Depletion flocculation occurs when a non or weakly adsorbed
polymer in dispersion is excluded or displaced from the space between two
approaching particles resulting in a polymer depleted zone and subsequent
flocculation (Everett, 1988; Jenkins & Snowden, 1996).
When the interfacial area of a colloidal droplet is reduced via a diffusional mass
transfer process from regions of high interfacial curvature to regions of low interfacial
curvature, this interfacial area reduction process is commonly called coarsening, or
Ostwald ripening. This is due to the smaller droplets having a higher solubility or
vapour pressure, causing them to dissolve or evaporate on the larger ones

26
(Voorhees, 1992; Dickinson, Ritzoulis & Povey, 1999; Zeng, 2007). Coalescence
involve the approach of two droplets, the thinning of the disperse medium between
the two and finally the bursting of the film where the droplets combine to form a
larger droplet of lower surface area (Everett, 1988; Boode & Walstra, 1993; Goff,
1997). Coalescence can be complete in systems where the droplets are liquid or
partial where the droplets contain crystals. Partial coalescence can lead to phase
inversion as in butter production from milk, where the oil-in-water (O/W) milk
emulsion inverts to the water-in-oil (W/O) butter emulsion. Again these factors can
be minimised by the proposed crystalline wax matrix and the strength of the
interfacial film. Unfortunately increasing the concentration of the dispersed phase
does bring with it proportionately an increase in these factors occurring, a fact that
should be considered when looking at producing high water content cosmetic
emulsions.
Whereby O/W emulsions (mayonnaise, dressings etc.) tend to be fluid substances
containing a partial crystalline phase, food-related W/O emulsions (butter, margarine
etc.) tend to be solid like. As mentioned earlier and endorsed by Darling and Birkett
(1987), particle stability is based on the viscosity of the continuous matrix in many
food systems like margarine and butter, immobilizing the water droplets. Again
according to research conducted by Fingas & Fieldhouse (2004), whilst interfacial
forces are principal in the formation of water-in-oil emulsions, the viscosity of the oil
also plays a major role in stability. This theory was also backed up by Garti,
Binyamin & Aserin (1998) citing research carried out by Johansson & Bergenståhl.
This notion is important as the concept could be applied in producing W/O cosmetics
like lipstick where the crystalline structure of the waxes in conjunction with the oils
viscosity would create a rigid matrix (Clermont-Gallerande, Chavardes & Zastrow,
27
1999) in the continuous phase. Conversely as stated via citation by Hodge &
Rousseau (2003), whilst wax crystals can impart stability to water-in-oil emulsions,
this stability is not based on an increase in the viscosity or density of the continuous
phase. This stability is based on surface-active interaction as opposed to the bulk
properties of the system. Either way both of these concepts could prove to be
beneficial by way of stabilising water-in-oil cosmetic emulsions.
2.8 Crystal Stabilisation
The presence of fat crystals can stabilize or destabilize an emulsion. In order to
stabilize an emulsion, the crystals must collect at the emulsion interface, in doing so
provide a physical barrier to coalescence (Rousseau, 2000; Hodge & Rousseau,
2003). The study of colloidal particles such as fat crystals in food systems is a
relatively recent phenomenon. Whilst it is well known that many emulsified foods rely
on solid particles for stability such as ice crystals in ice cream and eggs yolk particles
in mayonnaise. The key factors determining the influence of fat crystals on emulsion
stability are: (1) the wettability of the crystals at the interface; (2) interfacial film
rheology; (3) particle microstructure, polymorphism and morphology; and (4) location
of fat crystals – in the dispersed (O/W) or continuous phase (W/O) emulsion
(Rousseau, 2000).
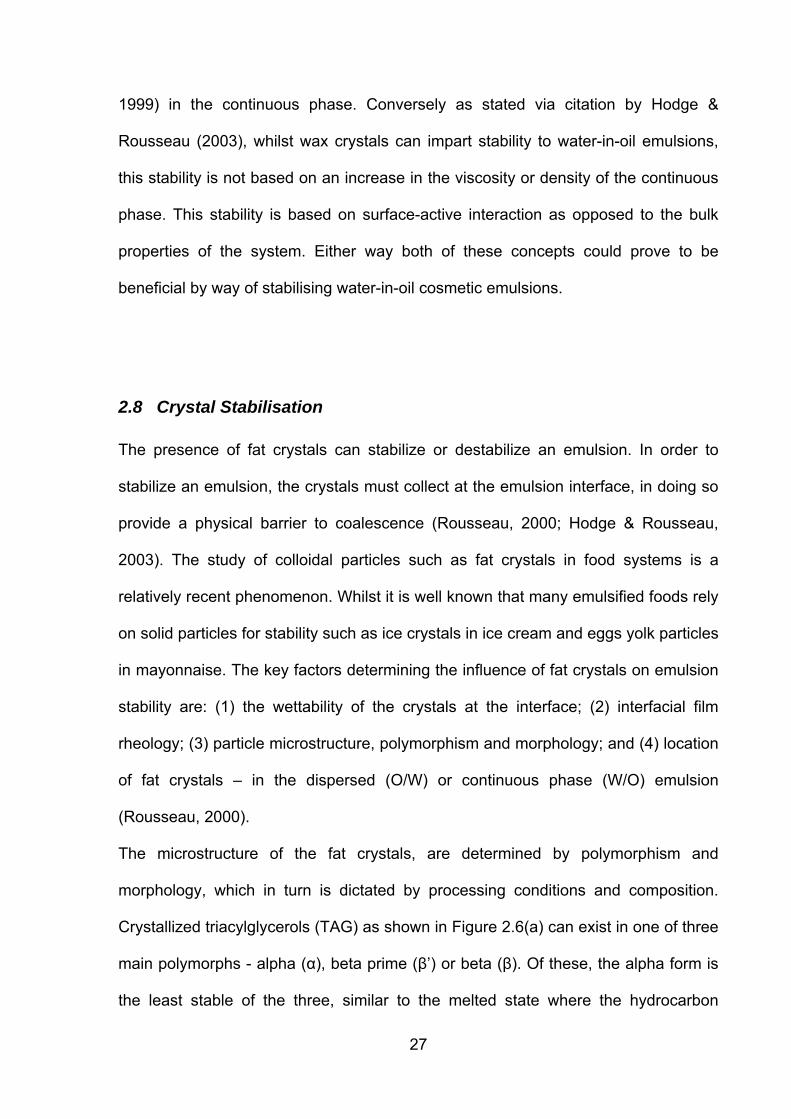
The microstructure of the fat crystals, are determined by polymorphism and
morphology, which in turn is dictated by processing conditions and composition.
Crystallized triacylglycerols (TAG) as shown in Figure 2.6(a) can exist in one of three
main polymorphs - alpha (α), beta prime (β’) or beta (β). Of these, the alpha form is
the least stable of the three, similar to the melted state where the hydrocarbon

28
chains are in free rotation and present a tuning fork conformation (Figure 2.6(b)) with
the beta form being the most stable forming the chair conformation (Figure 2.6(c)).
These triacylglycerols pack in different longitudinal arrangements namely double
chain length (Figure 2.7) and triple chain length (Figure 2.8) (Paul et al., 1991; Culot
et al., 1994). Whist this is the case as stated by Persson (2008), not all
triacylglycerols are able to form the beta polymorph. In many cases the beta prime
polymorph is formed in preference due to asymmetry of the triacylglycerols and
crystal growth occurring over extended periods. Moreover, Coupland (2002) found
that fats tended to nucleate initially in the alpha-form and later partly converting to
the beta prime. The reverse was observed with the bulk sample where the beta-
prime form would initially be formed followed by the alpha form.

29
(a)
R2
O
R
O
O
R1
O O
O
R2
O
O
R1
O
OO
R
O
(b) (c)
Fig. 2.6. Crystallized triacylglycerols (TAG), (a) molecular structure, (b) tuning
fork conformation and (c) chair conformation. (Source Structure: Drawn –
Advanced Chemistry Development ACD/ChemSketch Product Version 12.01)
O
O
O
O
O
O
R
R1
R2
30
(a) (b) (c)
Fig. 2.7. Double chain length structures, (a) alpha (α) tuning fork, (b) beta
prime (β’) tilted tuning fork and (c) beta (β) stacked chair. (Adapted: Culot et al.,
(1994))
Long spacing
Long spacing
Long spacing

31
(a) (b) (c)
Fig. 2.8. Triple chain length structures, (a) alpha (α) tuning fork, (b) beta
prime (β’) tilted tuning fork and (c) beta (β) stacked chair. (Adapted: Culot et
al., (1994))
Garti, Binyamin and Aserin (1998) have demonstrated that it is possible to stabilise
W/O emulsions by α-form polymorphs in conjunction with polyglycerol polyricinoleate
(PGPR) which is used as a non ionic lipophilic emulsifier. However in order to
achieve a large amount of α-form polymorphs in the continuous phase, flash cooling
of the triglycerides (tristearin) was required prior to emulsification. These emulsions
were not stable, however, for sufficiently long periods. Applying the hypothesis could
be useful in producing water-in-oil cosmetics like lipstick. However as stated
crystalline polymorphs transitions over time could result in undesirable and unstable
products. This dilemma of polymorphic changes occurring during storage could be
Long spacing
Long spacing Long
spacing
32
prevented by the addition of crystal modifying emulsifying agents according to
research conducted by Krog (1977) where sorbitan esters were used to stabilize the
intermediate beta prime (β’) crystal form.
Whilst fat crystallisation can help to stabilise W/O emulsions, fat crystallisation within
O/W emulsions has a tendency to reduce emulsion stability, causing partial
coalescence. This is due to the crystals (those that are rigid enough to overcome the
Laplace pressure) penetrating the interfacial layer between the two droplets. This
produces a bridge which in turn leads to coalescence between the two drops. Whilst
crystal penetration (leading to partial coalescence) of oil droplets in typical oil-in-
water emulsions may be undesirable, fat crystallisation is important in supporting the
structure of the air cells in typical foams like ice cream and whipped cream
(Coupland, 2002). Penetration of the interfacial layer is less likely if the crystals are
able to conform to the shape of the droplet. As mentioned earlier alpha (α)
polymorphs have a more liquid malleable character and are therefore more likely to
follow the contours of the droplets. Also fats containing a broad mixture of
triglycerides will tend to form a mixed crystalline structure, giving rise to a softer
mechanical structure hence a more stable emulsion. Other factors such as interfacial
film thickness along with environmental factors have been found to affect whether or
not the crystals are able to penetrate and hence destabilize an emulsion; of course
interfacial film thickness is dependent on the choice and quantity of emulsifier used.
Protein stabilised emulsions have been found to be more stable than small-molecule
surfactants due to the formation of a thicker interface (Darling and Birkett, 1987).
Whilst crystallisation may be required to stabilise W/O emulsions, which
appropriately would be the case in stabilising W/O cosmetics, this could lead to an
increase in the hardness of the final emulsion. Although this is important, in

33
producing a stable solid stick product, the lipstick must also be pliable to achieve a
smooth layer when applied.
Wang & Lee (1997) found that the hardness of emulsion lipstick with two lipophilic
emulsifiers was less than that of a conventional lipstick with an accompanying lower
degree of crystalllinity. This may have been due to the good compatibility between
the lipophilic emulsifiers (Span 60 and Span 80) used with the waxes and oils hence
reducing the degree of crystallinity. They also found that an increase in the emulsion
droplets also produced a harder product which is unusual, as one would have
expected an increase to reduce the hardness.
Whilst it is well documented that to form a stable W/O emulsion one requires the
addition of an emulsifier to prevent coalescence between the water droplets,
stabilisation can also be achieved via electrostatic droplet-droplet repulsion
(Leunissen, 2007). This hypothesis has been backed up by Zwanikken et al., (2008)
where W/O emulsions (in fairly polar oils) were stabilized for periods in excess of 18
months. These electrostatic droplet-droplet repulsions occur as a result of ion uptake
from the oil. This observed stability and crystallisation can be explained qualitatively
via calculations based on the Poisson-Boltzmann theory for monovalent cations and
anions in the geometry of a planar water-oil interface (Zwanikken & Rene van Roij,
2007). Whether or not this would be an ideal, practical or realistic approach to take in
the preparation of cosmetics is doubtful, as the number of additional additives in the
formula would in all probability complicate this method of stabilisation.

34
2.9 Microbial stability & Origin of Contamination
In order for microbial activity to take place within cosmetics and foods, not only must
there be water present, this water must also be available. In addition water used in
product manufacture can be an obvious source of contamination.
Water activity (aw) is an index of the availability of water for chemical reactions and
microbial growth (Banwart, 1981). The stability is mainly a consequence of the
relationship between the equilibrium moisture content (EMC) and its corresponding
water activity (aw) (Myhara et al., 1998). A potentially hazardous food could become
hazardous at a pH greater than 4.6 and a water activity greater than 0.85 (but less
than 1.00 as microorganisms cannot grow in pure water), as these conditions
provide the right conditions for pathogenic organisms to grow. Therefore in order to
reduce the potential hazard, storage at or below 5-7 °C is recommended to retard
microbial activity. This would however prove impractical for cosmetics with large
quantities of free water where the water activity could exceed 0.85.
Whilst in general, O/W emulsions are more susceptible to bacterial attack for obvious
reasons with water being the continuous phase as opposed to W/O emulsions; W/O
emulsions do still present a complex system whose implications for microbial growth
and survival are not fully understood. Guentert and Linton (2003) found that the
dispersion of water droplets in the oil (W/O emulsion) produces an effective barrier to
prevent microbial activity taking place. This was backed up by Verrips & Zaalberg
(1980), who go on to state that this intrinsic stability is based not only on the size of
the droplet, but also on the fact that only a small portion of the droplets within the
emulsion is occupied by microorganisms originating from the water phase.
Furthermore the production of finer water droplets will consequently limit the number
of generations the bacteria can produce (Delamarre & Batt, 1999; Kilcast &

35
Subramaniam, 2000). All of these theories however are based on emulsions with
very little free water where one would assume microbial activity will take place. As
substantiated by Brown and Butcher (2005) despite the addition of preservatives,
water rich cosmetics are an ideal environment for bacterial and fungal growth.
Therefore keeping the free water content to a minimum is of paramount importance
alongside producing fine droplets on the micro scale or smaller. Additionally there is
still a possibility that organisms may migrate from the continuous oil phase to the
dispersed water droplets, plus if the oil phase is not entirely anhydrous migration in
the opposite direction cannot be entirely ruled out. Research conducted by Bennet
(1962) on preservation of emulsions showed that the oil-to-water ratio had a
significant effect upon the magnitude of microbial growth (Harry and Wilkinson,
1973). In view of these findings, producing high water content emulsion (above 20%
aqueous phase) lipsticks may carry with it a higher risk of microbial propagation and
survival.
2.10 Emulsion Processing
Emulsion formation via the break-up of droplets is based predominantly on
turbulence. This can be achieved by the use of devices ranging from high-energy
short-time (high-pressure homogenizers), to low-energy long-time (paddle stirrer).
Processing can be dependent on a number of factors including equipment available
to the individual choice of the manufacturer. However choice normally comes down
to the flow properties of the product and what exactly is required of the final product.

36
There are a number of important factors involved in the initial emulsification of a
product, namely temperature, intensity and duration of mixing, along with the order
and rate of addition of phases. For the purpose of this research and the production of
emulsion lipstick products the temperature would have to be elevated to around 80-
95˚C to ensure melting and subsequent blending of the raw waxes. As mentioned,
emulsification can be achieved by high-energy short-time (high-pressure
homogenizers), or low-energy long-time (paddle stirrer), where it is important to add
that the practical aspects of mixing are both shear and flow. Whilst a high degree of
shear is required for the emulsification and dispersion process, a high degree of flow
is also required for heating and cooling and blending. Although both processes give
both shear and flow the relative balance is very important depending on the product
ingredients and what type of emulsion is required. High-energy short-time (high-
pressure homogenizers) tend to give more shear whereas low-energy long-time
(paddle stirrer) tend to give more flow. With regards to the production of emulsion
lipsticks, high-energy short time would be advantageous as opposed to low-energy
long-time, due to the viscosity of the oil and waxes and in order to produce a finer
water dispersed phase.
A high degree of shear is generally produced by the action of rotating an impeller at
high speed in a stationary liquid or by passing the liquid at high speed past stationary
baffles or through narrow orifices. High shear mixers combine both processes with a
high speed turbine revolving in a mesh stator chamber containing various
constrictions and baffles (Harry and Wilkinson, 1973).
There are numerous alternative methods that can be used for emulsifications,
namely colloid mills, high pressure homogenizers, ultrasonic homogenizers,

37
membranes and micro-capillary. None of these processes would be an ideal choice
for this type of emulsification due to the temperatures involved and the viscosity of
the oil phase.
2.11 Characterisation & Analysis of microcrystalline structure
2.11.1 Rheology & Texture
One of the most significant aspects of any cosmetic lipstick is its rheological
properties. Rheological or viscoelastic measurements are generally carried out in
order to quantify qualitatively the flow of the material for purpose of quality i.e.
spreadability on the skin (Adeyeye et al., 2002). Spreadability, texture, hardness and
feel are just a few of the properties that are vital in terms producing a successful
marketable product. The term spreadability has been used by consumers for many
years to explain the ease of distribution of a product. Like many other common
terms, spreadability is not a single physical property. According to Blair (1938), the
two principal physical factors involved are brittleness and hardness. By way of
endorsement to this, most researchers have studied physical properties using
methods such as the penetrometer, extrusion and crushing-strength (Huebner &
Thomsen, 1957). As a cosmetic lipstick product is applied by compression to the lips,
by far the best method would be crushing-strength. This is backed up by Wang &
Lee (1997), even though their choice of method was the penetrometer. Whist the
penetrometer test is useful as a hardness indicator; it is mainly related to the yield
stress of the test material. However it is an ideal method along with interfacial
rheology for comparing the interfacial film strengths formed by specific emulsifiers,
38
which of course is an important contributor to emulsion stability. It is also useful in
determining the presence of undesirable air pockets under the surface.
Although Rheology is measured macroscopically, these measurements depend on
what’s occurring on a microscopic level, thus revealing valuable important
information about the microstructure of the emulsion with regards to particle-particle
interaction and consequently stability. Rheological properties of emulsions
associated with stability are determined by many factors including the concentration
of the dispersed phase along with droplet size distribution, the emulsifiers and
associated interfacial film strength. The viscosity and composition of the continuous
phase particularly at low dispersed phase concentration and also the temperature
are additional factors.
By means of manipulation of the aforementioned parameters the rheological
characteristics of the product can be altered (Dickinson & Golding, 1997). With
regards to stability, according to work conducted by Fingas & Fieldhouse (2004) the
stability can be grouped into three categories; stable, mesostable (intermediate) and
unstable, with each having distinct physical properties. For a stable emulsion, the
zero shear rate viscosity is at least six orders of magnitude higher than that of the
starting oil. For an unstable one, the zero shear rate viscosity is usually less than two
to three orders of magnitude greater. Additionally, a stable emulsion will exhibit
elasticity whereas an unstable one will not. These viscoelastic properties could be
assessed by means of non-destructive oscillatory rheometry (Gaperlin et al., 1998),
which would also indicate the physical stability of the emulsion as backed up by Jiao
& Burgess (2003) and Adeyeye et al (2002) where one would expect the value for
the storage G’ modulus (a measure of the solid/ elastic behaviour) to predominate

39
over that of the loss G’’ modulus (a measure of the liquid/ viscous behaviour) whilst
the emulsion maintained stability. In addition with the dynamic parameter loss
tangent (tan δ) this would provide valuable information with regards to forming a
model to assess the point of destabilisation of the systems. One would normally
associate a drop in viscosity to be a sign of destabilising coalescence occurring
within the dispersed phase, however in research conducted by Dickinson, Ritzoulis &
Povey (1999) where destabilisation occurred as a result of bridging flocculation; a
stable emulsion appears as a viscous Newtonian liquid, whereas an unstable one
appears to be elastic and non-Newtonian. Here the viscoelastic properties during
destabilisation (viscous to elastic) are determined predominantly by the nature and
chemistry of emulsifier-emulsifier interaction.
2.11.2 Differential Scanning Colorimetry - DSC
It is well documented that thermal analysis is an important tool for material
characterisation (Burmester, 1992). Differential Scanning Colorimetry – DSC, has
accordingly been found to be an ideal method for the analysis of the microcrystalline
structure of emulsions and the polymorphic structure of fats crystals, (Garti,
Binyamin & Aserin, 1998; Clermont-Gallerande et al., 1999).
While subjecting the sample to a closely controlled well-defined temperature-change
programme any transitional changes in the physical and chemical properties can be
measured as a function of temperature or time. This thermal energy can therefore be
monitored and recorded as it is proportional to the energy absorbed or evolved
during the transition (Willard et al., 1981). Generally the degree of crystallisation is
proportional to the heat of transition of the melting point peak, measured by DSC.
Due to its sensitivity to thermal changes in materials, DSC has been found to be

40
ideal for assessing not only the degree of crystallisation, but also any polymorphic
structure within the materials namely waxes (Matas, Sanz, & Heredia, 2003) a
technique used also by Wang & Lee (1997) in their research on lipsticks. This is also
an ideal way of assessing any changes in the crystalline polymorphs of the lipstick
during storage and hence a useful method in determining the softening point and
melting point range of the lipstick prior to and after extended storage periods.
2.11.3 Pulsed Nuclear Magnetic Resonance – pNMR
Droplet size can be determined by low-field pulsed Nuclear Magnetic Resonance –
pNMR, microscopy, laser diffraction and electric sensing (Duynhoven et al., 2002).
Pulsed Nuclear Magnetic Resonance has a number of distinct advantages over the
other methods as the sample preparation is non-perturbing as stated by Duynhoven
et al (2002). This method is well suited for solid emulsions, such as butter (Fourel,
Guillement, & Le Botlan, 1995) as the presence of solid components in the
continuous phase does not affect the assessment. This would therefore be a useful
method to use on harder samples such as lipsticks. Furthermore being a non
destructive technique, samples can be analysed repeatedly over time for changes in
droplet movement, coalescence, flocculation etc. In addition pNMR will also analyse
flocculated droplets (Fourel et al., 1995; Hodge & Rousseau, 2003). This method is
useful in terms of emulsion stability and would be useful in assessing the stability
and therefore shelf life of the lipstick after production. As pNMR can also measure
the amount of free water in the W/O emulsion this would provide a good indication in
terms of microbiological storage.

41
2.11.4 Cryogenic Scanning Electron Microscopy - Cryo-SEM
The droplet size distribution of the dispersed water phase, the nature and
stabilisation of the water-oil interface are important factors in determining the stability
of the emulsion. Cryogenic Scanning Electron Microscopy – cryo SEM is ideal to
elucidate the morphology and the fundamental interactions that ultimately determine
the bulk behaviour of emulsions and suspensions (Mikula & Munoz, 2000; John,
Bhattacharya, & Raynor, 2004). By way of freeze fracture, followed by image
analysis it is possible to obtain three-dimensional compositional information of the
dispersed and continuous phase and to a lesser extent the interface.
This method is ideal for water-in-oil emulsions such as lipstick emulsions, where
visualisation of particles at the interface is required. Alternatively with water as the
continuous phase it would not be possible due to the formation of large chunks of ice
via the cryogenic cooling. Furthermore it is particularly useful for opaque emulsions
that cannot be visualised in great detail using an optical microscope (Madivala et al.,
2009), which would also be the case when attempting to view cosmetic lipstick
emulsions. Unfortunately the method does have a number of drawbacks. Because
the sample size is very small, it may not be entirely representative of the entire
emulsion. Additionally one is relying on a clean fracture of the sampled portion in
order to observe the morphology in detail. As a result, in order achieve high-quality
micrographs that are representative of the emulsion it would more often than not,
require several attempts. In view of this, alternative methods should be used in
conjunction with cryo SEM as backup.

42
3 Materials
3.1 Waxes & Emulsifiers
All the waxes, namely Carnauba, Microcrystalline and Hard Paraffin plus the Castor
oil used in the formulations were provided by Boots Group plc (Nottingham, UK).
Three safe food grade non-ionic emulsifiers were selected for the research; namely
Sorbitan monooleate - Span 80 (S6760, HLB = 4.3) supplied by Sigma-Aldrich
(Sigma Life Science); Polyglycerol polyricinoleate – PGPR (ADMUL WOL 1408K,
HLB = 1.5 ± 0.5) supplied by Kerry Bio-Science and Polyoxyethylene sorbitan
monooleate - Tween 80 (P8074, HLB = 15) supplied by Sigma-Aldrich (Sigma Ultra).
3.2 Emulsifier Selection
The initial part of the research was to select the correct emulsifier or blend of
emulsifiers capable of producing stable W/O emulsions. This was done initially with
the aid of the HLB index, which for W/O emulsions is 4-6. Whilst all emulsions are
thermodynamically unstable, albeit time dependent, they will therefore eventually
destabilise given time. Producing water-in-oil emulsions with a crystalline wax matrix
will invariably result in a more stable emulsion system due to steric stabilisation. It
would have been far too time consuming to screen emulsifiers over the entire
hydrophile-lipophile range. Therefore two food grade non-ionic lipiphilic emulsifiers
and a food grade non-ionic emulsifier blend were selected for the research.
1 Sorbitan monooleate - Span 80, HLB = 4.3. Used mainly as a non-ionic emulsifier in cosmetic and pharmaceutical ointments and creams, and also as a stabilizer in food products (Dziezak, 1988).

43
2 Polyglycerol polyricinoleate – PGPR, HLB = 1.5 ± 0.5.
Used as a non-ionic water-in-oil emulsifier in low fat margarines and spreads. Used also in chocolates to reduce the yield stress and therefore its viscosity, thickness and flow properties allowing it to melt better in the mouth (Wilson & Smith, 1998).
3 Polyoxyethylene sorbitan monooleate - Tween 80, (HLB = 15) blended with
Sorbitan monooleate - Span 80 (S6760), (HLB = 4.3) to give HLB = 5. Tween 80 alone is normally used as a non-ionic oil-in-water emulsifier (Feng et al., 2006) and stabilizer in medication ice cream, milk products, lotions and creams (Pourreza & Rastegarzadeh, 2004).
Both Sorbitan monooleate - Span 80 and Polyglycerol polyricinoleate – PGPR were
selected for lipophilicity and having low HLB values. Span 80 within the 4-6 HLB
range at 4.3 is ideal for producing W/O emulsions whilst PGPR, highly lipophilic at
1.5 ± 0.5 may not be ideal.
It been well documented that blending emulsifiers will always produce a more stable
emulsion (ICI Americas Inc.) as opposed to using a single emulsifier by the fact that
combining a water soluble hydrophilic one with an oil soluble lipophilic one will
produce a denser interfacial film due to the hydrophilic and lipophilic portions of the
molecules sitting on different sides of the interface (Rieger & Rhein, 1997), hence
Polyoxyethylene sorbitan monooleate - Tween 80 (being water soluble hydrophilic)
was blended with Sorbitan monooleate - Span 80, (oil soluble hydrophobic/lipophilic).
In addition to this Tween 80 also has an analogous chemical type with Span 80, both
being of the ‘-oleate’ family.
With chemical composition playing a major role when producing stable emulsions;
selecting emulsifiers with similar hydrocarbon chain length and type to that of the oil
has been shown to produce emulsions with maximum stability (Korhonen et al.,
2004). For this reason PGPR was selected due to its polyricinoleate hydrophobic
chain which complements the ricinoleic acid in the castor oil.

44
With the continuous phase being oil and wax and therefore a non-ionising medium,
selecting ionic emulsifiers would have been no benefit with stabilisation depending
on the crystalline oil matrix to a greater extent as opposed to charged droplet
repulsion. Additionally non-ionic surfactants have traditionally been used in creams
and lotions due to a number of reasons. They are generally low in toxicity, neutral,
stable to electrolytes (hence additives in the formula) and ideal for solubilising
colorants, perfumes and fats (Harry and Wilkinson, 1973).
3.2.1 Emulsifier Blend Calculations
Equations 3.1 & 3.2 were used to calculate the ratio (%) of Polyoxyethylene
sorbitan monooleate - Tween 80 to Sorbitan monooleate - Span 80:
% 100
3.1
% 100 % 3.2
Where;
= Polyoxyethylene sorbitan monooleate - Tween 80
= Sorbitan monooleate - Span 80
= Required HLB = 5
% 100 5 4.315 4.3
7010.7 6.5%
% 100 6.5 93.5%

45
4 Research Methodology
4.1 Differential Scanning Colourimetry – DSC & Enthalpy calclations
Prior to attempting to produce an emulsion formulation it was imperative to reduce
the number of components in the base formula to produce an actual basic lipstick of
oil and wax to build on. Additionally many of the normal ingredients used in a
conventional lipstick such as preservatives are surface active and could therefore
interfere with the study adversely. As emulsion stabilisation along with the entire
structure of an emulsion lipstick is dependent upon the microstructure and crystalline
matrix formed by the waxes within the formula by way of interstitial and steric
stabilisation, a preliminary assessment was carried out on all of the waxes by DSC to
assess their thermal characteristics (Buchwald, Breed & Greenberg, 2008; Nikolova
et al., 2009), namely melting point, melting point range, polymorphism and crystalline
purity (crystallisation points). This data was necessary in order to select the waxes to
be used as components to produce a simplified basic lipstick formula. It was
important that the formulations physicochemistry was comparable to that of
conventional lipstick upon which an emulsion formula could then be developed. It
was later also used to assess the degree of crystallinity and melting point range in
the lipstick formulations. This was significant with regards to establishing the correct
softening point and organoleptic skin feel.
One of the most important determinants for texture, spreadability and skin feel is the
amount and type of waxes present in the formulation along with the degree of
crystallisation. Furthermore, the melting profiles of these waxes, determines the
consistency of the formulation. The more solid at a given temperature the harder the
product is perceived at that temperature. Products should therefore be formulated to
have a softening point at skin temperature but should also have a fairly broad

46
melting point range in order to maintain a degree of consistency over the melting
point range. By this, the product has an acceptable yield stress but remains resistant
to mild abrasions and does not bleed beyond the vermilion border.
DSC analysis was performed using a Perkin Elmer DSC7 Colourimeter where
sample masses ranged from 5-10mg for the raw waxes and 5-20mg for the
formulations. An overview of the DSC program settings is detailed in Table 4.1.
Aluminium sample cups were used, volume ≈ 40 μL.
Table. 4.1. DSC Program settings (Software used - Pyris for Windows, Version
3.04.)
Program Settings:-
Initial state: 10 °C at 0 mW, Nitrogen flow 20 mLmin-1. Equilibrate within 0.100 °C, (Temperature ±), 0.100 mW (Heat flow ±) & 2.0 min (Max wait time)
Program: Hold for 1.0 min at 10 °C. Heat ramp, from 10 °C up to 120 °C at 2 °Cmin-1. (Run time 56 min)
Enthalpy calculations (degree of crystallinity) based on the area under the
thermogram peaks were conducted using the Trapezoid method (Equation 4.3);
∑ 4.3
Where = Area under the thermogram peaks, = Heat Flow Endo/Exo (mW) and
= Temperature (°C).

47
4.2 Basic Lipstick Preparation
Fig. 4.1. Flow Chart for the Preparation of Basic Lipstick.
Transferred to Castor Oil Blended Water Bath (Stirred) 95-100°C
Cooled 20mins (Lipstick Moulds)
-18 ~-20°C Filling at 80°C
The constrained basic lipstick formula design was chosen where the sum of all three
components was equal to 100 wt% (all components weight-weight percentage
w/w%). The contents of the components for basic formula 1 were: Carnauba wax
(7.1 wt%), Microcrystalline wax (15.98 wt%) and Castor oil (76.92 wt%).
The Basic lipstick formula was prepared as detailed in Figure 4.1, the waxes were
weighed separately; these were then transferred to the castor oil that was weighed
separately in a beaker large enough to accommodate the waxes.
After adding of the waxes (to the castor oil), the beaker was placed in a water bath at
95 to 100 °C and stirred continuously to prevent the waxes from separating and
creaming to the surface.
The wax/oil mixture was allowed to cool with continuous stirring to approximately
80°C and then transferred to the lipstick moulds (Dweck & Burnham, 1980). It was
essential that the moulds were filled to excess to avoid any depression in the centre
due to contraction after cooling.
Microcrystalline
Wax (weighed in
weighing boat)
Castor Oil
(weighed in
beaker)
Raw Materials –
(Oil, Carnauba &
Microcrystalline
Carnauba Wax
(weighed in
weighing boat)
Molten Oil and
Waxes (Stirring
continued)
Molten Lipstick
Moulds Solid Lipstick
Moulds

48
The moulds were then placed in a freezer at -18 to -20 °C for 20 min. This rapid
cooling was carried out in order to produce a considerable amount of crystalline
nuclei (Garti, Binyamin & Aserin, 1998). In doing this, the potential for crystal growth
was reduced significantly, resulting in smaller crystals and a smoother glossier
product. Uncontrolled growth, will usually give rise to grainy products with bloom on
the surface (Dweck & Burnham, 1980). Whist rapid cooling could lock the particles in
an unstable crystalline polymorph slowly transforming into a more stable form on
storage, this step was vital in the preparation of these emulsions. In order to assess
for this, the emulsions would have to analysed via DSC over extended periods
longer than the period allowed for duration of this project. Samples were removed
manually and kept for analysis.
4.3 Interfacial Tension and Surface Excess Concentration
Equilibrium Interfacial Tension was carried out in order to assess the surface active
properties of each of the emulsifiers and emulsifier blends at various concentrations.
In addition the emulsifier molecular packing was assessed and related to the HLB
values, the interfacial structure and the overall stability & texture of the final product.
Furthermore there is a limit to the lowering of the interfacial tension by an emulsifier
(Santos et al., 2009), which is normally when surfactant molecules start to self
aggregate and form micelles in the bulk solution. This concentration is commonly
known as the critical micelle concentration (CMC) relating to the surface
concentration reaching its’ critical saturation point. It is important to note that the
Equilibrium Interfacial Tension was carried out initially as an indication of the
emulsifiers surface active properties and to judge their suitability. The only

49
conclusive way is to include them in the formulation and characterize the final
emulsion product.
The Equilibrium Interfacial Tension between the main continuous oil phase and
water was assessed using a Kruss K100 Tensiometer. Measurements were carried
out using the Wilhelmy plate (Kruss Standard Plate – roughened platinum, width
19.900 mm, height 10.000 mm & depth 0.200 mm) method with the temperature
elevated and maintained at 31.0 ± 0.2 °C using an external circulating water bath.
This temperature was used to accommodate the conditions (unusually high
temperature) in the laboratory at the time. Procedure settings are detailed in Table
4.2.
Sample vessel (121.5 mL with diameter 70 mm) was used for the measurements,
with 20.0 g (20 mL) of de-ionised water and 45 g of castor oil with the emulsifiers
dissolved in the oil phase. The system was not stirred as this would have given rise
to a degree of emulsification. Whilst both liquids were measured using an analytical
balance, a small portion of the oil always remained in the initial vessel after transfer
Measurement involved two stages:
i. The plate was initially tared by means of immersion via the automated height-
adjustable sample carrier, in 45.0 g of the light low density oil phase.
ii. Secondly 20.0 g of the higher density water phase was introduced to the
tensiometer in a separate vessel. After allowing the plate to touch the surface,
again via the automated height-adjustable sample carrier, the light low density
oil phase was then transferred carefully on top via the use of a syringe.
Time-dependent changes in the interfacial tension were detected automatically.

50
Table. 4.2. IFT Procedure settings
IFT Procedure settings; Immersion Depth (Plate): 2.0 mm Maximum Time: 50,000 sValues (Plot): 5,000Values for Mean: 20Surface detection sensitivity: 0.005 gSurface detection speed: 6 mm/minPlot: Surface Tension (mN/m) vs Time (s)
After stabilisation, twenty stable consecutive readings were taken and used to create
isotherms of equilibrium Interfacial Tension (mN/m) vs Concentration of Emulsifier
(mg/L). Values were also taken to create isotherms of equilibrium Interfacial Tension
vs natural logarithm concentration - ln Conc. in order to calculate the surface excess
concentration and area per molecule. The Gibbs’ adsorption equation (Equation 4.4)
was used in order to determine the number of moles of emulsifier per square meter
(mol/m2) - surface excess;
Г 1
4.4
Where Г = surface excess per unit area of emulsifier, = the universal gas constant,
= the temperature (Kelvin), = interfacial tension and = natural log of the bulk
concentration.
With the surface excess Г, the area per molecule of adsorbed surfactant was
calculated using equation 4.5;
1Г 4.5

51
Where = Area per molecule and = Avagadro’s constant.
4.3.1 IFT Plate Measurement principle
Using the Kruss Standard Plate method, the liquid was raised as detailed via the
automated height-adjustable sample carrier, until contact on the surface or interface
is registered. At this point the tension acting on the balance is at its maximum which
means the sample carrier is not moved again during measurement.
The Interfacial/Surface Tension is calculated from equation 4.6 below:
σ F
L. cosθ 4.6
Where σ is the Interfacial/Surface Tension, F is the Force acting on the balance, L is
the wetted Length of the plate and θ is the contact angle.
The Kruss Standard Plate being made of roughened platinum is wetted so that the
contact angle is virtually zero. Therefore cosθ ≈ 1, and therefore only the Force F and
the Length L need to be taken into consideration (Tensiometer K100).

52
4.4 Emulsion Lipstick Preparation
Table. 4.3. Lipstick Formulations
Ingredients
Formulations Carnauba
Wax (w/w %)
Micro-crystalline
Wax (w/w %)
Castor Oil
(w/w %)
Hard Paraffin (w/w %)
Water (w/w %)
Emulsifier (w/w %)
Total
(w/w %)
Basic Lipstick 7.10 15.98 76.92 0.00 0.00 0.00 100
Emulsion 1 (10% water, 1% Emulsifier) 7.10 15.98 65.92 0.00 10.00 1.00 100
Emulsion 1 (20% water, 1% Emulsifier) 7.10 15.98 55.92 0.00 20.00 1.00 100
Emulsion 2 (10% water, 1% Emulsifier) 6.32 14.22 68.46 0.00 10.00 1.00 100
Emulsion 2 (20% water, 1% Emulsifier) 5.61 12.62 60.77 0.00 20.00 1.00 100
Emulsion 2 (30% water, 1% Emulsifier) 4.90 11.03 53.07 0.00 30.00 1.00 100
Emulsion 2 (40% water, 1% Emulsifier) 4.19 9.43 45.38 0.00 40.00 1.00 100
Emulsion 2 (10% water, 2% Emulsifier) 6.25 14.06 67.69 0.00 10.00 2.00 100
Emulsion 2 (20% water, 2% Emulsifier) 5.54 12.46 60.00 0.00 20.00 2.00 100
Emulsion 2 (30% water, 2% Emulsifier) 4.83 10.87 52.30 0.00 30.00 2.00 100
Emulsion 2 (40% water, 2% Emulsifier) 4.12 9.27 44.61 0.00 40.00 2.00 100
Emulsion 3 (40% water, 1% Emulsifier) 4.19 9.43 40.38 5.00 40.00 1.00 100
Emulsion 3 (40% water, 4% Emulsifier) 3.98 8.95 38.33 4.74 40.00 4.00 100
Three approaches were taken with regards to preparing the emulsion based lipsticks
(Table 4.3). Emulsions based on the Basic lipstick formula were prepared by initially
varying the amount of castor oil in the formula and keeping the amount of waxes and
emulsifiers constant and secondly by varying the entire wax/oil content and again
keeping the amount of emulsifier constant. The third approach was identical to the
second with the addition of Hard Paraffin to produce a more rigid formula only at 40
wt% water content. The constrained emulsion lipstick formula design was again

53
chosen where the sum of all of the components was equal to 100 wt% (all
components weight-weight percentage w/w%) and sample batch size in total was
kept at 60 ml each time. The content of emulsion components was varied: aqueous
phase (10-40 wt%), oil phase (56-89 wt%) and emulsifier (1-4 wt%). The emulsifiers
used were Span 80 (HLB = 4.3), PGPR (HLB = 1.5 ± 0.5) and a blend of Span 80
(93.5%) and Tween 80 (6.5%); (HLB = 5).
Fig. 4.2. Flow Chart for the Preparation of Emulsion Lipstick
Melt Emulsification – 5mins
Water Bath 95-100°C High Shear 10,100-10,400 rpm Heat
Filling at 80 °C Lipstick Moulds
Cooled 20mins
-18 ~-20 °C
The Emulsion based Lipstick formulations were prepared as detailed in Figure 4.2.
The Basic Lipstick as detailed in section 4.3 (which was essentially the continuous oil
phase) and the emulsifiers were weighed separately in a beaker large enough to
accommodate the de-ionised water (the dispersed phase), which was weighed
separately in another beaker. Both beakers were placed in a water bath at 95 to 100
°C, to melt the basic oil phase and to heat the de-ionised water up to matching
temperature.
Basic formula +
Emulsifier
(weighed in
beaker)
Combined
Formula (Pre-
emulsified)
Emulsified molten
Lipstick Formula
(Stirring
De-ionised Water
(weighed in
beaker)
Emulsion molten
Lipstick Moulds
Solid Emulsion
Lipstick Moulds

54
The water was transferred directly to the molten oil phase and emulsifiers then
emulsified using a Silverson L4 RT High Shear laboratory mixer for exactly 5 mins at
10,100 – 10,400 rpm.
The emulsified formulation was allowed to cool (with continuous stirring) to
approximately 80 °C and then transferred to the lipstick moulds. For the high water
content emulsions (30-40 wt%) the emulsion had to be transferred with a syringe as
pouring became impossible due to shear thickening of the emulsion. This was due to
the increase in interfacial area and resultant increase in the possibility of droplet
interactions.
Once again the moulds were placed in a freezer at -18 to -20 °C for 20 min. In
addition, according to research conducted by Hodge and Rousseau (2003), rapid
crystallisation of wax in the continuous phase of a W/O emulsion following
emulsification is an effective way of enhancing long-term stability. Samples were
removed manually and kept for analysis.
4.5 Pulsed Nuclear Magnetic Resonance – pNMR; Emulsion stability &
Droplet size distribution
The emulsion stability was assessed in terms of droplet coalescence. Each of the
emulsions containing 40 wt% water content and 1 wt% emulsifier were analysed by
means of the volume-weighted droplet diameter D3.3 over a period of 127 days (4.5
months). Ideally a longer period (up to 6 months) would have been better, however
the time allocated to the project would not allow this. Only the samples containing 40
wt% water content and 1 wt% emulsifier were assessed as the aim of the research
was to produce stable products with up to 40% water content with the minimum

55
amount of potentially unfavourable additives. Any significant statistical increase in
the volume-weighted droplet diameter D3.3 over this period was used to determine
the overall kinetic stability of each system.
The droplet size distribution achieved in any emulsification process is a result of the
competition between two opposite processes; namely the breaking of droplets and
the droplet-droplet coalescence (Tcholakova, Denkov & Danner, 2004). Both of
these processes are promoted by the intensity of the emulsification process; here the
hydrodynamic power density (energy) dissipated from the high shear mixer on the
two immiscible liquids during emulsification. The rate of adsorption (diffusion
coefficient) of the emulsifier to the droplet surface interface is dependent on type and
concentration, the viscosity ratio between the two immiscible liquids and the volume
fractions of the oil, wax and water.
Droplet size determinations by NMR were carried out with a low-resolution NMR
spectrometer Bruker minispec, mq20, permanent magnetic strength 0.47 T,
instrument settings (Table 4.4) and acquisition parameters (Table 4.5). The
instrument was equipped with a variable temperature gradient probe head mq-
PGU2, with operating range -10 up to 70 °C and a pulse gradient unit, field gradient
strength 2 T/m. The calibrated pulsed gradient strength was determined measuring
echo amplitudes without and with gradient using a sample of 0.5 mM CuSO4.5.H2O
with a self-diffusion coefficient (Ds = 1.38 10-9 m2/s) at 5 °C. Therefore all analyses,
being W/O emulsions had to be conducted at 5 °C ± 2.5 °C via the use of external
circulation cooling unit, cooled with water/ethylene glycol (circulating fluid). A
thermometer was used to check the inside of the probe chamber prior to analysis.
Approximately 0.5 to 0.6 ml sections (up to 1 cm height in NMR tube) of each of the

56
emulsions were taken in triplicate and analysed both for droplet size and at regular
intervals over a period of 130 days in order to assess for emulsion stability to
coalescence. These stability samples were all stored at room temperature in order to
replicate the conditions comparable to storing typical cosmetics.
Table. 4.4. pNMR Instrument settings (software version V2.2)
Instrument settings 90° Pulse Length: 8.5 μs180° Pulse Lenth: 17.32 μsDet. Angle broad: 351 °Det. Angle narrow: 355 °Gain: 59 dBRecycle delay: 2 secMagnetic Field steps: -59Rec. Dead time: 0.0173 msField Homog. Limit: 0.2 msNMR Base Frequency: 19.95 MHzNMR Frequency offset: +8.00 kHz
Table. 4.5. Acquisition parameters for W/O droplet size analysis
Acquisition parameters
Gradient Pulse separator – Ldelta (∆): 210 ms
Gradient Pulse width – delta (δ): 19 msOil Suppression delay – Tau_null (Ƭ0): 28.84 ms Diffusion coefficient: 1.38 10-9 m2/sAnalysis Temperature: 5 °C ± 2.5 °C
57
4.5.1 Droplet Size Distribution measurement
Log-normal droplet (particle) size distributions are mathematically described as
follows:
1σ √2π
,
4.7
Where is the relative frequency of a droplet with a specific diameter, is the
droplet diameter, σ is standard deviation of the normal distribution plot,
Geometric median (mean) diameter , ; 50 % of droplets are smaller and 50 %
larger than this diameter, is the natural exponential function.
Note:
d50,0; 50% of the total number of droplets, have diameter at this size.
d50,3; 50% of the total volume of droplets, have diameter at this size.
d1,0; number-length mean (e.g. droplets measured via microscopy)
d2,0; number-surface area mean (based on surface area of droplets)
d3,0; number-volume or number-weight mean
d2,1; length-area mean
d3,1; length-volume mean
d3,2; surface area-volume mean or surface area moment mean – Sauter Mean
Diameter
d4,3; volume-mass mean or volume/mass moment mean – De Broukere Mean
Diameter
58
d0,0; number-weighted mean (e.g. NMR)
d3,3; volume-weighted mean (e.g. NMR)
The surface-weighted mean . was calculated from the volume-weighted mean .
using the following equation 4.8 :
. .. 4.8
Where σ is the standard deviation of the logarithm of the droplet diameter and is
the natural exponential function (Duynhoven ey al., 2002).
4.6 Microscopy
Optical (Light) Microscopy and cryo-Scanning Electron Microscopy were used to
observe, evaluate and classify the size of the droplets individually. This was also
used to assess visually the degree of emulsion instability, in terms of droplet
flocculation, partial coalescence etc. An association was then made between the
results obtained here and those obtained using the NMR.
4.6.1 Optical Microscopy
A Reichert-Jung Polyvar Met Optical Microscope was used for the analysis, capable
of a wide range of incident and transmitted light techniques. The Illumination system
was made up of a 100 Watt halogen low voltage lamp with a colour temperature of
3200 K.

59
This system was capable of producing accurate images of extremely large object
fields with the absence of chromatic and spherical aberration. The objectives were
plan achromates and plan fluorites for infinite tube lengths and had a high brilliance,
resolution and flatness of field. Standard, long working distance (LWD) and extra-
long working distance (XLWD) objectives were available. Objective magnification
were 10x, 25x, 40x and 100x (with Oil).
Microscope slides used were from Thermo Scientific size 76 x 26mm, thickness 1.0-
1.2mm. Cover glass (borosilicate) slides used were from VWR International, 22 x
50mm, thickness no. 1.5.
4.6.2 Cryo-Scanning Electron Microscopy – Cryo-SEM
A Philips XL-30ESEM Cryo-Scanning Electron Microscope was used for the
analysis. Cryogenic temperatures were used to preserve the structure of the sample
in the original chemically unmodified state.
A small amount of the sample (approximately 3 x 2 x 6 mm) was fixed onto the
sample holder, the holder having a layer of carbon-rich conductive glue (conductive
to allow discharge of electrons). The sample was then frozen (cryo-fixed) rapidly in a
bath of boiling-liquid nitrogen at -196 to -210 °C for about 2 min. The sample was
then transferred to the high vacuum cryo-unit chamber and freeze fractured. Any
surface water was sublimated and a thin layer (approximately 10 nm) of gold
sputtered onto the surface. This was done to aid conductance with electrons. The
sample was then inserted into the observation chamber and observations were
carried out at 3-5 kV at temperatures between -100 and -175 °C.
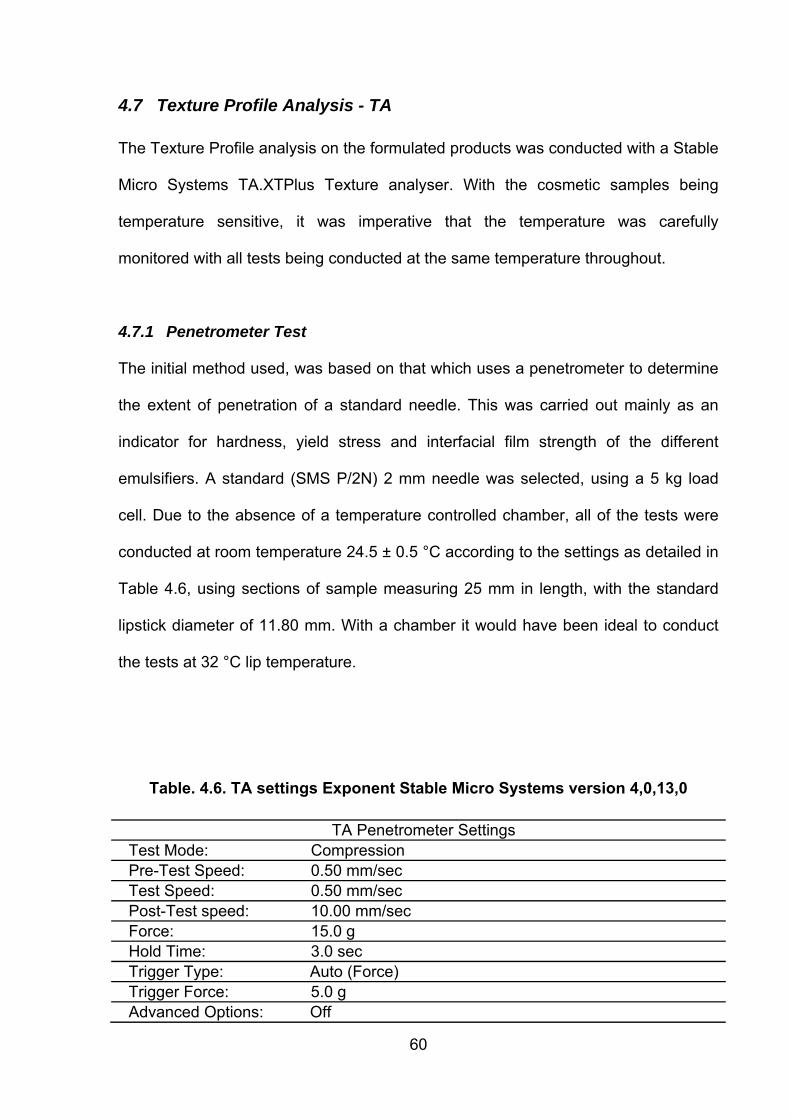
60
4.7 Texture Profile Analysis - TA
The Texture Profile analysis on the formulated products was conducted with a Stable
Micro Systems TA.XTPlus Texture analyser. With the cosmetic samples being
temperature sensitive, it was imperative that the temperature was carefully
monitored with all tests being conducted at the same temperature throughout.
4.7.1 Penetrometer Test
The initial method used, was based on that which uses a penetrometer to determine
the extent of penetration of a standard needle. This was carried out mainly as an
indicator for hardness, yield stress and interfacial film strength of the different
emulsifiers. A standard (SMS P/2N) 2 mm needle was selected, using a 5 kg load
cell. Due to the absence of a temperature controlled chamber, all of the tests were
conducted at room temperature 24.5 ± 0.5 °C according to the settings as detailed in
Table 4.6, using sections of sample measuring 25 mm in length, with the standard
lipstick diameter of 11.80 mm. With a chamber it would have been ideal to conduct
the tests at 32 °C lip temperature.
Table. 4.6. TA settings Exponent Stable Micro Systems version 4,0,13,0
TA Penetrometer Settings Test Mode: Compression Pre-Test Speed: 0.50 mm/sec Test Speed: 0.50 mm/sec Post-Test speed: 10.00 mm/sec Force: 15.0 g Hold Time: 3.0 sec Trigger Type: Auto (Force) Trigger Force: 5.0 g Advanced Options: Off

61
The sample cuts were placed centrally under the needle probe and the needle
adjusted until it was just above the sample (approximately 1-1.5 mm) and the probe
tared (zero) prior to analysis.
Once the trigger force of 5.0 g was attained this triggered the start of the test where
the needle proceeded to penetrate the sample at 0.50 mm/sec until a force of 15 g
was achieved, at which point the probe head maintained a 3.0 sec hold time prior to
extracting the needle at 10 mm/sec. After each test, the needle tip was wiped clean
towards the point. Plots of needle penetration Distance (mm) vs Time (sec) were
obtained as shown in Figure 4.3, and these values compared against those of
standard conventional lipstick samples.
Profile of Texture Profile (2mm Needle Probe)
Time (sec)
0 2 4 6 8 10 12
Dis
tanc
e (m
m)
-6
-4
-2
0
2
4
6
1. Penetration
2. Max of 10.0g3. Hold (3sec)
4. Probe release
Fig. 4.3. Profile of Penetrometer Test
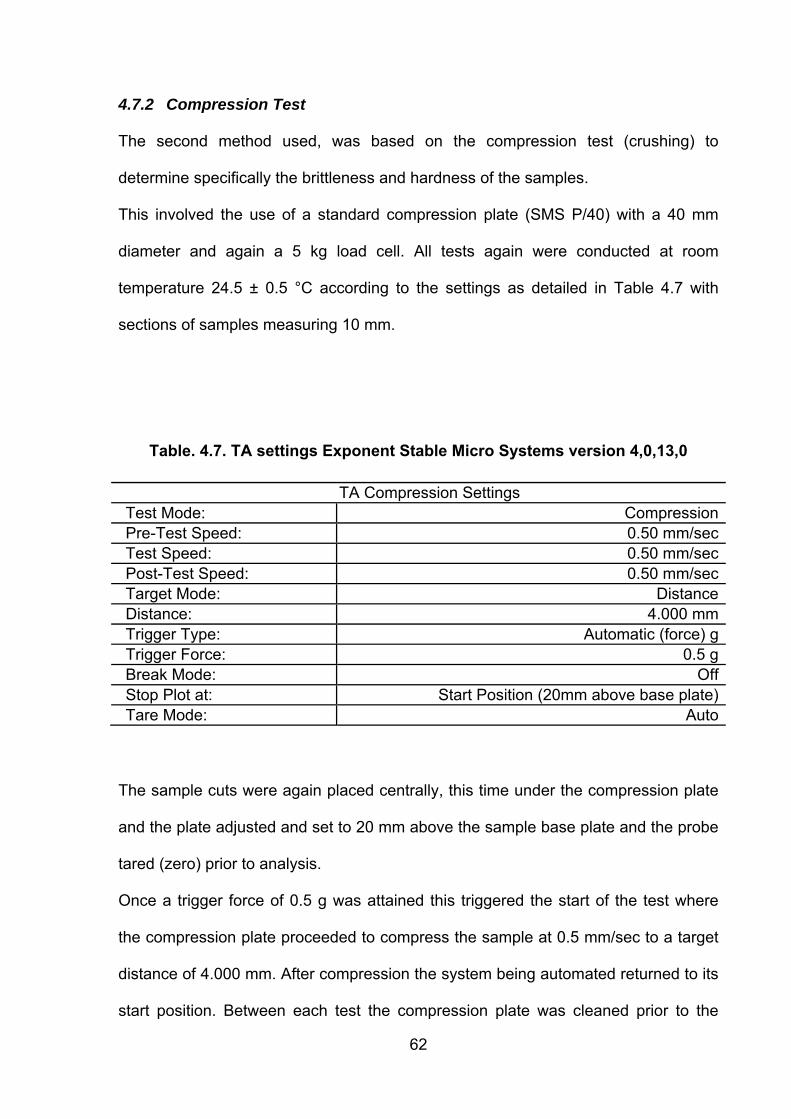
62
4.7.2 Compression Test
The second method used, was based on the compression test (crushing) to
determine specifically the brittleness and hardness of the samples.
This involved the use of a standard compression plate (SMS P/40) with a 40 mm
diameter and again a 5 kg load cell. All tests again were conducted at room
temperature 24.5 ± 0.5 °C according to the settings as detailed in Table 4.7 with
sections of samples measuring 10 mm.
Table. 4.7. TA settings Exponent Stable Micro Systems version 4,0,13,0
TA Compression Settings Test Mode: CompressionPre-Test Speed: 0.50 mm/secTest Speed: 0.50 mm/secPost-Test Speed: 0.50 mm/secTarget Mode: DistanceDistance: 4.000 mmTrigger Type: Automatic (force) gTrigger Force: 0.5 gBreak Mode: OffStop Plot at: Start Position (20mm above base plate)Tare Mode: Auto
The sample cuts were again placed centrally, this time under the compression plate
and the plate adjusted and set to 20 mm above the sample base plate and the probe
tared (zero) prior to analysis.
Once a trigger force of 0.5 g was attained this triggered the start of the test where
the compression plate proceeded to compress the sample at 0.5 mm/sec to a target
distance of 4.000 mm. After compression the system being automated returned to its
start position. Between each test the compression plate was cleaned prior to the

63
start of the subsequently test. Plots of Compression force (g) vs Time (sec) were
obtained as shown in Figure 4.4, and these values compared against those of
standard conventional lipstick samples.
The peak (plot maximum) value obtained for the compression force determined the
firmness of the sample. The lower the value obtained the softer the samples, the
higher the firmer the sample. The area of the curve up to this maximum point is
taken as a measure of consistency. The higher this value is, the thicker the
consistency. The negative region of the plot (produced on plate return) was used
also to determine the cohesive (adhesive) properties of the lipstick. This gives an
indication of the consistency/resistance to spread. The more negative the value the
more cohesive the sample. The area of the negative region of the curve may be
referred to as the ‘work of cohesion’. The higher this value is, the more resistant the
lipstick has to breaking down, the higher the adhesive properties and viscosity
(Smewing, 1998).
Profile of Compression Firmness Test - 4mm
Time (sec)
0 5 10 15 20 25 30 35
Forc
e (g
)
-150
-100
-50
0
50
100
150
200
(+ve Maximum) Firmness
(-ve Minimum) Stickiness
Consistency
Index of Viscosity
Fig. 4.4. Profile of Compression Firmness Test conducted

64
4.7.3 Rheology
Rheological non-destructive oscillation testing was conducted in order to predict and
quantify the samples’ properties under deformation, before flow i.e. without
destroying the structure. This will give an indication of specifically the viscoelasticity
profile, structure, toughness, flow and emulsion stability with varying water and
emulsifier content.
Rheological analysis was conducted on a Bohlin CVO 120 Rheometer (Malvern
Instruments Range) according to settings detailed in Table 4.8, using Bohlin
Software version 6. 50. 5. 8. All Viscoelastic property measurements were conducted
using a serrated 25 mm parallel plate geometry (PP25) with corresponding base
plate to eliminate plate slip due to the high oil and wax content of the samples
involved. All tests were conducted at 32 °C (Lip temperature) controlled by means of
a circulating water bath.
Table. 4.8. Viscoelastic – Dynamic oscillation sweep settings (Stress
controlled)
Oscillation sweep settings Temp Mode : ISOTHERMAL 32.0 °C Thermal Equilibrium Time : 0.00 s Pre-Shear : OFF Auto-Tension : OFF Shear mode : Controlled Stress Sweep Type : AMP SWEEP Range : LOG Frequency : 1 Hz No. Samples : 31 Strain Control : OFF Steady Shear Stress : 0 Pa Minimum Stress : 0.512 Pa Maximum Stress : 512.000 Pa Ramp Direction : Up Periods : 8.00 Points : 8192

65
5 Results, Data Analysis & Discussion
5.1 Introduction
The aim of this thesis was to formulate stable W/O emulsion lipsticks with up to 40
wt% water content, concurrent with all of the skin feel organoleptic qualities of a
conventional lipstick. These qualities along with overall stability were subsequently
characterised using the following techniques: DSC for thermo-physical
characterisation of microcrystalline structure along with melting point and melting
point range, Oscillation Rheology and Texture profiling to assess spreadability,
viscoelasticity, texture and emulsion stability, and pNMR in conjunction with
Microscopy to determine droplet size, droplet size distribution and long term
emulsion stability.
5.2 Interfacial tension
Figures 5.1 & 5.2 shows interfacial tension measurements of castor oil against a
water phase containing Span 80, PGPR and a blend of Span 80 with Tween vs
Concentration of Emulsifier (mg/L) and concentration Natural logarithm - ln Conc.
respectively. From Figure 5.1, it is evident that all of the emulsifiers and blends
possess surface active properties, reducing the initial interfacial tension from
10.65mN/m with increasing concentrations. A greater reduction in the interfacial
tension was observed for both PGPR and the blend of Span 80 with Tween 80 than
for Span 80 alone with the blend proving to be extremely effective at reducing
interfacial tension at much lower concentrations than both of the others due to
interfacial tensions being reduced on both sides of the interface. In addition the

66
critical micelle concentration (CMC) of the blend is significantly lower than that of
Span 80 and PGPR as observed by the equilibrium interfacial tension isotherm
(Figure 5.1) and the surface excess concentration value of 0.19 x 10⁻⁶ mol/m2
compared with 0.90 x 10⁻⁶ and 1.02 x 10⁻⁶ mol/m2 for PGPR and Span 80 alone
respectively (Table. 5.1). As expected, the average packing area per molecule was
much higher; 887 Å2 compared to 185 and 163 Å2 for PGPR and Span 80 alone
respectively.
Very hydrophilic emulsifiers such as Tween 80 will when adsorbed at the interface
only form expanded monolayers (Krog, 1977; Lu & Rhodes, 2000) which would
explain the excessive large packing area value of 887 Å2 (Table 5.1). In addition to
this, the expanded polyoxyethylene sorbitan head (increasing ethene oxide EO
groups) (Figure 5.7 and 5.8) will reduce the CMC value, favouring micellisation
(Santos et al., 2009) which would explain the lower CMC value compared to PGPR
and Span 80 alone. In order to achieve optimum stability a strong closely packed
cohesive monolayer film is essential to prevent droplet coalescence. This would
suggest that the blend of Tween 80 with Span 80 based on the values obtained
(Table 5.1) may not be as strong as that produced using Span 80 alone or PGPR
even though it appears to have better surface active properties than Span 80 alone.
Although the CMC, surface excess concentration and the packing area for both
PGPR and Span 80 appear to be similar, Span 80 showed a slightly higher surface
excess concentration, showing tighter packing. Admittedly both emulsifiers contain
different hydrophilic and hydrophobic groups making it difficult to make a direct
comparison, however the polyglycerol group (Figures 5.3 and 5.4) has a molar
volume almost twice that of the sorbitan group (Figures 5.5 and 5.6), which could be
a contributing factor to the aforementioned differences. Nonetheless PGPR was

67
found to be better at reducing the interfacial tension as increasing chain length has a
tendency to promote enhanced chain-chain interactions leading to lower interfacial
tension (Chattopadhyay, Shah and Ghaicha, 1992). Generally it has been noticed
that for a homologous series of non-ionic emulsifiers, the increase in the hydrophobic
chain length increases the apparent CMC at the oil-water interface (Peltonen &
Yliruusi, 2000; Zhang and Yin, 2005). Again with the emulsifiers being non-
homologous it was not possible to model a direct comparison.
Note that the average packing of the area for the blend is a mixture of both the Span
80 (93.5%) and Tween 80 (6.5%) expanded monolayer molecules.
Interfacial Tension, Castor Oil : Water with Emulsifiers at 31.0°C
Conc. of Emulsifiers (mg/L)
0.0 2.0e+4 4.0e+4 6.0e+4 8.0e+4 1.0e+5 1.2e+5 1.4e+5 1.6e+5 1.8e+5
Inte
rfaci
al T
ensi
on (m
N/m
)
0
2
4
6
8
10
12
PGPR (HLB 1.5 ± 0.5)Span 80 (HLB = 4.3)Span 80 with Tween 80 (HLB = 5)
Fig. 5.1. Isotherms of equilibrium Interfacial Tension (mN/m) vs Concentration
of Emulsifier (mg/L), between Castor oil and water (de-ionised), measured by
Kruss Standard Plate (Pt). Emulsifiers tested: Span 80 (HLB = 4.3), PGPR (HLB
= 1.5 ± 0.5) and a blend of Span 80 with Tween 80 (HLB = 5).

68
CMC - Interfacial Tension; Castor Oil : Water with Emulsifiers at 31.0°C
ln Conc.
7 8 9 10 11 12 13
Inte
rfaci
al T
ensi
on (m
N/m
)
0
2
4
6
8
10
PGPR (HLB = 1.5 ± 0.5)Span 80 (HLB = 4.3)Span 80 with Tween 80 (HLB = 5) Regression to Surface Saturation - CMC
Fig. 5.2. Isotherms of equilibrium Interfacial Tension vs concentration natural
logarithm - ln Conc. (mg/L) between Castor oil and water (de-ionised),
measured by Kruss Standard Plate (Pt). Emulsifiers tested: Span 80 (HLB =
4.3), PGPR (HLB = 1.5 ± 0.5) and a blend of Span 80 with Tween 80 (HLB = 5).
Showing only the linear regression portion approaching the surface saturation
critical micelle concentration points.
Table. 5.1. Surface activity of Emulsifiers and blend at 31.0°C.
Emulsifier
R2 Г (mol/m2)
Area (Å2)
PGPR (HLB = 1.5 ± 0.5)
-2.26 0.92 0.90 x 10⁻⁶ 185
Span 80 (HLB = 4.3)
-2.57 0.92 1.02 x 10⁻⁶ 163
Span 80 with Tween 80 (HLB = 5)
-0.47 0.82 0.19 x 10⁻⁶ 887

69
O
O
OH
OH
OH
OH
OCH3
O
O
O
CH3
O CH3
O
OH
Molecular Formula = C63H116O13
Polyricinoleate Hydrophobic portion
(Oil)
Polyglycerol
Hydrophilic portion
(Water)
Fig. 5.3. Molecular structure of Polyglycerol polyricinoleate – PGPR.
O
O
OH
OH
OH
OH
O CH3
O
O
O
CH3
O CH3
O
OH
O
O
OH
OH
OH
OH
O
CH3
O O
O
CH3
O
CH3
O OH
Castor oil with Wax crystal stabilization
Water droplet
Interface region
Fig. 5.4. Schematic orientation of two PGPR molecules in a W/O emulsion
adsorbed at the oil-water interface.

70
O
OHOH
OH
O
O
CH3
Molecular Formula = C24H44O6
Monooleate Hydrophobic
portion (Oil)Sorbitan Hydrophilic
portion (Water)
Fig. 5.5. Molecular structure of Sorbitan monooleate – Span 80.
O
OHOH
OH
O
O
CH3
O
OHOH
OH
O
O
CH3
O
OHOH
OH
O
O CH3
Water droplet Castor oil with Wax crystal
stabilization
Interface region
Fig. 5.6. Schematic orientation of two Span 80 molecules in a W/O emulsion
adsorbed at the oil-water interface.
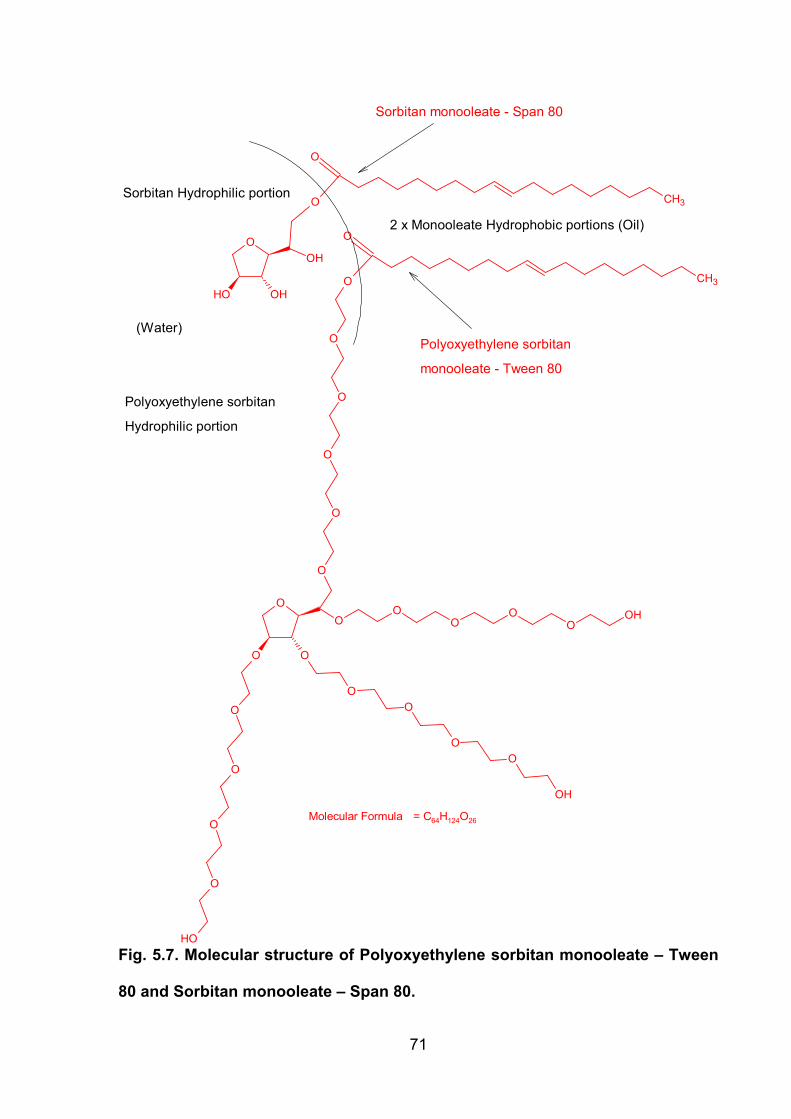
71
O
OO
OO
OO
OOH
OO
OO
OH
O
O
O
O
OH
O
O
O
O
O
O
O
CH3
Molecular Formula = C64H124O26
O
OHOH
OH
O
O
CH3
2 x Monooleate Hydrophobic portions (Oil)
(Water)
Sorbitan Hydrophilic portion
Polyoxyethylene sorbitan
Hydrophilic portion
Polyoxyethylene sorbitan
monooleate - Tween 80
Sorbitan monooleate - Span 80
Fig. 5.7. Molecular structure of Polyoxyethylene sorbitan monooleate – Tween
80 and Sorbitan monooleate – Span 80.

72
O
OH
OH OH
O
O
CH3
O
O
O
O
O
O
O
O
OH
O
O
O
O
OH
O
O
O
O
OH
O
O
O
O
O
O
O
CH3
Castor oil with Wax crystal stabilization
Water droplet
Interface region
Fig. 5.8. Schematic orientation of Span 80 and Tween 80 molecules in a W/O
emulsion adsorbed at the oil-water interface.

73
5.3 Thermo-physical Characteristics using Differential Scanning
Colorimetry – DSC on Raw Waxes & Basic Lipstick Formula
5.3.1 Thermo-physical Characteristics – DSC on Waxes
Table 5.2 present a summary of the thermo-physical values obtained with onset
temperatures (start of melting or hardening process), the peak maxima (melting
point) and enthalpies of a selection of waxes used in a conventional lipstick. The
corresponding thermograms, Figures 5.9 to 5.14 are presented in the Appendix with
accompanying chemistry of their thermo-physical characteristics. It is important to
note that both Beeswax and Carnauba wax produced three endothermic events. This
was due to either lack of purity and other admixtures being present or a mixture of
hydrocarbons. It could also be due to polymorphism where one would expect to see
two (dimorphism) or three (trimorphism) endothermic events due to differences
densities and as a result subsequent differences in melting points.
Table. 5.2. Thermo-physical Characteristics of Waxes using Differential
Scanning Colorimetry.
Wax No. of DSC endothermic
events
Temperature °C (Onset) & Maximum
Enthalpy J/g
Beeswax 3 (17.2) 29.3,41.1 & 49.1 169.7 Berry wax 2 (27.1) 42.8 & 47.6 104.6
Carnauba wax 3 (44.7) 54.0, 72.0 & 78.3 193.2 Hard Paraffin 2 (21.4) 32.6 & 51.2 195.2
Microcrystalline 2 (combined) (27.1) 47.9 & 62.0 140.1 Multiwax 2 (combined) (18.2) 47.8 & 58.3 121.9

74
5.3.2 Wax selection for Simplified Basic Lipstick Formula & Thermo-physical
Characteristics – DSC Basic Lipstick Formula
Both Carnauba and Microcrystalline wax were selected in order to produce the Basic
Lipstick formula whose DSC thermogram is presented in Figure 5.15 based on a
number of factors.
Carnauba wax possess the highest degree of crystallinity (193.2 J/g) and the highest
melting point along with the firmest rigid structure – due to long chain fatty acids
esterified with long chain alcohols. This was therefore chosen to form the basis of
the structure which is required for satisfactory moulding. Only Hard Paraffin wax
which was subsequently used in the final formula at 40 wt% water content only for
firmness, had a higher degree of crystallinity (195.19 J/g), however its melting point
was not high enough to achieve a melting point range of 55 to 75 °C in the basic
formula. The content of carnauba wax was kept to the minimum as excessive
amounts would have produced a product too rigid, with too high a yield stress
making application extremely difficult. With the selection of non-ionic emulsifiers and
a non-existent electric diffuse layer, the carnauba wax also formed the stabilizing
rigid crystalline wax matrix (continuous phase bulk viscosity) required to prevent
flocculation of the water droplets (dispersed phase) in the emulsion formulation.
Microcrystalline wax which was interchangeable with multiwax was selected for its
characteristic flexible, tacky, elastic properties which is required for a conventional
lipstick. In addition it was the only wax, which when formulated was able to produce
a product with a softening point of 32 °C (skin temperature) and a melting point
range of 55 to 75°C, a fundamental prerequisite for a good quality lipstick (McKetta,
1993). Additionally, the wax possessed a microscopic crystalline structure (140.1
J/g), facilitated by means of flash cooling which was required, not only in the basic

75
and conventional formula for quality and to bind the oil to prevent sweating, but also
proved ideal for surface-active stabilisation in the subsequent W/O emulsion product.
The microcrystalline structure given its smaller size and hence higher surface area
should lead to increased particle interactions (droplet coverage) via interacting with
the hydrocarbon (hydrophobic/lipophilic) chain of the non-ionizing emulsifier and
should potentially increase the interfacial viscosity and therefore the overall stability
of the emulsion (Lee, 1999; Rousseau, 2000).
In order to achieve the correct chemical and physical characteristics, 7.1 wt%
Carnauba wax was combined with 15.98 wt% Microcrystalline wax and 76.92 wt%
Castor oil to produce a product (Basic Lipstick) with an enthalpy of 44.04 J/g and a
softening point and melting point range characteristic to that of a conventional
lipstick.
Basic Lipstick DSC Thermogram (Melting Point Range)
Temperature °C
10 20 30 40 50 60 70 80 90
Hea
t Flo
w E
ndo/
Exo
(mW
)
0.0
0.1
0.2
0.3
0.4
Softening Point at Lip Temperature - Onset Temperature 32°C
Melting Point Range
Enthalpy = 44.04 J/g
Fig. 5.15. DSC Thermogram for the Basic Lipstick formula (Melting Point
Range) containing 7.1 wt% Carnauba wax, 15.98 wt% Microcrystalline wax and
76.92 wt% Castor oil.

76
5.3.3 Thermo-physical Characteristics – DSC on Emulsions
The degree of crystallisation for each of the emulsion lipstick samples was compared
with that of the basic sample by assessment of the thermo-physical changes within
the samples by DSC as indicated by the thermograms (Figures 5.16 to 5.23). Whilst
all of the thermograms are plotted on the same heat flow scale (mW), due to the fact
that slightly different samples weights were used throughout for each test, a
breakdown of the endothermic events per unit mass (J/g), are detailed in Table 5.3.
On observation one can see that all of the emulsion samples have the same
characteristic melting profile to that obtained for the basic sample. The emulsion
samples containing hard paraffin also show the same characteristic profile with an
additional endothermic event mid way (47 to 55 °C) along the melting point range
(Figure 5.23), which naturally ties in with that for the hard paraffin (Figure 5.12).
Surprisingly although there is a drop in enthalpy compared to the basic sample, there
is no significant consistent reduction in enthalpy throughout with increasing water
content as would be expected with changes in the volume and weight fraction. A
reduction was however observed with the 40 wt% samples, which was amended with
the addition of hard paraffin, which was expected with hard paraffin having the
highest degree of crystallinity of all the waxes. Increasing the emulsifier content from
1 % to 2 % and subsequently 4 % for the hard paraffin samples did not make any
significant difference to the degree of crystallisation. This would in all probability
indicate that a content of 1 wt% emulsifier throughout, even at the highest water
content is sufficient (or in excess) in production of emulsion lipstick products as
increasing the concentration would give rise to a smaller drop size distribution and a

77
higher degree of surface active crystallinity. With this being the case it may not be a
significant enough change to see a change in the overall enthalpy value.
1% PGPR DSC Thermograms (10 to 120°C)
Temperature (°C)
0 20 40 60 80 100 120
Hea
t Flo
w E
ndo/
Exo
(mW
)
Basic Lipstick10% H20; 1% PGPR20% H20; 1% PGPR30% H20; 1% PGPR40% H20; 1% PGPR
Fig. 5.16. DSC Thermograms for the Basic Lipstick formula and Emulsion
Lipstick Formulas 10, 20, 30 and 40 wt% water content with 1 wt% PGPR.
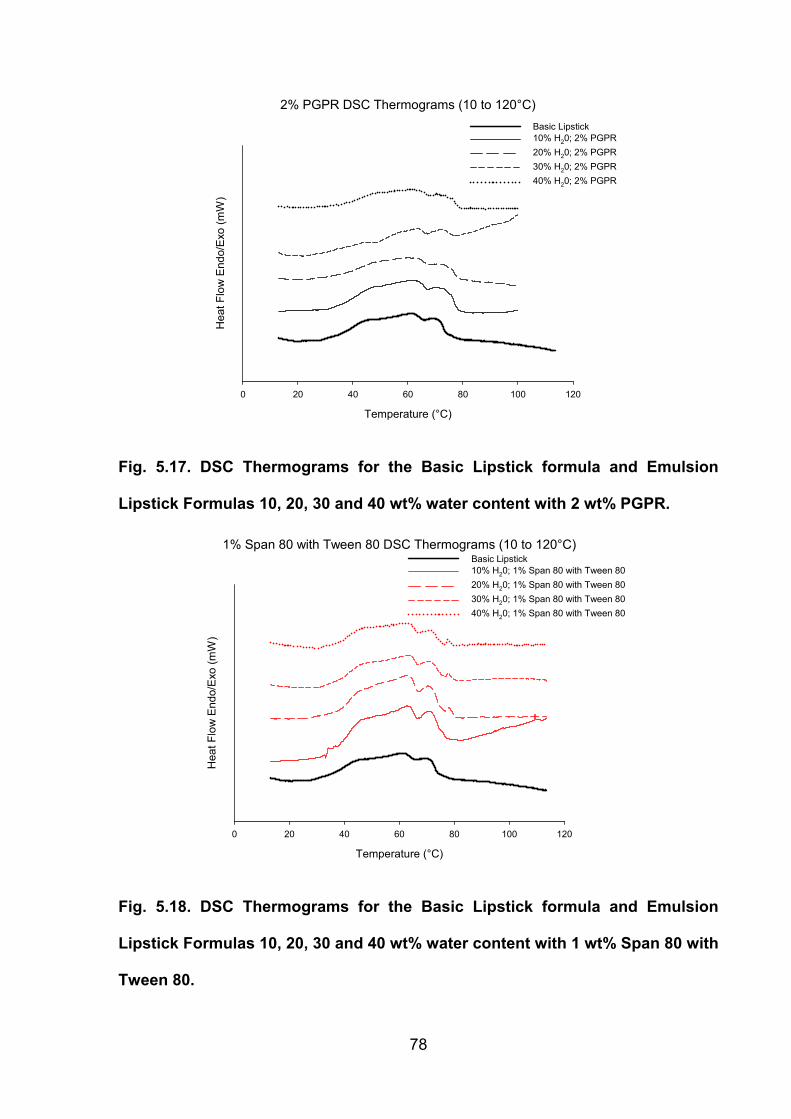
78
2% PGPR DSC Thermograms (10 to 120°C)
Temperature (°C)
0 20 40 60 80 100 120
Hea
t Flo
w E
ndo/
Exo
(mW
)
Basic Lipstick10% H20; 2% PGPR20% H20; 2% PGPR30% H20; 2% PGPR40% H20; 2% PGPR
Fig. 5.17. DSC Thermograms for the Basic Lipstick formula and Emulsion
Lipstick Formulas 10, 20, 30 and 40 wt% water content with 2 wt% PGPR.
1% Span 80 with Tween 80 DSC Thermograms (10 to 120°C)
Temperature (°C)
0 20 40 60 80 100 120
Hea
t Flo
w E
ndo/
Exo
(mW
)
Basic Lipstick10% H20; 1% Span 80 with Tween 8020% H20; 1% Span 80 with Tween 8030% H20; 1% Span 80 with Tween 8040% H20; 1% Span 80 with Tween 80
Fig. 5.18. DSC Thermograms for the Basic Lipstick formula and Emulsion
Lipstick Formulas 10, 20, 30 and 40 wt% water content with 1 wt% Span 80 with
Tween 80.

79
2% Span 80 with Tween 80 DSC Thermograms (10 to 120°C)
Temperature (°C)
0 20 40 60 80 100 120
Hea
t Flo
w E
ndo/
Exo
(mW
)
Basic Lipstick10% H20; 2% Span 80 with Tween 8020% H20; 2% Span 80 with Tween 8030% H20; 2% Span 80 with Tween 8040% H20; 2% Span 80 with Tween 80
Fig. 5.19. DSC Thermograms for the Basic Lipstick formula and Emulsion
Lipstick Formulas 10, 20, 30 and 40 wt% water content with 2 wt% Span 80 with
Tween 80.
1% Span 80 DSC Thermograms (10 to 120°C)
Temperature (°C)
0 20 40 60 80 100 120
Hea
t Flo
w E
ndo/
Exo
(mW
)
Basic Lipstick10% H20; 1% Span 8020% H20; 1% Span 8030% H20; 1% Span 8040% H20; 1% Span 80
Fig. 5.20. DSC Thermograms for the Basic Lipstick formula and Emulsion
Lipstick Formulas 10, 20, 30 and 40 wt% water content with 1 wt% Span 80.

80
2% Span 80 DSC Thermograms (10 to 120°C)
Temperature (°C)
0 20 40 60 80 100 120
Hea
t Flo
w E
ndo/
Exo
(mW
)
Basic Lipstick10% H20; 2% Span 8020% H20; 2% Span 8030% H20; 2% Span 8040% H20; 2% Span 80
Fig. 5.21. DSC Thermograms for the Basic Lipstick formula and Emulsion
Lipstick Formulas 10, 20, 30 and 40 wt% water content with 2 wt% Span 80.
1% Hard Paraffin DSC Thermograms (10 to 120°C)
Temperature (°C)
0 20 40 60 80 100 120
Hea
t Flo
w E
ndo/
Exo
(mW
)
Basic Lipstick40% H2O; 1% PGPR40% H2O; 1% Span 80 with Tween 8040% H2O; 1% Span 80
Fig. 5.22. DSC Thermograms for the Basic Lipstick formula and Hard Paraffin
Emulsion Lipstick Formulas containing 40 wt% water content with 1 wt%
Emulsifiers PGPR, Blend of Span 80 with Tween 80 and Span 80.

81
4% Hard Paraffin DSC Thermograms (10 to 120°C)
Temperature (°C)
0 20 40 60 80 100 120
Hea
t Flo
w E
ndo/
Exo
(mW
)
Basic Lipstick40% H2O; 4% PGPR40% H2O; 4% Span 80 with Tween 8040% H2O; 4% Span 80
Fig. 5.23. DSC Thermograms for the Basic Lipstick formula and Hard Paraffin
Emulsion Lipstick Formulas containing 40 wt% water content with 4 wt%
Emulsifiers PGPR, Blend of Span 80 with Tween 80 and Span 80.

82
Table. 5.3. Thermo-physical characteristics comparisons for Basic Lipstick
and Emulsion samples
Lipstick Sample Enthalpy J/g Basic Sample 44.04
10% H2O; 1% PGPR 27.33 10% H2O; 1% Span 80 with Tween 80 29.34
10 % H2O; 1% Span 80 26.59 10% H2O; 2% PGPR 27.52
10% H2O; 2% Span 80 with Tween 80 28.40 10 % H2O; 2% Span 80 27.29 20% H2O; 1% PGPR 27.18
20% H2O; 1% Span 80 with Tween 80 27.35 20 % H2O; 1% Span 80 27.00 20% H2O; 2% PGPR 30.88
20% H2O; 2% Span 80 with Tween 80 30.77 20 % H2O; 2% Span 80 26.28 30% H2O; 1% PGPR 33.89
30% H2O; 1% Span 80 with Tween 80 28.55 30 % H2O; 1% Span 80 25.65 30% H2O; 2% PGPR 24.49
30% H2O; 2% Span 80 with Tween 80 27.63 30 % H2O; 2% Span 80 27.46 40% H2O; 1% PGPR 30.19
40% H2O; 1% Span 80 with Tween 80 21.33 40 % H2O; 1% Span 80 21.21 40% H2O; 2% PGPR 18.76
40% H2O; 2% Span 80 with Tween 80 20.51 40 % H2O; 2% Span 80 23.13
Hard Paraffin 40% H2O; 1% PGPR 31.77 Hard Paraffin 40% H2O; 1% Span 80 with Tween 80 25.18
Hard Paraffin 40% H2O; 1% Span 80 27.44 Hard Paraffin 40% H2O; 4% PGPR 28.93
Hard Paraffin 40% H2O; 4% Span 80 with Tween 80 29.06 Hard Paraffin 40% H2O; 4% Span 80 28.97

83
5.4 Emulsion Stability
5.4.1 Coalescence and Droplet Evolution
All of the samples showed some degree of droplet coalescence over the entire 127
day period, albeit initially after the first 30 days (Figure 5.4), with PGPR showing the
highest degree of stability overall with an increase of 11% for volume-weighted mean
droplet diameter D3.3 compared to the blends of Span 80 with Tween 80 which
showed an increase of 19%, with Span 80 being the least stable showing a 45%
increase. Not only did PGPR exhibit greater stability by way of droplet size, but also,
the breadth of the distribution remained much smaller throughout compared to the
blend of Span 80 with Tween 80 and Span 80 alone (Figures 5.25, 5.26 & 5.27),
indicating less coalescence throughout for both the smaller and larger droplets.
Emulsion Stability for 40% H2O; 1% Emulsifiers
Time Period (Days)
0 20 40 60 80 100 120 140
D3.
3 D
ropl
et D
iam
eter
(µm
)
2
4
6
8
10
12
14
16
18
20
40% H2O; 1% Span 80 with Tween 80 (HLB = 5)40% H2O; 1% Span 80 (HLB = 4.3)40% H2O; 1% PGPR (HLB = 1.5 ± 0.5)
Fig. 5.24. Stability (evolution) of the volume-weighted mean droplet diameter
D3.3, for 40 wt% water content and 1 wt% emulsifier over a period of 127 days.

84
Emulsion Stability for 40% H2O; 1% Span 80 with Tween 80 (HLB = 5)
Mean droplet size diameter D3.3 (µm)
0 20 40 60 80 100 120
Rel
ativ
e fre
quen
cy
0
20
40
60
80
100
40% H2O; 1% Span/Tween80 (HLB = 5) at 0 days40% H2O; 1% Span/Tween80 (HLB = 5) at 127 days
Fig. 5.25. Stability (evolution) of the volume-weighted mean droplet diameter
D3.3 frequency distributions for 40 wt% water content, 1 wt% Span 80 with
Tween 80 (HLB = 5) at 0 and 127days.
Emulsion Stability for 40% H2O; 1% Span 80 (HLB = 4.3)
Mean droplet size diameter D3.3 (µm)
0 10 20 30 40 50 60 70
Rel
ativ
e fre
quen
cy
0
20
40
60
80
100
40% H2O; 1% Span 80 (HLB = 4.3) at 0 days40% H2O; 1% Span 80 (HLB = 4.3) at 127 days
Fig. 5.26. Stability (evolution) of the volume-weighted mean droplet diameter
D3.3 frequency distributions for 40 wt% water content, 1 wt% Span 80 (HLB =
4.3) at 0 and 127days.

85
Emulsion Stability for 40% H2O; 1% PGPR (HLB = 1.5 ± 0.5)
Mean droplet size diameter D3.3 (µm)
0 10 20 30 40 50
Rel
ativ
e fre
quen
cy
0
20
40
60
80
100
40% H2O; 1% PGPR (HLB = 1.5 ± 0.5) at 0 days40% H2O; 1% PGPR (HLB = 1.5 ± 0.5) at 127 days
Fig. 5.27. Stability (evolution) of the volume-weighted mean droplet diameter
D3.3 frequency distributions for 40 wt% water content, 1 wt% PGPR (HLB = 1.5
± 0.5) at 0 and 127days.
Coalescence follows four main steps, namely flocculation, thin film drainage, film
rupture and coalescence (Johansson, Bergenståhl & Lundgren, 1995). PGPR
exhibited the greatest degree of stability, indicating less flocculation and
coalescence. It is in all probability that there is a much higher degree of interstitial
crystallisation at the interface keeping the droplets separate compared to the
crystallisation at the interface when using either Span 80 alone or a blend of Span 80
with Tween 80. This could be attributed to the chemistry, the length and type of the
lipophilic polyricinoleate chain (Figure 5.4) having a much greater affinity towards
forming a tight crystal network with the wax crystals as opposed to that produced via
the lipophilic monooleate chain in the other two systems (Figures 5.6 and 5.8).
Additionally if or when flocculation does occur, any coalescence will again be
inhibited or reduced if a rigid tightly packed interfacial film is present preventing film

86
drainage and rupture. In spite of the fact that both PGPR and Span 80 were found to
have similar surface excess concentration values, it is most likely, based on the time
stability (evolution) data over the entire 127 day period that the cohesive forces
existing between molecules at the interface are much stronger for PGPR than Span
80. Span 80 produced a more stable emulsion when blended with Tween 80 with
much better surface active properties. This backs up the theory that blending
emulsifiers will give rise to a more stable emulsion than using a single emulsifier of
the same group.
Whilst none of the three emulsifier systems can be described as being exactly
monodispersed, there is however a degree of difference between not only the actual
droplet size, but also the droplet size distribution throughout for the PGPR emulsions
compared to the droplet size and droplet size distribution for both Span 80 and the
blend of Span 80 with Tween 80. As a consequence the emulsions stabilised with
PGPR are less likely to encounter Ostwald ripening. In general and more specifically
to the emulsion stability observed with these three systems the coalescence along
with sedimentation is influenced as stated by the initial droplet size. Coalescence will
always increase with the breadth of the droplet size distribution and additionally
sedimentation velocity will inevitably be proportional to droplet size.
5.5 Emulsifier, Droplet Size Distribution & Microscopy
5.5.1 Size Distribution and Mophology
Table 5.4 shows the droplet size diameter D3.3 with calculated D3.2 for the initial
formulation attempt, where the amount of castor oil in the formula was reduced by 10
wt% and the amount of water increased by the same amount. Unfortunately this

87
method was only useful in preparing low water content emulsions up 20 wt%. Tables
5.5 to 5.7 show the second formulation, where the entire oil content (carnauba wax,
microcrystalline wax and castor oil) was altered by 10 wt% and the water content
changed by the same amount. This allowed the preparation of emulsions up to 40
wt% water content. However the final emulsion products containing 40 wt% water
content were much softer than a conventional lipstick product, so in order to produce
a more rigid product hard paraffin was added as shown in Table 5.8. Please note
that the calculated D3.2 does not have a standard deviation as these values are
based on the mean (single) D3.3 value.

88
Table. 5.4. Emulsion based Lipsticks, initial approach with 10 & 20 wt% water content and 1 wt% Emulsifiers. Volume-
weighted mean droplet diameter D3.3 and the calculated surface-weighted mean droplet diameter D3.2.
Emulsion Lipstick Formula Droplet size Diameter
Emulsifier System Carnauba
Wax (w/w %)
Micro-crystalline
Wax (w/w %)
Castor Oil
(w/w %)
Water (w/w %)
Emulsifier (w/w %)
D3.3 (μm) ± σ
D3.2 (μm)
Free Water
(%/100)
PGPR (HLB = 1.5 ± 0.5)
7.10 15.98 65.92 10.00 1.00 5.30 ± 0.48 4.73 0.02
7.10 15.98 55.92 20.00 1.00 4.57 ± 0.53 3.97 0.02
Span 80 (HLB = 4.3)
7.10 15.98 65.92 10.00 1.00 28.91 ± 0.39 26.57 0.25
7.10 15.98 55.92 20.00 1.00 26.20 ± 0.55 22.97 0.16
Span 80 with Tween 80 (HLB = 5)
7.10 15.98 65.92 10.00 1.00 13.39 ± 0.53 11.62 0.04
7.10 15.98 55.92 20.00 1.00 8.89 ± 0.74 6.78 0.02

89
Table. 5.5. Emulsion based Lipsticks, second approach with 10, 20, 30 & 40 wt% water content and 1 & 2 wt% PGPR (HLB
= 1.5 ± 0.5). Volume-weighted mean droplet diameter D3.3 and calculated surface-weighted mean droplet diameter D3.2.
Emulsion Lipstick Formula Droplet size Diameter
Emulsifier System Carnauba
Wax (w/w %)
Micro-crystalline
Wax (w/w %)
Castor Oil
(w/w %)
Water (w/w %)
Emulsifier (w/w %)
D3.3 (μm ± σ)
D3.2 (μm)
Free Water
(%/100)
PGPR (HLB = 1.5 ± 0.5)
6.32
14.22
68.46
10.00
1.00
5.63 ± 0.54 4.85 0.07
5.61 12.62 60.77 20.00 1.00 4.74 ± 0.56 4.05 0.03
4.90
11.03
53.07
30.00
1.00 5.30 ± 0.77 3.93 0.09
4.19 9.43 45.38 40.00 1.00 5.26 ± 0.98 3.26
0.14
6.25 14.06 67.69 10.00 2.00 2.65 ±0.36 2.48 0.08
5.54 12.46 60.00 20.00 2.00 3.26 ± 0.46 2.93 0.04
4.83 10.87 52.30 30.00 2.00 3.30 ± 0.60 2.76 0.06
4.12
9.27
44.61
40.00 2.00 4.10
± 0.91 2.71 0.10

90
Table. 5.6. Emulsion based Lipsticks, second approach with 10, 20, 30 & 40 wt% water content and 1 & 2 wt% Span 80
(HLB = 4.3). Volume-weighted mean droplet diameter D3.3 and calculated surface-weighted mean droplet diameter D3.2.
Emulsion Lipstick Formula Droplet size Diameter
Emulsifier System Carnauba
Wax (w/w %)
Micro-crystalline
Wax (w/w %)
Castor Oil
(w/w %)
Water (w/w %)
Emulsifier (w/w %)
D3.3 (μm ± σ)
D3.2 (μm)
Free Water
(%/100)
Span 80 (HLB = 4.3)
6.32 14.22 68.46 10.00 1.00 14.92 ± 0.67 12.02 0.14
5.61 12.62 60.77 20.00 1.00 16.46 ± 0.76 12.36 0.09
4.90 11.03 53.07 30.00 1.00 17.26 ± 0.67 13.76 0.13
4.19 9.43 45.38 40.00 1.00 14.93 ± 0.76 11.20 0.29
6.25 14.06 67.69 10.00 2.00 25.80 ± 0.57 21.93 0.10
5.54 12.46 60.00 20.00 2.00 29.60 ± 0.20 29.01 0.45
4.83 10.87 52.30 30.00 2.00 26.40 ± 0.20 25.88 0.56
4.12 9.27 44.61 40.00 2.00 16.45 ± 0.70 12.91 0.33

91
Table. 5.7. Emulsion based Lipsticks, second approach with 10, 20, 30 & 40 wt% water content and 1 & 2 wt% Span 80 with
Tween 80 (HLB = 5). Volume-weighted mean droplet diameter D3.3 and calculated surface-weighted mean droplet diameter
D3.2.
Emulsion Lipstick Formula Droplet size Diameter
Emulsifier System Carnauba
Wax (w/w %)
Micro-crystalline
Wax (w/w %)
Castor Oil
(w/w %)
Water (w/w %)
Emulsifier (w/w %)
D3.3 (μm ± σ)
D3.2 (μm)
Free Water
(%/100)
Span 80 with
Tween 80 (HLB = 5)
6.32 14.22 68.46 10.00 1.00 4.16 ± 0.51 3.64 0.03
5.61 12.62 60.77 20.00 1.00 5.47 ± 0.79 4.01 0.03
4.90 11.03 53.07 30.00 1.00 12.30 ± 0.88 8.32 0.17
4.19 9.43 45.38 40.00 1.00 13.48 ± 0.87 9.29 0.27
6.25 14.06 67.69 10.00 2.00 25.80 ± 0.87 19.01 0.11
5.54 12.46 60.00 20.00 2.00 19.35 ± 0.71 15.10 0.03
4.83 10.87 52.30 30.00 2.00 21.73 ± 0.68 17.29 0.13
4.12 9.27 44.61 40.00 2.00 14.83 ± 0.84 10.40 0.24

92
Table. 5.8. Emulsion based Lipsticks containing Hard Paraffin, final approach with 40 wt% water content and 1 & 4 wt%
Emulsifiers. Volume-weighted mean droplet diameter D3.3 and calculated surface-weighted mean droplet diameter D3.2.
Emulsion Lipstick Formula
Droplet size Diameter
Emulsifier System Carnauba
Wax (w/w %)
Micro-crystalline
Wax (w/w %)
Castor Oil
(w/w %)
Hard Paraffin (w/w %)
Water (w/w %)
Emulsifier (w/w %)
D3.3 (μm) ± σ
D3.2 (μm)
Free Water (%/100)
PGPR (HLB = 1.5 ± 0.5)
4.19 9.43 40.38 5.00 40.00 1.00 4.76 ± 0.96 3.00 0.20
3.98 8.95 38.33 4.74 40.00 4.00 3.95 ± 0.71 3.06 0.06
Span 80 (HLB = 4.3)
4.19 9.43 40.38 5.00 40.00 1.00 17.13 ± 0.57 14.52 0.24
3.98 8.95 38.33 4.74 40.00 4.00 13.13 ± 0.90 8.79 0.15
Span 80 with Tween 80 (HLB = 5)
4.19 9.43 40.38 5.00 40.00 1.00
22.38 ± 0.77
16.64 0.20
3.98 8.95 38.33 4.74 40.00 4.00
18.22 ± 0.61
15.15 0.52

93
For the initial preparation the emulsifiers were kept at 1 wt% throughout, for the
second preparation emulsifiers were tried at both 1 and 2 wt%, and finally in the hard
paraffin formula emulsifiers were tried at both 1 and 4 wt%. These changes in the
emulsifier contents were necessary in order to assess any changes in the droplet
size and other characteristics.
Due to the fact that three different non-ionic emulsifiers with different hydrophobic
and hydrophilic groups were used in the preparation it would be almost impossible to
model exactly the differences in droplet sizes and droplet size distribution in relation
to their chemistry. However an evaluation can be made based on an assessment of
their individual distinctive characteristics.
On observation of the results one can see throughout that the volume-weighted
mean droplet diameter D3.3 and the calculated surface-weighted mean droplet
diameter D3.2 achieved throughout with the use of PGPR was much smaller than
what was achieved with the use of Span 80 and the blend of Span 80 with Tween
80. This was verified by optical microscopy and cryogenic Scanning Electron
Microscopy (SEM) Figures 5.28 to 5.33.
Using the high shear mixer will always produce droplets, however due to the Laplace
pressure within the droplets, which will inevitably increases as the droplets decrease
in size makes it harder to produce smaller droplets as they resist deformation.
Decreasing the interfacial tension with the addition of an emulsifier will also decrease
the Laplace pressure allowing the production of smaller droplets. Although all of the
emulsifier systems have been found to have good surface properties the reason why
smaller droplets are produced using PGPR could be down to the fact that it produces
better surface coverage, in conjunction with a higher surface adsorption rate during

94
the emulsification process along with a stronger interfacial film. This is significant
because during emulsification there will always be frequent encounters between
droplets which could lead to coalescence if there is insufficient droplet coverage or a
tenuous interfacial film. One could infer that the extended structure of the ricinoleate
chain and the orientation of the molecules produce a much stronger interface than
that of the oleate chain. Of course even though the blend of Span 80 with Tween 80
has better surface properties than Span 80 by way of producing a lower interfacial
tension, the surface excess concentration value of 0.19 x 10⁻⁶ mol/m2 is very low
compared with 0.90 x 10⁻⁶ and 1.02 x 10⁻⁶ mol/m2 for PGPR and Span 80 alone
respectively. Less surface coverage means a weaker (expanded) interfacial film and
therefore a higher probability of droplet coalescence during emulsification. In
addition, droplet formation occurs as a result of a higher interfacial tension on the
concave side. Therefore using a blend of emulsifiers will reduce the likelihood of this
due to reductions on both sides of the interface, thus producing larger droplets in the
process as opposed to PGPR which reduces the interfacial tension significantly on
the side of the oil continuous phase. Span 80 has a surface excess concentration
value comparable with that of PGPR however its surface active properties by way of
reducing the surface tension are not as good; therefore the droplets Laplace
pressure throughout emulsification will remain higher.
The mean droplet size during the emulsification process is heavily dependent on
emulsifier concentration. At very low emulsifier concentrations, below the surface
excess concentration one would expect much larger droplets due to a lack of surface
coverage giving rise to coalescence, as opposed to smaller droplets with increasing
concentrations due to better surface coverage and less coalescence. There will
inevitably be a plateau after the surface excess concentration. In addition one would

95
expect to see larger droplets with increasing water content if the increase in water
content pushes the surface concentration below the surface excess concentration.
Whist this trend is partially evident in the final formulation (Table 5.8), it is not
obvious throughout the other formulations. This could have been due to the fact that
a change of 1 wt% was not enough to see a significant change or could have been
down to other factors like insufficient emulsification or inconsistencies in the high
shear mixing process. It could also suggest that a concentration of 1 wt% is sufficient
to produce emulsions at all of the relevant water contents.
Fig. 5.28. Photomicrographs of 20 wt% water content with 1 wt% PGPR,
showing droplets with diameter D1,0 5 μm and smaller.

96
Fig. 5.29. 30 wt% water content with 1 wt% Span 80, showing droplets with
diameter D1,0 20 μm and smaller. Droplet coalescence can also be observed for
droplets around 5 μm.
Fig. 5.30. 40 wt% water content with 1 wt% Span 80 with Tween 80, showing
droplets with a droplet diameter D1,0 spread above 10 μm and smaller than 5
μm.

97
Fig. 5.31. Cryo-SEM micrograph of Basic Sample (7.1 wt% Carnauba, 15.98
wt% Microcrystalline wax and 76.92 wt% Castor oil) with a pure crystalline
structure.
Fig. 5.32. Cryo-SEM micrograph of 40 wt % water content with 1 wt% PGPR
showing a droplet D1,0 of 5 μm surrounded by smaller droplets at pits.
Continuous oil and crystalline phase can be seen encasing the droplets.

98
Fig. 5.33. Cryo-SEM micrograph of Hard paraffin formula containing 40 wt%
water content with 1 wt% Span 80 with Tween 80. A couple of water droplets
can be seen around D1,0 = 20 μm in diameter encased in surface active wax
crystals.

99
5.6 Texture Profile Analysis - TA
5.6.1 Introduction
Hardness is important in determining the physical characteristic properties of any
product. Consequently lipstick hardness assessment based on mainly the wax, oil
and water composition together with albeit to a lesser extent the emulsifier content,
is a useful tool in determining objectively the effects of changing the formulation has
on the product.
5.6.2 Penetration and Compression
Texture profile analysis as illustrated in Figures 5.34, (penetration; indication of
hardness, yield stress and interfacial film strength) and Figures 5.35, (compression;
brittleness and hardness) was conducted on the basic lipstick sample and all of the
emulsion samples containing 1 wt% of emulsifier plus the hard paraffin samples
containing 40wt% water content with 1 & 4% emulsifiers. The test was also carried
out on a conventional shelf sample (Tables 5.9 & 5.10) for comparison (values not
plotted). An important point to mention is that the values obtained via compression
were attributed mainly to the overall macrostructure as opposed to the microstructure
properties via the penetration test.
One can observe there is an increase in penetration distance with increasing water
content throughout for all samples which would indicate a corresponding softening
with the increasing water content. Although all of the samples show a degree of
softening throughout, the emulsion samples containing PGPR do not appear to yield
as much as those containing both Span 80 and the blend of Span 80 with Tween 80,
which could be attributed to a number of factors. Not only did PGPR produce a much
smaller droplet size distribution, the free water content was much lower, which would
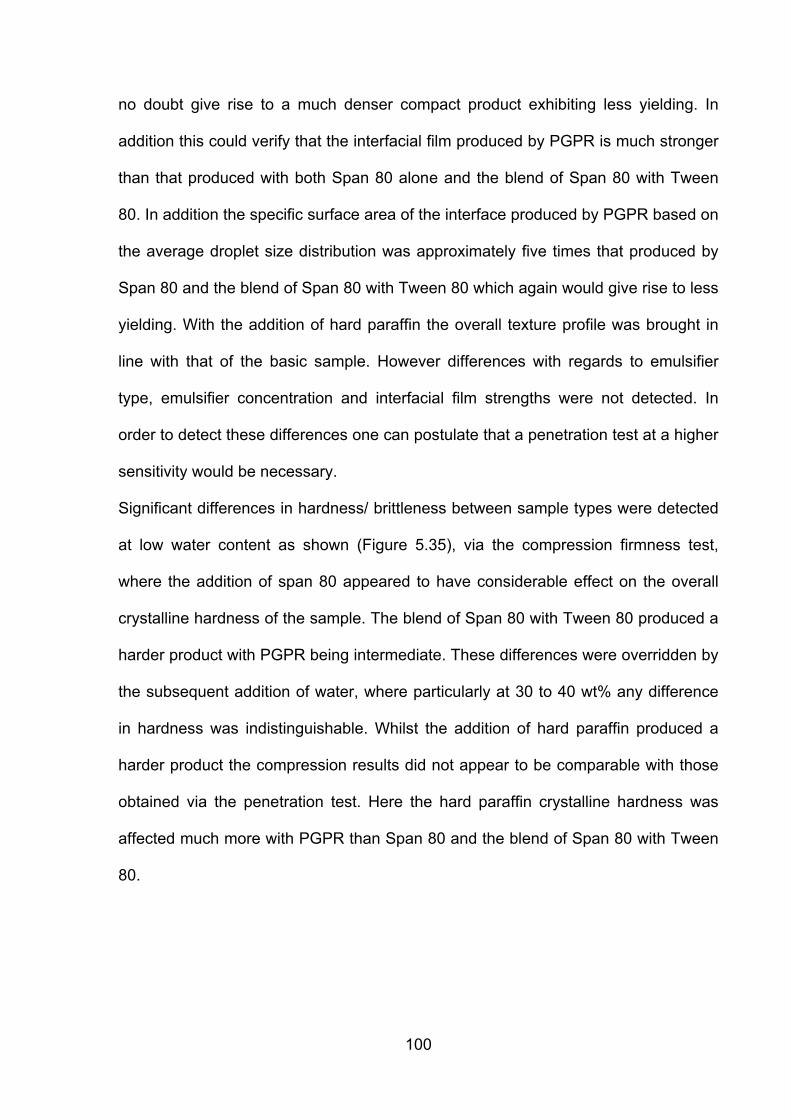
100
no doubt give rise to a much denser compact product exhibiting less yielding. In
addition this could verify that the interfacial film produced by PGPR is much stronger
than that produced with both Span 80 alone and the blend of Span 80 with Tween
80. In addition the specific surface area of the interface produced by PGPR based on
the average droplet size distribution was approximately five times that produced by
Span 80 and the blend of Span 80 with Tween 80 which again would give rise to less
yielding. With the addition of hard paraffin the overall texture profile was brought in
line with that of the basic sample. However differences with regards to emulsifier
type, emulsifier concentration and interfacial film strengths were not detected. In
order to detect these differences one can postulate that a penetration test at a higher
sensitivity would be necessary.
Significant differences in hardness/ brittleness between sample types were detected
at low water content as shown (Figure 5.35), via the compression firmness test,
where the addition of span 80 appeared to have considerable effect on the overall
crystalline hardness of the sample. The blend of Span 80 with Tween 80 produced a
harder product with PGPR being intermediate. These differences were overridden by
the subsequent addition of water, where particularly at 30 to 40 wt% any difference
in hardness was indistinguishable. Whilst the addition of hard paraffin produced a
harder product the compression results did not appear to be comparable with those
obtained via the penetration test. Here the hard paraffin crystalline hardness was
affected much more with PGPR than Span 80 and the blend of Span 80 with Tween
80.

101
Texture Profile Penetrometer Breakdown - (2mm Needle Probe - 10g)
Content of H2O (%)
0 10 20 30 40 50
Pen
etra
tion
Dis
tanc
e (m
m)
0
2
4
6
8
10
12
14
16
18
Basic Lipstick 1% PGPR 1% Span 80 with Tween 80 1% Span 80 1% PGPR - HP1% Span 80 with Tween 80 - HP1% Span 80 - HP4% PGPR - HP4% Span 80 with Tween 80 - HP4% Span 80 - HP
Fig. 5.34. Texture profile penetrometer test on Basic Lipstick, Emulsions
samples containing 10, 20, 30 & 40 wt% water content with 1 wt% Emulsifiers
and 40% wt% water content, 1 & 4% Emulsifiers with Hard Paraffin.

102
Table. 5.9. Texture profile penetrometer data for all samples.
Lipstick Sample Mean
Distance (mm)
SD (mm)
Conventional Shelf Lipstick 1.90 0.05 Basic Lipstick 1.62 0.09
10% H2O; 1% PGPR 2.20 0.02 20% H2O; 1% PGPR 2.87 0.02 30% H2O; 1% PGPR 5.18 0.97 40% H2O; 1% PGPR 9.58 1.79
10% H2O; 1% Span 80 with Tween 80 2.04 0.004 20% H2O; 1% Span 80 with Tween 80 3.95 0.64 30% H2O; 1% Span 80 with Tween 80 5.08 0.54 40% H2O; 1% Span 80 with Tween 80 14.91 1.93
10% H2O; 1% Span 80 3.49 0.09 20% H2O; 1% Span 80 4.85 0.02 30% H2O; 1% Span 80 5.93 0.82 40% H2O; 1% Span 80 14.69 1.76
Hard Paraffin 40% H2O; 1% PGPR 2.79 0.10 Hard Paraffin 40% H2O; 1% Span 80 with Tween 80 2.69 0.18
Hard Paraffin 40% H2O; 1% Span 80 2.86 0.14 Hard Paraffin 40% H2O; 4% PGPR 2.60 0.11
Hard Paraffin 40% H2O; 4% Span 80 with Tween 80 2.75 0.11 Hard Paraffin 40% H2O; 4% Span 80 2.89 0.13

103
Compression Firmness Test - (4mm compression distance)
Content of H2O (%)
0 10 20 30 40 50
Com
pres
sion
Firm
ness
For
ce (g
)
0
100
200
300
400
500
6001% Span 80 1% PGPR 1% Span 80 with Tween 80 Basic Lipstick1% PGPR - HP1% Sp 80 with Tw 80 - HP1% Span 80 - HP4% PGPR - HP4% Sp 80 with Tw 80 - HP4% Span 80 - HP
Fig. 5.35. Compression firmness test on Basic Lipstick, Emulsions samples
containing 10, 20, 30 & 40 wt% water content with 1 wt% Emulsifiers and 40%
wt% water content, 1 & 4% Emulsifiers with Hard Paraffin.

104
Table. 5.10. Compression firmness data for all samples.
Lipstick Sample Mean
Compression Force (g)
SD (g)
Conventional Shelf Lipstick 609.7 29.0 Basic Lipstick 541.9 15.3
10% H2O; 1% PGPR 324.7 8.9 20% H2O; 1% PGPR 194.4 12.5 30% H2O; 1% PGPR 121.4 9.7 40% H2O; 1% PGPR 72.5 3.1
10% H2O; 1% Span 80 with Tween 80 417.3 23.4 20% H2O; 1% Span 80 with Tween 80 139.7 3.7 30% H2O; 1% Span 80 with Tween 80 110.8 6.1 40% H2O; 1% Span 80 with Tween 80 95.3 5.2
10% H2O; 1% Span 80 216.9 34.2 20% H2O; 1% Span 80 161.1 30.1 30% H2O; 1% Span 80 128.4 7.9 40% H2O; 1% Span 80 78.3 6.0
Hard Paraffin 40% H2O; 1% PGPR 153.7 7.2 Hard Paraffin 40% H2O; 1% Span 80 with Tween 80 230.6 16.3
Hard Paraffin 40% H2O; 1% Span 80 210.5 11.0 Hard Paraffin 40% H2O; 4% PGPR 143.8 13.2
Hard Paraffin 40% H2O; 4% Span 80 with Tween 80 262.4 13.7 Hard Paraffin 40% H2O; 4% Span 80 271.4 11.4

105
5.7 Rheology
5.7.1 Introduction
The majority of materials including lipsticks are not completely solid or liquid like,
they are viscoelastic. During storage lipstick clearly needs to behave like a solid;
however during application it should behave like a fluid and flow just enough to
enable even spreading on the lips.
5.7.2 Viscoelasticity
The structural characteristics of each of the lipstick emulsion samples were
measured via non-destructive oscillations at 32 °C to replicate lip conditions. The
viscoelastic moduli, Storage (elastic) G’ and Loss (viscous) G’’, being direct
measurements of the particle-particle interactions within the samples were assessed
in order to determine the emulsions’ stability and how they compared against the
conventional and basic lipstick samples.
Throughout all the tests as illustrated in Figures 5.36 to 5.38 and Table 5.11, the
storage modulus G’ was greater than the loss modulus G’’, indicating that all of the
samples were more solid-like (elastic). Although there was a characteristic increase
in the elasticity throughout all of the three systems, where the emulsions at 10 wt%
water content showed a higher degree of solidity than the basic lipstick; an increase
in water content was accompanied by a loss in elasticity, indicative of G’
approaching G’’ together with a drop in the dynamic viscosity, showing characteristic
emulsion instability with increasing water content, indicating samples becoming more
liquid-like (viscous).

106
Although no emulsions were prepared above 40 wt% water content, based on these
results any further increase in water content would probably result in subsequent
phase inversion destabilisation and an obvious changeover in the viscoelastic
moduli. Why all of the three emulsion systems at 10 wt% water content showed a
higher degree of solidity in comparison with the basic sample was in all probability
due to the additional interfacial film rheology. However by increasing the volume
fraction of the dispersed phase in the system the overall solidity and dynamic
viscosity would therefore decline and approach that of the dispersed water phase.
This loss in elasticity at 40 wt% water content was re-established by the addition of
both hard paraffin and by increasing the emulsifier content from 1 to 4% (Table
5.11), where the flow/ viscoelasticty of the samples were reverted back to those of
the basic lipstick. These values are acceptable although they do not correspond
exactly with the conventional samples; again this is due to the extreme sensitivity of
these rheological measurements.
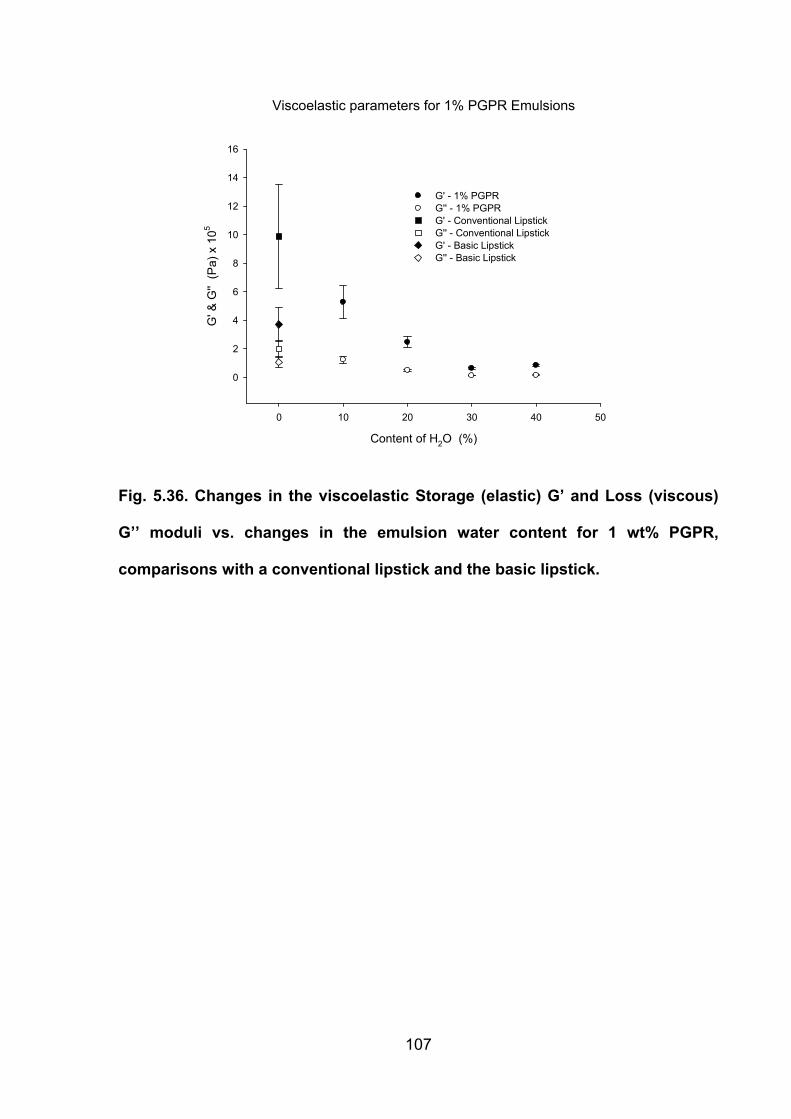
107
Viscoelastic parameters for 1% PGPR Emulsions
Content of H2O (%)
0 10 20 30 40 50
G' &
G''
(Pa)
x 1
05
0
2
4
6
8
10
12
14
16
G' - 1% PGPRG'' - 1% PGPRG' - Conventional LipstickG'' - Conventional LipstickG' - Basic LipstickG'' - Basic Lipstick
Fig. 5.36. Changes in the viscoelastic Storage (elastic) G’ and Loss (viscous)
G’’ moduli vs. changes in the emulsion water content for 1 wt% PGPR,
comparisons with a conventional lipstick and the basic lipstick.

108
Viscoelastic parameters for 1% Span 80 with Tween 80 Emulsions
Content of H2O (%)
0 10 20 30 40 50
G' &
G''
(Pa)
x 1
05
0
2
4
6
8
10
12
14
16
G' - 1% Span 80 with Tween 80G'' - 1% Span 80 with Tween 80G' - Conventional LipstickG'' - Conventional LipstickG' - Basic LipstickG'' - Basic Lipstick
Fig. 5.37. Changes in the viscoelastic Storage (elastic) G’ and Loss (viscous)
G’’ moduli vs. changes in the emulsion water content for 1 wt% Span 80 with
Tween 80, comparisons with a conventional lipstick and the basic lipstick.

109
Viscoelastic parameters for 1% Span 80 Emulsions
Content of H2O (%)
0 10 20 30 40 50
G' &
G''
(Pa)
x 1
05
0
2
4
6
8
10
12
14
16
G' - 1% Span 80G'' - 1% Span 80G' - Conventional LipstickG'' - Conventional LipstickG' - Basic LipstickG'' - Basic Lipstick
Fig. 5.38. Changes in the viscoelastic Storage (elastic) G’ and Loss (viscous)
G’’ moduli vs. changes in the emulsion water content for 1 wt% Span 80,
comparisons with a conventional lipstick and the basic lipstick.

110
Table. 5.11. Viscoelastic moduli, G’ (Storage) & G’’ (Loss) data for all samples.
Lipstick Sample G’
Storage (Pa) x 105
SD (Pa) x 105
G’’ Loss
(Pa) x 105
SD (Pa) x 105
Conventional Shelf Lipstick 9.89 3.62 1.98 0.61
Basic Lipstick 3.71 1.21 1.07 0.37
10% H2O; 1% PGPR 5.28 1.15 1.24 0.26
20% H2O; 1% PGPR 2.46 0.39 0.51 0.08
30% H2O; 1% PGPR 0.64 0.08 0.12 0.01
40% H2O; 1% PGPR 0.85 0.06 0.16 0.01
10% H2O; 1% Span 80 with Tween 80 8.16 1.60 1.79 0.32
20% H2O; 1% Span 80 with Tween 80 2.13 0.43 0.45 0.10
30% H2O; 1% Span 80 with Tween 80 1.39 0.39 0.28 0.08
40% H2O; 1% Span 80 with Tween 80 1.38 0.46 0.28 0.09
10% H2O; 1% Span 80 4.53 1.69 1.00 0.38
20% H2O; 1% Span 80 1.75 0.36 0.38 0.07
30% H2O; 1% Span 80 1.58 0.40 0.34 0.08
40% H2O; 1% Span 80 1.49 0.13 0.32 0.02
Hard Paraffin 40% H2O; 1% PGPR 1.68 1.09 0.33 0.20
Hard Paraffin 40% H2O; 1% Span 80 with Tween 80 3.51 1.11 0.78 0.21
Hard Paraffin 40% H2O; 1% Span 80 1.62 0.27 0.38 0.06
Hard Paraffin 40% H2O; 4% PGPR 3.47 0.04 0.08 0.01
Hard Paraffin 40% H2O; 4% Span 80 with Tween 80 4.08 0.71 0.94 0.14
Hard Paraffin 40% H2O; 4% Span 80 1.97 0.62 0.46 0.14

111
6 Conclusions
By using non-ionic emulsifiers it has been possible to formulate W/O emulsion
lipsticks with up to a 40 wt% aqueous phase content. The emulsions were stabilised
interstitially with microcrystalline wax with carnauba wax and hard paraffin playing a
central role in the stabilisation by thickening the continuous phase. The hard paraffin
was required specifically to restore the hardness to the samples with 40 wt% water
content. Although the emulsifier blend proved to be superior at reducing the
interfacial tension at lower concentrations, due to the hydrophilicity of the Tween 80,
this resulted in the formation of expanded monolayers hence a weaker interface and
larger droplets due to coalescence during emulsification. It did however show a
higher degree of evolution stability than Span 80 alone. Both Span 80 and
particularly PGPR produced condensed monolayers giving rise to smaller droplets
due to less coalescence during emulsification. In addition, lowering the interfacial
tension on the oil continuous phase side of the interface did as expected produce
much smaller droplets as opposed to lowering it to the same degree on both sides of
the interface, as the interface would always bend towards the side with the higher
interfacial tension. Although the duration of the project would not allow it, a shelf life
in excess of 6 months, up to a year would be ideal. Based on the stability results, this
would be best achieved using PGPR.
As producing fine monodispersed macroemulsions would be the ultimatel formulation
to aim for; this would be best produced by selecting a highly lipophilic non-water
dispersing emulsifier with an extremely low HLB value of 0 and 2 as established
using PGPR together with chemical compatibility with the oil phase. Fine
monodispersed macroemulsion droplets would be ideal for a number of reasons
including; increased stability (less Ostwald ripening), a firmer product and could

112
potentially reduce microbial spoilage. Increasing the concentration of the emulsifiers
from 1 to 4 % did as expected produce a reduction in droplet size, however equally
as important it showed a significant reduction in the amount of free water which
again is important as it could reduce the potential for microbial spoilage.

113
7 Further Work
With it being possible to formulate course W/O macroemulsions using Span 80 and a
Span 80 with Tween 80 blend and fine W/O macroemulsion using PGPR, to
formulate W/O microemulsions alternative more effective high energy processing
methods should be investigated in combination with alternative chemically
compatible highly lipophilic non-water dispersing polymeric emulsifier at HLBs in the
region 0 to 2. Emulsifier blends of similar chemical type should also be looked at in
this HLB region for stability.
As the objective of the research was to produce W/O emulsions to deliver moisture
and active water soluble ingredients to the lips; the effectively breaking of the
emulsion droplets after application should inevitably be looked at.
Additionally the production of O/W/O emulsions should be investigated with a view to
delivering fat-soluble active ingredients to the lips, plus a more detailed analysis of
the polymorphic changes occurring in the crystalline structure over typical shelf life
times as changes could produce undesirable products.
Emulsion formulations with preservatives, colouring, pigments and dyes should be
attempted, characterised and compared with formulations without, in an attempt to
assess for any adverse effects by these normal ingredients.

114
Appendix
The following Figures; 5.9 to 5.14 present the DSC thermograms obtained in order to
select the waxes for the basic lipstick formula and subsequent emulsion
formulations.
Beeswax DSC Thermogram (10 to 120°C)
Temperature °C
0 20 40 60 80 100 120 140
Hea
t Flo
w E
ndo/
Exo
(mW
)
-2
-1
0
1
2
3
4
5
6
Fig. 5.9. Differential Scanning Colorimetric Thermogram for Beeswax
(10 to 120°C).
Figure 5.9 presents a thermogram for Beeswax showing a triple endothermic event
at 29.3, 41.4 and 49.1 °C. This could be due to the fact that beeswax is made up of a
number of long-chain hydrocarbons including alkanes (C21 to C33), alcohols, free
acids (C22 to C30), long-chain diesters, esters of long chain alcohols (C40 to C52)
along with other materials. (Kameda, 2004; Talens & Krochta, 2005).

115
Berrywax DSC Thermogram (10 to 120°C)
Temperature °C
0 20 40 60 80 100 120 140
Hea
t Flo
w E
ndo/
Exo
(mW
)
-1.0
-0.5
0.0
0.5
1.0
1.5
2.0
2.5
3.0
Fig. 5.10. Differential Scanning Colorimetric Thermogram for Berry wax
(10 to 120°C).
Figure 5.10 presents a thermogram for berry wax which has a double endothermic
event observed at 42.8 and 47.6 °C. Though made up of mainly oleanolic acid
(60%), it also contains glycerides of stearic, palmitic and myristic acids, lauric acid,
unsaturated fatty acids, esters, primary alcohols and other aliphatic compounds
(Casado & Heredia, 1999).

116
Carnauba Wax DSC Thermogram (10 to 120°C)
Temperature °C
0 20 40 60 80 100 120 140
Hea
t Flo
w E
ndo/
Exo
(mW
)
-1
0
1
2
3
4
5
Fig. 5.11. Differential Scanning Colorimetric Thermogram for Carnauba wax
(10 to 120°C).
Figure 5.11 presents a thermogram for Carnauba wax which shows a triple
endothermic event observed at 54.0, 72.0 and 78.3 °C. The main composition is wax
esters (80 to 85%), and small amounts of free acids and alcohols (10 to 20%), with
hydrocarbons and resins (1 to 3%). These acids include the even carbon n-aliphatic
acids (C18 to C34 inclusive), carnaubic acid (C24), cerotic acid (C26), heptacosanoic
acid (C27), and arachidic acid (C20) (Koonce & Brown 1945). The alcohols are
straight chains of even carbon number (C26 to C34) with the higher alcohols
dominating (Murray & Schoefeld, 1951; Milanovic et al., 2010).

117
Hard Paraffin DSC Thermogram (10 to 120°C)
Temperature °C
0 20 40 60 80 100 120 140
Hea
t Flo
w E
ndo/
Exo
(mW
)
-1
0
1
2
3
4
5
6
7
Fig. 5.12. Differential Scanning Colorimetric Thermogram for Hard Paraffin
(10 to 120°C).
Figure 5.12 presents a thermogram for hard paraffin which has a double
endothermic event at temperatures 32.6 and 51.2 °C. It consists of a mixture of
straight chain high molecular weight hydrocarbons (C28 to C90) (Nhlapo, Luyt &
Vosloo, 1998).
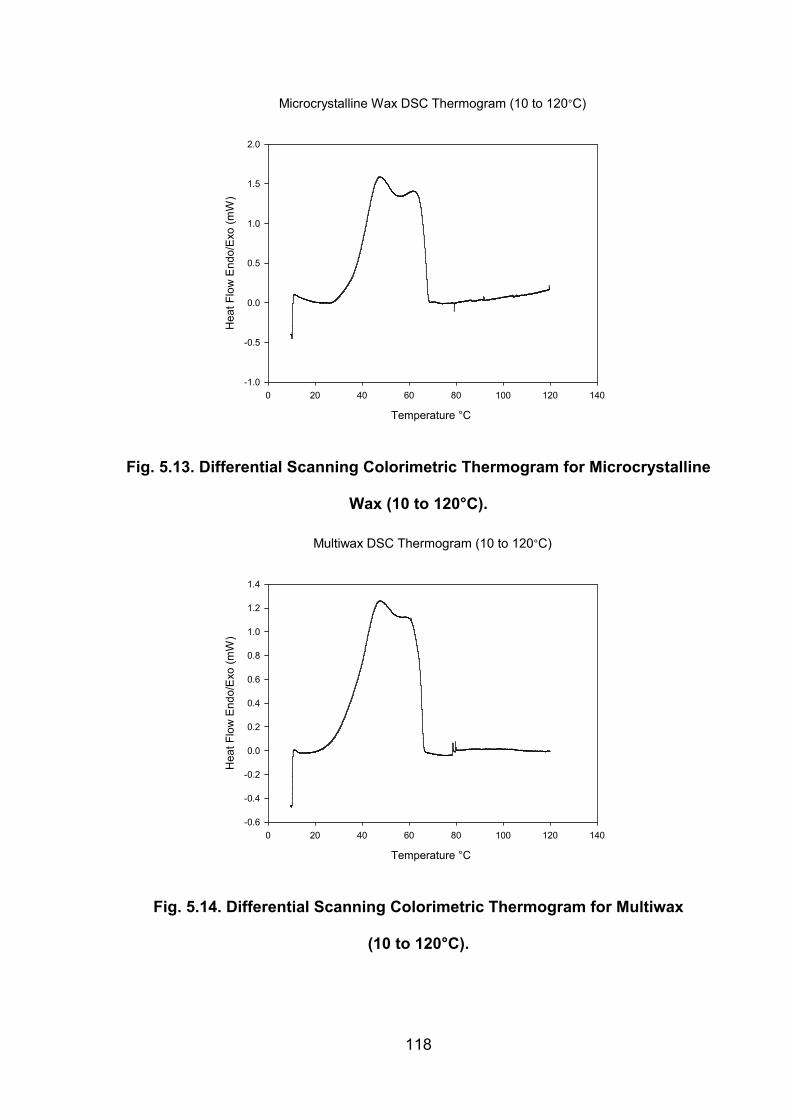
118
Microcrystalline Wax DSC Thermogram (10 to 120°C)
Temperature °C
0 20 40 60 80 100 120 140
Hea
t Flo
w E
ndo/
Exo
(mW
)
-1.0
-0.5
0.0
0.5
1.0
1.5
2.0
Fig. 5.13. Differential Scanning Colorimetric Thermogram for Microcrystalline
Wax (10 to 120°C).
Multiwax DSC Thermogram (10 to 120°C)
Temperature °C
0 20 40 60 80 100 120 140
Hea
t Flo
w E
ndo/
Exo
(mW
)
-0.6
-0.4
-0.2
0.0
0.2
0.4
0.6
0.8
1.0
1.2
1.4
Fig. 5.14. Differential Scanning Colorimetric Thermogram for Multiwax
(10 to 120°C).
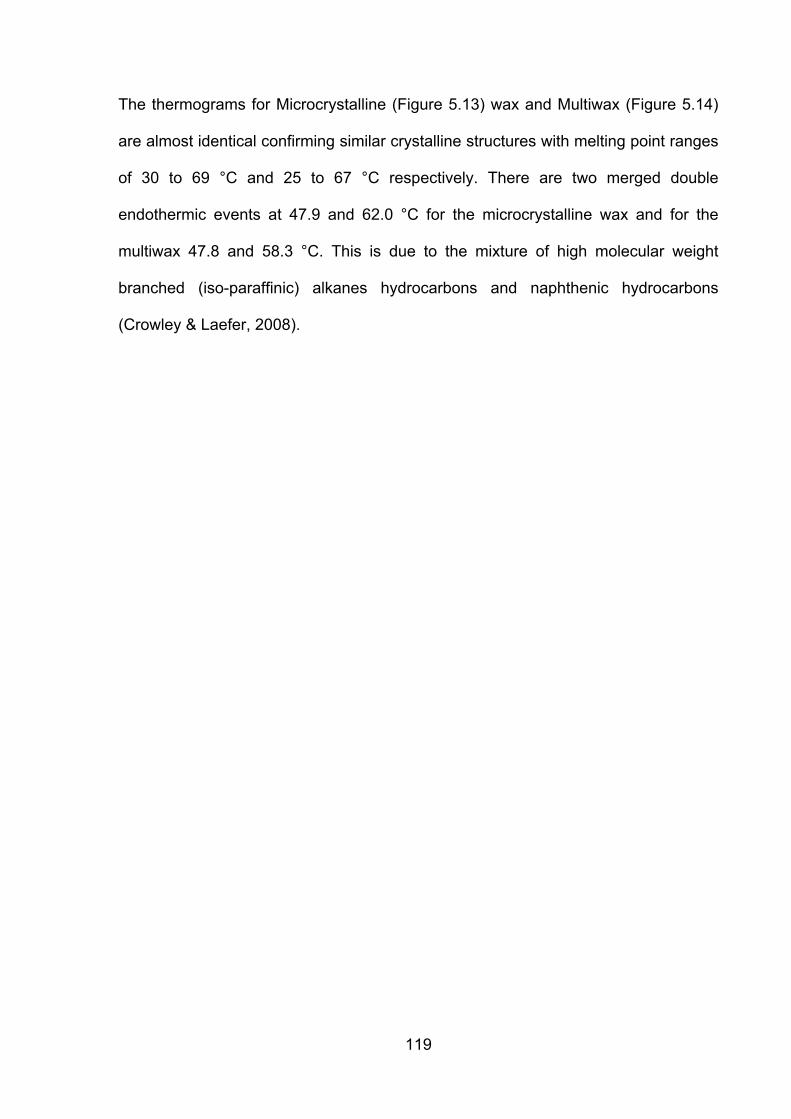
119
The thermograms for Microcrystalline (Figure 5.13) wax and Multiwax (Figure 5.14)
are almost identical confirming similar crystalline structures with melting point ranges
of 30 to 69 °C and 25 to 67 °C respectively. There are two merged double
endothermic events at 47.9 and 62.0 °C for the microcrystalline wax and for the
multiwax 47.8 and 58.3 °C. This is due to the mixture of high molecular weight
branched (iso-paraffinic) alkanes hydrocarbons and naphthenic hydrocarbons
(Crowley & Laefer, 2008).

120
References
Adamczyk, S., Lázaro, R., Pérez-Arquillué, C., Bayarri, S., & Herrera, A. (2010). Impact of the Use of Fluvalinate on Different Types of Beeswax from Spanish Hives. Archives of Environmental Contamination and Toxicology, 58 (3), 733-739. Adeyeye, M., Jain, A., Ghorab, M., & Reilly, W. (2002). Viscoelastic evaluation of topical creams containing microcrystalline cellulose/sodium carboxymethyl cellulose as stabilizer. AAPS PharmSciTech, 3 (2), 16-25. Bagchi, K. and Puri, S. (1998). Free radicals and antioxidants in health and disease. Eastern Mediterranean Health Journal. Volume 4, Issue 2, 350-360. Bancroft, W. D. (1913). the Theory of Emulsification, V. J. Phys. Chem., 17 (6), pp 501–519. Banwart, G. J. (1981). Conditions that Influence Microbial Growth. “Basic Food Microbiology,” 4, 73-120. Abridged Edition. Barton, S. J. (2008). Cosmetics Industry Overview Available from: http://www.articlesbase.com/womens-issues-articles/cosmetics-industry-overview-488931.html. (Accessed 23/10/2010). Binks, B. P. (1995). Emulsions. http://pubs.rsc.org.ezproxyd.bham.ac.uk/en/content/articlepdf/1995/pc/pc9959200097 (Accessed 08/05/2011). Blair, G. W. S. (1938). 191. The Spreading Capacity of Butter. I. Journal of Dairy Research, 9 (02), 208-214. Boode, K. & Walstra P. (1993). Partial coalescence in oil-in-water emulsions. 1 . Nature of the aggregation. Colloids and Surfaces A: Physicochemical and Engineering Aspects, 81, 121-137. Brown, A. and Butcher, M. (2005). A guide to emollient therapy. Nursing Standard (Royal College of Nursing, Great Britain), 19(24), 68-75. Brumberg, E. (1986). Save Your Money, Save Your face. Buchwald, R., Breed, M. D., & Greenberg, A. R. (2008). The thermal properties of beeswaxes: unexpected findings. J Exp Biol, 211 (1), 121-127. Burmester, A. (1992). Investigation of Paint Media by Differential Scanning Calorimetry (DSC). Studies in Conservation, Vol. 37, No. 2 pp. 73-81. Cannon, R. (2008). The Essence of Beauty Begins with a Good Moisturizer. Inside Cosmeceuticals Innovation in Personal Care & Cosmetics. Available at: http://www.insidecosmeceuticals.com/articles/2008/05/the-essence-of-beauty-begins-with-a-good-moisturiz.aspx (Accessed 06/04/2009).

121
Casado, C., & Heredia, A. (1999). Structure and dynamics of reconstituted cuticular waxes of grape berry cuticle (Vitis vinifera L.). Journal of Experimental Botany, 50, 175-182. Chattopadhyay, A. K., Shah, D. O., and Ghaicha, L. (1992) Double-tailed surfactants and their chain length compatibility in water-in-oil emulsions. Langmuir, 8 (1), pp 27–30. Choi, E. H., Man, M., Wang, F., Zhang, X., Brown, B. E., Feingold, K. R., & Elias, P. M. (2005). Is Endogenous Glycerol a Determinant of Stratum Corneum Hydration in Humans? J Investig Dermatol, 125 (2), 288-293. Clermont-Gallerande, H. D., Chavardes, V., & Zastrow, L. (1999). Crystal Clear Transparent Lipstick Formulation Based on Solidified Oils. International Journal of Cosmetic Science, 21 (6), 413-424. Cohen, M., & Kozlowski, K. (1998). Read My Lips: A Cultural History of Lipstick (Illustrated edition.). Chronicle Books. Coupland, J. N. (2002). Crystallisation in emulsions. Current Opinion in Colloid & Interface Science, 7 (5-6), 445-450. Crowley, A. and Laefer, D. F. (2008). Understanding micro crystalline waxes for the seismic protection of art objects. Journal of the American Institute for Conservation. Vol. 47, Issue. 2, 119-138. Culot, C. Durant, F. Mosley, D. H. Marie Andre, J. Vercauteren, D. P. (1994). Conformational analyses of the polymorphism of triglycerides. International Journal of Quantum Chemistry, Volume 52, Issue 21, pages 57-77. Darling, D. F. and Birkett, R.J. (1987). Food colloids in practice. In “Food Emulsions and Foams,” ed E. Dickinson, 1-29. London Royal Society of Chemistry. Delamarre, S., & Batt, C. A. (1999). The microbiology and historical safety of margarine. Food Microbiology, 16 (4), 327-333. Dickinson, E., & Golding, M. (1997). Rheology of Sodium Caseinate Stabilized Oil-in-Water Emulsions. Journal of Colloid and Interface Science, 191 (1), 166-176. Dickinson, E., Ritzoulis, C., & Povey, M. J. W. (1999). Stability of Emulsions Containing Both Sodium Caseinate and Tween 20. Journal of Colloid and Interface Science, 212 (2), 466-473. Donsky, H. (1985). Beauty is Skin Deep: A Doctors Guide to Healthy, Younger Looking Skin. Duynhoven, J. P. M. V., G. J. W. Goudappel, G. van Dalen, P. C. van Bruggen, J. C. G. Blonk, & A. P. A. M. Eijkelenboom. (2002). Scope of droplet size measurements in food emulsions by pulsed field gradient NMR at low field. Magnetic Resonance in Chemistry, 40 (13).

122
Dweck, A. C., & Burnham, C. A. M. (1980). Moulding techniques in lipstick manufacture: a comparative evaluation. International Journal of Cosmetic Science, 2 (3), 143-173. Dziezak, J.D. (1988). Emulsifiers: The interfacial key to emulsion stability. Food Technology, 42 (10), 172–186. Ersser, S. J., Maguire, S., Nicol, N.H., Penzer, R. and Peters, J., 2009. Best Practice in Emollient Therapy; A Statement for Health Care Professionals. 2nd Edition. Dermatological Nursing (supplement), 8 (3), pp. 1-22. Everett, D. H. (1988). Basic Principles of Colloid Science. Royal Society of Chemistry. Feng, J., Zeng, Y., Ma, C., Cai, X., Zhang, Q., Tong, M., Yu, B., et al. (2006). The Surfactant Tween 80 Enhances Biodesulfurization. Appl. Environ. Microbiol., 72 (11), 7390-7393. Fingas, M., & Fieldhouse, B. (2004). Formation of water-in-oil emulsions and application to oil spill modelling. Journal of Hazardous Materials, 107 (1-2), 37-50. Fourel, I., Guillement, J. P., & Le Botlan, D. (1995). Determination of Water Droplet Size Distributions by Low Resolution PFG-NMR: II. "Solid" Emulsions. Journal of Colloid and Interface Science, 169 (1), 119-124. Gaperlin, M., Tuar, L., Tuar, M., Kristl, J., & Šmid-Korbar, J. (1998). Lipophilic semisolid emulsion systems: viscoelastic behaviour and prediction of physical stability by neural network modelling. International Journal of Pharmaceutics, 168(2), 243-254. Garti, N., Binyamin, H., & Aserin, A. (1998). Stabilisation of water-in-oil emulsions by submicrocrystalline α-form fat particles. Journal of the American Oil Chemists' Society, 75(12), 1825-1831. Goff, H. D. (1997) Colloidal Aspects of Ice Cream-A Review. Int. Dairy Journal 7 363-373 Griffin, W.C. (1949) Classification of surface-active agents by “HLB”, J. Soc. Cosmetic Chem. 1, pp. 311–326. Groves, E. (2008) The Top 100 ranks the world’s largest cosmetics manufacturers by beauty sales.The Who’s Who of Cosmetics. A Who’s Who of the industry. Available at: http://www.scribd.com/doc/3027409/Top-100-Cosmetic-Manufacturers. (Accessed 24/12/2010). Guentert, A. M. and Linton, R. H. (2003). Growth and survival of selected pathogens in margarine-style table spreads. Journal of Environmental Health, 65 (9), 9-14.

123
Halliwell, B. (1994). Free Radicals and Antioxidants: A Personal View. Nutrition Reviews, 52 (8), 253-265. Harry, Ralph G. and J.B. Wilkinson (1973). Coloured Make-up Preparations. Harry's Cosmeticology (Revised edition): The Principles and Practice of Modern Cosmetics (Volume One), Chapter 13, 140-175. Hodge, S. M., & Rousseau, D. (2003). Flocculation and coalescence in water-in-oil emulsions stabilized by paraffin wax crystals. Food Research International, 36 (7), 695-702. Holmberg, Krister. (2002). Chapter 11. Surface Chemistry in the Petroleum Industry. Handbook of Applied Surface and Colloid Chemistry, Volumes 1 & 2, John Wiley & Sons 251-267. Huebner, V. R., & Thomsen, L. C. (1957). Spreadability and Hardness of Butter. I. Development of an Instrument for Measuring Spreadability. J. Dairy Sci., 40 (7), 834-838. ICI Americas Inc., The HLB System: A Time-saving Guide to Emulsifier Selection. (1980)(Wilmington, DE 19897, USA). Jahaniaval, F., Kakuda, Y., & Abraham, V. (2003). Characterisation of a double emulsion system (oil-in-water-in-oil emulsion) with low solid fats: Microstructure. Journal of the American Oil Chemists' Society, 80 (1), 25-31. Jenkins, P. & Snowden, M. (1996). Depletion flocculation in colloidal dispersions. Advances in Colloid and Interface Science 68, 57-96. Jiao, J., & Burgess, D. (2003). Rheology and stability of water-in-oil-in-water multiple emulsions containing Span 83 and Tween 80. The AAPS Journal, 5 (1), 62-73. Johansson D., Bergenståhl, B. and Lundgren, E., 1995. Water-in-triglyceride oil emulsions. Effect of fat crystals on stability. Journal of the American Oil Chemists’ Society 72 8, pp. 939–950. John, J., Bhattacharya, M., & Raynor, P. C. (2004). Emulsions containing vegetable oils for cutting fluid application. Colloids and Surfaces A: Physicochemical and Engineering Aspects, 237 (1-3), 141-150. Kameda, T. (2004). Molecular structure of crude beeswax studied by solid-state 13C NMR. J Insect Sci.; 4: 29. Kelley, W. C. (1948). The use of a microcrystalline wax in tablet polishing. I. Journal of the American Pharmaceutical Association, 37 (6), 253-254. Kilcast, D., & Subramaniam, P. (2000). The Stability and Shelf-life of Food.

124
Kobayashi, H., & Tagami, H. (2004). Functional properties of the surface of the vermilion border of the lips are distinct from those of the facial skin. British Journal of Dermatology, 150 (3), 563-567. Koonce, S., & Brown, J. (1945). The n-aliphatic acids of carnauba wax the isolation of tetracosanoic acid. Journal of the American Oil Chemists' Society, 22 (9), 217-218. Korhonen, M., Hirvonen, J., Peltonen, L., Antikainen, O., Yrjänäinen, L., & Yliruusi, J. (2004). Formation and characterisation of three-component-sorbitan monoester surfactant, oil and water-creams. International Journal of Pharmaceutics, 269 (1), 227-239. Krog, N. (1977). Functions of emulsifiers in food systems. Journal of the American Oil Chemists' Society, 54 (3), 124-131. Kumar, S. (2005). Exploratory analysis of global cosmetic industry: major players, technology and market trends. Technovation, 25 (11), 1263-1272. Lee, R. F. (1999). Agents Which Promote and Stabilize Water-in-Oil Emulsions. Spill Science & Technology Bulletin, 5 (2), 117-126. Lu, D., and Rhodes, D. G. (2000). Mixed Composition Films of Spans and Tween 80 at the Air-Water Interface. Langmuir 16, 8107-8112 Leunissen, M. E., van Blaaderen, A., Hollingsworth, A. D., Sullivan, M. T., & Chaikin, P. M. (2007). Electrostatics at the oil-water interface, stability, and order in emulsions and colloids. Proceedings of the National Academy of Sciences, 104 (8), 2585-2590. Madivala, B., Vandebril, S., Fransaer, J., & Vermant, J. (2009). Exploiting particle shape in solid stabilized emulsions. Soft Matter, 5 (8), 1717. Matas, A. J., Sanz, M. J., & Heredia, A. (2003). Studies on the structure of the plant wax nonacosan-10-ol, the main component of epicuticular wax conifers. International Journal of Biological Macromolecules, 33 (1-3), 31-35. McKetta, J. J. Jr (1993). Cosmetics, Lipstick. Encyclopedia of chemical processing and design (Volume 12), 93-96. MedEdPortal. (2007). KCUMB. http://www.pathguy.com/histo/000.htm (Accessed 28/11/2010). Melo, M.A.F. Melo, D.M.A. and Pinto, C.H.C. (1998). Carnauba Wax used as a Hydrophobic Agent for Expanded Vermiculite. Braz. J. Chem. Eng. (vol. 15) no. 1. Mikula, R. J., & Munoz, V. A. (2000). Characterisation of emulsions and suspensions in the petroleum industry using cryo-SEM and CLSM. Colloids and Surfaces A: Physicochemical and Engineering Aspects, 174 (1-2), 23-36.

125
Milanovic, J., Manojlovic, V., Levic, S., Rajic, N., Nedovic, V., & Bugarski, B. (2010). Microencapsulation of Flavors in Carnauba Wax. Sensors, 10 (1), 901-912. Mulhern, R., Fieldman, G., Hussey, T., Lévêque, J., & Pineau, P. (2003). Do cosmetics enhance female Caucasian facial attractiveness? International Journal of Cosmetic Science, 25 (4), 199-205. Murray, K., & Schoenfeld, R. (1951). Studies of waxes. III. The alcohols of carnauba wax. Journal of the American Oil Chemists' Society, 28 (11), 461-466. Myhara, R. M., Sablani, S. S., Al-Alawi, S. M., & Taylor, M. S. (1998). Water Sorption Isotherms of Dates: Modeling Using GAB Equation and Artificial Neural Network Approaches. Lebensmittel-Wissenschaft und-Technologie, 31 (7-8), 699-706. Nhlapo, N. S., Luyt, A. S., & Vosloo, H. C. M. (1998). Comparison of two curing agents in thermal crosslinking. I. Hard paraffin wax. Journal of Applied Polymer Science, 70 (8), 1551-1559. Nicol, N. H., 2005. Anatomy and Physiology of the Skin. Dermatology Nursing, 17(1). Nikolova, K R. Panchev, I. Kovacheva, D. and Pashova, S. (2009). Thermophysical and optical characteristics of bee and plant waxes. Journal of Optoelectronics and Advanced Materials, Vol. 11, No. 9, p. 1210 – 1213. Pasquali, R. C., Sacco, N. & Bregni, C. (2009). The Studies on Hydrophilic-Lipophilic Balance (HLB): Sixty Years after William C. Griffin’s Pioneer Work (1949-2009). Lat. Am. J. Pharm. 28 (2): 313-317. Pasquali, R. C., Taurozzi, M. P. & Bregni C. (2008). Some considerations about the hydrophilic–lipophilic balance system. International Journal of Pharmaceutics 356, 44–51. Paul J. M. W. L. Birker, Sijmen de Jong, Eli C. Roijers and Ton C. van Soest. (1991). Structural investigations of β′ triacylglycerols: An x-ray diffraction and microscopic study of twinned β′ crystals. Journal of the American Oil Chemists’ Society, Volume 68, Number 12, 895-906. Peltonen, & Yliruusi. (2000). Surface Pressure, Hysteresis, Interfacial Tension, and CMC of Four Sorbitan Monoesters at Water-Air, Water-Hexane, and Hexane-Air Interfaces. Journal of Colloid and Interface Science, 227 (1), 1-6. Persson, M. (2008). Alpha stable fats. Lipid Technology, 20 (1), 13-16. Peters Rit, A. W. Keunen, K. Bladel, B.V. Puleo, S. L. And Sprenger, J. (1990). “A New Beeswax Derivative for Cosmetic Formulations”, Cosmetics & Toiletries, 105 (8) 53-61. Pink, R. C. (1940) The Stabilisation of water-in-oil emulsions by oil-soluble soaps. http://pubs.rsc.org.ezproxyd.bham.ac.uk/en/content/articlepdf/1941/tf/tf9413700180 (Accessed 08/05/2011).

126
Pourreza, N., & Rastegarzadeh, S. (2004). Kinetic spectrophotometric determination of Tween 80. Talanta, 62 (1), 87-90. Rajin, M., Bono, A., & Mun, H. C. (2007). Optimisation of Natural Ingredient Based Lipstick Formulation by Using Mixture Design. Retrieved October 20, 2010, from http://adsabs.harvard.edu.ezproxye.bham.ac.uk/abs/2007JApSc...7.2099R Rawlings, A. V., Canestrari, D. A., & Dobkowski, B. (2004). Moisturizer technology versus clinical performance. Dermatologic Therapy, 17 (s1), 49-56. Rieger, M. M., & Rhein, L. D. (1997). Surfactants in cosmetics. CRC Press. Rousseau, D. (2000). Fat crystals and emulsion stability -- a review. Food Research International, 33 (1), 3-14. Ryu, J., Park, S., Kwak, T., Chang, M., Park, M., Choi, K., et al. (2005). Improving lip wrinkles: lipstick-related image analysis. Skin Research and Technology: Official Journal of International Society for Bioengineering and the Skin (ISBS) [and] International Society for Digital Imaging of Skin (ISDIS) [and] International Society for Skin Imaging (ISSI), 11(3), 157-64. Salvador, A., & Chisvert, A. (2007). Analysis of cosmetic products. Elsevier. Santos, F. K. G., Neto, E. L. B., Moura, M. C. P., Dantas, T. N. C., & Neto, A. A. D. (2009). Molecular behavior of ionic and nonionic surfactants in saline medium. Colloids and Surfaces A: Physicochemical and Engineering Aspects, 333 (1-3), 156-162. Schulman, J. H. & Cockbain, E. G. (1939) Molecular interactions at oil/water interfaces. Part 11. Phase inversion and stability of water in oil emulsions. http://pubs.rsc.org.ezproxyd.bham.ac.uk/en/content/articlepdf/1940/tf/tf9403500661 (Accessed 08/05/2011). Smewing, J. (1998). Analysing the textural properties of cosmetics. Cosmetics and Toiletries Manufacture Worldwide, 249-253. Talens, P., & Krochta, J. M. (2005). Plasticizing Effects of Beeswax and Carnauba Wax on Tensile and Water Vapor Permeability Properties of Whey Protein Films. Journal of Food Science, 70 (3), 239-243. Tcholakova, S., Denkov, N. D., & Danner, T. (2004). Role of surfactant type and concentration for the mean drop size during emulsification in turbulent flow. Langmuir: The ACS Journal of Surfaces and Colloids, 20 (18), 7444-7458. Tensiometer K100 MK2/SF/C, Instruction Manual, V2-05, Krüss GmbH, Hamburg, 2001–2005.

127
Teo, B., Basri, M., Zakaria, M., Salleh, A., Rahman, R., & Rahman, M. (2010). A potential tocopherol acetate loaded palm oil esters-in-water nanoemulsions for nanocosmeceuticals. Journal of Nanobiotechnology, 8 (1), 4. Voorhees, P. W. (1992). Ostwald Ripening of Two-Phase Mixtures. Annu. Rev. Maler. Sci. 22: 197-215. Wang, T. and Lee, G. (1997). The effect of formulation on the hardness and crystallisation of emulsion lipsticks. Journal of the Society of Cosmetic Chemists, 48, 41-50. Weber, J. M. & de Villebonne, J. C. (2002). Differences in purchase behavior between France and the USA: the cosmetic industry. Journal of Fashion Marketing and Management, 6 (4), pp. 396-407. Willard, H. H., Merritt, Jr., L. L., Dean, J. A., Settle, Jr., F. A. (1981). Thermal Analysis. “Instrumental Methods of Analysis”, (Sixth Edition). Chapter 20. 606-607. Wilson, R., & Smith, M. (1998). Human Studies on Polyglycerol Polyricinoleate (PGPR). Food and Chemical Toxicology, 36 (9-10), 743-745. Wolf, B., Lam, S., Kirkland, M., & Frith, W. J. (2007). Shear thickening of an emulsion stabilized with hydrophilic silica particles. Journal of Rheology, 51 (3), 465-478. Wolf, R., Orion, E., & Davidovici, B. (2007). Skin care products and subtle data manipulation. Clinics in Dermatology, 25 (2), 222-224. Yang Guiqin, Li Xiaozeng, Yan Lemei, Cui Jianzhong, & Guo Congrong. (1997). Microencapsulation of ultramarine particles in water/oil emulsion and surface fractal dimensionality of the particles. Dyes and Pigments, 34 (1), 57-62. Zeng, H. C. (2007). Ostwald Ripening: A Synthetic Approach for Hollow Nanomaterials Current Nanoscience 3, 177-181. Zhang, Z., and Yin, H. (2005). Effect of polyoxypropylene chain length on the critical micelle concentration of propylene oxide-ethylene oxide block copolymers. Journal of Zhejiang University Science, 6 (3): 219–221. Zwanikken, J., & van Roij, R. (2007). Charged Colloidal Particles and Small Mobile Ions near the Oil-Water Interface: Destruction of Colloidal Double Layer and Ionic Charge Separation. Physical Review Letters, 99 (17), 178301-4. Zwanikken, J., de Graaf, J., Bier, M., & van Roij, R. (2008). Stability of additive-free water-in-oil emulsions. Journal of Physics: Condensed Matter (20) IOP Publishing.