Embed Size (px)
Citation preview

Stabilising sunflower biodiesel with synthetic antioxidants
by
Isabella Hester van der Westhuizen
Submitted in partial fulfilment of the requirements for the degree
Doctor of Philosophy
Chemical Technology
in the
Department of Chemical Engineering
Faculty of Engineering, Build Environment and Information Technology
University of Pretoria
Supervisor: Prof. W.W. Focke
October 2017

Page i
DECLARATION BY CANDIDATE
I hereby declare that the thesis submitted for the degree PhD: Chemical Technology,
at the University of Pretoria, is my own original work and has not previously been submitted
to any other institution of higher education. I further declare that all sources cited or quoted
are indicated and acknowledged by means of a comprehensive list of references.
I H van der Westhuizen Date
Copyright: © University of Pretoria, 2017.

Page ii
DEDICATION
My husband Driekus for his love, support and encouragement, and
my children Barry, Wilhelm, Idrian and Megan.
Without any one of you,
this endeavour would have been impossible
October 2017

Page iii
ACKNOWLEDGEMENTS
Prof. Walter Focke, for his continued motivation and encouragement. He was always
available to give support and advice throughout this mission whenever it was needed.
Financial support for this research, from the Energy Institutional Research Theme of
the University of Pretoria, is gratefully acknowledged.
The Department of Chemical Engineering, for the use of their instruments, especially
Alette Devega for chemicals and laboratory equipment and Howard Benade for
helping with the viscosity tests.
Prof. Ncholu Manyala for his continuous support.
Prof Ben Botha at TUT for allowing me to use the GC-FID in his department.
The Consulting and analytical services at the CSIR for helping with the GC analysis,
especially Brian Marais and Samantha Pillay.
Bioservices for additional analysis.
Gerard Puts for his advice regarding NMR analysis.
Dr Selepe, Department of Chemistry at the University of Pretoria, for NMR analysis.
Lastly my parents for the sunflower pictures from their farm near Brits.

Page iv
ABSTRACT
The main objective of this project was to investigate the effect of synthetic antioxidants on
the oxidation stability of sunflower biodiesel. Although the effect of antioxidants on the
behaviour of edible plant oils has been widely investigated, less is known on the
effectiveness, and possible synergistic combinations, of antioxidants on the stabilization of
biodiesel also referred to as FAME (fatty acid methyl esters).
For this project biodiesel was made at room temperature via the transesterification of
sunflower oil with methanol in the presence of KOH as catalyst. Depending on the sunflower
oil batch used, the ester content of the samples, as determined using GC-FID and 1H NMR
analysis, ranged from 92 to 98 wt.% The progress of the transesterification reaction was
monitored by 1H NMR and FTIR spectroscopy in addition to performing viscosity
measurements.
The oxidative stability was determined using the Rancimat method. The European Standard
EN 14112 for the Rancimat method describes two procedures for determining the induction
period. The automated method relies on finding the position of the peak in the second
derivative of the conductivity vs. time curve while the manual method is based on the
intersection of two tangents lines to the response curve. It was shown that the latter method
can also be automated by a curve fitting approach based on a novel Rancimat response
function. This analysis demonstrates that the induction period values determined by the two
methods differ with the second derivative method returning slightly higher estimates for the
induction period.
Oxidation stability was investigated by stabilising the sunflower biodiesel using three
different types of antioxidants and their combinations at a fixed dosage level of 0.15 wt.%.
They included a hindered phenolic antioxidant, tetrakis[methylene(3,5-di-t-butyl-4-
hydroxyhydrocinnamate)]methane (Anox 20), an amine-type antioxidant, poly(1,2-dihydro-
2,2,4-trimethylquinoline) (Orox PK) and a phosphite-type antioxidant, tris(nonylphenyl)
phosphite (Naugard P). When used alone, Anox 20 gave the highest stabilization factor
followed by Orox PK and Naugard P. When used in binary or ternary formulations, no
antagonistic effects were found. Anox 20 was the single most effective stabilizer of the three.
However, synergistic improvement of stability was observed on partial substitution with Orox
Page v
PK. The antioxidant Naugard P seemed to have no effect on the stabilization of sunflower
biodiesel. The Rancimat induction period data was fitted with Scheffé polynomials. The
optimum antioxidant mixture combination comprised Anox 20 and Orox PK in the mass ratio
of ca.2:1.
It was of interest to determine whether the Orox PK also synergises with other phenolic
antioxidants. Therefore, combinations containing 33.3% Orox PK together with, butylated
hydroxytoluene (BHT), tert-butylhydroxyquinone (TBHQ), 2,5-di-tert-butyl-1,4-dihydroxybenzene
(DTBHQ), pyrogallol and propyl gallate were tested alone and compared to results obtained
for the neat antioxidant on its own, keeping the total dosage level at 0.15%. All these
antioxidants proved to be more effective stabilizers than Anox 20 in sunflower biodiesel.
Only DTBHQ showed improved stabilization when used in combination with Orox PK. The
antioxidants BHT, TBHQ, pyrogallol and propyl gallate showed decreased stabilization when
combined with Orox PK.

Page vi
Table of Contents
Chapter 1: Introduction ................................................................................ 1
1.1. Project Objective ................................................................................................... 1
1.2. Rationale for Project .............................................................................................. 1
1.2.1. Biodiesel oxidation stability ........................................................................... 1
1.2.2. Antioxidant effect .......................................................................................... 2
1.2.3. Biofuels industrial strategy of South Africa .................................................... 3
1.3. Project Design ....................................................................................................... 4
1.3.1. Phase 1: Preparation of biodiesel .................................................................... 4
1.3.2. Phase 2: Effect of antioxidant blends on oxidation stability ............................ 4
1.3.3. Phase 3: Results ............................................................................................. 5
Chapter 2: Literature.................................................................................... 7
2.1. Introduction ........................................................................................................... 7
2.2. History of Biodiesel ............................................................................................... 8
2.3. Biodiesel Specifications and Properties ................................................................ 11
2.3.1. Some important quality parameters specified for biodiesel ........................... 14
2.4. Biodiesel Production Technologies/Processes ...................................................... 17
2.4.1. Dilution/blending ......................................................................................... 17
2.4.2. Micro-emulsions .......................................................................................... 18
2.4.3. Thermal cracking (Pyrolysis) ....................................................................... 18
2.4.4. Transesterification........................................................................................ 19
2.5. Biodiesel Feed Stock ........................................................................................... 21
2.6. Fatty Acid Composition of Vegetable Oils ........................................................... 23
2.7. Sunflower Oil ...................................................................................................... 25
2.7.1. Background .................................................................................................. 25
2.7.2. Sunflower oil composition ........................................................................... 27
2.8. Transesterification ............................................................................................... 28
2.9. Transesterification Reaction Mechanisms ............................................................ 29
2.9.1. Parameters influencing transesterification .................................................... 32
2.9.2. Monitoring transesterification reaction ......................................................... 37
2.10. Oxidation Stability of Biodiesel ........................................................................... 38

Page vii
2.10.1. Influence of fatty acid composition .............................................................. 39
2.10.2. Mechanism of oxidation ............................................................................... 41
2.10.3. Autoxidation of linoleic acid ........................................................................ 43
2.10.4. Mechanism of antioxidants........................................................................... 46
2.10.5. Antioxidants type ......................................................................................... 47
2.10.6. Effect of antioxidants on oxidative stability .................................................. 48
2.10.7. Synergy........................................................................................................ 51
2.11. Mixture Experiments ........................................................................................... 54
2.11.1. Mixture designs ........................................................................................... 54
2.11.2. Correlating the ternary IP mixture data with Scheffé K-polynomials ............ 56
Chapter 3: Methodology ............................................................................. 60
3.1. Background ......................................................................................................... 60
3.2. Theory: Biodiesel Production ............................................................................... 60
3.3. Experimental: Biodiesel production ..................................................................... 61
3.3.1. Materials ...................................................................................................... 61
3.3.2. Biodiesel preparation ................................................................................... 62
3.3.3. Monitoring the mixing effect on the transesterification reaction ................... 63
3.4. Biodiesel Characterisation Procedures ................................................................. 64
3.4.1. Gas Chromatography: GC-FID..................................................................... 65
3.4.2. Fourier Transform Infrared spectroscopy (FTIR) .......................................... 68
3.4.3. 1H NMR spectroscopy.................................................................................. 71
3.4.4. Viscosity and density ................................................................................... 73
3.4.5. Thin layer chromatography: TLC ................................................................. 74
3.4.6. Additional characterization methods ............................................................ 75
3.5. Oxidation Stability ............................................................................................... 81
3.5.1. Antioxidants................................................................................................. 81
3.5.2. Antioxidant formulations with biodiesel ....................................................... 81
3.5.3. Rancimat oxidation test ................................................................................ 84
3.6. Data reduction ..................................................................................................... 86
Chapter 4: Results and Discussion ............................................................. 89
4.1. Effect of Reaction Time on Transesterification of Sunflower Biodiesel................ 89

Page viii
4.1.1. GC-FID and 1H NMR .................................................................................. 89
4.1.2. Viscosity measurements ............................................................................... 91
4.1.3. Thin layer chromatography .......................................................................... 92
4.1.4. FTIR analysis using HATR sample accessory .............................................. 93
4.2. Biodiesel Characterisation ................................................................................... 95
4.2.1. FTIR analysis using HATR sample accessory .............................................. 97
4.3. Oxidative Induction Time .................................................................................... 99
4.3.1. Oxidative induction periods from global Rancimat data analysis .................. 99
4.3.2. Effect of antioxidant concentration on induction time ................................. 100
4.3.3. Effect of measurement temperature on induction time ................................ 104
4.3.4. Effect of antioxidant combinations on oxidative induction ......................... 106
4.3.5. Combinations of Orox PK with other phenolic-based compounds .............. 113
Chapter 5: Conclusion .............................................................................. 115
References: ................................................................................................. 117
Appendix A: Simplified theory for an antioxidant stabilisation mechanism..
................................................................................................. 126
Appendix B: Molecular weight calculation for sunflower oil .................... 128
Appendix C: GC-FID Results for sample BD01 ........................................ 130
Appendix D: 1H –NMR spectra ................................................................... 136

Page ix
List of Schemes
Scheme 1: Basic transesterification reaction with methanol ................................................ 29
Scheme 2: Consecutive steps for transesterification ............................................................. 31
Scheme 3: Bis-allylic configurations for linoleic and linolenic acids ................................... 40
Scheme 4: Common fatty acid methyl esters according to Yaakob et al. (2014)................... 40
Scheme 5: Step 1 - Initiation reaction .................................................................................. 41
Scheme 6: Step 2 – Propagation .......................................................................................... 42
Scheme 7: Branching reactions............................................................................................ 42
Scheme 8: Step 3 – Termination .......................................................................................... 42
Scheme 9: Mechanism for hydroperoxide formation in the autoxidation of Linoleic acid
according to Schneider (2009) ......................................................................... 44
Scheme 10: Mechanism of hydroperoxide decomposition and the formation of secondary
oxidation products according to Choe and Min (2006)..................................... 45
Scheme 11: Antioxidant mechanisms .................................................................................. 46
Page x
List of Figures
Figure 1.1: Schematic diagram depicting the project layout ................................................... 6
Figure 2.1: Sunflowers on a farm near Brits, North West Province, South Africa ................ 26
Figure 2.2: Typical triangular design with three components, combined [3,2] and [3,3] lattice
....................................................................................................................... 55
Figure 3.1: Sunflower oil from Sunfoil (left) and sunflower biodiesel (top layer) with glycerol
(bottom layer), after transesterification (right) ................................................. 63
Figure 3.2: Mixing Experiment 2, after 24 h settling, before glycerol removal (1 to 15 min
mixing time) ................................................................................................... 64
Figure 3.3: Mixing Experiment 2, samples after last water wash, before drying (1 to 15 min
mixing time) ................................................................................................... 64
Figure 3.4: HATR sampling accessory used with the Perkin Elmer Spectrum 100 ............... 71
Figure 3.5: Anton Paar SVM 3000 rotational Stabinger viscometer ..................................... 74
Figure 3.6: Karl Fischer apparatus for water content measurement ...................................... 78
Figure 3.7: GC instrument used for determination of methanol content ............................... 79
Figure 3.8: Setaflash Series 3 closed cup flash point tester .................................................. 80
Figure 3.9: From left sunflower oil, sunflower biodiesel, and sunflower biodiesel spiked with
different antioxidants ...................................................................................... 81
Figure 3.10: Metrohm 895 Professional PVC Thermomat ................................................... 84
Figure 3.11: Schematic of Rancimat instrument, heating block, reaction vessel and
measurement cell (image obtained from Metrohm) .......................................... 85
Figure 3.12: Conductivity versus time plot (image obtained from Metrohm) ....................... 85
Figure 3.13: Schematic illustration of the data reduction methods used ............................... 87
Figure 4.1: Mixing effect on ester content using data from GC-FID and 1H NMR ............... 90
Figure 4.2: Kinematic viscosity measurements for SET 01 and SET 02 ............................... 91
Figure 4.3: SET 01 and SET 02 using solvent mixture hexane, ethyl acetate, and acetic acid
anhydride in the ratio of 90:9:1 v/v .................................................................. 92
Figure 4.4: SET 01 and SET 02 using solvent mixture hexane, diethyl ether, and acetic acid
in the ratio of 70:30:1 v/v. ............................................................................... 92
Figure 4.5: FTIR spectra for sample SET 01 (left) and SET 02 (right) at 550 – 4000 cm1
... 94
Figure 4.6: FTIR spectra for sample SET 01 (left) and SET 02 (right) at 3100 – 3800 cm1
. 94
Figure 4.7: FTIR spectra for sample SET 01 (left) and SET 02 (right) at 800 – 1400 cm1
... 94
Figure 4.8: FTIR of sunflower oil and sunflower biodiesel .................................................. 98

Page xi
Figure 4.9: FTIR of sunflower biodiesel before and after Rancimat oxidation test ............... 98
Figure 4.10: (a) Representative Rancimat conductivity vs. time curves and (b) the
corresponding response functions extracted from raw data. A: Neat biodiesel at
120 C. B and C: Biodiesel spiked with 0.15 wt.% Anox 20 at 100 and 90 C
respectively. .................................................................................................... 99
Figure 4.11: Comparing the model-based induction times to those reported by the software
installed on the Rancimat instrument. (a) IPR vs. IPT, and (b) IPR vs. IPD. A:
Different Anox 20 concentrations; B: Biodiesel with 0.15 wt.% Anox at
different temperatures, and C: Neat biodiesel at different temperatures.......... 100
Figure 4.12: The effect of antioxidant concentration on the induction time. ....................... 104
Figure 4.13: The effect of measurement temperature on the induction time for neat biodiesel
batch BD02 and a sample spiked with 0.15 wt.% antioxidant (Anox 20). ...... 106
Figure 4.14: Representative baseline-corrected Rancimat conductivity vs. time curves. The
symbols represent experimental data and the solid lines are fits to Equation 14.
(a) Neat biodiesel; (b) 0.15 wt.% Anox 20; (c) 0.05 wt.% Orox PK with 0.10
wt.% Anox 20. The symbols indicate experimental results determined in
duplicate and the solid and broken lines model fits. ....................................... 107
Figure 4.15: Measured and predicted Rancimat induction times. These induction times are
based on the tangent method for blends of Naugard P, Anox 20 and Orox PK.
The total antioxidant content was fixed at 0.15 wt.%. The variable x1 indicates
the mass fraction of first mentioned antioxidant in the binary antioxidant blend.
..................................................................................................................... 109
Figure 4.16: Measured and predicted Rancimat induction times. These induction times are
based on the tangent method for blends of Anox 20 and Orox PK. The total
antioxidant content was fixed at 0.15 wt.% and 0.25 wt.%. The variable x1
indicates the mass fraction of first mentioned antioxidant in the binary
antioxidant blend. .......................................................................................... 112
Figure 4.17: IPT values for neat antioxidants and combinations with Orox PK................... 113
Figure 4.18: Plots of (a) fi() = IPi/ and (b) the variation of IPD/IPT with the shape parameter
. .................................................................................................................. 114
Page xii
List of Tables
Table 2.1: Biodiesel quality requirement ............................................................................. 13
Table 2.2: Fatty acids and their corresponding methyl esters ............................................... 24
Table 2.3: Typical fatty acid composition (wt.%) for some common feed stock oils and fats
used for biodiesel production .......................................................................... 25
Table 2.4: Fatty acid composition of regular, mid and high oleic sunflower oil .................... 28
Table 2.5: Antioxidant type and structure ............................................................................ 49
Table 3.1: Antioxidant used for oxidation stability .............................................................. 82
Table 3.2: Antioxidant weight fraction for the three main types of antioxidants ................... 83
Table 3.3: Antioxidant weight fractions for combinations of Orox PK with additional
phenolic type antioxidants ............................................................................... 83
Table 3.4: Analytical expressions for the response function, its derivatives and some of its
properties ........................................................................................................ 88
Table 4.1: The effect of mixing time on ester conversion using data from GC-FID and
1H NMR .......................................................................................................... 90
Table 4.2: Viscosity and density measurements ................................................................... 91
Table 4.3: Ester content and FAME composition of biodiesel samples ................................ 96
Table 4.4: Density and viscosity results biodiesel samples................................................... 96
Table 4.5: Additional characterisation of biodiesel samples ................................................. 97
Table 4.6: Effect of antioxidant (Orox PK) concentration on the IP of sunflower biodiesel 101
Table 4.7: Effect of antioxidant (Naugard P) concentration on the IP of sunflower biodiesel
..................................................................................................................... 102
Table 4.8: Effect of antioxidant (Anox 20) concentration on the IP of sunflower biodiesel 103
Table 4.9: Effect of measurement temperature on the induction period of neat sunflower
biodiesel and a sample spiked with 0.15 wt.% Anox 20 antioxidant .............. 105
Table 4.10: Average Induction times (IP) of biodiesel spiked samples at 0.15wt.% ........... 108
Table 4.11: Orox (1) – Naugard (2) – Anox (3) antioxidant package Scheffé cubic model for
the prediction of IPT and for correlating the composition dependence of the
parameters of the response function. The total antioxidant content was fixed at
0.15 wt.%. ..................................................................................................... 109
Table 4.12: Average Induction times (IP) of biodiesel spiked samples at 0.25wt.% ........... 111

Page xiii
List of Abbreviations and Acronyms
AOCS American Oil Chemist Society
ARC Agricultural Research Council
ASTM American Society of Testing and Materials
ATR Attenuated total reflectance
BD Biodiesel
BHA Butylated hydroxyanisole
BHT Butylated hydroxytoluene
BS British Standard
BTME Beef tallow methyl ester
CO2 Carbon dioxide
DTBHQ 2,5-di-tert-butyl-1,4-dihydroxybenzene
DG Diglyceride
DPA Diphenylamine
DPF Distilled poultry fat base biodiesel
DSBO Distilled soybean oil biodiesel
EN European standard
FAME Fatty acid methyl ester
FFA Free fatty acid
FID Flame ionisation detector
FTIR Fourier transform infrared
GC Gas chromatography
GC-FID Gas chromatography flame ionisation detector
CSIR Council for Industrial and Scientific Research
HATR Horizontal attenuated total reflectance
HPLC High performance liquid chromatography
1H NMR Proton nuclear magnetic resonance
KI Potassium iodide
KOH Potassium hydroxide

Page xiv
MG Monoglyceride
MIR Mid infrared
MUFA Mono unsaturated fats
NaOH Sodium hydroxide
NIR Near infrared
NOx Nitrogen oxide
OBPA Octylated butylated diphenyl amine
OECD Organization for Economic Co-operation and Development
OOT Oxidation induction temperature
OSI Oil Stability Index
PDSC Pressure differential scanning calorimetry
PG Propyl gallate
PME Palm methyl ester
PUFA Polyunsaturated fats
PY Pyrogallol
SAFA Saturated fats
SANS South African National Standard
SBHHC Thioethylenebis(3,5-di-t-buty-4-hydroxyhydrocinnamate)
SBO Soybean biodiesel
TBHQ Tert-butylhydroxyquinone
TBP tert-butylated phenol
TG Triglyceride
TLC Thin layer chromatography
TMS Tetramethylsilane
WVO Waste vegetable oil

Page xv
List of Symbols
Symbol Parameter Units
ΣA Total peak area for methyl ester C14 to that in C24:1 a.u.
ACH2 integration value of -methylene protons a.u.
AEI Peak area corresponding to methyl heptadecanoate, a.u.
AMe Integration value of the methoxy protons a.u.
AT Pre-exponential factor, Equation 18 h
a, ai, aij, etc. Scheffé polynomial adjustable parameters
B Na2S2O3 solution required for titration of Blank mL
C Ester content, Equation 7 wt.%
C Conversion of triglycerides, Equation 9 %
C Concentration of antioxidant, Equation 17 wt.%
CEI Concentration of methyl heptadecanoate mg ml1
EA Activation energy J mol1
K1
IP Induction period h
IPD Derivative method induction period h
IPR Rancimat induction period h
IPT Tangent method induction period h
IPo Induction time of neat biodiesel h
IP(T) Induction time, at temperature T h
IV Iodine value g iodine /100g
k Proportionality constant -
K Constant, Equation 17 h (wt.%)1
L Linolenic acid methyl ester content wt.%
m Index for simplex experimental design -
m Slope of the initial portion of the conductivity curve mS h1
q Number of components in a mixture -
R Gas constant J mol1
K1
Rf Retention factor -

Page xvi
S Na2S2O3 solution required for titration of Sample mL
t Time h
T Temperature K, °C
V Volume mL
VEI Volume of the methyl heptadecanoate solution used mL
W Mass g, mg, µg
SB Becker synergy ratio (IPmix/IPexpected) -
SM Marinova synergy ratio
Greek symbols
proportionality constant mS
(t) experimental conductivity vs. time curve mS
min conductivity offset at time t = 0 mS
dimensionless shape factor -
characteristic time constant h
Subscripts
o Initial or neat
mix mixture
exp expected
min minimum
max maximum

Chapter 1 Page 1
Chapter 1: Introduction
1.1. Project Objective
The main objective of this project was to investigate the effect of selected synthetic
antioxidants and their blends on the oxidation stability of sunflower oil-based biodiesel.
Although the effect of antioxidants on the behaviour of edible plant oils has been widely
investigated, less is known on the effectiveness and possible synergistic combinations of
antioxidants on the stabilization of biodiesel.
Biodiesel is an alternative non-toxic and biodegradable fuel produced from vegetable
oil, animal fat and used or recycled oils and fats. Biodiesel, unlike petroleum diesel, oxidises
as soon as it has been produced and is thus more prone to oxidation or auto-oxidation during
long term storage.
Currently the reference method for determining the oxidation stability of biodiesel is
EN14112 (BS EN 14112, 2003) also known as the Rancimat method.
The oxidation rate of neat biodiesel (FAME) depends on the nature of the fatty acids,
temperature, oxidation conditions, the presence or absence of light, radiation intensity, and
the presence of naturally occurring antioxidants. The addition of natural and synthetic
antioxidants can increase the oxidation stability of biodiesel.
1.2. Rationale for Project
The rationale for this project is threefold and is better explained by the following:
1.2.1. Biodiesel oxidation stability
In a previous study regarding the effect of synthetic antioxidants on the oxidation stability of
biodiesel (Focke et al., 2012), biodiesels were prepared from canola, soybean and sunflower
oils using base catalysed methanolysis. Rancimat induction periods (IP) for the neat
sunflower, soybean and canola biodiesels were respectively 0.61, 3.3, and 7.1 h. The
biodiesels were stabilised by adding 0.5 wt.% of the synthetic antioxidants, 2,5-di-tert-butyl-
1,4-dihydroxybenzene (DTBHQ), poly(1,2-dihydro-2,2,4-trimethylquinoline) (Orox PK) and
tris(nonylphenyl) phosphite (Naugard P) separately to each biodiesel. The Rancimat IP
results showed:

Chapter 1 Page 2
The neat canola biodiesel conformed to EN 14214, the European specification for
biodiesel which was at the time IP > 6 h, but has since changed and is currently IP
> 8h. Addition of DTBHQ or Orox PK improved the stability of canola biodiesel.
Soybean biodiesel samples spiked with DTBHQ at concentrations of 0.5 wt.% and
above also satisfied the EN14214 specification.
Sunflower biodiesel showed improved IP value with Orox PK, but the 6 h
specified by EN 14214 (BS EN 14214, 2008+A1:2009) as well as the 3 h
induction period specified by ASTM D-6751 (ASTM D6751-15ce1, 2016) could
not be reached.
Oxidation stability is a very important quality parameter for biodiesel and it is worth
investigating possible antioxidant systems for sunflower biodiesel which would improve the
oxidation stability and possible conformance to the biodiesel specifications.
1.2.2. Antioxidant effect
As a result of the previous study (Focke et al., 2012), it was decided to investigate the
addition of a low-cost amine-based antioxidant, like Orox PK which showed enhanced
oxidative stability when added to sunflower biodiesel. Orox PK is also known to be a very
effective antioxidant in rubbers which contain numerous double bonds just as is the case for
sunflower oil biodiesel. Due to the finding that addition of a synthetic antioxidant may
actually reduce the oxidative stability in the case of canola stabilised with Naugard P, it was
also decided to investigate possible synergistic and/or antagonistic antioxidant effects. The
synergy between phenolic- and phosphite-based antioxidants is well established in polyolefin
polymers and it was of interest to see whether that applies to biodiesel too (Bauer et al.,
1995). However, none of the antioxidants from the previous study, when they were used on
their own in sunflower oil biodiesel, produced sufficient inhibition to pass the lowest
specification of 3 h required for biodiesel sold in the USA.
The three main antioxidants used in this study are usually applied in polymers. These
antioxidants are relatively inexpensive compared to those recommended for biodiesel. Thus,
the main objective of this study was to study the stabilization of sunflower oil-based
biodiesel. Secondly, it was of interest to determine whether synergistic activity occurs in
mixtures of phenolic-, phosphite- and amine-based antioxidants in sunflower biodiesel.
Combinations of these antioxidants were therefore explored using the Rancimat method
while keeping the overall antioxidant concentration fixed at 0.15 wt.%.

Chapter 1 Page 3
The aims for the present investigation were:
(a) To determine whether antioxidants commonly used in polyolefin polymers such as
polyethylene (which features no double bonds) and in natural rubber where there are
numerous double bonds present have any merit as biodiesel stabilisers, and
(b) To establish whether synergistic effects are present when they are used in suitable
combinations.
1.2.3. Biofuels industrial strategy of South Africa
The Biofuels Industrial Strategy of South Africa (Department of Minerals and Energy, 2007),
also called the final Biofuels Strategy, was approved in December 2007. For the production
of biofuels in South Africa sugar cane and sugar beet was proposed for bioethanol and
sunflower, canola and soybeans for biodiesel. This decision was based on the existing crop
production and proven crops. However, to alleviate concerns about food security it was
decided that the feed stock for biodiesel should be soybeans and for biofuel, sorghum (Gilder
and Mamkeli, 2014). Both soybean and sunflower oil were analysed as potential biodiesel
feed stock in terms of supply and demand, cost and pricing. Biofuel projects are unfortunately
not financially attractive due to feed stock prices, food security concerns, and the relatively
low cost of crude oil. The result is that not even a single large biofuel company has emerged
in South Africa during the five years from 2008 to 2013 (Burger, 2014).
In October 2013, it was announced that South African fuel producers will begin
mandatory blending of petrol and diesel with biofuels from 1 October 2015 in an effort to
encourage investment in its biofuels sector and reduce its reliance on imported fuel (Anon,
2013). It is likely that biodiesel from plant oils will not become a primary diesel fuel in South
Africa. Rather, it is likely to become an additive that improves the lubricity of synthetic
diesel coming from the Sasol processes.
While biofuels may not be commercially viable at the moment, research and
development must be done on agriculture and biotechnology to ensure future competitiveness
and food security to prevent a situation where South Africa will have to import and pay for
biotechnology, according to Dr Dirk Swanevelder from the Agricultural Research Council
(ARC) (Burger, 2014). Although, soybean was chosen as feed stock for biodiesel due to its
higher value oil cake and lower nitrogen requirement, they are not as drought tolerant and
produce less oil than sunflower seeds. Sunflowers can be planted later in the season and are
Chapter 1 Page 4
hardier in dryland conditions. That is why farmers plant sunflowers when conditions for other
crops like maize are not ideal (Burger, 2014). Due to these facts, studying the oxidation
stability of sunflower biodiesel is worthwhile.
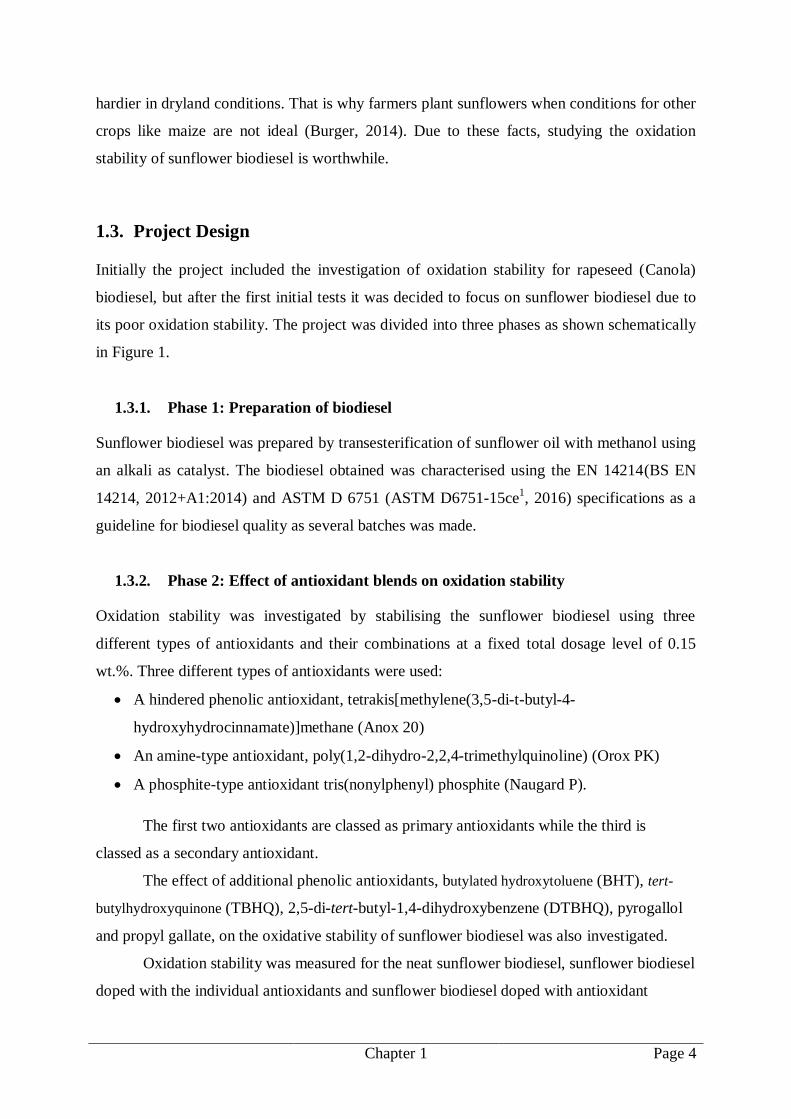
1.3. Project Design
Initially the project included the investigation of oxidation stability for rapeseed (Canola)
biodiesel, but after the first initial tests it was decided to focus on sunflower biodiesel due to
its poor oxidation stability. The project was divided into three phases as shown schematically
in Figure 1.
1.3.1. Phase 1: Preparation of biodiesel
Sunflower biodiesel was prepared by transesterification of sunflower oil with methanol using
an alkali as catalyst. The biodiesel obtained was characterised using the EN 14214(BS EN
14214, 2012+A1:2014) and ASTM D 6751 (ASTM D6751-15ce1, 2016) specifications as a
guideline for biodiesel quality as several batches was made.
1.3.2. Phase 2: Effect of antioxidant blends on oxidation stability
Oxidation stability was investigated by stabilising the sunflower biodiesel using three
different types of antioxidants and their combinations at a fixed total dosage level of 0.15
wt.%. Three different types of antioxidants were used:
A hindered phenolic antioxidant, tetrakis[methylene(3,5-di-t-butyl-4-
hydroxyhydrocinnamate)]methane (Anox 20)
An amine-type antioxidant, poly(1,2-dihydro-2,2,4-trimethylquinoline) (Orox PK)
A phosphite-type antioxidant tris(nonylphenyl) phosphite (Naugard P).
The first two antioxidants are classed as primary antioxidants while the third is
classed as a secondary antioxidant.
The effect of additional phenolic antioxidants, butylated hydroxytoluene (BHT), tert-
butylhydroxyquinone (TBHQ), 2,5-di-tert-butyl-1,4-dihydroxybenzene (DTBHQ), pyrogallol
and propyl gallate, on the oxidative stability of sunflower biodiesel was also investigated.
Oxidation stability was measured for the neat sunflower biodiesel, sunflower biodiesel
doped with the individual antioxidants and sunflower biodiesel doped with antioxidant
Chapter 1 Page 5
combinations/blends. The oxidation stability tests were done according to the Rancimat test
procedure described in EN 14112.
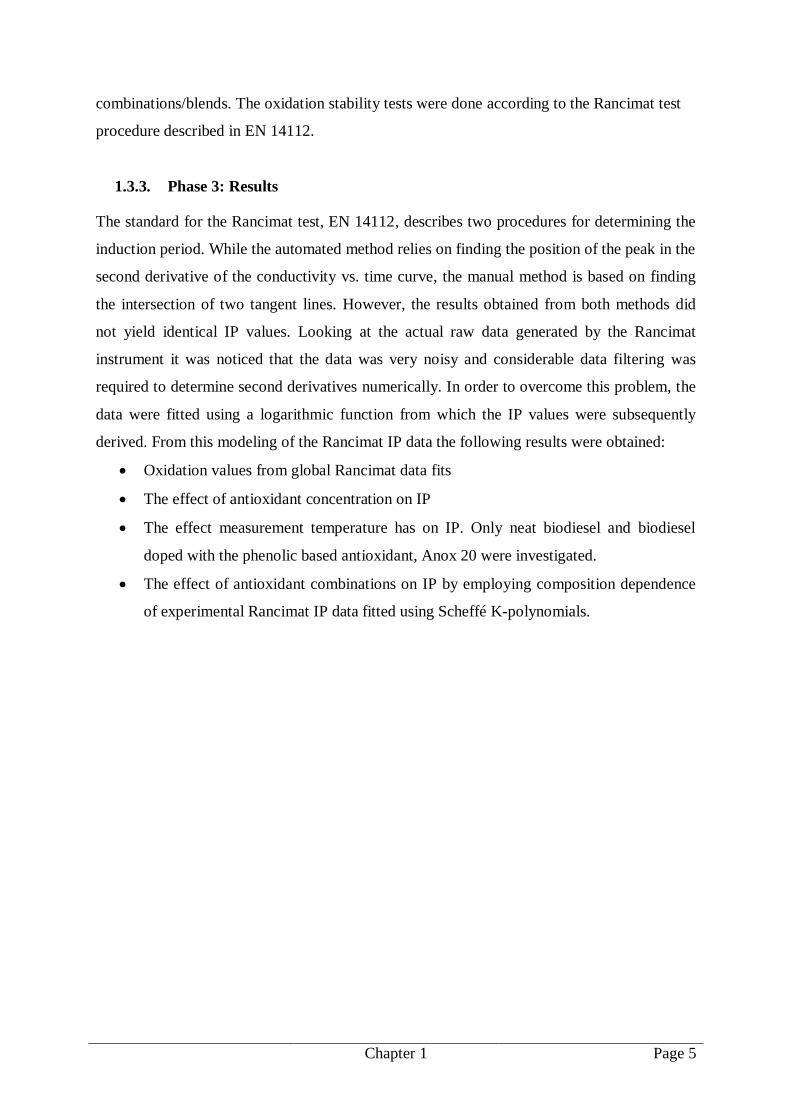
1.3.3. Phase 3: Results
The standard for the Rancimat test, EN 14112, describes two procedures for determining the
induction period. While the automated method relies on finding the position of the peak in the
second derivative of the conductivity vs. time curve, the manual method is based on finding
the intersection of two tangent lines. However, the results obtained from both methods did
not yield identical IP values. Looking at the actual raw data generated by the Rancimat
instrument it was noticed that the data was very noisy and considerable data filtering was
required to determine second derivatives numerically. In order to overcome this problem, the
data were fitted using a logarithmic function from which the IP values were subsequently
derived. From this modeling of the Rancimat IP data the following results were obtained:
Oxidation values from global Rancimat data fits
The effect of antioxidant concentration on IP
The effect measurement temperature has on IP. Only neat biodiesel and biodiesel
doped with the phenolic based antioxidant, Anox 20 were investigated.
The effect of antioxidant combinations on IP by employing composition dependence
of experimental Rancimat IP data fitted using Scheffé K-polynomials.

Chapter 1 Page 6
Project:
Stabilising Sunflower Biodiesel with
synthetic antioxidants
Sunflower Oil
Transesterification:
Sunflower Biodiesel
FAME
Characterisation of FAME
according to EN 14214 and ASTM
D 6751 requirements
3 main antioxidants
Phenolic Antioxidant:
tetrakis[methylene(3,5-di-t-butyl-4-
hydroxyhydrocinnamate)]methane
(ANOX 20)
Amine based antioxidant:
poly(1,2-dihydro-2,2,4-trimethylquinoline)
(OROX PK)
Phosphite based antioxidant:
tris(nonylphenyl) phosphite
(NAUGARD P)
Additional phenolic antioxidants:
BHT, DTBHQ, TBHQ, Pyrogallol,
Propylgallate
Tests:
FAME analysis (Ester content)
FAME composition
Viscosity
Density
Methanol Content
Water content
Acid Value
Iodine value
Flashpoint
Total Glycerine
Free Glycerine
Oxidation stability tests using
Rancimat test EN 14112
Individual
antioxidants
Neat Sunflower
Biodiesel
Antioxidant combinations
Orox PK: Naugard P
Naugard P: Anox 20
Orox PK: Anox 20
Orox PK: Additional
antioxidants
PHASE 1:
Making biodiesel
MethanolCatalyst: KOH
PHASE 2:
Evaluate effect of antioxidant
blends on oxidation stability
Synthetic antioxidants
PHASE 3:
Results
Effect of antioxidant
concentration on IP
Effect of measurement
temperature on IP
Effect of antioxidant
combination on IP Oxidation induction
values from global
Rancimat data analysis
Data reduction:
Modelling of Rancimat IP data
Composition dependance of experimental Rancimat IP
data fitted using Sheffé K-polynomials
Figure 1.1: Schematic diagram depicting the project layout

Chapter 2 Page 7
Chapter 2: Literature
2.1. Introduction
Biodiesel, also referred to as fatty acid methyl esters (FAME), is an alternative and renewable
diesel fuel. Biodiesel is derived from renewable lipid sources like plant oils such as rapeseed,
soybean and sunflower oil as well as animal fats, for example tallow. The oils or fats are
converted to FAME in a transesterification reaction (Karavalakis et al., 2010, Graboski and
McCormick, 1998). Biodiesel is defined by ASTM International as a fuel composed of
monoalkyl esters of long chain fatty acids derived from renewable vegetable oils and animal
fats (Moser, 2009).
Biodiesel is renewable because it is made from sustainable energy sources compared
to crude oil which is limited and will eventually run out. Except for being renewable,
biodiesel is also a green fuel as it reduces engine emissions, it is free of sulfur and aromatic
compounds, it is safe to handle, it enhances lubricity and is also non-toxic and biodegradable.
It also exhibit fuel properties comparable with conventional diesel fuels (Karavalakis et al.,
2010, Meher et al., 2006)
Biodiesel is fast becoming a strategic source for alternative fuel due to the drive to
reduce greenhouse gases and to obtain a cleaner and more environmentally friendly fuel than
fossil fuels. The use of food sources for producing biodiesel has unfortunately tarnished the
green image and although biodiesel cannot entirely replace petroleum based diesel fuel, there
are reasons, according to Van Gerpen (Van Gerpen, 2005), that justify the development of
biodiesel. For instance, biodiesel provides a market for excess produced vegetable oil and
animal fats. While it decreases dependence on imported fuel it does not eliminate it entirely.
Because biodiesel is renewable it does not contribute to global warming. A life cycle analysis
of biodiesel showed an overall reduction of 78% in CO2 emissions compared with petroleum
based diesel fuel. Exhaust emissions of carbon monoxide, unburned hydrocarbons and
particulate emissions are lower than with regular fuel but unfortunately emission tests have
shown a slight increase in nitrogen oxide (NOx). Diesel fuel with poor lubricating properties
can be converted into acceptable fuel by adding biodiesel to it.
Biodiesel has many advantages but there are also disadvantages. Some of the major
drawbacks for biodiesel quality and commercialization include high feed stock cost, cold
flow properties, higher NOx exhaust emissions, storage stability, and inferior oxidation
stability (Knothe, 2001, Karavalakis et al., 2011, Moser, 2009).

Chapter 2 Page 8
The ability to produce renewable feed stocks, keeping the cost of biodiesel
competitive with that of petroleum diesel, not using land necessary for food production and
not destroying natural ecosystems in the process will ensure the future of biodiesel in the
world according to Ibeto et al. (2011).
Plant oil, mainly rapeseed and soy are the most commonly used raw materials for the
production of biodiesel. To promote the use of biofuels of which biodiesel is most popular,
technologies and regulations were developed for the production of biodiesel from vegetable
oils, waste oils (cooking oils) and even waste animal fats. This resulted in the development of
testing standards and specifications for biodiesel. The specification consists of a number of
test methods to which the biodiesel must conform in order to be commercially distributed and
sold. The testing specifications all include oxidation stability as an important requirement.
2.2. History of Biodiesel
Biofuels or biodiesel are not new. The term biodiesel was originally used to describe
unmodified vegetable oils that could be used as a substitute for diesel fuel (Salvi and Panwar,
2012). The historical development in the biofuel industry and particularly in biodiesel is
unlike other industries and is driven more by economics and politics than by technology (Sani
et al., 2012). According to Knothe (2005b), the history of biodiesel is often unclear or
presented inconsistently in the literature. The use of vegetable oils and their derivatives as
diesel fuels were researched well before the energy crises of the 1970s and 1980s, which led
to renewed interest in alternative fuels. Rudolf Diesel, the inventor of the diesel engine, is
inadvertently linked to the history of biodiesel. Rudolf Diesel’s prime model, which was a
single iron cylinder with a flywheel at its base and using peanut oil, ran on its own power for
the first time in Augsburg, Germany on 10 August 1893 (Sastry and Murthy, 2012). In
remembrance of this event, 10 August has been declared ―International Biodiesel Day‖. At
the World Fair in Paris in 1900, Diesel demonstrated running a diesel engine on straight
peanut oil (Knothe, 2005b). The engine was built by the Otto Company and was actually
designed to run on mineral oil. The French government requested Diesel to use peanut oil
because peanuts were a major crop and they were interested in using it as a domestic fuel
within their African colonies. Diesel himself seemed to be supportive of using vegetable oil
as fuel and conducted related tests. However, already in 1853, before the diesel engine was
invented, the scientists Dufy and Patrick conducted the transesterification of a vegetable oil
but at the time found no application for their product. The use of vegetable oil based fuels
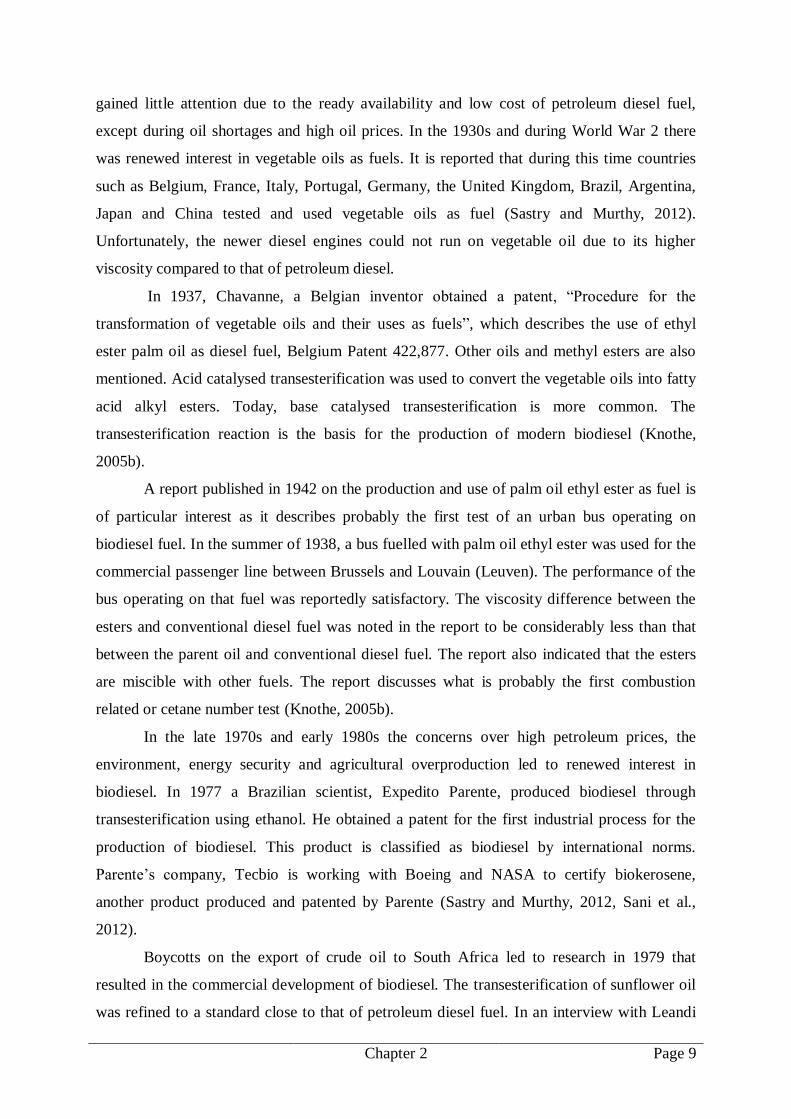
Chapter 2 Page 9
gained little attention due to the ready availability and low cost of petroleum diesel fuel,
except during oil shortages and high oil prices. In the 1930s and during World War 2 there
was renewed interest in vegetable oils as fuels. It is reported that during this time countries
such as Belgium, France, Italy, Portugal, Germany, the United Kingdom, Brazil, Argentina,
Japan and China tested and used vegetable oils as fuel (Sastry and Murthy, 2012).
Unfortunately, the newer diesel engines could not run on vegetable oil due to its higher
viscosity compared to that of petroleum diesel.
In 1937, Chavanne, a Belgian inventor obtained a patent, ―Procedure for the
transformation of vegetable oils and their uses as fuels‖, which describes the use of ethyl
ester palm oil as diesel fuel, Belgium Patent 422,877. Other oils and methyl esters are also
mentioned. Acid catalysed transesterification was used to convert the vegetable oils into fatty
acid alkyl esters. Today, base catalysed transesterification is more common. The
transesterification reaction is the basis for the production of modern biodiesel (Knothe,
2005b).
A report published in 1942 on the production and use of palm oil ethyl ester as fuel is
of particular interest as it describes probably the first test of an urban bus operating on
biodiesel fuel. In the summer of 1938, a bus fuelled with palm oil ethyl ester was used for the
commercial passenger line between Brussels and Louvain (Leuven). The performance of the
bus operating on that fuel was reportedly satisfactory. The viscosity difference between the
esters and conventional diesel fuel was noted in the report to be considerably less than that
between the parent oil and conventional diesel fuel. The report also indicated that the esters
are miscible with other fuels. The report discusses what is probably the first combustion
related or cetane number test (Knothe, 2005b).
In the late 1970s and early 1980s the concerns over high petroleum prices, the
environment, energy security and agricultural overproduction led to renewed interest in
biodiesel. In 1977 a Brazilian scientist, Expedito Parente, produced biodiesel through
transesterification using ethanol. He obtained a patent for the first industrial process for the
production of biodiesel. This product is classified as biodiesel by international norms.
Parente’s company, Tecbio is working with Boeing and NASA to certify biokerosene,
another product produced and patented by Parente (Sastry and Murthy, 2012, Sani et al.,
2012).
Boycotts on the export of crude oil to South Africa led to research in 1979 that
resulted in the commercial development of biodiesel. The transesterification of sunflower oil
was refined to a standard close to that of petroleum diesel fuel. In an interview with Leandi

Chapter 2 Page 10
Kolver (Kolver, 2008), Frans Hugo, who was the leader of the original research team of the
division of Agricultural engineering that developed the sunflower to fuel technology in South
Africa, recalls that the fuel crises in 1979 was a big problem for South African farmers. They
were unable to buy the fuel required for planting which left South Africa vulnerable, not only
to a food crisis, but also on the transport front. At the time they knew that tractors were able
to run with sunflower oil as fuel. However, sunflower oil was thicker than diesel fuel and
coked up the injectors with a sticky carbon substance. Different substances like paraffin and
diesel were used to thin the sunflower oil but test done, showed it was not working and the
problem persists. According to Hugo, the breakthrough came when Dr Louwrens du Plessis
from the Counsel for Scientific and Industrial Research (CSIR) suggested a chemical process
for the sunflower oil diesel, which proved successful. By 1983 the process for the production,
quality and engine testing for biodiesel was completed and published internationally. In 1984
the crude oil boycott of South Africa had been averted and it was decided that the use of
sunflower oil for producing biodiesel was not economically viable and further development
was suspended. An Austrian company, Gaskoks, bought the technology from the South
African Agricultural engineers. In 1987 they erected a biodiesel pilot plant and in 1989 the
first industrial scale plant (Knothe, 2005b, Sastry and Murthy, 2012, Ibeto et al., 2011).
However at around the same time in Austria, researchers from BLT, and the
University of Graz were independently working on the idea of chemical modification of
vegetable oil fuel. The chemists at the University of Graz contacted the Austrian Ministry of
Agriculture to determine whether they would be interested in such a project. The ministry
informed them that BLT in Wieselburg was already working on such a project. Professors
Martin Mittelbach, an organic chemist and his boss Hans Junck travelled to Wieselburg to
meet the researchers at BLT. This meeting was the beginning of a long cooperation between
Wieselburg and Graz. After Mittelbach secured some funding the first biodiesel pilot plant
was commissioned in 1985 at Silberberg Agricultural Collage in Styria, Austria. The plant
was capable of producing 500 tons of biodiesel from rapeseed. Due to the joint efforts of the
biodiesel researchers from Wieselburg and Graz the Austrian Standardization Institute
established a working group that succeeded in creating the first biodiesel standard in the
world (ON C 1190). This standard was to become the basis of all subsequent standards (Pahl,
2008).
The last decades have seen many more biodiesel plants opening due to environmental
impact concerns. There are currently 21 countries with commercial biodiesel projects.
Geographic, climatic and economic factors determine which vegetable oils are of interest for

Chapter 2 Page 11
potential use in biofuels. In the United States, soybean oil is a prime feed stock while in
Europe it is rapeseed (Canola) oil and in tropical countries it is palm and coconut oil. In 2005,
Minnesota became the first U.S. state to mandate at least 2% biodiesel content in all diesel
fuel sold in the state (Sastry and Murthy, 2012, Ibeto et al., 2011).
In 2016 the United States and Brazil were the leading biodiesel producers generating
5.5 and 3.8 billion litres respectively. They were followed by Germany, Indonesia and
Argentina each producing 3.0 billion litres and France with 1.5, Thailand 1.4, Spain 1.1,
Belgium 0.5, Columbia 0.5, Canada 0.4 and China 0.3 billion litres (Anon, 2018).
Global biodiesel production should increase from 37 billion litres in 2016 to 40.5
billion litres by 2026. About 30% of global biodiesel production in 2026 should be based on
waste vegetable oils according to the OECD-FAO Agricultural outlook for 2017 to 2026
(OECD/FAO, 2017). According to this outlook, production patterns will continue to be
influenced by policy rather than market forces. The European Union is expected to remain by
far the major producer of biodiesel. The use of biodiesel is projected to increase from 13.6
billion litres in 2016 to 14.5 billion litres in 2020 when the RED (renewable energy) target is
met. Biodiesel use is expected to decrease, with production declining to 13 billion litres by
2026. Biodiesel production in the United States should remain stable around 7.4 billion litres.
Argentinian biodiesel production should also increase. Other significant biodiesel producers
are Brazil, Indonesia and Thailand. Brazil, as the third largest biodiesel producer, should
contribute 36% of the global biodiesel production. Malaysia and Philippines will continue
expansion of biodiesel production. Malaysia will export around 40% of its production while
Philippines production is mainly for domestic use.
2.3. Biodiesel Specifications and Properties
The quality of biodiesel is influenced by several factors which include the quality of the feed
stock, the fatty acid composition of the parent vegetable oil or animal fat, the production
process as well as other materials used in the process, post production parameters, and
handling and storage (Ferrari et al., 2011, Barabás and Todoruț, 2011, Knothe, 2005a). Most
current diesel engines are designed to be powered by petroleum based diesel fuel.
Substituting petroleum based diesel fuel with biodiesel requires that the biodiesel should have
similar properties than those of petroleum diesel fuel. To support the increasing use of alkyl
ester based biodiesel and it blends as automotive fuel the development of standards started in
the 1990s (Jääskeläinen, 2007). The current standards for regulating the quality of biodiesel

Chapter 2 Page 12
are based on a variety of factors which vary from region to region including current diesel
standards, types of diesel engines common in the region, emissions regulations, and feed
stock available.
The specification used in Europe is EN 14214 (BS EN 14214, 2012+A1:2014) and
describes a product that can be used either as a stand-alone fuel or as a blending component
(up to 7% by volume in accordance with EN 590) in diesel fuel. The European biodiesel
specification applies only to mono-alkyl esters made with methanol, thus fatty acid methyl
esters. The minimum ester content is specified at 96.5%. The standard used in the USA is
ASTM D 6751-11b (ASTM D6751-15ce1, 2016) which was developed by ASTM
International. This standard also describes a stand-alone product, Biodiesel (B100), or a
product for use in blends with any petroleum derived diesel fuel. While the specification was
written for B100 according to Jääskeläinen (2007), it was not intended for neat biodiesel used
as automotive fuel but rather for a biodiesel component that can be blended producing
biodiesel/diesel fuel blends. The ASTM specification defines biodiesel as mono-alkyl esters
of long chain fatty acids derived from vegetable oils or animal fats. The alcohol used is,
however, not specified and the mono-alkyl esters can be produced with any alcohol
(methanol, ethanol, etc.) as long as it meets the requirements outlined in the fuel
specification. The EU and USA standards have international significance as they are usually
used as the starting point for the development of biodiesel specifications in other countries. In
South Africa the biodiesel standard, SANS 1935 (2011), was adapted from the European
standard EN 14214. Table 2.1 show a comparison of the property requirements for
automotive biodiesel (FAME) according to EN 14214, ASTM 6751 and SANS 1935.

Chapter 2 Page 13
Table 2.1: Biodiesel quality requirement
Property Units Limits
EN 14214 ASTM D6751 SANS 1935
FAME content, min %(m/m) 96.5 - 96.5
Density at 15 °C kg/m3 860 -900 - 860 -900
Kinematic viscosity at 40 °C mm2/s 3.5 – 5.0 1.9 – 6.0 3.5 – 5.0
Flash point, min °C 101 130 120
Sulfur content, max mg/kg 10.0 15.0 10.0
Carbon residue, max %(m/m) - 0.05 0.3
Cetane number, min - 51 47 51
Sulfated ash content, max %(m/m) 0.02 0.02 0.02
Water content, max mg/kg 500 -
Water and sediment, max - 0.05 vol.% -
Total contamination, max mg/kg 24.0 - 24.0
Copper strip corrosion
(3 h at 50 °C) rating Class 1 No 3 Class 1
Oxidation Stability at 110 °C. min hours 8 3 6
Acid value, max mg KOH/g 0.50 0.50 0.50
Iodine value, max g iodine
/100g 120 - 140
Linolenic acid methyl ester, max %(m/m) 12.0 - 12.0
Polyunsaturated (≥ 4 double
bonds)methyl esters, max %(m/m) 1.0 - 1.0
Methanol content, max %(m/m) 0.20 0.2 or 130 °C
min flashpoint 0.20
Monoglyceride content, max %(m/m) 0.70 0.40 0.80
Diglyceride content, max %(m/m) 0.20 - 0.20
Triglyceride content, max %(m/m) 0.20 - 0.20
Free Glycerol, max %(m/m) 0.02 0.02 -
Total Glycerol, max %(m/m) 0.25 0.24 -
Group I metals (Na+K), max mg/kg 5.0 5.0 -
Group II metals (Ca+Mg), max mg/kg 5.0 5.0 -
.
Chapter 2 Page 14
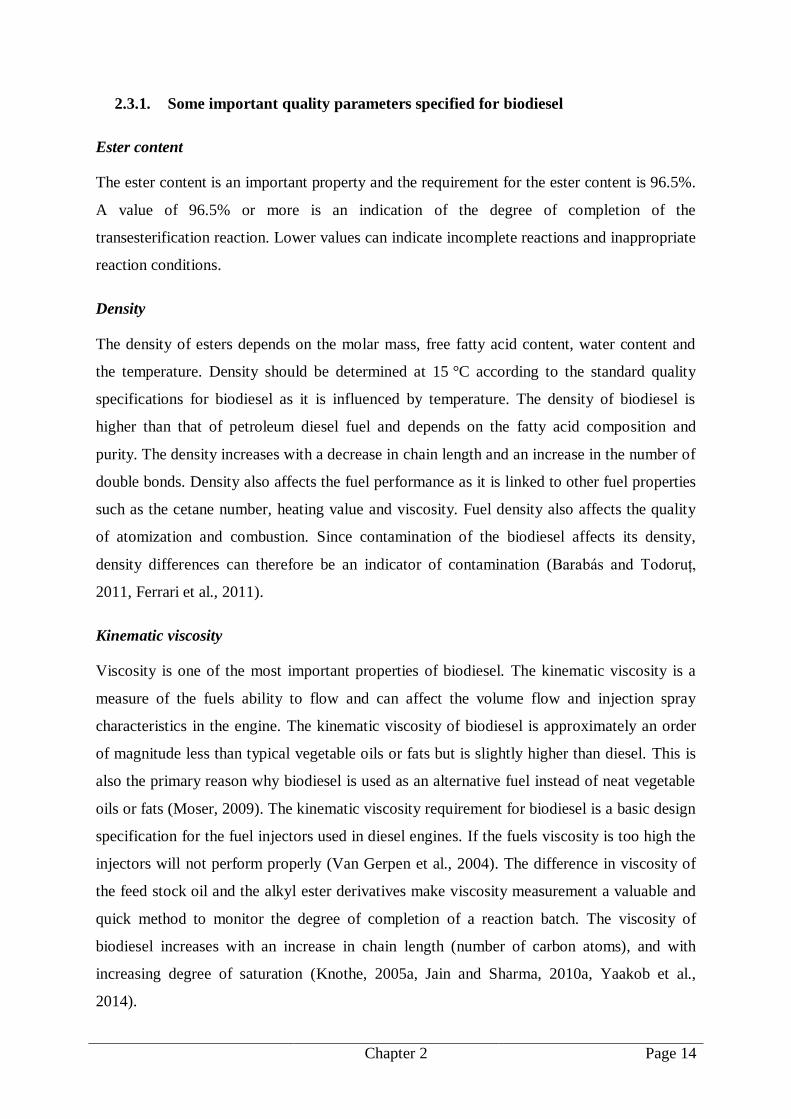
2.3.1. Some important quality parameters specified for biodiesel
Ester content
The ester content is an important property and the requirement for the ester content is 96.5%.
A value of 96.5% or more is an indication of the degree of completion of the
transesterification reaction. Lower values can indicate incomplete reactions and inappropriate
reaction conditions.
Density
The density of esters depends on the molar mass, free fatty acid content, water content and
the temperature. Density should be determined at 15 °C according to the standard quality
specifications for biodiesel as it is influenced by temperature. The density of biodiesel is
higher than that of petroleum diesel fuel and depends on the fatty acid composition and
purity. The density increases with a decrease in chain length and an increase in the number of
double bonds. Density also affects the fuel performance as it is linked to other fuel properties
such as the cetane number, heating value and viscosity. Fuel density also affects the quality
of atomization and combustion. Since contamination of the biodiesel affects its density,
density differences can therefore be an indicator of contamination (Barabás and Todoruț,
2011, Ferrari et al., 2011).
Kinematic viscosity
Viscosity is one of the most important properties of biodiesel. The kinematic viscosity is a
measure of the fuels ability to flow and can affect the volume flow and injection spray
characteristics in the engine. The kinematic viscosity of biodiesel is approximately an order
of magnitude less than typical vegetable oils or fats but is slightly higher than diesel. This is
also the primary reason why biodiesel is used as an alternative fuel instead of neat vegetable
oils or fats (Moser, 2009). The kinematic viscosity requirement for biodiesel is a basic design
specification for the fuel injectors used in diesel engines. If the fuels viscosity is too high the
injectors will not perform properly (Van Gerpen et al., 2004). The difference in viscosity of
the feed stock oil and the alkyl ester derivatives make viscosity measurement a valuable and
quick method to monitor the degree of completion of a reaction batch. The viscosity of
biodiesel increases with an increase in chain length (number of carbon atoms), and with
increasing degree of saturation (Knothe, 2005a, Jain and Sharma, 2010a, Yaakob et al.,
2014).

Chapter 2 Page 15
Flash point
The flash point is a measure of the temperature required to ignite a fuel and is done to
determine the safe handling and storage of a fuel. The typical flash point of pure methyl
esters is > 200 °C and is thus classified as non-flammable. Biodiesel with a low flash point
may still have volatiles like methanol present that were not completely removed during the
process. Thus the flash point can also be used as an indicator for the presence of residual
methanol in the biodiesel. Methanol in the fuel may affect engine seals and corrode metal
components (Van Gerpen et al., 2004).
Water content
The American standard (ASTM) treats water content and sediment as a single parameter
while the European standard treat water as a separate parameter with sediment treated under
total contamination. The South African standard was adapted from the European standard and
thus treates water content as a separate property. Water can react with the esters resulting in
free fatty acids in the biodiesel and it can also support microbial growth in storage tanks. The
presence of water in feed stock oil will produce soaps during the transesterification and affect
the completeness of the reaction. The water that may be present in the oil feed stock is
removed during the production process. However, water can also be formed during the
process by the reaction of the potassium hydroxide catalyst with alcohol. Water is
deliberately added during the washing process to remove contaminants. The water is removed
by a drying process to ensure the final product meet the specified requirement (Ferrari et al.,
2011, Van Gerpen et al., 2004).
Acid value
The acid number is a direct measure of free fatty acids contained in the ―fresh‖ biodiesel or
of free fatty acids and acids from the degradation of aged fuel samples. The acid value is
expressed in mg KOH required to neutralise 1 g of biodiesel. The fatty acids present in the
fuel may be partly due to the type of feed stock used for fuel production or it can be
generated during the production process. The acid value will be low directly after production
using a base catalysed process since the base catalyst will strip the available free fatty acids.
The acid value may increase with time as the fuel degrades due to contact with water and air.
The presence of free fatty acids in biodiesel can lead to corrosion and it may be a symptom of
water in the fuel. This test should be performed regularly (Ferrari et al., 2011, Van Gerpen et
al., 2004).

Chapter 2 Page 16
Iodine value
Iodine value or iodine number (IV) is a measure of the number of double bonds present in the
fatty acid radicals of the biodiesel. It is thus a measure of the total unsaturation within a
mixture of fatty acids. Iodine value is expressed in gram iodine which reacts with 100 g of
biodiesel. Iodine value was introduced in the biodiesel quality standards to evaluate the
biodiesels stability to oxidation. Biodiesel with a high iodine value is easily oxidized in air.
The iodine value is important when choosing a feed stock. A high iodine value indicates more
double bonds present which results in a lower cetane number, that is, reduced engine
performance. Some promising seed oils are excluded as feed stock due to their high iodine
value (Ferrari et al., 2011, Barabás and Todoruț, 2011, Yaakob et al., 2014).
Methanol content
Methanol content is a measure of unreacted methanol remaining in the biodiesel. The
methanol will affect the flash point of the biodiesel. Methanol in the biodiesel can cause fuel
system corrosion, low lubricity, and problems with injectors due to its high volatility (Ferrari
et al., 2011).
Mono-, di- and triglyceride content
The American standard (ASTM) does not provide individual limit values for mono-, di-, and
triglycerides unlike the European and thus the South African standards which specify
individual limits for the partial acylglycerides. Mono- and diglycerides are formed as
intermediates during the transesterification reaction. The presence of mono-, di- and
triglycerides is an indication of the degree of completion and the efficiency of the
transesterification process. Mono- and diglycerides can contaminate the final product. If left
within the final product it can produce cold flow problems. The result will be a fuel
containing a glycerol trace that is a major cause of carbon deposits left behind after the
combustion process (Ferrari et al., 2011, Van Gerpen et al., 2004).
Free Glycerol
Free glycerol is the molecular glycerol present in the fuel (Van Gerpen et al., 2004). It results
from incomplete transesterification reactions. Free glycerol is no longer bonded to the ester
and in theory can be separated from the biodiesel. High free glycerol arises from insufficient
separation or washing of the ester product after completion of the transesterification reaction.
Free glycerol in the biodiesel can eventually settle in storage tanks where it can cause
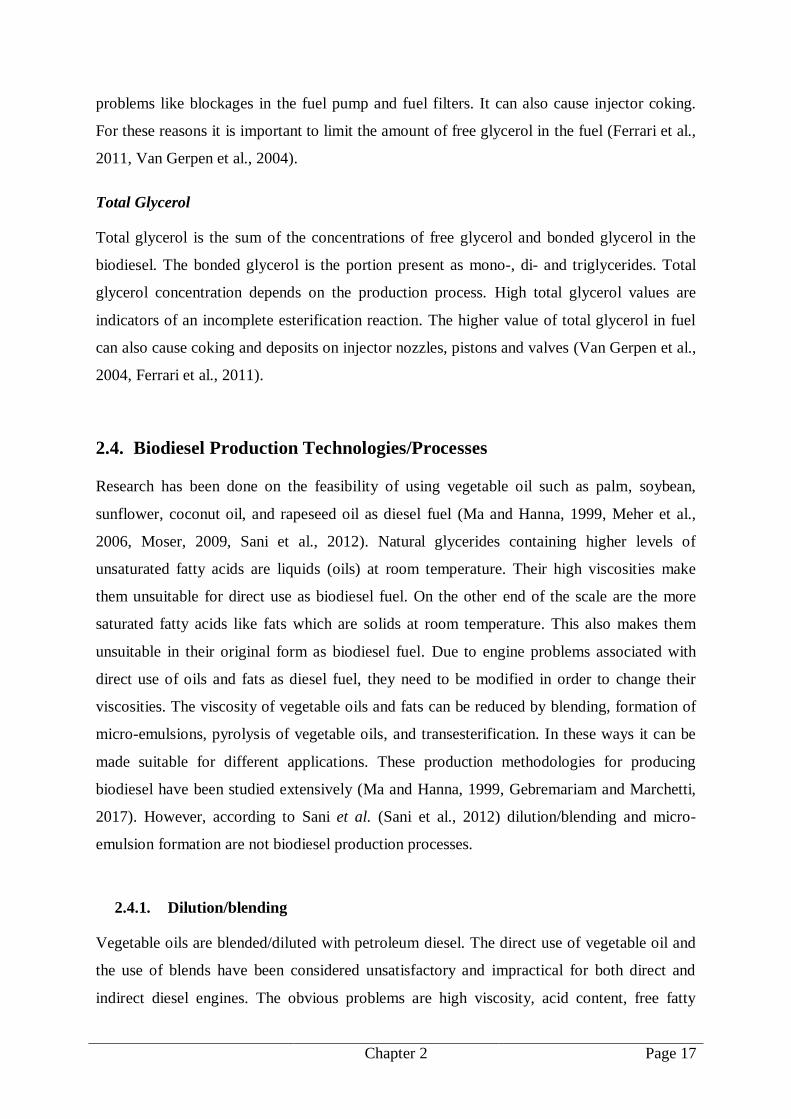
Chapter 2 Page 17
problems like blockages in the fuel pump and fuel filters. It can also cause injector coking.
For these reasons it is important to limit the amount of free glycerol in the fuel (Ferrari et al.,
2011, Van Gerpen et al., 2004).
Total Glycerol
Total glycerol is the sum of the concentrations of free glycerol and bonded glycerol in the
biodiesel. The bonded glycerol is the portion present as mono-, di- and triglycerides. Total
glycerol concentration depends on the production process. High total glycerol values are
indicators of an incomplete esterification reaction. The higher value of total glycerol in fuel
can also cause coking and deposits on injector nozzles, pistons and valves (Van Gerpen et al.,
2004, Ferrari et al., 2011).
2.4. Biodiesel Production Technologies/Processes
Research has been done on the feasibility of using vegetable oil such as palm, soybean,
sunflower, coconut oil, and rapeseed oil as diesel fuel (Ma and Hanna, 1999, Meher et al.,
2006, Moser, 2009, Sani et al., 2012). Natural glycerides containing higher levels of
unsaturated fatty acids are liquids (oils) at room temperature. Their high viscosities make
them unsuitable for direct use as biodiesel fuel. On the other end of the scale are the more
saturated fatty acids like fats which are solids at room temperature. This also makes them
unsuitable in their original form as biodiesel fuel. Due to engine problems associated with
direct use of oils and fats as diesel fuel, they need to be modified in order to change their
viscosities. The viscosity of vegetable oils and fats can be reduced by blending, formation of
micro-emulsions, pyrolysis of vegetable oils, and transesterification. In these ways it can be
made suitable for different applications. These production methodologies for producing
biodiesel have been studied extensively (Ma and Hanna, 1999, Gebremariam and Marchetti,
2017). However, according to Sani et al. (Sani et al., 2012) dilution/blending and micro-
emulsion formation are not biodiesel production processes.
2.4.1. Dilution/blending
Vegetable oils are blended/diluted with petroleum diesel. The direct use of vegetable oil and
the use of blends have been considered unsatisfactory and impractical for both direct and
indirect diesel engines. The obvious problems are high viscosity, acid content, free fatty

Chapter 2 Page 18
acids, gum formation, oxidation of the vegetable oil, and carbon deposits (Ma and Hanna,
1999). The dilution of vegetable oils can be accomplished with materials such as diesel fuel,
and a solvent, for example ethanol (Srivastava and Prasad, 2000). Short term studies with
blends gave satisfactory results but long term use in direct injection diesel engines is not
recommended. The reasons relate to severe injector nozzle coking, thickening of the lubricant
and heavy carbon deposits on intake valves.
2.4.2. Micro-emulsions
A micro-emulsion (Ma and Hanna, 1999) is defined as a colloidal equilibrium dispersion of
optically isotropic fluid microstructures with dimensions in the 1-150 nm range formed
spontaneously from two normally immiscible liquids by one more ionic or non-ionic
amphiphiles. Micro-emulsions are isotropic, clear or translucent and thermodynamically
stable dispersions of oil, water, surfactant, and often also small amphiphilic molecules called
co-surfactants (Srivastava and Prasad, 2000). Micro-emulsions can be made from vegetable
oils with an ester and a dispersant (co-solvent) or from vegetable oils with an alcohol and a
surfactant, with or without diesel fuel. A micro-emulsion of methanol with vegetable oils can
perform nearly as well as diesel fuel but because of the alcohol content, they have lower
volumetric heating values than diesel fuel. However, the high latent heat of vaporization
tends to cool the combustion chamber and reduce nozzle coking. Micro-emulsions with
solvents such as methanol, ethanol and butanol have been studied to try and solve the
problem the high viscosity of vegetable oils pose.
2.4.3. Thermal cracking (Pyrolysis)
Pyrolysis is the conversion of one substance into another using heat and a catalyst. Heating is
done in the absence of air or oxygen resulting in the cleavage of chemical bonds yielding
smaller molecules. The pyrolysed material can be vegetable oils, animal fats, natural fatty
acids and methyl esters of fatty acids. The temperature range for conversion is between 400
and 450 °C. The liquid fractions (oils) obtained from the pyrolysed vegetable oil has similar
properties to diesel fuel. Compared to pure vegetable oil, the oil obtained from pyrolysis has
a lower viscosity and a higher cetane number. The viscosity, flash and pour point and the
calorific values for the obtained oils are lower than that of diesel fuel. Although the
pyrolysate has an increased cetane number, it is nevertheless lower than that of diesel fuel.
The products of pyrolysis consist of alkanes, alkenes, alkadienes, aromatics, carboxylic acids,

Chapter 2 Page 19
and sulfur. The pyrolysed oils (soybean and safflower oils) (Srivastava and Prasad, 2000)
have acceptable levels of sulfur, water, sediment, and copper corrosion values but they have
unacceptable ash and carbon residue amounts and pour points. In general, fuel obtained from
pyrolysis is difficult to characterise (Sani et al., 2012) and the process is energy consuming
and require expensive distillation equipment. Moreover, the sulfur and ash content makes it
less eco-friendly. However, pyrolysis produces clean liquids which need no additional
washing, drying and filtering. Pyrolysis of Tung oil, soybean, safflower, rapeseed and some
other oils are well documented in the literature (Ma and Hanna, 1999, Sani et al., 2012,
Srivastava and Prasad, 2000).
2.4.4. Transesterification
Biodiesel, as defined in Europe and the USA, is made by transesterification. Of the methods
available to make biodiesel from natural oils and fats, transesterification is currently the
method of choice as it is the most viable process for the lowering of viscosity (Sharma et al.,
2008). Transesterification, also called alcoholysis, is the reaction of a fat or oil with an
alcohol in the presence of a catalyst to form an ester. Glycerol is a by-product which has
commercial value. According to Sani et al. (2012), there are several transesterification
techniques for biodiesel production. These techniques include the following catalytic and
non-catalytic processes:
Homogeneous alkali-catalysed transesterification: Alkali catalysts, for example
sodium hydroxide (NaOH) and potassium hydroxide (KOH) are readily available
and affordable and enhance the reaction rate. Problems with homogeneous
catalysis include saponification, sensitivity to free fatty acids (FFAs), expensive
separation equipment, generating waste water and high energy consumption.
Other alkali catalyst includes sodium methoxide (NaOCH3) and potassium
methoxide (KOCH3) (Sani et al., 2012, Talha and Sulaiman, 2016). Sodium
methylate, also known as sodium methoxide, (SMO), is the predominant catalyst
for large scale biodiesel production. This is mainly due to increased biodiesel
yield, lower purification cost and more consistent quality. Alkoxide catalysts are
marketed as ready to use 30 % sodium methylate solutions in methanol. They are
suitable for water free processes due to their hygroscopic properties (Sims, 2012,
Demirbas, 2008) .

Chapter 2 Page 20
Homogeneous acid-catalysed transesterification: This process is not as popular
as the base catalysed process due to the use of strong acids such as H2SO4, HCl,
BF3, H3PO4 and organic sulfonic acids. It is thus associated with higher cost and
greater environmental impacts. Although this process is not strongly affected by
FFAs in the feed stock it is it is much slower than the base catalysed process.
Heterogeneous acid and base catalysed transesterification: This technique has
the potential to reduce the high cost of biodiesel production. The solid acid can
simultaneously catalyse the esterification and transesterification without the need
for pre-treating feed stocks with high FFAs. Biodiesel can thus be produced from
readily available and low-cost feed stocks. The disadvantages of this technique
include mass transfer problems which reduces the rate of reaction due to the
formation of three phases with alcohol and oil, the loss of catalyst activity in the
presence of water and post production cost (Sani et al., 2012).
Enzymatic transesterification: With enzymatic transesterification some of the
problems associated with homogenous catalyst are avoided, for example
expensive product separation, waste water generation and the presence of side
reactions. Enzymatic catalysis enhances the quality of the product but the high
purchase cost, product contamination and residual enzymatic activity limits the
applicability of this technique. Extra-cellular lipases and intra-cellular lipases are
the two major groups of enzymatic catalysts (Sani et al., 2012). Enzymes have the
advantage that they can be used as catalyst for both transesterification and
esterification reactions (Marchetti et al., 2007).
Supercritical alcohol transesterification: Supercritical alcohol transesterification
is a non-catalytic process. Supercritical transesterification is done in a single
homogenous phase, unlike conventional transesterification of two heterogeneous
liquid phases, involving polar molecules (alcohol) and non-polar molecules
(triglycerides). Instead of using a catalyst, high pressure and temperature are used
to carry out the transesterification reaction. Under supercritical conditions, i.e.
above the critical temperature and pressure of the substance, the alcohol serves a
dual purpose of acid catalyst and reactant. The absence of an interphase solves the
mass transfer limitations and the reaction takes minutes to complete rather than
hours. The parameters that have the highest impact on supercritical
transesterification yields are temperature followed by reaction time and pressure
Chapter 2 Page 21
(Gebremariam and Marchetti, 2017, Silva and Oliveira, 2014). At a methanol to
oil ratio of 42:1 and a pressure of 28.0 MPa, the rate constant for supercritical
transesterification is dramatically enhanced by increasing the temperature from
210 °C to 280 °C. The reaction pressure also has a significant effect on the
efficiency of the reaction below 20 MPa. The effect tends to be negligible above
25 MPa. Optimal conditions for high conversion yield of 96% alkyl ester content
were reaction temperatures of 300 °C to 350 °C and a pressure of 20 to 35 MPa
with a alcohol to oil molar ratio of 40:1 to 42:1 and reaction time of 30 min. The
advantages of supercritical transesterification over the conventional homogeneous
catalytic method are feedstock flexibility, higher production efficiency, faster
reaction times, good product yields, greater environmentally friendliness, no
catalyst being required, reduction of waste from pre- and postproduction and
requiring fewer processing steps. However the disadvantages are that high
conversion requires high temperatures (330 – 350 °C) and pressures (19 to 35
MPa); high alcohol to oil molar ratio result in large excess alcohol and large
energy consumption, and high capital cost for equipment. The high amount of
alcohol in the biodiesel product also retards the biodiesel/glycerol phase
separation (Ngamprasertsith and Sawangkeaw, 2011).
For this project biodiesel was prepared from sunflower oil using transesterification.
The process mechanisms are described in more detail in Sections 2.8 and 2.9.
2.5. Biodiesel Feed Stock
For the production of biodiesel a variety of oils can be used. According to Leung et al. (2010)
the cost of raw materials for biodiesel production accounts for about 60 to 80% of the total
cost. Choosing the right feed stock is thus very important as the yield and properties of
biodiesel produced from different feed stocks would be quite different from each other.
The selection criteria of vegetable oils are availability, cost, product shelf life, and oil
quality and composition (Salvi and Panwar, 2012). There are more than 350 oil bearing plants
identified as potential sources for producing biodiesel. Only palm, jatropha, rapeseed,
soybean, sunflower, cottonseed, safflower and peanut oils are considered viable feed stocks
(Sani et al., 2012, Demirbas, 2009). Various oils have been used in different countries as feed
stock due to availability. The typical feed stock materials are virgin vegetable oils, used or

Chapter 2 Page 22
waste vegetable oils (WVO), animal fats which include lard, yellow grease, and the by-
products of the production of omega-3 fatty acids from fish oils and algae. The latter can be
grown from waste materials without displacing land currently used for food production
(Sastry and Murthy, 2012). According to Moser (Moser, 2009) alternative feed stocks arise
out of necessity from regions of the world where the above mentioned oils are not locally
available. The different feed stocks used in the production of biodiesel can be divided into the
following groups:
Edible feed stocks, for example rapeseed, soybean, sunflower, peanut oil, palm oil
and coconut oil,
Non-edible feed stocks, for example jatropha, jojoba, cotton, castor, and tung oil,
Algae oil, for example marine green algae are considered the most suitable for
biodiesel production, and
Other feed stocks including used vegetable oils, yellow grease, brown grease and
soapstock.
Most nonedible oils contain high levels of free fatty acids and may require more
chemical steps or alternate approaches to produce biodiesel. This can increase production
cost and lower the ester yield below the standard requirement. Animal fats on the other hand
contain higher levels of saturated fatty acids which are solids at room temperature, which can
also cause problems in the production process and can be more costly than using vegetable
oils.(Leung et al., 2010).
According to Sharma et al. (2008), soybean oil is commonly used in the USA and
rapeseed in many European countries while coconut oil and palm oil are used in Malaysia.
Rapeseed oil is the feed stock oil most commonly used in the European Union for biodiesel
production (Romano and Sorichetti, 2010). In the USA and Argentina it is soybean oil and in
Asia and Central American countries its palm and sunflower oil. Other oils used are peanut,
linseed, safflower and used vegetable oils. Due to food securities and high feed stock prices
the use of non-edible oils like jatropha, jojoba, and Tung as well as microalgae have been
studied (Romano and Sorichetti, 2010).
Rapeseed and canola are considered to be synonymous. In Canada, canola (Canadian
oil low acid), is a genetically modified rapeseed with reduced erucic acid and glucosinolates
content. Canola oil, due to its high quality, together with olive oil are considered to be the
best cooking oils as they reduce blood cholesterol levels (Romano and Sorichetti, 2010).
Chapter 2 Page 23
In the production of biodiesel as much as 70 to 90% of the production cost is attributed
to the cost of raw materials. To reduce cost most industrial biodiesel plants utilise waste
cooking oil or fat. The European Union focuses on biodiesel from waste oils, soy, rapeseed
and palm oils (Araújo et al., 2017). The office for Agriculture and Food (BLE) in Germany
published a progress report for 2016 which shows that for the first time in Germany the
consumption of biodiesel from used cooking oil (UCO) exceeded that of rapeseed biodiesel
(RME) (Kotrba, 2017).
2.6. Fatty Acid Composition of Vegetable Oils
The terms fatty acid profile or fatty acid composition are used to describe the specific nature
of the fatty acids occurring in the oils and fats. Biodiesel is derived from vegetable oils of
which the major component are triglycerides, also termed triacylglycerols. Triglycerides are
fatty acid esters of glycerol with long hydrocarbon chains. It is important to note that
vegetable oils are mixtures of triglycerides from various fatty acids, thus different fatty acids
in varying proportions. Different vegetable oils will have different fatty acid compositions
and depend on the plant source (Van Gerpen et al., 2004).
The fatty acid profile of the FAME mirrors that of the source oil. Thus, if sunflower
oil high in linoleic acid is used, the resulting ester will also have a high methyl linoleate
component. This is because the fatty acid chain is not changed during the transesterification
of the fatty oils into alkyl esters. Thus the chemistry of the biodiesel degradation will be the
same as that of the fatty oils from which they are derived (Waynick, 2005).
The main fatty acids in biodiesel are saturated C16 and saturated and unsaturated
C18. For example, oleic acid (C18:1) contains a single double bond, linoleic acid (C18:2)
contains two and linolenic acid (C18:3) contains three double bonds (de Guzman et al.,
2009). In Table 2.2 the five most common fatty acids and their corresponding methyl esters
found in vegetable oils like sunflower and soybean oils are listed. Other fatty acid chains can
also be present but in small amounts.
The degree of saturation is quite important as oils with higher poly unsaturation are
more prone to oxidation. Waynick (Waynick, 2005) found that the relative oxidation rates for
methyl esters of oleic (C18:1), linoleic (C18:2) and linolenic (C18:3) correspond to increases
in the degree of unsaturation. Oxidation stability decreases as the linoleic and linolenic acid
content in fatty oils or esters increases.

Chapter 2 Page 24
Table 2.2: Fatty acids and their corresponding methyl esters
Acronym Fatty Acid
Formula Molecular weight Methyl ester
C16:0 Palmitic Acid C16H32O2 256.4
Methyl palmitate C17H34O2 270.5
C18:0 Stearic Acid C18H36O2 184.5
Methyl stearate C19H38O2 198.5
C18:1 Oleic Acid C18H34O2 282.5
Methyl oleate C19H36O2 296.5
C18:2 Linoleic Acid C18H32O2 280.5
Methyl linoleate C19H34O2 294.5
C18:3 Linolenic Acid C18H30O2 278.4
Methyl linolenate C19H32O2 292.5
Different vegetable oils have different fatty acid compositions and degrees of
saturation as depicted in Table 2.3. The websites (Fediol, Neoda) classify fatty acids as:
Saturated fats (SAFA) are highly stable to oxidation. Examples are animal fats
(meat, butter, cheese and cream) and tropical plant oils like palm and coconut oil.
Monounsaturated fats (MUFA) contain a single double bond in the fatty acid
chain and are relatively stable to oxidation. They are usually a liquid at room
temperature, but when chilled they solidify. Examples of oils with high
monounsaturated fatty acids are olive oil, rapeseed/Canola and peanut oil.
Polyunsaturated fats (PUFA) contain two or more double bonds and are the least
stable to oxidation. They are usually liquids at room temperature and also when
chilled. Among the polyunsaturated fats are two important fatty acids also called
essential fatty acids, namely linolenic acid (an omega-3 fatty acid) and linoleic (an
omega-6 fatty acid). Examples of polyunsaturated fats are soybean oil and
sunflower oils.
Consequently sunflower oil with a high polyunsaturated fatty acid composition will
thus be more prone to oxidation compared to oil high in saturated and monounsaturated fatty
acids.

Chapter 2 Page 25
Table 2.3: Typical fatty acid composition (wt.%) for some common feed stock oils and fats
used for biodiesel production
Saturated Mono-
unsaturated Polyunsaturated
Fatty acid Capric Lauric Myristic Palmitic Stearic Oleic Linoleic Linolenic
Carbon
number C:10 C12:0 C14:0 C16:0 C18:0 C18:1 C18:2 C18:3
Coconut oil 7 47 18 9 3 6 2
Lard (Pork
fat)
2 24 14 44 11
Beef tallow 3 23 20 42 3 1
Cottonseed 1 23 3 17 54
Palm oil 1 44 4 40 11
Rapeseed /
Canola
4 2 61 22 10
Soybean oil 11 4 23 54 8
Sunflower oil 6 5 29 58 1
Sources: CODEX STAN 210-1999 and (Moser, 2009) for fatty acid composition of oils and (Marchetti et al.,
2007) for the fatty acid composition of lard and tallow. Trace amounts < 1% of other constituents may also be
present. Coconut also have C:6 (1%) and C:8 (7%)
2.7. Sunflower Oil
2.7.1. Background
Sunflower is an important oilseed crop cultivated for the production of edible oil worldwide
and is widely used in foods for cooking and frying. Sunflower is also gaining attention as
feed stock for biodiesel production. Sunflower oil is the last member of the group of four
major vegetable oils, with palm, soybean and rapeseed being the other three.
Sunflower oil is made from seeds of the sunflower plant, Helianthus Annuus L, a
member of the Compositea (Asteraceae) family and the genus Helianthus. The genus
Helianthus, from the Greek helios and anthos meaning sun and flower, was named after the
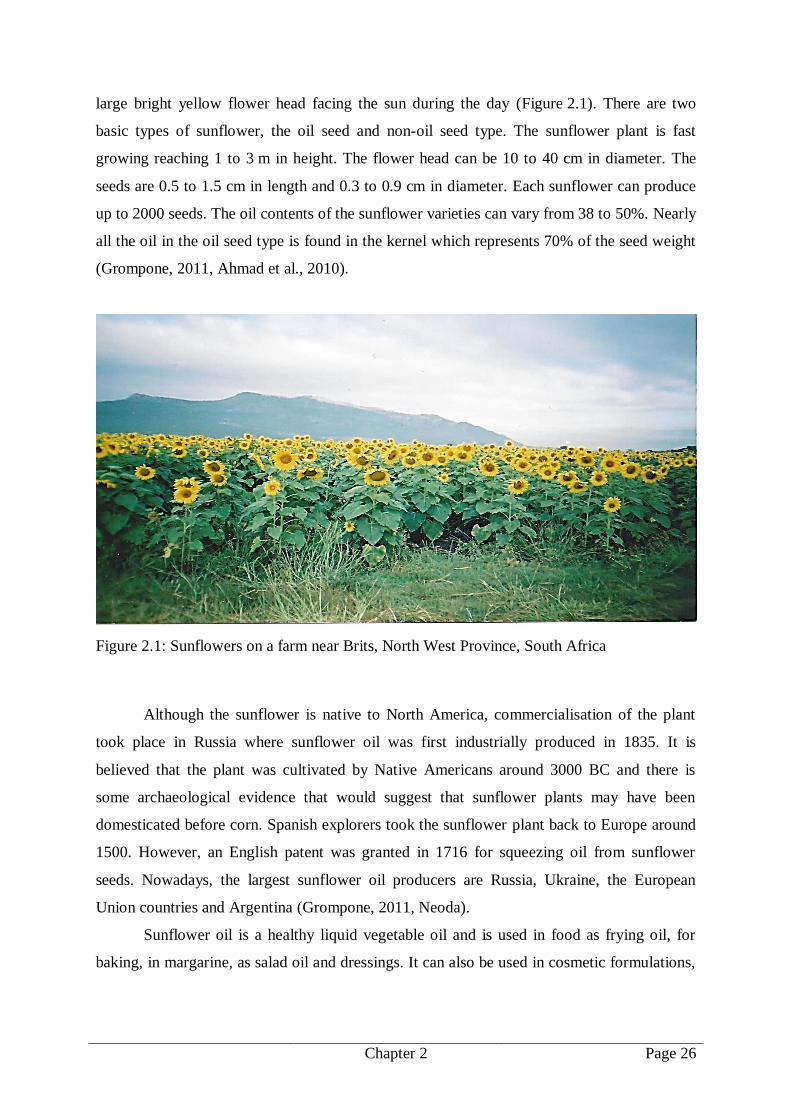
Chapter 2 Page 26
large bright yellow flower head facing the sun during the day (Figure 2.1). There are two
basic types of sunflower, the oil seed and non-oil seed type. The sunflower plant is fast
growing reaching 1 to 3 m in height. The flower head can be 10 to 40 cm in diameter. The
seeds are 0.5 to 1.5 cm in length and 0.3 to 0.9 cm in diameter. Each sunflower can produce
up to 2000 seeds. The oil contents of the sunflower varieties can vary from 38 to 50%. Nearly
all the oil in the oil seed type is found in the kernel which represents 70% of the seed weight
(Grompone, 2011, Ahmad et al., 2010).
Figure 2.1: Sunflowers on a farm near Brits, North West Province, South Africa
Although the sunflower is native to North America, commercialisation of the plant
took place in Russia where sunflower oil was first industrially produced in 1835. It is
believed that the plant was cultivated by Native Americans around 3000 BC and there is
some archaeological evidence that would suggest that sunflower plants may have been
domesticated before corn. Spanish explorers took the sunflower plant back to Europe around
1500. However, an English patent was granted in 1716 for squeezing oil from sunflower
seeds. Nowadays, the largest sunflower oil producers are Russia, Ukraine, the European
Union countries and Argentina (Grompone, 2011, Neoda).
Sunflower oil is a healthy liquid vegetable oil and is used in food as frying oil, for
baking, in margarine, as salad oil and dressings. It can also be used in cosmetic formulations,

Chapter 2 Page 27
but only the high oleic sunflower oil possesses a shelf life sufficient for commercial cosmetic
formulations.
2.7.2. Sunflower oil composition
Sunflower oil is a triglyceride, typically derived from the fatty acids linoleic acid and oleic
acid. Sunflower oil consists mainly of:
Palmitic acid (saturated): 6%
Stearic acid (saturated): 5%
Oleic acid (mono unsaturated): 30%
Linoleic acid (poly unsaturated): 59%
Produced sunflower oils can be classified as high linoleic (regular), mid oleic and
high oleic. Table 2.4 shows the fatty acid composition of regular, mid oleic and high oleic
sunflower oils. Until recently the most common type was linoleic sunflower oil also referred
as regular sunflower oil. It contains predominantly polyunsaturated fats, a linoleic content of
48 to 74% with monounsaturated fats, oleic acid (14 to 39%) and low saturated fat levels of
11% on average, and it is high in Vitamin E. Due to the high levels of polyunsaturated fats in
linoleic sunflower oil it is more susceptible to oxidation during commercial use. Mid oleic
sunflower oil has at least 69% oleic acid and high oleic acid sunflower oil at least 82% oleic
acid. High oleic sunflower oil has a fatty acid profile similar to canola oil. The above
varieties of sunflower oil differ greatly in their levels of monounsaturated and
polyunsaturated fats with only minor differences in their saturated fat content. Variation in
unsaturated fatty acids profile is strongly influenced by both genetics and climate. Sunflower
oil also contains lecithin, tocopherols, carotenoids and waxes. It is light in taste and
appearance and has high vitamin E content.

Chapter 2 Page 28
Table 2.4: Fatty acid composition of regular, mid and high oleic sunflower oil
Fatty acid Fatty acids (wt.%)
Regular Mid Oleic High Oleic
Palmitic C16:0 5.0 – 7.6 4.0 – 5.5 2.6 – 5.0
Stearic C18:0 2.7 – 6.5 2.1 – 5.0 2.9 – 6.2
Oleic C18:1 14.0 – 39.4 43.1 – 71.8 75.0 – 90.7
Linoleic C18:2 48.3 – 74.0 18.7 – 45.3 2.1 – 17.0
Linolenic C18:3 ND – 0.3 ND - 0.5 ND – 0.3
Arachidic C20:0 0.1 – 0.5 0.2 – 0.4 0.2 – 0.5
Behenic C22:0 0.3 – 1.5 0.6 – 1.1 0.5 – 1.6
Lignoceric C24:0 ND – 0.5 0.3 - 0.4 ND – 0.5
Key: ND - Not Detectable, defined as ≤ 0.05%
Source: CODEX STAN 210-1999
2.8. Transesterification
Biodiesel is made by chemically reacting triglycerides with an alcohol (methanol) in the
presence of a catalyst, either an acid or a base to produce Fatty Acid Methyl Esters (FAME)
and glycerol. This process is called transesterification and has been the subject of numerous
research papers (Ma and Hanna, 1999, Van Gerpen et al., 2004, Meher et al., 2006, Marchetti
et al., 2007).
The fatty acid chains are depicted by R, R’ and R‖ in Scheme 1 which shows the basic
transesterification reaction with methanol. The fatty acid chains can all have different chain
lengths.
To complete a transesterification reaction a 3:1 molar ratio of alcohol to triglyceride is
needed, meaning the stoichiometric reaction requires one mol of the triglyceride (TG) and
three mol of the alcohol to produce three mol methyl ester, the biodiesel product, and one mol
of glycerol, the by product. In practice the ratio needs to be higher to drive the equilibrium to
a maximum ester yield (Ma and Hanna, 1999, Van Gerpen et al., 2004).

Chapter 2 Page 29
CH2
CH
CH2
O
O
R
O
O
R'
O
O
R"
CH3OH
CH2
CH
CH2
OH
OH
OH
CH3O RC
O
+ +3 3
Trigliceride Methanol Glycerol Methyl esters
Scheme 1: Basic transesterification reaction with methanol
2.9. Transesterification Reaction Mechanisms
There are a number of kinetic studies in the literature on transesterification of esters with
alcohol. However, only a few of these studies deal with the base catalysed methanolysis of
sunflower vegetable oil (Vicente et al., 2005, Stamenković et al., 2008, Berrios et al., 2007,
Mittelbach and Trathnigg, 1990).
Transesterification of vegetable oils is an equilibrium reaction consisting of a number
of consecutive but also reversible reactions. In the reaction the triglyceride (TG) is converted
stepwise to diglyceride (DG) by reacting with a methanol molecule, the diglyceride (DG) is
converted to monoglyceride (MG) and the monoglyceride (MG) finally to glycerol as can be
seen in Scheme 2.
In a study by Freedman et al. (1986) the transesterification of soybean oil with
butanol and methanol and catalysts sodium methoxide and sulfuric acid were investigated.
They determined the reaction rate constants by varying the reaction parameters such as
alcohol to oil molar ratio, reaction temperature, catalyst type, and concentration and found
that a second order reaction model provided a satisfactory mechanism for all three reversible
reactions.
The kinetics of methanolysis of sunflower oil with KOH as catalyst was investigated
by Mittelbach and Trathnigg (1990). The content of triglycerides, the resulting methyl esters
as well as diglycerides and monoglycerides were analysed at different times and molar ratios.
At a molar ratio of 3:1 (methanol:oil) the kinetic order appeared to be second order during the
first minutes. The reaction rate then decreased rapidly due to the formation of glycerine as a
second phase, which leads to a loss of methanol and catalyst. The effect of temperature,

Chapter 2 Page 30
amount of catalyst and type of vegetable oil on formation of methyl esters was examined.
Refined and unrefined sunflower and rapeseed oils were used. They found that the best
reaction conditions corresponded to 10% excess methanol, 1.5% KOH catalyst and a
temperature of 25 °C. The conversion rate for unrefined oils was lower due to removal of
catalysts by the free fatty acids. The refined sunflower oil showed higher conversion rates
compared to rapeseed oil. It was assumed that the difference in conversion rates might be
caused by the differences in the fatty acid compositions of the two oils.
In a study done by Noureddini and Zhu (1997) the effect of mixing on the kinetics of
the alkali catalysed transesterification of soybean oil with methanol was investigated. A
methanol to oil molar ratio of 6:1 was used while the catalyst concentration (0.2 wt.%) was
kept constant. The catalyst used was sodium hydroxide (NaOH). Only the temperature and
mixing intensity were varied. The results at three mixing intensities and five different
temperatures indicated a slow reaction rate or delay at the beginning followed by a sudden
surge and finally a lower rate as the reaction approaches completion. This is a typical
behaviour for autocatalytic reactions or reactions with changing mechanisms. However, the
transesterification of TG is not known to be autocatalytic. A second hypothesis based on a
stepwise and reversible reaction mechanism was clearly demonstrated by the experimental
results as an initial mass transfer controlled region (slow) followed by a kinetically controlled
region (fast) and a final slow region as equilibrium is approached. The mass transfer region is
shortened with an increase in temperature and higher mixing intensity.
Vicente et al. (2005) also observed three regions of different reaction rates during the
investigation of the methanolysis of sunflower oil using potassium hydroxide (KOH) as
catalyst with a methanol to oil ratio of 6:1. This study focused on the influence of impeller
speed (mixing), temperature and catalyst concentration on the reaction rates. Initially the
reaction system consists of two separate layers as sunflower oil and methanol are not
miscible. In this region mass transfer controls the kinetics, but as soon as methyl esters are
formed they act as co-solvents because methyl esters are soluble in methanol and the
vegetable oil. As one layer is formed the chemical reaction controls the kinetics. This
behaviour is typical for a reaction with changing mechanisms. They concluded that the
kinetics of sunflower oil methanolysis is based on a reaction mechanism involving an initial
mass transfer control region followed by a kinetically controlled region. The results from the
experiments showed that the kinetically controlled region follows a second order mechanism

Chapter 2 Page 31
for the forward and reverse reactions where the reaction system can be described as a pseudo
homogeneous catalysed reaction. The results also showed that an increase in temperature and
the amount of catalyst enhanced the reaction rate.
CH2
CH
CH2
O
O
R
O
O
R'
O
O
R"
CH3OH
CH2
CH
CH2
O
O
R
O
O
R'
OH
CH3O R"C
O
CH2
CH
CH2
O
O
R
O
O
R'
OH
CH3OH
CH2
CH
CH2
O
O
R
OH
OH
CH3O R'C
O
CH2
CH
CH2
O
O
R
OH
OH
CH3OH
CH2
CH
CH2
OH
OH
OH
CH3O RC
O
+ +
+ +
+ +
Triglyceride reaction
Diglyceride reaction
Monoglyceride reaction
Scheme 2: Consecutive steps for transesterification
In a kinetic study done by Hassan et al. (2013) on alkali catalysed transesterification
of sunflower oil with methanol they concluded that the overall transesterification reaction
consists of three consecutive second order reversible reaction steps. In this study the effect of
molar ratio, catalyst loading and reaction temperature on fatty acid methyl esters (FAME),
triglycerides (TG), diglycerides (DG) and monoglycerides (MG) was evaluated using the
statistical approach of the Taguchi method. They found that FAME increases with
simultaneous decrease in TG, DG and MG when the catalyst loading, temperature and molar

Chapter 2 Page 32
ratio were increased. The catalyst loading was found to be a significant rate controlling
parameter for FAME, TG and DG but not as significant for MG. The effect of the increase in
temperature was found to be more significant for MG than for the reduction of TG and DG in
the reaction mixture. The order of the parametric effects based on relative contribution was
observed as catalyst loading > molar ratio > temperature for TG and DG, but for MG the
sequence was molar ratio > temperature > catalyst loading. They concluded that a higher
level of catalyst loading and molar ratio is thus required for maximisation of FAME and
minimisation of TG and DG, but a higher temperature is needed to minimise MG.
2.9.1. Parameters influencing transesterification
The effect of various process parameters on the transesterification reaction has been reported
in the literature. The effect of each parameter is also influenced by the other parameters.
These include:
Molar ratio
The molar ratio of alcohol to triglyceride is one of the most important variables affecting the
ester yield. The stoichiometric ratio for transesterification requires three moles of alcohol and
one mole of glyceride to yield three moles of fatty acid methyl ester and one mole of glycerol
(Van Gerpen et al., 2004). Alcohol is used in excess to shift the reaction equilibrium to the
product side because the reaction is reversible. Freedman et al. (1984) studied the effect of
molar ratio on the ester yield of vegetable oils (soybean, sunflower, peanut and cotton seed
oils) using as alcohol, methanol, ethanol, and butanol and as catalysts, sodium methoxide,
sodium hydroxide, and sulfuric acid. The molar ratio was varied from 1:1 to 6:1 obtaining a
98% ester conversion at a 6:1 molar ratio. When the molar ratio was decreased to the
theoretical ratio of 3:1 the ester conversion also decreased to 82%. These results suggest that
to obtain maximum ester conversion a 6:1 ratio should be used. Ratios greater than 6:1 can
complicate ester and glycerol recovery.
The molar ratio is influenced by the type of catalyst used. In the transesterification of
soybean oil with butanol and an acid catalyst (Freedman et al., 1986) the reaction required a
30:1 ratio of butanol to soybean oil while for the alkali based catalyst reaction a 6:1 ratio was
required to achieve the same ester yield for a given reaction time.

Chapter 2 Page 33
Catalyst type and concentration
A catalyst is used to improve the reaction rate and yield. Catalysts used in the
transesterification reaction are either acid or alkali based. Acids used as catalyst include
sulfuric acid, phosphoric acid, and hydrochloric acid. Alkalis include sodium hydroxide,
sodium methoxide, potassium hydroxide, potassium methoxide, sodium amide, sodium
hydride, potassium amide and potassium hydride (Ma and Hanna, 1999). Alkali-catalysed
transesterification is much faster than acid-catalysed transesterification (Freedman et al.,
1984). Even at ambient temperatures the alkali-catalysed reaction proceeds rapidly while
acid-catalysed reactions require higher temperatures. However, if the glyceride has a high
free fatty acid content and high water content, acid-catalysed transesterification is more
suitable.
In a study by Vicente et al. (1998) the reaction of sunflower oil and methanol was
conducted using different types of catalyst (acid, base, homogeneous and heterogeneous).
Sodium hydroxide was found to be the best compared to the other catalyst used. The reaction
using NaOH was very fast as conversion larger than 80% were reached within the first 5 min.
They found that the catalyst concentration has a larger effect than temperature. Although both
catalyst concentration and temperature were found to have a positive influence, high catalyst
concentrations (>1.5%), and high temperatures (>60 ℃) led to the production of large
amounts of soaps.
The reaction rate increased with catalyst concentration for the transesterification of
sunflower oil with methanol (Vicente et al., 2005). The effect of catalyst concentration on the
reaction rate was very significant for the second forward reaction and also for the second
reverse reaction.
In the kinetics study of sunflower and rapeseed oil methanolysis using KOH as
catalyst it was observed that the increase in catalyst concentration increased the rate of
biodiesel production (Roosta et al., 2016, Roosta and Vatan, 2016). However, a catalyst
concentration above 1.5wt.% had little or no significant effect on the rate of biodiesel
production. The catalyst concentration is also more effective at low temperatures.
Reaction time
Several studies in the literature followed the formation of fatty esters with time. The
conversion rate increases with reaction time. Freedman et al. (1984) studied the
transesterification of peanut, cotton seed, sunflower and soybean oils using methanol at a 6:1

Chapter 2 Page 34
and 3:1 ratio. They observed an 80% ester conversion after 1 min for soybean and sunflower
oils, which confirms the quickness of alkali-catalysed methanolysis. However, the ester
conversion after 1 min for peanut and cottonseed oil was distinctly lower. After 1 h the
conversion were almost the same for all four oils ranging from 93 to 98%. Thus, with
sufficient time ester conversion for all four oils showed similar results.
Ma et al. (1998) studied the transesterification of beef tallow with methanol. The
reaction rate was very slow at first due to the mixing and dispersion of methanol in the beef
tallow since the initial reaction only happened on the interface of the methanol and beef
tallow. With mixing, the two immiscible phases became a stable emulsion and the reaction
proceeded very fast for 1 to 5 min but slowed down and reached the maximum yield after 15
min.
Reaction temperature
Transesterification can occur at different temperatures and depending on the oil used, clearly
influences the reaction yield. A higher reaction temperature can decrease the viscosities of the
oils and thus better mixing and dispersion occurs resulting in an increased reaction rate and
shorter reaction time (Leung et al., 2010). The transesterification reaction of refined soybean
oil with methanol, using a 6:1 molar ratio and 1% NaOH catalyst at temperatures of 60, 45
and 32 °C yielded ester conversion of 94, 87, and 64% respectively after only 6 min
(Freedman et al., 1984). However, after 1 h ester formation was identical for 60 and 45 °C
and only slightly lower for 32 °C. The results show that temperature clearly influences the
reaction rate and yield of the esters. However after 4 h the ester conversion at 32 °C slightly
exceeded that of the other temperatures.
Noureddini and Zhu (1997) investigated the transesterification of soybean oil with
methanol using a methanol to oil molar ratio of 6:1 and a NaOH catalyst concentration of 0.2
wt.%. Results were obtained at three mixing intensities and five different temperatures. From
the results it was observed that the mass transfer region is shortened as temperature is
increased which may be due to the higher energy state of the molecules resulting in more
effective collisions and the higher solubility of the reactants at elevated temperatures.
Mixing intensity
An important factor in the transesterification process is the degree of mixing between the
alcohol and the oil (TG) phase (Noureddini and Zhu, 1997). TG and alcohol phases are not
miscible and form two liquid layers upon their initial introduction in the reaction. Increase in

Chapter 2 Page 35
the contact between the reactants and thus the mass transfer rate is obtained with mechanical
mixing. It is thus expected that variations in mixing intensity can alter the kinetics of the
transesterification reaction. Mixing, using mostly mechanical stirrers has been used in kinetic
studies, but the effect of mixing intensity on the kinetics of the transesterification reaction has
not been fully addressed. A better understanding of the mixing effect on the kinetics of the
reaction will be a valuable tool in process scale-up design.
Investigating the effect of mixing on the kinetics of the transesterification of soybean
oil with methanol (Noureddini and Zhu, 1997), the molar ratio and the catalyst concentration
were kept constant, but the temperature and mixing intensity were varied. Kinetic data were
collected at three mixing intensities and five temperatures. Reaction rate constants and
activation energies were determined for all the forward and reverse reactions. The
dependency of the reaction rate constants on mixing intensity was also investigated. An initial
delay in the reaction was experienced with decreased temperature and mixing intensity. A
two phase liquid system initially forms and as the reaction is diffusion controlled, poor
diffusion between the phases resulted in a slow rate. As methyl esters are formed they act as a
mutual solvent for the reactants and a single phase system is formed. The lag time decreased
as the mixing intensity increased. This result supports the mass transfer control theory during
the initial stage of the reaction. The results demonstrated an initial mass transfer controlled
region followed by a kinetic controlled region.
The methanolysis of sunflower oil using potassium hydroxide (KOH) as catalyst with
a methanol to oil ratio of 6:1 (Vicente et al., 2005) was done varying the temperature and
impeller speed. At an impeller speed of 300 rpm at 25 and 65 °C the triglyceride conversions
were very small, resulting in a low methyl ester production rate. As the reaction progressed
the conversions increased and then stayed constant as equilibrium was approached. At 65 °C
the delay in methyl appearance (due to the immiscibility of the methanol in oil) was short
because the solubility of the oil in methanol increased at higher temperatures. When the
impeller speed was increased from 300 to 600 rpm at temperatures of 25 and 65 °C, the delay
in methyl ester appearance became shorter, indicating that the mass transfer control became
less important. The triglyceride conversion achieved its maximum value after one minute at
600 rpm. At higher impeller speeds the mass transfer is not significant. Due to the increase in
the vegetable oil solubility in methanol at 65 °C a shorter delay in methyl ester appearance
was observed.
Mass transfer limitations between the oil and alcohol have a significant effect on the
rate of the reaction. Hydrodynamic cavitation has been widely used in wastewater treatment

Chapter 2 Page 36
(Gogate and Pandit, 2005, Chuah et al., 2016). Mixing intensification via ultrasonic and
hydrodynamic cavitation has been considered for enhancing the rate of transesterification.
These technologies enhance the reaction rate, reduce oil to alcohol molar ratio required,
reduce the necessary energy input by mass transfer intensification and make separation of the
product easier. Hydrodynamic cavitation reactors are reportedly the most efficient for
biodiesel production (Ghayal et al., 2013). Hydrodynamic cavitation is generated by passing
fluid through a constriction such as throttling valves, orifice plates or a venturi. Cavitation is
induced when the fluid pressure falls below the vapour pressure. High-intensity micro-level
turbulence is generated by the eventual collapse of the vapour-filled cavities. This
significantly increases the interfacial area and this makes the hydrodynamic reactor very
effective in eliminating the mass transfer resistance during the reaction. In a kinetic study, on
the preparation of biodiesel under hydrodynamic cavitation conditions from waste cooking
oil, high conversion of 98% was achieved with a 1:6 molar ratio of oil to methanol, 1 wt.%
KOH as catalyst, 60 °C reaction temperature and 15 minute reaction time (Chuah et al.,
2017). With hydrodynamic cavitation the yield efficiency was 833% higher and the reaction
time 600% shorter compared to mechanical stirring.
The effect of moisture and free fatty acids (FFA)
Free Fatty Acids (FFA) and moisture contents are two parameters determining the viability of
the transesterification process (Meher et al., 2006). For a complete transesterification using a
base catalyst, a FFA value lower than 3% is needed. Low cost oils and fats often contain
large amounts of free fatty acids. The FFA in these feed stocks will react with the alkali
catalyst, producing soaps. A two-step esterification process is needed involving an acid
catalysed pre-treatment followed by the second step using an alkaline catalyst to complete the
transesterification reaction. Feed stocks with characteristic high amounts of FFA are yellow
grease (12% FFA) and brown grease (33% FFA).
Acid-catalysed transesterification produces water as by-product of the reaction
(Rodriguez, 2011) and needs to be removed in order to complete the reaction. The acid
catalysed reaction also requires higher temperatures as well as higher molar ratios. It is also
important that the feed stock used in the biodiesel production should contain little or no water
content that is less than 1%. The presence of water in the feed stock will produce soaps
during the transesterification process which will affect the reaction. The soap and water forms
an emulsion that will affect the biodiesel conversion and quality.

Chapter 2 Page 37
Van Gerpen (2005) reported that the yield of methyl esters was reduced from 93 -
98% for the refined oil to 67 - 86% for the crude oil. The reason for this was mostly
contributed to the presence of up to 6.66% FFA in the crude oil.
Ma et al. (Ma et al., 1998) studied the base catalysed transesterification of beef tallow
in the presence of FFA and water. When no FFA or water was added to the reaction mixture
the beef tallow methyl ester (BTME) yield was the highest. The addition of only 0.6% FFA to
the reaction mixture resulted in the lowest BTME yield, less than 5%. When water and FFA
were present at the same time in the reaction mixture it had a synergistic negative effect on
the reaction.
2.9.2. Monitoring transesterification reaction
The determination of biodiesel fuel quality is important for successful commercialisation
(Knothe, 2001). Analysis of the biodiesel product and monitoring of the transesterification
reaction has been the subject of numerous publications. The ideal analytical method for a
product such as biodiesel should be reliable and inexpensive in quantifying contaminants
even at trace levels. No current analytical method meets the demands for biodiesel. The major
analytical procedures for biodiesel comprise of chromatographic and spectroscopic methods.
In studies regarding the kinetics of the transesterification of vegetable oils, the most
widely used analytical procedure to determine the completeness of the reaction and the
resulting fuel quality was gas chromatography (GC). The use of GC equipped with a flame
ionisation detector (FID) is reported in the literature (Vicente et al., 2005, Rashid et al., 2008,
Ma et al., 1998, De Filippis et al., 1995). GC-FID is also the analytical procedure described in
EN 14103 (BS EN 14103, 2011). However, Knothe (Knothe, 2000, Knothe, 1999) noted that
using GC does have some problems resulting from columns being heated higher than the
recommended temperature limit. Also, repeated use at high temperatures causes stronger
column bleed. Baseline drift occurred when very fast heating rates were used, thus resulting
in baseline drifts which interfered with quantification. This is a problem considering the low
contamination levels specified by the biodiesel standards.
The use of spectroscopic methods is increasing as tool for quality control purposes.
The use of Near-Infrared (NIR) and mid Fourier Transform Infrared (mid-FTIR) has been
reported in literature (Knothe, 1999, Knothe, 2000, Yuan et al., 2014, De Filippis et al.,
1995). The advantages of these methods are that it is easy to use, the measurements are quite
fast, it is non-destructive and it provides accurate and reliable results. Knothe (2000) also

Chapter 2 Page 38
reported on the use of 1H nuclear magnetic resonance spectroscopy (
1H NMR) for
quantification and monitoring the transesterification reaction. Gelbard et al. (1995) monitored
the formation of fatty acid methyl esters of rapeseed oil by transesterification with methanol
using 1H NMR. Naureen et al. (2015) also reported the use of spectroscopic methods, FT-IR
and NMR (1H and
13C) for characterisation of sunflower oil biodiesel as well as using GC-
MS to determine the chemical composition of the sunflower oil biodiesel.
De Filippis et al. (1995) developed a quick analytical method for assessing the methyl
ester content of purified transesterification products by applying a simple correlation with
viscosity. The results obtained were in agreement with the values measured by GC analysis.
Other analytical methods used for quantification and monitoring of the
transesterification reaction are HPLC ( (Hassan et al., 2013, Noureddini and Zhu, 1997) and
Thin Layer Chromatography (TLC) (Wall 2000, Fontana et al., 2009, Escobar et al., 2008).
The use of TLC-FID was reported by Freedman et al. (1984). Biodiesel transesterification
kinetics monitored by pH measurement was reported by Clark et al. (2013).
2.10. Oxidation Stability of Biodiesel
Oxidation stability is one of the most important properties for biodiesel quality. Biodiesel and
biodiesel blends are more prone to oxidation than the corresponding vegetable oils according
to Jain and Sharma (2010b). Biodiesel produced from vegetable oils and other feed stocks
were found to be more susceptible to oxidation by the oxygen in air than petroleum fuels.
This is due to the presence of double bonds in the fatty acid chains.
The fuel properties of biodiesel can degrade by the following mechanisms (Pullen and
Saeed, 2012, Jakeria et al., 2014)
1. Oxidation or auto-oxidation from contact with oxygen at ambient temperatures.
2. Thermal or thermal-oxidative decomposition due to exposure to heat.
3. Hydrolysis due to contact with water and moisture in tanks and fuel lines.
4. Microbial contamination from migration of dust particles or water droplets
containing bacteria or fungi in the fuel.
Oxidation stability refers to the fuel’s tendency to react with oxygen at temperatures close to
ambient and describes the relative susceptibility of biodiesel fuel to degradation by oxidation.
The degree of oxidative degradation biodiesel underwent prior to combustion in a diesel
engine will be affected by a multitude of factors. These include the nature of the original feed

Chapter 2 Page 39
stock, the biodiesel production method, fuel additives and impurities, storage and handling
conditions, and conditions within the fuel tank. Oxidation affects several biodiesel fuel
properties like viscosity, cetane number, acid and peroxide values. It can also lead to the
formation of polymeric residues that can block fuel filters and injectors (Pullen and Saeed,
2012).
Properties such as the acid value, peroxide value and viscosity tend to increase while
the iodine number and methyl ester content decrease. The changes that occur due to oxidation
affect the quality of biodiesel. That is why oxidation stability is of great importance in
biodiesel technology (Zuleta et al., 2012).
Storage stability refers to the general stability of fuel while it is in long term storage.
Oxidation stability is thus a more general term and differs from storage stability since
oxidation does not only occur during storage but also during production and end use (Pullen
and Saeed, 2012).
According to Knothe (2007), the understanding of oxidation is complicated as fatty
acids usually occur in complex mixtures and minor components in these mixtures may
catalyse or inhibit oxidation.
The oxidation rate of biodiesel is affected by factors such as the fatty acid
composition of the parent oil, temperature, light exposure, radiation intensity, and the
presence or absence of naturally occurring antioxidants.
It is possible to increase the oxidative stability of biodiesel by introducing additional
natural or synthetic antioxidants. However, adding naturally occurring antioxidants is
generally not as effective as adding suitable synthetic antioxidants (Knothe, 2007, Jain and
Sharma, 2010b, Pullen and Saeed, 2012, Domingos et al., 2007, Sendzikiene et al., 2005,
Shah et al., 2009). However, naturally occurring antioxidants play a major role in the
oxidative stability of the neat biodiesel as observed by Tang et al. (2008b) and Liang et al.
(2006) for crude palm oil methyl esters.
2.10.1. Influence of fatty acid composition
Fatty acid composition is an important factor that affects the properties of biodiesel.
Vegetable oils and animal fats contain a large proportion of unsaturated fatty acids, making
oxidative stability an issue of concern. The rate of oxidation of unsaturated fatty acids or
esters can vary considerably. The relative oxidation rate increases with an increase in the
degree of unsaturation. According to Karavalakis and Stournas (2010) polyunsaturated fatty
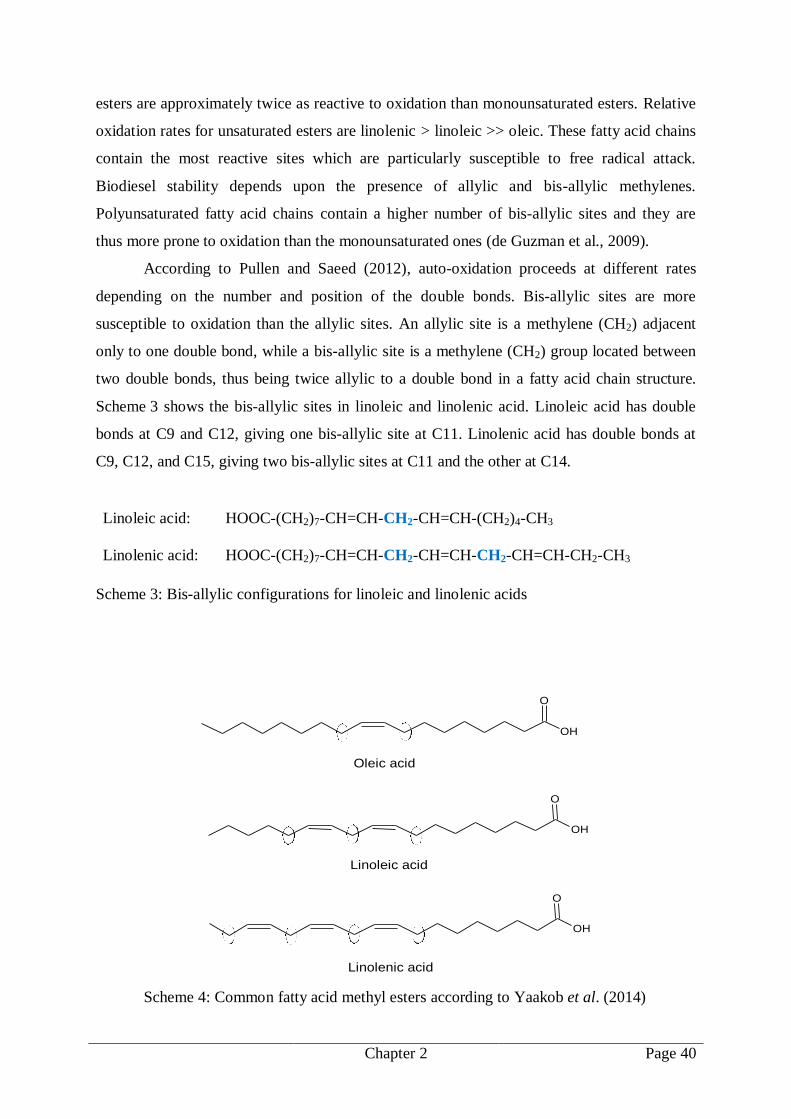
Chapter 2 Page 40
esters are approximately twice as reactive to oxidation than monounsaturated esters. Relative
oxidation rates for unsaturated esters are linolenic > linoleic >> oleic. These fatty acid chains
contain the most reactive sites which are particularly susceptible to free radical attack.
Biodiesel stability depends upon the presence of allylic and bis-allylic methylenes.
Polyunsaturated fatty acid chains contain a higher number of bis-allylic sites and they are
thus more prone to oxidation than the monounsaturated ones (de Guzman et al., 2009).
According to Pullen and Saeed (2012), auto-oxidation proceeds at different rates
depending on the number and position of the double bonds. Bis-allylic sites are more
susceptible to oxidation than the allylic sites. An allylic site is a methylene (CH2) adjacent
only to one double bond, while a bis-allylic site is a methylene (CH2) group located between
two double bonds, thus being twice allylic to a double bond in a fatty acid chain structure.
Scheme 3 shows the bis-allylic sites in linoleic and linolenic acid. Linoleic acid has double
bonds at C9 and C12, giving one bis-allylic site at C11. Linolenic acid has double bonds at
C9, C12, and C15, giving two bis-allylic sites at C11 and the other at C14.
Linoleic acid: HOOC-(CH2)7-CH=CH-CH2-CH=CH-(CH2)4-CH3
Linolenic acid: HOOC-(CH2)7-CH=CH-CH2-CH=CH-CH2-CH=CH-CH2-CH3
Scheme 3: Bis-allylic configurations for linoleic and linolenic acids
OH
O
OH
O
Oleic acid
Linoleic acid
Linolenic acid
OH
O
Scheme 4: Common fatty acid methyl esters according to Yaakob et al. (2014)

Chapter 2 Page 41
According to Karavalakis and Stournas (2010), the stability of biodiesel is mainly
related to the number and position of allylic and bis-allylic methylene functional groups that
are adjacent to the double bond and not the total number of double bonds as expressed by the
iodine value.
Cosgrove et al. (1987) studied the kinetics of autoxidation on polyunsaturated fatty
acids with increasing degrees of unsaturation in the mono-, di- and triglycerides of linoleate.
This allowed them to investigate the effect of more than one unsaturated chain contained in
the same molecule. They concluded that the oxidisability of simple polyunsaturated (PUFA)
esters is directly related to the number of double allylic positions present in the molecule.
This relationship however does not appear to apply to the mono-, di- and triglycerides of
C18:2 (linoleate) as the triglyceride does not follow the classical autoxidation kinetics.
2.10.2. Mechanism of oxidation
The mechanism of oxidation is well documented (Ingold, 1961, Knothe, 2007, Pullen and
Saeed, 2012, Cosgrove et al., 1987, Jain and Sharma, 2010b). During the initiation step free
radicals are formed that can react directly with oxygen. This results in the formation of
peroxides and hydroperoxides. An early indication that oxidation is taking place is the
existence of peroxides and is measured in terms of peroxide value. After the peroxides,
aldehydes and ketones are formed. The oxidation process of unsaturated fatty acid chains
from fatty oils and their esters in the presence of atmospheric oxygen is known as auto-
oxidation or peroxidation (Jain and Sharma, 2010b, Pullen and Saeed, 2012). The oxidation
of biodiesel is a chain reaction comprising a sequence of three basic steps:
Initiator radicals (I·) react with the fatty acid molecule (RH) abstracting a hydrogen
atom adjacent to a double bond in a fatty acid chain to produce a new carbon based fatty acid
radical (R·) (Scheme 5) (Pullen and Saeed, 2012). The initiator is a free radical that is
generally produced by the decomposition of hydroperoxides (ROOH) present as impurities,
or by metal catalysed decomposition of hydroperoxides. Oxidation can also be catalysed by
exposure to light, called photo-oxidation.
RH + I· → R· + IH
Scheme 5: Step 1 - Initiation reaction
During the propagation step the initiated fatty acid radical (R·) reacts with molecular
oxygen to form a fatty acid peroxide radical (ROO·) (Scheme 6). It is unstable and proceed to
Chapter 2 Page 42
react with the substrate RH, abstracting hydrogen to form a fatty acid hydroperoxide (ROOH)
as well as a new fatty acid radical (R·). The new fatty acid radical (R·) again reacts with
oxygen resulting in a self-sustaining chain reaction and an accumulation of fatty acid
hydroperoxide (ROOH). This is the most widely occurring oxidation reaction, where
hydroperoxides are formed as the fundamental primary product of oxidation. The
hydroperoxide forming reaction determines the rate of oxidation (Pullen and Saeed, 2012).
However, hydroperoxides are unstable and degrade to produce radicals that further accelerate
propagation reactions, also referred to as branching reactions (Reische, 2002) (Scheme 7).
R· + O2 → ROO·
ROO· + RH → ROOH + R·
Scheme 6: Step 2 – Propagation
ROOH → RO· + HO·
HO· + RH → H2O + R·
RO· + RH → ROH + R·
Scheme 7: Branching reactions
Hydroperoxide degradation also leads to odours associated with rancidity in the later
stages of oxidation.
The chain reaction terminates when two free radicals react to produce a non-radical
species (Scheme 8). This only happens readily when the concentration of radical species is
sufficient and there is a high probability for the two radicals actually colliding. At low
temperatures, peroxy radicals (ROO·) can combine with a R· radical to yield peroxy linked
molecules (ROOR) liberating oxygen (Pullen and Saeed, 2012).
R· + R· → R-R
R· + ROO· → ROOR
ROO· + ROO· → ROOR + O2
Scheme 8: Step 3 – Termination
The primary product of oxidation is the formation of hydroperoxides and it also
determines the rate of oxidation. The hydroperoxide concentration is very low during the

Chapter 2 Page 43
initial period but the level increases rapidly in the propagation period and indicates the onset
of the overall oxidation. The availability of weakly bound allylic hydrogens in the fatty acid
chain and the relative ease with which they react with peroxy radicals determines the degree
of susceptibility to auto-oxidation (Jain and Sharma, 2010b, Pullen and Saeed, 2012, Chen
and Luo, 2011).
The rise in peroxide concentration is a useful indicator of biodiesel oxidation. Over
time, secondary oxidation products including aldehydes, ketones and short-chain carboxylic
acids are formed. The latter increase the acid number of the biodiesel. This can ultimately
cause corrosion of fuel system components, the hardening of rubber compounds and the
jamming of moving parts (Chen and Luo, 2011, Karavalakis and Stournas, 2010, Pullen and
Saeed, 2012).
2.10.3. Autoxidation of linoleic acid
The degradation of biodiesel by autoxidation is described as a two-step process
forming first primary and then secondary oxidation products. Oxygen does not react directly
with the double bonds in linoleic acid. The reaction proceeds via an initial formation of a
fatty acid radical. The primary oxidation stage is described as a chain reaction. The classical
oxidation mechanism of linoleic acid involves hydrogen abstraction from the bis-allylic
methylene group, carbon 11 (Scheme 9) to produce a fatty acid radical (pentadienyl radical)
that is delocalised over carbons 9 through 13 (Frankel, 1984, Schneider, 2009). The radical
produced is resonance stabilised. Two of these resonance forms are particularly stable
because they contain conjugated double bonds. The radical will be present preferentially on
carbon 9 and 13, thus forming the conjugated hydroperoxides 9-HPODE and 13-HPODE.
When oxygen reacts with these alkyl radicals, peroxide radicals are formed in the
chain propagation step. Addition of oxygen to the carbon centred radical is exceedingly fast.
This means that the rate of reaction is only limited by how fast oxygen can get to the fatty
acid radical and there is basically no energy barrier for formation of the peroxide radical. This
is true for addition of oxygen to all three carbons 9, 11 and 13. The bond that breaks is in the
-position to where the radical is located, hence the reaction of the peroxyl radical is called
-fragmentation. The reaction with oxygen is reversible, thus the peroxide radical can loose
oxygen and revert back to the carbon radical. The peroxide radical abstracts a hydrogen atom
from an available bisallylic methylene group. Although this is the rate limiting (slowest) step
of the radical reactions during autoxidation, it is nevertheless the dominating reaction for the

Chapter 2 Page 44
peroxide radical during the early stages of autoxidation. It is also the step that propagates the
chain by passing the radical on to the next fatty acid molecule (Schneider, 2009).
13
12
11
10
9
R1
R
R = -C5H
11
R1 = -C7H
14COOH
Linoleic Acid
-
R1
R
R1
R
R
R1
R1
R
conjugated bis-allylic conjugated
-frag.fast
-frag.slow
-frag.slow
+O2
+O2
+O2
11
R1
R OO
R
9R
1
OO
R1
13R
OO
+ +
+
11
R1
R OOH
R
9R
1
HOO
R1
13R
OOH
Scheme 9: Mechanism for hydroperoxide formation in the autoxidation of Linoleic acid
according to Schneider (2009)

Chapter 2 Page 45
During the secondary oxidation stage more complex hydroperoxide decomposition
reactions occur. They include dehydration, cyclization, radical substitution, cracking,
dimerization and this result in a wide spectrum of products. These products includes
monomeric keto-, epoxy-, di– and trihydroxyl- compounds, dihydroxyperoxides, etc. in
addition to oligomeric species which include dimers and trimers linked via peroxy- or ether
groups and short chain species. The formation of oligomeric and short-chain species increase
the viscosity of biodiesel which results in poor cold flow properties and increased filter and
nozzle plugging. The formation of shorter chain fatty acids, which increases biodiesel acidity
is also associated with the secondary oxidation stage (Choe and Min, 2006, Samadhi et al.,
2017). Scheme 10 shows the mechanisms of hydroperoxide decomposition to form secondary
oxidation products.
R2
R1
O2 H
R2 CH CH CH R1
OOH
OH
-
R2 CH CH CH R1
O
B A
BA
R2 CH CH CHOR2 CH CHR1++ CHO R1
R3H
R3
OH
-
A1A2
R2 OH R2H
OH
-
B1 R3H
R3
B2
R2 CH CH OH
R2 CH2 CHO R2 CH CH2
Scheme 10: Mechanism of hydroperoxide decomposition and the formation of secondary
oxidation products according to Choe and Min (2006).

Chapter 2 Page 46
2.10.4. Mechanism of antioxidants
Antioxidants are chemical compounds which can delay the start or slow the rate of the
oxidation reaction. The oxidation stability of biodiesel can be increased by adding natural or
synthetic antioxidants, which bind the free radicals and stops chain reaction. Antioxidants
function by delaying oxidation but they do not prevent it (Knothe, 2007, Jain and Sharma,
2010b).
According to Mittelbach and Schober (2003) very little is known of the effect of
antioxidants on the stabilization of biodiesel while the effect of antioxidants on the behaviour
and stability of edible vegetable oils was widely investigated. Antioxidants can occur
naturally or synthetic antioxidants may be added deliberately. The effectiveness (Pullen and
Saeed, 2012) of a synthetic antioxidant depends on its chemical structure as well as the
components of the biodiesel. Reported work (Waynick, 2005) with biodiesel fuel has been
limited to the chain braking antioxidants. The two most common types of chain breaking
antioxidants are phenolic and amine types. However, most of the work in fatty oil and ester
applications has been limited to the phenolic type antioxidant.
Antioxidants like phenols and amines have a hydrogen atom that can be donated to
interrupt the chain reaction (Knothe, 2007). For example, phenols become quinones or they
can react with a radical in an additive fashion.
The general mechanism by which these antioxidants work is illustrated in Scheme 11. The
hydrogen atom in the antioxidant (AH) is more easily abstracted and is rapidly donated to the
peroxy radical preventing it from creating another radical. The antioxidant free radical (A·) is
either stable and less reactive or further reacts to form a stable molecule that does not
contribute to the oxidation process. The oxidation chain reaction is thus interrupted while the
antioxidant is consumed (Rizwanul Fattah et al., 2014, Pullen and Saeed, 2012).
ROO· + AH → ROOH + A ·
RO· + AH → ROH + A ·
ROO· + A· → ROOA
RO· + A· → ROA
Scheme 11: Antioxidant mechanisms
Denisov (1996) analysed the cyclic mechanisms of chain termination with phenols
and aromatic amines in the oxidation of hydrocarbons. During oxidation, the initiation rate

Chapter 2 Page 47
increase as oxidation accelerates and hydroperoxides accumulate. By introducing an inhibitor
(antioxidant), such as a phenol or amine, the oxidation reaction is retarded and chain
termination is accelerated. The rate of the chain termination is limited by the reaction of the
peroxy radical with the inhibitor (antioxidant). The retarding action of the inhibitor is
determined by its concentration and reactivity. The induction period will thus depend on the
concentration of the antioxidant added and the inhibition coefficient.
The simplest theory developed for hydrogen donor free radical scavenger type
antioxidants was presented by Gol'dberg et al. (1988). It predicts that the induction time is
proportional to the inhibitor concentrations with three rate constants determining the
proportionality constant. All three rate constants are temperature dependant. It is therefore
conceivable that antioxidants that perform poorly at the elevated test temperature might
actually perform better at much lower storage and end use temperatures. The simplified
model for the oxidation of hydrocarbons is shown in Appendix A.
2.10.5. Antioxidants type
Antioxidants can be classified on the base of structure and antioxidant mechanisms (Knothe,
2007, Jain and Sharma, 2010b, Pullen and Saeed, 2012, Rizwanul Fattah et al., 2014, Chao et
al., 2014)
Primary antioxidants preferentially react with the free radicals that are formed
during the initiation of oxidation and are called chain breakers or radical
scavengers. The two most common types are phenolic and amine. Most fatty oil
and ester studies were limited to the phenolic types. Primary oxidants interrupt the
radical chain reactions of the auto–oxidation process by donating hydrogen atoms
to terminate active free radical intermediates such as alkoxy and alkyl peroxide
radicals. Phenolic antioxidants are excellent hydrogen donors.
Secondary antioxidants or hydroperoxide decomposers function by reacting with
hydroperoxides to form unreactive compounds, for example alcohols.
Hydroperoxide decomposers include sulfur and organophosphorus compounds.
Different synthetic antioxidants have different effects on the stability of biodiesel
depending on the feed stock without affecting properties such as viscosity and density. Acid
value seems to be affected slightly by the addition of antioxidants (Jain and Sharma, 2010b).
The effect synthetic antioxidants have on oxidation stability depends on their
synergism with the vegetable oil being studied (Araújo et al., 2009). The most common

Chapter 2 Page 48
antioxidants used for biodiesel including some additives developed for petroleum fuels, are
butalyted hydroxytoluene (BHT), butalyted hydroxianisol (BHA), tert-butylhydroquinone
(TBHQ), propyl gallate (PG) and pyrogallol (PY) (Karavalakis et al., 2011). Table 2.5 shows
different antioxidants and their chemical structures.
Vauhkonen et al. (2011) compared the oxidation stability of bio-oils and fuels from
low value feedstock (animal fats) to those of conventional feedstock (rapeseed oil). The
oxidative stability was determined with the Rancimat method. Synthetic antioxidants, BHA,
IONOL and BF 1000 were added to the bio-oils and fuels. They found that the animal-based
fat methyl ester required higher concentrations of antioxidants than the rapeseed methyl ester.
However, the feedstock materials required lower concentrations of antioxidants than the
methyl esters to have efficient oxidative stability. Therefore, antioxidants should be selected
considering the chosen feedstock.
2.10.6. Effect of antioxidants on oxidative stability
The oxidative stability of biodiesel can be improved by adding antioxidants (Knothe, 2007,
Jain and Sharma, 2010b, Schober and Mittelbach, 2004).
Mittelbach and Schober (2003) used the Rancimat method, EN14112 to study the
oxidation stability of methyl esters from sunflower and rapeseed oil, used frying oil and beef
tallow; distilled and undistilled. Antioxidant concentrations ranged from 100 to 1000 ppm.
They found that the antioxidants PY, PG, TBHQ, and BHA significantly increased the
oxidative stability of methyl esters from rapeseed, used frying oil and beef tallow, while BHT
was not very efficient. However, TBHQ showed good results only in the undistilled samples.
Natural antioxidants in distilled samples are removed during distillation. PY and PG at
concentrations of 1000 ppm showed good results in undistilled sunflower oil. The sunflower
methyl ester exhibited relatively poor oxidative stability with all the antioxidants studied.
This is due to the higher concentration of linoleic acid in sunflower oil which is less stable
than oleic acid toward oxidation.
Dunn (2005) studied the effectiveness of the antioxidants PG, BHT, BHA and -Tocopherol
in soybean oil fatty acid methyl ester (SME). Dynamic PDSC was used with a heating rate
of 5 °C/min and with air (2 MPa) as oxidizing gas. The results showed that the antioxidants
PG, BHT and BHA were most effective and -tocopherol least effective in increasing
oxidation induction temperature OOT.

Chapter 2 Page 49
Table 2.5: Antioxidant type and structure
Antioxidant Type Structure
Orox PK
poly(1,2-dihydro-2,2,4-trimethylquinoline
Amine
NCH
3
CH3
H
CH3
Naugard P
tris(nonylphenyl) phosphite
Phosphite OP
C9H
193
Anox 20
tetrakis[methylene(3,5-di-t-butyl-4-
hydroxyhydrocinnamate)]methane
Phenolic OH
OCH2
O
C
4
BHT
Butylated hydroxytoluene Phenolic
OH
CH3
CH3
CH3
CH3
CH3
CH3
CH3
TBHQ
Tert-butylhydroxyquinone Phenolic
OH
OH
CH3
CH3
CH3
DTBHQ
2,5-di-tert-butyl-1,4-dihydroxybenzene Phenolic
OH
OH
CH3
CH3
CH3
CH3
CH3
CH3
PG
Propyl gallate Phenolic
OH
OH
OH
O
O
PY
Pyrogallol Phenolic
OH
OH
OH

Chapter 2 Page 50
Domingos et al. (2007) evaluated the effect of synthetic antioxidants BHA, TBHQ
and BHT on the induction time of soybean oil ethyl esters with low oxidation stability. The
Rancimat method, EN14112 (BS EN 14112, 2003) was used to measure the oxidation
stabilities. BHT was found to be the most effective antioxidant up to concentrations of 7000
ppm. However, TBHQ displayed a better stabilizing effect when used at higher
concentrations of 8000 ppm. BHA provided no noticeable increased induction time at
concentrations of 2000 ppm and greater. Binary or ternary mixtures of these antioxidants
yielded no evidence of any positive synergistic effect.
Karavalakis et al. (2011) studied the effect of phenolic antioxidants on a commercial
methyl ester sample. They found that BHT and BHA were not as effective as TBHQ, PG and
PY. At an antioxidant loading of 1000 ppm the efficiency of the antioxidants used was in the
order TBHQ > PG > PY > BHA > BHT.
Araújo et al. (2009) evaluated the performance of several phenolic antioxidants in
castor oil fatty methyl ester (FAME) using the PetroOXY oxygen-contact degradation test.
Their results indicated that BHA outperformed PG, TBHQ, and 2,6-ditert-butyl-4-
methylphenol (DBPC) for castor oil methyl ester.
Polavka et al. (2005) used temperature scanning PDSC and Rancimat analysis to
study the oxidation stability of methyl esters derived from fresh rapeseed oil and waste frying
oil, both distilled and undistilled, unstabilized and stabilized by pyrogallol or BHT. Both
techniques show that oxidation stability increases considerably with the addition of
antioxidants. Pyrogallol was found to be the more efficient inhibitor.
Liang et al. (2006) used the Rancimat method EN14112 to study the oxidative
stability of crude and distilled palm oil methyl ester. The crude palm oil methyl exhibit
outstanding oxidative stability (IP > 25 h) compared to the distilled palm oil methyl ester (IP
= 3.5 h). The stability of the crude palm oil methyl was attributed to the presence of natural
components such as carotenes and vitamin E that act as antioxidants. Addition of the natural
antioxidant or synthetic antioxidants improved the stability of distilled palm oil methyl ester
but it remained less than that of the crude biodiesel. The efficiency ranking of antioxidants in
the distilled biodiesel was as follows: TBHQ > BHT > -tocopherol.
Sarin et al. (2010) used the Oxidation Stability Index (OSI) method to study the
destabilizing effect of catalytic amounts of transition metals on palm methyl ester (PME).
Addition of the antioxidants BHT, TBHQ, tert-butylated phenol derivative (TBP), and

Chapter 2 Page 51
octylated butylated diphenyl amine (OBPA), improved the oxidation stability of metal-
contaminated PME. TBHQ was the most effective.
According to Waynick (2005) the most effective synthetic antioxidants investigated
and used in fatty oils and esters are TBHQ, pyrogallol (PY) and propyl gallate (PG). These
antioxidants were most effective in concentrations of 200 to 1000 ppm depending on the
substrate and the type of stability test used to evaluate oxidative stability. BHT is usually one
of the less effective synthetic antioxidants in fatty oils and esters. However, it is one of the
most effective for hydrocarbon fuels and lubricants.
2.10.7. Synergy
Synergy corresponds to the situation where the combination of two or more agents provides
an effect that is greater than the expected sum of their individual effects (Breitinger, 2012).
Agents can interact in three possible ways. The effects can simply add up, that is, there is no
interaction; their combination could produce a greater than expected result (i.e. synergy), or
their interaction could lead to a reduced result (i.e. antagonism).
Synergism involves several mechanisms between antioxidants, for example a
combination of two or more different free radical scavenger antioxidants where one of them
is regenerated by the others, sacrificial oxidation of an antioxidant to protect another
antioxidant, and a combination of two or more antioxidants with different mechanisms
(Decker, 2002). The regeneration of the more effective free radical scavenger (primary
antioxidant) by the less effective free radical scavenger (co-antioxidant, synergist) occurs
mostly when the one scavenger has a higher reduction potential than the other one. The free
radical scavenger with the higher reduction potential acts as the primary antioxidant.
Regeneration of primary antioxidants contributes to a higher net interactive antioxidant effect
than the simple sum of individual effects.
Few studies explored synergy in biodiesel for combinations of antioxidants.
Synergism can arise for a variety of reasons depending on the types of antioxidants
employed. According to Ingold (Ingold, 1961) synergism requires that two antioxidants
perform different roles during inhibition. Furthermore, in a given mixture of antioxidants
synergism may be due to more than one cause; for example, combinations of a free radical
inhibitor that donates hydrogen with a synergist that can decompose peroxides. Another
mechanism that might give rise to synergism is the transfer of a hydrogen atom from the
synergist to the free radical inhibitor after it has lost its active hydrogen to a peroxy radical.

Chapter 2 Page 52
This mechanism is likely to be favoured with mixtures of free radical inhibitors, since even
the less active component will give a resonance-stabilized free radical. Synergists may not
even be effective when used alone. Rather, they may work best when combined with an
antioxidant. The most effective synergistic mixtures of antioxidants are probably those in
which one compound functions as a free radical scavenger and the other as a hydroperoxide
decomposer (Ingold, 1961).
Some combinations of antioxidants did show synergistic effects with respect to the
auto oxidation of lipids in fats and oils. For example, de Guzman et al. (2009) found
synergistic stability improvement with combinations of tert-butyl hydroquinone (TBHQ) and
butylated hydroxyanisole (BHA). Binary antioxidant formulations: TBH/:BHA, TBHQ/PG
and TBHQ/PY were most effective at 2:1, 1:1, 2:1 weight ratios, in both distilled soybean oil
(DSBO) and distilled poultry fat-based (DPF) biodiesel. They also concluded that
quantification of antioxidant content in stored biodiesel demonstrates that TBHQ regenerates
the PY. This is the dominating factor behind the synergistic effect of the TBHQ/PY blend.
However, not all combinations produced a synergistic effect. In some cases there was no
effect or even worse, antagonistic effects were observed.
Combinations of -tocopherol and myricetin showed synergy with respect to the
autoxidation of sunflower oil (Marinova et al., 2008). At concentrations lower than 0.001 M,
the best stability was achieved with equimolar ratios of the antioxidants. Analysis of the
kinetic data indicated that the mechanism involves regeneration of the highly efficient
antioxidant myricetin by -tocopherol. Although the antioxidants were not used in biodiesel,
a similar synergism can be expected there. Becker et al. (2007) studied the effect of binary
combinations of four antioxidants (-tocopherol, astaxanthin, quercetin and rutin). They
concluded that factors like structural organization of the lipid, polarity and the hydrophilic
nature of the antioxidants and poor solubility of the antioxidant may affect synergism and
antagonism. However, this was only found in emulsions and not in the bulk oils. They
suggested that synergism is mainly caused by differences in solubility and differences in
phase distributions at or near the interface.
The expected induction period value for a mixture of antioxidants (IPexpected)
corresponds to the sum of the individual induction periods minus the induction period of the
neat fuel. Becker and Knorr (1996) defined synergism (S) as the proportional improvement in
the actually measured IP value (IPmix) beyond the expected IP value for the mixture. That is
SB = (IPmix/IPexpected) 100%. Only added effects were observed for combinations of

Chapter 2 Page 53
monophenols or bisphenols with sulfides or aromatic phosphites (i.e. SB > 100%).
Combinations of monophenols or 4,4'-MBP (4,4'-methylenebis-(2,6-ditert-butylphenol)) and
aromatic amines resulted in added or slightly negative effects,that is SB ≤ 100% (Becker and
Knorr, 1996).
Marinova et al. (2008) defined synergy slightly differently:
SM = [IPmix IPo (IPexpected IPo)]/(IPexpected IPo)] 100% where IPmix is the actually
measured IP value for the system, IPo is the value for the neat fuel (the control sample). A
positive value corresponds to synergism and a negative value to antagonism.
Tang et al. (2008a) investigated the effectiveness of individual and binary antioxidant
formulations on the oxidative stability of different types of biodiesel and distilled biodiesel.
They found that the effective activity level of antioxidants depended on the biodiesel
feedstock and the presence of natural antioxidants. Synergistic effects were found in soy
bean biodiesel (SBO) for binary mixtures of TBHQ and PY. The IP values for the binary
antioxidant increased with the ratio TBHQ/PY until a maximum was reached at a ratio of
TBHQ/PY = 2:1 (667 ppm TBHQ and 333 ppm PY).
The synergy between phenolic- and amine-based antioxidants could be explained by
the Gatto and Grina mechanism (Gatto and Grina, 1999). The hindered phenols and resulting
phenoxy radicals are more stable than the analogous amines and amino radicals. The phenolic
antioxidant simply acts as a proton source for the more reactive amine. They also concluded
that the antioxidant structure, base oil type and oxidation test conditions are critical factors.
For the solvent-refined oil which contained the highest level of aromatics and sulfur, a
maximum response was obtained at a phenolic to diphenylamine ratio of 1:1. The hydro-
cracked oils, which contained almost no sulfur and very little aromatics, a maximum response
was obtained at a phenolic to diphenylamine ratio of 1:3. These results show the effect of
sulfur and aromatics in the base oil on the phenol to diphenylamine ratio (DPA). Pressure
DSC (PDSC) data indicated strong synergism between thioethylenebis(3,5-di-t-buty-4-
hydroxyhydrocinnamate) (SBHHC) and DPA. Amino 2,6-di t-butylphenol (DTBP) and DPA
also showed a synergistic effect but not as strong as that of SBHHC and DPA. The strong
response of these combinations was attributed to the ability of these antioxidant combinations
to function as radical scavengers, provided by the phenol group, in addition to the
hydroperoxide decomposing effect provided by the sulfur or amino group.

Chapter 2 Page 54
2.11. Mixture Experiments
According to Cornell (Cornell, 2000) a mixture experiment is simply the action of adding or
blending ingredients to obtain a more desirable end effect or product. It is something we all
do regularly, for example, adding sugar to coffee or tea, mixing oil and vinegar and spices for
a salad dressing or even adding a different octane level fuel to what is already in the fuel
tank. The foundation for mixture designs and the modelling of the results was laid down by
Scheffé for cases where the proportions of two or more ingredients are varied (Scheffé,
1958). He first introduced the simplex lattice designs and the use of Sheffé polynomials for
correlating the functional relationship of the responses with the ingredient composition.
In mixture experiments, the factors are proportions of the components in a mixture
(Bello and Vieira, 2011). The response is a variable that characterises the quality of the
product, assumed to be a function of the component proportions. The simplex constraint for
mixtures is the requirement that the sum of the component proportions should equal unity.
Other factors affecting the characteristics of the mixture in addition to the mixture
components are called process variables. These may be included in the experiment as
factorial components.
In a mixture experiment various proportions of two or more components are mixed to
make different compositions of an end product. The composition variables are expressed in
terms of fractions, for example by mass, volume or mole. All proportions have to be
nonnegative and their sum must be equal to unity (the simplex constraint). Thus, in a mixture
that contains q components the component proportions xi are subject to 0 ≤ xi ≤ 1 and
∑
2.11.1. Mixture designs
Scheffé developed the simplex lattice and simplex centroid design for experiments with
mixtures (Cornell, 2000, Lambrakis, 1968). The purpose of these mixture designs is to aid the
empirical prediction of the response of a mixture of the components. It holds for the case
where the response depends only on the proportions of the components and not on the actual
amount of the mixture. For unconstrained mixtures, that is if all possible proportions are
allowed for all components, the simplex lattice, simplex centroid, and the simplex axial
design are commonly used. When there are numerous components in the mixture, the simplex
axial and simplex centroid designs are preferred. If the number of components is not too

Chapter 2 Page 55
large, but a high order polynomial equation is needed in order to accurately describe the
response surface, then the simplex lattice design is used.
Triangular designs are useful for formulation development when ternary mixtures are
considered (Gorman and Hinman, 1962). According to Bello and Vieira (Bello and Vieira,
2011), for a three-component mixture, the available experimental region can be represented
with the 3-coordinate system shown in Figure 2.2. The vertices of the triangle correspond to
the pure components. Each edge of the triangle corresponds to a binary mixture. The possible
ternary mixtures are located inside the triangle. The triangle boundary defines the limits of
the experimental space.
Figure 2.2: Typical triangular design with three components, combined [3,2] and [3,3] lattice
A simplex coordinate system is used to define the value of each component xi, (i =
1,2,…,q where q is the number of components). The triangle or simplex plot denotes the
experimental space or area for displaying a three-component system. It is defined by the
requirement that the sum of the three components equals unity. The coordinates for the
points on the vertices correspond to (1,0,0), (0,1,0) and (0,0,1). The interior points of the
triangle represent mixtures in which all three components are present, thus meaning all xi > 0,
for i = 1,2,3. The point in the middle of the triangle is called the centre point and the

Chapter 2 Page 56
coordinate for this point is (1/3,1/3,1/3). It is also called the centroid of a face or plane. The
three coordinates on the centroid of edges are (1/2,1/2,0), (1/2,0,1/2) and (0,1/2,1/2).
In a simplex lattice design the response in a mixture experiment is usually described
by a polynomial function. This function represents how the components affect the response.
A lattice is the ordered arrangement consisting of uniformly spaced distribution points. Thus
the choice for a design should be one whose points are spread evenly over a whole simplex.
In a [q, m] simplex lattice design for q components, the points are defined by the
following coordinate settings, xi = 0, 1/m, 2/m, ..., 1 for i = 1,2,…, q. The proportions
assumed by each component take the m + 1 equally spaced vales from 0 to 1. The design
space consists of all the reasonable combinations of all the values for each factor m and is
called the degree of lattice (Scheffé, 1958). For example:
For a [3,2] design, xi = 0, 1/2, 1. The design space has six points on the triangle, three
on the vertices and 3 on the edges of the triangle.
For a [3,3] design xi = 0, 1/3, 1/3, 1 with a design space of ten points on the triangle,
three points on the vertices (1,0,0), (0,1,0) and (0,0,1). The six points on the edge
(2/3,1/3,0), (1/3,2/3,0), (0,2/3,1/3) (0,1/3,2/3), (1/3,0,2/3) and (2/3,0,1/3). The centre
coordinates being (1/3,1/3,1/3).
For a simplex design with degree of m, each component has m + 1 different values. The
experiment results can be used to fit a polynomial equation up to an order of m.
The simplex centroid design includes, like the name implies, only the centroid points.
In the simplex centroid the points on the edge of the triangle (1/2,1/2,0) are called 2nd
degree
centroids. Each edge has two non-zero components with equal value. The point in the centre
(1/3,1/3,1/3) is a 3rd
degree centroid as all three components have the same value. For the
design of q components the highest degree of centroid is q. It is called the overall centroid or
the centre point of the design. A simplex centroid design usually requires fewer composition
evaluations than a simplex lattice design with the same degree. A polynomial model with
fewer terms can then be used. Thus, a [3,3] simplex centroid design can be used to fit the
special cubic model (Gorman and Hinman, 1962, Scheffe, 1963).
2.11.2. Correlating the ternary IP mixture data with Scheffé K-polynomials
Consider a mixture that contains q different components. Let xi be the fractions that describe
the mixture composition. In the present example this was achieved by choosing mass
fractions as the composition variables. The question is to develop consistent expressions that
Chapter 2 Page 57
connect mixture composition with a mixture property. In the present case, the ―property‖ is
the effect the mixture has on the oxidative stability of a biodiesel when it is added at a fixed
dosage of 0.15 wt.%.
The Scheffé K-polynomials are among the most common empirical models applied in
the context of experimental mixture design (Focke and Du Plessis, 2004, Draper and
Pukelsheim, 1998). In essence they are trimmed Taylor polynomials that take the mixture
constraints into account, that is:
0 xi 1 for i = 1, 2, …. q (1)
Together with the simplex constraint
∑
(2)
The nth
-order Scheffé K-polynomials are homogeneous first order in the model parameters
and homogeneous nth
-order in the composition variables. The mixture property is denoted by
amix and the model parameters by ai, aij, and aijk depending on the order of the K-polynomial.
Note that irrespective of the order of the model that is used, the property value for a pure
component i is given by ai = aii = aiii … The present study considered a ternary mixture of
antioxidants so q = 3 and the mixture property of interest was the effect on the stability of the
biodiesel as quantified by the Rancimat induction time IPR.
The first order Scheffé polynomial for a ternary mixture is given by:
(3)
This is the so-called ―linear blending rule‖ and it states that the mixture property varies
linearly with composition. In effect the mixture property is defined by a composition
weighted arithmetic mean over the pure component properties. The key advantage of the
linear blending rule is that pure component properties suffice to predict multicomponent
behavior.
The second order Sheffé K-polynomial for a binary i-j mixture is described by:
(4)
In this model the parameter aij describes interaction effects. A q-component mixture will
comprise q(q-1) different binaries and thus the model will feature that number of binary
Chapter 2 Page 58
interaction parameters. In addition, binary experimental data is required to fix these
parameters. Once known, multicomponent property values can be predicted.
The experimental IP values obtained for the Orox-Naugard and Naugard-Anox binary
blends were such that the composition dependence was adequately represented by second
order Sheffé polynomials. However, the response for the Orox-Anox binary was highly
nonlinear and it was necessary to use a cubic Scheffé K-polynomial to correlate the data for
this system. This means that the ternary data for the Orox (1) - Naugard (2) - Anox (3) system
must also be fitted with a third order Scheffé polynomial:
(5)
Where amix = IPR is the induction time in the presence of the antioxidant blend at a fixed
dosage of 0.15 wt.%; xi represents the mass fraction of additive i in the antioxidant blend; aiii
is the Rancimat induction time recorded for neat antioxidant i, and the aijk are adjustable
model parameters. Note that a cubic Scheffé polynomial features two binary interaction
parameters for each binary and one ternary parameter for each ternary in the system. So for
the present case there are six binary parameters aijj and one ternary constant a123 to be
determined. Thus it would appear that there are a total of ten parameters that need to be fixed.
However, as already mentioned, the data for two of the binaries were adequately fitted by the
lower order quadratic Scheffé model. Now, a convenient aspect of Scheffé polynomials is
that they form a set of nested models that range from the linear bending rule to whatever
order is desired. Lower order models can be transformed into higher order ones by
multiplication with the simplex constraint, Equation (2). This allows the ―upgrading‖ of
lower order models for incorporation into one of a higher order. In the present case the
upgrading of the quadratic, described by Equation (4), to the cubic form was achieved by
multiplying the right hand side with xi + xj = 1:
(6)
Comparing coefficients shows that aiii = aii; 3aiij = aii +2aij, etc. So the ternary parameters are
expressed in terms of specific combinations of the binary and pure component parameters.
This means that, for the present case, only eight model parameters need to be determined to

Chapter 2 Page 59
fit the cubic Scheffé polynomial to the data. Taking this into account, the following procedure
was used to fix the model parameters. The neat component parameters aiii were determined as
the average of the two measurements for the effect of the neat antioxidants. The rest of the
parameters were determined by least square data fitting.

Chapter 3 Page 60
Chapter 3: Methodology
3.1. Background
Biodiesel must conform to numerous test methods described in European specification
EN14214 (BS EN 14214, 2012+A1:2014) and American Standard Specification ASTM D
6751-11b (ASTM D6751-15ce1, 2016) in order to be commercially distributed and sold. Both
these specifications include oxidation stability as an important requirement. Currently the
reference method for the oxidative stability of biodiesel is EN14112 (BS EN 14112, 2003). It
describes the Rancimat method for measuring the induction time of the biodiesel at 110 °C. A
minimum induction time of 8 h is required by EN14214 (BS EN 14214, 2012+A1:2014) but
ASTM D 6751-11b (ASTM D6751-15ce1, 2016) requires a minimum induction time of 3 h.
The main objective of this study was to study the stabilization of sunflower oil-based
biodiesel as it usually does not conform to US and European standard specifications even
when stabilized with conventional antioxidants.
3.2. Theory: Biodiesel Production
The conventional wisdom is that the preferred transesterification parameters for oils in
general, yielding maximum methyl ester content, are a reaction time of 60 min at a
temperature of 60 °C, NaOH or KOH as catalyst in an amount of 1% by mass of the oil, and a
molar ratio of alcohol to oil of 6:1 (Freedman et al., 1984). However, for this project
biodiesel was made via the transesterification of sunflower oil with methanol in the presence
of KOH as catalyst at room temperature. Kinetic studies (Freedman et al., 1984, Vicente et
al., 2005, Ma et al., 1998, Noureddini and Zhu, 1997) of the transesterification of vegetable
oils indicate that the methyl ester yield depends on the feed stock oil, alcohol, catalyst type
and amount, molar ratio, reaction temperature, and reaction time. However, the optimum
parameters used for obtaining optimal ester content for one type of oil (e.g. coconut or
soybean) might not provide the same ester content for sunflower oil (Leung et al., 2010,
Freedman et al., 1984).
In a study done by Stamenković et al. (2008) on the kinetics of sunflower oil
methanolysis at low temperature, experiments were carried out at 10, 20 and 30 °C. An
impeller speed of 200 rpm was used to produce a uniform dispersion of methanol into the oil.
They found that mass transfer limitations were important at low temperatures (10 or 20 °C)

Chapter 3 Page 61
while at the higher temperature of 30 °C it disappeared. This was due to the increase in the
specific interfacial area. This explains the observations by Ma et al. (1998) that vigorous
agitation was no longer needed at higher reaction temperatures, once the two immiscible
phases were fully mixed and the reaction had started.
The production of good quality biodiesel from used frying oil was reported
(Tomasevic and Siler-Marinkovic, 2003) using the following reaction conditions, methanol to
oil ratio of 6:1, catalyst 1% KOH, reaction temperature of 25 °C, and a reaction time of
30 min. They found that an increase in catalyst amount as well as molar ratio did not
contribute to the yield and quality of the esters.
Jovanovic et al. (2016) studied alkaline transesterification for the production of
biodiesel in a batch reactor from sunflower, soybean and rapeseed oils at room temperature
(18 to 22 °C). Performing the transesterification at room temperature significantly simplified
the biodiesel production process in a batch reactor. The accepted procedures in a small
production usually represent a compromise between developed and defined laboratory
procedures and procedures for easy implementation in practical terms. It is also possible to
produce biodiesel of commercial quality as defined by the standard specifications at process
temperatures of 40 to 55 °C. However, for small biodiesel producers using these temperatures
is not an easy task and their investigation was thus focused on performing the process at room
temperature. They obtained an ester content exceeding the prescribed 96.5 wt.%. The ester
content for sunflower and rapeseed biodiesel was respectively 97.8 and 96.7 wt.%. The
soybean oil only reached an ester content of 93 wt.%. They concluded that producing
biodiesel by transesterification at room temperature in a batch reactor produced biodiesel of
commercial quality according to the standard specification. In conclusion, low temperature
transesterification can be done successfully provided vigorous stirring is applied.
3.3. Experimental: Biodiesel production
3.3.1. Materials
Local sunflower oil was selected as source for making biodiesel. In a previous study (Focke
et al., 2012), it was found that biodiesel from this source is significantly less stable than those
derived from rapeseed and soybean oils. There is another advantage of using sunflower
biodiesel. Since it is less stable, Rancimat stability tests would be shorter and this facilitates
the generation of more data at a reduced expense. While it would be an added advantage to
Chapter 3 Page 62
achieve the required European stability norm as well, that was not the primary objective. The
materials used were pure triple distilled sunflower oil manufactured by Sunfoil; UnivAR
methanol, general reagent grade potassium hydroxide pellets and molecular sieve 4Å beads,
all from Merck.
3.3.2. Biodiesel preparation
The biodiesel was prepared at ambient conditions using the following procedure after the
process was optimised according to the procedure described in Section 3.3.3. Potassium
hydroxide was used as catalyst and 5 g (1% of the oil amount) was completely dissolved in
100 mL of dry methanol. The solution was then poured over 500 mL of the sunflower oil in a
large Mason jar. The jar was securely closed and the solution vigorously shaken for 15 min
(approximately 3 shakes per second). The solution was transferred to a gravity separation
funnel and allowed to settle. In the first hour the separation appeared about 75% complete
and after 8 h, the glycerine reaction product had settled at the bottom with the biodiesel
(FAME) layer on top. The lower glycerol phase was removed. The biodiesel was then washed
to remove residual catalyst, free fatty acids and methanol. The product was washed five times
each with 140 mL distilled water. The biodiesel was decanted into an open container and
placed in a convection oven set at 70 °C to facilitate the removal of the remaining methanol
and water. After drying the sample, 10 g molecular sieve 4Å was added to the biodiesel to
remove any residual moisture present. The biodiesel was stored in an airtight container in a
fridge.
The mol ratio for the above procedure was calculated as 1: 5.5 (sunflower oil to
methanol). The molecular weight of the oil is derived from the molecular weights of the
triglycerides corresponding to the fatty acid methyl esters for the biodiesel. The molecular
weight was calculated using the methods described in Appendix B.
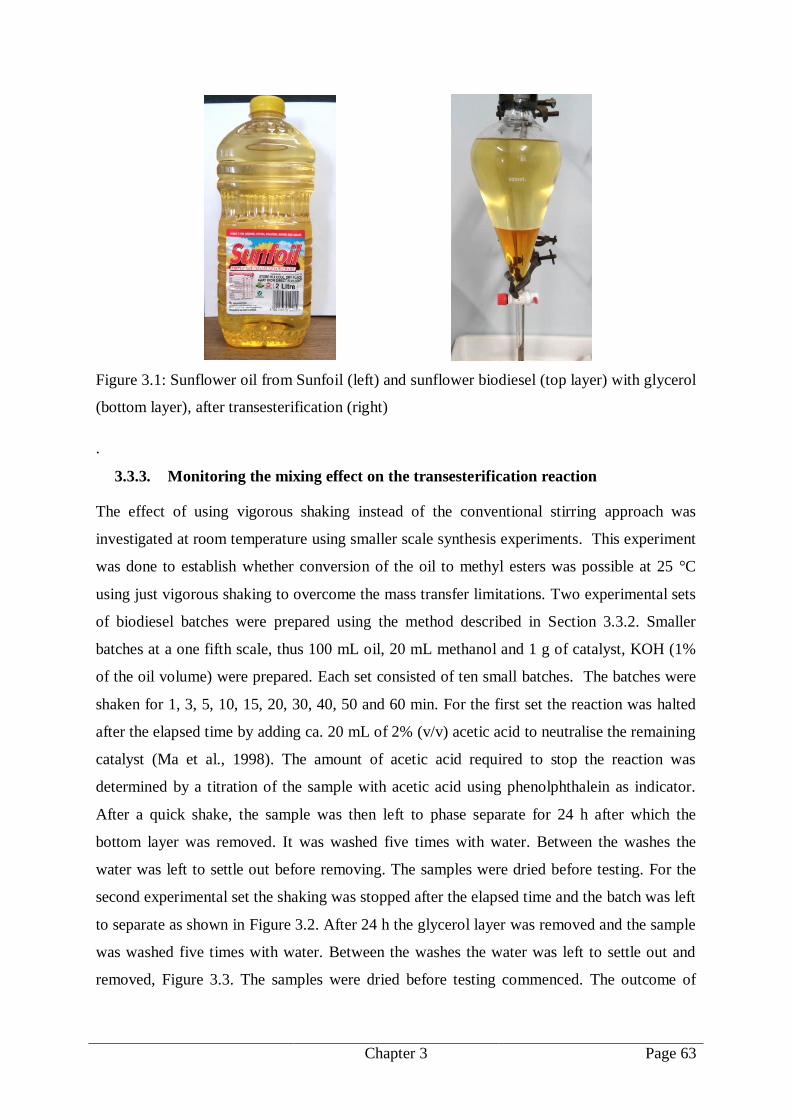
Chapter 3 Page 63
Figure 3.1: Sunflower oil from Sunfoil (left) and sunflower biodiesel (top layer) with glycerol
(bottom layer), after transesterification (right)
.
3.3.3. Monitoring the mixing effect on the transesterification reaction
The effect of using vigorous shaking instead of the conventional stirring approach was
investigated at room temperature using smaller scale synthesis experiments. This experiment
was done to establish whether conversion of the oil to methyl esters was possible at 25 °C
using just vigorous shaking to overcome the mass transfer limitations. Two experimental sets
of biodiesel batches were prepared using the method described in Section 3.3.2. Smaller
batches at a one fifth scale, thus 100 mL oil, 20 mL methanol and 1 g of catalyst, KOH (1%
of the oil volume) were prepared. Each set consisted of ten small batches. The batches were
shaken for 1, 3, 5, 10, 15, 20, 30, 40, 50 and 60 min. For the first set the reaction was halted
after the elapsed time by adding ca. 20 mL of 2% (v/v) acetic acid to neutralise the remaining
catalyst (Ma et al., 1998). The amount of acetic acid required to stop the reaction was
determined by a titration of the sample with acetic acid using phenolphthalein as indicator.
After a quick shake, the sample was then left to phase separate for 24 h after which the
bottom layer was removed. It was washed five times with water. Between the washes the
water was left to settle out before removing. The samples were dried before testing. For the
second experimental set the shaking was stopped after the elapsed time and the batch was left
to separate as shown in Figure 3.2. After 24 h the glycerol layer was removed and the sample
was washed five times with water. Between the washes the water was left to settle out and
removed, Figure 3.3. The samples were dried before testing commenced. The outcome of

Chapter 3 Page 64
these tests, after appropriate characterisation experiments, informed the final procedure that
was used to prepare the biodiesel samples used for antioxidant stabilisation studies.
Figure 3.2: Mixing Experiment 2, after 24 h settling, before glycerol removal (1 to 15 min
mixing time)
Figure 3.3: Mixing Experiment 2, samples after last water wash, before drying (1 to 15 min
mixing time)
3.4. Biodiesel Characterisation Procedures
The purpose of the characterisation methods that were used was simply to benchmark the
quality of the biodiesel used for the oxidation stability test. The ideal analytical method for
biodiesel is one that reliably and inexpensively quantify all contaminants, even at trace levels

Chapter 3 Page 65
with experimental ease (Knothe, 2001). There is however no analytical method that meets the
extreme demands for biodiesel. It is therefore necessary to make compromises when selecting
methods for biodiesel analysis or for monitoring the transesterification reaction. Almost all
methods used in the analysis of the samples were suitable, with appropriate modifications, for
all biodiesel feed stocks.
3.4.1. Gas Chromatography: GC-FID
The fatty acid methyl ester (FAME) content in biodiesel is a very important parameter as the
methyl ester content must not be less than be 96.5%. The FAME (ester) content was analysed
according to test method EN 14103 (BS EN 14103, 2011) and the modified EN 14103
(Ruppel and Huybrighs, 2008). Both these methods describe the determination of the total
methyl ester content of fatty acids by gas chromatography equipped with a flame ionization
detector.
A gas chromatograph (GC) consists basically of the following: a supply of carrier gas,
a sample injection system, a column for separation, a detector, and separate thermally stable
compartments for housing the column and the detector. According to Willard et al. (Willard
et al., 1988), gas chromatography requires two mutually immiscible phases, the mobile and
the stationary phases. The mobile phase or carrier gas is usually an inert gas, for example
helium or nitrogen, also referred to as the eluent. The stationary phase consists of a packed
column where the packing in the column acts as stationary phase or the column walls (of a
small diameter tube) is coated with the liquid stationary phase (capillary columns). The
versatility due to the wide choice of materials for the stationary and mobile phases makes it
possible to separate molecules that differ slightly in their physical and chemical properties.
The solute containing the sample is injected into the mobile phase using a syringe
where it instantly vaporises, turning into a vapour or a gas. The gas-solute mixture undergoes
a series of interactions between the stationary and mobile phases as it is being carried through
the system by the mobile phase. The solute components are adsorbed by the stationary phase
in the column and then desorbed again by fresh carrier gas. The process of adsorption-
desorption occurs repeatedly as the sample is transported toward the column outlet by the
carrier (mobile) phase. The separation of compounds is based on differences in the strengths
of interaction of the compounds with the stationary phase. These differences determine the
rate of migration of the individual components. The separated components emerge in the
order of increasing interaction with the stationary phase. The stronger the interaction, the

Chapter 3 Page 66
stronger the compound interacts with the stationary phase resulting in a longer retention time
as it takes more time to migrate through the column.
The flame ionization detector (FID) responds to substances that produce charged ions
when burned in a hydrogen/air flame. The sample enters the burner base through a Millipore
filter and is mixed with hydrogen gas. The mixture burns at the tip of the jet with air or
oxygen. Ions and free electrons are formed in the flame and enter the gap between two
electrodes. These may be parallel plates or an annular configuration mounted 0.5 - 1.0 cm
above the flame tip. An applied potential of about 400 V, sets up an electric field that causes
current to flow when ions are present between the two electrodes in the detector. The
resulting current flow is more intense when the solutes pass through than the current flow
produced by the pure carrier gas and the fuel gas flame alone. Furthermore it is proportional
to the concentration of the compound present in the sample. There are unfortunately no direct
relationships between the number of carbon atoms and the size of the signal. Thus, the
individual response factors for each compound have to be experimentally determined for each
instrument. When using a technique like GC-FID one should remember that high
temperatures and high flow rate decrease retention time but they also deteriorate the quality
of the separation.
The FAME analysis for the first two biodiesel batches, Sample BD01 and Sample
BD02 was performed by the CSIR Food and Beverage Laboratory (now acquired by Aspirata
Certification Auditing and Testing (Pty) Ltd.) using an Agilent 6890 GC-FID. Unfortunately,
the two biodiesel batches were insufficient to complete all the experiments and an additional
batch had to be made. However, due to the unavailability of the instrument at CSIR the
FAME analysis for Sample BD03 was performed at the Tshwane University of Technology
using a Varian Crompack CP-3800 gas chromatograph. Table 3.1 list the parameters used for
the two GC-FID instruments.

Chapter 3 Page 67
Table 3.1: GC - FID instrument parameters
Instrument Agilent 6890 GC-FID Varian Crompack CP-3800
Column
Agilent J&W GC column CP-
SIL 88 (100 m × 0.25 mm with a
film thickness of 0.20 µm)
Restek Rtx-2330 column
(30 m × 0.25 mm with a film
thickness of 0.20 µm)
Initial temperature 60 °C for 1 min 80 °C for 5 min
Program
20 °C/min to 150 °C for 0 min
5 °C/min to 215 °C for 0 min
1.5 °C/min to 240 for 40 min
10 °C/min to 150 °C for 5
min
10 °C/min to 260 °C for 7
min
Carrier gas Hydrogen Helium
Fuel Air - Hydrogen Air - Hydrogen
Detector temperature 260 °C 300 °C
Injector temperature 230 °C 280 °C
Split ratio 150:1 100:1
Injection volume 1 µL 1 µL
Determination of ester content:
The biodiesel samples were dissolved in hexane (Sigma-Aldrich). Quantification was
performed by internal standard calibration using methyl heptadecanoate. Identification of the
FAMEs in the biodiesel samples was accomplished by comparing their retention times to a
Supelco FAME reference mixture containing 37 components. The FAME content was
computed according to EN 14103 (European standard EN 14103, 2011) as discussed by
Ruppel and Huybrighs (Ruppel and Huybrighs, 2008). All the peaks, from that for methyl
myristate (C14) to that for the methyl ester of nervonic acid (C24:1), were accounted for.
The ester content C, expressed as a mass percentage, is calculated using Equation 7
∑
(7)
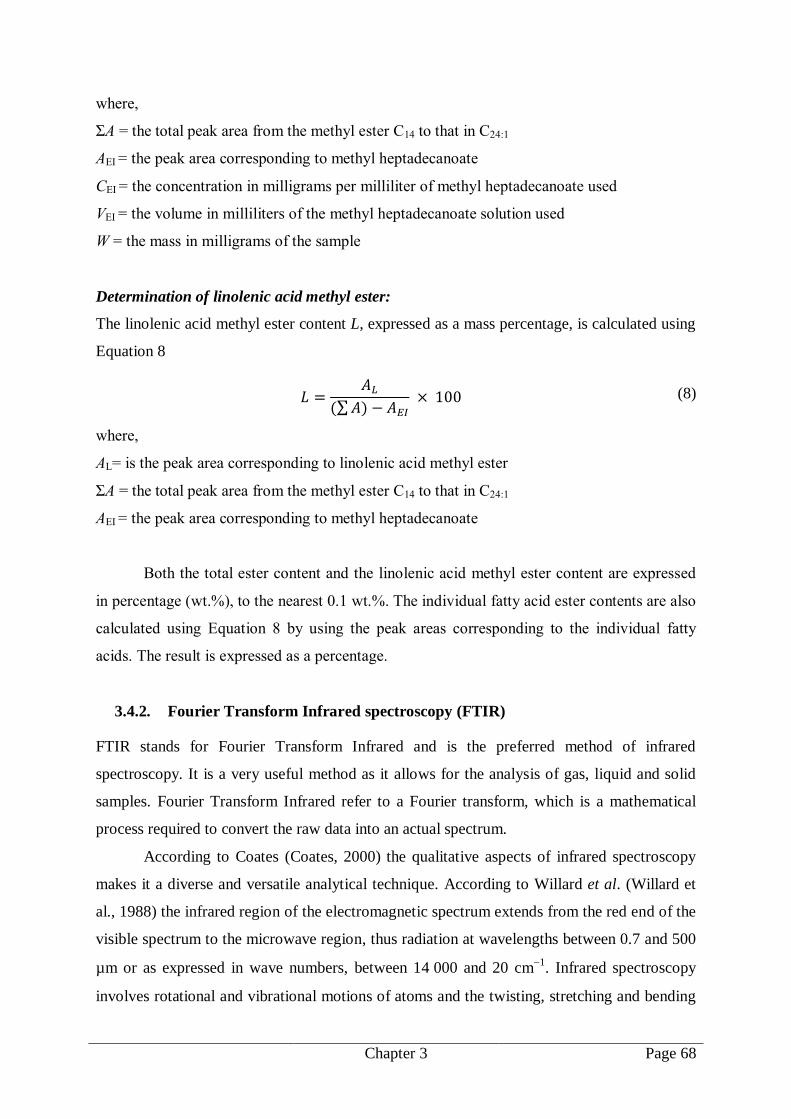
Chapter 3 Page 68
where,
ΣA = the total peak area from the methyl ester C14 to that in C24:1
AEI = the peak area corresponding to methyl heptadecanoate
CEI = the concentration in milligrams per milliliter of methyl heptadecanoate used
VEI = the volume in milliliters of the methyl heptadecanoate solution used
W = the mass in milligrams of the sample
Determination of linolenic acid methyl ester:
The linolenic acid methyl ester content L, expressed as a mass percentage, is calculated using
Equation 8
∑ (8)
where,
AL= is the peak area corresponding to linolenic acid methyl ester
ΣA = the total peak area from the methyl ester C14 to that in C24:1
AEI = the peak area corresponding to methyl heptadecanoate
Both the total ester content and the linolenic acid methyl ester content are expressed
in percentage (wt.%), to the nearest 0.1 wt.%. The individual fatty acid ester contents are also
calculated using Equation 8 by using the peak areas corresponding to the individual fatty
acids. The result is expressed as a percentage.
3.4.2. Fourier Transform Infrared spectroscopy (FTIR)
FTIR stands for Fourier Transform Infrared and is the preferred method of infrared
spectroscopy. It is a very useful method as it allows for the analysis of gas, liquid and solid
samples. Fourier Transform Infrared refer to a Fourier transform, which is a mathematical
process required to convert the raw data into an actual spectrum.
According to Coates (Coates, 2000) the qualitative aspects of infrared spectroscopy
makes it a diverse and versatile analytical technique. According to Willard et al. (Willard et
al., 1988) the infrared region of the electromagnetic spectrum extends from the red end of the
visible spectrum to the microwave region, thus radiation at wavelengths between 0.7 and 500
µm or as expressed in wave numbers, between 14 000 and 20 cm1
. Infrared spectroscopy
involves rotational and vibrational motions of atoms and the twisting, stretching and bending

Chapter 3 Page 69
of bonds in a molecule. Upon exposure to infrared radiation, the molecules selectively absorb
radiation at a specific wavelength. Due to a change in the dipole moment (difference in
electronegativity) in the molecules the vibrational energy levels of the molecules transfer
from the ground state to the excited state. The many different vibrations occurring
simultaneously produce a highly complex absorption spectrum. The absorption at a specific
frequency region can be correlated with specific stretching and bending motions. It is
possible to detect the presence of certain functional groups in the compound by judicious
interpretation of an FTIR spectrum. Therefore, an FTIR spectrum provides a molecular
fingerprint for each compound.
The infrared region can be divided into three segments. The first is the near-infrared
region (NIR) with frequencies from 12 500 cm1
to about 4000 cm1
. The second region is
the mid-infrared region (MID), which covers the frequency range from 200 to 4000 cm-1
.
This region is divided into the ―group frequency‖ region (4000 to 1300 cm1
) and the
―fingerprint region‖ (1300 to 650 cm1
). The absorption bands in the group frequency region
are more or less dependent on only specific functional groups and not the complete molecular
structure. In the ―fingerprint region‖, single bond stretching frequencies and bending
vibrations involve motions of bonds linking a substituent group to the remainder of the
molecule. The far-infrared region between 667 and 10 cm-1
consist of bending vibrations of
carbon, nitrogen, oxygen and fluorine. These low frequency molecular vibrations are
particularly sensitive to changes in the overall structure of the molecule (Willard et al., 1988).
Most modern infrared spectrometers are FTIR instruments. They were developed to
overcome limitations encountered with dispersive instruments. This led to the development of
a very simple optical device called an interferometer, which made it possible to measure all
of the infrared frequencies simultaneously rather than individually (Thermo Nicolet, 2001).
In FTIR, the beam of infrared energy emitted passes through an aperture and enters
the interferometer. Most interferometers employ beam splitters which divides the incoming
infrared beam into two optical beams. The two beams reflect off their respective mirrors and
are recombined when they meet back at the beam splitter. The path one beam travel is a fixed
length while the other path length is constantly changing. The signal which exits the
interferometer is the result of the two beams interfering with each other and is called an
interferogram. In the interferometer spectral encoding takes place. The resulting
interferogram signal exits the interferometer. The infrared beam then enters the sample
compartment where it is either transmitted through or reflected off the sample surface.

Chapter 3 Page 70
Specific frequencies (corresponding to specific energies), which are unique characteristics of
the sample, are absorbed. The beam finally passes to the detector for final measurement.
Detectors are specially designed to measure the special interferogram signal. The measured
signal is turned into the final infrared spectrum by a Fourier transform, which converts the
raw data into an actual spectrum. A background spectrum (with no sample in the beam path)
is done because there needs to be a relative scale for absorption intensity. The background
scan is compared to the measurement with the sample in the beam to determine the
transmittance (Willard et al., 1988).
Attenuated Total Reflectance (ATR) is an FTIR technique that allows for qualitative
or quantitative analysis. Little or no sample preparation is required and that speeds up the
analysis process. ATR spectroscopy is often the preferred method for the analysis of liquid
samples. In ATR a beam of radiation is directed onto an optically dense crystal with a high
refractive index at an angle larger than the critical angle for total internal reflection. An
evanescent wave, created by the internal reflectance, protrudes into the sample in contact
with the surface of the crystal. Therefore it is important that there must be good contact
between the crystal and the sample. The beam of radiation enters the sample that is in contact
with the crystal. The evanescent wave is attenuated in regions of the IR spectrum where the
sample absorbs energy. The attenuated beam returns to the crystal and eventually exits the
opposite end of the crystal where it is detected by the IR spectrometer. The depth of
penetration for ATR is a function of the wavelength, refractive index of the crystal being used
and the beam angle. Advantages of ATR are minimal sample preparation, it is easy to clean
and samples can be analysed in their natural state (Perkin Elmer, 2004).
FTIR spectra were recorded on a PerkinElmer Spectrum 100 fitted with a horizontal
attenuated total reflectance cell (HATR) (Figure 3.4) or a conventional ATR cell. The
reported spectra represent the average of 32 scans recorded at a resolution of 4 cm1
. The
HATR crystal is zinc selenide, which is resistant to water, and many acids and alkalis. It is
easy to clean and thus ideal to use with oil samples. Zinc selenide has a refractive index
similar to that of a diamond.

Chapter 3 Page 71
Figure 3.4: HATR sampling accessory used with the Perkin Elmer Spectrum 100
3.4.3. 1H NMR spectroscopy
Nuclear magnetic resonance (NMR) spectroscopy is the characteristic adsorption of energy
by certain nuclei with a net spin in a strong magnetic field (Willard et al., 1988). The nuclei
of certain isotopes possess an intrinsic spin because they contain an uneven number of
protons and neutrons. A magnetic moment is generated by the spin of these charged particles.
If placed in an external magnetic field, the nuclei’s magnetic moment can align with or
against the field. For nuclei exhibiting half spin, the alignment with the field is more stable
and energy must be absorbed by the nucleus to ―flip‖ the nucleus over to a less stable
alignment against the field (Morrison and Boyd, 1987). The amount of energy required to
cause a particular nucleus to realign depends upon such factors as nucleus type, magnetic
field strength, and the configuration of the electronic cloud around a particular nucleus. The
energies required to flip a nucleus depends on the strength of the external magnetic field used
and falls in the radio frequency range.
By irradiating a sample of nuclei with different electronic environments using a short
pulse of radio frequency radiation, the nuclei can be made to flip to a higher energy
alignment state. As these nuclei relax back to their stable flip state, they may emit radio
frequency radiation characteristic of the nucleus type and its accompanying electronic
environment. The characteristic emitted frequencies are recorded by the spectrometer
instrument and form the basis of an NMR spectrum. The magnetic field strength of a
spectrometer is fixed and changes in characteristic frequencies are usually only due to the
changes in the electronic environment of the nuclei. The electronic environment is a function
of the chemical environment and the NMR spectrum provides a qualitative and a quantitative

Chapter 3 Page 72
measure of which chemical environments are present, in other words which functional groups
and which types of chemical bonds. Protons such as the 1H isotope and the carbon 13C
isotope are the most common types of nuclei studied for organic molecules. Structural
information regarding the skeletal arrangement of the molecule may be obtained from NMR.
The characteristic frequencies are made instrument variant by normalising them against the
characteristic frequencies of a standard compound. The normalised frequencies are called
chemical shifts and for 1H and 13C NMR spectroscopy they are normalised against
tetramethylsilane (TMS). Chemical shifts are reported in ppm.
Gelbard et al. (Gelbard et al., 1995), Tariq et al. (Tariq et al., 2011) and Knothe
(Knothe, 2000) used 1H NMR spectroscopy to monitor the progress of transesterification.
This technique allows the quantification of the various methyl esters present, and therefore
the yield of the reaction, without requiring derivatisation of the samples. The methyl ester
yield is obtained from the integrated values for the protons for the methyl ester moiety at
3.7 ppm and the -carbonyl methylene group at 2.3 ppm. Tariq et al. (Tariq et al., 2011)
characterised rocket seed oil biodiesel with 1H NMR spectroscopy. The singlet at 3.65 ppm
and the triplet at 2.26 ppm are characteristic for the methoxy and the -CH2 protons
respectively. These distinctive peaks confirm the presence of methyl esters in the biodiesel.
Glyceryl related signals are located at 4.1 to 4.4 ppm (Gelbard et al., 1995).
Equation 9 can be used to quantify the yield of transesterification (Tariq et al., 2011,
Gelbard et al., 1995, Naureen et al., 2015).
(9)
where,
C = the conversion of triglycerides to the corresponding methyl esters in percent
AMe = the integration value of the methoxy protons of the methyl esters
ACH2 = the integration value of -methylene protons
The 1H NMR spectra were recorded on a 400 MHz Bruker AVANCEIII NMR
spectrometer at room temperature (20 °C). Tetramethylsilane (TMS) was used as standard.
The chemical shifts are reported in ppm. The samples (30 mg) were dissolved in CDCl3
purchased from Sigma-Aldrich.

Chapter 3 Page 73
3.4.4. Viscosity and density
Viscosity is an important biodiesel quality parameter. Viscosity is a measure of internal
resistance to flow of a fluid and it varies considerably with temperature. Two methods for
measuring viscosity are available, namely dynamic (absolute) viscosity and kinematic
viscosity.
Dynamic viscosity is defined as the fluid sample’s resistance to flow when subjected
to a shear stress and the SI unit is the Pas. However, in commercial practice the unit
of centipoise (1 cP = mPas) is still encountered.
Kinematic viscosity is equivalent to the dynamic viscosity divided by the fluid
density. Kinematic viscosity is reported in centistoke units (cSt). Thus 1 cSt =
1 mm2s
1.
Viscosity and density measurements were carried out using an automated Anton Paar
SVM 3000 rotational Stabinger viscometer. The Stabinger viscometer consists of two
concentric cylinders. The outer cylinder is a tube that rotates at constant speed in a
temperature-controlled housing. This tube is filled with the sample. The internal cylinder is a
measuring rotor with a built in magnet that floats in the sample liquid by hydrodynamic
lubrication effects and centrifugal forces. This way bearing friction forces is avoided. Peltier
elements allow for stable temperature control over a wide range. The density of the fluid
sample must be known to calculate the kinematic viscosity from the measured dynamic
viscosity. In the SVM 3000 (Figure 3.5) the density cell is integrated which means that the
density measurements does not have to be carried out separately. Both the viscosity and
density cells are filled in one cycle and the measurements are carried out simultaneously. The
instrument measures the dynamic viscosity and the density. Kinematic viscosity is then
calculated from these values. Thus, in one cycle for a single sample, results are obtained for
the dynamic and kinematic viscosity as well as the density.
The viscosity and density measurements were performed at atmospheric pressure at
15 and 40 °C. The measurements required only 5 mL sample. Between measurements the
viscometer was rinsed three times with hexane (Sigma-Aldrich). After the hexane rinse air
was passed through the cell to make sure it was clean and dry before each measurement.
Viscosity measurements were done at a single temperature of 25 °C for monitoring the effect
of mixing on the transesterification process.

Chapter 3 Page 74
Figure 3.5: Anton Paar SVM 3000 rotational Stabinger viscometer
3.4.5. Thin layer chromatography: TLC
Thin layer chromatography (TLC) is used to separate mixtures into their components. It is
often used to monitor the progress of an organic reaction. The TLC method involves a
stationary phase, usually a thin uniform layer of silica or alumina coated onto a piece of glass,
metal or even rigid plastic. The mobile phase is a suitable liquid solvent or a mixture of
solvents. A pencil line is drawn on the plate near the bottom of the plate approximately
2.5 cm from the edge to ensure that the solvent line is below the line with the sample spot on
it. A small drop of the solution or mixture is placed on the line using a small glass capillary.
When the spot is dry, the plate is inserted in a beaker containing the mobile phase with the
spot at the bottom. The beaker is covered to ensure that the atmosphere in the beaker is
saturated with solvent vapour and to prevent solvent from evaporating as it rises up the plate.
As the solvent (mobile phase) travels up the plate (stationary phase) the different components
of the mixture travel at different rates and the mixture is separated into the different
compounds.
The rate of separation for a mixture is unique for a particular combination of solvent
and stationary phase. The solvent is allowed to rise until it almost reaches the top of the plate
to give maximum separation. Measurements are often taken from the plate in order to help
identify the compounds present. Rf values (retention factor) are calculated from the distance
traveled by the mixture component divided by the distance traveled by the solvent. The
stationary phase may have a substance added to it which will fluoresce when exposed to UV
light. If not, it is possible to react the spots with a solution to make them visible. The plate
must, however be dried before it is sprayed with this solution.
Rodrigues et al. (2009) used silica-gel TLC to confirm the conversion of vegetable
oils into ethyl esters. For their analyses on thin layer plates they used hexane, ethyl ether and

Chapter 3 Page 75
acetic acid in a ratio of respectively 80:20:2 (v/v) as mobile phase. Detection was achieved by
spraying the plate with a 5% ethanolic phosphomolybdic acid solution followed by heating
the plate for 10 min. The results showed the positions of ethyl esters, triglycerides, di- and
monoglycerides. According to Wall (Wall 2000), thin layer chromatography is one of the
simplest and most widely used techniques in the analysis of lipids. This method proved to be
a practical method for distinguishing between lipid classes. They used as mobile phase n-
hexane, diethyl ether and acetic acid in a ratio of 70:30:1 v/v. The triacylglycerides, being the
least polar, also exhibited the least retention time and migrated well with the solvent front,
closely followed by the fatty acids. Diglycerides migrated much more slowly and
monoglycerides showed minimal movement from the origin. Jurriens et al. (Jurriens et al.,
1964) also used TLC for the quantitative analysis of mixtures of glycerides. Their results
demonstrated that glycerides can be accurately estimated by means of TLC.
TLC was used to monitor the transesterification reaction of sunflower biodiesel. The
plates used were silica gel on TLC foils from Sigma-Aldrich. Two solvent mixtures were
used: The first mixture, hexane (Sigma-Aldrich): ethyl acetate (Sigma-Aldrich): acetic acid
anhydride (Merck) in ratio of 90:9:1 v/v and the second mixture, hexane (Sigma-Aldrich),
diethyl ether (Sigma-Aldrich) and acetic acid (Merck) in the ratio of 70:30:1 v/v. The
detection solution used was a solution of 25% sulfuric acid (Merck) in ethanol (Merck).
3.4.6. Additional characterization methods
The following biodiesel physical properties were determined, using standard procedures, by
Bio Services CC, Randburg, South Africa. These properties included acid value, iodine value,
water content, methanol content, flash point and free and total glycerine.
Acid value is a measure of the amount of carboxylic acid and free fatty acids contained in the
fuel sample. It is expressed in mg KOH required to neutralise 1 g of biodiesel. The prescribed
test methods for acid value according to the biodiesel specifications are EN14104 (BS EN
14104, 2003) and ASTM D 664 (ASTM D664, 2004).
Acid value was determined using a manual titration method similar to the one
described in AOCS Te 1a-64 (2009). Ethanol was neutralised by titration with sodium
hydroxide or potassium hydroxide to a faint pink colour using phenolphthalein as indicator
before it is used. A known amount of sample is dissolved in the hot neutral ethanol and is
titrated with a solution of potassium hydroxide with a known concentration. The titration

Chapter 3 Page 76
endpoint was determined using phenolphthalein as indicator until a faint but permanent pink
colour persists for 30 seconds. Equation 10 was used to calculate the acid value.
(10)
where,
M = molarity of the alcoholic KOH, which is 0.1 and,
V = volume of titrant, mL
W = mass of test portion, g
The molecular weight of KOH = 56.1
Iodine value or number is a measure for the number of double bonds in a sample. It specifies
the amount of iodine in g that is consumed by 100 g of the biodiesel sample under the given
conditions. The prescribed test methods for acid value according to the biodiesel
specifications are EN14111 (EN 14111, 2003) and ASTM D5768-02 (2014). The ASTM
D5768 and AOCS Cd 1-25 (1989) methods describe the Wijs procedure for determination of
the iodine value. The test measures the unsaturation as iodine value by addition of an iodine
or chlorine reagent. The amount of reagent absorbed is determined by back titration of the
excess reagent and comparing it to a blank.
The sample must be accurately weighted and must be such that there will be an excess
of Wijs solution of 100 to 150% over the amount absorbed. The method includes a table as a
guide to the size of sample to weight. The sample is weighed into a flask and dissolved in
chloroform (Labchem). Wijs solution (Labchem) is added to the sample and into each of at
least two additional flasks to be titrated as blanks. The flasks is stoppered and stored in a dark
place for 30 min at 25 °C. After removing the flask from storage, potassium iodide (KI)
solution (Labchem) is added to the sample followed by water. The sample is titrated with a
sodium thiosulfate solution (Na2S2O3) solution which is added gradually and with constant
and vigorous shaking until the yellow colour almost disappears. A starch indicator (Labchem)
is added to the solution and the titration is continued until the blue colour just disappears.
The calculation for iodine value is:
(11)
where,
B = Na2S2O3 solution required for titration of blank

Chapter 3 Page 77
S = Na2S2O3 solution required for titration of sample
N = Normality of Na2S2O3 solution
W = mass of sample, g
Water content was measured by Karl Fischer Titration. The standard followed was ASTM
D4928-12 (2012), the standard test method for water in crude oils by coulometry. Test
specimens were homogenised before injection into the titration cell of a Karl Fischer
apparatus. The iodine required for the Karl Fischer reaction is generated coulometrically at
the anode. The titration is based on the stoichiometry of the reaction where one mole of
iodine reacts with one mole of water. In this way the quantity of water is determined. When
all the water has been consumed, the excess iodine is detected by an electrometric endpoint
detector. The precision of the test is critically dependent on the effectiveness of the
homogenization step. In the procedure, a weighted test specimen is injected into the titration
cell and the wt.% of water is determined. A number of substances and classes of compounds
associated with condensation or oxidation-reduction reactions can interfere in the
determination of water by Karl Fischer, for example the double bonds in biodiesel.
A Rudolf Karl Fischer apparatus was used (Figure 3.6). It is an American brand that
used to be called Orion. The reagent was Hydranal Composite 5 (Sigma-Aldrich) and the
solvent methanol HPLC grade (Fischer Chemicals).
The mass % water was calculated using Equation 12:
(12)
where,
W1 = mass of water titrated, µg
W2 = mass of sample used, µg
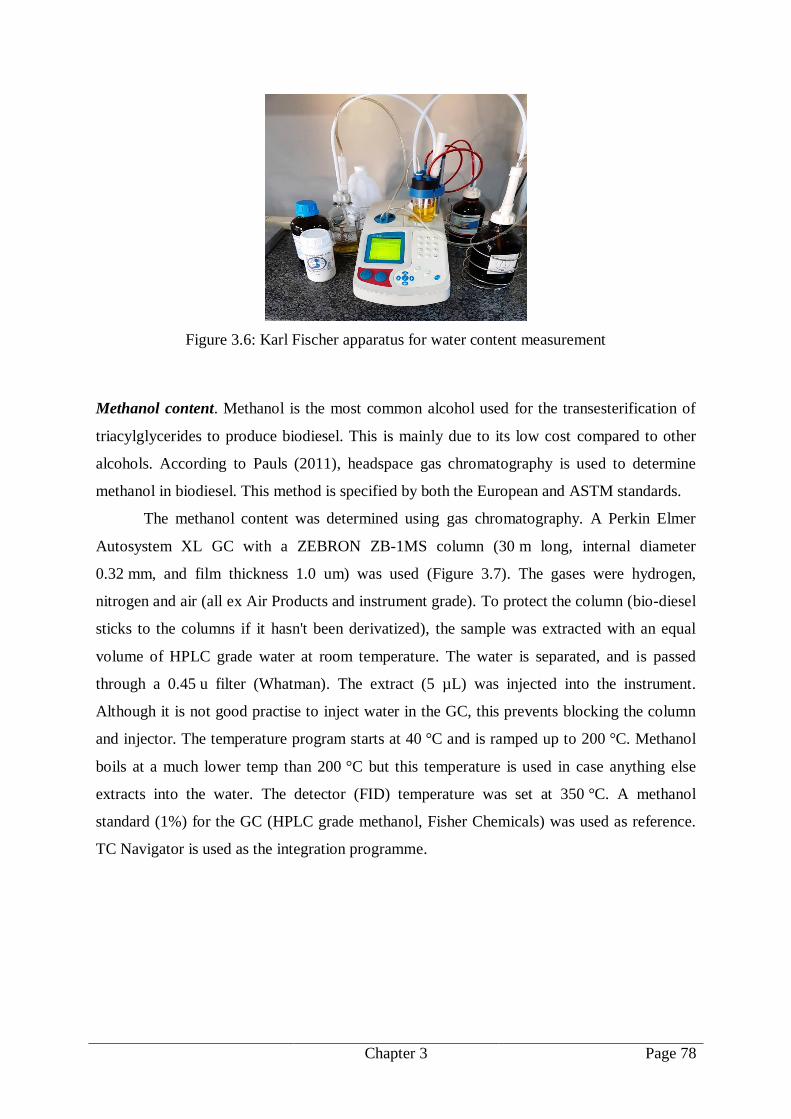
Chapter 3 Page 78
Figure 3.6: Karl Fischer apparatus for water content measurement
Methanol content. Methanol is the most common alcohol used for the transesterification of
triacylglycerides to produce biodiesel. This is mainly due to its low cost compared to other
alcohols. According to Pauls (2011), headspace gas chromatography is used to determine
methanol in biodiesel. This method is specified by both the European and ASTM standards.
The methanol content was determined using gas chromatography. A Perkin Elmer
Autosystem XL GC with a ZEBRON ZB-1MS column (30 m long, internal diameter
0.32 mm, and film thickness 1.0 um) was used (Figure 3.7). The gases were hydrogen,
nitrogen and air (all ex Air Products and instrument grade). To protect the column (bio-diesel
sticks to the columns if it hasn't been derivatized), the sample was extracted with an equal
volume of HPLC grade water at room temperature. The water is separated, and is passed
through a 0.45 u filter (Whatman). The extract (5 µL) was injected into the instrument.
Although it is not good practise to inject water in the GC, this prevents blocking the column
and injector. The temperature program starts at 40 °C and is ramped up to 200 °C. Methanol
boils at a much lower temp than 200 °C but this temperature is used in case anything else
extracts into the water. The detector (FID) temperature was set at 350 °C. A methanol
standard (1%) for the GC (HPLC grade methanol, Fisher Chemicals) was used as reference.
TC Navigator is used as the integration programme.

Chapter 3 Page 79
Figure 3.7: GC instrument used for determination of methanol content
Flash point is used to define the flammability of a liquid. It is also used to classify liquids
according to their flammability by governmental regulatory agencies. Flash point may also be
used to determine the presence of impurities or contaminants in a given liquid, such as the
presence of residual solvents, for example methanol in biodiesel. The flash point was
determined using method ASTM D3828-16a (2016). The test method covers a procedure for
determining whether a material does or does not flash at a specified temperature. The method
also determines the lowest finite temperature at which a material does flash when using a
small scale closed cup.
The sample is introduced by means of a syringe, 2 mL through a leak-proof entry
port into the tightly closed small scale closed-cup apparatus or directly into the cup that has
been brought to the required test temperature. For the flash/no flash test, the expected flash
point temperature may be a specification or other operating requirement. After 1 min, a test
flame is applied inside the cup. It is noted whether or not the test specimen flashes. A fresh
specimen must be used if a repeat test is necessary. For a finite flash point measurement, the
temperature is sequentially increased through the expected range by applying the test flame at
5 °C intervals until a flash is observed. A fresh specimen is used to make a true
determination, starting the test at the temperature of the last interval before the flash point of
the material. Tests are done at increasing 0.5 °C intervals.
A Setaflash Series 3 closed cup Flash point tester was used (Figure 3.8). Small scale
flash point testers operate using gas or electric ignition and are very easy and reliable to use.
Small sample volumes of 2 to 4 mL allow rapid and very safe sample handling.

Chapter 3 Page 80
Figure 3.8: Setaflash Series 3 closed cup flash point tester
Free and total glycerine. The preferred test methods for free and total glycerine in biodiesel
are EN 14105 (EN 14105, 2011) and ASTM D 6584 (ASTM D6584, 2000). The ASTM
method provides for the quantitative determination of free and total glycerine in methyl esters
using gas chromatography. GC is widely used for biodiesel analysis due to its generally
higher accuracy in quantifying minor components. However, the accuracy of GC can be
influenced by factors such as baseline drift and signal overlapping (Knothe, 2001). According
to Pauls (Pauls, 2011) the ASTM method is based upon high temperature silylation GC. The
total glycerol content is the sum of the free glycerol and the bound glycerol content, which is
the glycerol content of the mono- di- and triglycerides. The silylation reagent used is N-
methyl-N–(trimethylsilyl)trifluoroacetamide (MSTFA). The internal standard for the glycerol
is 1,2,4-butanetriol and for the acylglycerols it is 1,2,3–tridecanolylglycerol. Care must be
taken in assigning peaks due to potential overlaps.
There are however several wet chemical AOCS methods for determining glycerol
which do not require expensive equipment (GC and columns) and standards. The AOCS
method Ca 14-56 (AOCS Ca 14-56, 1989) for total, free and combined glycerol, an
iodometric-periodic acid method was used. This method determines the total, free and
combined glycerol in fats and oils. The total glycerol is determined after saponification of the
sample, the free glycerol directly on the sample as taken and the combined glycerol by
difference. According to Pisarello et al. (Pisarello et al., 2010) the method involves the
saponification of the sample with an alcoholic solution of KOH. This is followed by addition
of chloroform and acetic acid. After separation and washing, periodic acid is added first and
then a KI solution, followed by iodine titration with sodium thiosulfate together with a starch

Chapter 3 Page 81
indicator. This method does not require any complicated equipment, but it implies the
handling of several harmful substances and it includes many chemical steps. This method is
suitable for the determination of total and free glycerine at low levels with high precision.
The chemicals used by Bioservices for the determination of free and total glycerol were from
Labchem.
3.5. Oxidation Stability
3.5.1. Antioxidants
The effect of three different types of antioxidants was investigated for the stabilisation of
sunflower biodiesel. The antioxidants were added to the biodiesel at a total loading of
0.15 wt.%. Both binary as well as a ternary blends of these antioxidants were tested. The
effect on oxidation stability was also investigated by additional phenolic antioxidants alone
and in blends with Orox PK. Table 3.1 lists the three main antioxidants used as well as the
additional phenolic antioxidants.
3.5.2. Antioxidant formulations with biodiesel
The antioxidants, Orox PK, Naugard P and Anox 20 were added to the biodiesel at a total
loading of 0.15 wt.%. The different binary as well as ternary blends are prepared by mixing
the three antioxidants at weight ratios (Table 3.2). Both binary as well as a ternary blends of
these antioxidants were tested. Figure 3.9 shows the sunflower biodiesel spiked with the
different antioxidants.
Figure 3.9: From left sunflower oil, sunflower biodiesel, and sunflower biodiesel spiked with
different antioxidants
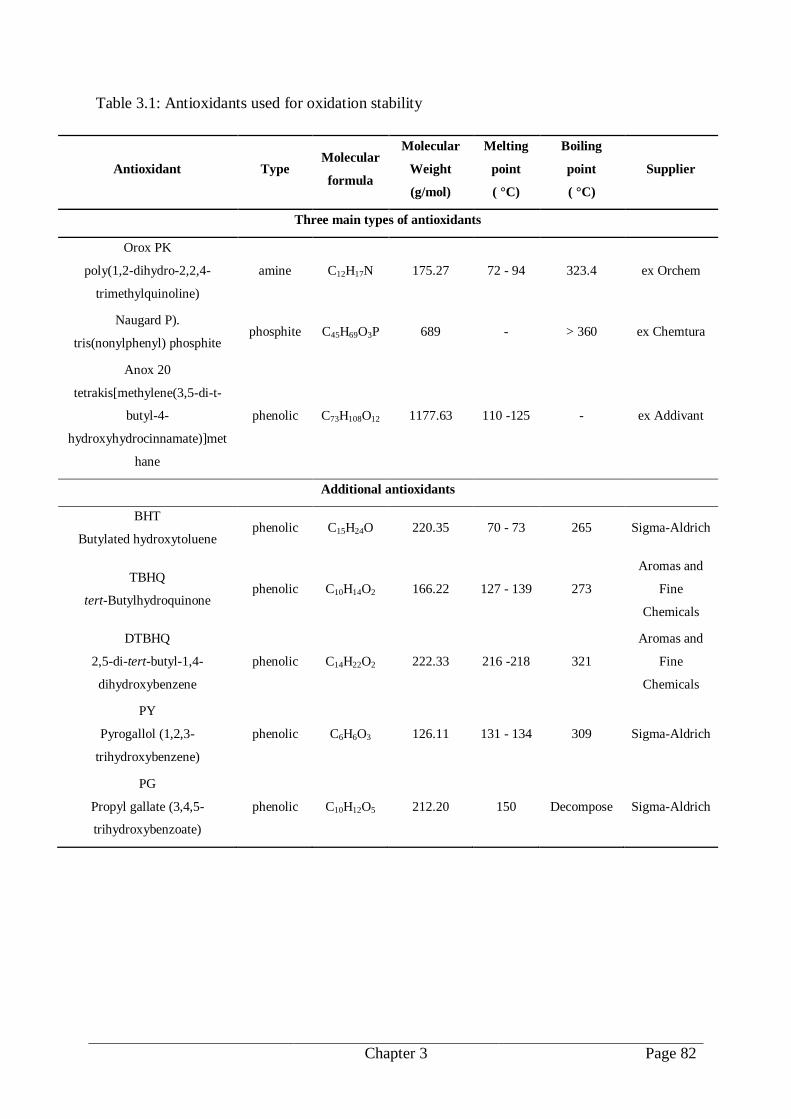
Chapter 3 Page 82
Table 3.1: Antioxidants used for oxidation stability
Antioxidant Type Molecular
formula
Molecular
Weight
(g/mol)
Melting
point
( °C)
Boiling
point
( °C)
Supplier
Three main types of antioxidants
Orox PK
poly(1,2-dihydro-2,2,4-
trimethylquinoline)
amine C12H17N 175.27 72 - 94 323.4 ex Orchem
Naugard P).
tris(nonylphenyl) phosphite phosphite C45H69O3P 689 - > 360 ex Chemtura
Anox 20
tetrakis[methylene(3,5-di-t-
butyl-4-
hydroxyhydrocinnamate)]met
hane
phenolic C73H108O12 1177.63 110 -125 - ex Addivant
Additional antioxidants
BHT
Butylated hydroxytoluene phenolic C15H24O 220.35 70 - 73 265 Sigma-Aldrich
TBHQ
tert-Butylhydroquinone phenolic C10H14O2 166.22 127 - 139 273
Aromas and
Fine
Chemicals
DTBHQ
2,5-di-tert-butyl-1,4-
dihydroxybenzene
phenolic C14H22O2 222.33 216 -218 321
Aromas and
Fine
Chemicals
PY
Pyrogallol (1,2,3-
trihydroxybenzene)
phenolic C6H6O3 126.11 131 - 134 309 Sigma-Aldrich
PG
Propyl gallate (3,4,5-
trihydroxybenzoate)
phenolic C10H12O5 212.20 150 Decompose Sigma-Aldrich

Chapter 3 Page 83
Table 3.2: Antioxidant weight fraction for the three main types of antioxidants
Antioxidant weight fractions
Orox PK Naugard P Anox 20
1.000 0.000 0.000
0.667 0.333 0.000
0.500 0.500 0.000
0.333 0.667 0.000
0.000 1.000 0.000
0.000 0.667 0.333
0.000 0.500 0.500
0.000 0.333 0.667
0.000 0.000 1.000
0.333 0.000 0.667
0.500 0.000 0.500
0.333 0.333 0.333
Combinations of Orox PK with several other phenolic antioxidants, at a mass ratio of
1:2 were also tested. The additional phenolic antioxidants are listed in Table 3.3. The total
antioxidant concentration was kept constant at 0.15 wt.%.
Table 3.3: Antioxidant weight fractions for combinations of Orox PK with additional
phenolic type antioxidants
Antioxidant weight fractions
Orox PK BHT TBHQ DTBHQ PY PG
0.333 0.667
0.333 0.667
0.333 0.667
0.333 0.667
0.333 0.667

Chapter 3 Page 84
3.5.3. Rancimat oxidation test
The Rancimat method (BS EN 14112, 2003) involves aging the biodiesel at an elevated
temperature whilst passing air through it at a constant rate. The hydroperoxides formed due to
oxidation react further to form volatile acids, mainly formic acid and acetic acid. These
volatile acids are transported via the stream of air into a measuring cell filled with distilled
water whose conductivity is constantly monitored. Thus, the formation of organic acids can
be detected by increases in the electrical conductivity. The induction time is indicative of the
potential shelf life of a product. The induction period (IP) is evaluated by the automated
Rancimat software which calculates the maximum second derivative of conductivity with
respect to time.
The oxidation stability of the biodiesel antioxidant blends was determined using a Metrohm
895 Professional PVC thermomat (Figure 3.10). It was set up with the required accessories
to analyse biodiesel according to the EN14112 (BS EN 14112, 2003) method. A 3.00 g
biodiesel sample was transferred into the reaction vessel and placed in the cellblock (Figure
3.11). The temperature was set at 110 °C and held constant. Air, at atmospheric pressure, was
allowed to flow at 10 Lh1
through the measuring vessel containing 60 mL of deionised
water. The increase in conductivity was measured as a function of time and the induction
time determined using the instrument software. Duplicate measurements of the induction
times were carried out for each sample. The Metrohm StabNet software derives the induction
time automatically from the maximum of the second derivative of the conductivity versus
time plot (Figure 3.12).
Figure 3.10: Metrohm 895 Professional PVC Thermomat

Chapter 3 Page 85
Figure 3.11: Schematic of Rancimat instrument, heating block, reaction vessel and
measurement cell (image obtained from Metrohm)
Figure 3.12: Conductivity versus time plot (image obtained from Metrohm)

Chapter 3 Page 86
3.6. Data reduction
The data produced by the Rancimat instrument corresponds to the initial part of the oxidation
reaction. The induction time values were extracted from the experimental conductivity vs.
time data generated by the Rancimat instrument as follows (Focke et al., 2016):
It was assumed that the conductivity vs. time curves ( = (t)) could be represented
by Equation 13:
(13)
where (t) is the experimental conductivity vs. time curve; min is the conductivity offset at
time t = 0; m is the slope of the initial portion of the conductivity curve; is a proportionality
constant and F(t) is an appropriate response function.
The parameter m in Equation 13 compensates for any linear signal drift over the full
measurement time. The response function F(t) should be able to adequately represent the
experimental data over the full measurement range. Inspection showed that the following
empirical expression (Equation 14) was adequate for the present data sets:
[ ⁄ ] (14)
where t is the time in h, ―log‖ represents the natural logarithm while and are adjustable
model parameters. The parameter is a dimensionless shape factor while is a characteristic
time constant for the response function and therefore has units of time. The adjustable
parameters that characterise the analytic expression for F(t) and the values of both m and min
were determined by least square fits of Equation 14 to the experimental data for conductivity
vs. time.
Figure 3.13 graphically illustrates how the induction periods (IPT and IPD) were
determined from the fitted response curves. The experimental conductivity vs. time curves
(insert in (a)) were fitted to the response function F(t) defined by Equation 13. The parameter
values were determined from the experimental data using least square fits. The IP values
were directly determined from the sigmoidal response curves parameters based on two
different methods: (a) The first approach is based on the assumption that the IP corresponds
to the intersection of the tangent line drawn to the inflection point of F(t) with the time axis.
(b) The second methodology associates the IP with the position of the maximum in the
second derivative of F(t) (i.e. F´´(t)).

Chapter 3 Page 87
Figure 3.13: Schematic illustration of the data reduction methods used
The ―manual method‖ (IPT) described in EN14112 (BS EN 14112, 2003) corresponds
to the intersection of the tangent line, drawn to the inflection point of the normalized response
curve, with the time axis (Fearon et al., 2004) as shown in Figure 3.13 (a). This leads to the
following expression (Equation 15) for the induction time in terms of the model parameters:
⁄ [ ⁄ ] (15)
The ―automatic instrument‖ procedure (IPD) mentioned in EN14112 (BS EN 14112,
2003) is established by finding the position of the maximum in the second derivative of the
fitted F(t) curve, that is F”(t) as illustrated in Figure 3.13 (b). The induction time
corresponding to this second methodology is given by Equation 16:
* ⁄ ( ( √
) )+ ⁄
(16)
The experimental Rancimat IPR values were obtained by the instrument software in a
similar fashion. The only difference is that in this case the second derivative was directly
obtained from the raw numerical data. However, it is quite clear that the Stabnet software has
some (unknown) data smoothing procedures in operation.
It was assumed that the Rancimat instrument generated ―true‖ induction time values
(IPR). These values are, in effect, based on a single data point corresponding to the condition

Chapter 3 Page 88
where the second derivative attained a maximum value. In contrast, the IPD and IPT are
global values as they are based on all the available experimental data points. Therefore, they
were directly determined from the adjustable parameters, and , of the analytical
expression for F(t) used to model the data trends. Those, in turn were determined by fitting
the dose-response curve considering all the available experimental data points. The relevant
response function derivatives, and the corresponding expressions for the parameters required
to evaluate the induction periods, are listed in Table 3.4
Table 3.4: Analytical expressions for the response function, its derivatives and some of its
properties
Response function expressions
[ ⁄ ]
⁄ { [ ⁄ ]}⁄
⁄ [ ⁄ ] { [ ⁄ ]}
⁄
⁄ [ ⁄ ⁄ ] { [ ⁄ ]}
⁄
Parameter Expression
Response function inflection point ⁄
Slope at inflection point ⁄ ⁄
Tangent line abscissa intercept (defines IPT) ⁄ [ ⁄ ]
Position of the maximum in the second
derivative curve (defines IPD)
* ⁄ ( ( √ ) )+ ⁄

Chapter 4 Page 89
Chapter 4: Results and Discussion
4.1. Effect of Reaction Time on Transesterification of Sunflower Biodiesel
When trial batches were prepared at ambient temperature (25°C) and 15 minutes mixing
time, biodiesel with a FAME content of 94 to 96 wt.% was obtained. By shaking the oil and
methanol sample vigorously the mass transfer resistance was reduced. However it seems that
the reaction continued during the settling reaction and not only during the vigorous mixing
period. This was established by comparing a batch prepared according to the procedure set
out in 3.3.3 (SET02) to one that was stopped after an elapsed time (SET01).
The two batches were labelled SET 01 (where the reaction was halted after the elapsed
mixing time by adding acetic acid) and SET 02 (where the reaction was stopped after the
elapsed mixing time but it was not halted by the addition of acetic acid). The effect of
reaction time (with mixing) on the two experimental sets of biodiesel batches was monitored
by using GC-FID, 1H NMR, viscosity measurements, TLC and FTIR.
4.1.1. GC-FID and 1H NMR
Both GC-FID and 1H NMR methods were used to monitor the degree of conversion of
sunflower oil to biodiesel. After the specified mixing time, the ester content of each sample
was calculated. According to Knothe (2000) the GC method is recommended in the standard
specification for determining the ester content. It is however not without problems, for
example overheating of the column beyond its recommended temperature limit (370 instead
of 350 °C) or to very high heating rates. Baseline drift does occur and this can compromise
quantification. Repeated use at high temperatures can also cause column bleed. Because of
the potential problems that can occur with the GC-FID method, Knothe also used 1H NMR to
calculate ester content. He used integration to determine values for the glyceridic and methyl
ester protons as discussed in more detail in Section 3.4.3. However, for both these methods,
accuracy of peak area integration is important. The results for ester content obtained with
GC-FID and 1H NMR are presented in Table 4.1 and Figure 4.1
The results obtained from the GC-FID correlates with that from 1H NMR. It also
shows that for SET 02, where the reaction was not halted, the ester content reached values of
90% and more after only 1 min of vigorous mixing.

Chapter 4 Page 90
Table 4.1: The effect of mixing time on ester conversion using data from GC-FID
and 1H NMR
Mixing time
(min)
GC-FID results (wt.%) 1H NMR (%)
SET 01 SET 02 SET 01 SET 02
1 46.3 90.2 46.9 93.7
3 73.6 92.8 73.3 95.2
5 73.8 92.4 79.5 95.7
10 85.1 91.7 86.2 95.7
15 88.0 91.0 88.8 95.4
20 89.2 93.4 90.1 95.4
30 90.1 93.9 91.8 95.3
40 91.1 93.2 93.5 96.2
50 94.1 93.7 93.8 96.2
60 94.9 95.0 95.3 96.6
Figure 4.1: Mixing effect on ester content using data from GC-FID and 1H NMR
30
40
50
60
70
80
90
100
110
0 10 20 30 40 50 60
Este
r co
nte
nt,
%
Mixing time, min
GC-FID SET 01
1H NMR SET 01
GC-FID SET 02
1H NMR SET 02

Chapter 4 Page 91
4.1.2. Viscosity measurements
The viscosity and density measurements for the two sets at 25 °C are shown in
Table 4.2 and Figure 4.2. The results represent the average of three measurements.
Table 4.2: Viscosity and density measurements
Mixing time
(min)
Dynamic viscosity
(mPas)
Kinematic viscosity
(mm2s
1)
Density
(g cm3
)
SET 01 SET 02 SET 01 SET 02 SET 01 SET 02
1 16.4 5.79 18.2 6.58 0.9009 0.8811
3 8.95 5.48 10.05 6.23 0.8902 0.8799
5 7.76 5.45 8.74 6.20 0.8874 0.8796
10 6.95 5.51 7.86 6.27 0.8850 0.8800
15 6.49 5.52 7.34 6.28 0.8834 0.8801
20 6.29 5.55 7.12 6.31 0.8828 0.8802
30 6.01 5.58 6.81 6.34 0.8819 0.8803
40 5.78 5.43 6.57 6.17 0.8810 0.8798
50 5.76 5.46 6.54 6.20 0.8808 0.8798
60 5.57 5.42 6.33 6.16 0.8803 0.8796
Figure 4.2: Kinematic viscosity measurements for SET 01 and SET 02
0
2
4
6
8
10
12
14
16
18
20
1 3 5 10 15 20 30 40 50 60
Kin
emat
ic v
isco
sity
, mm
2s
- 1
Mixing time, min
SET 01
SET 02
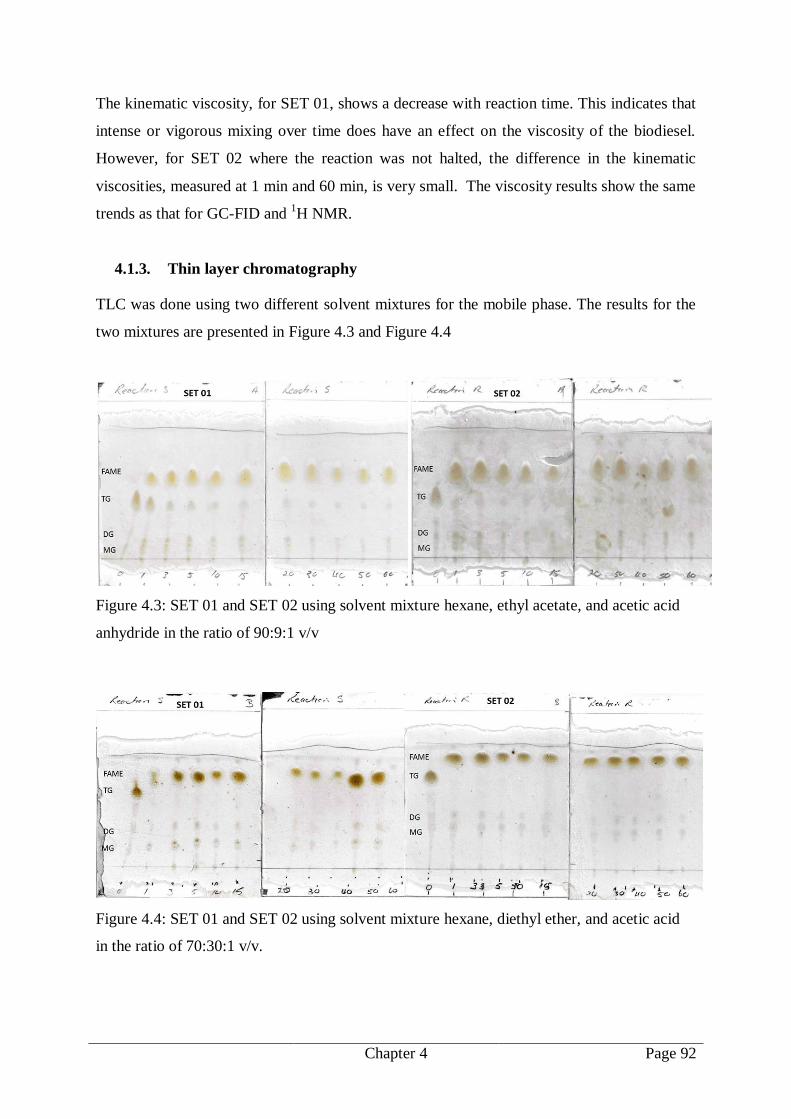
Chapter 4 Page 92
The kinematic viscosity, for SET 01, shows a decrease with reaction time. This indicates that
intense or vigorous mixing over time does have an effect on the viscosity of the biodiesel.
However, for SET 02 where the reaction was not halted, the difference in the kinematic
viscosities, measured at 1 min and 60 min, is very small. The viscosity results show the same
trends as that for GC-FID and 1H NMR.
4.1.3. Thin layer chromatography
TLC was done using two different solvent mixtures for the mobile phase. The results for the
two mixtures are presented in Figure 4.3 and Figure 4.4
Figure 4.3: SET 01 and SET 02 using solvent mixture hexane, ethyl acetate, and acetic acid
anhydride in the ratio of 90:9:1 v/v
Figure 4.4: SET 01 and SET 02 using solvent mixture hexane, diethyl ether, and acetic acid
in the ratio of 70:30:1 v/v.

Chapter 4 Page 93
From the results in Figure 4.3 and Figure 4.4 it seems possible to use TLC to monitor
the conversion of sunflower oil to biodiesel. The zero labels in the first position on the left of
the TLC plate correspond to neat sunflower oil. The numbers 1, 3, 5, 10, 15, 20, 30, 40, 50
and 60 are the mixing times in minutes. The positions of FAME, triglycerides (TG), di-
glycerides (DG) and mono-glycerides (MG) are depicted on the TLC plate. These positions
were referenced from the literature (Rodrigues et al., 2009, McGinnis and Dugan, 1965,
Fontana et al., 2009, Escobar et al., 2008) where similar results were obtained. The second
solvent mixture, hexane, diethyl ether, and acetic acid in the ratio of 70:30:1 v/v seems to
give better separation. The first solvent mixture, hexane, ethyl acetate, and acetic acid
anhydride in the ratio of 90:9:1 v/v, also gave separation, but not as clear as that of the second
mixture. This shows the importance of using an appropriate solvent blend as mobile phase.
According to Wall (Wall 2000) the inclusion of acetic or formic acid in the solvent mixture
helps to improve resolution. TLC is an inexpensive method for monitoring a chemical
reaction but it does require some knowhow, practice and experience. Although a separation
was effected, as is evident in Figures 4.3 and 4.4, it is not very clear. However, it does give a
visual representation of the ester content results shown in Figure 4.1. For that reason it is
included.
4.1.4. FTIR analysis using HATR sample accessory
Infra-red spectra in the mid-infrared region were obtained for samples SET 01 and SET 02.
The monitoring of transesterification by FTIR has been reported in the literature (Knothe,
2000, Yuan et al., 2014). In the mid infrared range the spectra for vegetable oils
(triglycerides) and their corresponding methyl ester are very similar (Knothe, 1999).
However, near-infrared spectra for the oils and corresponding methyl esters reveal two
distinguishing signals, one at 4425 – 4430 cm1
and a second one at 6005 cm1
. In both these
bands the methyl ester display peaks while the oil exhibit shoulders. Unfortunately, with the
instrument available it was not possible to obtain usable spectra in the near-infrared region.
However, the infrared spectra obtained for SET 01 differed from that of SET 02. The
differences were observed between 3100 – 3800 cm1
and 800 – 1200 cm1
as can be seen in
Figures 4.5 to 4.7. The spectra at the different mixing times for SET 01 show very distinct
shoulders for the peak at 3474 cm1
. These shoulders seem to disappear as the mixing time
increases from 1 to 60 min. These shoulders are not as noticeable for SET 02.

Chapter 4 Page 94
Figure 4.5: FTIR spectra for sample SET 01 (left) and SET 02 (right) at 550 – 4000 cm1
Figure 4.6: FTIR spectra for sample SET 01 (left) and SET 02 (right) at 3100 – 3800 cm1
Figure 4.7: FTIR spectra for sample SET 01 (left) and SET 02 (right) at 800 – 1400 cm1
The characteristic peak for glycerol at around 3307 cm1
shown in
Figure 4.8
corresponds to the peaks observed for SET 01 between 3100 and 3800 cm1
at different
mixing times (Figure 4.6). These ―shoulder‖ peaks decreases with increase in mixing time

Chapter 4 Page 95
giving an indication of the conversion of sunflower oil to biodiesel. Differences were also
observed in the region 800 – 1200 cm1
for SET 01.
Thus, to summarise, the results from GC-FID, 1H NMR, viscosity, TLC and FTIR
show that it is possible to obtain a biodiesel of acceptable quality at room temperature
provided there is sufficient mixing to overcome mass transfer limitations. The results for
SET 02, where the reaction was stopped after the elapsed mixing time, but not halted by the
addition of acetic acid, followed by a 24 h settling time, had an ester content of 90 wt.% after
only 1 min and 96 wt.% after 60 min of vigorous mixing.
According to Noureddini and Zhu (1997) an initial mass transfer controlled region
(slow) is followed by a kinetically controlled region, which is faster and finally a slow region
as equilibrium is approached. The mass transfer region is shorted with an increase in
temperature and higher mixing intensity.
The results show that the mass transfer between the oil and alcohol has a significant
effect on the rate of reaction. With vigorous shaking it was possible to obtain a FAME
content of 90 wt.% after only 1 min of mixing and 95 wt.% after just 60 min compared to the
46 wt.% after 1 min and 95 wt.% after 60 min for (SET01) that was halted. The FAME
content was the same for both the sets at 60 minutes which would indicate that the reaction
does proceed during settling for reaction times less than 60 minutes.
4.2. Biodiesel Characterisation
The total fatty acid methyl ester (FAME) content and the composition of the sunflower
biodiesel are listed in Table 4.3. Three biodiesel batches were used, they were:
Biodiesel Batch 1 (BD01) was used to study the effect of antioxidant concentration
and possible synergy on the induction time (IP). As sample BD01 became depleted,
new batches were prepared.
Biodiesel Batch 2 (BD02) was used to study the effect of temperature while
Biodiesel Batch 3 (BD03) was used for the additional combinations of the amine with
other phenol-type antioxidants.
Sample BD01 met the EN 14214 specifications including the requirement that the ester
content should not be lower than 96.5%. This was not the case for the other biodiesel
samples, BD02 and BD03. Note that the ester content for sample BD03 was determined using

Chapter 4 Page 96
a different GC-FID instrument and column. The properties of the biodiesel samples used in
this study are shown in Table 4.3 Table 4.4, and Table 4.5.
Biodiesel Batch BD01 and BD02 had similar methyl ester composition. The methyl
ester composition for batch BD03 show a lower value for methyl oleate, C18:1 compared to
the other two batches. It also shows a higher value for methyl linoleate, C18:2. The ester
content (wt.%) and composition reported is an average of two determinations.
Table 4.3: Ester content and FAME composition of biodiesel samples
Property Units BD01 BD02 BD03
FAME (ester content) wt.% 98.3 92.5 94.8
FAME composition: (%) wt.%
Methyl palmitate, C16:0 6.73 6.29 5.82
Methyl stearate, C18:0 6.63 6.45 7.17
Methyl oleate, C18:1 22.4 21.8 16.5
Methyl linoleate, C18:2 62.0 63.0 68.2
Methyl linolenate, C18:3 0.22 0.37 0.63
Other methyl esters 2.02 2.09 1.55
Table 4.4: Density and viscosity results biodiesel samples
Property Units BD01 BD02 BD03
Density at 15 C kg m3
888 n.d. 888
Kinematic viscosity at 40 C mm2s
1 4.6 n.d. 4.59
The density and viscosity for neat sunflower oil were respectively, 923 kg m3
at 15 C and
88 mm2s
1 at 40 C.
The average molecular weight of sunflower oil was calculated as 879.16 g.mol1
. The
calculation was done according to the methods presented in Appendix B.
The FAME content was calculated from GC-FID data and 1H NMR spectra shown in
Appendix C and D respectively.

Chapter 4 Page 97
Table 4.5: Additional characterisation of biodiesel samples
Property Units BD01 BD02 BD03
Flash point C 170 170 n.d.
Water content % 0.04 0.05 0.04
Acid value mg KOH g1
0.1 0.1 0.06
Methanol content wt.% 0 0 0
Iodine value g iodine/100g 118 119 125
Free glycerol wt.% 0.01 0.02 0.02
Total glycerol wt.% 0.34 0.43 1.03
Appearance - clear clear clear
The water content for neat sunflower oil was 0.03% and the acid value
0.05 mg KOH g1
. The total glycerol values reported are higher than the 0.25 wt.% required by
the standard specification (BS EN 14214, 2012+A1:2014). The free and total glycerol was
determined using method AOCS Ca 14-56 (iodometric-periodic acid). However, the preferred
method for the determination of free and total glycerol involves chromatography (GC and
HPLC). These methods provide generally higher accuracy in quantifying minor components.
4.2.1. FTIR analysis using HATR sample accessory
The FTIR spectra for sunflower oil, sunflower biodiesel (FAME) and glycerol are presented
in Figure 4.8. The FTIR spectrum of the biodiesel featured a strong band at 1740 cm1
corresponding to the ester carbonyl functionality. The three strong bands at 1169 cm1
(ester
C-O), 1740 cm1
(ester C=O) and 2923 cm1
(aliphatic chains) are characteristic of FAME
biodiesel. According to Coates (Coates, 2000) the peak assignments are as follows: The peak
at about of 3000 cm–1
is due to the H–C= functional group; the two peaks located at ca. 2923
and 2853 cm–1
are from the –CH2– group; the 1740 cm–1
absorption is attributed to the ester
C=O stretch deformation; the two medium bands at 1195 and 1169 cm1
are associated with
the C–O bond in the ester functional group; the band at 722 cm–1
is characteristic for the long
–(CH2)n sequences in the aliphatic chains of the fatty acids. The nonexistence of the O-H
bond stretching in the range of 3640 - 3200 cm1
confirms the absence of residual water in
the biodiesel samples. The alcohol functional group (O-H bond) is either a strong, sharp
frequency band in the range of 3640 - 3610 cm1
(free hydroxyl alcohols) or a strong broad

Chapter 4 Page 98
frequency band in the range of 3500 - 3200 cm1
(H-bonded alcohols). It is evident from
Figures 4.8 and 4.9 that no alcohol functionality is present in the biodiesel. The single sharp
ester peak at 1740 cm1
, that is the absence of another band adjacent to this ester band, rules
outs the presence of carboxylic acids as they feature a strong peak at 1770 cm1
.
The spectra for the biodiesel after the Rancimat oxidation stability test shows new
bands at 1655 cm1
and 3500 cm1
owing to the formation of new oxygenated species
containing alcohol and carbonyl functionalities.
Figure 4.8: FTIR of sunflower oil and sunflower biodiesel
Figure 4.9: FTIR of sunflower biodiesel before and after Rancimat oxidation test
-0.1
0.4
0.9
1.4
1.9
60010001400180022002600300034003800
Ab
sorb
ance
Wavenumber (cm1)
Sunflower oil Sunflower FAME Glycerol
-0.05
0.45
0.95
1.45
1.95
60010001400180022002600300034003800
Ab
sorb
ance
Wavenumber (cm1)
Biodiesel before Rancimat Biodiesel after Rancimat
2853 cm1
3009 cm1
1740 cm1
1169 cm1
1435 cm1 722 cm1
1655 cm1
1195 cm1
1244 cm1
2923 cm1
1016 cm1 1458 cm1

Chapter 4 Page 99
4.3. Oxidative Induction Time
4.3.1. Oxidative induction periods from global Rancimat data analysis
Representative Rancimat conductivity vs. time curves is shown in Figure 4.10(a). The
symbols display selected experimental data points and the solid lines represent fits obtained
with the response model defined in Equation 13. The model parameters include a
characteristic time constant () while the dimensionless parameter affects the shape of the
response curve. The response functions extracted from the corresponding data sets are plotted
in Figure 4.10(b). It seems that good data fits were obtained. Induction time estimates, based
on the two different methods, were calculated using the fit parameters of these models using
the expressions listed in Table 3.4
Figure 4.10: (a) Representative Rancimat conductivity vs. time curves and (b) the
corresponding response functions extracted from raw data. A: Neat biodiesel at 120 C. B
and C: Biodiesel spiked with 0.15 wt.% Anox 20 at 100 and 90 C respectively.
The instrument IPR values, determined by the Rancimat instrument software, are
plotted against the IP values derived from the model parameters as shown in Figure 4.11. The
data used for the plots are listed in Table 4.8 and 4.9. It is evident from Figure 4.11 that the
IPT and IPD values extracted from global data fits are in good agreement with the IPR values
generated by the Rancimat software. The IPT values generated by the intersecting tangent
method apparently yielded values that were almost identical to those determined by the
Rancimat software from the raw data. Taking all the data points together, a relationship
corresponding to a direct proportionality, was found: IPR = k IPT with k = 0.995 0.038. In

Chapter 4 Page 100
contrast, the IPD values, based on the second derivative method, are slightly higher. In this
case k = 0.976 0.039. This means that the calculated IPD values were, on average, about
2.5% higher than the IPR values. The IPT values obtained via curve fitting shows good
agreement with those obtained from the instrument.
Figure 4.11: Comparing the model-based induction times to those reported by the software
installed on the Rancimat instrument. (a) IPR vs. IPT, and (b) IPR vs. IPD. A: Different Anox
20 concentrations; B: Biodiesel with 0.15 wt.% Anox at different temperatures, and C: Neat
biodiesel at different temperatures.
4.3.2. Effect of antioxidant concentration on induction time
The effect of antioxidant concentration on the experimental induction times are listed in
Table 4.6 (Orox PK), Table 4.7 (Naugard P) and Table 4.8 (Anox 20)

Chapter 4 Page 101
Table 4.6: Effect of antioxidant (Orox PK) concentration on the IP of sunflower biodiesel
C, wt.% IPR IPT IPD IPR/IPT IPR/IPD IPD/IPT
0 1.56 1.56 1.56 1.00 1.00 1.00
0 1.53 1.53 1.53 1.00 1.00 1.00
0 1.53 1.53 1.53 1.00 1.00 1.00
0.083 1.76 2.10 1.87 0.84 0.94 0.89
0.083 2.13 2.50 2.32 0.85 0.92 0.93
0.083 1.79 2.10 2.15 0.85 0.83 1.03
0.125 1.95 2.22 2.03 0.88 0.96 0.92
0.125 1.85 2.22 2.07 0.83 0.89 0.93
0.125 1.97 2.40 2.37 0.82 0.83 0.99
0.150 1.73 2.36 2.19 0.73 0.79 0.93
0.150 2.01 2.53 2.37 0.80 0.85 0.94
0.150 1.64 2.35 2.29 0.70 0.72 0.97
0.167 1.71 2.26 2.09 0.76 0.82 0.93
0.167 1.86 2.26 2.08 0.82 0.90 0.92
0.167 1.82 2.67 2.67 0.68 0.68 1.00
0.250 2.09 2.49 2.31 0.84 0.90 0.93
0.250 2.04 2.40 2.21 0.85 0.92 0.92
0.250 1.98 2.36 2.21 0.84 0.90 0.94

Chapter 4 Page 102
Table 4.7: Effect of antioxidant (Naugard P) concentration on the IP of sunflower biodiesel
C, wt.% IPR IPT IPD IPR/IPT IPR/IPD IPD/IPT
0 1.56 1.56 1.56 1.00 1.00 1.00
0 1.53 1.53 1.53 1.00 1.00 1.00
0 1.53 1.53 1.53 1.00 1.00 1.00
0.083 1.66 1.91 1.67 0.87 0.99 0.87
0.083 1.72 1.89 1.66 0.91 1.04 0.88
0.083 1.75 1.74 1.78 1.01 0.98 1.03
0.125 1.72 1.71 1.40 1.01 1.23 0.82
0.125 1.66 1.67 1.41 1.00 1.18 0.84
0.125 1.75 1.92 1.70 0.91 1.03 0.88
0.150 1.54 1.75 1.23 0.88 1.26 0.70
0.150 1.58 1.74 1.48 0.91 1.07 0.85
0.150 1.57 1.73 1.50 0.91 1.04 0.87
0.167 1.60 1.75 1.46 0.92 1.09 0.84
0.167 1.62 1.72 1.51 0.94 1.07 0.88
0.167 1.60 1.90 1.82 0.84 0.88 0.96
0.250 1.57 1.72 1.49 0.91 1.05 0.87
0.250 1.56 1.64 1.12 0.95 1.39 0.68
The IP values increase linearly with antioxidant concentration according to:
(17)
where IP and IPo are the induction times in h of the stabilised and the neat biodiesel
respectively, C is the concentration of the antioxidant in wt.% and K is a proportionality
constant. The value of this constant for the tangent-based induction time was K = 21.2 3.5
h (wt.%)1
. This means that for Biodiesel Batch BD01 with IPo = 1.56, spiked with Anox 20,
an antioxidant dosage exceeding 0.30 wt.% is required in order to conform with the 8 h
stability requirement of EN14112 (BS EN 14214, 2012+A1:2014) . However, a little more
than 0.07 wt.% will suffice to pass the 3 h ASTM D6751 (ASTM D6751-15ce1, 2016)
specification.

Chapter 4 Page 103
Table 4.8: Effect of antioxidant (Anox 20) concentration on the IP of sunflower biodiesel
C, wt.% IPR IPT IPD IPR/IPT IPR/IPD IPD/IPT
0 1.56 1.56 1.56 1.00 1.00 1.00
0 1.53 1.53 1.53 1.00 1.00 1.00
0 1.53 1.53 1.53 1.00 1.00 1.00
0.083 3.67 3.56 3.64 1.03 1.01 1.02
0.083 3.76 3.92 4.01 0.96 0.94 1.02
0.083 3.77 3.92 4.01 0.96 0.94 1.02
0.125 4.32 4.47 4.58 0.97 0.94 1.03
0.125 4.32 4.60 4.72 0.94 0.92 1.03
0.125 4.73 4.68 4.80 1.01 0.99 1.03
0.150 4.20 4.17 4.28 1.01 0.98 1.03
0.150 4.08 4.11 4.18 0.99 0.98 1.02
0.150 4.83 4.72 4.83 1.02 1.00 1.02
0.167 5.11 5.23 5.37 0.98 0.95 1.03
0.167 5.19 5.29 5.42 0.98 0.96 1.03
0.167 5.42 5.45 5.58 1.00 0.97 1.02
0.250 5.56 5.50 5.64 1.01 0.99 1.03
0.250 6.92 6.48 6.65 1.07 1.04 1.03
0.250 6.49 6.35 6.50 1.02 1.00 1.02
Figure 4.12 shows a plot of the induction time IPT vs. the concentration of the
antioxidants Orox Pk, Naugard P and Anox 20.

Chapter 4 Page 104
Figure 4.12: The effect of antioxidant concentration on the induction time.
4.3.3. Effect of measurement temperature on induction time
The effect of measurement temperature on the induction time for neat Biodiesel Batch BD02
and a sample spiked with 0.15 wt.% antioxidant (Anox 20) is given in Table 4.9 and Figure
4.13
The IPT values for both the neat and spiked fluids followed the Arrhenius temperature
dependence:
[ ⁄ ] (18)
where IP(T) is the induction time in h, at temperature T in K; AT is the pre-exponential factor
with units of h; EA is the activation energy in J mol1
K1
, and R is the gas constant
(approximately 8.3145 J mol1
K1
). The activation energies for the neat biodiesel and the
stabilised sample were calculated as 79 and 101 kJ mol1
K1
, respectively. This means that
the stabilising effect of the antioxidant diminishes with increasing temperature. This is also
evident from the plots in Figure 4.13. Xin et al. (Xin et al., 2009) found in a study on propyl
gallate stabilised safflower biodiesel, that the Rancimat IP values obey Arrhenius-like
temperature dependence. They observed activation energy of 97 kJ mol1
K1
is similar to
that for Anox 20 stabilised sunflower biodiesel.

Chapter 4 Page 105
Table 4.9: Effect of measurement temperature on the induction period of neat sunflower
biodiesel and a sample spiked with 0.15 wt.% Anox 20 antioxidant
T, °C IPR IPT IPD IPR/IPT IPR/IPD IPD/IPT
Neat biodiesel
80 21.9 22.1 22.2 0.99 0.99 1.00
80 20.9 19.3 19.6 1.08 1.06 1.02
80 22.2 22.5 1.01
80 23.1 23.0 1.00
90 8.0 8.5 8.8 0.94 0.92 1.03
90 7.4 8.6 8.8 0.87 0.85 1.02
90 7.7 7.9 1.03
90 8.0 8.2 1.02
100 4.7 4.6 4.7 1.02 1.00 1.02
100 4.0 4.1 4.1 0.98 0.96 1.02
100 4.1 4.4 4.5 0.92 0.90 1.02
110 2.1 2.3 2.2 0.92 0.95 0.97
110 2.2 2.1 2.1 1.01 1.02 0.99
110 2.2 2.2 1.01
120 1.3 1.3 1.3 1.01 1.05 0.96
120 1.3 1.4 1.3 0.94 0.97 0.96
120 1.3 1.3 1.3 0.96 0.97 0.99
Anox 20 @ 0.15 wt.%
80 73.6 74.2 74.8 0.99 0.99 1.01
90 31.1 29.4 29.6 1.06 1.05 1.01
90 29.4 31.1 31.3 0.94 0.94 1.01
100 12.5 13.2 13.5 0.94 0.93 1.02
100 12.3 12.6 12.8 0.98 0.97 1.01
110 5.5 5.2 5.4 1.06 1.03 1.03
110 5.0 5.0 5.1 1.01 0.99 1.03
110 5.2 5.0 5.1 1.04 1.01 1.03
120 2.4 2.5 2.5 0.99 0.97 1.03
120 2.7 2.6 2.6 1.04 1.01 1.03
120 2.4 2.5 2.6 0.94 0.91 1.03
120 2.3 2.6 2.6 0.91 0.89 1.03

Chapter 4 Page 106
Figure 4.13: The effect of measurement temperature on the induction time for neat biodiesel
batch BD02 and a sample spiked with 0.15 wt.% antioxidant (Anox 20).
4.3.4. Effect of antioxidant combinations on oxidative induction
The effect of antioxidant combinations on the induction time, was determined at a total
antioxidant concentration constant of 0.15 wt.%. The composition of the antioxidant mixture
was represented in vector form (x1;x2;x3) with the xi representing the mass fractions of the
individual additives present in the antioxidants package alone. Figure 4.14 shows
representative conductivity vs. time data obtained with the Rancimat method. The symbols
show experimental data obtained in duplicate runs and the lines correspond to least square fits
of Equation 13. The induction times were calculated using Equation 15 and Equation 16
respectively. Table 4.10 lists the measured Rancimat induction IPT and IPD times. In most
instances IP from the second derivative method exceeded that from the common tangent
method, IPT > IPD. The mean and standard deviation of the ratio for the samples spiked with
antioxidant is IPT /IPD = 1.04 0.07. The rest of the discussion focuses on IPT values as these
tended to give conservative results. Figure 4.15 shows the variation of the IPT induction
times, extracted from such curves, with composition for the antioxidant mixtures.

Chapter 4 Page 107
Figure 4.14: Representative baseline-corrected Rancimat conductivity vs. time curves. The
symbols represent experimental data and the solid lines are fits to Equation 14. (a) Neat
biodiesel; (b) 0.15 wt.% Anox 20; (c) 0.05 wt.% Orox PK with 0.10 wt.% Anox 20. The
symbols indicate experimental results determined in duplicate and the solid and broken lines
model fits.
The composition dependence of the experimental Rancimat induction time data was
fitted using Scheffé K-polynomials. Details of the fitting procedure are presented in Section
2.11.2. The data fits in Figure 4.15 are indicated by the solid lines while the symbols
represent actual experimental measurements. The composition dependence of the Naugard
PK - Anox 20 and the Orox PK - Naugard P binaries was adequately represented by quadratic
Scheffé polynomials. The model coefficients are listed in Table 4.11. However, the
composition dependence of IPT for the Orox PK - Anox 20 binary was highly nonlinear, so
much so that a cubic Scheffé polynomial had to be employed to fit the data. According to
Table 4.10 and Figure 4.15, the hindered phenol, Anox 20, was the most effective stabilizer
for the present sunflower biodiesel followed by Orox PK at 0.15 wt.% antioxidant
concentration. None of the neat antioxidants achieved the 8 h EN14214 (BS EN 14214,
2012+A1:2014) stability requirement. However, Anox 20 on its own did exceed the 3 h
ASTM D6751 (ASTM D6751-15ce1, 2016) specification. Mixtures of Orox PK and Anox 20
showed strong synergism. Virtually all combinations of these two antioxidants tested featured
IPT values that were higher than those measured for Anox 20 on its own. The fitted curve,

Chapter 4 Page 108
defined by a cubic Scheffé polynomial, predicted a maximum value of IPT = 5.30 h at
approximately a 1:2 ratio of Orox to Anox.
Table 4.10: Average Induction times (IP) of biodiesel spiked samples at 0.15wt.%
Antioxidant weight fractions Induction times (h)
Orox PK Naugard P Anox 20 IPT IPD
1.000 0.000 0.000 2.37
2.52
2.20
2.36
0.667 0.333 0.000 1.98
2.21
1.79
2.21
0.500 0.500 0.000 1.95
1.88
1.80
1.81
0.333 0.667 0.000 1.85
1.77
1.79
1.66
0.000 1.000 0.000 1.84
1.88
1.69
1.73
0.000 0.667 0.333 2.94
2.91
3.01
2.99
0.000 0.500 0.500 3.54
3.48
3.64
3.56
0.000 0.333 0.667 3.79
4.02
3.88
4.12
0.000 0.000 1.000 4.17
4.32
4.28
4.43
0.333 0.000 0.667 5.38
5.28
5.51
5.40
0.500 0.000 0.500 4.72
4.82
4.82
4.92
0.667 0.000 0.333 4.22
4.11
4.33
4.21
0.333 0.333 0.333 3.69
3.88
3.77
3.98
Neat biodiesel 1.55 0.21 1.33 0.28
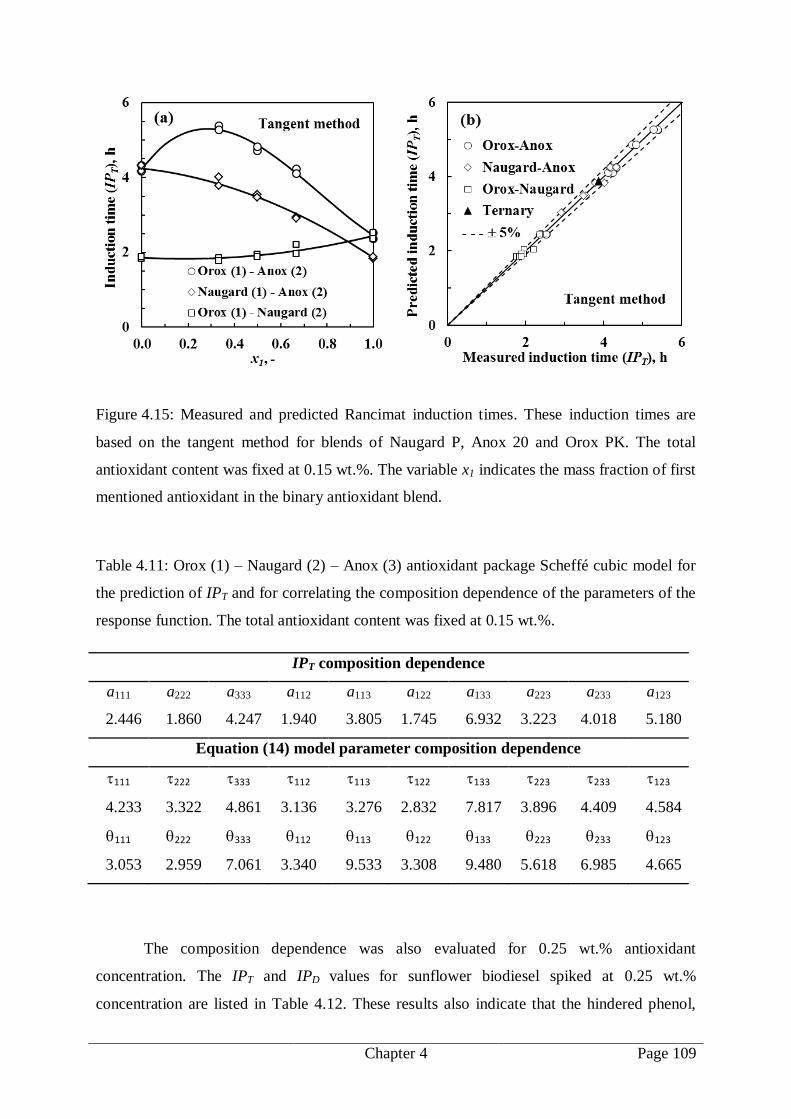
Chapter 4 Page 109
Figure 4.15: Measured and predicted Rancimat induction times. These induction times are
based on the tangent method for blends of Naugard P, Anox 20 and Orox PK. The total
antioxidant content was fixed at 0.15 wt.%. The variable x1 indicates the mass fraction of first
mentioned antioxidant in the binary antioxidant blend.
Table 4.11: Orox (1) – Naugard (2) – Anox (3) antioxidant package Scheffé cubic model for
the prediction of IPT and for correlating the composition dependence of the parameters of the
response function. The total antioxidant content was fixed at 0.15 wt.%.
IPT composition dependence
a111 a222 a333 a112 a113 a122 a133 a223 a233 a123
2.446 1.860 4.247 1.940 3.805 1.745 6.932 3.223 4.018 5.180
Equation (14) model parameter composition dependence
111 222 333 112 113 122 133 223 233 123
4.233 3.322 4.861 3.136 3.276 2.832 7.817 3.896 4.409 4.584
111 222 333 112 113 122 133 223 233 123
3.053 2.959 7.061 3.340 9.533 3.308 9.480 5.618 6.985 4.665
The composition dependence was also evaluated for 0.25 wt.% antioxidant
concentration. The IPT and IPD values for sunflower biodiesel spiked at 0.25 wt.%
concentration are listed in Table 4.12. These results also indicate that the hindered phenol,

Chapter 4 Page 110
Anox 20, was the most effective stabilizer for the present sunflower biodiesel followed by
Orox PK. None of the neat antioxidants at the higher concentration achieved the 8 h
EN14214 (BS EN 14214, 2012+A1:2014) stability requirement. Mixtures of Orox PK and
Anox 20 showed strong synergism. The fitted curve, Figure 4.16 defined by a cubic Scheffé
polynomial, predicted a maximum value of IPT = 7.54 h at approximately a 1:2 ratio of Orox
to Anox at 0.25 wt.% concentration. These results also show that only Anox 20 can be
considered as an inhibitor for biodiesel according to the 3 h specified by ASTM
D6751(ASTM D6751-15ce1, 2016).
Potential synergism is evaluated by combining primary antioxidants with other
primary oxidants or with a secondary antioxidant to achieve maximum efficiency. Synergistic
antioxidant mixtures allow for a reduction in the concentration of each antioxidant in the
mixture. It also increases the antioxidant effectiveness compared to that of the individual
antioxidant. Subroto et al. (2013) studied the effect of antioxidant binary combinations on the
oxidation stability of Jatropha curcas oil. They observed synergism between pyrogallol and
an amine antioxidant (N,N-di-sec-butyl-p-phenylenediamine) at weight ratios of 3:1 and 1:3,
which would suggest that pyrogallol is regenerated by the amine antioxidant. They also
concluded that synergism is feedstock dependant. What may be a good antioxidant for
Jatropha curcas oil used alone or in combination with other antioxidants might not be the best
antioxidant for other feedstock oils.
At a 0.25 wt.% antioxidant dosage, both binary compositions with Anox 20 (Orox
PK – Anox 20 and Naugard P - Anox 20) showed induction times greater than the 3 h
specified by ASTM D6751. This would indicate a synergistic effect not only between the
phenolic- and amine-based antioxidants but also between the phenolic and phosphite based
antioxidants.
Primary antioxidants act as radical scavengers to inhibit the oxidation reaction while
secondary antioxidant is a peroxide decomposer. The secondary antioxidant, Naugard P was
however the least effective of the three main antioxidants used. It therefore appears that for
sunflower biodiesel the former effect is more important than the latter with respect to the
stabilisation of the biodiesel against oxidative degradation. This may have to do with the
extreme lability conferred by the conjugated double bonds in the fatty acid chain.
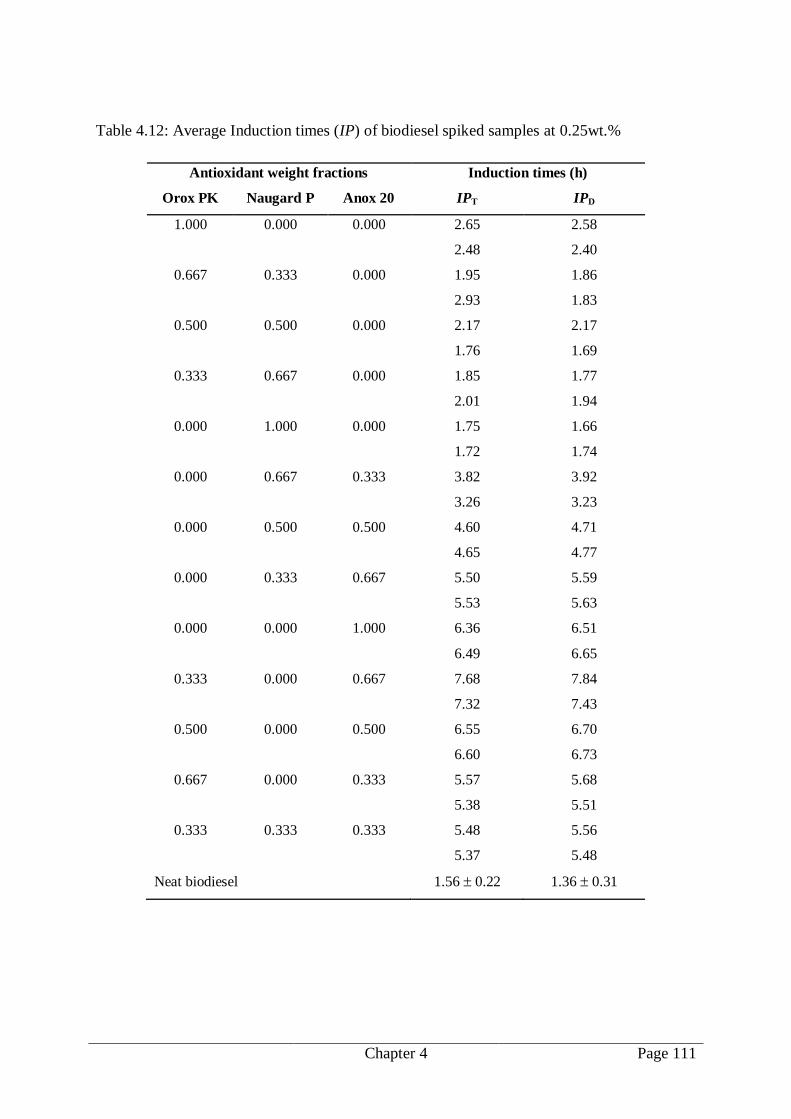
Chapter 4 Page 111
Table 4.12: Average Induction times (IP) of biodiesel spiked samples at 0.25wt.%
Antioxidant weight fractions Induction times (h)
Orox PK Naugard P Anox 20 IPT IPD
1.000 0.000 0.000 2.65
2.48
2.58
2.40
0.667 0.333 0.000 1.95
2.93
1.86
1.83
0.500 0.500 0.000 2.17
1.76
2.17
1.69
0.333 0.667 0.000 1.85
2.01
1.77
1.94
0.000 1.000 0.000 1.75
1.72
1.66
1.74
0.000 0.667 0.333 3.82
3.26
3.92
3.23
0.000 0.500 0.500 4.60
4.65
4.71
4.77
0.000 0.333 0.667 5.50
5.53
5.59
5.63
0.000 0.000 1.000 6.36
6.49
6.51
6.65
0.333 0.000 0.667 7.68
7.32
7.84
7.43
0.500 0.000 0.500 6.55
6.60
6.70
6.73
0.667 0.000 0.333 5.57
5.38
5.68
5.51
0.333 0.333 0.333 5.48
5.37
5.56
5.48
Neat biodiesel 1.56 0.22 1.36 0.31

Chapter 4 Page 112
Figure 4.16: Measured and predicted Rancimat induction times. These induction times are
based on the tangent method for blends of Anox 20 and Orox PK. The total antioxidant
content was fixed at 0.15 wt.% and 0.25 wt.%. The variable x1 indicates the mass fraction of
first mentioned antioxidant in the binary antioxidant blend.
According to Becker and Knorr (1996) synergism in a binary antioxidant combination
is evident when the mixture proves to be more effective than expected, that is if it exceeds the
sum of the induction periods recorded for the individual antioxidants, acting on their own at
the mixture dosage level minus the induction period of the pure biodiesel. However, these
authors only observed added effects for combinations of monophenols or bisphenols with
either sulfides or aromatic phosphites. Gatto and Grina (1999) previously observed synergy
(at approximately the same ratio found presently) of an amine antioxidant to a phenolic one
in a sulfur-free mineral oil. The mechanisms responsible for this synergistic antioxidant
interaction are expected to be complex and their elucidation is beyond the scope of the
present investigation. However, it is likely that it can be attributed to some type of
regeneration of the more effective antioxidant by the other one, or the sacrificial oxidation of
the latter to protect the former (Gatto and Grina, 1999, de Guzman et al., 2009, Decker,
2002). According to Becker et al. (2007), while the action of chain breaking, free radical
scavenging, antioxidants are fairly well understood, the mechanisms proposed to explain
antioxidant synergism or antagonism are speculative and conflicting observations have been
reported (Jensen et al., 1995, Denisov, 1996, Haidasz et al., 2014).
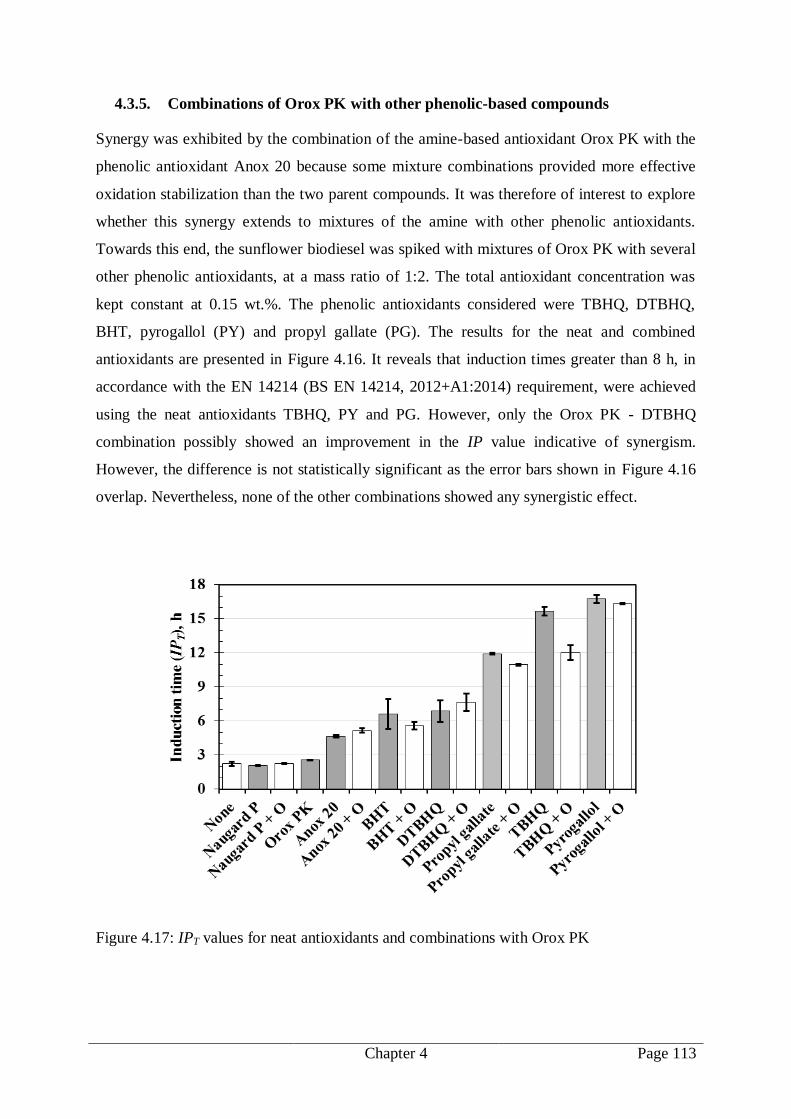
Chapter 4 Page 113
4.3.5. Combinations of Orox PK with other phenolic-based compounds
Synergy was exhibited by the combination of the amine-based antioxidant Orox PK with the
phenolic antioxidant Anox 20 because some mixture combinations provided more effective
oxidation stabilization than the two parent compounds. It was therefore of interest to explore
whether this synergy extends to mixtures of the amine with other phenolic antioxidants.
Towards this end, the sunflower biodiesel was spiked with mixtures of Orox PK with several
other phenolic antioxidants, at a mass ratio of 1:2. The total antioxidant concentration was
kept constant at 0.15 wt.%. The phenolic antioxidants considered were TBHQ, DTBHQ,
BHT, pyrogallol (PY) and propyl gallate (PG). The results for the neat and combined
antioxidants are presented in Figure 4.16. It reveals that induction times greater than 8 h, in
accordance with the EN 14214 (BS EN 14214, 2012+A1:2014) requirement, were achieved
using the neat antioxidants TBHQ, PY and PG. However, only the Orox PK - DTBHQ
combination possibly showed an improvement in the IP value indicative of synergism.
However, the difference is not statistically significant as the error bars shown in Figure 4.16
overlap. Nevertheless, none of the other combinations showed any synergistic effect.
Figure 4.17: IPT values for neat antioxidants and combinations with Orox PK

Chapter 4 Page 114
The induction time IPT generally gave lower values than IPD, especially for the more
highly stabilized biodiesel samples. This means that, compared to IPD, the IPT values
provided conservative estimates for the oxidative stabilization. This index was therefore
selected for further study as it returned conservative values for biodiesel samples stabilized
with antioxidants. The expressions for the estimation of induction periods, from the
parameters of the response curve F(t) of Equation 13, both take the form IPi = fi(). This
means that the ratio of the two IP values is independent of the time constant and given by:
* ⁄ ( ( √
) )+ ⁄
⁄ [ ⁄ ]
(19)
According to Equation 19, IPT exceeds IPD when < 3.88. The two estimates agree to within
5% provided > 3.17 and the difference is less than 2% for > 4.8. Figure 4.17 shows a
plot of the IPD/IPT ratio.
Figure 4.18: Plots of (a) fi() = IPi/ and (b) the variation of IPD/IPT with the shape parameter
.

Chapter 5 Page 115
Chapter 5: Conclusion
Sunflower biodiesel of acceptable quality can be prepared by base catalysed
methanolysis within minutes provided the reagent mixtures are vigorously shaken and a 24 h
settling time is used to allow the settling of the glycerol layer. With this approach, the ester
content exceeds 90 wt.% after just 1 min and 96 wt.% after 60 min. Although this method
works for sunflower biodiesel it is not clear if it will give the same ester yield for other
vegetable oils.
The stability of neat and antioxidant spiked sunflower biodiesel can be quantified by
the Rancimat induction period (IP). This method generates a conductivity vs. time curve as
an air oxidation test, conducted at an elevated temperature, progresses. Initially the
conductivity remains constant but after a characteristic time it rises rapidly due to the release
of acidic compounds from the oxidative degradation of the biodiesel. The IP can be
determined from the experimental curve according to two different approaches. The
―automatic‖ method determines the time corresponding to the maximum in the second
derivative of the response curve. The ―manual‖ method determines the induction time from
the intersection of two tangents drawn to the response curve as described in EN14112 (BS
EN 14112, 2003). One is drawn to the initial part and the other to the latter part of the
response curve. It was shown that the ―manual‖ method for determining the IP can also be
automated by suitable curve fitting.
The proposed method utilises a nonlinear response model and the IP values are
determined from the fitted model constants. In fact it actually allows global evaluation of the
induction time from the model fit parameters, using both the tangent method (IPT) and second
derivative method (IPD). The analytical expressions and the actual data clearly indicate that
the two methods yield slightly different IP values. It was found that, for well-stabilized
biodiesel samples, IPD > IPT. The implication is that the tangent method yields conservative
estimates for the induction period of stabilised sunflower biodiesel. For the present data set
the second derivative method yielded IP values that were about 2.5% longer than those
calculated using the tangent method.
Sunflower biodiesel was stabilised with three different antioxidants representing three
different chemistries at a fixed dosage level of 0.15 wt.%. The oxidative stability of neat and
stabilised sunflower biodiesel samples was quantified with a Metrohm 895 Thermomat
instrument according to the Rancimat induction time method.
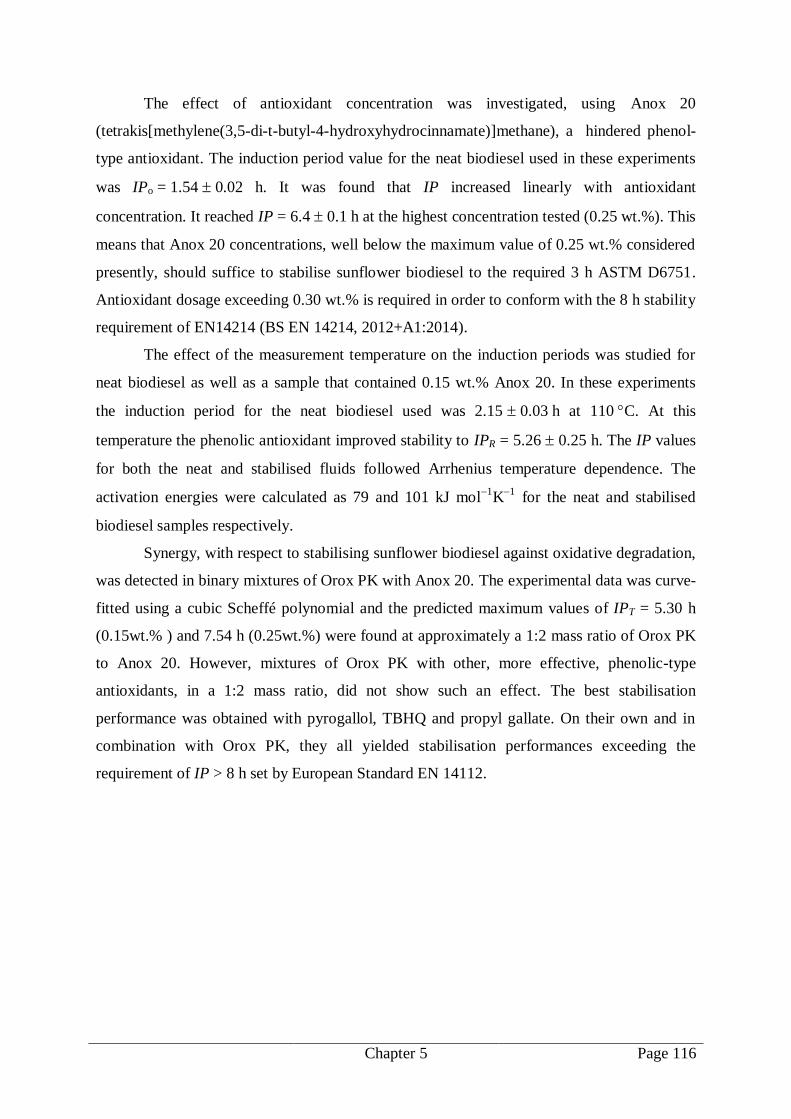
Chapter 5 Page 116
The effect of antioxidant concentration was investigated, using Anox 20
(tetrakis[methylene(3,5-di-t-butyl-4-hydroxyhydrocinnamate)]methane), a hindered phenol-
type antioxidant. The induction period value for the neat biodiesel used in these experiments
was IPo = 1.54 0.02 h. It was found that IP increased linearly with antioxidant
concentration. It reached IP = 6.4 0.1 h at the highest concentration tested (0.25 wt.%). This
means that Anox 20 concentrations, well below the maximum value of 0.25 wt.% considered
presently, should suffice to stabilise sunflower biodiesel to the required 3 h ASTM D6751.
Antioxidant dosage exceeding 0.30 wt.% is required in order to conform with the 8 h stability
requirement of EN14214 (BS EN 14214, 2012+A1:2014).
The effect of the measurement temperature on the induction periods was studied for
neat biodiesel as well as a sample that contained 0.15 wt.% Anox 20. In these experiments
the induction period for the neat biodiesel used was 2.15 0.03 h at 110 C. At this
temperature the phenolic antioxidant improved stability to IPR = 5.26 0.25 h. The IP values
for both the neat and stabilised fluids followed Arrhenius temperature dependence. The
activation energies were calculated as 79 and 101 kJ mol1
K1
for the neat and stabilised
biodiesel samples respectively.
Synergy, with respect to stabilising sunflower biodiesel against oxidative degradation,
was detected in binary mixtures of Orox PK with Anox 20. The experimental data was curve-
fitted using a cubic Scheffé polynomial and the predicted maximum values of IPT = 5.30 h
(0.15wt.% ) and 7.54 h (0.25wt.%) were found at approximately a 1:2 mass ratio of Orox PK
to Anox 20. However, mixtures of Orox PK with other, more effective, phenolic-type
antioxidants, in a 1:2 mass ratio, did not show such an effect. The best stabilisation
performance was obtained with pyrogallol, TBHQ and propyl gallate. On their own and in
combination with Orox PK, they all yielded stabilisation performances exceeding the
requirement of IP > 8 h set by European Standard EN 14112.

References Page 117
References:
AHMAD, M., AHMED, S., FAYYAZ UL, H., ARSHAD, M., KHAN, M. A., ZAFAR, M. &
SULTANA, S. 2010. Base catalyzed transesterification of sunflower oil biodiesel.
African Journal of Biotechnology, 9, 8630-8635.
ANON. 2013. SA to blend biofuels from 2015 [Online]. Big Media Publishers. Available:
http://www.southafrica.info/business/trends/newbusiness/biofuels-011013.htm
[Accessed 2014/02/19].
ANON. 2016. Triglyceride Molecular weight calculator [Online]. Available:
http://biodieseleducation.org/TOOLS/Calculators/Molecularweight_calculator.html
[Accessed 2016/06/14].
ANON. 2018. Statista [Online]. Available:
https://www.statista.com/statistics/271472/biodiesel-production-in-selected-countries/
[Accessed 2018/02/02].
AOCS CA 14-56 1989. AOCS Official Method: Total, Free and Combined Glycerol.
AOCS CD 1-25 1989. AOCS Official Method: Iodine Value of Fats and Oils, Wijs Method.
AOCS TE 1A-64 2009. AOCS Official Method: Acid Value.
ARAÚJO, K., MAHAJAN, D., KERR, R. & SILVA, M. D. 2017. Global biofuels at the
crossroads: an overview of technical, policy, and investment complexities in the
sustainability of biofuel development. Agriculture, 7, 32.
ARAÚJO, S. V., LUNA, F. M. T., ROLA JR, E. M., AZEVEDO, D. C. S. &
CAVALCANTE JR, C. L. 2009. A rapid method for evaluation of the oxidation
stability of castor oil FAME: influence of antioxidant type and concentration. Fuel
Processing Technology, 90, 1272-1277.
ASTM D664 2004. Standard Test Method for Acid Number of Petroleum Products by
Potentiometric Titration.
ASTM D3828-16A 2016. Standard test method for Flash point by small scale closed cup
tester.
ASTM D4928-12 2012. Standard test method for water in crude oil by coulometric Karl
Fischer titration.
ASTM D5768-02 2014. Standard Test Method for Determination of Iodine Value of Tall Oil
Fatty Acids.
ASTM D6584 2000. Standard Test Method for Determination of Free and Total Glycerine in
B-100 Biodiesel Methyl Esters by Gas Chromatography.
ASTM D6751-15CE1 2016. Standard specification for Biodiesel Fuel Blend Stock (B100) for
Middle Distillate Fuels1.
BARABÁS, I. & TODORUȚ, I.-A. 2011. Biodiesel quality, standards and properties.
Biodiesel-quality, emissions and by-products. InTech.
BAUER, I., HABICHER, W. D., RAUTENBERG, C. & AI-MALAIKA, S. 1995.
Antioxidant interaction between organic phosphites and hindered amine light
stabilisers during processing and thermoxidation of polypropylene. Polymer
degradation and stability, 48, 427-440.
BECKER, E. M., NTOUMA, G. & SKIBSTED, L. H. 2007. Synergism and antagonism
between quercetin and other chain-breaking antioxidants in lipid systems of
increasing structural organisation. Food Chemistry, 103, 1288-1296.
BECKER, R. & KNORR, A. 1996. An evaluation of antioxidants for vegetable oils at
elevated temperatures. Lubrication Science, 8, 95-117.
BELLO, L. H. A. D. & VIEIRA, A. F. D. C. 2011. Tutorial for mixture-process experiments
with an industrial application. Pesquisa Operacional, 31, 543-564.

References Page 118
BERRIOS, M., SILES, J., MARTÍN, M. A. & MARTÍN, A. 2007. A kinetic study of the
esterification of free fatty acids (FFA) in sunflower oil. Fuel, 86, 2383-2388.
BREITINGER, H.-G. 2012. Drug synergy–mechanisms and methods of analysis. Toxicity
and Drug Testing. InTech.
BS EN 14103 2011. Fat and oil derivatives-Fatty Acid Methyl Esters (FAME)-Determination
of ester and linolenic acid methyl ester contents.
BS EN 14104 2003. Fat and Oil Derivatives—Fatty Acid Methyl Esters (FAME)—
Determination of Acid Value, Standards Policy and Strategy Committee. British
Standards Institute.
BS EN 14112 2003. Fat and oil derivatives-Fatty Acid Methyl Esters (FAME)-Determination
of oxidation stability (accelerated oxidation test).
BS EN 14214 2008+A1:2009. Automotive fuels- Fatty Acid Methyl Esters (FAME) for
diesel engines-Requirements and test methods
BS EN 14214 2012+A1:2014. Liquid petroleum products-fatty acid methyl esters (FAME)
for use in diesel engines and heating applications-requirements and test methods.
BURGER, S. 2014. Amid technical and financial concerns, SA moves ahead with biofuels
strategy. Available: http://www.engineeringnews.co.za/article/amid-technical-and-
financial-concerns-sa-moves-ahead-with-biofuels-strategy-2014-03-21 [Accessed
2017/01/11].
CHAO, M., LI, W. & WANG, X. 2014. Antioxidant synergism between synthesised
alkylated diphenylamine and dilauryl thiodipropionate in polyolefin base fluid.
Journal of Thermal Analysis and Calorimetry, 117, 925-933.
CHEN, Y.-H. & LUO, Y.-M. 2011. Oxidation stability of biodiesel derived from free fatty
acids associated with kinetics of antioxidants. Fuel Processing Technology, 92, 1387-
1393.
CHOE, E. & MIN, D. B. 2006. Mechanisms and factors for edible oil oxidation.
Comprehensive reviews in food science and food safety, 5, 169-186.
CHUAH, L. F., KLEMEŠ, J. J., YUSUP, S., BOKHARI, A., AKBAR, M. M. & CHONG, Z.
K. 2017. Kinetic studies on waste cooking oil into biodiesel via hydrodynamic
cavitation. Journal of Cleaner Production, 146, 47-56.
CHUAH, L. F., YUSUP, S., AZIZ, A. R. A., BOKHARI, A. & ABDULLAH, M. Z. 2016.
Cleaner production of methyl ester using waste cooking oil derived from palm olein
using a hydrodynamic cavitation reactor. Journal of cleaner production, 112, 4505-
4514.
CLARK, W. M., MEDEIROS, N. J., BOYD, D. J. & SNELL, J. R. 2013. Biodiesel
transesterification kinetics monitored by pH measurement. Bioresource Technology,
136, 771-774.
COATES, J. 2000. Interpretation of infrared spectra, a practical approach. . In: RA, M. (ed.)
Encyclopedia of Analytical Chemistry. John Wiley & Sons
CORNELL, J. A. 2000. Developing mixture models, are we done. Journal of Statistical
Computation and Simulation, 66, 127-144.
COSGROVE, J. P., CHURCH, D. F. & PRYOR, W. A. 1987. The kinetics of the
autoxidation of polyunsaturated fatty acids. Lipids, 22, 299-304.
DE FILIPPIS, P., GIAVARINI, C., SCARSELLA, M. & SORRENTINO, M. 1995.
Transesterification processes for vegetable oils: A simple control method of methyl
ester content. Journal of the American Oil Chemists' Society, 72, 1399-1404.
DE GUZMAN, R., TANG, H., SALLEY, S. & NG, K. Y. S. 2009. Synergistic Effects of
Antioxidants on the Oxidative Stability of Soybean Oil- and Poultry Fat-Based
Biodiesel. Journal of the American Oil Chemists' Society, 86, 459-467.

References Page 119
DECKER, E. A. 2002. Antioxidant mechanisms. In: AKOH, C. C., MIN,D.B (ed.) Food
Lipids. 2nd ed. New York: Marcel Dekker, Inc.
DEMIRBAS, A. 2008. Comparison of transesterification methods for production of biodiesel
from vegetable oils and fats. Energy Conversion and Management, 49, 125-130.
DEMIRBAS, A. 2009. Progress and recent trends in biodiesel fuels. Energy conversion and
management, 50, 14-34.
DENISOV, E. T. 1996. Cyclic mechanisms of chain termination in the oxidation of organic
compounds. Russian Chemical Reviews, 65, 505-520.
DEPARTMENT OF MINERALS AND ENERGY 2007. Biofuels industrial strategy of the
Republic of South Africa. Department of Minerals and Energy Pretoria.
DOMINGOS, A., SAAD, E., VECHIATTO, W., WILHELM, H. & RAMOS, L. 2007. The
influence of BHA, BHT and TBHQ on the oxidation stability of Soybean oil ethyl
esters (Biodiesel). J. Braz. Chem.Soc, 18, 416-423.
DRAPER, N. R. & PUKELSHEIM, F. 1998. Mixture models based on homogeneous
polynomials. Journal of statistical planning and inference, 71, 303-311.
DUNN, R. O. 2005. Effect of antioxidants on the oxidative stability of methyl soyate
(biodiesel). Fuel Processing Technology, 86, 1071-1085.
EN 14105 2011. Fat and oil derivatives. Fatty acid methyl esters (FAME). Determination of
free and total glycerol and mono-, di-, triglyceride contents. . CEN Brussels, Belgium.
EN 14111 2003. Fat and Oil Derivatives. Fatty Acid Methyl Esters (FAME). Determination
of Iodine Value.: CEN Brussels, Belgium.
ESCOBAR, E. C., DEMAFELIS, R. B., PHAM, L. J., FLORECE, L. M. & BORINES, M. G.
2008. Biodiesel Production from Jatropha curcas L. Oil by Transesterification.
Philippine Journal of Crop Science (PJCS) December, 33, 1-13.
FEARON, P. K., BIGGER, S. W. & BILLINGHAM, N. C. 2004. DSC combined with
chemiluminescence for studying polymer oxidation. Journal of Thermal Analysis and
Calorimetry, 76, 75-83.
FEDIOL. Oil characteristics [Online]. Fediol. Available:
http://www.fediol.be/web/oil%20characteristics/1011306087/list1187970078/f1.html
[Accessed 2015/11/03].
FERRARI, R. A., PIGHINELLI, A. L. M. T. & PARK, K. J. 2011. Biodiesel production and
quality. Biofuel's Engineering Process Technology. InTech.
FOCKE, W. W. & DU PLESSIS, B. 2004. Correlating multicomponent mixture properties
with homogeneous rational functions. Industrial & engineering chemistry research,
43, 8369-8377.
FOCKE, W. W., VAN DER WESTHUIZEN, I., GROBLER, A. L., NSHOANE, K. T.,
REDDY, J. K. & LUYT, A. S. 2012. The effect of synthetic antioxidants on the
oxidative stability of biodiesel. Fuel, 94, 227-233.
FOCKE, W. W., WESTHUIZEN, I. V. D. & OOSTHUYSEN, X. 2016. Biodiesel oxidative
stability from Rancimat data. Thermochimica Acta, 633, 116-121.
FONTANA, J., ZAGONEL, G., VECHIATTO, W., COSTA, B., LAURINDO, J.,
FONTANA, R., PELISSON, L., JORGE, B. & LANÇAS, F. 2009. Simple TLC-
screening of acylglycerol levels in biodiesel as an alternative to GC determination.
Journal of chromatographic science, 47, 844-846.
FRANKEL, E. N. 1984. Lipid oxidation: mechanisms, products and biological significance.
Journal of the American Oil Chemists’ Society, 61, 1908-1917.
FREEDMAN, B., BUTTERFIELD, R. O. & PRYDE, E. H. 1986. Transesterification kinetics
of soybean oil 1. Journal of the American Oil Chemists' Society, 63, 1375-1380.
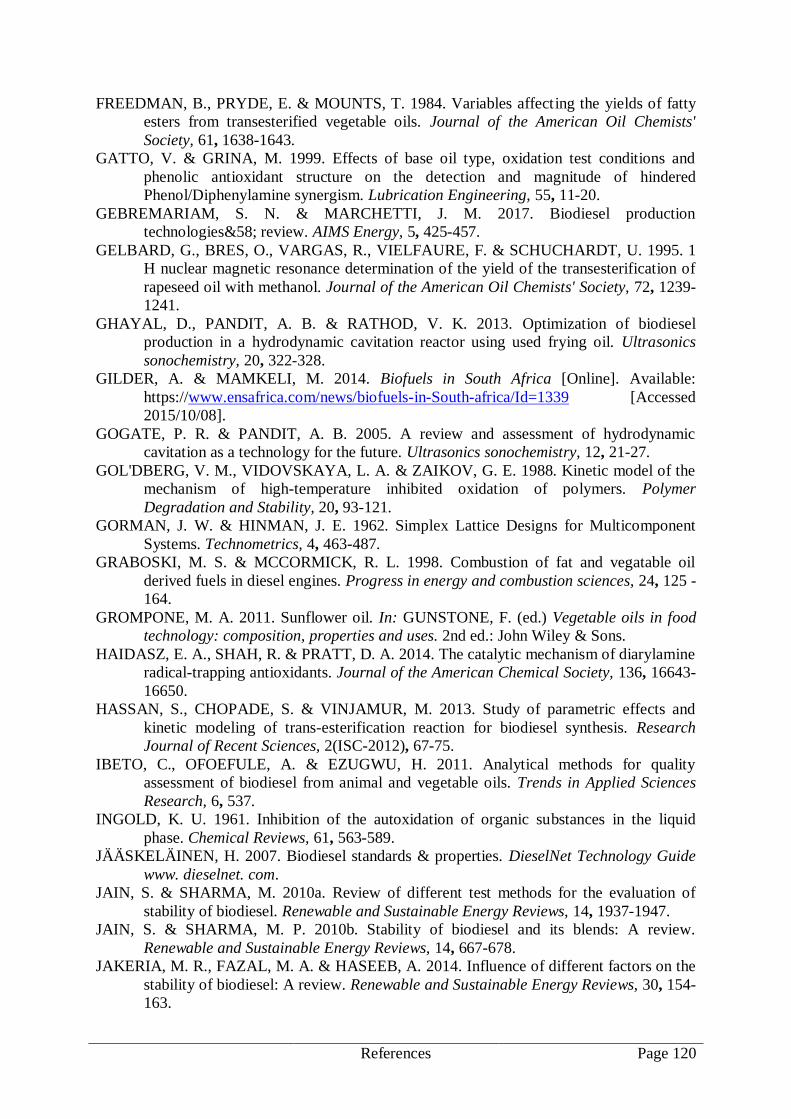
References Page 120
FREEDMAN, B., PRYDE, E. & MOUNTS, T. 1984. Variables affecting the yields of fatty
esters from transesterified vegetable oils. Journal of the American Oil Chemists'
Society, 61, 1638-1643.
GATTO, V. & GRINA, M. 1999. Effects of base oil type, oxidation test conditions and
phenolic antioxidant structure on the detection and magnitude of hindered
Phenol/Diphenylamine synergism. Lubrication Engineering, 55, 11-20.
GEBREMARIAM, S. N. & MARCHETTI, J. M. 2017. Biodiesel production
technologies&58; review. AIMS Energy, 5, 425-457.
GELBARD, G., BRES, O., VARGAS, R., VIELFAURE, F. & SCHUCHARDT, U. 1995. 1
H nuclear magnetic resonance determination of the yield of the transesterification of
rapeseed oil with methanol. Journal of the American Oil Chemists' Society, 72, 1239-
1241.
GHAYAL, D., PANDIT, A. B. & RATHOD, V. K. 2013. Optimization of biodiesel
production in a hydrodynamic cavitation reactor using used frying oil. Ultrasonics
sonochemistry, 20, 322-328.
GILDER, A. & MAMKELI, M. 2014. Biofuels in South Africa [Online]. Available:
https://www.ensafrica.com/news/biofuels-in-South-africa/Id=1339 [Accessed
2015/10/08].
GOGATE, P. R. & PANDIT, A. B. 2005. A review and assessment of hydrodynamic
cavitation as a technology for the future. Ultrasonics sonochemistry, 12, 21-27.
GOL'DBERG, V. M., VIDOVSKAYA, L. A. & ZAIKOV, G. E. 1988. Kinetic model of the
mechanism of high-temperature inhibited oxidation of polymers. Polymer
Degradation and Stability, 20, 93-121.
GORMAN, J. W. & HINMAN, J. E. 1962. Simplex Lattice Designs for Multicomponent
Systems. Technometrics, 4, 463-487.
GRABOSKI, M. S. & MCCORMICK, R. L. 1998. Combustion of fat and vegatable oil
derived fuels in diesel engines. Progress in energy and combustion sciences, 24, 125 -
164.
GROMPONE, M. A. 2011. Sunflower oil. In: GUNSTONE, F. (ed.) Vegetable oils in food
technology: composition, properties and uses. 2nd ed.: John Wiley & Sons.
HAIDASZ, E. A., SHAH, R. & PRATT, D. A. 2014. The catalytic mechanism of diarylamine
radical-trapping antioxidants. Journal of the American Chemical Society, 136, 16643-
16650.
HASSAN, S., CHOPADE, S. & VINJAMUR, M. 2013. Study of parametric effects and
kinetic modeling of trans-esterification reaction for biodiesel synthesis. Research
Journal of Recent Sciences, 2(ISC-2012), 67-75.
IBETO, C., OFOEFULE, A. & EZUGWU, H. 2011. Analytical methods for quality
assessment of biodiesel from animal and vegetable oils. Trends in Applied Sciences
Research, 6, 537.
INGOLD, K. U. 1961. Inhibition of the autoxidation of organic substances in the liquid
phase. Chemical Reviews, 61, 563-589.
JÄÄSKELÄINEN, H. 2007. Biodiesel standards & properties. DieselNet Technology Guide
www. dieselnet. com.
JAIN, S. & SHARMA, M. 2010a. Review of different test methods for the evaluation of
stability of biodiesel. Renewable and Sustainable Energy Reviews, 14, 1937-1947.
JAIN, S. & SHARMA, M. P. 2010b. Stability of biodiesel and its blends: A review.
Renewable and Sustainable Energy Reviews, 14, 667-678.
JAKERIA, M. R., FAZAL, M. A. & HASEEB, A. 2014. Influence of different factors on the
stability of biodiesel: A review. Renewable and Sustainable Energy Reviews, 30, 154-
163.

References Page 121
JENSEN, R. K., KORCEK, S., ZINBO, M. & GERLOCK, J. L. 1995. Regeneration of amine
in catalytic inhibition of oxidation. The Journal of Organic Chemistry, 60, 5396-5400.
JOVANOVIC, V. V., MANIC, N., STOJILJKOVIC, D. D. & HADZIC, P. 2016. Production
of biodiesel in a batch reactor by alkaline transesterification at room temperature.
Annals of the Faculty of Engineering Hunedoara, 14, 247.
JURRIENS, G., DE VRIES, B. & SCHOUTEN, L. 1964. Quantitative analysis of mixtures of
glycerides. Journal of lipid research, 5, 267-268.
KARAVALAKIS, G., HILARI, D., GIVALOU, L. K., DIMITRIOS & STOURNAS, S.
2011. Storage stability and ageing effect of biodiesel blends treated with different
antioxidants. Energy, 36, 369-374.
KARAVALAKIS, G. & STOURNAS, S. 2010. Impact of Antioxidant Additives on the
Oxidation Stability of Diesel/Biodiesel Blends†. Energy & Fuels, 24, 3682-3686.
KARAVALAKIS, G., STOURNAS, S. & KARONIS, D. 2010. Evaluation of the oxidation
stability of diesel/biodiesel blends. Fuel, 89, 2483-2489.
KNOTHE, G. 1999. Rapid monitoring of transesterification and assessing biodiesel fuel
quality by near-infrared spectroscopy using a fiber-optic probe. Journal of the
American Oil Chemists' Society, 76, 795-800.
KNOTHE, G. 2000. Monitoring a progressing transesterification reaction by fiber-optic near
infrared spectroscopy with correlation to 1 H nuclear magnetic resonance
spectroscopy. Journal of the American Oil Chemists' Society, 77, 489-493.
KNOTHE, G. 2001. Analytical methods used in the production and fuel quality assessment of
biodiesel. American Society of Agricultural Engineers 44, 193 - 200.
KNOTHE, G. 2005a. Dependence of biodiesel fuel properties on the structure of fatty acid
alkyl esters. Fuel Processing Technology, 86, 1059-1070.
KNOTHE, G. 2005b. The history of vegetable oil-based diesel fuels. In: KNOTHE, G., VAN
GERPEN, J. & KRAHL, J. (eds.) The Biodiesel Handbook. Elsevier.
KNOTHE, G. 2007. Some aspects of biodiesel oxidative stability. Fuel Processing
Technology, 88, 669-677.
KOLVER, L. 2008. Does SA’s sunflower-to-diesel technology have any place in its fuel-
security future? Available: http://www.engineeringnews.co.za/article/does-sas-
sunflowertodiesel-technology-have-any-placein-its-fuelsecurity-future-2008-10-17-1
[Accessed 2017/05/08].
KOTRBA, R. 2017. Germany consumed more UCO biodiesel last year than RME. Biodiesel
Magazine.
LAMBRAKIS, D. P. 1968. Experiments with Mixtures: A Generalization of the Simplex-
Lattice Design. Journal of the Royal Statistical Society. Series B (Methodological),
30, 123-136.
LEUNG, D. Y., WU, X. & LEUNG, M. 2010. A review on biodiesel production using
catalyzed transesterification. Applied energy, 87, 1083-1095.
LIANG, Y., MAY, C., FOON, C., NGAN, M., HOCK, C. & BASIRON, Y. 2006. The effect
of natural and synthetic antioxidants on the oxidative stability of palm diesel. Fuel,
85, 867-870.
MA, F., CLEMENTS, L. & HANNA, M. 1998. The effects of catalyst, free fatty acids, and
water on transesterification of beef tallow. Transactions of the ASAE, 41, 1261.
MA, F. & HANNA, M. A. 1999. Biodiesel production: A review. Bioresource Technology,
70, 1-15.
MARCHETTI, J. M., MIGUEL, V. U. & ERRAZU, A. F. 2007. Possible methods for
biodiesel production. Renewable and Sustainable Energy Reviews, 11, 1300-1311.

References Page 122
MARINOVA, E., TONEVA, A. & YANISHLIEVA, N. 2008. Synergistic antioxidant effect
of α-tocopherol and myricetin on the autoxidation of triacylglycerols of sunflower oil.
Food Chemistry, 106, 628-633.
MATHIARASI, R. & PARTHA, N. 2016. Optimization, kinetics and thermodynamic studies
on oil extraction from Daturametel Linn oil seed for biodiesel production. Renewable
Energy, 96, 583-590.
MCGINNIS, G. W. & DUGAN, L. 1965. A rapid low temperature method for preparation of
methyl esters of fatty acids. Journal of the American Oil Chemists' Society, 42, 305-
307.
MEHER, L., VIDYASAGAR, D. & NAIK, S. 2006. Technical aspects of biodiesel
production by transesterification—a review. Renewable and Sustainable Energy
Reviews, 10, 248-268.
MITTELBACH, M. & SCHOBER, S. 2003. The influence of antioxidants on the oxidation
stability of biodiesel. JAOCS, Journal of the American Oil Chemists' Society, 80, 817-
823.
MITTELBACH, M. & TRATHNIGG, B. 1990. Kinetics of alkaline catalyzed methanolysis
of sunflower oil. European Journal of Lipid Science and Technology, 92, 145-148.
MORRISON, R. T. & BOYD, R. N. 1987. Organic Chemistry, Allyn and Bacon, Inc.
MOSER, B. R. 2009. Biodiesel production, properties, and feedstocks. In Vitro Cellular &
Developmental Biology - Plant, 45, 229-266.
NAUREEN, R., TARIQ, M., YUSOFF, I., CHOWDHURY, A. J. K. & ASHRAF, M. A.
2015. Synthesis, spectroscopic and chromatographic studies of sunflower oil biodiesel
using optimized base catalyzed methanolysis. Saudi Journal of Biological Sciences,
22, 332-339.
NEODA. Oils and fats information, Chemistry of oils and fats [Online]. National Edible Oil
Distributors Association. Available: www.neoda.org.uk/oils-fats-information
[Accessed 2015/08/31.
NGAMPRASERTSITH, S. & SAWANGKEAW, R. 2011. Transesterification in supercritical
conditions. Biodiesel-feedstocks and processing technologies. InTech.
NOUREDDINI, H. & ZHU, D. 1997. Kinetics of transesterification of soybean oil. Journal
of the American Oil Chemists' Society, 74, 1457-1463.
OECD/FAO 2017. OECD-FAO Agricultural Outlook 2017-2026, OECD Publishing.
PAHL, G. 2008. Biodiesel: growing a new energy economy, Chelsea Green Publishing.
PAULS, R. 2011. A review of chromatographic characterization techniques for biodiesel and
biodiesel blends. Journal of chromatographic science, 49, 384-396.
PERKIN ELMER 2004. ATR accessories, An overview.
PISARELLO, M., DALLA COSTA, B., VEIZAGA, N. & QUERINI, C. 2010. Volumetric
method for free and total glycerin determination in biodiesel. Industrial &
Engineering Chemistry Research, 49, 8935-8941.
POLAVKA, J., PALIGOVÁ, J., CVENGROŠ, J. & SIMON, P. 2005. Oxidation stability of
methyl esters studied by differential thermal analysis and Rancimat. Journal of the
American Oil Chemists' Society, 82, 519-524.
PULLEN, J. & SAEED, K. 2012. An overview of biodiesel oxidation stability. Renewable
and Sustainable Energy Reviews, 16, 5924-5950.
RASHID, U., ANWAR, F., MOSER, B. R. & ASHRAF, S. 2008. Production of sunflower
oil methyl esters by optimized alkali-catalyzed methanolysis. Biomass and bioenergy,
32, 1202-1205.
REISCHE, D. W. 2002. Antioxidants. In: AKOH, C. C., MIN,D.B. (ed.) Food Lipids. 2nd
ed. New York: Marcel Dekker, Inc.

References Page 123
RIZWANUL FATTAH, I. M., MASJUKI, H. H., KALAM, M. A., HAZRAT, M. A.,
MASUM, B. M., IMTENAN, S. & ASHRAFUL, A. M. 2014. Effect of antioxidants
on oxidation stability of biodiesel derived from vegetable and animal based
feedstocks. Renewable and Sustainable Energy Reviews, 30, 356-370.
RODRIGUES, S., MAZZONE, L., SANTOS, F., CRUZ, M. & FERNANDES, F. 2009.
Optimization of the production of ethyl esters by ultrasound assisted reaction of
soybean oil and ethanol. Brazilian Journal of Chemical Engineering, 26, 361-366.
RODRIGUEZ, J. M. 2011. Effects of Raw Materials and Production Practices on Biodiesel
Quality and Performance. Biodiesel-Quality, Emissions and By-Products. InTech.
ROMANO, S. D. & SORICHETTI, P. A. 2010. Dielectric spectroscopy in biodiesel
production and characterization, Springer Science & Business Media.
ROOSTA, A., JAVANMARDI, J. & BEHINEH, E. S. 2016. Mathematical Modeling of
Biodiesel Production under Intense Agitation. International Journal of Chemical
Reactor Engineering, 14, 445-451.
ROOSTA, A. & VATAN, F. 2016. Modeling Effects of Mass Transfer Rate and Catalyst
Concentration on Biodiesel Production in Batch Reactors. Chemical Engineering
Communications, 203, 1116-1124.
RUPPEL, T. & HUYBRIGHS, T. 2008. Fatty Acid Methyl Esters in B100 Biodiesel by Gas
Chromatography (Modified EN 14103).
SALVI, B. L. & PANWAR, N. L. 2012. Biodiesel resources and production technologies – A
review. Renewable and Sustainable Energy Reviews, 16, 3680-3689.
SAMADHI, T. W., HIROTSU, T. & GOTO, S. 2017. Measurement of Antioxidant Effects
on the Auto-oxidation Kinetics of Methyl Oleate-Methyl Laurate Blend as a Surrogate
Biodiesel System. Bulletin of Chemical Reaction Engineering & Catalysis, 12, 157.
SÁNCHEZ, A., MACEIRAS, R., CANCELA, A. & RODRÍGUEZ, M. 2012. Influence of n-
hexane on in situ transesterification of marine macroalgae. Energies, 5, 243-257.
SANI, Y., DAUD, W. & AZIZ, A. A. 2012. Biodiesel feedstock and production technologies:
Successes, challenges and prospects. Biodiesel-Feedstocks, Production and
Applications. InTech.
SANS 1935 2011. Automotive biodiesel - Fatty Acid Methyl Esters (FAME) for diesel
engines - Requirements and test methods. SANS 1935:2011.
SARIN, A., ARORA, R., SINGH, N. P., SARIN, R. & MALHOTRA, R. K. 2010. Oxidation
stability of palm methyl ester: Effect of metal contaminants and antioxidants. Energy
and Fuels, 24, 2652-2656.
SASTRY, S. & MURTHY, C. V. R. 2012. Prospects of biodiesel for future energy security.
Elexir, Chemical Engg, 53, 12029-12034.
SCHEFFE, H. 1963. The Simplex-Centroid Design for Experiments with Mixtures. Journal
of the Royal Statistical Society. Series B (Methodological), 25, 235-263.
SCHEFFÉ, H. 1958. Experiments with mixtures. Journal of the Royal Statistical Society.
Series B (Methodological), 344-360.
SCHNEIDER, C. 2009. An update on products and mechanisms of lipid peroxidation.
Molecular nutrition & food research, 53, 315-321.
SCHOBER, S. & MITTELBACH, M. 2004. The impact of antioxidants on biodiesel
oxidation stability. European Journal of Lipid Science and Technology, 106, 382-389.
SENDZIKIENE, E., MAKAREVICIENE, V. & JANULIS, P. 2005. Oxidation stability of
Biodiesel Fuel Produced from Fatty wastes. Polish Journal of Environmental Studies,
14, 335-339.
SHAH, R., MAHAJAN, D., PATEL, S., BALL, J., COLANTUONI, V. & MARAJ, R. 2009.
Oxidation Stability in Biodiesel: A Brief Review of Current Technology. Biodiesel
Magazine.

References Page 124
SHARMA, Y. C., SINGH, B. & UPADHYAY, S. N. 2008. Advancements in development
and characterization of biodiesel: A review. Fuel, 87, 2355-2373.
SILVA, C. D. & OLIVEIRA, J. V. 2014. Biodiesel production through non-catalytic
supercritical transesterification: current state and perspectives. Brazilian Journal of
Chemical Engineering, 31, 271-285.
SIMS, B. 2012. Catalyzing Biodiesel Growth: An analysis of conventional acid and base
catalysts used intoday's biodiesel industry. Biodiesel Magazine.
SRIVASTAVA, A. & PRASAD, R. 2000. Triglycerides-based diesel fuels. Renewable and
sustainable energy reviews, 4, 111-133.
STAMENKOVIĆ, O. S., TODOROVIĆ, Z. B., LAZIĆ, M. L., VELJKOVIĆ, V. B. &
SKALA, D. U. 2008. Kinetics of sunflower oil methanolysis at low temperatures.
Bioresource Technology, 99, 1131-1140.
SUBROTO, E., MANURUNG, R., HEERES, H. J. & BROEKHUIS, A. A. 2013. Screening
of antioxidants as stabilisers for Jatropha curcas L. oil. European Journal of Lipid
Science and Technology, 115, 909-920.
TALHA, N. S. & SULAIMAN, S. 2016. Overview of catalysts in biodiesel production.
ARPN Journal of Engineering and Applied Sciences, 11, 439-448.
TANG, H., DE GUZMAN, R. C., SALLEY, S. O. & NG, S. K. 2008a. The oxidative
stability of biodiesel: Effects of FAME composition and antioxidant. Lipid
Technology, 20, 249-252.
TANG, H., WANG, A., SALLEY, S. O. & NG, K. Y. S. 2008b. The Effect of Natural and
Synthetic Antioxidants on the Oxidative Stability of Biodiesel. Journal of the
American Oil Chemists' Society, 85, 373-382.
TARIQ, M., ALI, S., AHMAD, F., AHMAD, M., ZAFAR, M., KHALID, N. & KHAN, M.
A. 2011. Identification, FT-IR, NMR (1 H and 13 C) and GC/MS studies of fatty acid
methyl esters in biodiesel from rocket seed oil. Fuel Processing Technology, 92, 336-
341.
THERMO NICOLET 2001. Introduction to fourier transform infrared spectrometry. Thermo
Nicolet Corporation: Madison-USA.
TOMASEVIC, A. V. & SILER-MARINKOVIC, S. S. 2003. Methanolysis of used frying oil.
Fuel Processing Technology, 81, 1-6.
VAN GERPEN, J. 2005. Biodiesel processing and production. Fuel Processing Technology,
86, 1097 - 1107.
VAN GERPEN, J., SHANKS, B., PRUSZKO, R., CLEMENTS, D. & KNOTHE, G. 2004.
Biodiesel Production Technology, National Renewable Energy Laboratory
Subcontractor Report NREL. SR-510-36244.
VAUHKONEN, V., SIRVIÖ, K., SVAHN, A. & NIEMI, S. A comparative study of the
antioxidant effect on the autoxidation stability of ester type biodiesels and source oils.
Clean Electrical Power (ICCEP), 2011 International Conference on 14-16 June 2011
2011. IEEE 211 - 215.
VICENTE, G., COTERON, A., MARTINEZ, M. & ARACIL, J. 1998. Application of the
factorial design of experiments and response surface methodology to optimize
biodiesel production. Industrial crops and products, 8, 29-35.
VICENTE, G., MARTÍNEZ, M., ARACIL, J. & ESTEBAN, A. 2005. Kinetics of sunflower
oil methanolysis. Industrial and Engineering Chemistry Research, 44, 5447-5454.
WALL , P. 2000. III Triglycerides Thin-Layer (Planar) Chromatography. Encyclopedia of
Separation Scienc e, Academic Press, London, 4412-4420.
WAYNICK, J. A. 2005. Characterization of Biodiesel Oxidation and Oxidation Products:
Technical Literature Review. Task 1 Results, National Renewable Energy Laboratory.

References Page 125
WILLARD, H. H., MERRITT JR, L. L., DEAN, J. A. & SETTLE JR, F. A. 1988.
Instrumental methods of analysis.
XIN, J., IMAHARA, H. & SAKA, S. 2009. Kinetics on the oxidation of biodiesel stabilized
with antioxidant. Fuel, 88, 282-286.
YAAKOB, Z., NARAYANAN, B. N., PADIKKAPARAMBIL, S., UNNI K, S. & AKBAR
P, M. 2014. A review on the oxidation stability of biodiesel. Renewable and
Sustainable Energy Reviews, 35, 136-153.
YUAN, T., AKOCHI-KOBLE, E., PINCHUK, D. & VAN DE VOORT, F. R. 2014. FTIR
on-line monitoring of biodiesel transesterification. International Journal of
Renewable Energy & Biofuels, 2014.
ZULETA, E. C., BAENA, L., RIOS, L. A. & CALDERÓN, J. A. 2012. The oxidative
stability of biodiesel and its impact on the deterioration of metallic and polymeric
materials: a review. Journal of the Brazilian Chemical Society, 23, 2159-2175.

Appendix A Page 126
Appendix A: Simplified theory for an antioxidant stabilisation
mechanism
The nomenclature is kept the same as used in the paper by Gol'dberg et al. (1988). A
simplified model for the oxidation of hydrocarbons considers the following subset of
reactions:
This scheme supposedly contains the minimum of elementary stages necessary to describe
typical experimental results.
Analysis of the differential equations describing the above reactions leads to the following
dimensionless forms:
(1 ) 1
dpi p ai p
d
(8)
1
dibi p ai
d
(9)
where
Variable Interpretation
2
3 6 2p k k ROOH k RH Dimensionless concentration of a
hydroperoxide
7 2i k InH k RH Dimensionless concentration of an inhibitor
3k t Dimensionless time
2 8 6 102a k k k k Inhibition parameter
2 7 3 6b k k RH k k Dimensionless rate constant of inhibitor
consumption
1. 1•
2R +O ROOk
2. 2• •ROO +RH ROOH+Rk
3. 3
2
2• • •
2ROOH RO + OH 2ROO + nonradicalproducts
k RH
O
6. 6• •
2ROO +ROO O + nonradicalproductsk
7. 7• •ROO +InH ROOH+ Ink
8. 8•ROO +InH nonradicalproductsk
10. 10
2
• •In +RH ROO +nonradicalproductsk
O

Appendix A Page 127
For situations corresponding to low inhibitor concentrations (iinh << 1) that provide
long inhibition times ( >> 1), the induction time can be estimated using the following
approximation:
ind oai b
2 8 6 10 2 7 3 62ind ok k k k k k RH k k i
3 8
7 10
2ind o
k ki
k k RH
8
2
2 10
2ind
k InHt
k k RH

Appendix B Page 128
Appendix B: Molecular weight calculation for sunflower oil
The molecular weight of a particular fat or oil depends on the fatty acid profile. To determine
the fatty acid profile the oil is converted into fatty acid alcohol esters. Using gas
chromatography the proportionate weights of the fatty acids is measured. Once the fatty acid
profile of the oil is known the average molecular weight of the oil can be calculated. The
weight of a single fatty acid can be calculated using (Anon, 2016):
MWi = 14.027C – 2.016d + 31.9988
Where:
C = number of carbon bonds
d = number of double bonds
The molecular weights for a single fatty acid as well that of the oil (triglyceride) is
given in Table B-1. The relative proportions is from sample BD01
Fatty acid profile
Relative ester
proportions
(Xi)
Molecuar weights (g.mol-1
)
Individual fatty acids
(MWi) MW oil
C14:0 0.14 228.38 723.18
C16:0 6.73 256.43 807.35
C16:1 0.08 254.43 801.35
C18:0 6.63 284.49 891.51
C18:1 22.44 282.49 885.51
C18:2 62.03 280.49 879.43
C18:3 0.22 278.49 873.51
C20:0 0.49 312.54 975.67
C20:1 0.12 310.54 968.67
C20:2 0.09 308.54 963.59
C22:0 0.80 340.59 1059.83
C24:0 0.21 368.65 1143.99
Both Sánchez et al. (2012) and Mathiarasi and Partha (2016) give equations for the
calculation of the average molecular weight of oils.
Using the values from Table B-1 the molecular weight for sunflower oil was
calculated as follows:

Appendix B Page 129
Equation MW (g.mol-1
)
Sánchez et al:
Pm = ∑ Pmi Xi
Where:
Pm = oil molecular weight
Pmi = molecular weight of triglyceride from fatty acid methyl esters
Xi = percent fatty acid (proportion)
879.11
Mathiarasi and Partha:
MWoil = 3∑ (MWiXi) + 38.05
Where:
MWoil = Mean molecular weight of sunflower oil
MWi = Molecular weight of ith fatty acid
Xi = mass fraction of the ith fatty acid
38.05 = molecular weight of glycerol backbone
879.16
The molecular weight calculated correspond to the molecular weight for sunflower
oil reported i.e. 876.16 g.mol-1
(Sánchez et al., 2012),

Appendix C Page 130
Appendix C: GC-FID Results for sample BD01
The FAME content and fatty acid composition calculation for sample BD01as an example is
summarised in Table C-1 and Table C-2.
Table C-1: Peak areas taken from GC chromatogram and calculation of Fatty acid compositions
Name
BD01 #1 BD01 #2 BD01 Average Area [pA*s] Composition Area [pA*s] Composition
C14 4.8957 0.2054 2.3153 0.0833 0.1443
C16 164.5476 6.9033 182.5336 6.5645 6.7339
C16:1 1.6575 0.0695 2.5747 0.0926 0.0811
C17 221.6357 - 230.9985 - -
C17:1 - - - - -
C18 158.6023 6.6539 183.6050 6.6030 6.6285
C18:1 trans - - - - -
C18:1 cis 532.9287 22.3580 626.2903 22.5235 22.4407
C18:2 trans - - - - -
C18:2 cis 1475.7106 61.9106 1728.1746 62.1509 62.0308
C20 11.1992 0.4698 14.3457 0.5159 0.4929
C18:3 1.2870 0.0540 1.3367 0.0481 0.0510
C20:1 2.6834 0.1126 3.6931 0.1328 0.1227
C18:3 cis 4.038 0.1694 4.7475 0.1707 0.1701
C20:2 2.0459 0.0858 2.5633 0.0922 0.0890
C22:0 18.9797 0.7963 22.4340 0.8068 0.8015
C24:0 5.0393 0.2114 5.996 0.2156 0.2135
Total Peak Area (C14 to C24) 2605.25 100 3011.6 100 100
Internal Std Peak Area 221.64
231.00 Total peak - Int std peak (C17) 2383.62 2780.61
Internal Std (mg/ml) 5.02
5.02 Interanal Std (g) 1
1
Density Hexane g/ml 0.659
0.659 Volume (ml) Int Std 1.0
1.00
Weight of sample (mg) 55.2
61.2 C 17:0 0.1256
25
0.1270g in 25 ml Hexane 0.005024 g/ml
5.024 mg/ml

Appendix C Page 131
Table C-2: Summary of FAME content calculation
BD01 #1 BD01 #2
Sum Area C14 to C24 2605.251 3011.61
Area Internal Std 221.636 231.00
Concentration Internal Std 5.02 5.02
Volume used Internal Std 1.0 1.0
Weight sample 55.2 61.2
A 10.75 12.04
B 0.09 0.08
Ester content wt. % 97.80 98.74
Average: 98.27 wt.%
From Table C-2:
A = ∑
B =
where,
ΣA = the total peak area from the methyl ester C14 to that in C24:1
AEI = the peak area corresponding to methyl heptadecanoate
CEI = the concentration in milligrams per milliliter of methyl heptadecanoate used
VEI = the volume in milliliters of the methyl heptadecanoate solution used
W = the mass in milligrams of the sample
The GC-FID chromatogram and data for Sample Batch BD01 in duplicate is shown below.

Appendix C Page 132

Appendix C Page 133

Appendix C Page 134

Appendix C Page 135

Appendix D Page 136
Appendix D: 1H –NMR spectra
The methyl ester yield is obtained from the integrated values for the protons for the methyl
ester moiety at 3.7 ppm and the -carbonyl methylene group at 2.3 ppm.
Isbe_SUN.010.001.1r.esp
7.5 7.0 6.5 6.0 5.5 5.0 4.5 4.0 3.5 3.0 2.5 2.0 1.5 1.0 0.5 0
Chemical Shift (ppm)
0.1
0.2
0.3
0.4
0.5
0.6
0.7
0.8
0.9
Nor
mal
ized
Inte
nsity
0.100.060.040.020.02
Sunflower oil

Appendix D Page 137
Isbe_S1.010.001.1r.esp
7.5 7.0 6.5 6.0 5.5 5.0 4.5 4.0 3.5 3.0 2.5 2.0 1.5 1.0 0.5 0
Chemical Shift (ppm)
0.1
0.2
0.3
0.4
0.5
0.6
0.7
0.8
0.9
Nor
mal
ized
Inte
nsity
0.060.04
SET01: 1 minute mixing time
Isbe_S2.010.001.1r.esp
7.5 7.0 6.5 6.0 5.5 5.0 4.5 4.0 3.5 3.0 2.5 2.0 1.5 1.0 0.5 0
Chemical Shift (ppm)
0.1
0.2
0.3
0.4
0.5
0.6
0.7
0.8
0.9
Norm
alized Inte
nsity
0.060.06
SET01: 3 minute mixing time
(ppm) Value
[2.2601 .. 2.4014] 0.05736291
[3.6039 .. 3.7617] 0.04033504
(ppm) Value
[2.2601 .. 2.4014] 0.05670583
[3.6039 .. 3.7617] 0.06234103

Appendix D Page 138
Isbe_S3.010.001.1r.esp
7.5 7.0 6.5 6.0 5.5 5.0 4.5 4.0 3.5 3.0 2.5 2.0 1.5 1.0 0.5 0
Chemical Shift (ppm)
0.1
0.2
0.3
0.4
0.5
0.6
0.7
0.8
0.9
Norm
alized Inte
nsity
0.060.07
SET01: 5 minutes mixing time
Isbe_S4.010.001.1r.esp
7.5 7.0 6.5 6.0 5.5 5.0 4.5 4.0 3.5 3.0 2.5 2.0 1.5 1.0 0.5 0
Chemical Shift (ppm)
0.1
0.2
0.3
0.4
0.5
0.6
0.7
0.8
0.9
Norm
alized Inte
nsity
0.060.07
SET01: 10 minutes mixing time
(ppm) Value
[2.2601 .. 2.4014] 0.05674314
[3.6039 .. 3.7617] 0.06766026
(ppm) Value
[2.2601 .. 2.4014] 0.05629207
[3.6039 .. 3.7617] 0.07281967

Appendix D Page 139
Isbe_S5.010.001.1r.esp
7.5 7.0 6.5 6.0 5.5 5.0 4.5 4.0 3.5 3.0 2.5 2.0 1.5 1.0 0.5 0
Chemical Shift (ppm)
0.1
0.2
0.3
0.4
0.5
0.6
0.7
0.8
0.9
Norm
alized Inte
nsity
0.060.07
SET01: 15 minutes mixing time
Isbe_S6.010.001.1r.esp
7.5 7.0 6.5 6.0 5.5 5.0 4.5 4.0 3.5 3.0 2.5 2.0 1.5 1.0 0.5 0
Chemical Shift (ppm)
0.1
0.2
0.3
0.4
0.5
0.6
0.7
0.8
0.9
Norm
alized Inte
nsity
0.060.08
SET01: 20 minutes mixing time
(ppm) Value
[2.2601 .. 2.4014] 0.05623998
[3.6039 .. 3.7617] 0.07494625
(ppm) Value
[2.2601 .. 2.4014] 0.05653466
[3.6039 .. 3.7617] 0.07634053

Appendix D Page 140
Isbe_S7.010.001.1r.esp
7.5 7.0 6.5 6.0 5.5 5.0 4.5 4.0 3.5 3.0 2.5 2.0 1.5 1.0 0.5 0
Chemical Shift (ppm)
0.1
0.2
0.3
0.4
0.5
0.6
0.7
0.8
0.9
Norm
alized Inte
nsity
0.060.08
SET01: 30 minutes mixing time
Isbe_S8.010.001.1r.esp
7.5 7.0 6.5 6.0 5.5 5.0 4.5 4.0 3.5 3.0 2.5 2.0 1.5 1.0 0.5 0
Chemical Shift (ppm)
0.1
0.2
0.3
0.4
0.5
0.6
0.7
0.8
0.9
Norm
alized Inte
nsity
0.060.08
SET01: 40 minutes mixing time
(ppm) Value
[2.2601 .. 2.4014] 0.05645853
[3.6039 .. 3.7617] 0.07777861
(ppm) Value
[2.2601 .. 2.4014] 0.0561865
[3.6039 .. 3.7617] 0.0788244

Appendix D Page 141
Isbe_S9.010.001.1r.esp
7.5 7.0 6.5 6.0 5.5 5.0 4.5 4.0 3.5 3.0 2.5 2.0 1.5 1.0 0.5 0
Chemical Shift (ppm)
0.1
0.2
0.3
0.4
0.5
0.6
0.7
0.8
0.9
Norm
alized Inte
nsity
0.060.08
SET01: 50 minutes mixing time
Isbe_S10.010.001.1r.esp
7.5 7.0 6.5 6.0 5.5 5.0 4.5 4.0 3.5 3.0 2.5 2.0 1.5 1.0 0.5 0
Chemical Shift (ppm)
0.1
0.2
0.3
0.4
0.5
0.6
0.7
0.8
0.9
Norm
alized Inte
nsity
0.060.08
SET01: 60 minutes mixing time
(ppm) Value
[2.2601 .. 2.4014] 0.05647845
[3.6039 .. 3.7617] 0.07947795
(ppm) Value
[2.2601 .. 2.4014] 0.05631197
[3.6039 .. 3.7617] 0.08048914
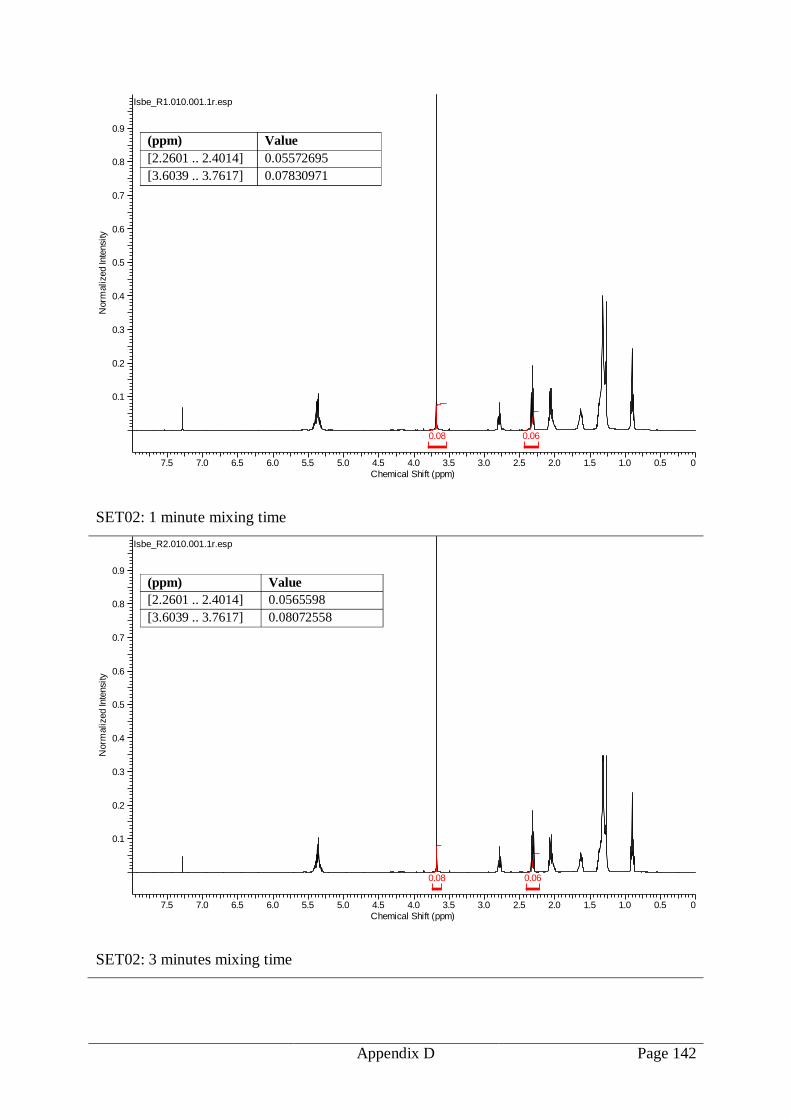
Appendix D Page 142
Isbe_R1.010.001.1r.esp
7.5 7.0 6.5 6.0 5.5 5.0 4.5 4.0 3.5 3.0 2.5 2.0 1.5 1.0 0.5 0
Chemical Shift (ppm)
0.1
0.2
0.3
0.4
0.5
0.6
0.7
0.8
0.9
Norm
alized Inte
nsity
0.060.08
SET02: 1 minute mixing time
Isbe_R2.010.001.1r.esp
7.5 7.0 6.5 6.0 5.5 5.0 4.5 4.0 3.5 3.0 2.5 2.0 1.5 1.0 0.5 0
Chemical Shift (ppm)
0.1
0.2
0.3
0.4
0.5
0.6
0.7
0.8
0.9
Norm
alized Inte
nsity
0.060.08
SET02: 3 minutes mixing time
(ppm) Value
[2.2601 .. 2.4014] 0.05572695
[3.6039 .. 3.7617] 0.07830971
(ppm) Value
[2.2601 .. 2.4014] 0.0565598
[3.6039 .. 3.7617] 0.08072558

Appendix D Page 143
Isbe_R3.010.001.1r.esp
7.5 7.0 6.5 6.0 5.5 5.0 4.5 4.0 3.5 3.0 2.5 2.0 1.5 1.0 0.5 0
Chemical Shift (ppm)
0.1
0.2
0.3
0.4
0.5
0.6
0.7
0.8
0.9
Norm
alized Inte
nsity
0.060.08
SET02: 5 minutes mixing time
Isbe_R4.010.001.1r.esp
7.5 7.0 6.5 6.0 5.5 5.0 4.5 4.0 3.5 3.0 2.5 2.0 1.5 1.0 0.5 0
Chemical Shift (ppm)
0.1
0.2
0.3
0.4
0.5
0.6
0.7
0.8
0.9
Norm
alized Inte
nsity
0.060.08
SET02: 10 minutes mixing time
(ppm) Value
[2.2601 .. 2.4014] 0.05632576
[3.6039 .. 3.7617] 0.08087657
(ppm) Value
[2.2601 ..
2.4014]
0.05640588
[3.6039 ..
3.7617]
0.0809755
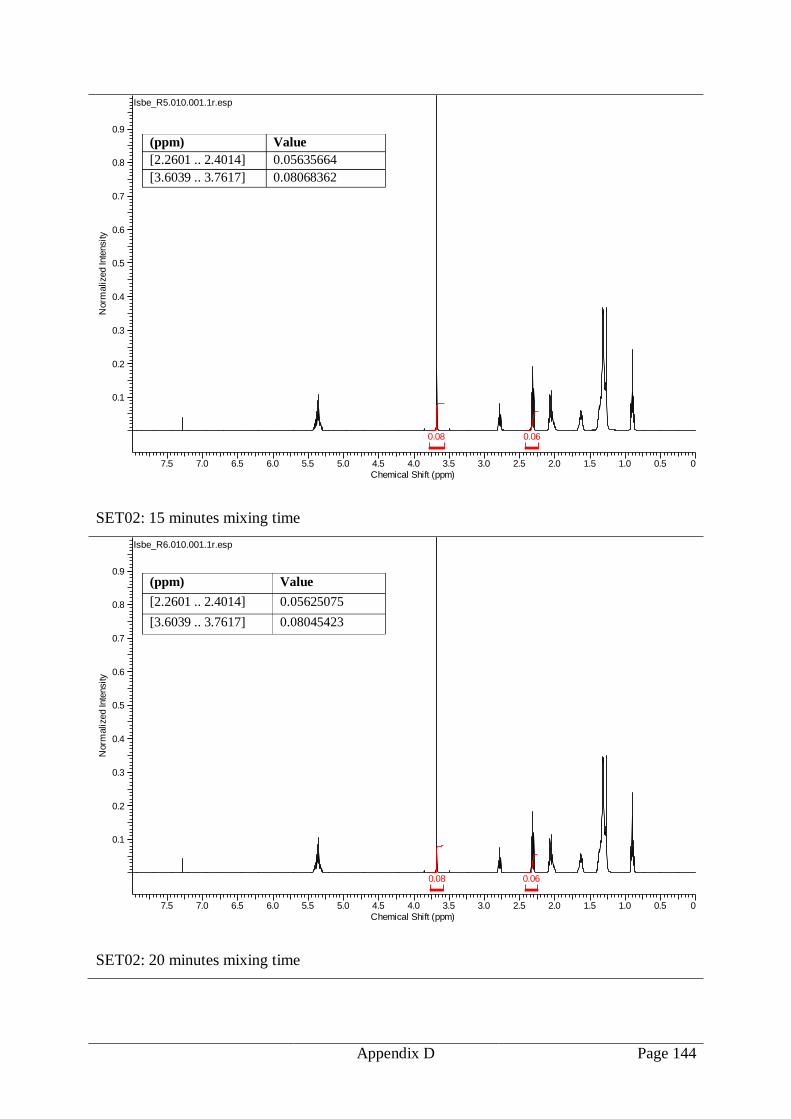
Appendix D Page 144
Isbe_R5.010.001.1r.esp
7.5 7.0 6.5 6.0 5.5 5.0 4.5 4.0 3.5 3.0 2.5 2.0 1.5 1.0 0.5 0
Chemical Shift (ppm)
0.1
0.2
0.3
0.4
0.5
0.6
0.7
0.8
0.9
Norm
alized Inte
nsity
0.060.08
SET02: 15 minutes mixing time
Isbe_R6.010.001.1r.esp
7.5 7.0 6.5 6.0 5.5 5.0 4.5 4.0 3.5 3.0 2.5 2.0 1.5 1.0 0.5 0
Chemical Shift (ppm)
0.1
0.2
0.3
0.4
0.5
0.6
0.7
0.8
0.9
Norm
alized Inte
nsity
0.060.08
SET02: 20 minutes mixing time
(ppm) Value
[2.2601 .. 2.4014] 0.05635664
[3.6039 .. 3.7617] 0.08068362
(ppm) Value
[2.2601 .. 2.4014] 0.05625075
[3.6039 .. 3.7617] 0.08045423

Appendix D Page 145
Isbe_R7.010.001.1r.esp
7.5 7.0 6.5 6.0 5.5 5.0 4.5 4.0 3.5 3.0 2.5 2.0 1.5 1.0 0.5 0
Chemical Shift (ppm)
0.1
0.2
0.3
0.4
0.5
0.6
0.7
0.8
0.9
Norm
alized Inte
nsity
0.060.08
SET02: 30 minutes mixing time
Isbe_R8.010.001.1r.esp
7.5 7.0 6.5 6.0 5.5 5.0 4.5 4.0 3.5 3.0 2.5 2.0 1.5 1.0 0.5 0
Chemical Shift (ppm)
0.1
0.2
0.3
0.4
0.5
0.6
0.7
0.8
0.9
Norm
alized Inte
nsity
0.060.08
SET02: 40 minutes mixing time
(ppm) Value
[2.2601 .. 2.4014] 0.05646878
[3.6039 .. 3.7617] 0.08072736
(ppm) Value
[2.2601 .. 2.4014] 0.0563194
[3.6039 .. 3.7617] 0.08128821

Appendix D Page 146
Isbe_R9.010.001.1r.esp
7.5 7.0 6.5 6.0 5.5 5.0 4.5 4.0 3.5 3.0 2.5 2.0 1.5 1.0 0.5 0
Chemical Shift (ppm)
0.1
0.2
0.3
0.4
0.5
0.6
0.7
0.8
0.9
Norm
alized Inte
nsity
0.060.08
SET02: 50 minutes mixing time
Isbe_R10.010.001.1r.esp
7.5 7.0 6.5 6.0 5.5 5.0 4.5 4.0 3.5 3.0 2.5 2.0 1.5 1.0 0.5 0
Chemical Shift (ppm)
0.1
0.2
0.3
0.4
0.5
0.6
0.7
0.8
0.9
Norm
alized Inte
nsity
0.060.08
SET02: 60 minutes mixing time
(ppm) Value
[2.2601 .. 2.4014] 0.05630282
[3.6039 .. 3.7617] 0.08121462
(ppm) Value
[2.2601 .. 2.4014] 0.05629358
[3.6039 .. 3.7617] 0.08160089


![[G. Pridham] Stabilising Fragile Democracies New (BookZa.org)](https://img.pdfslide.net/doc/110x75/55cf9886550346d03398276b/g-pridham-stabilising-fragile-democracies-new-bookzaorg.jpg)