Embed Size (px)
Citation preview

Copyright © President & Fellows of Harvard College
Stability-Liquidity Tradeoffs in the
Post-Crisis Fixed Income Market
discussion by
VICTORIA IVASHINA
Brookings, November 17, 2015

Liquidity indicators: Treasuries Corporate bonds
Transaction cost “bid-ask spreads widened markedly during the crisis, but have been relatively narrow and stable since” 1
“credit bid-offer at post-crisis lows”2
“much of the time the cost of trading is low”2
Turnover
~30 times/year in 2006 ~10 times/year in 20142 “a doubling in UST outstanding only partly explains the drop in turnover”3
about the same (~1) (2006 vs. 2014)2
Depth “depth rebounded healthily after the crisis, but declined markedly during the 2013 taper tantrum and around the October 15, 2014 flash rally” 1
Transaction size “after declining during the crisis and then rebounding, trade size also declined during the taper tantrum and around the October 15 event” 1
“it is harder to execute larger trades”3
“e-trading is mostly in odd-lots” 3
Price impact “price impact rose sharply during the crisis, declined markedly after, and then increased some during the taper tantrum and in the week including October 15, 2014” 1
Looking for symptoms: State of liquidity
2
1 Adrian et al. (2015)
2 SIFMA
3 Citi Research
• UST and corporate bond liquidity is OK
by historic standards; no evidence to be
concerned
• Issue: what we can measure vs. what we
would like to measure
o We are concerned that liquidity can
suddenly disappear: this is not what we
are assessing when we look at average
levels of liquidity
o Unique factors affect liquidity of USTs, IG
corporate bonds, HY corporate bonds
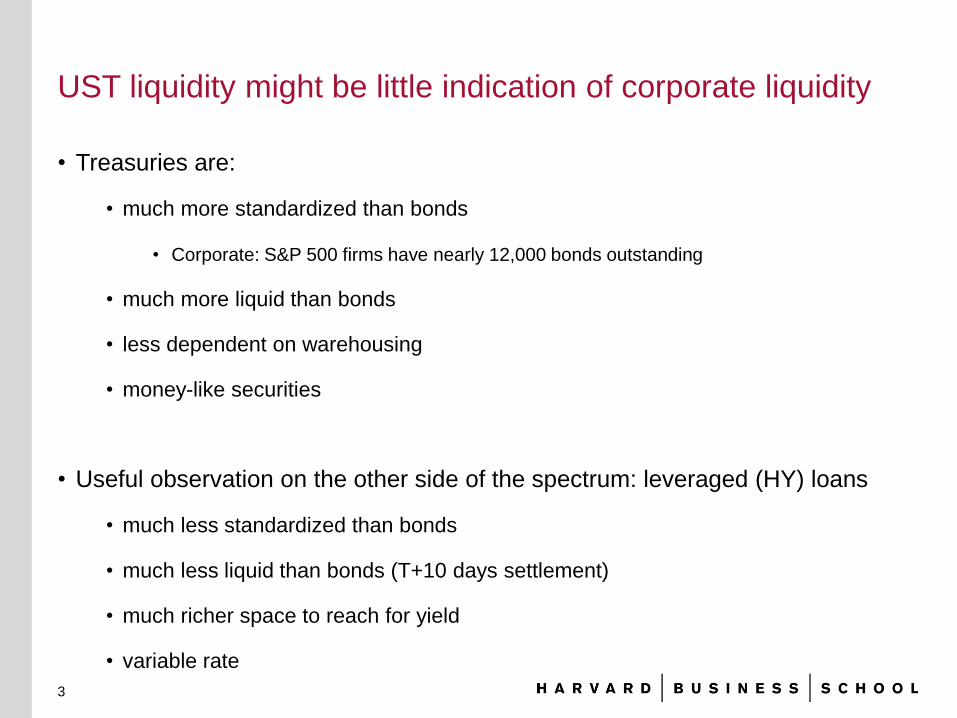
• Treasuries are:
• much more standardized than bonds
• Corporate: S&P 500 firms have nearly 12,000 bonds outstanding
• much more liquid than bonds
• less dependent on warehousing
• money-like securities
• Useful observation on the other side of the spectrum: leveraged (HY) loans
• much less standardized than bonds
• much less liquid than bonds (T+10 days settlement)
• much richer space to reach for yield
• variable rate
3
UST liquidity might be little indication of corporate liquidity

170
131 146
207
310
392
603
266
87
155
388
318
616
582
435
0
100
200
300
400
500
600
700
20
00:Q
3-2
00
1:Q
2
20
01:Q
3-2
00
2:Q
2
20
02:Q
3-2
00
3:Q
2
20
03:Q
3-2
00
4:Q
2
20
04:Q
3-2
00
5:Q
2
20
05:Q
3-2
00
6:Q
2
20
06:Q
3-2
00
7:Q
2
20
07:Q
3-2
00
8:Q
2
20
08:Q
3-2
00
9:Q
2
20
09:Q
3-2
01
0:Q
2
20
10:Q
3-2
01
1:Q
2
20
11:Q
3-2
01
2:Q
2
20
12:Q
3-2
01
3:Q
2
20
13:Q
3-2
01
4:Q
2
20
14:Q
3-2
01
5:Q
2
Bil
lio
n U
SD
Leveraged loans High-yield bonds
Data source: Standard and Poor’s LCD
Note: Data on HY bond issuance data starts in 2005.
U.S. High-Yield Credit Volume (New Issues)

Loan mutual funds’ AUM expanded over eight times
5
Source: S&P, LCD

Net monthly cash inflows to loan funds
6
Source: S&P, LCD

State of liquidity: High Yield Loans
• Turnover: ~10% drop in 3Q2015, ~3% drop in 2Q2015
• But, all in all, no signs of a “run”
7
Source: LSTA

8
Are the accelerating forces from 2008 still in place?
40
50
60
70
80
90
100
110
120
1-May-07 1-May-08 1-May-09
Average Bid Quote for Secondary Loan Market
(leveraged loans)

Less leverage in this segment
9
Source: S&P, LCD
HY Loan Investors (at origination)
TRS structures that dominated
this segment are mostly gone;
now, “managed accounts,” not a
levered structure
Banks substantially cut their
exposure (under Fed scrutiny:
new Leveraged Lending
Guidance), and, of course,
banks’ liability side is in better
shape
CLOs (collateralized loan
obligations) are not mark-to-
market and are not subject to
redemptions; that said, CLO
issuance is contracting since its
peak in 2Q2014
shadow banking
shadow banking

10
In sum
• Evidence to date suggests that, in the near term, short-lived market
dislocations are unlikely to escalate and be a threat to the broader
financial stability
• Even in the leveraged loan market (the most illiquid segment of the
fixed income market), 6 quarters of a very weak mutual fund
environment was not conducive to a sell off
• But some of the forces holding things together are market forces
• Continuous monitoring of liquidity and underlying market structure is
essential