Embed Size (px)
Citation preview
Ultrasonics Sonochemistry 38 (2017) 75–83
Contents lists available at ScienceDirect
Ultrasonics Sonochemistry
journal homepage: www.elsevier .com/locate /u l tson
Stability of cavitation structures in a thin liquid layer
http://dx.doi.org/10.1016/j.ultsonch.2017.03.0021350-4177/� 2017 Elsevier B.V. All rights reserved.
⇑ Corresponding author.E-mail address: [email protected] (L. Bai).
Wu Pengfei a,b, Bai Lixin a,⇑, Lin Weijun a, Yan Jiuchun c
a State Key Laboratory of Acoustics, Institute of Acoustics, Chinese Academy of Sciences, Beijing 100190, ChinabUniversity of Chinese Academy of Sciences, Beijing 100049, Chinac State Key Laboratory of Advanced Welding Production Technology, Harbin Institute of Technology, Harbin 150001, China
a r t i c l e i n f o a b s t r a c t
Article history:Received 19 January 2017Received in revised form 3 March 2017Accepted 3 March 2017Available online 6 March 2017
Keywords:Ultrasonic cavitation structureStabilityCavitation bubble cloudPerturbation
The inception and evolution of acoustic cavitation structures in thin liquid layers under different condi-tions and perturbations are investigated experimentally with high speed photography. The stability andcharacterization of cavitation structures are quantified by image analysis methods. It is found that cav-itation structures (shape of bubble cloud and number of bubbles) are stable under unaltered experimen-tal conditions, and the cavitation bubble cloud will return to the original structure and remain stable evenin the face of large perturbations. When the experimental conditions are altered (for example, acousticintensity, cavitation nuclei, boundary), the cavitation structures will vary correspondingly. Further anal-ysis implies that the stability of cavitation structures is closely related to the number of bubbles in thecavitation bubble cloud. There are two mechanisms acting simultaneously in the cavitation bubble cloudevolution, one ‘‘bubble production” and the other ‘‘bubble disappearance”. We propose that the twomechanisms acting together constitute the most likely explanation for the stability of cavitation struc-tures and their transformation.
� 2017 Elsevier B.V. All rights reserved.
1. Introduction
Applications of ultrasonic cavitation span many industrial sec-tors, from sonochemistry, through ultrasonic cleaning, ultrasoniclithotripsy, sonoporation, emulsification, sludge reduction,nanoparticle preparation and wastewater treatment, to ultrasoniccell disruption [1,2]. It is generally known that cavitation bubbledistribution is spatially inhomogeneous [3]. Numerous radiallyoscillating bubbles move translationally in the acoustic field. Theyare recognized with regularity to form different kinds of cavitationstructures. For example, conical bubble structure (CBS) [4–6],acoustic Lichtenberg figure (ALF) [7–9], tailing bubble structure(TBS) [10,11], jet-induced bubble structure (JSB) [10,11], smokerstructure [12]. It was found that the specific filament branches inALF structures possess a remarkable high stability and long life-time [3]. Ulrich Parlitz [8] (1999) and Robert Mettin [13] (1999)reproduced ALF structures in simulations by the assumption ofan inhomogeneous distribution of bubble sources in space. Basedon the theory of shape instability and diffusive instability for singlebubbles, Zhang Wenjuan [14] (2013) studied the instability of anindividual bubble in a bubble chain (a filament branch in ALFstructures). Alexei Moussatov [4,15] (2003) found that the
macro-structure of the CBS in the vicinity of the radiating surfaceremains remarkably stable, though the streamers in the structureare not stable and fluctuate in space. Bertrand Dubus [5] (2010)and Olivier Louisnard [6] (2012) proposed some explanations forthe physical origin of the CBS from different angles. Bai Lixin [12](2012) found that smoker structures are not stable in long rangand it is hard to predict their positions, however their shape andinternal structures are rather stable. He also investigated the con-trol of TBS and JBS by artificial implants of nuclei based on theirstability [10,11].
Although similar phenomena of cavitation-structure stabilityhave been observed by many others, detailed experimental studyon the macro stability can be rarely find. The details of cavitationstructure are usually difficult to be observed and unsuitable forstability studies because of its three dimensional shape and com-plex mass transfer process with surroundings. To overcome the dif-ficulty, the cavitation structures in thin liquid layers (between twoparallel solid walls) are used to investigate the stability of cavita-tion structures, because the quasi-2D structure can be clearly pho-tographed and easily controlled. The cavitation in thin liquid layerwas first investigated by Alexei Moussatov [16] (2005). He foundthat this configuration lead to a large amplification of the acousticpressure which makes the generation of cavitation possible at lowpower or in a wide frequency range. García-Atance Fatjó [17](2010) investigated the cavitation ring in a thin liquid layer using
76 P. Wu et al. / Ultrasonics Sonochemistry 38 (2017) 75–83
a theoretical model based on the combination of Fluid Mechanicsand Analytical Mechanics. We have already studied the memoryeffect [18] and surface tension [19] of cavitation structures in athin liquid layer, and the stability of cavitation structures will bediscussed in this paper.
2. Experiment
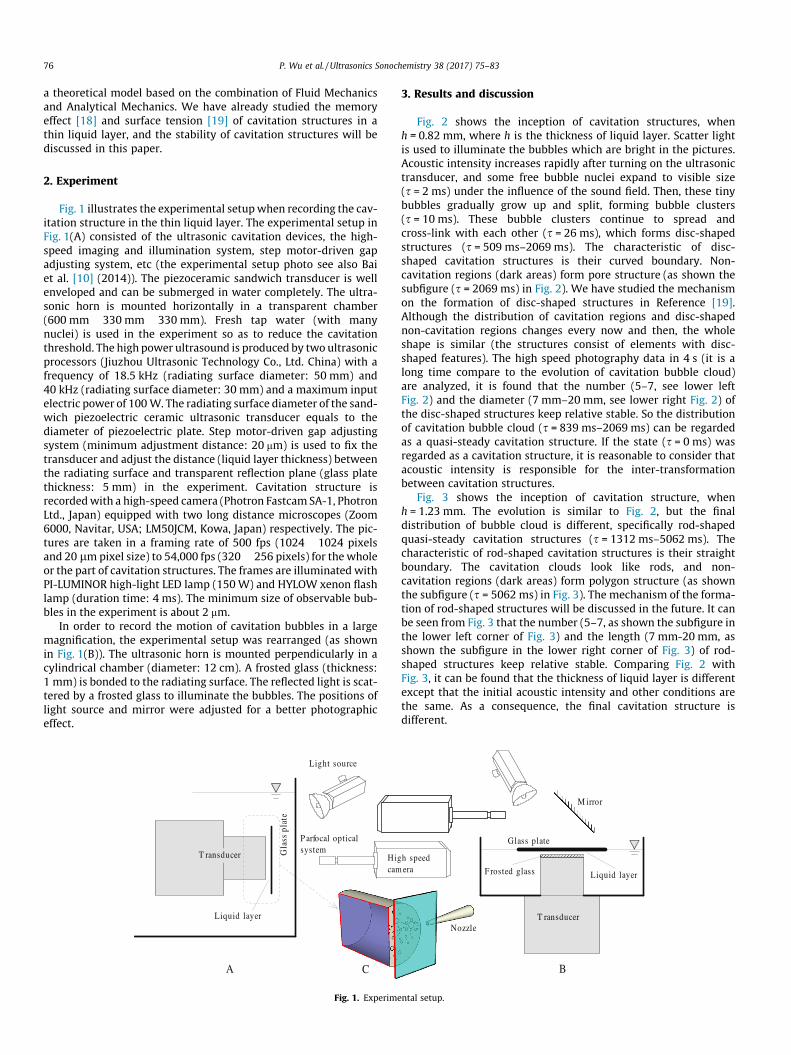
Fig. 1 illustrates the experimental setupwhen recording the cav-itation structure in the thin liquid layer. The experimental setup inFig. 1(A) consisted of the ultrasonic cavitation devices, the high-speed imaging and illumination system, step motor-driven gapadjusting system, etc (the experimental setup photo see also Baiet al. [10] (2014)). The piezoceramic sandwich transducer is wellenveloped and can be submerged in water completely. The ultra-sonic horn is mounted horizontally in a transparent chamber(600 mm � 330 mm � 330 mm). Fresh tap water (with manynuclei) is used in the experiment so as to reduce the cavitationthreshold. The high power ultrasound is produced by two ultrasonicprocessors (Jiuzhou Ultrasonic Technology Co., Ltd. China) with afrequency of 18.5 kHz (radiating surface diameter: 50 mm) and40 kHz (radiating surface diameter: 30 mm) and a maximum inputelectric power of 100 W. The radiating surface diameter of the sand-wich piezoelectric ceramic ultrasonic transducer equals to thediameter of piezoelectric plate. Step motor-driven gap adjustingsystem (minimum adjustment distance: 20 mm) is used to fix thetransducer and adjust the distance (liquid layer thickness) betweenthe radiating surface and transparent reflection plane (glass platethickness: 5 mm) in the experiment. Cavitation structure isrecordedwith a high-speed camera (Photron Fastcam SA-1, PhotronLtd., Japan) equipped with two long distance microscopes (Zoom6000, Navitar, USA; LM50JCM, Kowa, Japan) respectively. The pic-tures are taken in a framing rate of 500 fps (1024 � 1024 pixelsand 20 lmpixel size) to 54,000 fps (320 � 256 pixels) for the wholeor the part of cavitation structures. The frames are illuminated withPI-LUMINOR high-light LED lamp (150 W) and HYLOW xenon flashlamp (duration time: 4 ms). The minimum size of observable bub-bles in the experiment is about 2 mm.
In order to record the motion of cavitation bubbles in a largemagnification, the experimental setup was rearranged (as shownin Fig. 1(B)). The ultrasonic horn is mounted perpendicularly in acylindrical chamber (diameter: 12 cm). A frosted glass (thickness:1 mm) is bonded to the radiating surface. The reflected light is scat-tered by a frosted glass to illuminate the bubbles. The positions oflight source and mirror were adjusted for a better photographiceffect.
P arfocal opticalsystem
Light source
Galss
p al
et
T ransducer
Liquid layer
A C
Higcam
Fig. 1. Experime
3. Results and discussion
Fig. 2 shows the inception of cavitation structures, whenh = 0.82 mm, where h is the thickness of liquid layer. Scatter lightis used to illuminate the bubbles which are bright in the pictures.Acoustic intensity increases rapidly after turning on the ultrasonictransducer, and some free bubble nuclei expand to visible size(s = 2 ms) under the influence of the sound field. Then, these tinybubbles gradually grow up and split, forming bubble clusters(s = 10 ms). These bubble clusters continue to spread andcross-link with each other (s = 26 ms), which forms disc-shapedstructures (s = 509 ms–2069 ms). The characteristic of disc-shaped cavitation structures is their curved boundary. Non-cavitation regions (dark areas) form pore structure (as shown thesubfigure (s = 2069 ms) in Fig. 2). We have studied the mechanismon the formation of disc-shaped structures in Reference [19].Although the distribution of cavitation regions and disc-shapednon-cavitation regions changes every now and then, the wholeshape is similar (the structures consist of elements with disc-shaped features). The high speed photography data in 4 s (it is along time compare to the evolution of cavitation bubble cloud)are analyzed, it is found that the number (5–7, see lower leftFig. 2) and the diameter (7 mm–20 mm, see lower right Fig. 2) ofthe disc-shaped structures keep relative stable. So the distributionof cavitation bubble cloud (s = 839 ms–2069 ms) can be regardedas a quasi-steady cavitation structure. If the state (s = 0 ms) wasregarded as a cavitation structure, it is reasonable to consider thatacoustic intensity is responsible for the inter-transformationbetween cavitation structures.
Fig. 3 shows the inception of cavitation structure, whenh = 1.23 mm. The evolution is similar to Fig. 2, but the finaldistribution of bubble cloud is different, specifically rod-shapedquasi-steady cavitation structures (s = 1312 ms–5062 ms). Thecharacteristic of rod-shaped cavitation structures is their straightboundary. The cavitation clouds look like rods, and non-cavitation regions (dark areas) form polygon structure (as shownthe subfigure (s = 5062 ms) in Fig. 3). The mechanism of the forma-tion of rod-shaped structures will be discussed in the future. It canbe seen from Fig. 3 that the number (5–7, as shown the subfigure inthe lower left corner of Fig. 3) and the length (7 mm-20 mm, asshown the subfigure in the lower right corner of Fig. 3) of rod-shaped structures keep relative stable. Comparing Fig. 2 withFig. 3, it can be found that the thickness of liquid layer is differentexcept that the initial acoustic intensity and other conditions arethe same. As a consequence, the final cavitation structure isdifferent.
Glass plate
T ransducer
Liquid layer
M irror
F rosted glass
B
Nozzle
h speedera
ntal setup.
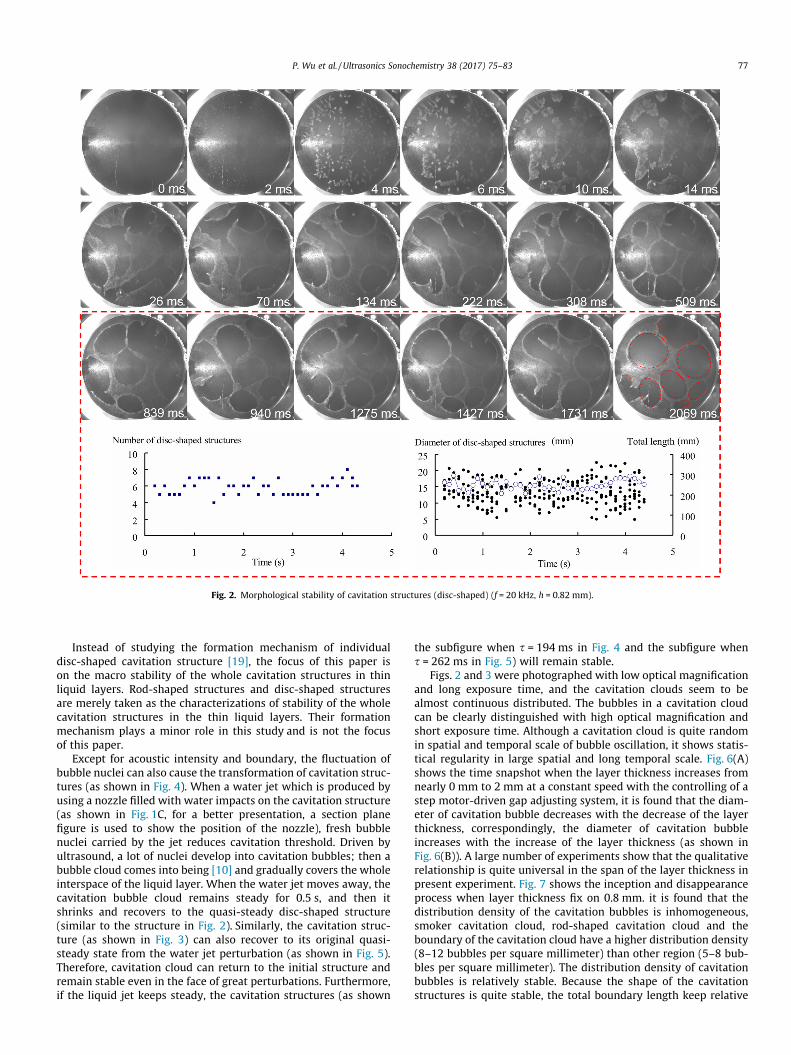
Fig. 2. Morphological stability of cavitation structures (disc-shaped) (f = 20 kHz, h = 0.82 mm).
P. Wu et al. / Ultrasonics Sonochemistry 38 (2017) 75–83 77
Instead of studying the formation mechanism of individualdisc-shaped cavitation structure [19], the focus of this paper ison the macro stability of the whole cavitation structures in thinliquid layers. Rod-shaped structures and disc-shaped structuresare merely taken as the characterizations of stability of the wholecavitation structures in the thin liquid layers. Their formationmechanism plays a minor role in this study and is not the focusof this paper.
Except for acoustic intensity and boundary, the fluctuation ofbubble nuclei can also cause the transformation of cavitation struc-tures (as shown in Fig. 4). When a water jet which is produced byusing a nozzle filled with water impacts on the cavitation structure(as shown in Fig. 1C, for a better presentation, a section planefigure is used to show the position of the nozzle), fresh bubblenuclei carried by the jet reduces cavitation threshold. Driven byultrasound, a lot of nuclei develop into cavitation bubbles; then abubble cloud comes into being [10] and gradually covers the wholeinterspace of the liquid layer. When the water jet moves away, thecavitation bubble cloud remains steady for 0.5 s, and then itshrinks and recovers to the quasi-steady disc-shaped structure(similar to the structure in Fig. 2). Similarly, the cavitation struc-ture (as shown in Fig. 3) can also recover to its original quasi-steady state from the water jet perturbation (as shown in Fig. 5).Therefore, cavitation cloud can return to the initial structure andremain stable even in the face of great perturbations. Furthermore,if the liquid jet keeps steady, the cavitation structures (as shown
the subfigure when s = 194 ms in Fig. 4 and the subfigure whens = 262 ms in Fig. 5) will remain stable.
Figs. 2 and 3 were photographed with low optical magnificationand long exposure time, and the cavitation clouds seem to bealmost continuous distributed. The bubbles in a cavitation cloudcan be clearly distinguished with high optical magnification andshort exposure time. Although a cavitation cloud is quite randomin spatial and temporal scale of bubble oscillation, it shows statis-tical regularity in large spatial and long temporal scale. Fig. 6(A)shows the time snapshot when the layer thickness increases fromnearly 0 mm to 2 mm at a constant speed with the controlling of astep motor-driven gap adjusting system, it is found that the diam-eter of cavitation bubble decreases with the decrease of the layerthickness, correspondingly, the diameter of cavitation bubbleincreases with the increase of the layer thickness (as shown inFig. 6(B)). A large number of experiments show that the qualitativerelationship is quite universal in the span of the layer thickness inpresent experiment. Fig. 7 shows the inception and disappearanceprocess when layer thickness fix on 0.8 mm. it is found that thedistribution density of the cavitation bubbles is inhomogeneous,smoker cavitation cloud, rod-shaped cavitation cloud and theboundary of the cavitation cloud have a higher distribution density(8–12 bubbles per square millimeter) than other region (5–8 bub-bles per square millimeter). The distribution density of cavitationbubbles is relatively stable. Because the shape of the cavitationstructures is quite stable, the total boundary length keep relative
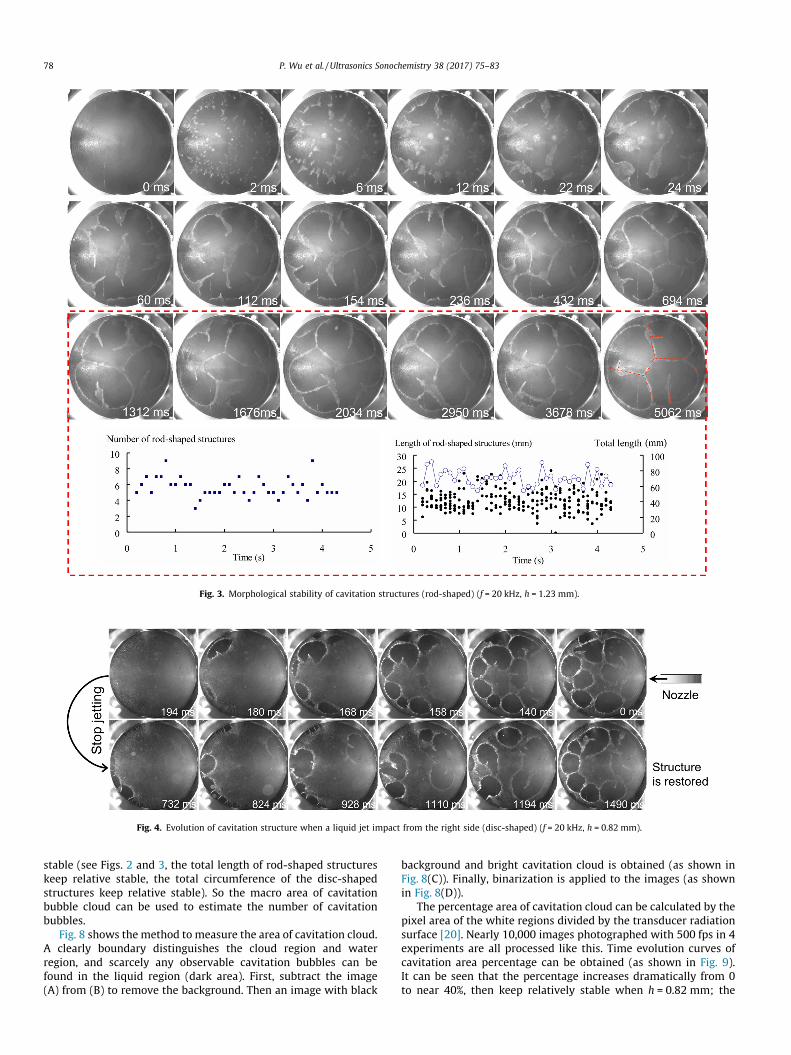
Fig. 3. Morphological stability of cavitation structures (rod-shaped) (f = 20 kHz, h = 1.23 mm).
Fig. 4. Evolution of cavitation structure when a liquid jet impact from the right side (disc-shaped) (f = 20 kHz, h = 0.82 mm).
78 P. Wu et al. / Ultrasonics Sonochemistry 38 (2017) 75–83
stable (see Figs. 2 and 3, the total length of rod-shaped structureskeep relative stable, the total circumference of the disc-shapedstructures keep relative stable). So the macro area of cavitationbubble cloud can be used to estimate the number of cavitationbubbles.
Fig. 8 shows the method to measure the area of cavitation cloud.A clearly boundary distinguishes the cloud region and waterregion, and scarcely any observable cavitation bubbles can befound in the liquid region (dark area). First, subtract the image(A) from (B) to remove the background. Then an image with black
background and bright cavitation cloud is obtained (as shown inFig. 8(C)). Finally, binarization is applied to the images (as shownin Fig. 8(D)).
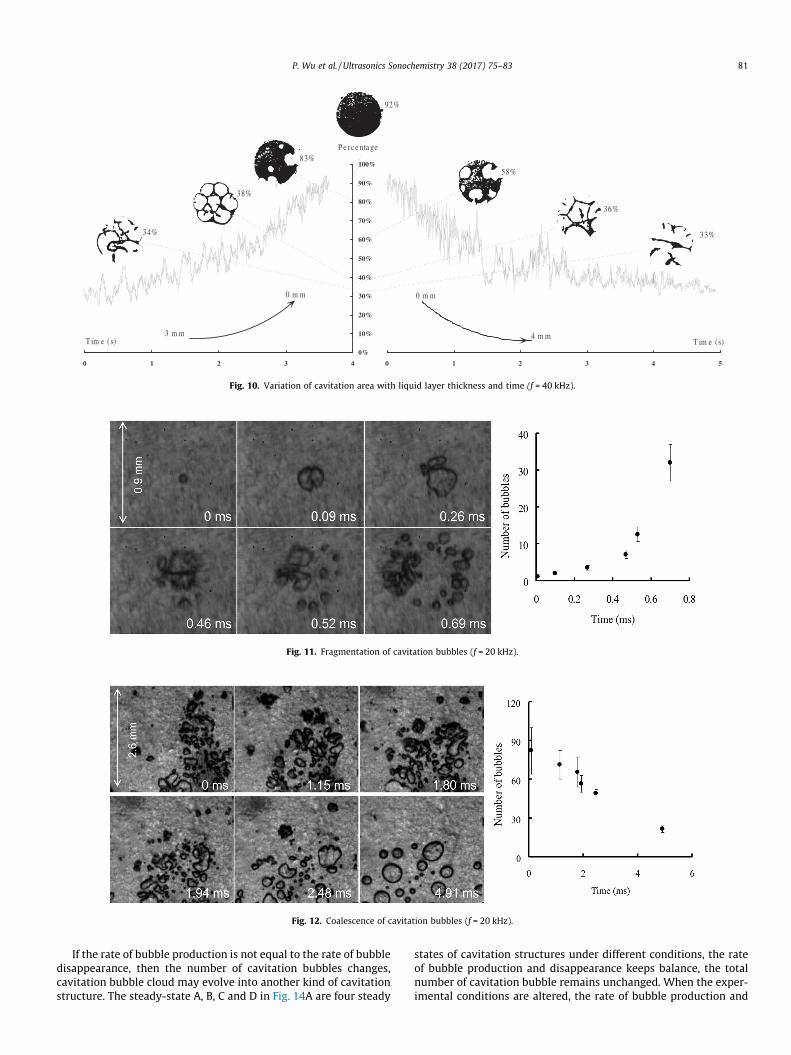
The percentage area of cavitation cloud can be calculated by thepixel area of the white regions divided by the transducer radiationsurface [20]. Nearly 10,000 images photographed with 500 fps in 4experiments are all processed like this. Time evolution curves ofcavitation area percentage can be obtained (as shown in Fig. 9).It can be seen that the percentage increases dramatically from 0to near 40%, then keep relatively stable when h = 0.82 mm; the
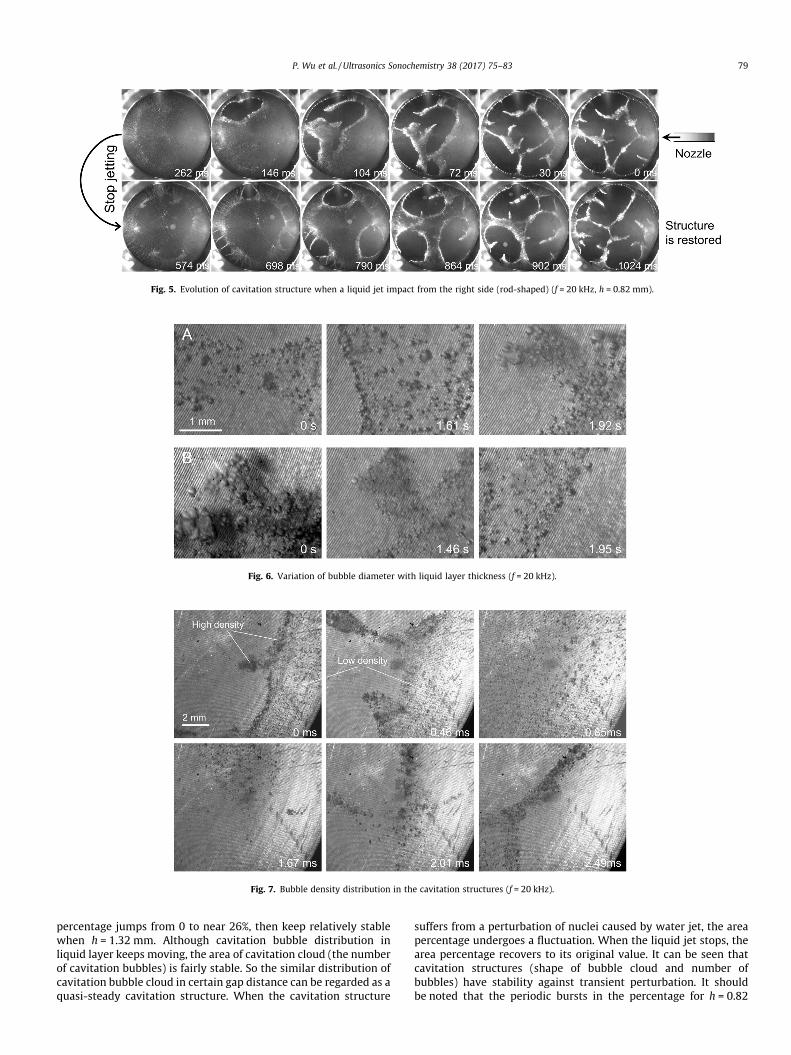
Fig. 5. Evolution of cavitation structure when a liquid jet impact from the right side (rod-shaped) (f = 20 kHz, h = 0.82 mm).
Fig. 6. Variation of bubble diameter with liquid layer thickness (f = 20 kHz).
Fig. 7. Bubble density distribution in the cavitation structures (f = 20 kHz).
P. Wu et al. / Ultrasonics Sonochemistry 38 (2017) 75–83 79
percentage jumps from 0 to near 26%, then keep relatively stablewhen h = 1.32 mm. Although cavitation bubble distribution inliquid layer keeps moving, the area of cavitation cloud (the numberof cavitation bubbles) is fairly stable. So the similar distribution ofcavitation bubble cloud in certain gap distance can be regarded as aquasi-steady cavitation structure. When the cavitation structure
suffers from a perturbation of nuclei caused by water jet, the areapercentage undergoes a fluctuation. When the liquid jet stops, thearea percentage recovers to its original value. It can be seen thatcavitation structures (shape of bubble cloud and number ofbubbles) have stability against transient perturbation. It shouldbe noted that the periodic bursts in the percentage for h = 0.82
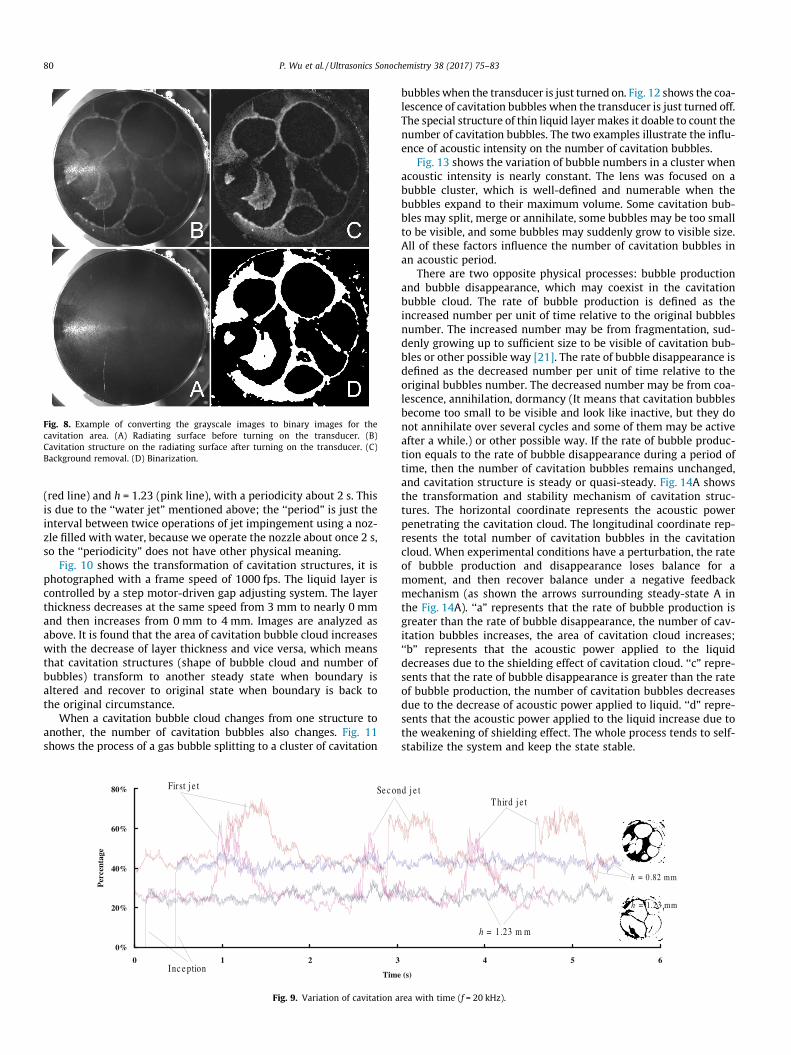
Fig. 8. Example of converting the grayscale images to binary images for thecavitation area. (A) Radiating surface before turning on the transducer. (B)Cavitation structure on the radiating surface after turning on the transducer. (C)Background removal. (D) Binarization.
80 P. Wu et al. / Ultrasonics Sonochemistry 38 (2017) 75–83
(red line) and h = 1.23 (pink line), with a periodicity about 2 s. Thisis due to the ‘‘water jet” mentioned above; the ‘‘period” is just theinterval between twice operations of jet impingement using a noz-zle filled with water, because we operate the nozzle about once 2 s,so the ‘‘periodicity” does not have other physical meaning.
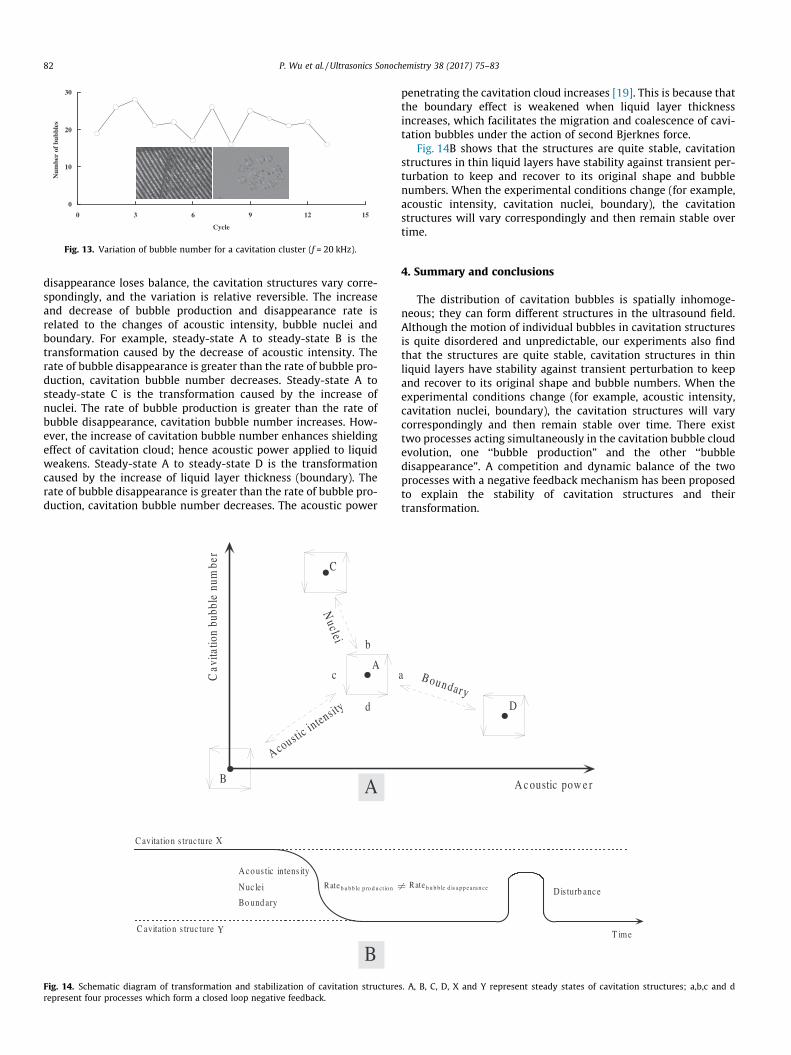
Fig. 10 shows the transformation of cavitation structures, it isphotographed with a frame speed of 1000 fps. The liquid layer iscontrolled by a step motor-driven gap adjusting system. The layerthickness decreases at the same speed from 3 mm to nearly 0 mmand then increases from 0 mm to 4 mm. Images are analyzed asabove. It is found that the area of cavitation bubble cloud increaseswith the decrease of layer thickness and vice versa, which meansthat cavitation structures (shape of bubble cloud and number ofbubbles) transform to another steady state when boundary isaltered and recover to original state when boundary is back tothe original circumstance.
When a cavitation bubble cloud changes from one structure toanother, the number of cavitation bubbles also changes. Fig. 11shows the process of a gas bubble splitting to a cluster of cavitation
0%
20%
40%
60%
80%
3210
Time
egatnecreP
Inc e ption
First j e t Se c on
Fig. 9. Variation of cavitation a
bubbleswhen the transducer is just turned on. Fig. 12 shows the coa-lescence of cavitation bubbles when the transducer is just turned off.The special structure of thin liquid layer makes it doable to count thenumber of cavitation bubbles. The two examples illustrate the influ-ence of acoustic intensity on the number of cavitation bubbles.
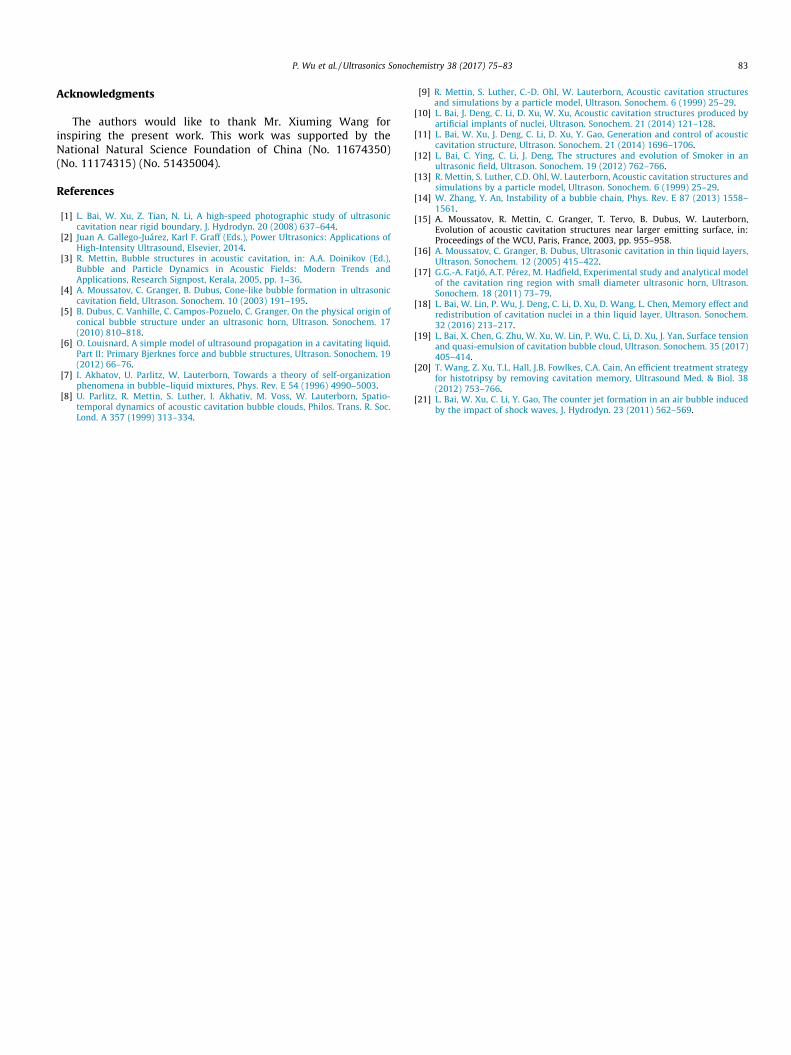
Fig. 13 shows the variation of bubble numbers in a cluster whenacoustic intensity is nearly constant. The lens was focused on abubble cluster, which is well-defined and numerable when thebubbles expand to their maximum volume. Some cavitation bub-bles may split, merge or annihilate, some bubbles may be too smallto be visible, and some bubbles may suddenly grow to visible size.All of these factors influence the number of cavitation bubbles inan acoustic period.
There are two opposite physical processes: bubble productionand bubble disappearance, which may coexist in the cavitationbubble cloud. The rate of bubble production is defined as theincreased number per unit of time relative to the original bubblesnumber. The increased number may be from fragmentation, sud-denly growing up to sufficient size to be visible of cavitation bub-bles or other possible way [21]. The rate of bubble disappearance isdefined as the decreased number per unit of time relative to theoriginal bubbles number. The decreased number may be from coa-lescence, annihilation, dormancy (It means that cavitation bubblesbecome too small to be visible and look like inactive, but they donot annihilate over several cycles and some of them may be activeafter a while.) or other possible way. If the rate of bubble produc-tion equals to the rate of bubble disappearance during a period oftime, then the number of cavitation bubbles remains unchanged,and cavitation structure is steady or quasi-steady. Fig. 14A showsthe transformation and stability mechanism of cavitation struc-tures. The horizontal coordinate represents the acoustic powerpenetrating the cavitation cloud. The longitudinal coordinate rep-resents the total number of cavitation bubbles in the cavitationcloud. When experimental conditions have a perturbation, the rateof bubble production and disappearance loses balance for amoment, and then recover balance under a negative feedbackmechanism (as shown the arrows surrounding steady-state A inthe Fig. 14A). ‘‘a” represents that the rate of bubble production isgreater than the rate of bubble disappearance, the number of cav-itation bubbles increases, the area of cavitation cloud increases;‘‘b” represents that the acoustic power applied to the liquiddecreases due to the shielding effect of cavitation cloud. ‘‘c” repre-sents that the rate of bubble disappearance is greater than the rateof bubble production, the number of cavitation bubbles decreasesdue to the decrease of acoustic power applied to liquid. ‘‘d” repre-sents that the acoustic power applied to the liquid increase due tothe weakening of shielding effect. The whole process tends to self-stabilize the system and keep the state stable.
654
(s)
h = 1.23 mm
h = 0.82 mm
d j e t
h = 1.23 m m
Third j e t
rea with time (f = 20 kHz).
0 1 2 3 4
0%
10%
20%
30%
40%
50%
60%
70%
80%
90%
100%
0 1 2 3 4 5
T im e ( s) T im e (s)
P e rc e nta ge
3 m m
0 m m
4 m m
0 m m
92%
83%
58%
38%
36%
34% 33%
Fig. 10. Variation of cavitation area with liquid layer thickness and time (f = 40 kHz).
Fig. 11. Fragmentation of cavitation bubbles (f = 20 kHz).
Fig. 12. Coalescence of cavitation bubbles (f = 20 kHz).
P. Wu et al. / Ultrasonics Sonochemistry 38 (2017) 75–83 81
If the rate of bubble production is not equal to the rate of bubbledisappearance, then the number of cavitation bubbles changes,cavitation bubble cloud may evolve into another kind of cavitationstructure. The steady-state A, B, C and D in Fig. 14A are four steady
states of cavitation structures under different conditions, the rateof bubble production and disappearance keeps balance, the totalnumber of cavitation bubble remains unchanged. When the exper-imental conditions are altered, the rate of bubble production and
0
10
20
30
0 3 6 9 12 15
Cycle
selbbubfo
rebmu
N
Fig. 13. Variation of bubble number for a cavitation cluster (f = 20 kHz).
82 P. Wu et al. / Ultrasonics Sonochemistry 38 (2017) 75–83
disappearance loses balance, the cavitation structures vary corre-spondingly, and the variation is relative reversible. The increaseand decrease of bubble production and disappearance rate isrelated to the changes of acoustic intensity, bubble nuclei andboundary. For example, steady-state A to steady-state B is thetransformation caused by the decrease of acoustic intensity. Therate of bubble disappearance is greater than the rate of bubble pro-duction, cavitation bubble number decreases. Steady-state A tosteady-state C is the transformation caused by the increase ofnuclei. The rate of bubble production is greater than the rate ofbubble disappearance, cavitation bubble number increases. How-ever, the increase of cavitation bubble number enhances shieldingeffect of cavitation cloud; hence acoustic power applied to liquidweakens. Steady-state A to steady-state D is the transformationcaused by the increase of liquid layer thickness (boundary). Therate of bubble disappearance is greater than the rate of bubble pro-duction, cavitation bubble number decreases. The acoustic power
C avitatio n s truc ture
C avitatio n s truc ture
Ac o us tic intens ity
Nuc lei
Bo und ary
Rateb u bb le p ro d u ct io n
A
B
C
Cav
itatio
nbu
bble
num
ber
b
c
d
A
B
Acousticintensity
Nuclei
Y
X
Fig. 14. Schematic diagram of transformation and stabilization of cavitation structurerepresent four processes which form a closed loop negative feedback.
penetrating the cavitation cloud increases [19]. This is because thatthe boundary effect is weakened when liquid layer thicknessincreases, which facilitates the migration and coalescence of cavi-tation bubbles under the action of second Bjerknes force.
Fig. 14B shows that the structures are quite stable, cavitationstructures in thin liquid layers have stability against transient per-turbation to keep and recover to its original shape and bubblenumbers. When the experimental conditions change (for example,acoustic intensity, cavitation nuclei, boundary), the cavitationstructures will vary correspondingly and then remain stable overtime.
4. Summary and conclusions
The distribution of cavitation bubbles is spatially inhomoge-neous; they can form different structures in the ultrasound field.Although the motion of individual bubbles in cavitation structuresis quite disordered and unpredictable, our experiments also findthat the structures are quite stable, cavitation structures in thinliquid layers have stability against transient perturbation to keepand recover to its original shape and bubble numbers. When theexperimental conditions change (for example, acoustic intensity,cavitation nuclei, boundary), the cavitation structures will varycorrespondingly and then remain stable over time. There existtwo processes acting simultaneously in the cavitation bubble cloudevolution, one ‘‘bubble production” and the other ‘‘bubbledisappearance”. A competition and dynamic balance of the twoprocesses with a negative feedback mechanism has been proposedto explain the stability of cavitation structures and theirtransformation.
Dis turb anc e
T ime
Rateb u b ble d is a pp e a ra n ce
D
A c oustic pow e r
a Boundary
s. A, B, C, D, X and Y represent steady states of cavitation structures; a,b,c and d
P. Wu et al. / Ultrasonics Sonochemistry 38 (2017) 75–83 83
Acknowledgments
The authors would like to thank Mr. Xiuming Wang forinspiring the present work. This work was supported by theNational Natural Science Foundation of China (No. 11674350)(No. 11174315) (No. 51435004).
References
[1] L. Bai, W. Xu, Z. Tian, N. Li, A high-speed photographic study of ultrasoniccavitation near rigid boundary, J. Hydrodyn. 20 (2008) 637–644.
[2] Juan A. Gallego-Juárez, Karl F. Graff (Eds.), Power Ultrasonics: Applications ofHigh-Intensity Ultrasound, Elsevier, 2014.
[3] R. Mettin, Bubble structures in acoustic cavitation, in: A.A. Doinikov (Ed.),Bubble and Particle Dynamics in Acoustic Fields: Modern Trends andApplications, Research Signpost, Kerala, 2005, pp. 1–36.
[4] A. Moussatov, C. Granger, B. Dubus, Cone-like bubble formation in ultrasoniccavitation field, Ultrason. Sonochem. 10 (2003) 191–195.
[5] B. Dubus, C. Vanhille, C. Campos-Pozuelo, C. Granger, On the physical origin ofconical bubble structure under an ultrasonic horn, Ultrason. Sonochem. 17(2010) 810–818.
[6] O. Louisnard, A simple model of ultrasound propagation in a cavitating liquid.Part II: Primary Bjerknes force and bubble structures, Ultrason. Sonochem. 19(2012) 66–76.
[7] I. Akhatov, U. Parlitz, W. Lauterborn, Towards a theory of self-organizationphenomena in bubble–liquid mixtures, Phys. Rev. E 54 (1996) 4990–5003.
[8] U. Parlitz, R. Mettin, S. Luther, I. Akhativ, M. Voss, W. Lauterborn, Spatio-temporal dynamics of acoustic cavitation bubble clouds, Philos. Trans. R. Soc.Lond. A 357 (1999) 313–334.
[9] R. Mettin, S. Luther, C.-D. Ohl, W. Lauterborn, Acoustic cavitation structuresand simulations by a particle model, Ultrason. Sonochem. 6 (1999) 25–29.
[10] L. Bai, J. Deng, C. Li, D. Xu, W. Xu, Acoustic cavitation structures produced byartificial implants of nuclei, Ultrason. Sonochem. 21 (2014) 121–128.
[11] L. Bai, W. Xu, J. Deng, C. Li, D. Xu, Y. Gao, Generation and control of acousticcavitation structure, Ultrason. Sonochem. 21 (2014) 1696–1706.
[12] L. Bai, C. Ying, C. Li, J. Deng, The structures and evolution of Smoker in anultrasonic field, Ultrason. Sonochem. 19 (2012) 762–766.
[13] R. Mettin, S. Luther, C.D. Ohl, W. Lauterborn, Acoustic cavitation structures andsimulations by a particle model, Ultrason. Sonochem. 6 (1999) 25–29.
[14] W. Zhang, Y. An, Instability of a bubble chain, Phys. Rev. E 87 (2013) 1558–1561.
[15] A. Moussatov, R. Mettin, C. Granger, T. Tervo, B. Dubus, W. Lauterborn,Evolution of acoustic cavitation structures near larger emitting surface, in:Proceedings of the WCU, Paris, France, 2003, pp. 955–958.
[16] A. Moussatov, C. Granger, B. Dubus, Ultrasonic cavitation in thin liquid layers,Ultrason. Sonochem. 12 (2005) 415–422.
[17] G.G.-A. Fatjó, A.T. Pérez, M. Hadfield, Experimental study and analytical modelof the cavitation ring region with small diameter ultrasonic horn, Ultrason.Sonochem. 18 (2011) 73–79.
[18] L. Bai, W. Lin, P. Wu, J. Deng, C. Li, D. Xu, D. Wang, L. Chen, Memory effect andredistribution of cavitation nuclei in a thin liquid layer, Ultrason. Sonochem.32 (2016) 213–217.
[19] L. Bai, X. Chen, G. Zhu, W. Xu, W. Lin, P. Wu, C. Li, D. Xu, J. Yan, Surface tensionand quasi-emulsion of cavitation bubble cloud, Ultrason. Sonochem. 35 (2017)405–414.
[20] T. Wang, Z. Xu, T.L. Hall, J.B. Fowlkes, C.A. Cain, An efficient treatment strategyfor histotripsy by removing cavitation memory, Ultrasound Med. & Biol. 38(2012) 753–766.
[21] L. Bai, W. Xu, C. Li, Y. Gao, The counter jet formation in an air bubble inducedby the impact of shock waves, J. Hydrodyn. 23 (2011) 562–569.