Embed Size (px)
Citation preview
Van der Plas, Van der Meer, Dominguez and Bijl BW17:71:1
STABILITY OF VERY WIDE GRADED MATERIAL, DESIGNED AS BREAKWATER CORE, UNDER WAVE ATTACK
Ton van der Plas, Bontrup Logistics, Amsterdam, The Netherlands Jentsje van der Meer, Van der Meer Consulting bv, Akkrum, The Netherlands Enrique Ripoll Dominguez, Inha, Euroconsult Group, Spain Eelco Bijl, CDR International BV, The Netherlands
Abstract A breakwater core typically consists of quarry run with a wide gradation up to 500kg or 1000kg. The use of this material can however lead to significant logistical and environmental problems during construction, not in the least associated with the intensive use of road going (construction) vehicles. As an alternative so-called Wide Grade material can be considered. This material, with a typical grading in the range of 0-200mm (~ 0/20kg), is readily available and can be produced, loaded and discharged quickly with large marine-borne bulk carriers and, given the right conditions, placed directly into the breakwater core. The main question however is whether this relatively small material is stable under typical wave conditions that may be expected during construction, before it is covered by subsequent filter and armour layers. This paper presents the results of extensive physical scale model testing carried out on this material. The tests show that the damage is relatively small for submerged berms, up to fairly extreme wave events. Comparison with existing theory is partly inconclusive for low-crested and near-bed structures because of the limited validity range of existing design methods. For emergent structures a relatively good match was found with the BREAKWAT model predictions. Finally, a method is suggested to use Wide Grade in the construction of a breakwater core, making use of the test results.
Introduction
Background A breakwater core typically consists of quarry run with a wide gradation up to 500kg or 1000kg. The principle idea being that the quarry run forms the left-over from the quarry after under layers and rock armour have been extracted. Hence it would be economical to use this in the breakwater design. In practice however, there may be several drawbacks to use core material from local quarries. First of all, the quarry run is handled using equipment such as front loaders and excavators and often has to be transported by (dump) trucks to either project site or loading quay. This means that the production rates are limited. Secondly, many quarries are land locked and using these for marine projects often means intensive use of the local road network, sometimes through large cities, congestion and significant environmental impacts. The use of dump trucks and end tipping requires a wide enough crest that may be dominated by construction requirements (passing of trucks and cranes, etc.), and may become a limitation in terms of work progress. The above challenges become even more significant, considering that the core material often constitutes a significant part of the overall breakwater volume. As an alternative, the use of 0-200mm Wide Grade material is proposed. This material is produced in a few specific quarries as a base material for a range of aggregates. Distinct (intrinsic) qualities of the material are depending on the source, but can typically be characterised as: high quality, constant grading, crushed and angular material, free of organic matter. Distinct logistical advantages are that the material can be produced quickly, loaded quickly on large bulk carriers and given the right vessel type, unloaded quickly as well by using conveyor belts or vessel gantry cranes. As a result, the material is
Van der Plas, Van der Meer, Dominguez and Bijl BW17:71:2
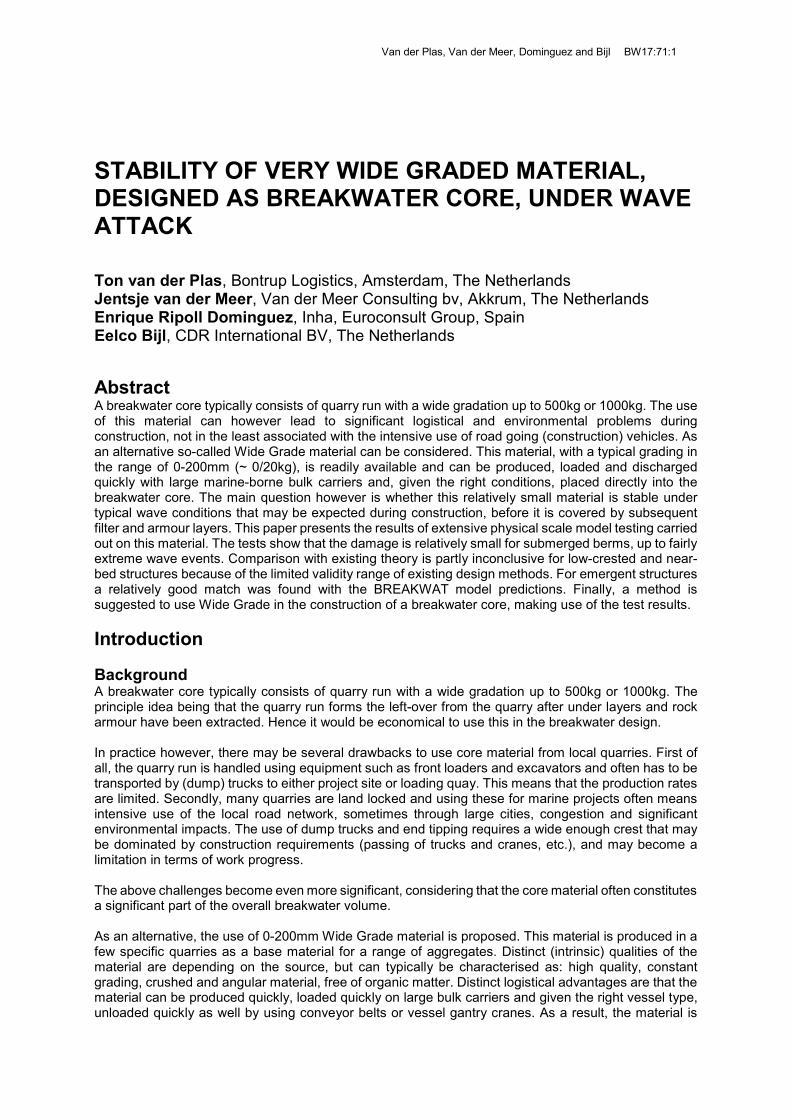
very economical to utilize even in projects thousands of kilometres from the quarry, in particular when considering large deep water breakwater projects. Because of the appealing prospects, Wide Grade is currently applied in large breakwater projects and is under consideration for other breakwater projects as well. The main question posed by clients, contractors and designers is whether the material is sufficiently stable during construction, before protective filter and/or under layers and armour layers can be placed on top. Existing design guidance for this type of structure and material during construction is very limited, or non-existing, because of the following unique characteristics, see also Figure 1:
• A D85/D15-ratio in the range 10–20, i.e. a very wide gradation; • A D50 in the range of 40-70 mm; • A long fine tail with D10 in the range of 1-10mm and including fines.
For the above reasons it was decided to undertake 2D physical modelling of this material, on a large scale, to represent as much of the original grading and minimize model scale effects. Various construction stages with submerged as well as emerged crest levels have been considered.
Figure 1: Typical Wide Grade grading curve
Physical model tests and results This section provides a summary of the physical model tests that were conducted at INHA (Barcelona) in the summer of 2016. The primary objective of the model tests was to measure the stability of the Wide Grade material under wave attack, for a range of conditions and construction stages. Some further tests were carried out simulating continuous placement of the wide grade as well as looking into the performance of wide grade as filter layer under an armour layer.
Model set-up
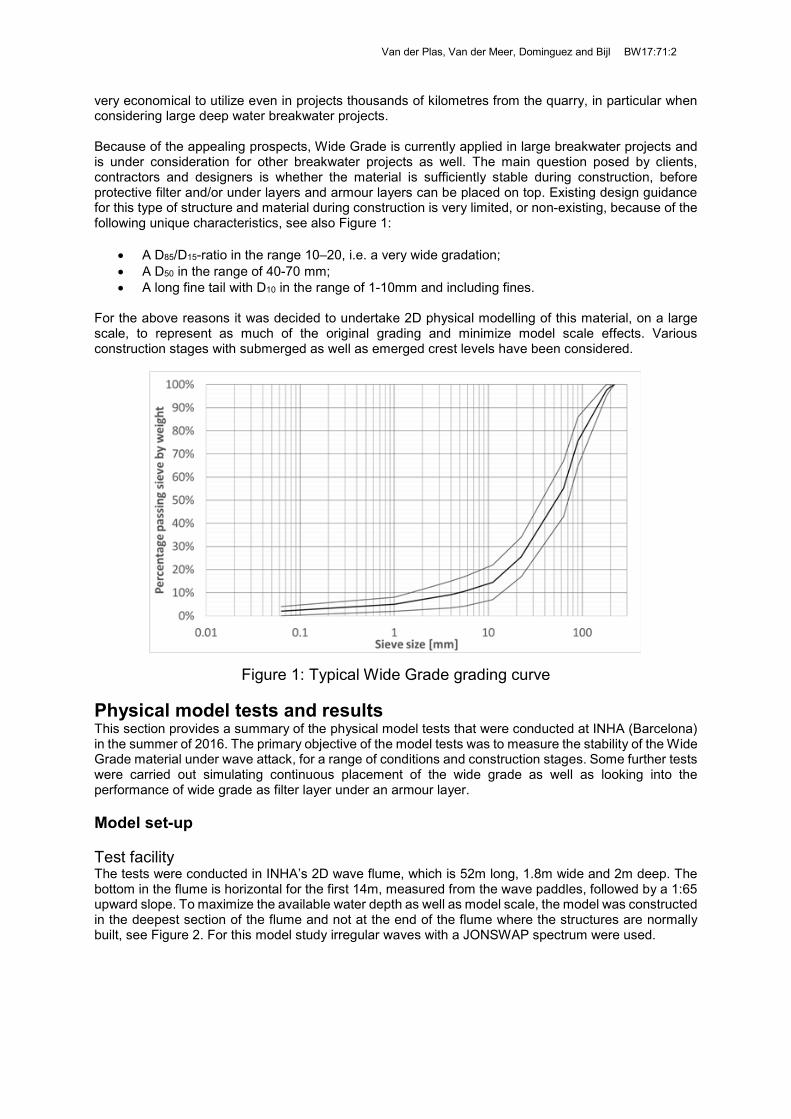
Test facility The tests were conducted in INHA’s 2D wave flume, which is 52m long, 1.8m wide and 2m deep. The bottom in the flume is horizontal for the first 14m, measured from the wave paddles, followed by a 1:65 upward slope. To maximize the available water depth as well as model scale, the model was constructed in the deepest section of the flume and not at the end of the flume where the structures are normally built, see Figure 2. For this model study irregular waves with a JONSWAP spectrum were used.
Van der Plas, Van der Meer, Dominguez and Bijl BW17:71:3
Figure 2: Longitudinal section of the INHA flume showing the location of the Wide Grade core (left) and Wide Grade core with drag arm on the right
Model scale The Wide Grade material originates from Bontrup’s quarry in Bremanger, Norway. In order to reduce model effects and to maintain the original characteristics such as particle density, roughness, shape etc, as good as possible, it was decided to sieve the original material for use in the model study. A key characteristic of this Wide Grade material is the long tail of finer particles. Removal of the finer particles (as is sometimes done in physical scale model tests), would result in a significant difference between the prototype grading and the model grading. The presence of finer particles on the other hand can lead to scale effects which would invalidate the model test results as well. A compromise was found in the following set of measures:
• Detailed analysis of the best scaling model to be adopted (see section below) • The model scale had to be as big as possible. A geometrical scale of 1:10 was selected. • The original grading of 0/200mm was reduced by a factor 10. No removal of fines was applied.
This grading is referred to as Type I, and was used for tests on Sections A-E • A control grading was constructed where all particles < 2mm were removed. This model grading
is referred to as Type II, and was used for the test on Section F. The selected model for scaling was the Best Model, with a model material density equal to the prototype material density. The Best Model provides similitude of the relative submerged density, relative length and the densimetric Froude number. For the relative fall velocity of the particles, the adopted scaling model does not maintain similitude. It was however argued that in this model study the bed load transport is dominant over the suspended load transport, which makes the particles behaviour in suspension far less relevant. Also, the non-compliance of the Best Model with regard to the grain size Reynolds number is not a problem provided that a rough turbulent regime exists around the bed. Analysis of the critical Shields number in both model and prototype, following the method described in the Rock Manual (2007), showed that the viscous effects can be considered negligible and that the initiation of motion in prototype is accurately represented in the model. It was concluded that the selected model (Best Model) together with the large scale (1:10) and the control test measures (with Type II material) would be appropriate to measure the stability of the Wide Grade material under wave attack.
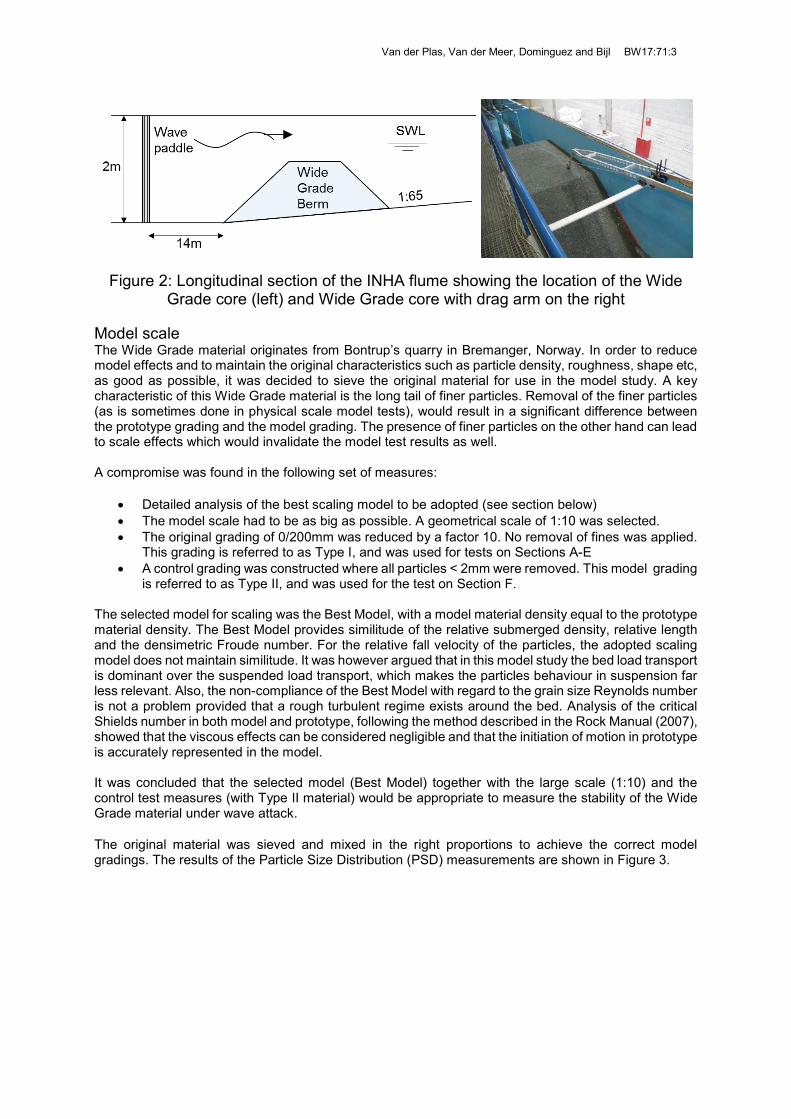
The original material was sieved and mixed in the right proportions to achieve the correct model gradings. The results of the Particle Size Distribution (PSD) measurements are shown in Figure 3.
Van der Plas, Van der Meer, Dominguez and Bijl BW17:71:4
Figure 3: PSD results for the used model gradings. The black lines show the 1:10 scaled Wide Grade limits.
The available depth in the INHA flume of 2m, combined with a scale of 1:10, allowed water depths of up to 15m in prototype and significant wave heights up to about 3.5m. A 15m water depth was deemed adequate considering typical water depths for deep water breakwaters and the fact that optimal delivery of the material requires vessels with a draft of about 12m minimum.
Damage measurements Damage measurements were carried out using a drag arm, which was pulled over the structure using a system of 4 electric motors. Continuous measurements of the rotation of the probe together with the horizontal position gives a very accurate profile of the structure. For each test, 3 profiles were taken, 20cm from the sides of the flume and in the centre line. This system could be used under water as well, which allowed rapid damage measurements after each test without having to drain the flume, see Figure 2 (right). After each test series, the material at outline (crest and slopes) was removed and replaced with new material.
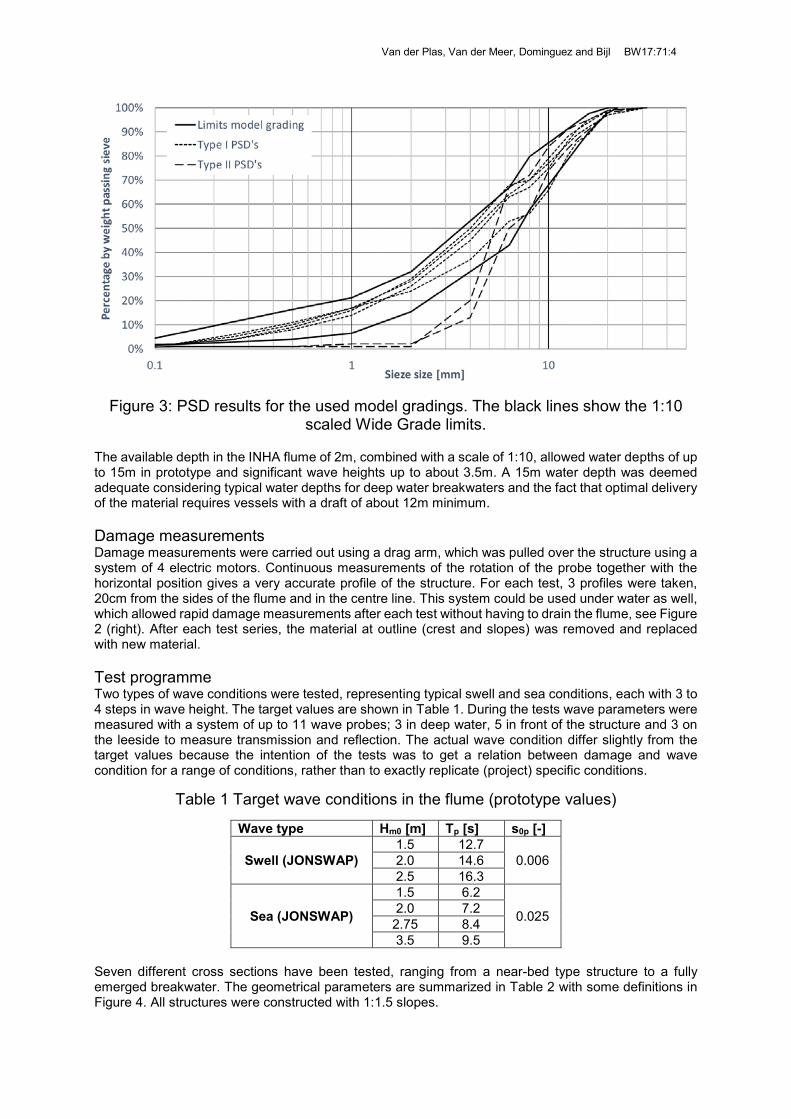
Test programme Two types of wave conditions were tested, representing typical swell and sea conditions, each with 3 to 4 steps in wave height. The target values are shown in Table 1. During the tests wave parameters were measured with a system of up to 11 wave probes; 3 in deep water, 5 in front of the structure and 3 on the leeside to measure transmission and reflection. The actual wave condition differ slightly from the target values because the intention of the tests was to get a relation between damage and wave condition for a range of conditions, rather than to exactly replicate (project) specific conditions.
Table 1 Target wave conditions in the flume (prototype values)
Wave type Hm0 [m] Tp [s] s0p [-]
Swell (JONSWAP) 1.5 12.7
0.006 2.0 14.6 2.5 16.3
Sea (JONSWAP)
1.5 6.2
0.025 2.0 7.2 2.75 8.4 3.5 9.5
Seven different cross sections have been tested, ranging from a near-bed type structure to a fully emerged breakwater. The geometrical parameters are summarized in Table 2 with some definitions in Figure 4. All structures were constructed with 1:1.5 slopes.
Van der Plas, Van der Meer, Dominguez and Bijl BW17:71:5
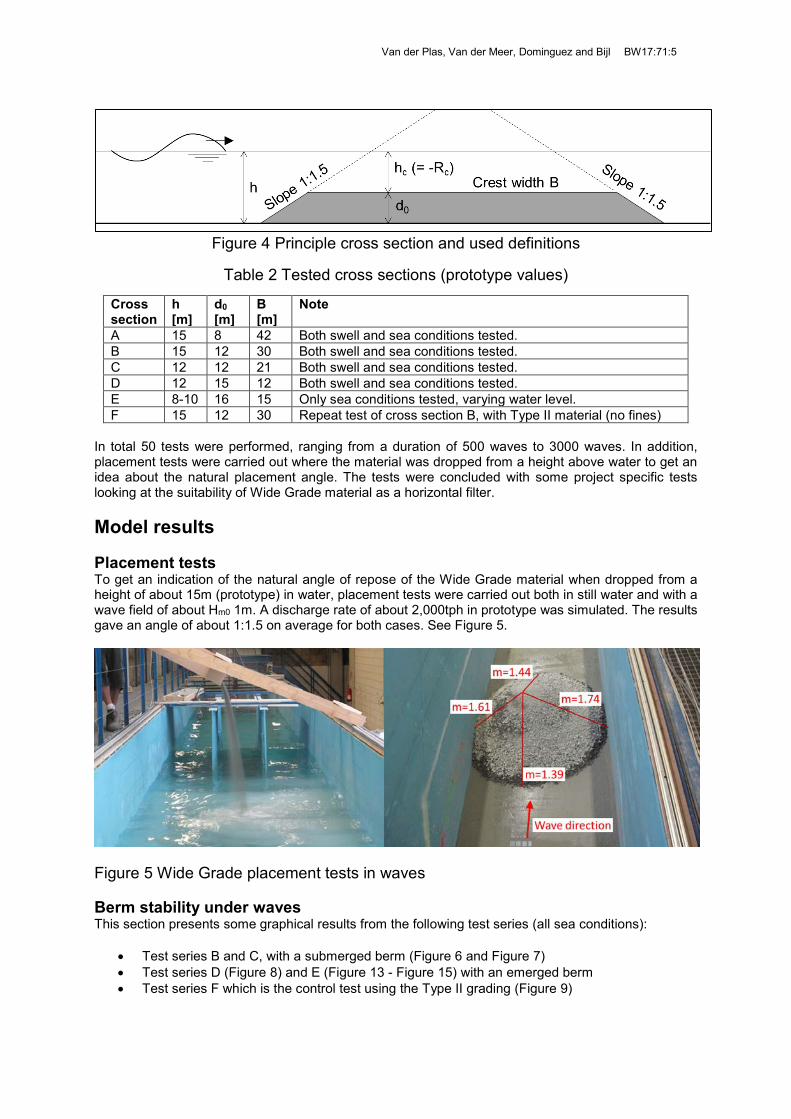
Figure 4 Principle cross section and used definitions
Table 2 Tested cross sections (prototype values)
Cross section
h [m]
d0 [m]
B [m]
Note
A 15 8 42 Both swell and sea conditions tested. B 15 12 30 Both swell and sea conditions tested. C 12 12 21 Both swell and sea conditions tested. D 12 15 12 Both swell and sea conditions tested. E 8-10 16 15 Only sea conditions tested, varying water level. F 15 12 30 Repeat test of cross section B, with Type II material (no fines)
In total 50 tests were performed, ranging from a duration of 500 waves to 3000 waves. In addition, placement tests were carried out where the material was dropped from a height above water to get an idea about the natural placement angle. The tests were concluded with some project specific tests looking at the suitability of Wide Grade material as a horizontal filter.
Model results
Placement tests To get an indication of the natural angle of repose of the Wide Grade material when dropped from a height of about 15m (prototype) in water, placement tests were carried out both in still water and with a wave field of about Hm0 1m. A discharge rate of about 2,000tph in prototype was simulated. The results gave an angle of about 1:1.5 on average for both cases. See Figure 5.
Figure 5 Wide Grade placement tests in waves
Berm stability under waves This section presents some graphical results from the following test series (all sea conditions):
• Test series B and C, with a submerged berm (Figure 6 and Figure 7) • Test series D (Figure 8) and E (Figure 13 - Figure 15) with an emerged berm • Test series F which is the control test using the Type II grading (Figure 9)
Van der Plas, Van der Meer, Dominguez and Bijl BW17:71:6
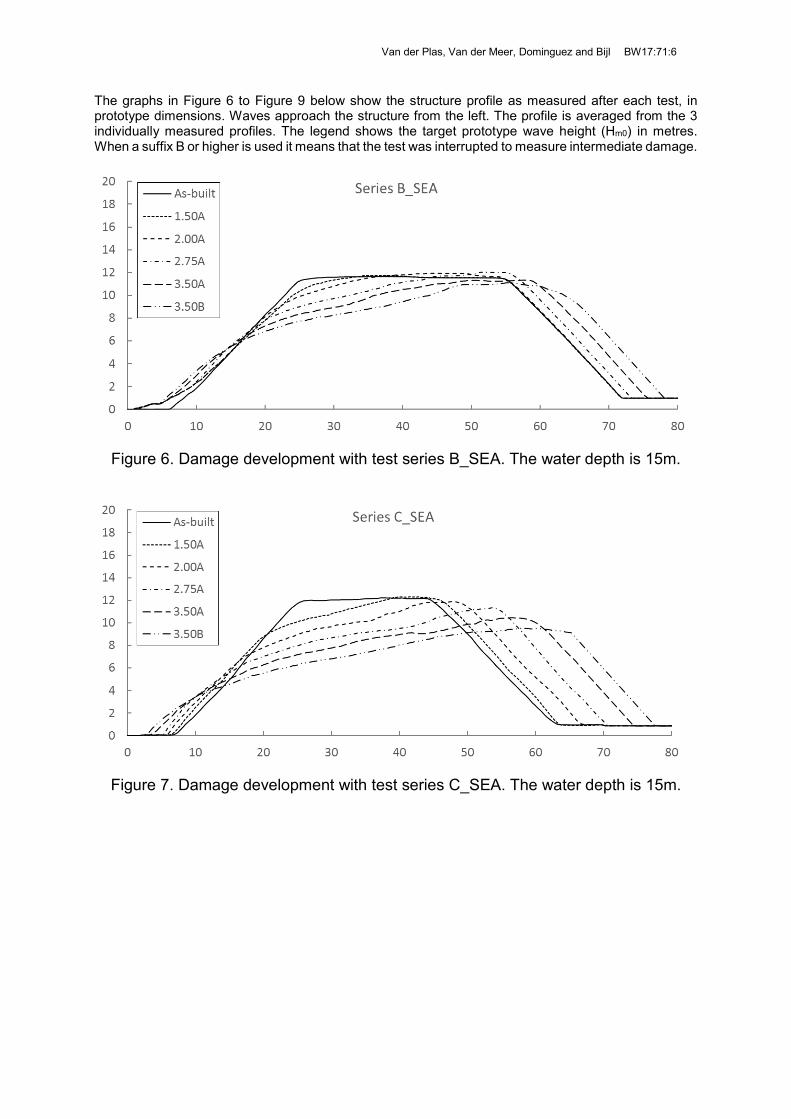
The graphs in Figure 6 to Figure 9 below show the structure profile as measured after each test, in prototype dimensions. Waves approach the structure from the left. The profile is averaged from the 3 individually measured profiles. The legend shows the target prototype wave height (Hm0) in metres. When a suffix B or higher is used it means that the test was interrupted to measure intermediate damage.
Figure 6. Damage development with test series B_SEA. The water depth is 15m.
Figure 7. Damage development with test series C_SEA. The water depth is 15m.
Van der Plas, Van der Meer, Dominguez and Bijl BW17:71:7
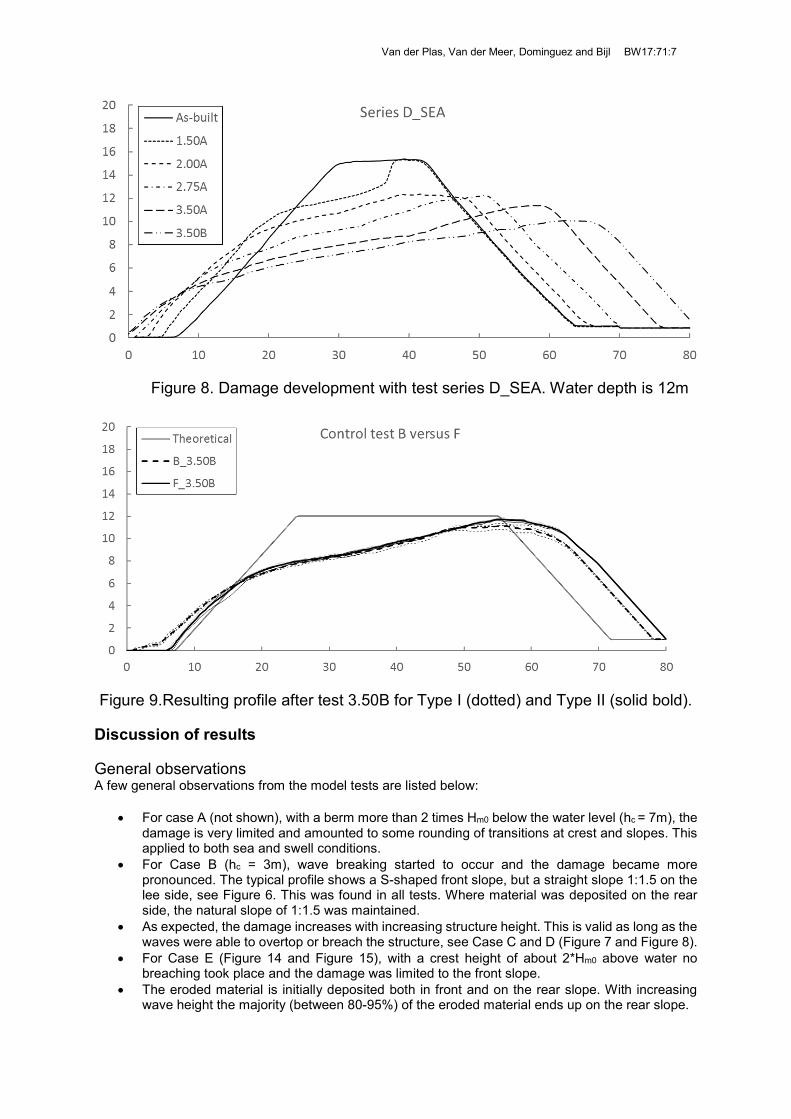
Figure 8. Damage development with test series D_SEA. Water depth is 12m
Figure 9.Resulting profile after test 3.50B for Type I (dotted) and Type II (solid bold).
Discussion of results
General observations A few general observations from the model tests are listed below:
• For case A (not shown), with a berm more than 2 times Hm0 below the water level (hc = 7m), the damage is very limited and amounted to some rounding of transitions at crest and slopes. This applied to both sea and swell conditions.
• For Case B (hc = 3m), wave breaking started to occur and the damage became more pronounced. The typical profile shows a S-shaped front slope, but a straight slope 1:1.5 on the lee side, see Figure 6. This was found in all tests. Where material was deposited on the rear side, the natural slope of 1:1.5 was maintained.
• As expected, the damage increases with increasing structure height. This is valid as long as the waves were able to overtop or breach the structure, see Case C and D (Figure 7 and Figure 8).
• For Case E (Figure 14 and Figure 15), with a crest height of about 2*Hm0 above water no breaching took place and the damage was limited to the front slope.
• The eroded material is initially deposited both in front and on the rear slope. With increasing wave height the majority (between 80-95%) of the eroded material ends up on the rear slope.
Van der Plas, Van der Meer, Dominguez and Bijl BW17:71:8
• The material deposited on the rear slope tends be become slightly segregated. The larger stones end up at the toe. The front slope in general shows less segregation (because there is less deposition) and contains coarse and fine particles even after heavy wave breaking on the slope, see Figure 10.
• In general there is a relatively good balance between erosion and accretion albeit with a slight tendency towards accretion. This can be explained by the fact that the material deposited on the front and rear slope segregates and assumes a less efficient packing resulting in a lower bulk density and hence a larger volume compared to the as-built structure.
Figure 10.Front slope (left) and rear slope (right) after test C_SEA
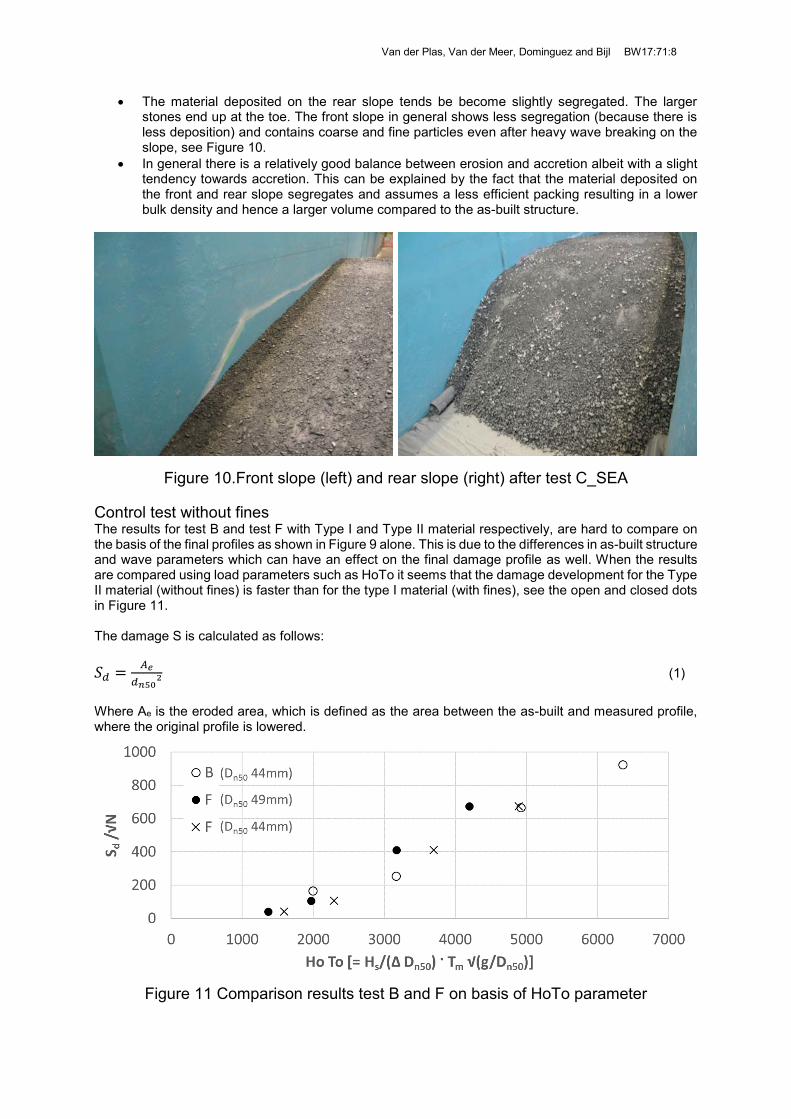
Control test without fines The results for test B and test F with Type I and Type II material respectively, are hard to compare on the basis of the final profiles as shown in Figure 9 alone. This is due to the differences in as-built structure and wave parameters which can have an effect on the final damage profile as well. When the results are compared using load parameters such as HoTo it seems that the damage development for the Type II material (without fines) is faster than for the type I material (with fines), see the open and closed dots in Figure 11. The damage S is calculated as follows: 𝑆𝑆𝑑𝑑 =
𝐴𝐴𝑒𝑒𝑑𝑑𝑛𝑛502
(1)
Where Ae is the eroded area, which is defined as the area between the as-built and measured profile, where the original profile is lowered.
Figure 11 Comparison results test B and F on basis of HoTo parameter
Van der Plas, Van der Meer, Dominguez and Bijl BW17:71:9
It is however noted that the load parameter HoTo includes the parameter Dn501.5. Due to the removal of the finer particles, the Dn50 value for the Type II material was measured to be 25% larger (49mm instead of 39mm). This is based on only two sieve tests (see Figure 3). With a slightly lower Dn50, the different trend as currently observed in Figure 11 disappears (see results with Dn50 = 44mm). Based on these test results it is concluded that there is no evidence of significant different erosion or accretion as a result of the presence of fines, and that model effects as a result of the fines are limited.
Comparison of model results with existing theory
Introduction The model results are compared with a number of existing theories as presented in the CUR/CIRIA Rock Manual (2007). These theories each have a limited validity range which either describe near-bed structures, low crested (or reef) structures, or dynamically stable emergent structures.
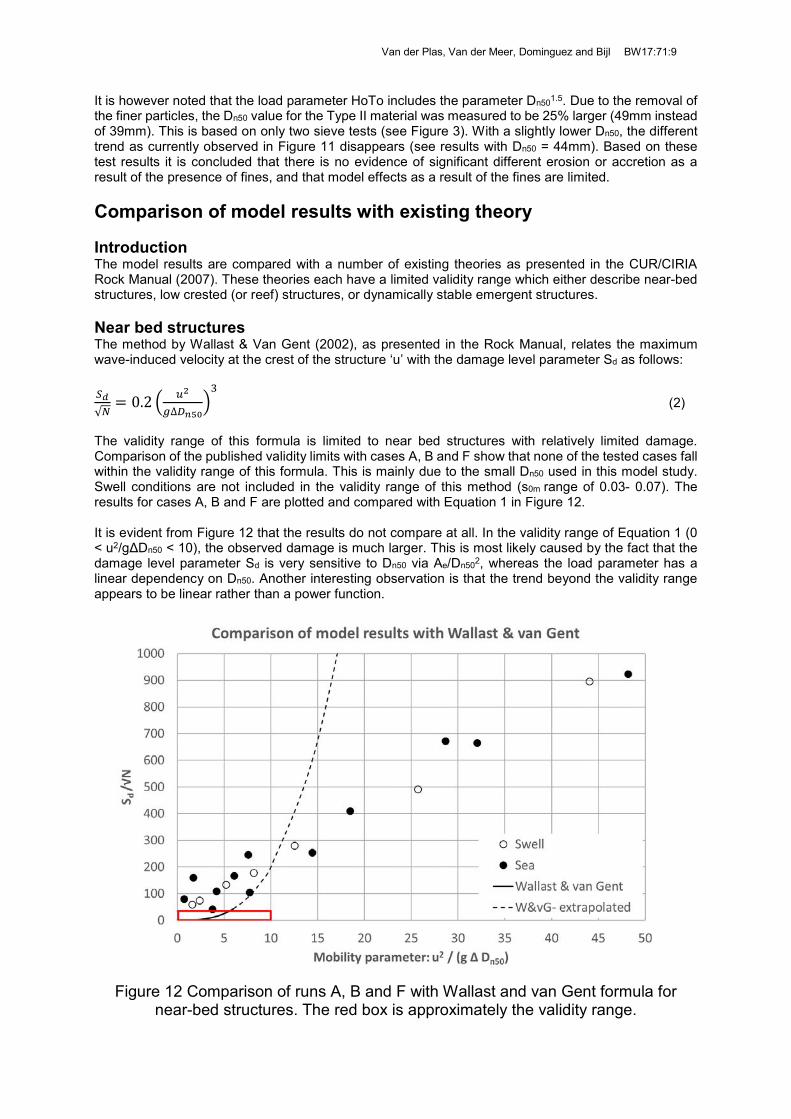
Near bed structures The method by Wallast & Van Gent (2002), as presented in the Rock Manual, relates the maximum wave-induced velocity at the crest of the structure ‘u’ with the damage level parameter Sd as follows: 𝑆𝑆𝑑𝑑√𝑁𝑁= 0.2 � 𝑢𝑢2
𝑔𝑔∆𝐷𝐷𝑛𝑛50�3 (2)
The validity range of this formula is limited to near bed structures with relatively limited damage. Comparison of the published validity limits with cases A, B and F show that none of the tested cases fall within the validity range of this formula. This is mainly due to the small Dn50 used in this model study. Swell conditions are not included in the validity range of this method (s0m range of 0.03- 0.07). The results for cases A, B and F are plotted and compared with Equation 1 in Figure 12. It is evident from Figure 12 that the results do not compare at all. In the validity range of Equation 1 (0 < u2/gΔDn50 < 10), the observed damage is much larger. This is most likely caused by the fact that the damage level parameter Sd is very sensitive to Dn50 via Ae/Dn502, whereas the load parameter has a linear dependency on Dn50. Another interesting observation is that the trend beyond the validity range appears to be linear rather than a power function.
Figure 12 Comparison of runs A, B and F with Wallast and van Gent formula for near-bed structures. The red box is approximately the validity range.
Van der Plas, Van der Meer, Dominguez and Bijl BW17:71:10
Reef-type structures – dynamically stable Reef type structures are defined by the Rock Manual as ‘consisting of homogenous piles of armour stones without a filter layer or core’ and for which ‘some reshaping’ is allowed. Ahrens (1987) and Van der Meer (1990) have analysed these structures and focussed on the change in crest height due to wave attack. The crest height reduction is related to several non-dimensional parameters such as Hs/Dn50, and At/Dn50 with At the cross sectional area of the as-built structure. Due to the very low value of Dn50 in this model study, these parameters fall well outside the validity range of this method. This is very apparent looking at for the bulk number At/Dn502 with values up to 400,000 in the model tests, whereas the maximum validity range is 3,500. The difference is a few orders of magnitude, leading to the conclusion that this method cannot be used to validate or compare the model test results.
Reshaping breakwaters (BREAKWAT) For dynamically stable emergent structures, such as rock and shingle beaches, a set of relationships were derived by Van der Meer (1988). These relationships are incorporated in the computational model BREAKWAT, which generates a profile after reshaping as a result of waves. Some operational boundary conditions for this model are:
• Ho (Hs/ΔDn50) = 3 to 500 Æ the range in these model tests is 20 – 50, so this is within range • D85/D15 < 2.5 Æ the range for the Type I material is 12-14, thus exceeding the validity range • Crest above SWL Æ this means that only test D and E results can be compared
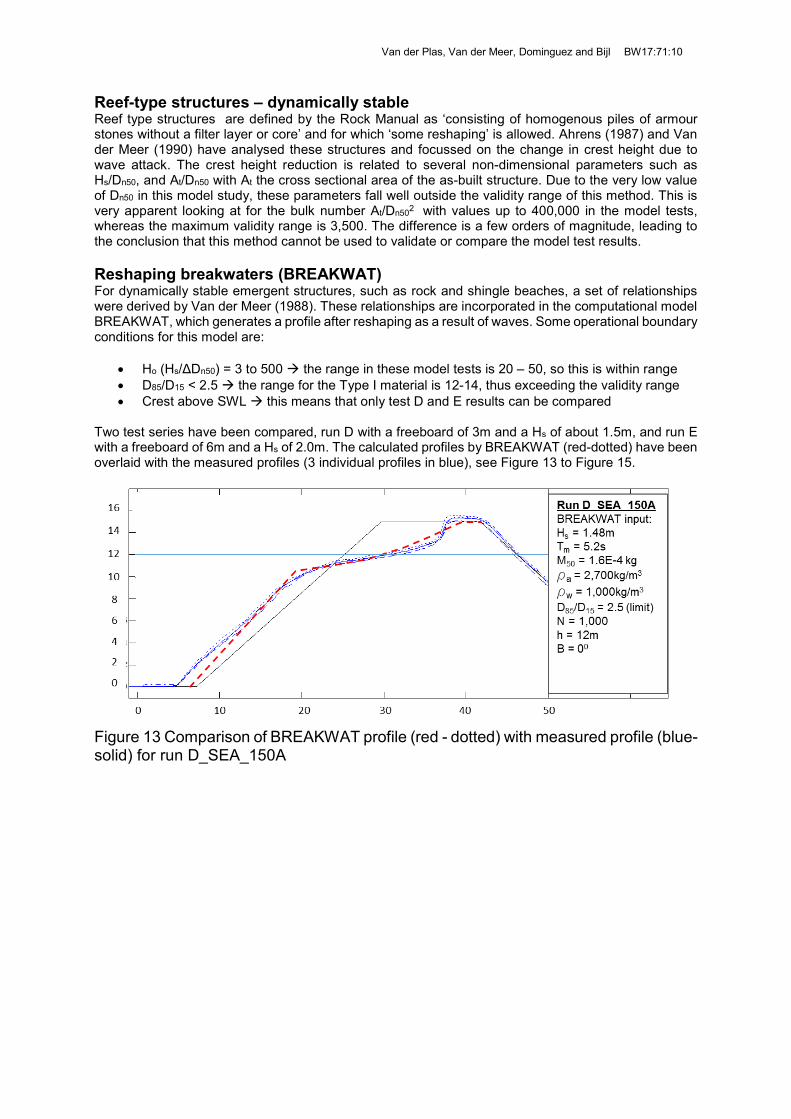
Two test series have been compared, run D with a freeboard of 3m and a Hs of about 1.5m, and run E with a freeboard of 6m and a Hs of 2.0m. The calculated profiles by BREAKWAT (red-dotted) have been overlaid with the measured profiles (3 individual profiles in blue), see Figure 13 to Figure 15.
Figure 13 Comparison of BREAKWAT profile (red - dotted) with measured profile (blue-solid) for run D_SEA_150A
Van der Plas, Van der Meer, Dominguez and Bijl BW17:71:11
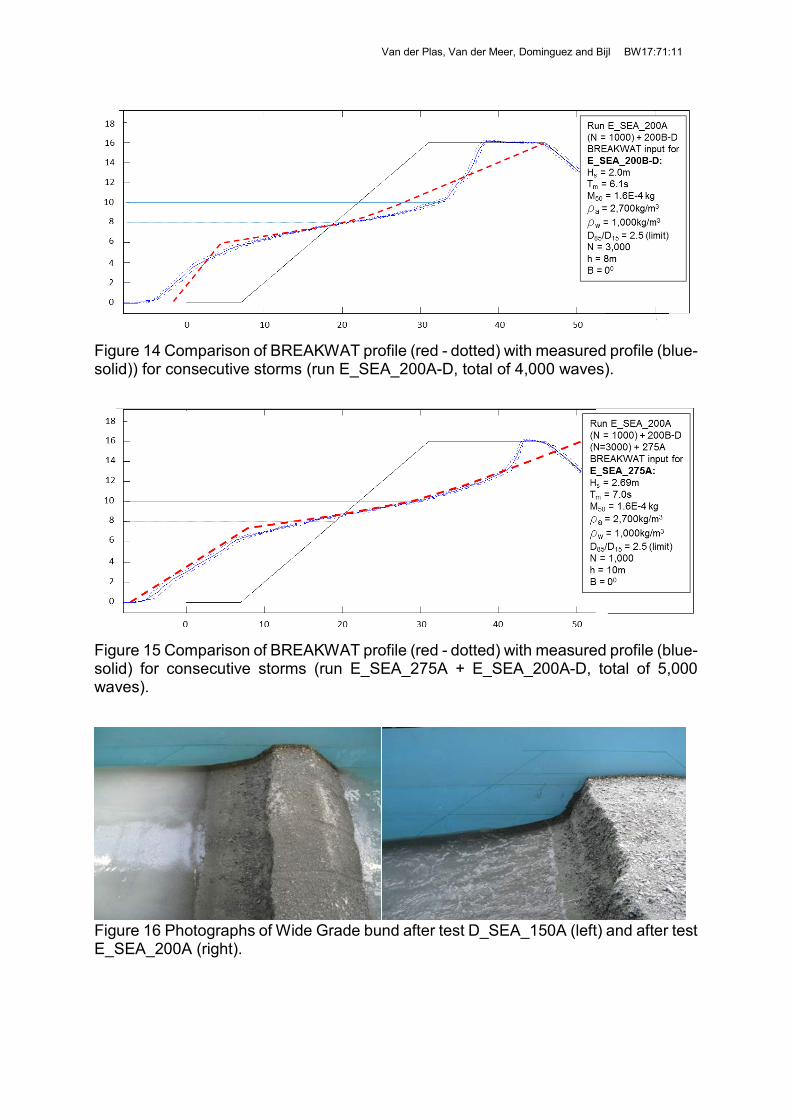
Figure 14 Comparison of BREAKWAT profile (red - dotted) with measured profile (blue-solid)) for consecutive storms (run E_SEA_200A-D, total of 4,000 waves).
Figure 15 Comparison of BREAKWAT profile (red - dotted) with measured profile (blue-solid) for consecutive storms (run E_SEA_275A + E_SEA_200A-D, total of 5,000 waves).
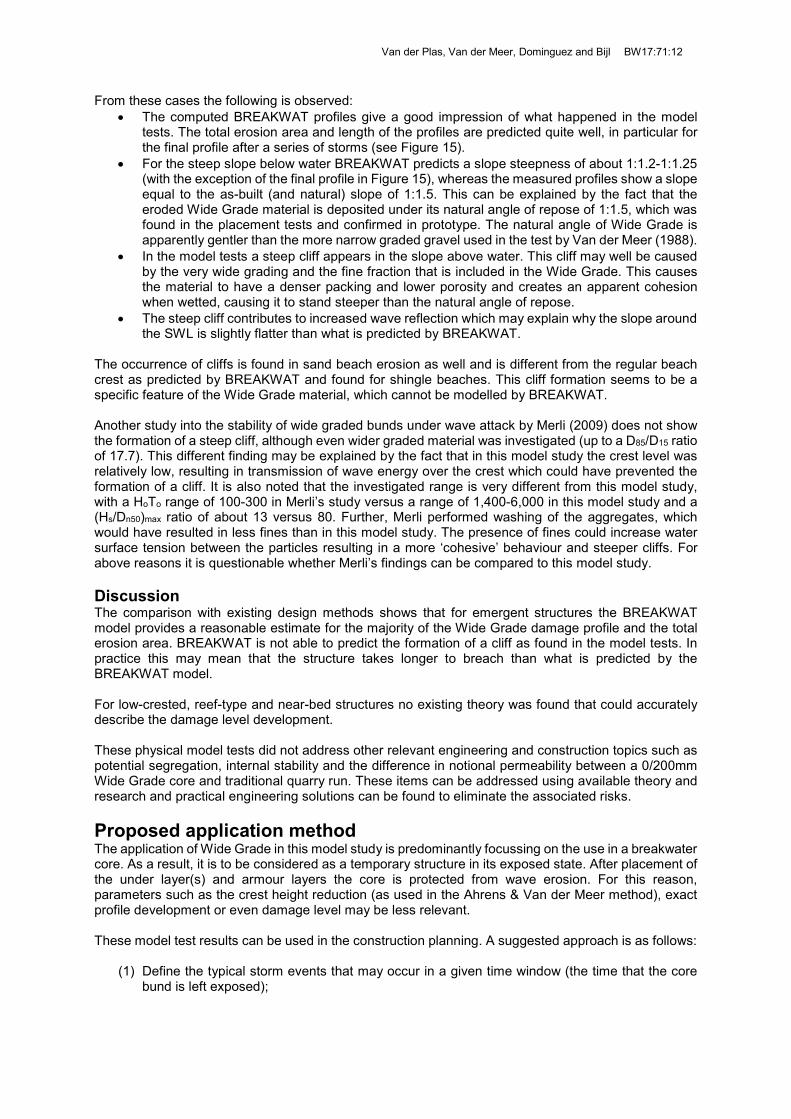
Figure 16 Photographs of Wide Grade bund after test D_SEA_150A (left) and after test E_SEA_200A (right).
Van der Plas, Van der Meer, Dominguez and Bijl BW17:71:12
From these cases the following is observed: • The computed BREAKWAT profiles give a good impression of what happened in the model
tests. The total erosion area and length of the profiles are predicted quite well, in particular for the final profile after a series of storms (see Figure 15).
• For the steep slope below water BREAKWAT predicts a slope steepness of about 1:1.2-1:1.25 (with the exception of the final profile in Figure 15), whereas the measured profiles show a slope equal to the as-built (and natural) slope of 1:1.5. This can be explained by the fact that the eroded Wide Grade material is deposited under its natural angle of repose of 1:1.5, which was found in the placement tests and confirmed in prototype. The natural angle of Wide Grade is apparently gentler than the more narrow graded gravel used in the test by Van der Meer (1988).
• In the model tests a steep cliff appears in the slope above water. This cliff may well be caused by the very wide grading and the fine fraction that is included in the Wide Grade. This causes the material to have a denser packing and lower porosity and creates an apparent cohesion when wetted, causing it to stand steeper than the natural angle of repose.
• The steep cliff contributes to increased wave reflection which may explain why the slope around the SWL is slightly flatter than what is predicted by BREAKWAT.
The occurrence of cliffs is found in sand beach erosion as well and is different from the regular beach crest as predicted by BREAKWAT and found for shingle beaches. This cliff formation seems to be a specific feature of the Wide Grade material, which cannot be modelled by BREAKWAT. Another study into the stability of wide graded bunds under wave attack by Merli (2009) does not show the formation of a steep cliff, although even wider graded material was investigated (up to a D85/D15 ratio of 17.7). This different finding may be explained by the fact that in this model study the crest level was relatively low, resulting in transmission of wave energy over the crest which could have prevented the formation of a cliff. It is also noted that the investigated range is very different from this model study, with a HoTo range of 100-300 in Merli’s study versus a range of 1,400-6,000 in this model study and a (Hs/Dn50)max ratio of about 13 versus 80. Further, Merli performed washing of the aggregates, which would have resulted in less fines than in this model study. The presence of fines could increase water surface tension between the particles resulting in a more ‘cohesive’ behaviour and steeper cliffs. For above reasons it is questionable whether Merli’s findings can be compared to this model study.
Discussion The comparison with existing design methods shows that for emergent structures the BREAKWAT model provides a reasonable estimate for the majority of the Wide Grade damage profile and the total erosion area. BREAKWAT is not able to predict the formation of a cliff as found in the model tests. In practice this may mean that the structure takes longer to breach than what is predicted by the BREAKWAT model. For low-crested, reef-type and near-bed structures no existing theory was found that could accurately describe the damage level development. These physical model tests did not address other relevant engineering and construction topics such as potential segregation, internal stability and the difference in notional permeability between a 0/200mm Wide Grade core and traditional quarry run. These items can be addressed using available theory and research and practical engineering solutions can be found to eliminate the associated risks.
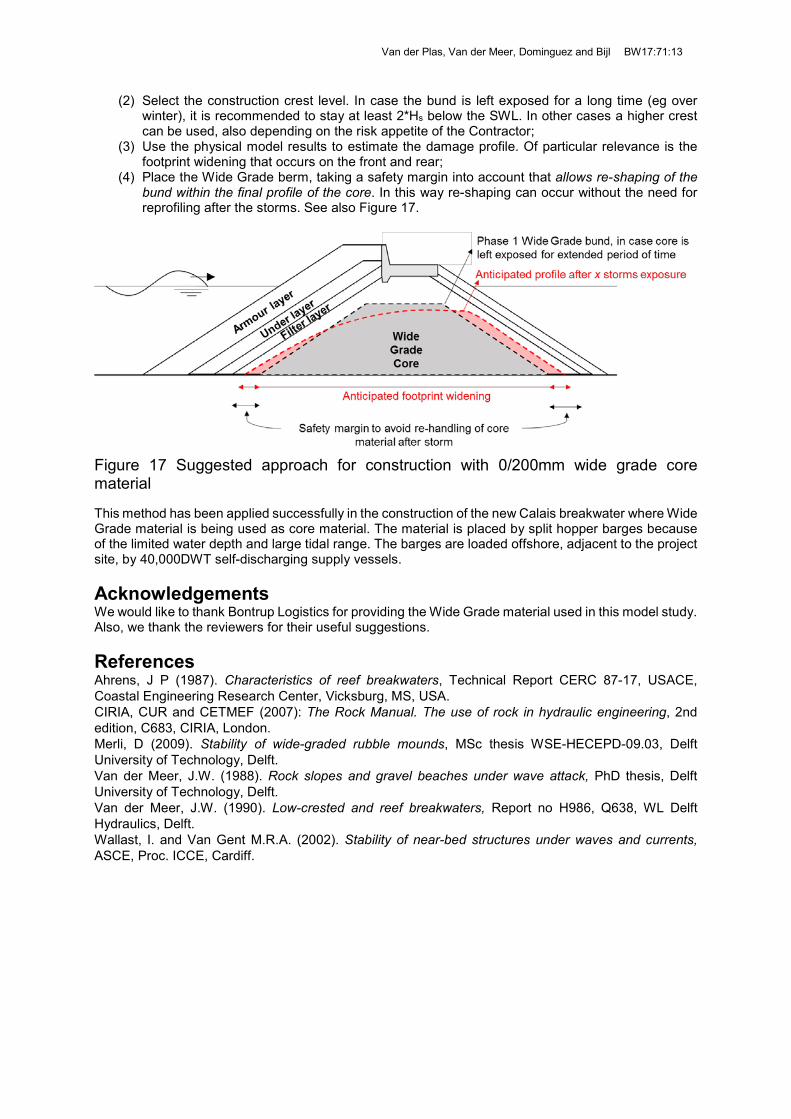
Proposed application method The application of Wide Grade in this model study is predominantly focussing on the use in a breakwater core. As a result, it is to be considered as a temporary structure in its exposed state. After placement of the under layer(s) and armour layers the core is protected from wave erosion. For this reason, parameters such as the crest height reduction (as used in the Ahrens & Van der Meer method), exact profile development or even damage level may be less relevant. These model test results can be used in the construction planning. A suggested approach is as follows:
(1) Define the typical storm events that may occur in a given time window (the time that the core bund is left exposed);
Van der Plas, Van der Meer, Dominguez and Bijl BW17:71:13
(2) Select the construction crest level. In case the bund is left exposed for a long time (eg over winter), it is recommended to stay at least 2*Hs below the SWL. In other cases a higher crest can be used, also depending on the risk appetite of the Contractor;
(3) Use the physical model results to estimate the damage profile. Of particular relevance is the footprint widening that occurs on the front and rear;
(4) Place the Wide Grade berm, taking a safety margin into account that allows re-shaping of the bund within the final profile of the core. In this way re-shaping can occur without the need for reprofiling after the storms. See also Figure 17.
Figure 17 Suggested approach for construction with 0/200mm wide grade core material
This method has been applied successfully in the construction of the new Calais breakwater where Wide Grade material is being used as core material. The material is placed by split hopper barges because of the limited water depth and large tidal range. The barges are loaded offshore, adjacent to the project site, by 40,000DWT self-discharging supply vessels.
Acknowledgements We would like to thank Bontrup Logistics for providing the Wide Grade material used in this model study. Also, we thank the reviewers for their useful suggestions.
References Ahrens, J P (1987). Characteristics of reef breakwaters, Technical Report CERC 87-17, USACE, Coastal Engineering Research Center, Vicksburg, MS, USA. CIRIA, CUR and CETMEF (2007): The Rock Manual. The use of rock in hydraulic engineering, 2nd edition, C683, CIRIA, London. Merli, D (2009). Stability of wide-graded rubble mounds, MSc thesis WSE-HECEPD-09.03, Delft University of Technology, Delft. Van der Meer, J.W. (1988). Rock slopes and gravel beaches under wave attack, PhD thesis, Delft University of Technology, Delft. Van der Meer, J.W. (1990). Low-crested and reef breakwaters, Report no H986, Q638, WL Delft Hydraulics, Delft. Wallast, I. and Van Gent M.R.A. (2002). Stability of near-bed structures under waves and currents, ASCE, Proc. ICCE, Cardiff.