Embed Size (px)
Citation preview

STABILIZATION OF HIGH SULFATE SOILS
By
NAGASREENIVASU TALLURI
Presented to the Faculty of the Graduate School of
The University of Texas at Arlington in Partial Fulfillment
Of the Requirements for the Degree of
DOCTOR OF PHILOSOPHY
THE UNIVERSITY OF TEXAS AT ARLINGTON
August 2013

Copyright © 2013 by Nagasreenivasu Talluri All Rights Reserved

iii
ACKNOWLEDGEMENTS
I would like to extend my sincere thanks to my advisor, Prof. Anand J. Puppala, for his
guidance and constant encouragement throughout this research study. As an advisor, he
provided the impetus and guidance for this study. His kindness, boundless energy and talent for
making things simple have been the driving force for my research. His commitment and never-
give-up attitude towards research will always be a source of inspiration to me. I would like to
express my sincere gratitude to Dr. Puppala for giving me the opportunity to work with him and
for encouraging me to present my research work at both national and international levels.
Special thanks are due to Richard Williamme and Mike Arellano of TxDOT for funding this
research and for their constant support throughout. I am also thankful to Prof. Anand J.
Puppala and the Department of Civil Engineering for providing financial support through the
Dean’s Doctoral Fellowship, STEM scholarship and Graduate Research Assistant position
throughout my study at UTA.
I am grateful to Dr. Laureano Hoyos, Dr. Xinbao Yu, Dr. Hyoek Choi and Dr. Chen Pai
Han for agreeing to be on my examining committee. Appreciation is also due to all the members
of Department of Civil Engineering staff, Ginny Bowers, Sara Ridenour, Ava Chapman, Lewis
Crow, and Paul Shover for their friendliness and unconditional help during my course of study
at UTA.
I am extremely indebted to Dr. Bhaskar Chittoori (Sinu) for his constant and never
ending support and for treating me as his family member and to Ahmed Gaily for his support
and care during some difficult times. I would also like to thank all my colleagues who extended
their direct or indirect help during my stay at UTA, as well as my friends Aravind Pedarla, Rajini
Karduri, Tejo Vikash Bheemasetti, Ujwal Patil, Minh Le, Ranjan Rout, Anil Raavi, Raja
Yenigalla, Praveen Vanga, Justin Thomey, and Lisandro Murua for their support,
encouragement and consistent follow up of my research and personal activities. My special

iv
thanks are due to Dr. Sireesh Saride for his help and support at the time of my application for
Ph.D admission at UTA.
My special thanks to the families of Prof. Anand J. Puppala and Dr. Bhaskar Chittoori
for including me in their social gatherings and making me feel at home during my stay at UTA.
Words are not enough to express my deepest gratitude to the Almighty for everything
He bestowed upon me. Finally, I would like to thank my parents, Venkateswara Rao Talluri and
Anjali Devi, for their affection, concern, constant support and encouragement all through my life.
This thesis is dedicated to them.
July 7, 2013

v
ABSTRACT
STABILIZATION OF HIGH SULFATE SOILS
Nagasreenivasu Talluri, Ph.D.
The University of Texas at Arlington, 2013
Supervising Professor: Anand J. Puppala
Stabilization of expansive soils using lime and cement additives have been used by
practitioners over the years. However, recent heaving and premature pavement failures in lime
and cement-treated subgrades containing sulfates led to questioning the validity of calcium-
based stabilization. When expansive soils containing sulfates are treated with calcium-based
stabilizers, the calcium from the stabilizer reacts with soil sulfates and alumina to form the
expansive mineral Ettringite. Formation and growth of the mineral Ettringite has been reported
as the cause of severe heaving in several pavement failures. Under favorable environmental
conditions, Ettringite transforms itself into another expansive mineral, Thaumasite. This heaving
is termed as ‘sulfate-induced heave’ in literature.
Several theories have been proposed to understand the heaving mechanisms in sulfate
bearing soils. Based on the theoretical background, researchers and practitioners have
proposed various methods to treat sulfate soils. Applicability of these methods is mostly limited
to soils containing sulfate content less than 8,000 ppm. Soils with sulfate content above 8,000
ppm are termed as ‘high sulfate’ soils, and chemical treatment of such soils is currently not
considered. Hence there exists a research need to create better understanding of the heaving

vi
phenomenon in soils with higher sulfate contents and develop practical techniques for
stabilizing such soils.
This research is designed to aid in understanding the heaving phenomenon in soils with
sulfate contents above 8,000 ppm and to develop practical techniques to stabilize such soils.
Six soils: four high plasticity clays, one low-plasticity clay soil and one high-plasticity silt, with
sulfate contents varying from 200 ppm - 44,000 ppm, were considered for this research.
Chemical and mineralogical tests were performed on the untreated soils to establish the clay
mineral distribution and composition of the soils. Additional Gypsum was added to the soils with
sulfate contents below 8,000 ppm so they could be considered as ‘high sulfate’. These soils
were treated with lime and mellowed for periods of zero, three and seven days. Following the
mellowing, the samples were remixed, compacted and subjected to various engineering,
mineralogical and chemical tests.
The present high-sulfate soils were treated lime stabilization with varying mellowing
periods and treated soils after treatment were subjected to the engineering and chemical tests.
Tests results were analyzed to understand the effectiveness of mellowing period on the heaving
phenomenon of ‘high sulfate’ soils. Both Ettringite formation and crystal growth have contributed
significantly to the overall swell of the treated soils. Swell trends observed in the treated soils at
respective mellowing periods were attributed to the variability in sulfate levels and reactive
alumina and silica contents. Treated soils at higher mellowing periods showed lesser sulfate
induced heaving when sulfate levels are lesser than 30,000 ppm. At higher sulfate levels, the
mellowing did not result in effective treatment of soils.
It was also observed that compaction void ratios and soil clay mineralogy have a
significant impact on the swell behavior of chemically treated high-sulfate soils at different
mellowing periods. Hence, mellowing effectiveness is explained using free energy and mass-
volume approaches. Threshold void ratio framework comprising of natural soil void ratio and

vii
sulfate content was developed to predict Ettringite-induced heaving in chemically treated high
sulfate soils at different mellowing periods.
Another treatment method using lime-fly ash treatment is also studied on two soils and
the test results showed that the combined treatment has resulted in lesser soil heaving in these
soils. The improvements here are mainly attributed to low amounts of calcium in the combined
chemical additive used here.
In the final study, the rate of Ettringite formation and growth in the treated soils was
indirectly assessed by measuring stiffness properties using the Bender Element tests. Bender
Element tests revealed material softening and subsequent stiffness degradation in chemically-
treated high-sulfate soils, and threshold stiffness loss values were established for the treated
soils. This non-destructive study assessment can be used to evaluate the Ettringite induced soil
heaving in sulfate soils under various chemical treatments.

viii
TABLE OF CONTENTS
ACKNOWLEDGEMENTS……………………………………………………………………..……… iii
ABSTRACT…………………………………………………………………………………………….. iv
LIST OF ILLUSTRATIONS…………………………………………………………………………… ix
LIST OF TABLES……………………………………………………………………………………… x
Chapter Page
1. INTRODUCTION ........................................................................................................... 1
1.1 Introduction .................................................................................................. 1
1.2 Current Guidelines in Practice .................................................................... 2
1.3 Scope of the Present Work ......................................................................... 3
1.4 Thesis Organization .................................................................................... 3
2. LITERATURE REVIEW ................................................................................................. 6
2.1 Chemical Stabilization of Soils .................................................................... 6
2.1.1 Chemical Stabilization of Soils .................................................... 6
2.2 Sulfate Bearing Soils ................................................................................... 8
2.2.1 Sources of Sulfates in Soils ...................................................... 10
2.3 Threshold Sulfate Levels ........................................................................... 12
2.3.1 Past Research on Threshold Sulfate Levels ............................. 12
2.3.2 Sulfate Measurement Methodologies ....................................... 13
2.4 Sulfate Heave Mechanisms ...................................................................... 17
2.4.1 Introduction ............................................................................... 17
2.4.2 Chemical Process ..................................................................... 20
2.4.3 Heaving Mechanisms ................................................................ 22
2.4.4 Factors Influencing Ettringite Induced Heave ........................... 24
2.5 Sulfate Heave Case Histories ................................................................... 25

ix
2.5.1 Stewart Avenue, Las Vegas, Nevada ....................................... 26
2.5.2 Bush Road, Georgia .................................................................. 27
2.5.3 Holloman Air force Base, New Mexico ...................................... 28
2.5.4 Joe Pool Dam, Texas ................................................................ 29
2.5.5 Sulfate Attack on a Tunnel Shotcrete Liner, Dallas, Texas ...... 30
2.5.6 Sulfate Heave Issues at DFW Airport, Texas ........................... 31
2.5.7 US 82, Texas ............................................................................ 33
2.5.8 US 287, Texas .......................................................................... 34
2.5.9 Western Colorado ..................................................................... 35
2.6 Stabilization of Sulfate Bearing Soils ........................................................ 38
2.6.1 Pre-Compaction Mellowing ....................................................... 38
2.6.2 Double Application of Lime ....................................................... 39
2.6.3 Combined Lime and Cement Treatment ................................... 40
2.6.4 Stabilization Using Low Calcium Based Stabilizers .................. 40
2.6.5 Stabilization with Non-Calcium Based Stabilizers..................... 43
2.6.6 Ground Granulated Blast Furnace Slag (GGBFS) .................... 44
2.6.7 Sulfate Resistant Cements........................................................ 45
2.6.8 Use of Geosynthetics ................................................................ 47
2.6.9 Pre-treatment with Barium compounds ..................................... 47
2.6.10 Use of Polymeric Fibers .......................................................... 48
2.6.11 Amorphous Silica and Alumina ............................................... 48
2.6.12 Several Other Techniques ...................................................... 49
2.7 Summary ................................................................................................... 50
3. EXPERIMENTAL PROGRAM ..................................................................................... 51
3.1 Introduction ................................................................................................ 51
3.2 Soil Selection Criteria ................................................................................ 51

x
3.3 Methodology .............................................................................................. 53
3.4 Testing Variables ...................................................................................... 54
3.5 Basic Tests ................................................................................................ 55
3.5.1 Atterberg Limits ......................................................................... 55
3.5.2 Specific Gravity ......................................................................... 56
3.5.3 Hydrometer analysis ................................................................. 56
3.5.4 Standard Proctor Compaction Tests ......................................... 57
3.6 Engineering Tests ..................................................................................... 60
3.6.1 Three Dimensional Swell Test (3-D swell) ................................ 60
3.6.2 Three Dimensional Shrinkage Test (3-D shrinkage) ................. 66
3.6.3 One Dimensional Swell Pressure Test (1-D swell pressure) .... 68
3.6.4 Unconfined Compressive Strength Tests (UCS Test) .............. 69
3.7 Chemical and Mineralogical Tests ............................................................ 71
3.7.1 Soluble Sulfate Determination (Modified UTA Method) ............ 71
3.7.2 Lime Dosage Determination ..................................................... 74
3.7.3 Cation Exchange Capacity (CEC) ............................................. 75
3.7.4 Specific Surface Area (SSA) ..................................................... 77
3.7.5 Total Potassium (TP) ................................................................ 78
3.7.6 Reactive Alumina and Silica ..................................................... 80
3.8 Summary ................................................................................................... 83
4. ANALYSIS OF LABORATORY TEST RESULTS (PHASE I) ..................................... 84
4.1 Introduction ................................................................................................ 84
4.1.1 ................................................................................................... 84
4.1.2 Strength Characteristics .......................................................... 101
4.1.3 Mineralogical Studies .............................................................. 112
4.2 Analysis of Test Results .......................................................................... 115

xi
4.2.1 Analysis of Test Results .......................................................... 116
4.3 Discussion ............................................................................................... 131
4.3.1 Effect of Compaction Void Ratio on Swell Strains .................. 131
4.3.2 Effect of Clay Mineralogy on Swell Strains ............................. 132
4.4 Conclusions ............................................................................................. 133
5. ANALYSIS OF LABORATORY TEST RESULTS (PHASE II) .................................. 135
5.1 Introduction .............................................................................................. 135
5.1.1 Basic Properties ...................................................................... 136
5.1.2 Chemical Properties ................................................................ 137
5.1.3 Volume Change Characteristics ............................................. 138
5.1.4 Strength Characteristics .......................................................... 146
5.1.5 Mineralogical Studies .............................................................. 152
5.2 Discussion ............................................................................................... 154
5.2.1 Effect of Compaction Void Ratio on Swell Strains .................. 154
5.2.2 Effect of Clay Mineralogy on Swell Strains ............................. 155
5.3 Observations ........................................................................................... 156
6. swell prediction models ............................................................................................. 157
6.1 Introduction .............................................................................................. 157
6.2 Swell Prediction Models .......................................................................... 158
6.2.1 Swell Prediction Model Based on Sulfate Content of the Soil 158
6.2.2 Swell Prediction Model Based on Threshold Void Ratio Frame Work ................................................................................................. 166
6.3 Summary & Conclusions ......................................................................... 175
7. TIME RATE OF ETTRINGITE FORMATION ............................................................ 176
7.1 Introduction .............................................................................................. 176
7.1.1 Small Strain Shear Moduli (Gmax) Measurements ................... 177
7.2 Analysis of Test Results .......................................................................... 201

xii
7.3 Observations ........................................................................................... 205
8. CONCLUSIONS AND RECOMMENDATIONS ......................................................... 206
8.1 Summary and Conclusions ..................................................................... 206
8.2 Future Research Recommendations ...................................................... 208
APPENDIX
A. PROCTOR COMPACTION CURVES……………………..…………………………210
REFERENCES ................................................................................................................. 215
BIOGRAPHICAL INFORMATION ..................................................................................... 223

xiii
LIST OF ILLUSTRATIONS Figure Page
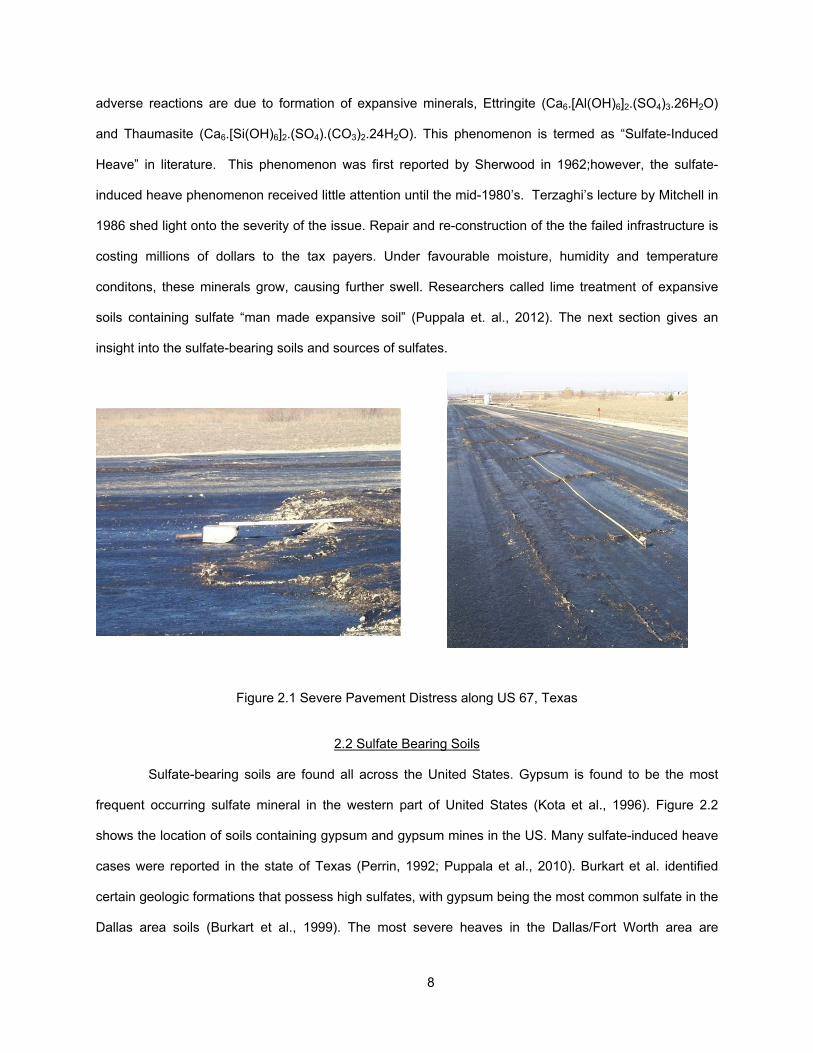
2.1 Severe Pavement Distress along US 67, Texas ..................................................................... 8
2.2 Location of soils containing Gypsum in United States (Kota et al., 1996) .............................. 9
2.3 Geology of Texas (Harris, 2005) ............................................................................................. 9
2.4 Gypsum and Thenardite in Natural Form .............................................................................. 10
2.5 SEM photograph of needle-like Ettringite (Mallat, 2006) ...................................................... 22
2.6 Schematic of the mineral structure of Ettringite (Intharasombat, 2003) ................................ 22
2.7 Longitudinal and Transverse cracks on Stewart Avenue (Hunter, 1988) ............................. 26
2.8 (a) Distress in Cement Stabilized Sand ................................................................................ 27
2.9 Heaving in flexible pavement near northeast corner of hangar ............................................ 29
2.10 Heaving in lime treated subgrade ....................................................................................... 30
2.11 Distress region on tunnel lining (C-3) .................................................................................. 31
2.12 Heave Distress Pattern on West Shoulder of Taxiway ...................................................... 33
2.13 Heaved area on east bound side ........................................................................................ 34
2.14 Longitudinal Cracks on Shoulder and Swell ....................................................................... 35
3.1 Map showing the location of test soils (Courtesy: Ahmed Gaily, 2012) ................................ 53
3.2 Atterberg Limits Apparatus .................................................................................................... 56
3.3 Standard proctor compaction test apparatus ........................................................................ 58
3.4 Standard proctor Compaction Curve for FM-1417 Soil ......................................................... 59
3.5 Gyratory Compacter Machine, (b) Soil sample after extraction ............................................ 61
3.6 Three Dimensional Swell Test Setup .................................................................................... 62
3.7 Vertical Swell Strain vs. Elapsed Time (Austin Soil) ............................................................. 63
3.8 Vertical Swell Strain vs. Elapsed Time (Childress Soil) ........................................................ 63
3.9 Vertical Swell Strain vs. Elapsed Time (Dallas Soil) ............................................................. 64

xiv
3.10 Vertical Swell Strain vs. Elapsed Time (FM-1417 Soil) ....................................................... 64
3.11 Vertical Swell Strain vs. Elapsed Time (Riverside Soil) ...................................................... 65
3.12 Vertical Swell Strain vs. Elapsed Time (US-82 Soil) ........................................................... 65
3.13 3-D Shrinkage Test ............................................................................................................. 67
3.14 1-D Swell Pressure Test Setup ........................................................................................... 68
3.15 Stress vs. Axial Strain, US-82, OMC, Natural ..................................................................... 70
3.16 UCS Test Setup .................................................................................................................. 70
3.17 Modified UTA Method for Determination of Soluble Sulfate Content .................................. 72
3.18 Soluble Sulfate Determination (Modified UTA method) ...................................................... 73
3.19 Lime Dosage Determination for Austin Soil ....................................................................... 75
3.20 Photographs of the various steps involved in the determination of CEC ............................ 76
3.21 Photographs of the various steps involved in the determination of SSA ............................ 77
3.22 Photographs of the various steps involved in the determination of TP ............................... 79
3.23 Reactive Alumina and Silica Measurements ....................................................................... 81
3.24 ICP_MS Set up .................................................................................................................... 82
3.25 Dark Colored Extract Due to Presence of Organics and Iron Oxides ................................. 82
4.1 Vertical Swell vs. Elapsed Time, Austin Soil (36,000 ppm sulfates) ..................................... 88
4.2 Vertical Swell vs. Elapsed Time, Childress Soil (44,000 ppm sulfates) ................................ 89
4.3 Vertical Swell vs. Elapsed Time, Dallas Soil (12,000 ppm sulfates) ..................................... 89
4.4 Vertical Swell vs. Elapsed Time, FM-1417 Soil (24,000 ppm sulfates) ................................ 90
4.5 Vertical Swell vs. Elapsed Time, Riverside Soil (20,000 ppm sulfates) ................................ 90
4.6 Vertical Swell vs. Elapsed Time, US-82 Soil (12,000 ppm sulfates) ..................................... 91
4.7 Volumetric Swell: Natural and 6% Lime Treated, Austin Soil (36,000 ppm sulfates) ........... 91
4.8 Volumetric Swell: Natural and 6% Lime Treated, Childress Soil (44,000 ppm sulfates) ...... 92
4.9 Volumetric Swell: Natural and 6% Lime Treated, Dallas Soil (12,000 ppm sulfates) ........... 92
4.10 Volumetric Swell: Natural and 6% Lime Treated, FM-1417 Soil (24,000 ppm sulfates) ..... 93

xv
4.11 Volumetric Swell: Natural and 6% Lime Treated, Riverside Soil (20,000 ppm sulfates) .... 93
4.12 Volumetric Swell: Natural and 6% Lime Treated, US-82 Soil (12,000 ppm sulfates) ......... 94
4.13 Volumetric Shrinkage, Austin Soil (36,000 ppm sulfates) ................................................... 97
4.14 Volumetric Shrinkage, Childress Soil (44,000 ppm sulfates) .............................................. 98
4.15 Volumetric Shrinkage, Dallas Soil (12,000 ppm sulfates) ................................................... 98
4.16 Volumetric Shrinkage, FM-1417 Soil (24,000 ppm sulfates)............................................... 99
4.17 Volumetric Shrinkage, Riverside Soil (20,000 ppm sulfates) .............................................. 99
4.18 Volumetric Shrinkage, US-82 Soil (12,000 ppm sulfates) ................................................. 100
4.19 UCS Curves for Austin Soil @ OMC ................................................................................. 103
4.20 UCS Curves for Austin Soil @ w/OMC ............................................................................. 103
4.21 UCS Curves for Childress Soil @ OMC ............................................................................ 104
4.22 UCS Curves for Childress Soil @ w/OMC ........................................................................ 104
4.23 UCS Curves for Dallas Soil @ OMC ................................................................................. 105
4.24 UCS Curves for Dallas Soil @ w/OMC ............................................................................. 105
4.25 UCS Curves for FM-1417 Soil @ OMC ............................................................................ 106
4.26 UCS Curves for FM-1417 Soil @ w/OMC ......................................................................... 106
4.27 UCS Curves for Riverside Soil @ OMC ............................................................................ 107
4.28 UCS Curves for Riverside Soil @ w/OMC ........................................................................ 107
4.29 UCS Curves for US-82 Soil @ OMC ................................................................................. 108
4.30 UCS Curves for US-82 Soil @ w/OMC ............................................................................. 108
4.31 Gibbs Free Energy Approach ............................................................................................ 119
4.32 Volume Changes in Soil Matrix Due to Formation of Ettringite/Thaumasite ..................... 125
5.1 Vertical Swell vs. Elapsed Time (Bells Soil - 27,000 ppm) ................................................. 141
5.2 Vertical Swell vs. Elapsed Time (FM-1417 Soil - 27,000 ppm) ........................................... 141
5.3 Volumetric Swell: Natural and Treated Bells Soil (27,000 ppm) ......................................... 142
5.4 Volumetric Swell: Natural and Treated FM-1417 Soil (24,000 ppm) .................................. 142

xvi
5.5 Volumetric Shrinkage Natural and Treated Bells Soil (27,000 ppm) .................................. 145
5.6 Volumetric Shrinkage Natural and Treated FM-1417 Soil (47,000 ppm) ............................ 145
5.7 UCS Curve for Bells Soil @ OMC (27,000 ppm) ................................................................ 148
5.8 UCS Curve for Bells Soil @ wOMC (27,000 ppm) .............................................................. 149
5.9 UCS Curve for FM-1417 Soil @ OMC (24,000 ppm) .......................................................... 149
5.10 UCS Curve for FM-1417 Soil @ WOMC (24,000 ppm) .................................................... 150
6.1 Measured vs. Predicted Swell Strains (OMC); Sulfate Content Based Model................... 164
6.2 Measured vs. Predicted Swell Strains (WOMC); Sulfate Content Based Model ................ 165
6.3 Vsulfate/Vsoil vs. Ve/Vvi at OMC (3 days mellowing) ................................................................ 171
6.4 Vsulfate/Vsoil vs. Ve/Vvi at WOMC (3 days mellowing) ............................................................. 172
6.5 Vsulfate/Vsoil vs. Ve/Vvi at OMC (7 days mellowing) ................................................................ 173
6.6 Vsulfate/Vsoil vs. Ve/Vvi at WOMC (7 days mellowing) ............................................................. 174
7.1 Soil Sample with Bender Elements ..................................................................................... 178
7.2 Sample Output from the Computer Screen ......................................................................... 178
7.3 Initial and Final Shear Modulus: Austin Soil @ OMC .......................................................... 180
7.4 Initial and Final Shear Modulus: Austin Soil @ WOMC Soil ............................................... 181
7.5 Initial and Final Shear Modulus: Childress Soil @ OMC .................................................... 181
7.6 Initial and Final Shear Modulus: Childress Soil @ WOMC ................................................. 182
7.7 Initial and Final Shear Modulus: Dallas Soil @ OMC .......................................................... 182
7.8 Initial and Final Shear Modulus: Dallas Soil @ WOMC ...................................................... 183
7.9 Initial and Final Shear Modulus: FM-1417 Soil @ OMC ..................................................... 183
7.10 Initial and Final Shear Modulus: FM-1417 Soil @ WOMC ................................................ 184
7.11 Initial and Final Shear Modulus: Riverside Soil @ OMC .................................................. 184
7.12 Initial and Final Shear Modulus: Riverside Soil @ WOMC ............................................... 185
7.13 Initial and Final Shear Modulus: US-82 Soil @ OMC ....................................................... 185
7.14 Initial and Final Shear Modulus: US-82 Soil @ WOMC .................................................... 186

xvii
7.15 Initial and Final Shear Modulus @ OMC ........................................................................... 187
7.16 Initial and Final Shear Modulus @ WOMC ....................................................................... 188
7.17 Shear Modulus vs. Elapsed Time: Austin Soil (Natural, OMC) ......................................... 189
7.18 Shear Modulus vs. Elapsed Time: Austin Soil (Natural, WOMC) ..................................... 189
7.19 Shear Modulus vs. Elapsed Time: Austin Soil (6% Lime Treated, OMC) ......................... 190
7.20 Shear Modulus vs. Elapsed Time: Austin Soil (6% Lime Treated, WOMC) ..................... 190
7.21 Shear Modulus vs. Elapsed Time: Childress Soil (Natural, OMC) .................................... 191
7.22 Shear Modulus vs. Elapsed Time: Childress Soil (Natural, WOMC) ................................ 191
7.23 Shear Modulus vs. Elapsed Time: Childress Soil (6% Lime Treated, OMC) .................... 192
7.24 Shear Modulus vs. Elapsed Time: Childress Soil (6% Lime Treated, WOMC) ................ 192
7.25 Shear Modulus vs. Elapsed Time: Dallas Soil (Natural, OMC) ......................................... 193
7.26 Shear Modulus vs. Elapsed Time: Dallas Soil (Natural, WOMC) ..................................... 193
7.27 Shear Modulus vs. Elapsed Time: Dallas Soil (6% Lime Treated, OMC) ......................... 194
7.28 Shear Modulus vs. Elapsed Time: Dallas Soil (6% Lime Treated, WOMC) ..................... 194
7.29 Shear Modulus vs. Elapsed Time: FM-1417 Soil (Natural, OMC) .................................... 195
7.30 Shear Modulus vs. Elapsed Time: FM-1417 Soil (Natural, WOMC) ................................. 195
7.31 Shear Modulus vs. Elapsed Time: FM-1417 Soil (6% Lime Treated, OMC) .................... 196
7.32 Shear Modulus vs. Elapsed Time: FM-1417 Soil (6% Lime Treated, WOMC) ................. 196
7.33 Shear Modulus vs. Elapsed Time: Riverside Soil (Natural, OMC) .................................... 197
7.34 Shear Modulus vs. Elapsed Time: Riverside Soil (Natural, WOMC) ................................ 197
7.35 Shear Modulus vs. Elapsed Time: Riverside Soil (6% Lime Treated, OMC) .................... 198
7.36 Shear Modulus vs. Elapsed Time: Riverside Soil (6% Lime Treated, WOMC) ................ 198
7.37 Shear Modulus vs. Elapsed Time: US-82 Soil (Natural, OMC) ........................................ 199
7.38 Shear Modulus vs. Elapsed Time: US-82 Soil (Natural, WOMC) ..................................... 199
7.39 Shear Modulus vs. Elapsed Time: US-82 Soil (6% Lime Treated, OMC) ......................... 200
7.40 Shear Modulus vs. Elapsed Time: US-82 Soil (6% Lime Treated, WOMC) ..................... 200

xviii
LIST OF TABLES
Table Page
2.1 Sulfate Heave Case Studies ................................................................................................. 37
3.1 Test Soil Locations and Soluble Sulfate Contents of the Selected Soils .............................. 52
3.2 Atterberg Limits and Soil Classification ................................................................................. 52
3.3 Testing Variables ................................................................................................................... 55
3.4 Summary of Basic Tests ....................................................................................................... 57
3.5 Summary of Proctor Tests on Natural Soils ......................................................................... 59
3.6 Summary of Proctor Tests on Lime Treated Soils ................................................................ 60
3.7 Summary of Proctor Tests on Lime + Flyash Treated Soils ................................................. 60
3.8 Summary of 3-D Swell Tests on Natural Soils ...................................................................... 66
3.9 Summary of 3-D Shrinkage Tests on Natural Soils .............................................................. 67
3.10 Summary of 1-D Swell Pressure Tests on Natural Soils .................................................... 69
3.11 Summary of UCS Test Results ........................................................................................... 71
3.12 Lime Dosage Determination (Eades and Grim Method) .................................................... 75
3.13 Summary of Mineralogical Tests ......................................................................................... 79
3.14 Percent Clay Minerals Observed for Soils under Study ...................................................... 80
3.15 Reactive Alumina and Silica Measurements ....................................................................... 81
4.1 Vertical, Radial and Volumetric Swell Strains of 6% Lime Treated Soils @ 0 day mellowing
..................................................................................................................................................... 85
4.2 Vertical, Radial and Volumetric Swell Strains of 6% Lime Treated Soils @ 3 day mellowing
..................................................................................................................................................... 85
4.3 Vertical, Radial and Volumetric Swell Strains of 6% Lime Treated Soils @ 7 day mellowing
..................................................................................................................................................... 86

xix
4.4 Volumetric Swell of Treated Soils @ 0 day mellowing .......................................................... 86
4.5 Volumetric Swell of Treated Soils @ 3 day mellowing .......................................................... 87
4.6 Volumetric Swell of Treated Soils @ 7 day mellowing .......................................................... 87
4.7 Summary of Volumetric Swell ............................................................................................... 88
4.8 Volumetric Shrinkage Strain Test Results (0 day mellowing) ............................................... 96
4.9 Volumetric Shrinkage Strain Test Results (3 day mellowing) ............................................... 96
4.10 Summaries of Volumetric Shrinkage Strains ...................................................................... 97
4.11 UCS Tests Results (Natural Soils) .................................................................................... 101
4.12 UCS Test Results (6% Lime, 0 day mellowing) ................................................................ 102
4.13 UCS Test Results (6% Lime, 3 day mellowing) ................................................................ 102
4.14 Swell Pressure of 6% Lime Treated Soils @ 0 day mellowing ......................................... 110
4.15 Swell Pressure of 6% Lime Treated Soils @ 3 day mellowing ......................................... 110
4.16 Summary of Swell Pressures (Natural, 0 day and 3 day mellowed soils) ......................... 111
4.17 Reactive Alumina and Silica Measurements @ 0 day and 3 day mellowing .................... 113
4.18 Summary of Reactive Alumina and Silica Measurements (at OMC) ................................ 113
4.19 Gibbs free energy of Reactants and Products at 20ºC (Ettringite Reaction) .................... 120
4.20 Gibbs free energy of Reactants and Products at 20ºC (CSH Reaction) ........................... 120
4.21 Alumina, Silica and Sulfate contents of the Test Soils in ppm .......................................... 120
4.22 Balanced Amounts of Sulfate, Alumina and Silica in mol/L .............................................. 121
4.23 Final Gibbs Free Energy of Ettringite and CSH Reactions ............................................... 122
4.24 Data for Mass-Volume Calculations .................................................................................. 126
4.25 Theoretical Maximum Possible Ettringite in lb/ft3 of Soil Based on................................... 128
4.26 Theoretical Maximum Possible Ettringite in lb/ft3 of Soil Based on................................... 128
4.27 Phase Distribution Based on Mechanical Calculations (@OMC) ..................................... 129
4.28 Phase Distribution Based on Mechanical Calculations (@WOMC) .................................. 129
4.29 Mass of Ettringite formed Based on Mechanical Calculations (@OMC) .......................... 130

xx
4.30 Mass of Ettringite formed Based on Mechanical Calculations (@WOMC) ....................... 130
4.31 Void Ratios of Test Soils ................................................................................................... 132
4.32 Percent Clay Minerals Observed for Soils under Study .................................................... 133
5.1 List of Variables ................................................................................................................... 136
5.2 Atterberg Limits and Classification of Soils ......................................................................... 136
5.3 Summary of Basic Tests .................................................................................................... 136
5.4 Sulfate Content Determination ........................................................................................... 137
5.5 Summary of Proctor Tests on Natural Soils ....................................................................... 137
5.6 Summary of Chemical Tests .............................................................................................. 137
5.7 Percent Clay Minerals Observed for Soils under Study ...................................................... 137
5.8 Vertical, Radial and Volumetric Swell Strains-Natural Soils ............................................... 138
5.9 Vertical, Radial and Volumetric Swell Strains-4%L+8%FA @ 0 days mellowing ............... 139
5.10 Vertical, Radial and Volumetric Swell Strains-4%L+8%FA @ 3 days mellowing ............. 139
5.11 Volumetric Swell Strains @ 0 day mellowing (4%L+8%FA) ............................................. 139
5.12 Volumetric Swell Strains @ 0 day mellowing (4%L+8%FA) ............................................. 140
5.13 Summary of Volumetric Swell Strains ............................................................................... 140
5.14 Volumetric Shrinkage Strains of Natural Soils .................................................................. 143
5.15 Volumetric Shrinkage Strains of 4%L+8%FA Treated Soils @ 0 day mellowing .............. 144
5.16 Volumetric Shrinkage Strains of 4%L+8%FA Treated Soils @ 3 day mellowing .............. 144
5.17 Volumetric Shrinkage Strains Summary ........................................................................... 144
5.18 UCS Tests Results (Natural Soils) .................................................................................... 147
5.19 UCS Tests Results (4%L+8%FA, 0days mellowing)......................................................... 147
5.20 UCS Tests Results (4%L+8%FA, 3 days mellowing)........................................................ 147
5.21 Summary of UCS Test Results ......................................................................................... 148
5.22 Swell Pressures of Untreated Soils ................................................................................... 151
5.23 Swell Pressure of 4%L+8%FA Treated Soils @ 0 day mellowing .................................... 151

xxi
5.24 Swell Pressure of 4%L+8%FA Treated Soils @ 3 day mellowing .................................... 151
5.25 Summary of Swell Pressures ........................................................................................... 152
5.26 Reactive Alumina and Silica Measurements Natural Soils ............................................... 153
5.27 Reactive Alumina and Silica Measurements @ 0 day and 3 day mellowing .................... 153
5.28 Summary of Reactive Alumina and Silica Measurements (at OMC) ............................... 153
5.29 Void Ratios of Test Soils ................................................................................................... 155
5.30 Percent Clay Minerals Observed for Soils under Study .................................................... 156
6.1 Swell/Shrinkage Predictions based on Idealized Model ..................................................... 161
6.2 Effective Sulfate Contents of Treated Soils ........................................................................ 162
6.3 Measured vs. Predicted Swell Strains ................................................................................. 162
6.4 Measured vs. Predicted Swell Strains ................................................................................. 163
6.5 Vsulfate/Vsoil and Ve/ Vvi at OMC (3 day mellowing) ................................................................ 168
6.6 Vsulfate/Vsoil and Ve/ Vvi at WOMC (3 day mellowing) ............................................................ 169
6.7 Vsulfate/Vsoil and Ve/ Vvi at OMC (7 day mellowing) ................................................................ 169
6.8 Vsulfate/Vsoil and Ve/ Vvi at WOMC (7 day mellowing) ............................................................ 170
7.1 Stiffness Loss for Natural Soils @ OMC (MPa/Hr.) ............................................................ 202
7.2 Stiffness Loss for Natural Soils @ WOMC (MPa/Hr.) ......................................................... 203
7.3 Stiffness Loss for 6% Lime Treated Soils @ OMC (MPa/Hr.) ............................................ 203
7.4 Stiffness Loss for 6% Lime Treated Soils @ WOMC (MPa/Hr.) ......................................... 204

1
CHAPTER 1
INTRODUCTION
1.1 Introduction
Natural expansive soils have been found in various regions across the globe (Chen, 1988). In the
United States, several western and southwestern states have been reported to contain the most
problematic expansive soils. These expansive soils undergo large volume changes upon seasonal
wetting and drying, which eventually leads to severe damage of the structures built above them (Chen,
1988; Nelson and Miller, 1992). Lime and cement have been used widely in soil stabilization technology
for treating expansive soils (Hausmann, 1990). When expansive soils are treated with lime/cement, the
pH of the system is raised to 12.4 where the release of calcium and the dissolution of clay alumina and
silica occur, leading to the formation of pozzolanic compounds. Formation of these pozzolanic
compounds improves the volume stability, durability and stiffness characteristics of the expansive soils.
Since calcium is the main ingredient of both lime and cement, these two stabilizers are called as calcium-
based stabilizers. Due to its availability and reasonable cost, lime has been used as the subgrade
stabilizer in most of the transportation infrastructure projects.
In the last two decades, many cases of severe pavement heaving and distress were reported
when the expansive soils containing sulfates were treated with traditional calcium-based stabilizers
(Sherwood, 1962; Mehta and Klein, 1966; Mehta and Wang, 1982; Mitchell, 1986; Hunter, 1988; Petry
and Little, 1992; Puppala et al. 1999, 2003, 2012). Initially, it was assumed that the heave emanated
from the swell movements of the underlying expansive soils upon wetting. Later it was confirmed by
several researchers that the heave originated from the lime/cement-treated subgrades (Hunter, 1988;
Perrin, 1992; Mitchell and Dermatas, 1992; Petry, 1994; Kota et al. 1996 and Puppala et al. 2000).
Several pavements and infrastructure facilities that were built to last for decades experienced severe
heaving issues shortly after construction. The heave and pavement distress were attributed to the
complex reactions occurring in a moist environment between the calcium from the stabilizer, alumina,
silica, and soil sulfates. This phenomenon is termed as “Sulfate – Induced Heave” in literature.

2
When sulfate-bearing soils are treated with calcium-based stabilizers at elevated pH conditions,
calcium is released from the stabilizer, which reacts with soil sulfates, alumina and silica to form the highly
expansive mineral, “Ettringite” (Ca6.[Al(OH)6]2.(SO4)3.26H2O). As the chemical composition indicates, the
mineral Ettringite contains 26 molecules of water and is capable of swelling more than 137% of its volume
(Little et al., 2010). The formation and growth of Ettringite causes expansive stresses in the soils. When
these expansive stresses exceed the overburden pressure, heave and pavement failures occur. When
the temperature of the system falls below 150C and carbonates are present in the system, Ettringite is
transformed into Thaumasite through a series of reactions. Both Ettringite and Thaumasite are expansive
minerals. Thaumasite has been reported as the cause of severe heaving of pavements and parking lots in
Las Vegas, Nevada (Hunter, 1988).
Ettringite formation and subsequent heave is a complex phenomenon occurring in soils. It was
reported that the formation of Ettringite is dependent on the availability of free alumina in soils, free
access to water, temperature, humidity and site drainage conditions. In addition to these, forensic studies
conducted by Hunter (1989) indicated that the observed swell is due to an increase in void ratio from the
initial compacted state due to the mineral growth. Puppala et al. (1999) reported that under similar
chemistry and environmental conditions, sulfate-induced heave is of greater concern in clays than in
sands.
1.2 Current Guidelines in Practice
Based on previous sulfate heave case studies, researchers recommended that when significant
amounts of sulfates are present in the native soil, lime/cement treatment must either be carried out with
caution or be completely avoided (Mitchell, 1986). Berger et al. (2001) reported that soluble sulfates
below 3,000 ppm are of little concern, sulfates between 3000-5000 ppm are moderate concern, 5000-
8000 ppm are moderate to high risk and greater than 8000 ppm sulfate concentrations are of severe
concern for stabilization using lime. Transportation agencies across United Sates use lime in most of the
subgrade stabilization projects due to its cost and availability compared to cement. According to the
guidelines developed by the Texas Department of Transportation (TxDOT), sulfate concentrations up to
3000 ppm can be stabilized by traditional lime with one day of mellowing. Soils with sulfate concentrations
up to 8000 ppm can be stabilized by providing additional moisture, along with other chemical treatments

3
including combined lime and fly ash treatments. When sulfate concentrations exceed 8000 ppm,
alternative treatment such as remove—and-replace or blending in non-plastic soils is recommended.
Remove, replace and blend non-plastic soils are not engineering solutions in view of the economy and
sustainability since the transportation of foreign materials involves increased fuel emissions and costs
associated with it.
The guidelines developed so far limited the threshold sulfate level for lime stabilization as 8,000
ppm. However, failures are particularly evident in sites where soil sulfates were 8000 ppm or more, which
needs attention of the research community. Also, the soils with sulfate concentrations above 8,000 ppm
are called as “High Sulfate Soils” and are deemed ineffective for lime stabilization. Hence, the main
objective of the current research is to develop stabilization techniques for soils containing sulfate contents
above 8000 ppm.
1.3 Scope of the Present Work
The main objectives of the current study are:
1. To understand heaving mechanisms in chemically-treated high sulfate soils and to study the time
rate of Ettringite formation for quick assessment of sulfate-induced heaving.
2. To develop alternate stabilization techniques to suppress Ettringite-induced heaving in high
sulfate soils and to assess the effectiveness of a combination of stabilizers such as lime and fly
ash in treating high sulfate soils.
3. To address the effects of various soil compositional factors such as clay mineralogy, reactive
alumina, silica contents, sulfate contents and compaction void ratios on the swell behavior of
chemically-treated high sulfate soils. Also, to develop a threshold void ratio framework based on
sulfate content and compaction densities.
1.4 Thesis Organization
This thesis is comprised of nine sections: introduction (chapter 1), literature review (chapter 2),
experimental testing program (chapter 3), analysis of laboratory test results, Phase I (chapter 4), analysis
of laboratory test results, Phase II (chapter 5), heave prediction models (chapter 6), time rate of Ettringite
formation (chapter 7) and summary, conclusions and future research recommendation (chapter 8).

4
Chapter 1 provides the introduction to sulfate heaving, current guidelines in practice, limitations,
scope of the current work and thesis organization.
Chapter 2 provides a summary of chemical stabilization of soils, problems in sulfate soils,
introduction to sulfate bearing soils, sources of sulfates in soils, sulfate heave case studies from around
the world, threshold sulfate levels and brief description of different techniques to measure soluble sulfate
contents followed by sulfate heave mechanisms. A brief overview of different stabilization techniques,
their limitation and challenges are presented here.
Chapter 3 presents soil selection criteria, stabilizer dosage selection, laboratory sample
preparation, testing program, testing procedures used. Basic classification of the natural soils was
determined and presented as per American Society for Testing Material (ASTM) standards and Texas
Department of Transportation (TxDOT) methods and these results are included in this chapter.
Chapter 4 (Phase I) provides a summary and analysis of engineering test results on control
soils and treated soils at different mellowing periods and possible mechanisms for the property variations.
Tests covered in this chapter were subdivided as engineering, chemical and mineralogical tests. The
engineering tests include 3-D volumetric swell, 3-D volumetric shrinkage, UCS, 1-D swell pressure tests,
chemical tests include the determination of soluble sulfate contents and mineralogical tests include
reactive alumina and silica measurements. Results of the testing were analyzed using Gibbs free energy
approach and mass-volume calculations.
Chapter 5 (Phase II) describes a comprehensive analysis and summary of tests conducted on
lime + fly ash treated soils with and without mellowing. The effect of lime fly ash treatment on Ettringite
formation was also evaluated. Possible mechanisms between soil compositional factors and their
interactions with chemical stabilizers in Ettringite formation and heaving are discussed.
Chapter 6 provides heave prediction models and threshold void ratio frame work developed in
the current research study.
Chapter 7 provides summary of Bender Element studies conducted to measure the rate of
Ettringite formation and subsequent material degradation in chemically treated high sulfate soils
considered in the current study.
Chapter 8 provides summary of the research findings and future research recommendations.

5
Last section of this dissertation comprises of appendices listing standard proctor compaction
curves, photographs of test specimens and equipment and references.

6
CHAPTER 2
LITERATURE REVIEW
2.1 Chemical Stabilization of Soils
The literature review presented in this chapter was collected by conventional library and
electronic resources, as well as from previous research reports in the area of chemical stabilization of
soils. An introduction to chemical stabilization of soils is given, followed by problems in sulfate-bearing
soils and different sources of sulfates and their distribution. Past research on the threshold sulfate levels,
various sulfate measurement methodologies and a description of each method was given in the
preceding section. Ettringite formation reactions, chemical process and heave mechanisms were
explained, followed by sulfate heave case histories around the world. The last section of the literature
review is dedicated to the research conducted in the area of sulfate soil stabilization. A brief description of
the guidelines developed by state DOT’s was presented, followed by the different treatment techniques
used by previous researchers and their merits and demerits. Limitations of the previous stabilization
techniques and challenges were explained.
2.1.1 Chemical Stabilization of Soils
A brief background on chemical stabilization of soils is presented here.
2.1.1.1 Background
Chemical stabilization of expansive soils using lime/cement has been a favorite technique of
practitioners over the years. As mentioned before, lime has been chosen more often due to its low cost
and easy availability. Stabilization of soils using lime improves the plasticity characteristics, moisture
stability and strength characteristics. Stabilization using lime proceeds through two stages; namely, soil
modification and soil stabilization. When expansive soils are treated with lime, a series of reactions occur
which leads to the plasticity and strength changes. These reactions are cation exchange, flocculation and
agglomeration, pozzolanic reactions and carbonation reactions. The first two reactions are called
modification reactions, which improve the plasticity, shear strength and workability. The degree of effect
and amount of lime required to cause cation exchange reactions is based on the soil clay mineralogy and

7
water conditions. These reactions lead to modification of lime-soil mixture and are short-term reactions.
The last two reactions are called stabilization reactions, which impart long term strength gain due to the
formation of a compound called pozzolan. Pozzolan is a finely divided siliceous or aluminous material
which forms cemented products with the presence of water and calcium hydroxide. Clay mineral structure
contains alumina and silica in its formation and is termed as a pozzolan. When expansive soils containing
clay are treated with lime, lime elevates the pH of the system to 12.4, where clay alumina and silica are
released into the system, combining with calcium and water, to from pozzolanic compounds. These
reactions continue uninhibited as long as there is residual calcium available for release of alumina and
silica to form pozzolanic compounds. These reactions are shortly summarized as: + + → ( )(1) + + → ( )(2) Formation of the pozzolanic compounds and extended curing conditions lead to strength improvements in
the order of several hundred pounds per square inch (psi). As the pozzolanic formation reactions indicate
alumina and silica are released from clay which are absent in sandy soils. Research has shown that lime
can be an effective stabilizer for sandy or silty soils containing as little as seven percent clay fraction
(Little, 1995).
2.1.1.2 Problems in Sulfate Soils
Though lime stabilization improves the volume and strength charectersitics of the expansive
soils, there are some limitations to lime stabilization. These limitations are the presence of organic carbon
and soluble sulfates. It has been reported that the presence of organic carbon in excess of one percent
can interfere with the pozzolanic reactions, leading to low strength gains. Compared to organic carbon,
the presence of sulfates is of higher concern bacause lime treatement in these types of soils leads to
excessive heaving and pavement failures (Mitchell 1986; Hunter 1988,1989; Puppala et al. 1999, 2003,
2012; Rajasekaran, 2005). These pavment failures lead to questions pertaining to the validity of lime
stabilization itself. Figure 2.1 Shows the severe pavement failure on US 67 close to Dallas/Fort Worth,
Texas (Burkart et al., 1999). It has been reported that when soils contain sulfate minerals such as
gypsum (CaSO4.2H2O) and sodium sulfate (Na2SO4) in their natural formation and are treated with
calcium based stabilizers, adverse reactions occur, causing severe heave and pavement distress. These
8
adverse reactions are due to formation of expansive minerals, Ettringite (Ca6.[Al(OH)6]2.(SO4)3.26H2O)
and Thaumasite (Ca6.[Si(OH)6]2.(SO4).(CO3)2.24H2O). This phenomenon is termed as “Sulfate-Induced
Heave” in literature. This phenomenon was first reported by Sherwood in 1962;however, the sulfate-
induced heave phenomenon received little attention until the mid-1980’s. Terzaghi’s lecture by Mitchell in
1986 shed light onto the severity of the issue. Repair and re-construction of the the failed infrastructure is
costing millions of dollars to the tax payers. Under favourable moisture, humidity and temperature
conditons, these minerals grow, causing further swell. Researchers called lime treatment of expansive
soils containing sulfate “man made expansive soil” (Puppala et. al., 2012). The next section gives an
insight into the sulfate-bearing soils and sources of sulfates.
Figure 2.1 Severe Pavement Distress along US 67, Texas
2.2 Sulfate Bearing Soils
Sulfate-bearing soils are found all across the United States. Gypsum is found to be the most
frequent occurring sulfate mineral in the western part of United States (Kota et al., 1996). Figure 2.2
shows the location of soils containing gypsum and gypsum mines in the US. Many sulfate-induced heave
cases were reported in the state of Texas (Perrin, 1992; Puppala et al., 2010). Burkart et al. identified
certain geologic formations that possess high sulfates, with gypsum being the most common sulfate in the
Dallas area soils (Burkart et al., 1999). The most severe heaves in the Dallas/Fort Worth area are

associate
sulfur-bea
to 27800p
Childress
the conce
d with the Ea
aring minerals
ppm (Chen e
district (Pupp
entrations of th
Figure
agle Ford form
s. These soils
et al., 2005).
pala et. al., 20
he Eagle Ford
2.2 Location
Figu
mation. Harris
s were found
Very high su
013). The geo
d shale and th
of soils conta
ure 2.3 Geolog
9
s et al. (2004)
to contain su
ulfate concen
ology of the s
he presence o
aining Gypsum
gy of Texas (
) identified co
ulfate concen
trations of 44
state of Texas
of sulfate soil
m in United S
Harris, 2005)
ounties in Tex
ntrations rang
4,000ppm we
s is given in F
ls across the
States (Kota e
)
xas known to
ging from 400
ere reported
Figure 2.3, sho
state.
et al., 1996)
o have
00ppm
in the
owing

10
2.2.1 Sources of Sulfates in Soils
There are several sources of sulfates in soils, produced from primary or secondary origin.
Primary sources can be defined as the direct sources of sulfates in their natural form, as sulfate-bearing
minerals such as gypsum while, the secondary sources are those that are not a direct source of sulfate
but give out sulfates as a byproduct of oxidation or other forms of chemical interactions. The following
section highlights these sources.
2.2.1.1 Primary Sources
The primary source of sulfates in soils is gypsum (CaSO4.2H2O). Sulfates are present in natural
soils as calcium sulfate (gypsum), sodium sulfate and magnesium sulfate (Puppala et al., 2003). Natural
sulfate minerals have different solubilities based on their dissolution rate. Due to gypsum’s low solubility
(2.58 gm/L) compared to both sodium sulfate (408 gm/L) and magnesium sulfate (260 gm/L), it acts as a
steady source of sulfates in soils. The maximum solubility of gypsum occurs at 35◦C-50◦C. Sulfates are
present in higher concentrations in clayey soils than in granular soils. This is due to the low permeability
of clayey soils compared to granular soils which do not allow the dissolved sulfates to pass through them.
In granular soils, these sulfates get leached out very easily due to their high permeability. Figure 2.4
shows the calcium sulfate and sodium sulfate crystals in their natural form.
Figure 2.4 Gypsum and Thenardite in Natural Form

11
2.2.1.2 Secondary sources
Other sources of sulfates in soils are pyrites (sulfides), which on oxidation reactions are
converted into soluble sulfates. Many cases of pyritic oxidation and subsequent sulfate indueced heave
were reported in UK (Floyd et. al., 2003). Floyd et. al., 2003 summarized pyritic oxidation reactions to
form sulfate as: 2 ( ) + 2 + 7 → 2 ( ) + 4 ( ) + 4 (3) 4 + 4 + → 4 ( ) + 2 (4) + 14 + 8 → 15 + 2 + 16 (5) During the rainy season, sulfates in the top layers of the soil dissolve and move into the stabilized
layers; whereas, during dry spells, due to evaporation, dissolved sulfates move upward into the top
layers, increasing their concentration (Dermatas, 1995). As previously discussed, the sulfates can be from
secondary origin. A forensic investigation study was conducted by Rollings et al. (1999) on the failure of a
low-volume road in Georgia. Extensive bumps and longitudinal cracking were observed five months after
construction on a pavement built on cement stabilized sand. The failure is attributed to the formation of
Ettringite in the cement stabilized sand. While no sources of sulfate were found in the native soils, the
investigation found that the water from a nearby well used for mixing cement and compacting was the
source of sulfate in the soil. Also, the clay fraction of the sand contained the mineral Halloysite, which is
rich in alumina. Though the native soil contained no sulfate, the sulfate transported from the mixing water,
alumina released from clay fraction of the soils reacted with calcium from cement in the basic envrioment
to form expansive mineral Ettringite. Another example of secondary sulfate contamination is the sulfates
transported by ground water.
It can be understood from the above discussion that there are various sources of sulfates in soils;
now, it is important to understand how these sulfates present in the soils induce heaving. The following
sections details the threshold sulfate levles for lime stabilization folowed by process of sulfate induced
heave along with the chemical reactions involved in the process.

12
2.3 Threshold Sulfate Levels
2.3.1 Past Research on Threshold Sulfate Levels
Based on the previous sulfate heave case studies, one can understand that when sulfates are
present, lime treatment needs to be performed with caution or to be completely avoided. This is not true
in all cases because soils with reasonable sulfate contents were stabilized successfully using lime.
Hence, there needs to be a level of sulfates below which sulfate heaving is not a concern. These sulfate
levels are called “Threshold Sulfate Levels”. Researchers across the USA have reported different
threshold levels of sulfates at which heave distress was recorded (Hunter, 1988; Mitchell and Dermatas,
1992; Petry and Little, 1992; Kota et al. 1996; Puppala et al. 1999; Viyanant, 2000; Little et. al., 2005).
There are no conclusive threshold levels of sulfate that could be established, and this is primarily
attributed to variability in soil type and site conditions of these case studies.
Petry et al., 1992 stated that if the level of soluble sulfate is below about 2,000 ppm or 0.2%, the
development of expansive minerals will not be an issue in stabilized soils. Berger et al. (2001) indicated
that soluble sulfates below 0.3 percent (3000 ppm of sulfates) are of no problem. Soluble sulfates
between 0.3 and 0.5 percent represent a moderate risk of harmful reaction. Sulfates between 0.5 to 0.8
percent indicate moderate-to-high risk. Soils with soluble sulfates levels greater than 0.8 percent pose a
serious threat to civil infrastructure facilities. Studies conducted at The University of Texas at Arlington
(Puppala et. al., 2003) confirmed that at low sulfate levels, around 1000 ppm, lime stabilization plays an
important role in reducing swelling of natural soils. At sulfate levels ranging from 0 to 2,500 ppm, the lime
stabilization reactions and sulfate heave reactions occur simultaneously, but the magnitude and extent of
heave depends on the lime concentration. At higher lime dosages, swell magnitudes were suppressed,
indicating the dominance of stabilizing reactions. Also, when the sulfate concentrations exceeded 2500
ppm, the increase in lime dosage resulted in increased heaving due to increased amounts of Ettringite
formed. Puppala et. al., 2003 reported that void ratio and compaction conditions play important roles in
the sulfate-induced heaving phenomenon. If the void ratios are small, the soil matrix is dense and cannot
accommodate any heave associated with Ettringite formation and growth leading to the pavement heave.
Research studies conducted by Harris et al. (2004) indicated that at or below 3000 ppm sulfate
concentrations, sulfate heaving is of no concern and lime stabilization can be effectively implemented.

13
Also, between 3000 and 7000 ppm, sulfate concentrations lime stabilization can be performed in soils
with some caution. In most of the cases, the sulfate levels to induce heaving ranged from 320 ppm to as
high as 43,500 ppm (Puppala et al. 1999; 2003). The time for sulfate heave appearance after chemical
stabilization ranged from a few days to 18 months. Also, soils that experienced this sulfate heave
included sands to silts and clays with containing the significant amounts of clay fraction.
Overall, it can be seen that there is no conclusive threshold sulfate level above which heaving
occurs. This is due to the fact that soil properties such as void ratios, environmental and site drainage
conditions differ from site to site. Both crystal growth and mineral hydration and subsequent mineral
expansion in a soil void space will eventually result in macro expansions at the surface levels that can
distress transportation infrastructure. Another important reason for these variations is the differences in
test methods to measure soluble sulfates. Several methods in the literature will yield different soluble
sulfates for the same soil and sulfate conditions since they have different bases to determine the sulfate
content. A brief overview and description of each of these methods is presented in the following section.
2.3.2 Sulfate Measurement Methodologies
In view of the sulfate heaving issues, transportation agencies across United States have
mandated measurement of sulfates prior to subgrade stabilization. These agencies use different
techniques to measure the subgrade sulfates, which are either gravimetric-based or turbidity-based.
However, it was reported that these methods often fail to provide consistent and repeatable values
(Viyanant, 2000). Also, under similar conditions, these methods provide different sulfate values (Harris et
al. 2003 and Puppala et al. 2002). Gravimetric procedures determine the sulfate content based on the
amount of sulfate precipitated upon the addition of Barium Chloride to soil-water solution. Turbidity-based
procedures convert the turbidity caused by the presence of sulfates to sulfate concentration. A brief
description of each of these techniques is given below.
2.3.2.1 Gravimetric Determination of Sulfates
The basis of gravimetric methods is precipitation of soluble sulfate on addition of barium chloride.
Representative soil samples are collected and mixed with equal proportions of water and kept overnight
to allow dissolution of sulfate into water. The soil-water solution is mixed, centrifuged and filtered thru a
filter paper. The resultant solution is boiled, and barium chloride is added to the solution to precipate

sulfate as
The portio
obtain the
sulfate de
discription
2.3.2.1.1
M
UTA meth
1:10 diluti
grams of
for 30 min
are extra
machine.
supernata
mL. The p
facilitate tBaCl (10%
T
through a
free from
the weigh
the soil. P
case of h
weight of
concentra
methods
other met
s barium sulfa
on of sulfate
e sulfate conc
etermination.
n of each of th
Modified UTA
Modified UTA
hod proposed
ion ratio can e
soil with 100
nutes on an E
cted from th
The higher
ant liquid is th
pH of the dilu
the further di
%) solution is
The precipitat
a 0.1μm mem
chlorides. Ch
hts of dry filte
Puppala et. al
high montmor
the barium
ation in ppm
indicated tha
hods (Talluri
ate. The resul
(SO42-) is calc
centration in
They are:
he methods i
A Method
method was
d by Petry (1
extract sulfate
mL of distille
Eberbach sha
he solution b
r rate of ce
hen filtered th
utant is adjus
ssolution of s
s added slowly
e is then dig
brane filter. W
hlorides can b
r paper and f
l., 2002 sugg
rillonite soils
sulfate precip
(parts per
at the Modifie
et. al., 2012).
tant solution
cuated and m
ppm. There
Modified UTA
s given below
s developed b
994). 1:10 so
e concentratio
ed water and
aker to disinte
by centrifugin
ntrifuging all
hrough 0.1μm
sted between
sulfates. The
y until the pre
ested in an o
While filtering
be checked by
filter paper w
ested the use
since most o
pitated is obt
million). Rec
ed UTA meth
.
14
is filtered to g
mutliplied with
are two wide
A method a
w:
by Puppala e
oil water dilut
ons up to 26,
leaving it ove
egrate the su
g the sampl
lows the eff
m VVLP type
5 and 7 by a
e solution is t
ecipitation pro
oven at 80-9
g, the precipit
y silver nitrate
with barium su
e of a finer filt
of the soil pa
tained and m
cent studies
od gave repe
get the weigh
h the weight o
ely used grav
and AASHTO
et al. (2002)
tion was use
000 ppm. Th
ernight. The
lfate salts in
le at 14,000
ficient extrac
filter paper, a
adding diluted
then boiled u
ocess is comp
900C for 12 h
tate is washe
e-nitric acid re
ulfate precipit
ter paper and
articles sizes
multiplied with
on diffferent
eatable and
ht of barium s
of barium sulf
vimetric techn
O (T 290-95)
and is a refi
d in this met
is method inv
next day, the
the soil matri
rpm using
ction of solu
and the filtrat
d hydrochlori
until the bubb
pleted.
hours. The pr
d with distille
eagent. The d
tate gives the
d longer cent
are smaller
h a factor to
t soluble sulf
consistent re
sulfate precipi
fate precipita
niques for so
) method. A
ned version o
thod. Theoret
volves mixing
e sample is sh
ix. Soluble su
IEC-HT cent
uble sulfates.
te is diluted t
c acid (1:9) H
bles appear. W
recipitate is fi
ed water to m
difference bet
e sulfate cont
rifuging time
than 0.1 μm
obtain the s
fate measure
esults compar
itated.
ted to
oluble
Brief
of the
tically,
of 10
haken
ulfates
trifuge
. The
o 200
HCl to
Warm
iltered
make it
tween
tent in
in the
m. The
sulfate
ement
red to

A2.3.2.1.2
T
mixture is
and rate
membran
pipetted.
then adde
additional
hot barium
complete.
water unt
platinum c
of hydrofl
reignited
materials
given in
expressio
Where, W
2
T
translate
They are
T2.3.2.1.3
In
measures
2003). By
AASHTO Me
The AASHTO
s then shaken
of centrifugin
e filter. 30 mL
The extract i
ed to the solu
10 mL of HC
m chloride (B. The solution
til the washin
crucible and c
uoric acid (H
and cooled
interfere with
this method
on:
W = Weight of
.3.2.2 Turbidi
Turbidity base
it into the sul
TxDOT meth
TxDOT Metho
n this metho
s the degree
y using the re
thod (T 290-9
O method invo
n and centrifu
ng as Modifie
L of clear sam
s then diluted
ution until the
Cl is added to BaCl ) is adde
n with precipit
ngs are free
charred witho
F) are added
in a desiccat
h the sulfate
. Concentrat
SuBaSO in gram
ty Based Det
ed techniques
fate concentr
od (Tex-145-
od (Tex-145-
od. turbidity
of absorption
elation betwe
95)
olves mixing
uged to obtai
ed UTA meth
mple containin
d to 200 mL
e methyl oran
the sample. T
ed to the solut
tate is filtered
from chloride
out flaming fo
d to expel the
tor to obtain
ion measure
ion of sulfat
ulfateinmg/Kgms and S = W
termination of
s measure the
ration. Two m
E) and ASTM
E)
caused by
n of light trans
een absorban
15
100 grams
n a clear ext
od does. The
ng sulfate ion
by adding d
nge end point
The solution
tion. Boiling i
d through a fi
e. Instead of
r one hour. A
e silica as sil
the mass of
ement. Provis
e ion in mg
g = 411500 ×SWeight of sam
f Sulfates
e amount of t
most widely us
M method (AS
sulfate is m
smitted throu
ce and conc
of soil samp
ract. This me
e resultant so
equivalent to
istilled water.
t is reached.
is then heate
s continued u
ne ashless fi
f weighing th
A drop of sulfu
icon tetraflou
f barium sulf
sions for rem
g/Kg (ppm) is
× W mple used in g
trubidity caus
sed turbidity t
STM C1580).
measured usi
ugh the samp
centration of a
ple with 300
ethod does no
olution is filte
o 20 - 50 mg o
. Hydrochloric
Once the en
ed until boiling
until the prec
lter paper an
e filter paper
uric acid (H Suride (SiF ). T
fate. Silica a
moval of such
s obtained f
grams = 10
sed by presen
techniques a
ng a colorim
ple by human
a solution, th
mL of water
ot specify the
ered using 0.
of barium sulf
c acid (1:9) H
ndpoint is rea
g, and then 5
ipitation proc
nd washed wi
r, it is placedSO ) and few
Then the sam
nd other inso
h interference
from the follo
nce of sulfate
re presented
meter. Colori
eye (Harris
he concentrat
r. The
e time
45μm
fate is
HCl is
ached,
mL of
ess is
th hot
d in a
drops
mple is
oluble
es are
owing
es and
here.
meter
et al.,
tion of

soluble io
remain co
ionized w
kept for o
filtrate is c
a sample
which inte
pressed u
initial cali
with a wh
colorimete
with the d
W
the conce
can be in
changing
concentra
reported a
A2.3.2.1.4
A
This meth
sulfate (N
20.0, 30.
correspon
These sol
calibration
and 250 m
Once the
ons can be ob
onstant. 10 g
water correspo
overnight. The
collected in a
vial. The sam
erfere with th
until “SUL” me
bration. The
ite plastic rod
er displays a
ilution ratio to
With 1:20 dilut
entration exce
ncreased and
the dilution
ation is greate
as > 44000 pp
ASTM Metho
ASTM method
hod involves
Na2SO4) dilute
0 and 40.0
nd to sulfate
lutions are ru
n curves. In tw
mL of de-ioni
stirring is ove
btained unde
of representa
onding to a d
e next day, t
beaker. Usin
mple vial is th
he sulfate m
ethod is displa
sample vial i
d. The sample
reading and
o obtain the c
tion, the color
eeds the allow
d the values
n ratios colo
er than 4400
pm.
od (C1580)
d can measur
preparation o
ed to 1 liter. T
mL is collec
concentration
n in a photom
wo 400 mL b
zed water is
er, the solutio
r the assump
ative soil sam
ilution ratio o
the sample is
ng a clean pip
hen cleaned
measurement.
ayed. The sa
s taken out a
e vial is then p
an average
oncentration
rimeter can m
wable limit of
s obtained ar
orimeter can
00 ppm an er
re sulfate con
of a standard
This standard
cted and dilu
ns of 0.0, 2.0
meter, and cor
beakers labele
added to eac
ns are filtered
16
ption that wav
mple is collect
of 1:20. The s
s filtered thro
pette, 10 mL o
using Kim wi
The colorim
ample vial is th
and a sulfate
placed in the
of three read
in ppm.
measure conc
colorimeter a
re multiplied
measure c
rror message
ncentration in
d sulfate solu
d sulfate solu
uted to 100
, 5.0, 10.0, 1
rresponding p
ed A and B, 3
ch beaker an
d through two
velength and
ted and mixed
sample is sha
ough a Whatm
of the clear fi
pe to remove
meter is switc
hen placed in
tablet is add
colorimeter a
dings is obta
centrations in
an error mess
with the co
concentration
e is displayed
n the range of
ution using 0
ution in volum
mL using d
15.0, 20.0, 30
photometer re
30g and 3g o
d stirred for 1
o dry medium-
optical path
d with 200 m
aken manuall
man No.42 fi
ltrate is extra
e any finger p
ched on and
n the colorime
ded to the so
and the test k
ined. The res
the range of
sage is displa
rresponding
s up to 44
d and the su
f 0.02-3.33%
0.1479gm of
mes of 0.0, 2.
istilled water
0.0 and 40.0
eadings are re
f representat
1 hour using
-textured filte
length of rad
L of distilled o
y for 1 minut
lter paper an
acted and plac
prints or dirt m
the mode k
eter and zero
olution and ta
key is pressed
sults are mult
100 - 4000 p
ayed. Dilution
dilution ratio
4000 ppm. I
lfate value ca
(200-33,000
anhydrous so
.0, 5.0, 10.0,
r. These solu
mg/L respec
ecorded to pr
ive soil is coll
a magnetic s
r papers. pH
diation
or de-
te and
nd the
ced in
marks
key is
ed for
amped
d. The
tiplied
ppm. If
n ratio
os. By
If the
an be
ppm).
odium
15.0,
utions
ctively.
repare
lected
stirrer.
of the

17
resultant solution is adjusted using 0.1 N HCl or 0.1 N NaOH to 7±1. 10 mL and 20 mL of aliquot is
collected from each solution (A and B) and diluted to 100 mL. 5.0 mL of conditioning reagent (containing
30 mL of HCl, 300 mL reagent water, 100 ml 95% ethanol, 75 g sodium chloride and 50 mL of glycerol) is
added to each of these solutions and stirred using a magnetic stirrer. 0.3 g of barium chloride crystals are
added to these solutions and stirred for 1 min. The solution is poured into the turbidity meter, and turbidity
is recorded after 4 min. The sulfate concentration in mg is determined from the calibration curve.
= 2.5 ∗∗
Where:
P= Percentage of SO4 in dried soil; M=mg/L of SO4 calculated from calibration curve; W= mass of
soil placed in 400 ml beaker in g; A= volume of aliquot specimen, in mL
2.4 Sulfate Heave Mechanisms
2.4.1 Introduction
Sherwood (1962) reported that a high pH is required to generate the reaction between the clay
fraction and sulfates present. When calcium-based stabilizers are used to treat expansive soils, the pH of
the system rises to a value of 12.4. At higher pH levels, the solubility of silica and alumina in clays
increase, and they are released into the solution. The sources of alumina in natural soils are amorphous
hydroxyl aluminum, alumino silicate phases of soil and hydroxyl phases from smectite and
montmorillonite. When the soils contain sulfates, sulfates react with calcium and alumina released from
clay to form the expansive mineral Ettringite (Ca6.[Al(OH)6]2.(SO4)3.26H2O). Ettringite is highly expansive
in nature and can expand up to 137% of its original volume (Little et al., 2010). Ettringite is a calcium-
sulfate-aluminate-hydrate and has 26 molecules of water in it. Formation and growth of Ettringite has
shown to improve the water retention capability leading to material softening. To study the effects of
material softening, Puppala et. al., 2006 conducted experiments where they measured the stiffness
properties of chemically-treated sulfate soils using Bender elements (BE). They found out that at sulfate
levels around 1,000ppm, strength enhancements were observed; whereas, sulfate levels of 10,000
showed strength reduction behavior leading to destabilizing mechanisms. These destabilization
mechanisms caused softening of small strain shear moduli properties.

18
Mehta et al., 1966 reported that the formation of Ettringite is favored in high alumina content
whereas formation of monosulfate hydrate is favored in low alumina content. Also, the Ettringite formation
is controlled by the molar ratio of Al2O3 and SO4. When the molar ratio of Al2O3 and SO4 is greater than
one, formation of monosulfate hydrate is favored. When the ratio is less than one Ettringite formation is
favored. Both monosulfate hydrate and Ettringite are stable phases in aqueous solution. It was
established that at higher temperatures monosulfate hydrate is stable whereas at lower temperatures
Ettringite is stable. When soils are initially treated with lime, lime increases the pH of the system and
hence the solubilities of alumina and silica. At higher alumina contents monosulfate hydrate is formed
first. As the rate of release of alumina into the solution decreases gradually Ettringite becomes a stable
phase. If sufficient soluble silica and alumina are not available in the soil then calcium reacts with other
minerals to form Gypsum, calcite and other pozzolanic compounds. The rate and amount of sulfate
release in to the solution depends on the sulfate salt present in the soil. Sulfate salts with higher
dissolution rates get dissolved easily and depleted early. If there is more alumina in the system than
sulfates, the formation of monosulfate hydrates continues until the pH of the system drops to a level
leading to slow release of alumina in to the solution. Ettringite becomes a stable phase once again. Once
Ettringite is formed it continues to grow in its purest form until the temperature of the system drops below
15◦C, above 15◦C Ettringite is a stable phase (Kollman et al., 1977).
When the temperature of the system drops below 15◦C, Ettringite transforms by series of
reactions into Thaumasite (Ca6.[Al(OH)6]2.(SO4)2.(CO3).24H2O) provided sufficient carbonates and
humidity are present in the soil. This transformation takes place by isostructural substitution of silica for
aluminum and carbonate for sulfate. The transformation of Ettringite to Thaumasite is followed by
intermediate phases. Thaumasite is also an expansive mineral and was found in many of pavement
failure cases (Hunter, 1988). Expansion capability of Thaumasite is similar to Ettringite. It was found that
rate of Ettringite formation and subsequent growth would be greater during summer (Rollings et al.,
1999). When the pH of the system falls below 10.5, the formation and growth of Ettringite is ceased. In
this case, gypsum becomes a stable phase.
The literature on sulfate-induced heave in soils report different environments where heave may
occur. Two different geochemical environments where heaving may occur are presented here. First,

19
sulfide minerals oxidize and react with other soil minerals to form sulfate minerals (Dubbe et al., 1997).
This transformation involves an increase in volume due to variations in atomic packing as well as the
addition of water to the mineral structure. The second environment involves the formation of a mineral
that expands up to 250% when completely formed (Berger et al., 2001). This mineral, called Ettringite,
only forms under special circumstances; there have been many experiments that elucidate factors
controlling the formation of this expansive mineral in concrete and more recently in soils (Sherwood,
1962; Ogawa and Roy, 1982; Hunter, 1989; Deng and Tang, 1994; Dermatas, 1995).
There are two geochemical environments under which Ettringite formation occurs. The first
geochemical environment for sulfate-induced heave was due to the oxidation of sulfides. Pyrite and
Marcasite, (both minerals are FeS2 but the atoms are arranged differently) form under an oxygen deficient
environment and are not stable in an oxygen-rich environment. They are abundant in many coals,
carbonaceous shales, and limestones. Often these rocks are exposed to the atmosphere during road
construction. Upon exposure, O2 (g) from the atmosphere serves as an oxidizing agent for pyrite and
Marcasite. The process is explained by the equation below: 4 ( ) + 14 + 15 → 4 ( ) + 8 (6) The iron and sulfur are oxidized by surface water that is enriched in atmospheric oxygen. The
iron generally precipitates as a ferric hydroxide, and the sulfur will either remain in solution or precipitate
as gypsum if there is sufficient calcium present. The source of calcium is often limestone (CaCO3);
limestone is very soluble in acids. Looking at the right side of equation 1, there are 8 moles of sulfuric
acid (H2SO4) released in the weathering of 4 moles of pyrite or marcasite. This will make the surrounding
environment very acidic and promote the dissolution of limestone (equation 2), which will supply Ca2+ for
the formation of gypsum (Equation 3). + → + ( 4) + + (7) + ( 4) + 2 → . 2 (8) The mineral transformation of pyrite to ferric hydroxide and gypsum results in an increase in
volume. The oxidation of pyrite and the formation of gypsum are responsible for distress experienced in a
few construction projects (Dubbe et al., 1997). In other projects, where traditional calcium-based
stabilization is performed, other deleterious reactions may occur. Heave caused by calcium-based

20
stabilizers in sulfate and clay-rich environments is mainly due to the formation of calcium aluminate
sulfate hydrate mineral (Ettringite). The next section describes the chemical process of Ettringite
formation and transformation to Thaumasite with equations.
2.4.2 Chemical Process
Hunter, 1988 summarized the series of reactions involving the formation and transformation of
Ettringite to Thaumasite. These reactions are presented below. The initial reactions are normal
pozzolanic reactions occurring in lime-treated soils. The type of clay mineral indicated here is
Montmorillonite (Equation 11). The sole function of clay is to provide alumina and silica. In the presence
of excessive sulfate, sulfate from any evaporate react with alumina released from dissolution of clay to
form Ettringite.
+ → ( ) (9) ( ) ( ) → + 2( ) (10) ( 12.4) ( ) . + 2( ) + 10 → 2 ( ) + 4 + (11) ( > 10.5) 2 → 2 + 2 → 2 + 2 (12) ( ) 5 + 6 + 4( ) → ( ). 4 . + 6( ) (13) ( ) . → + + (14) ( , = 1; = 2 = 2; = 1) 6 + 2 ( ) + 4( ) + 3 + 26 → ( ) . ( ) . 26 (15) ( ) + → (16) ( ) + → + 2 + 2 (17)

21
( ) ( ) . ( ) . 26 + 2 + 2 +→ ( ) . ( ) . ( ) . 24 + 2 ( ) + + 4 + 2 (18) ( − ℎ ) + + 2 → . 2 (19) ( ) + → (20) ( ) 2.4.3 Ettringite Mineral Structure
The name of Ettringite is derived from the place Ettringen, Rhine province, Germany. The mineral
occurs in cavities of metamorphosed limestone inclusions in volcanic flows. The term “Ettringite” was first
introduced by Lehamann in 1874. The mineral structure of Ettringite is hexagonal prisms, often in
elongated form. Ettringite can have different shapes: needle-like, lath-like, and rod-like. These shapes
depend on the time and pH during the formation period. A photograph taken with the help of a Scanning
electron microscope (SEM) shows the needle-like structure of Ettringite and is presented in Figure 2.5.
Previous research concluded that when pH is very high, the rod-like Ettringite crystals are formed. Lath-
like crystals are formed as concretions of smaller crystals aligned in the same direction and in low pH
conditions, while needle-like crystals are formed in low pH conditions (Kollman, 1978). Figure 2.6 depicts
a schematic of the mineral structure of Ettringite. The preceding section describes various schools of
thought related to Ettringite formation and heaving.

22
Figure 2.5 SEM photograph of needle-like Ettringite (Mallat, 2006)
Figure 2.6 Schematic of the mineral structure of Ettringite (Intharasombat, 2003)
2.4.3 Heaving Mechanisms
The formation of Ettringite and its subsequent growth are explained by Cohen (1983). According
to him, there are two different swell mechanisms associated with Ettringite formation and subsequent
growth. These mechanisms are reported as crystal growth theory and swelling theory. The expansion
theories presented in Cohen’s paper are based on Ettringite formation and growth in cement concrete.
Dermatas (1995) summarized the heaving mechanism in two categories. The first is a topochemical
mechanism where expansion is related to formation and/or oriented crystal growth of Ettringite (Ogawa
and Roy, 1982). As per the crystal growth theory, aluminum, calcium and sulfates can concentrate around

23
Ettringite nucleation sites and combine to form additional Ettringite. With Ettringite crystal growth,
pressure is exerted on the restraining media. When this pressure exceeds the confinement or
overburden, swelling occurs. The second is a thorough solution mechanism where expansion is related to
swelling due to hydration.
2.4.3.1 Heaving due to Crystal Growth
Ogawa and Roy (1982) proposed a heave mechanism based on crystal growth. This results in a
large nucleation rate which generates many small Ettringite crystals surrounding the aluminum-bearing
particles. According to their theory, Ettringite forms around calcium aluminum sulfate particles in the early
stages of cement hydration. This creates a reaction zone around every particle. In later stages, with the
introduction of water into the system, the crystals assume a needle-like shape around particles from
which they are formed. When the adjacent reaction zones intersect they exert mutual pressure on each
other, leading to the swelling of the whole system. This mechanism is favored in high pH and sufficient
availability of reactants. In soil-lime systems, the soil matrix is less rigid and contains larger void spaces
compared to the cement concrete system. This allows the accommodation of initial Ettringite in soil voids.
With introduction of additional water into the system in later stages, heaving occurs since the soil matrix
can no longer accommodate the continuous Ettringite growth.
2.4.3.2 Heaving due to Hydration
Swelling due to hydration was proposed by Mehta (1973). He suggested that formation of
Ettringite follows a thorough solution mechanism. Also, in the presence of saturated Ca(OH)2 , the rate of
hydration of aluminum decreases significantly. This causes the Ettringite to form gel-like and colloidal
crystals. These colloidal crystals adsorb large quantities of water molecules due to their high surface area
and net negative charge. Expansion of colloidal Ettringite is aided by external water supply. In the
absence of lime, long rod-like crystals are formed. These crystals have low surface area. They absorb
lesser water molecules, and hence no expansion is observed in this case. Colloidal or gel-like crystals are
formed in high hydroxyl ion concentration; whereas, rod-like crystals are formed in low hydroxyl ion
concentrations. Mehta and Wang (1982) conducted series of experiments and found that coarser
Ettringite expands less than finer Ettringite. Scanning electron microscope studies revealed that in the
presence of lime, Ettringite crystals are 1 micron in length and ¼ micron in width. In the absence of lime,

24
longer (6 to 8 inches) and wider (1/2 to 1 micron) crystals are observed. He observed that the amount of
expansion is associated with the amount of water adsorbed. The restraint offered by soil system is less
compared to concrete system and hence even small swell pressures can cause expansions in soils.
The investigation of chemically treated soils in Las Vegas by Hunter (1989) identified a total
swelling of 24% swell due to formation of ettringite/thaumasite, and he attributed the rest to an increase in
voids from the soil initially being in such a heavily compacted state. Many investigators (Mitchell and
Dermatas, 1992; Wild et al., 1999; Kota et al., 1996) have noted that low compaction density reduced the
swell due to more void space which will allow the expansive minerals formation. Harris et al., 2004
concluded that reduced swell is due to a combination of more void space and a faster reaction rate
removing more of the sulfates from the system before compaction.
2.4.4 Factors Influencing Ettringite Induced Heave
The following conditions needs to be satisfied for the formation of Ettringite and its growth:
1. High pH environment
2. High water supply
3. Relative humidity
4. Continuous supply of calcium
Ettringite formation is favored in high pH conditions. When the pH of the system drops below
10.5 the Ettringite formation/expansion is terminated. At pH<10.5, due to inadequate supply of dissolved
clay or calcium ions or sulfate ions, the Ettringite/Thaumasite formation/expansion is terminated.
Adequate supply of alumina is an important factor. The possible sources of silica and alumina in soils are
clay minerals, quartz, feldspar, mica and other alumino-silicate minerals. The experience from Stewart
Avenue suggested that a minimum of 10 % clay fraction is needed for Ettringite formation. Availability of
alumina is strongly dependent on the quantity and type of clay mineral present in the soils. Kaolinite
mineral releases more alumina compared to Montmorillonite mineral. At elevated pH conditions, Kaolinite
releases alumina five times faster than Montmorillonite (Dermatas, 1995). This fact is supported by
Mitchell and Dermatas (1992) investigation of lime treated specimens of sand mixed with Kaolinite and
Montmorillonite. Kaolinite acts as a continuous source of alumina and hence Ettringite phase is stable. A
more recent study using geochemical modeling further illustrates the importance of aluminum availability

25
(Little et al., 2005) in generating reactions causing sulfate-heave; furthermore, they speculate how the
Al/Si ratio may be modified to mitigate sulfate heave reactions.
Formation of Ettringite is a necessary but not sufficient condition for heave to occur. Heave
development is controlled by rate and quantity of Ettringite formation. Heave is a function of the crystal
size, restraint of the system and ion mobility within the system. Due to lower rigidity of stabilized soil
matrix compared to Portland cement, soils are more open systems where Ettringite can diffuse easily,
resulting additional precipitation of Ettringite (Hunter, 1988). Continuous supply of water is necessary for
growth of Ettringite and subsequent heave. In Stewart Avenue, Las Vegas case study in areas with
sulfate contents as low as 700 ppm severe damage and heave were observed whereas in areas with
sulfate contents close to 20,500 ppm no heave was observed. In the previous case those areas were
close to a major source of water.
Relative humidity of the system is also an important factor. Sulfate-induced heave is dependent
on the amount of sulfates present in the soil. Hydraulic and osmotic pressures in soils are responsible for
a supply of additional sulfates in soils. Hydraulic and osmotic pressures assist the movement of sulfates
from subgrade soil to the stabilized pavement layers. The greater the soluble sulfates, the greater is the
risk of sulfate attack.
The amount and type of lime used plays an important role since, with increase in lime content,
the amount of calcium available for Ettringite formation increases. At low lime contents, sulfate heave is
not observed. Formation of Ettringite is effected by temperature (Mitchell et al., 1992). Temperature
affects the rate of ongoing reactions, and hence the overall reaction process. The temperature conditions
found in pavement sections (20-400C) are sufficient to cause Ettringite growth. Ettringite formation and
growth is higher at warm temperatures. Other factors influencing the formation of Ettringite are water
content and dry density of lime-treated soil.
2.5 Sulfate Heave Case Histories
In this section various case histories of sulfate induced heave are reported in brief. A summary of
several case histories was presented at the end of the section in Table 1.

2.5.1 Stew
S
constructi
medians.
extent of
constructi
aggregate
dry weigh
homogeno
minerals (
were foun
between a
A
the invest
100 % sw
this area c
wart Avenue,
Severe heavi
on (Hunter,
The maximu
f distress on
on. The pave
e base on a 3
ht of soil. Th
ous. The mi
(Sepiolite and
nd to be adjac
asphaltic pave
Figure 2.7
A forensic inve
tigation showe
welling. The re
contained gyp
Las Vegas, N
ng was obse
1988). Distr
m distress ob
n Stewart Av
ement section
30 cm lime tr
he soils in th
ineralogy of
d Montmorillo
cent to an ob
ement and co
Longitudinal
estigation wa
ed that the cl
eactions betw
psum as a so
Nevada
erved on Stew
ress was ob
bserved was
venue. The
n contained 1
eated sub-ba
he Stewart A
the soils co
onite) and eva
bvious source
oncrete media
and Transve
as carried out
ays present a
ween lime and
ource of sulfat
26
wart Avenue
bserved in a
in the order
first evidenc
0 cm of asph
ase. The soils
Avenue are s
ontained prim
aporates (Ca
e of water, are
an. The obser
rse cracks on
to find the p
are slight to m
d sulfates wer
te. The influx
Street, Las V
asphaltic pav
of 12 inches
ce of distres
haltic concrete
s in the area
sandy silts a
mary minerals
alcite and Gyp
eas of poor d
rved distress
n Stewart Ave
possible cause
moderately ex
re the causes
x of sulfates is
Vegas, Neva
vement, conc
(30 cm). Fig
ss appeared
e layer follow
are treated w
and sandy cla
s (Quartz an
psum). Areas
drainage and
is shown in F
enue (Hunter,
e of the heav
xpansive, but
s of heaving.
s provided by
da two years
crete and as
gure 2.7 show
six months
wed by 13-20
with 4 % of lim
ays and are
nd Feldspar)
s of major da
construction
Figure 2.7.
1988)
ving. The resu
are not capa
In addition, s
y percolating w
s after
sphalt
ws the
after
cm of
me by
fairly
, clay
amage
joints
ults of
able of
oils in
water.

X-ray diff
Thaumas
around 13
Ettringite
minerals E
also conc
2.5.2 Bus
In
developed
pavement
wide and
resting on
clayey sa
cement. A
areas of s
Figure 2.8
Figure
fraction (XRD
ite in the dam
3oC. Formati
gets convert
Ettringite/Tha
luded that a c
h Road, Geor
n 1992, five
d severe bum
t surface hea
63 mm heig
n 15 mm cem
nds to sandy
An investigat
severe and n
8 shows the d
e 2.8 (a) Distre
D) and Scann
maged sub-b
on and grow
ted into Thau
aumasite, and
clay fraction o
rgia
months after
mps (Rollings
aving were ob
ght. The low-v
ment-stabilize
y clays. The r
ion was carr
o distress we
distressed are
ess in Cemen
ning Electron
ase layers. T
wth of Thaum
umasite by is
their subseq
of 10% is suff
r its construc
et al., 1999).
bserved in so
volume road
ed sub-base.
road was bui
ied out to fin
ere sent to th
eas.
nt Stabilized S
27
n Microscopy
The temperat
masite is favo
sostructural s
uent growth o
icient to caus
ction, a low
. Reflective c
ome locations
was construc
The soils in
lt on clayey s
nd the probab
he laboratory,
Sand
y (SEM studi
tures recorde
ored at this t
substitution. O
on soaking ar
se sulfate indu
volume road
racking in ov
s. The maxim
cted by 31 m
this area var
sand stabilize
ble causes o
, and mineral
(b) Crack
ies) indicated
ed in the pav
temperature,
Overall forma
re the causes
uced heave in
d in Chatham
verlying aspha
mum size of
mm of asphal
ried from fine
ed with 5-6%
of heaving. C
logical studie
k in Cement S
d the presen
vement areas
since below
ation of expa
s of swelling.
n soils
m County, Ge
altic pavemen
bumps was 3
lt concrete su
e sands to si
Ordinary Po
Core samples
es were perfo
Stabilized San
nce of
were
15oC
ansive
It was
eorgia
nt and
3.1 m
urface
lt and
ortland
s from
rmed.
nd Base

28
Upon EDAX studies, an abundance of needle-like crystals were observed in areas with high
bumps. These needles-like crystals were found to be Ettrnigite. Though the stabilized soil was sandy, it
contained significant proportions of mineral halloysite, which is rich in alumina and is required for the
Ettrngite formation. Also, the original soil did not contain enough sulfates to cause expansion, but the
well water used for mixing soil and cement contained sulfates enough to cause Ettringite formation and
heaving. Ettringite growth is supported by the moist climate of Georgia and ingress of water through the
cracked joints of pavement. The temperature of the pavement is enough to cause heave reactions to take
place. Sulfate concentrations as low as 700 ppm caused severe heave and damage in some areas due to
the abundance of water. The authors classified this attack as a Type II attack in which the Portland
cement hydration products provide calcium, clay fraction provide alumina which react with soil sulfates to
from Ettringite. Findings of this case study cautioned against cement stabilization of sands with significant
clay fractions since they are sometimes more susceptible to sulfate attack than lime treated materials.
2.5.3 Holloman Air force Base, New Mexico
Pavements and ribbed mat foundation on a project at Holloman Air force Base, NM developed
heaving problems several years after construction (Rollings et al., 2006). All the areas in the project have
600 mm of crushed concrete as fill or base course. Severe heave was observed in the aircraft
maintenance hangar, ramps and areas where the thickness of the floor is only 150 mm. Heave is mostly
observed in areas where recycled concrete aggregate is used as fill or base course. The climate in NM is
semi-arid. The water table at Holloman AFB fluctuates throughout the year, but it is often high. The soils
in the area are CL-ML, ML, or CL in the Unified Soil Classification System, with plasticity indices varying
from non-plastic to 15 and with about 50–75% passing through the number 200 sieve.
Large quantities of gypsum are found in the areas of Holloman AFB. Microscopy and X-ray
diffraction of the samples from heaved areas indicated the presence of large quantities of Ettringite and
Thaumasite. Intact core samples were collected near air craft maintenance hangar and tested for
chemical composition. These cores contained gypsum as a re-cementing material on the intact cores,
and gypsum was also found as coating around aggregate particles in the hangar area. The soils in the
area contained Kaolinite and Chlorite as primary clay minerals, but they are not responsible for the heave.
Figure 2.9 shows the heaving in flexible pavement near the northeast corner of the hangar.

It
Holloman
it. The hig
Fine soil
reclaiming
availability
between a
resulted
investigat
pavement
furnace sl
2.5.4 Joe
In
(Perrin, 19
Soils in t
minerals.
formation
Figure
t was found
AFB. Crushe
gh water table
particles are
g process. A
y of alumina
alumina from
in the forma
ion that altho
t construction
lag with recyc
Pool Dam, T
n 1988 and 1
992). The pav
his area wer
The extent o
. Though the
e 2.9 Heaving
that sulfate
ed recycled c
e level in this
available wit
Although sulfa
in soils, cru
fine fractions
ation of exp
ough recycled
n in areas of
cled concrete
Texas
1989, several
vement sectio
re lean clays
f heaving is d
soils contain
g in flexible pa
attack of the
oncrete is mo
s area assiste
hin the recyc
ate resistant
ushing and p
s of soil, calci
pansive mine
d concrete is
f sulfate cont
can be imple
l park roads
ons contained
s and clayey
depicted in Fi
ned barely de
29
avement near
e recycled c
ore permeabl
ed in seepage
cled concrete
cements we
placing allowe
um from recy
eral Thaumas
s a valuable
tamination. T
emented prov
in Joe Pool L
d 150mm thic
sands, with
gure 2.10. Th
tectable sulfa
r northeast co
concrete was
e and allows
e of water th
through subg
ere used in
ed contamina
ycled concrete
site. It was
construction
The use of fly
vided sufficien
Lake experie
ck subgrade la
less than th
hese soils be
ate contents,
orner of hang
s the cause
easy passag
rough crushe
grade contam
the concret
ation of the
e, and readily
concluded
material, it c
y ash, groun
nt laboratory d
nced severe
ayers stabiliz
hree percent
elonged to the
the lime-trea
ar
of the heavi
ge of water th
ed concrete la
mination durin
e, which lim
soil. The rea
y available gy
from the for
cannot be us
d granulated
data is availab
heaving prob
zed with 5-6%
clay swelling
e Eagle Ford
ted base mat
ing at
rough
ayers.
ng the
mit the
action
ypsum
rensic
sed in
blast
ble.
blems
% lime.
g clay
Shale
terials

30
contained 2000-9000 ppm sulfates. Though the reason for the increase in sulfate content was not known,
it was hypothesized that sulfates could have migrated from the surrounding soil through continuous
supply of fresh water. Upon mineralogical investigation, it was found that Ettringite and Thaumasite were
the causes of the heaving. The roadway was re-compacted, but the heaving issue continued. Finally, all
the lime treated layers were replaced with gravel base and non-expansive fill, and no issues of heaving
were observed.
Figure 2.10 Heaving in lime treated subgrade
2.5.5 Sulfate Attack on a Tunnel Shotcrete Liner, Dallas, Texas
Cracking and water leakage problems were observed in a tunnel shotcrete liner in Dallas, Texas
(Puppala et al., 2010). The tunnel was found on limestone, on top of the Eagle Ford geological formation.
On careful inspection, a white powder-like material and gel-like substance are found on the shotcrete
liner. Samples of powder material and rock core samples from distress locations were collected and sent
to The University of Texas at Arlington (UTA) geotechnical laboratories. These were collected from low
distress regions (LDR), medium distress regions (MDR) and high distress regions (HDR). These samples
were subjected to extensive mineralogical testing by XRPD and EDAX studies. Rock core samples were
subjected to unconfined compressive strength (UCS), indirect tensile strength (ITS) and unconsolidated
undrained (UU) tests. A photograph of the distress region is shown in Figure 2.11.

M
core sam
and sulfat
4% were
ppm were
UCS valu
The prese
sulfates a
concluded
Type V ce
2.5.6 Sulf
O
signs of s
the taxiwa
treated ba
rigid reinf
Mineralogical
ples and pow
tes. High moi
measured in
e observed in
e with increas
ence of sulfat
and continuou
d that continu
ement as sho
fate Heave Iss
One of the ta
sulfate induce
ay section. Th
ase soil. The
orced concre
Figure
studies of all
wder samples
isture content
low distress
n LDR and HD
sing distress
tes influenced
us moisture
uous monitori
tcrete materia
sues at DFW
xiway section
d heave. Loc
he shoulders w
main taxiway
ete pavement
2.11 Distress
the samples
collected fro
ts of approxim
regions. Sulf
DR areas. UC
magnitude. S
d the rock pro
leakage from
ng of the tunn
al is suggeste
W Airport, Texa
ns built at the
calized areas
were construc
y section did
overlying a f
31
s region on tu
indicated the
om the field in
mately 15% w
fate contents
CS testing of
Similar trends
operties adve
m the joints c
nel heave ne
ed.
as
e Dallas/Fort
of heave dist
cted of flexibl
not show any
four to twelve
nnel lining (C
e presence of
ndicated pres
were measure
less than 15
the rock sam
s were observ
ersely. It was
could compro
eeds to be do
t Worth Intern
tress were ob
le asphalt pav
y signs of hea
e inch lime-tre
C-3)
f Ettringite and
ence of calci
ed in high dis
500 ppm and
mples indicate
ved with UU te
s observed th
omise the tun
one. The use
national Airpo
bserved along
vement, whic
aving since it
eated base c
d Thaumasite
um, alumina,
stress regions
greater than
ed the decrea
ests and ITS
at the presen
nnel safety. I
of sulfate res
ort (DFW) sh
g both should
h rest upon a
t was built wi
course. The n
e. The
silica
s, and
2000
ase in
tests.
nce of
t was
sistant
howed
ers of
a lime-
th the
natural
32
subgrade soil was shaley clay with sandy seams and occasional gypsum deposits. The base course
consists of the native subgrade soil stabilized with lime. Figure 2.12 shows the distress pattern.
The shoulders exhibited pavement cracking associated with heave distress. At several locations,
the amount of heave ranged from 0.05m (5cm). to as high as 0.3m (30cm). This heave pattern was
irregular and sometime affected small localized areas of one to two feet in diameter. Other heave- related
cracks in the asphalt pavement appeared near the junction between rigid concrete and asphalt concrete
sections. Significant lateral movement of pavement edges had also occurred at certain locations. On the
other hand, the rigid pavement was in good condition, with few minor shrinkage cracks at very few
locations.
Reasons for the observed distress were location of drainage ditches near the shoulders and
topography of the site which might have contributed to the increase in the heaving of lime treated soils.
Heavy rain fall occurred in the last six months of 1996 and early 1997 may have raised the water levels
under the pavement sections. This moisture may have contributed to the hydration necessary for the
formation of Ettringite and Thaumasite compounds. These compounds, when further hydrated, may have
resulted in the heaving of the flexible pavement section. The west shoulder exhibited more damage than
the east shoulder. Part of this may be attributed to the water pooling near the base of the embankment
which is located next to the west shoulder. Another factor for less distress on the east shoulder could be
attributed to the better draining facilities of the east shoulder section due to topographical features.

33
Figure 2.12 Heave Distress Pattern on West Shoulder of Taxiway
2.5.7 US 82, Texas
The Texas Department of Transportation (TxDOT) observed heaving on a new construction
project on U.S.82 (Chen et al., 2005). The pavement design included a 50 mm asphalt concrete over 300
mm flexible base followed by 200 mm lime treated subgrade. The heaving was observed on east side of
the project, while no heaving was observed on the west side. Figure 2.13 depicts the observed heaving
on the east side. The soils on both sides have tan colored soils, but the east side soils contained sparkly
bits of gypsum. The subgrade soil from this project belongs to Eagle Ford formation. Soils in Dallas/ Fort
Worth are rich in clay and gypsum.
A forensic investigation was initiated to determine the causes of heaving and possible solutions
for future projects. Core samples of lime-treated subgrade and raw subgrade were collected and sent for
testing by the Texas Transportation Institute (TTI). SEM analysis of the core samples confirmed the
presence of long fibrous crystals. These were confirmed as Ettringite. These crystals were absent in raw
subgrades. Further chemical analysis was performed to find the unreacted sulfate which could cause
heaving in the future. In-situ conductivity and pH measurement tests were performed on soils from both
the east side and the west side. The pH values were higher in both these cases since the soils are lime
treated. Conductivity of samples from the east side were found to be higher than those from the west

side. It wa
was conc
soils on th
low amou
mellowing
concluded
2.5.8 US
E
Childress
followed b
mm hydra
raw subgr
testing. Th
termed as
NB ROW
as also conclu
cluded that so
he east side h
unts of sulfate
g period and
d from the stu
287, Texas
Extensive lon
, Texas (Zhim
by a 254 mm
ated lime-trea
rade soil sam
he soils in the
s high sulfate
W are classifie
uded that a si
oluble gypsum
have sulfates
es. The west
3% of lime
udy that condu
Figu
gitudinal crac
ming, 2008). T
fly ash stabil
ated base. Th
mples from the
e NB ROW a
e soils (HS). S
ed as fine gra
ix-fold increas
m seeps from
in the range
side of the p
e application.
uctivity meas
re 2.13 Heave
cking and se
The pavemen
ized crushed
e maximum d
e north and s
rea were foun
Soils in the s
ained soils; w
34
se in conduct
m the surface
of 4,000 -27,
project was tr
No heaving
urement is a
ed area on ea
evere ride ro
nt section con
stone base u
distress was
south right of
nd to contain
outh bound R
whereas, soil
tivity is observ
e to depths, in
,800 ppm. Th
reated with 3
g was observ
good indicato
ast bound sid
oughness we
nsisted of 76.
underlain by a
observed in t
ways (ROW)
sulfates abov
ROW are low
ls in the SB
ved with an in
ncreasing the
e soils on the
3% of lime fo
rved on the
or of sulfates
de
ere observed
2 mm Type D
a 178 mm flex
the north bou
) were sent to
ve 35,000 pp
w sulfate soils
ROW are cla
ncrease in de
e conductivity
e west side co
llowed by a 7
west side. It
in soils.
on US 287
D asphalt hot
xible base an
und (NB) lane
o the laborato
pm. These soi
s (LS). The so
assified as c
epth. It
y. The
ontain
72 hr.
t was
7 near
t mix ,
nd 228
e. Two
ory for
ils are
oils in
coarse

grained so
NB area is
A
bar linear
resonant
soaking. V
ash, lime
It was fou
sulfate co
swelling a
lime-treate
2.5.9 Wes
A
structural
oils. Higher c
s sulfate indu
A series of lab
r shrinkage
column tests
Various alter
and slag wer
und that a co
ontents. The
and retained
ed subgrade
stern Colorad
A commercial
fill blanket (B
clay content in
uced. Figure 2
boratory tests
tests, condu
s, and uncon
native stabiliz
re conducted
ombination of
combination
unconfined c
with select fil
Figure 2.1
do
structure wa
Bagley et. al.,
n the NB soils
2.14 shows th
were done to
ctivity and c
nfined compr
zer treatment
. Property en
lime and sla
of lime and f
compressive s
l, or reworkin
4 Longitudina
as constructe
, 2009). The s
35
s is the cause
he longitudina
o characterize
colorimetry te
essive streng
ts such as hy
hancements
ag seemed to
fly ash is mo
strength. The
g with the sta
al Cracks on S
d with mono
soils in the a
e of the swell
al cracks on sh
e the unmodi
ests, moisture
gth tests wer
ydrated lime,
with the addi
o be the best
ost suitable fo
e present stud
abilizers.
Shoulder and
lithic cast-in-
rea were san
ling. The hea
houlder and s
ified soils. Att
e susceptibil
re performed
, Portland ce
ition of stabili
t choice for s
or high sulfat
dy recommen
d Swell
place footing
ndy clay to cla
ve observed
swell.
terberg limits
ity tests, fre
d after 10 da
ement, lime a
izers were stu
oils with mod
te soils in ter
nded replacin
on a lime tr
ay overlying s
in the
tests,
e-free
ays of
and fly
udied.
derate
rms of
ng the
reated
sandy

36
clay stone. Shortly after construction, the structure showed 28cm of differential elevation. Lime treatment
of the on-site soils was selected for the structural blanket. Lime dosage was chosen as 5-10% by dry
weight of soil. Low swell potential of soils, high moisture content and soft clay soils indicated that the
water addition was not the cause of the movement. An investigation was begun to determine the causes
of heaving. The post-construction investigation showed soluble sulfate contents ranging from 0.37
(3,700ppm) to 1.65 % (16,500 ppm). Surface water infiltrated due to poor drainage and landscape
irrigation. Also, the ground water table was encountered at shallow depths. Lime-treated base layer
thickness ranged from 0.3 to 0.82 meters. Upon stoichiometric calculations, authors calculated the
maximum Ettrnigte induced heave to be 40% of the lime treated fill thickness (12cm to 33cm). Maximum
measured heave was recorded as 30cm, which correlated well with the calculations. The south and south
east portions of the foundation required complete replacement. The authors recommended precautions
to prevent surface and subsurface water to lime treated base material.

37
Table 2.1 Sulfate Heave Case Studies
Location Soil Nature of Lime/C Sulfate Heave
Parking Lots, Kansas, Southern California
N/A Thaumasite and Ettringite
NA NA NA
Stewart Avenue, Las Vegas, Nevada
Silty clay Ettringite 4.5% 43,500 6 months
Lloyd Park, Joe Pool Lake, Dallas, Texas
OC Ettringite 5% (L) 2,000– 9,000 Immediately
Auxiliary Runway, Laughlin AFB, Spofford, Texas
Clays Ettringite 6-9% 14,000– 25,000 2 months
Cedar Hill State Park, Joe Pool Lake, Dallas, Texas
Highly Ettringite 6% (L) 21,200 2 months
Denver International Airport, Denver, Colorado
Expansi Ettringite NA (L) 2,775 NA
SH-118, Alpine & SH-161, Dallas, TX
Clayey Ettringite 4% (C) >12,000 6 to 18
Localities in Dallas-Fort Worth Region, Texas
Clays Ettringite 6%-9% 233-18,000 Varies
Dallas – Fort Worth International Airport, Irving, Texas
Clay Ettringite 5% (L) 320– 13,000 3 months
Near Shreveport, Louisiana Aggregates Ettringite NA NA NA
Holloman Air Force Base, NM Crushed Ettringite NA NA Several
U.S.82,TX N/A Ettringite 6%(L) 100-27800 Immediately
Baylor Creek Bridge, Childress, TX
Fine 5%(L) 6800-35000 Several
Western Oklahoma Clays Ettringite 0- 194-84000 NA
Pavements in Frisco, Arlington, Texas
Clays Ettringite 6-8% 500-5000 1 month
DART Tunnel, Mocking Bird Station, Dallas
Clay Ettringite Ordinar 1700-2300 Several

38
2.6 Stabilization of Sulfate Bearing Soils
This section is dedicated to various techniques available to stabilize sulfate bearing soils and I
their limitations.
2.6.1 Pre-Compaction Mellowing
The investigation of soils in Las Vegas showed that only 24% of the observed swell was caused
by the formation of Ettringite and Thaumasite, and the rest of the swell is attributed to an increase in void
ratio from the initial compacted state due to the mineral growth (Hunter, 1988). The experience from
Stewart Avenue showed that an increase in the void space could potentially accommodate the Ettringite
formation and growth. Several investigators noted that compaction to lower density means decreasing the
maximum dry density which could create more void space to allow the formation of expansive minerals
(Kota et al., 1996 and Mitchell et. al., 1992). Decrease in dry density of the treated mixes can be achieved
by delaying the compaction after mixing with the stabilizers. This phenomenon is called “pre-compaction
mellowing” in literature. Research studies in the UK have shown that mellowing soils for a certain period
of time at constant moisture levels allows the lime to hydrate completely, diffusing through the soil and
causing maximum changes in plasticity (West, 1959 and Sherwood, 1993). These plasticity changes
create a non-plastic material which is workable. Though the final achieved density is slightly lower,
maximum effects of lime stabilization can be achieved by using mellowing.
In the case of sulfate bearing soils, during mellowing, sulfate reactions and lime stabilization
reactions occur simultaneously. The formation of deleterious compounds occurs before compaction in this
case (Berger et al., 2001; Harris et al., 2004). During the remixing and re-compaction, already formed
Ettringite is broken to prevent the formation of reaction zones for further Ettringite growth. As mentioned
earlier, any further growth of Ettringite can be accommodated in the less dense material. Harris et. al.,
2004 recommended provision of an additional 3-5% moisture above the optimum moisture content during
the mellowing to allow faster dissolution of sulfates, leading to the early depletion of reaction compounds
for Ettringite formation. Research studies conducted in Texas have shown that the magnitude of swell
reduced due to a combination of more voids and a faster reaction rate, removing more of the sulfate from
the system before compaction.

39
Harris et al., 2004 reported that using 3-day mellowing period resulted in acceptable swell in soils
with sulfate contents around 7,000ppm. When the sulfate concentrations reached 10,000ppm mellowing
did not give positive results in this case. Based on these research findings Texas Department of
Transportation warranted use of lime treatment above 8,000ppm sulfate level.
In a study conducted by Berger et. al., (2001), sulfate soils from South Orange County, California
were successfully stabilized using a pre-compaction mellowing technique. Soils containing 0, 5000ppm
and 8000ppm sulfate concentrations were treated with 4% lime and 4% lime+8% fly ash and allowed to
mellow for periods of one, three and five days. After the mellowing period, samples were cast into
cylinders and strength and swell tests were conducted to see the effectiveness of stabilization. All the
test soils passed the strength and allowable swell criteria, showing the dominance of pozzolanic
reactions. The pH of the treated soils was determined to check possible Ettringite reactions. In all the
cases, the pH was well below 10, indicating that Ettringite formation reactions are not possible at these
pH conditions.
A second set of samples were fabricated using 6% lime and spiked with 14,000ppm (±1000ppm)
sulfates to see the effect of a higher concentration of sulfates. All the soils were mixed with 6% lime and
6% lime and 12% fly ash and allowed to mellow for periods of one, three and five days. After the
mellowing period, specimens were cast and moist cured for 60 days and tested for swelling in sulfate
solution. All the soils showed positive effects of stabilization with minimal vertical swell. The pH of the test
soils was observed to be higher than 10 in all cases, indicating the occurrence of both pozzolanic and
sulfate reactions. Successful stabilization of all the soils using mellowing technique was attributed to the
fact that all the expansion occurred during the mellowing period and sulfates were consumed during the
mellowing period with no more sulfates available after compaction. Maximum effects of stabilization were
achieved in this case.
2.6.2 Double Application of Lime
Double application of lime to treat sulfate soils is based on the assumption that first application of
lime allows formation and expansion of Ettringite, whereas second application of lime accelerates the
formation of pozzolanic compounds. These pozzolanic compounds bind the soil particles and improve soil
strength. The time gap between the first and second application of lime is an important factor. If the time

40
duration between successive applications of lime is less, the soil sulfates will not get dissolved completely
leading to the formation of low-sulfate form of calcium-alumium-sulfate-hydrate (CASH) compounds.
These compounds in later stages get converted in to Ettringite with release of sulfates by rain or oxidation
of sulfides. A minimum of three days of curing is required between successive applications of lime.
Adding more and more lime does not ensure heave arrest, since additional supply of sulfates by leaching
and oxidation of pyrites is possible. In such cases heaving problem is still aggravated.
It was observed by Pat Harris et al. (2004) that double application of lime resulted in more
heaving than single application. It was concluded that double application of lime is ineffective in soils with
high sulfate contents and soils containing sulfides (pyrites). Soils with soluble sulfates up to 7000 ppm
can be effectively stabilized with double application of lime (Kota et al., 1996). Double application
technique can be used in low sulfate soils provided soils do not contain sulfides.
2.6.3 Combined Lime and Cement Treatment
It is well known that lime and cement treatment improves the workability and reduces volumetric
changes of soils. Researchers from The University of Texas at Arlington used a combination of lime and
cement to treat expansive soils from Arlington, Texas containing low to medium sulfates (Chakkrit et. al.,
2008). As part of the laboratory studies, two high plasticity clay soils from Arlington were chosen and
treated with 12% lime and a combination of 6%lime and 6% cement. Two curing periods, 2 days and 7s
days, were considered in this study. Laboratory results indicated that the combination of lime and cement
successfully provided strength enhancements and reduced swell and shrinkage characteristics. Also, the
combination of lime and cement treatment proved to be more effective than the lime treatment alone.
Findings from the laboratory study were implemented successfully in the field, and no issues of heaving
were observed.
2.6.4 Stabilization Using Low Calcium Based Stabilizers
When soils containing sulfates are treated with calcium based stabilizers, sulfate-induced heave
is observed. The most common calcium based stabilizers are cement and lime. The higher the calcium,
the higher the heave associated with it. The availability of calcium can be limited by using low-calcium

41
stabilizers. Fly ash is one of the calcium-based stabilizers. Fly ash is classified as class C fly ash and
class F as per ASTM. The main difference between class C fly ash and class F fly ash is the availability of
free calcium. The percentage of free calcium is higher in class C fly ash compared to class F fly ash. This
is the reason why lime needs to be added to class F fly ash for soil stabilization. The factors which affect
the reaction rate of fly ash in soils are soil type, specific surface areas of soils, chemical composition of fly
ash admixtures and dosage of fly ash. It was concluded that the use of fly ash decreases the swell and
shrinkage strains of the soils by decreasing the plasticity index of soil (Puppala et al., 2000).
The treatment of soils with low-calcium based stabilizers such as class C fly ash, class F fly ash
has been attempted by various researchers (Wang et al., 2004; Puppala et al., 2006; Solanki et al., 2009,
McCarthy et al., 2009). Treatment of soils with fly ash initiates short-term and long-term reactions. The
short-term reactions include flocculation and agglomeration with increased ionic exchange. The long-term
reactions include strength enhancements.
McCarthy et. al., 2009 studied the effect of lime +fly ash treatment on suppression of swelling
associated with Ettringite formation. Their study consisted of two steps. One was a preliminary evaluation,
and other was a main laboratory research program. As part of the preliminary evaluation, they used 5:1
quartz and Montmorillonite sand spiked with 20,000ppm sulfates (sodium sulfate) and stabilized using
class F fly ash and GGBFS (ground granulated blast furnace slag). The dosages of fly ash and GGBFS
were 3, 6, 9, 12% and 3, 6, 9% respectively. Test soils were mixed with different dosages of stabilizers,
compacted and tested for swelling for a period of 28 days. Results of the testing showed that the fly ash
dosage at 9% yielded the optimum results in suppressing the swelling.
The main research program included stabilizing sulfate bearing Kimmeridge clay using lime (3%)
and different dosages of fly ash. As part of this investigation, they also studied the influence of mellowing
on suppression of swelling in lime fly ash-treated soils. In this study, they used four different types of
class F fly ash with varying coarseness. Test soils were mixed with lime and water, and Proctor curves
were developed. Once the maximum dry density and optimum moisture content were established, soils
were treated with lime and water and allowed to mellow for periods of 0, 1 and 3 days. After mellowing,
the soils were mixed with fly ash (@6, 12, 18, 24% on dry weight basis) and Proctor curves were
developed for a different dosage level. Compaction values from the Proctor curves were used in

42
preparing specimens for swell and strength testing. Results indicated that mellowing was effective in
suppression of swelling. A control level of swelling (below 5%) was achieved using 18% fly ash at one
day mellowing and 12% fly ash at 3 day mellowing. Another important observation was that coarser fly
ash was efficient in swell suppression due to the low maximum dry density achieved, which is indicative of
more void space for Ettringite accommodation. For the sake of practicality, the authors recommended the
use of 3% lime and 10-15% coarse fly ash, with one day mellowing.
In a research study conducted at UTA (Deepthi et al., 2007), three different types of fly ash were
used to stabilize sulfate-rich expansive soils from the DFW (Dallas-Fort Worth) area and Arlington area.
According to the Unified Soil Classification System (USCS), these soils are classified as low
compressibility clays (CL), with medium plasticity index values. Stabilizer dosage levels used in the study
are 0, 10, 15, and 20 % by dry weight of the soil. Three-dimensional free swell, shrinkage strain and
pressure swell tests were conducted on treated soils. Based on three-dimensional swell test results, class
F fly ash treatment was considered a better treatment method compared to bottom ash treatment. It was
concluded that Class F fly ash provided maximum enhancements to the soil properties. Heave severity
was reduced from a high level to a medium or low severity level by class F fly ash treatment. Maximum
property enhancements were observed in combined stabilizer treatment with class F fly ash and nylon
fibers.
A similar study conducted at the University of Oklahoma, using class C fly ash (CFA), supported
the claim. The soils studied were sulfate-rich lean clays from Oklahoma. The soils were treated with 5, 10,
& 15% dosage levels of class C fly ash, lime and cement kiln dust (CKD). The evaluation of stabilizer
treatment was done on the long-term and short-term basis. Several engineering tests, including resilient
modulus (MR), modulus of elasticity (ME), unconfined compressive strength (UCS), tube suction (TST)
and three-dimensional swell tests, were performed. Mineralogical tests were conducted to identify the
micro-structural developments. The addition of class C fly ash improved MR, UCS, ME after 28 days of
curing. The moisture susceptibility was considerably decreased by the application of CFA. Overall, CFA
showed better short-term and long-term performance compared to other stabilizers used in the present
study.

43
A recent research study conducted by McCarthy et al. (2009) in the UK on fly ash treatment of
high sulfate soils yielded satisfactory results. He concluded that swelling reduced by increasing fly ash
contents and decreasing lime content. Use of coarser fly ash was found to be more effective than finer fly
ash. Further, he recommended the use of 3 % lime, 10-15 % mass fly ash, and an allowance of one day
mellowing period before application of fly ash and coarser fly ash.
2.6.5 Stabilization with Non-Calcium Based Stabilizers
There have been a number of studies, over the past 20 years, pertaining to the effectiveness of
non-calcium based stabilizers for subgrade soil stabilization. The U.S. Forest Service, the U.S. Army
Corps of Engineers, and researchers in Australia have studied many of the additives (Bolander, 1997;
Giummarra et al., 1997). A review of some of the literature relating to this topic is presented below.
Marquart (1995) stabilized three Texas Vertisols (pH ranged from basic to acidic) with sulfonated
naphthalene. Their study showed that higher amounts of stabilizer were required for basic soils (High pH
soils) and that there was an optimal stabilizer content for swell reduction. The effects of a potassium-
based stabilizer on expansive clay soils was investigated by Addison and Petry (1998). They determined
that multiple, low concentration injections performed better than a single high concentration injection and
that the treated sites should not be allowed to dry significantly before sealing with a foundation or slab .
The effectiveness of three liquid soil stabilizers at changing the engineering properties of clay soils was
evaluated by researchers at the University of Texas, Austin (Rauch et al., 2002).
Rauch et al. (2002) concluded that there were no significant changes in soil properties at the
recommended stabilizer application rates. Santoni et al. (2002) studied the wet and dry strength gain of a
silty-sand material stabilized with 12 nontraditional stabilizers, including: acids, enzymes, lignosulfonates,
petroleum emulsions, polymers, and tree resins. They reported a large variation in results, with some
stabilizers performing well and other stabilizers not performing at all for the experimental conditions and
soil they used.
These studies, using nonstandard (noncalcium-based) stabilizers, were criticized by the
manufacturers of the non-standard stabilizer products for measuring properties biased toward the
lime/cement industries (i.e. strength gain and/or unrealistic swell tests) in a controlled laboratory setting

44
and for not following the manufacturer’s recommended mixing and curing procedures. Many of these
products are reported to change the soil compaction characteristics and/or the clay minerals’ affinity for
water, resulting in less 3-D swell. Harris et al. (2006) evaluated many of the same stabilizers as previous
researchers (Rauch et al., 2002; Santoni et al., 2002), but strict mixing and curing requirements imposed
on lab testing by the stabilizer manufacturers were followed. Soils with sulfate concentrations above
10,000 ppm were stabilized with nine non-standard stabilizers (acids, emulsions, enzymes, and polymers)
and evaluated with respect to 3-dimensional swell and unconfined compressive strength (UCS) because
the Texas DOT is primarily concerned with swell reduction in plastic soils and strengthening the subgrade
enough to serve as a working platform for construction. The research showed that many of the stabilizers
were no more effective than adding water to the soil in the soils tested. Harris et al. (2006) showed that a
polymer at six times the recommended application rate and an acid actually reduced the swell by eight
percent. However, the strength was not improved. Both stabilizers proved to be more costly than
removing and replacing the subgrade.
2.6.6 Ground Granulated Blast Furnace Slag (GGBFS)
Sulfate-induced heaving phenomenon is observed when soils containing sulfates are treated with
calcium-based stabilizers such as lime and cement. Replacement of cement or lime by GGBFS has been
studied by various researchers (Wild et al., 1998; Tasong et al., 1999; Puppala et al., 2005). Substituting
part of the lime with GGBFS for high sulfate clay soil stabilization has been successfully implemented in
the UK by researchers. Progressive replacement of the lime by GGBFS reduces the amount of available
free lime, improves cementation properties due to slag hydration and reduces the pH of the soil system
significantly (Wild et al., 1998, 1999). Experimental studies by Wild et al. (1999) on kaolinite and
Kimmeridge clay illustrated that substitution of lime by GGBFS produces significant reduction in linear
expansion of sulfate bearing clayey soils containing gypsum as a source of sulfate. In this study lime
stabilization is partially replaced with 60 to 80 % of GGBFS. The addition of GGBFS in stabilized sandy
and soft clayey soils reduces the permeability considerably. When soils are treated with insufficient
quantities of GGBS, Ettringite-induced heave is observed. In such cases, soil sulfates react with calcium,
alumina and silica, leading to the formation of Ettringite and subsequent heaving. Replacement of lime

45
with GGBFS reduces the availability of calcium to react with soil sulfates, and the growth of Ettringite is
severely inhibited.
Treatment of sulfate-bearing soils by GGBFS has been attempted in United States by various
researchers (Harris et al., 2004; Puppala et al., 2005). In a research study conducted at UT Arlington,
soils from north Texas were treated with various stabilizers such as class F fly ash + Type V cement,
GGBFS, Type V sulfate resistant cement, lime + fibers and GGBFS. These soils are classified as low
compressible clays (CL) with sulfate levels around 5000 ppm. Three different moisture contents were
considered in the study. The dosage level of GGBFS is 20% by dry weight of soil. UCS, one dimensional
swell and three dimensional swell tests were conducted on the soil samples to see the effect of stabilizers
on soil property enhancements. Swell strains considerably decreased with the application of GGBFS, and
a significant increase in UCS is observed in the present study.
In a similar study conducted by Harris et al. (2006), two stabilizer treatments were applied on
College Station, Texas soils. The stabilizers studied were GGBFS + lime and class F fly ash. The soils
were treated with 0 and 20,000 ppm sulfates. Several engineering and mineralogical tests were
performed to see the effects of stabilizers. The use of 5% GGBFS with 1% lime yielded satisfactory
results in reducing swell and improving strength. The cost of GGBFS plus lime treatment was similar to
lime treatment alone.
2.6.7 Sulfate Resistant Cements
Cement has been used as a stabilizing material for expansive soils for many years. Soils
stabilized with cement are called as “Cement-stabilized” soils (Hausmann, 1990). Different types of
cements are available in the market to meet physical and chemical requirements for various applications.
Type I cement is used for general RCC structures, Type II for soils with low sulfate contents, Type III for
high strength in early stages, Type IV for dam structures and Type V for high sulfate soils. Cement
treatment of soils provides strength enhancements and plasticity reductions through flocculation,
cementation and pozzolanic reactions. In sulfate-resistant cement stabilization, the series of reactions
involved are similar to ordinary cement stabilization. In general, tricalcium aluminate (C3A) formed in the
ordinary Portland cement concrete material provides enough alumina required for Ettringite formation

46
(Rollings et al., 1999). Sulfate-resistant cements inhibit formation of Ettringite by limiting the availability of
reactive alumina. The tricalcium aluminate (C3A) concentrations in sulfate resistant cements are low;
hence, they reduce the amount of alumina available in concrete material to react with soil sulfates to form
Ettringite.
Sulfate-resistant cements fail in cases where alumina is introduced ito the soil matrix by
contamination. It was observed in the Holloman Air force Base, NM case study that although sulfate
resistant cements are used in recycled concrete, they become ineffective through soils contamination
during mixing and stock piling, resulting Ettringite formation and subsequent heaving.
Studies on sulfate-resistant cements in stabilization of sulfate soils have been conducted by
various researchers (Griffin, 2001; Puppala et al., 2004). In an experimental study conducted by Puppala
et al. (2004), Type I/II and Type V stabilizers were used to treat soils with sulfate levels varying from
1000- 5000 ppm and above. The stabilizer dosage levels were established as 5 and 10% by dry weight of
the soil, as well as two moisture content levels, wet of optimum and optimum moisture content. Strength,
stiffness, swell and shrinkage strain tests were carried out on the treated soils. In both treatments,
plasticity indices reduced to an insignificant value. Treated soil samples compacted at wet of optimum
yielded higher strength and lesser swell properties. Higher moisture contents at wet of optimum facilitated
stronger hydration reactions between cement and soil particles. The strength enhancements due to
cement treatment are attributed to the formation of pozzolonic compounds (Tobermorite, Jusite and
Prehnite) and flocculation. XRD tests results confirmed that both treatments are effective in sulfate
induced heave mitigation. Overall, both treatments yielded similar results since the soils involved in the
study were low-to-medium sulfate.
A similar study was conducted by Deepti et al. (2007) at The University of Texas, Arlington. In
this study, stabilization potentials of class F fly ash + Type V cement, GGBFS, Type V sulfate resistant
cement, lime + fibers and GGBFS were studied on soils with medium sulfate levels. It was found that all
the stabilizers improved the soil properties by reducing liquid limits, plasticity indices, swell and shrinkage
strains, and increased UCS and MR values. Based on the ranking analysis, it was concluded that Type V
cement showed the best performance among the other stabilizers.

47
Sarkar and Little (1998) successfully stabilized a crushed concrete base parking lot that was
contaminated with sulfates, using a Type V cement and Class C fly ash. However, a 19% stabilizer was
required to stabilize the base due to very high moisture content in the degraded base.
2.6.8 Use of Geosynthetics
A combination of geotextiles and geogrid can be used as an alternative for high plasticity soils
with soluble sulfates. Geotextile acts as a separator between pavement and natural subgrade. The
purpose of geotextile is to separate layers of pavement from the natural subgrade and to prevent
migration of clay into the upper layers due to traffic loads. Geogrids were successfully used on
stabilization of high sulfate soils. Mechanical stabilization by geogrid instead of chemical stabilization can
be an alternative for high sulfate soils (Zhiming, 2008).
2.6.9 Pre-treatment with Barium compounds
Using barium compounds to pretreat the sulfate bearing soils was suggested by Ferris et al.
(1991). Laboratory testing, using the California Bearing Ratio (CBR) test, indicated increased bearing
strength values and decreased swell values when barium hydroxide or barium chloride are added to
sulfate bearing soil before lime application. Tests were carried out on soil samples from California, Texas
and Colorado. Two types of barium compounds; namely, barium hydroxide and barium chloride were
used in this study. The soils were treated with the above mentioned chemicals before the application of
lime treatment. The treatment of sulfate-bearing soils with barium compounds resulted in the formation of
barium sulfates, removing all the sulfate ions available. With no sulfate ions available to form the water
sensitive Ettringite mineral, no heaving was observed in the soil samples. A comparison study indicated
the use of barium hydroxide over barium chloride to arrest Ettringite formation effectively. Since the cost
of barium treatment is higher than lime treatment, this method did not enjoy much of popularity.
Walker Jr. (1992) used a barium-containing compound to treat soils with high sulfate contents.
The dosage of the barium compound was chosen so that it effectively reacted with sulfates to form less
soluble products to participate in the Ettringite reactions. Barium hydroxide, barium chloride and barium
carbonate were used in his study to pre-treat the soils. Following the barium treatment, test soils were

48
stabilized using lime to give maximum stabilization effects. Soils with sulfate contents up to 10,000 ppm
were stabilized successfully using this method.
2.6.10 Use of Polymeric Fibers
The use of polymeric fibers in treating sulfate-bearing soils has been successfully implemented
(Punthutaecha et al., 2006). Fibers are not affected by salts in soils, biological degradation, or ultraviolet
degradation. They provide additional tensile strength to the soil by reinforcing it. In a study conducted by
Punthutaecha et al. (2006), polypropylene (PP) and hydrophilic nylon fibers (N) were used with various
forms of fly ash to stabilize sulfate bearing soils. The effect of the combined stabilizer treatment (fibers
and ashes) is studied in the present research. The polymeric fiber dosages used in the present study are
0, 0.2, 0.4, and 0.6 % by dry weight of soils. Three-dimensional free-swell, shrinkage strain, pressure
swell tests were conducted on all the treated soil samples. At dosage levels higher than 0.2 %, increase
in swell behavior was observed in poly propylene treated soils; whereas, nylon fibers decreased the swell
behavior of soils with an increase of dosage. Volumetric shrinkage strains decreased with an increase in
stabilizer dosage. Inclusion of fibers was slightly effective in reducing swell pressures. It was observed
that soils stabilized with combined stabilizers experienced lower heave movements compared to soils
stabilized with either fibers or ashes. This is due to flocculation, chemical strengthening reactions
between soils and ash stabilizers. Inclusion of fibers enhanced tensile and shear strengths of soils. It was
concluded that Class F fly ash combined with nylon fibers provided maximum improvement to soil
properties.
2.6.11 Amorphous Silica and Alumina
Researchers in Louisiana used amorphous silica (AS) and silica fume (SF) to stabilize soils
containing sulfates (Wang et. al., 2003). Local roads in Louisiana experienced severe heaving and
pavement failures when Winn Rock gravel containing gypsum was used as a surface course and
stabilized using Portland cement. A laboratory stabilization program was designed to find a suitable
stabilizer. A silty clay soil from Louisiana was mixed with Winn Rock containing soil (WRS) and was used
for the laboratory evaluations. The soils were mixed with cement and blast furnace slag (BFS), class C fly

49
ash, amorphous silica and silica fume at different proportions. The stabilizer dosage varied from 5-20%.
Treated specimens were tested for strength and expansion characteristics. It was observed that soils
treated with cement alone produced a material with no compressive strength, indicating the dominance of
Ettringite reactions. The observed expansion in this case was high and directly proportional to the cement
content. Cement and blast furnace slag-treated soils showed significant strength enhancements and low
swell magnitudes. A mixture of cement, class C fly ash and amorphous silica performed best among the
stabilizer combinations used with respect to strength enhancements and swell reductions. The authors
also recommend the use of silica fume (SF) in place of amorphous silica (AS) due to its easy availability
in the market.
The use of amorphous silica in reducing sulfate expansions was demonstrated by McKinnon et
al., 1993. They used silicon dioxide at dosages of 0.2-6% by dry weight of the soils before treating with
lime. The purpose of adding amorphous silica or silica compound is that silica becomes soluble due to the
high pH generated by lime treatment and readily reacts with free calcium and alumina to form pozzolanic
compounds. Early formation of pozzolanic compounds robs the constituents required for Ettringite
reactions (free calcium and alumina) thereby causing stabilization of the soil. The authors also
recommended the use of potassium hydroxide to maintain the high pH conditions to ensure release of
free alumina to react with calcium from stabilizer and silica compounds. The authors successfully
stabilized soils from Denver, Colorado containing sulfate levels of 6,000 ppm.
2.6.12 Several Other Techniques
The other methods include stabilizing the top portion of select fill, compacting to lower densities
and use of polymeric fibers with soil. Soils with no soluble sulfates can be brought from different locations
to use as select fill material over the subgrade. Stabilizing the selected fill material is equivalent to
stabilizing the natural subgrade. Proper care should be taken to avoid migration of sulfates in to the select
fill material, failure of which again leads to sulfate-induced heave. Compaction of the stabilizing layer to
lower densities is another option available. Compacting at lower densities allows more void spaces in the
soil matrix. This allows more room for the growth of Ettringite and its overall expansion.

50
2.7 Summary
Based on the literature, we can understand that sulfate-induced heave is inevitable when soils
containing considerable amounts of sulfates are treated with calcium-based stabilizers. Cement and lime
treatments proved to be effective in treating soils with low sulfate levels; whereas, both the treatments
failed in treating high sulfate soils. It was also understood that the exact measurement of soil sulfates in
in-situ conditions is not possible, given there is a chance of sulfate migration from external sources.
Establishment of a generalized threshold sulfate level at which heaving occurs is difficult due to the
limitations on available soil mineralogical data and non-homogeneity in the available data. Alternative
stabilization techniques such as double application of lime, pre-compaction mellowing, non-calcium based
additives, and low calcium based additives, blast furnace slag, amorphous silica and alumina, and
addition of barium compounds have been tried with some degree of success. All the above mentioned
methods have their own limitations with respect to sulfate content, cost, applicability in real field
conditions and environmental concerns. Applicability of any of these methods is project and site specific
since the site conditions and project specifications vary. Another important observation is that in most of
the cases treated soils have sulfate concentrations well below 10,000ppm.
Current research focuses on the roles of clay mineralogy, reactive alumina and silica, compaction
void ratio and moisture content availability on Ettringite formation. Also, the effect and role of pre-
compaction mellowing period on Ettringite formation in soils with sulfate contents above 8,000 ppm will be
studied. Finally, the impacts of lime and lime-fly ash treatments on swell, shrinkage behaviors of high
sulfate soils will be addressed.

51
CHAPTER 3
EXPERIMENTAL PROGRAM
3.1 Introduction
An experimental program was designed to study the heaving mechanisms in chemically
stabilized high sulfate soils. Lime is the main stabilizer for the current research due to its adaptability by
several transportation agencies. Lime+ fly ash studies were also conducted on two soils to see the effect
of lime + fly ash treatment on high sulfate soils. The current testing program has been subdivided into two
phases. Phase I: lime treatment studies and Phase II: lime + fly ash treatment studies. The testing
programs with both lime and lime + fly ash was designed to understand the reactions between calcium-
based stabilizers, sulfate, and alumina contents at different sulfate levels, compaction densities and
moisture contents. For the testing program in Phase I, six soils with varying sulfate concentrations from
the state of Texas were chosen. Due to limited availability of high sulfate soils, one of the two soils used
in Phase II testing was chosen from the Phase I soils
The following sections describe criteria for soil selection, physical and chemical properties of the
control soils, testing materials, types of laboratory tests performed, test equipment used, and test
procedures.
3.2 Soil Selection Criteria
Two criteria’s were used in selection of tests soils. First criterion for selection of soils is the
sulfate content. Tests were conducted to determine the soluble sulfates in the soils. Soluble sulfates were
determined using the Modified UTA method. The results were consistent, with minimum differences. The
sulfate test results are presented in Table 3.1. Based on the sulfate contents, the soils were categorized
into three groups: soils with sulfate contents greater than 8000 ppm, soils with sulfate contents less than
8000 ppm and soils with negligible sulfate contents. Among the six soils, three soils showed sulfate
contents above 8000 ppm (Austin, Childress and FM-1417). Two of the six soils have sulfate levels
ranging from 5,200 ppm to 7000 ppm (Dallas and US82). One of the six soils is a control soil with

52
negligible sulfate contents (Riverside). Additional sulfates in the form of gypsum will be added to these
soils to make them high sulfate (> 8000 ppm).
The second criterion in the selection of test soils was based on the PI values. The determination
of Liquid limit, Plastic limit and Plasticity index of the soils was carried out as per ASTM D-4318. The
Atterberg limits of all six soils are shown in Table 3.2. The soils are grouped into four categories based on
the PI values: Soils with PI values < 30, 30 < PI < 40, 40 < PI < 50 and PI > 50. Figure 3.1 depicts the test
soils location on the Texas map. The following section describes the methodology adapted in the current
study to treat high sulfate soils.
Table 3.1 Test Soil Locations and Soluble Sulfate Contents of the Selected Soils
Soil Location Soluble Sulfates, ppm
Sulfate soils
US-82 (Sherman) 5,200*
Dallas 7,000*
FM-1417 (Sherman) 24,000
Austin 36,000
Childress 44,000
Control soil Riverside (College Station) 200* * Sulfates < 8,000 ppm, additional sulfates were added in the form of Gypsum
Table 3.2 Atterberg Limits and Soil Classification
Soil Atterberg Limits USCS
Classification LL PL PI
Austin 76 25 51 CH
Childress 71 35 36 MH
Dallas 80 35 45 CH
FM-1417 72 30 42 CH
Riverside 35 11 24 CL
US-82 75 25 50 CH

53
Figure 3.1 Map showing the location of test soils (Courtesy: Ahmed Gaily, 2012)
3.3 Methodology
The main intent of the current research is to study heave mechanisms in soils with sulfate contents above
8,000ppm. For this reason, soils with sulfate levels below 8,000ppm were spiked with gypsum to raise the
sulfate content above 8,000ppm. The testing Program has been divided into basic tests, engineering tests
and chemical and mineralogical tests. Basic tests include Atterberg limits, hydrometer, specific gravity
and Proctor compaction tests. Engineering tests include 3-D volumetric swell strain (3-D swell), 3-D
volumetric shrinkage strain (3-D shrinkage), 1-D pressure swell and UCS tests. Chemical and
mineralogical tests include sulfate content and lime dosage and reactive alumina and silica, cation
exchange capacity (CEC), specific surface area (SSA) and total potassium (TP). Cation exchange
capacity, specific surface area and total potassium tests were conducted to determine the basic clay
mineralogy as in the procedures outlined by Chittoori et al., (2011). The purpose of determining the clay
mineralogy is that certain clay minerals release more alumina at elevated pH conditions compared to

54
others, which is the critical component of both pozzolanic and Ettrngite formation reactions (Dermatas,
1995 and Puppala et al., 2005).
Followed the basic soil classification tests, all the soils were subjected to clay mineralogy tests to
determine clay mineral distribution. Test soils were also subjected to reactive alumina and silica tests,
using ICP_MS (inductively coupled plasma _ mass spectroscopy) to determine the amount of alumina
and silica in the natural formation which upon chemical stabilization using lime leads to formation of both
pozzolanic and deleterious compounds. Engineering tests were performed to determine the swell,
shrinkage and strength characteristics which will be used as a datum for comparing with the treated soil
properties.
As mentioned before, lime is used as the main stabilizer in the current research. In this study the
“Pre-compaction mellowing” technique was used in stabilizing the high sulfate soils. Two mellowing
periods were considered in the current study. They are 0 days and 3 days. Test soils were treated with
lime and allowed to mellow in a moisture-controlled environment. Following the mellowing, the samples
were mixed thoroughly and compacted. Engineering tests were conducted on the compacted soil
samples. To study the effect of higher mellowing periods, an additional set of 3-D swell tests were
conducted using a 7 day mellowing period. After the samples were subjected to swell tests, reactive
alumina and silica measurements were conducted to determine the loss of alumina and silica during
stabilizing and sulfate reactions.
3.4 Testing Variables
Testing variables include soils, sulfate contents, compaction moisture contents, mellowing
periods and stabilizers. Six different soils from the state of Texas were chosen to include high plasticity
clay (CH), low plasticity clay (CL) and high plasticity silt (MH), with different geological origins. Elevated
sulfate contents in these soils varied from 12,000ppm to 44,000ppm. Two compaction moisture contents;
namely, optimum moisture content (corresponding to maximum dry density, MDD) and wet of optimum
moisture content (corresponding to 95% maximum dry density), were chosen. Also two mellowing
periods, 0 and 3 days, were selected for stabilization of soils. The following section describes the test

55
procedures in brief. Two stabilizers lime and lime + fly ash were used in the current study. Table 3.3
shows the testing variables.
Table 3.3 Testing Variables
Description Variable
Soils Six (Austin, Childress, Dallas,
FM-1417, Riverside, and US-82)
Sulfate Contents Five (12,000 ppm; 20,000
ppm; 24,000 ppm; 36,000 ppm; and
44,000 ppm)
Stabilizer One (Lime)
Dosage One (6%L)
Compaction Moisture Contents Two (Optimum, OMC and Wet
of optimum, WOMC moisture content)
Mellowing Periods Three (0, 3 and 7 days)
3.5 Basic Tests
Basic tests include Atterberg limits, sieve analysis, hydrometer, specific gravity and Proctor compaction
tests. Testing procedures are given below.
3.5.1 Atterberg Limits
Liquid limit (LL), Plastic limit (PL) and Plasticity index (PI) of the soils was determined per ASTM
procedure D4318-10. These tests were conducted in order to determine the plasticity properties of the
soils. Upon addition of water, the state of soil proceeds from dry, semisolid, plastic and finally to liquid
states. The water contents at the boundaries of these states are known as shrinkage SL, plastic PL and
liquid LL limits, respectively (Lambe and Whitman, 2000). Therefore, LL is calculated as the water content
at which the soil flows, and PL is determined as the water content at which the soil starts crumbling when
rolled into a 1/8-inch diameter thread. Figure 3.2 shows the apparatus used for Atterberg limits.

56
Figure 3.2 Atterberg Limits Apparatus
These Atterberg limits are very important to show a relationship between the shrink-swell potential of the
soils and their relevant plasticity indices. The numerical difference between LL and PL values is known as
plasticity index (PI), and this property is generally used to characterize the plasticity nature of the soil and
its expansive potential. The water content of the samples during tests is measured using the microwave
drying method based on the repeatable data as reported by Hagerty et al. (1990).
3.5.2 Specific Gravity
Soil consists of an accumulation of particles, which may be of a single mineral type or, more
often, a mixture of a number of mineral types. This means that different soil types have different specific
gravity values. In this research, the standard test as per ASTM D 854 was conducted to determine the
specific gravity of the selected soils.
3.5.3 Hydrometer analysis
Hydrometer Analysis was carried out as per ASTM D422. The procedure involved taking 50
grams of the oven dried portion that passed through a No. 200 sieve and mixing with a solution containing
a 4% deflocculating agent (Sodium Hexametaphosphate) and soaking it for about 8 to 12 hours. The
prepared soil was thoroughly mixed in a mixer cup, and all the soil solids inside the mixing cup were
transferred to a 1000 cc graduated cylinder and filled to the mark using distilled water.
The hydrometer readings were recorded at cumulative times of 0.25 min., 0.5 min., 2 min. 4 min.,
8 min., 15 min., 20 min., 2 hr., 4 hr., 8 hr., 12 hr., 24 hr., 48 hr., and 72 hr. After taking the readings
initially for the first 2 minutes, the hydrometer was taken out and kept in another cylinder filled with

57
distilled water. Necessary temperature corrections, zero corrections and meniscus corrections were made
to the hydrometer readings as per procedure. Table 3.4 summarizes the basic soil classification and
particle size distribution.
Table 3.4 Summary of Basic Tests
Soil Gradation, %
Gs Elevated Sulfate
Content (after adding Gypsum)
USCS Classification
Gravel Sand Silt Clay Austin 0 21 39 40 2.61 36,000 CH
Childress 0 23 69 8 2.51 44,000 MH
Dallas 0 4 32 64 2.71 12,000 CH
FM-1417 0 9 20 71 2.66 24,000 CH
Riverside 0 32 30 38 2.56 20,000 CL
US-82 0 5 35 60 2.65 12,000 CH
3.5.4 Standard Proctor Compaction Tests
In order to determine the compaction moisture content and dry unit weight relationships of the
soils in the present research program, it was necessary to conduct standard Proctor compaction tests.
The optimum moisture content (OMC) of the soil is the water content at which the soils are compacted to
a maximum dry unit weight condition. Specimens exhibiting a high compaction unit weight are best at
supporting civil infrastructure since the void spaces are minimal and settlement will be less. Compaction
tests were conducted on all types of soil to determine moisture content and dry unit weight relationships.
ASTM D698 procedure was followed to determine the maximum dry density (MDD) and corresponding
optimum moisture content. This test requires use of a hand held rammer, which has a 50 mm diameter
face with a weight of 2.5 kg, and a cylindrical mold, which has internal dimensions of 105 mm in diameter
and 115.5 mm in height. This gives a volume of 1000 cm3 (or 1/30 ft3). Figure 3.3 shows the proctor
compaction apparatus.

58
Figure 3.3 Standard proctor compaction test apparatus
Soil mix was compacted in three layers by applying 25 blows per layer of rammer dropping from
the controlled height of 300 mm. After compacting, the compacted soil was weighed, and the moisture
content was measured. The procedure was repeated after each increment of water was added to the soil
mix. Test results were commonly presented in the form of a compaction curve, which depicts a
relationship between dry unit weight and water content. Water contents at 95% of the maximum dry
density conditions representing wet of OMC were selected for testing. Figure 3.4 depicts the typical
Proctor curve for FM-1417 soil. Proctor test results on natural, lime treated and lime +fly ash-treated soils
are presented in Table 3.5, Table 3.6 and Table 3.7 respectively. All the natural and treated Proctor
curves are presented in Appendix.

59
Figure 3.4 Standard proctor Compaction Curve for FM-1417 Soil
Table 3.5 Summary of Proctor Tests on Natural Soils
Soil Type
Natural (Untreated) Soil
Moisture Content (%) Dry Density (lb/ft³)
OMC WOMC OMC WOMC Austin 18 23 106 100
Childress 21 25 103 98 Dallas 28 33 92 87
FM-1417 27 34 89 84 Riverside 20 25 99 94
US-82 24 32 91 86

60
Table 3.6 Summary of Proctor Tests on Lime Treated Soils
Soil Type
6% Lime Treated Soils
Moisture Content (%) Dry Density (lb/ft³)
OMC WOMC OMC WOMC
Austin 21 29 95 90
Childress 22 28 96 91
Dallas 29 39 87 83
FM-1417 28 34 87 83
Riverside 21 25 98 93
US-82 26 32 89 85
Table 3.7 Summary of Proctor Tests on Lime + Flyash Treated Soils
Soil Type Natural Lime (4%) + Flyash (8%)
Moisture Content (%)
Dry Density (lb/ft³)
Moisture Content (%)
Dry Density (lb/ft³)
FM-1417 27 89 21 90
Bells 23 96 20 91
3.6 Engineering Tests
Engineering tests include 3-D swell, 3-D shrinkage, 1-D swell pressure and UCS tests. Following section
describes the procedures followed.
3.6.1 Three Dimensional Swell Test (3-D swell)
Free swell test commonly refers to the conventional one-dimensional free swell test, which was
conducted on soil specimens that were 2.5 in. diameter with 1 in. thickness. This test is only used to
measure the maximum amount of heave in the vertical direction of a confined soil specimen. To examine
the maximum vertical, radial, and volumetric swell potential, three-dimensional free swell test was
conducted in this research. Three dimensional volumetric swell tests were conducted using the double
inundation technique to determine the maximum possible radial and vertical swell. Double inundation
represents the worst possible scenario in a field where 100% saturation of the soil is achieved after a
continuous rainfall event. Maximum expansive heave is observed in this case. The double inundation

61
technique for measuring the volumetric swell was used successfully in the past by various researchers
across the United States and the UK. It was observed in the current study that 3-D swell tests, using the
capillary rise method, yielded lower values of swell, indicating the underestimation of swell; whereas, the
swell determined using “double inundation” technique was on the higher side, representing the actual field
swell.
The following paragraphs describe the soil sample preparation method and testing procedures
used. Oven-dried soils were pulverized and mixed at targeted moisture content levels. Both control and
treated soil specimens were mixed and then compacted by using Gyratory Compactor Machine at two
moisture content levels. Figure 3.5 illustrates the Gyratory Compacting Machine and sample after
extraction.
Figure 3.5 Gyratory Compacter Machine, (b) Soil sample after extraction

62
Samples which were 4 in. (101.6 mm) in diameter and 4.6 in (116.8 mm) in height were covered
by a rubber membrane. Porous stones were placed at the top and bottom of the specimens, which
facilitated the movement of water to the soil specimen. The specimen was fully soaked under water in a
large container. It is common practice to perform swell tests on chemically-treated sulfate soils under
moisture inundation from both ends of the soil specimen. Sulfate soils need the presence of moisture
content that will facilitate reactions for Ettringite crystal formation and its hydration. Hence, swell tests
here were performed under full soaking conditions. The amount of soil heave in both vertical and
diametrical directions was monitored until there was no significant swell for 24 hours. Radial
measurements were then taken at the top, middle, and bottom circumferences of the soil samples and
averaged at a frequency similar to the Consolidation Test. Figure 3.6 shows the 3-D swell test setup. The
percent values were calculated based on the original dimensions of the soil specimen. Table 3.8 gives the
vertical, radial and volumetric swell strains of natural soils. Figures 3.7 thru 3.12 show the vertical swell
strain vs. elapsed time for untreated soils considered in the current study.
Figure 3.6 Three Dimensional Swell Test Setup

63
Figure 3.7 Vertical Swell Strain vs. Elapsed Time (Austin Soil)
Figure 3.8 Vertical Swell Strain vs. Elapsed Time (Childress Soil)

64
Figure 3.9 Vertical Swell Strain vs. Elapsed Time (Dallas Soil)
Figure 3.10 Vertical Swell Strain vs. Elapsed Time (FM-1417 Soil)

65
Figure 3.11 Vertical Swell Strain vs. Elapsed Time (Riverside Soil)
Figure 3.12 Vertical Swell Strain vs. Elapsed Time (US-82 Soil)

66
Table 3.8 Summary of 3-D Swell Tests on Natural Soils
Soil Type Vertical Strain (%) Radial Strain (%) Volumetric Swell
Strain (%)
OMC WOMC OMC WOMC OMC WOMC
Austin 7.6 3.6 4.5 2.5 16.6 8.7
Childress 3.9 0.9 1.8 1.4 7.5 3.7
Dallas 3.8 2.6 3.7 2.6 11.0 7.8
FM-1417 6.0 6.1 5.1 1.3 16.2 8.9
Riverside 4.2 4 2.9 3.1 10.0 10.2
US-82 7.2 4.9 5.5 1.5 18.1 7.9
3.6.2 Three Dimensional Shrinkage Test (3-D shrinkage)
Due to limitations in the linear shrinkage bar test, researchers at University of Texas at Arlington
(UTA) proposed a new test method using cylindrical compacted soil specimens and subjecting them to a
drying process and then measuring the volumetric, axial and radial shrinkage strains. This test offers
several advantages over the conventional linear shrinkage bar test such as reduced interference of
boundary conditions on shrinkage, larger amount of soil being tested, and simulation of compaction states
of moisture content - dry density conditions. The 3-D shrinkage test was conducted to measure the
shrinkage characteristics of the expansive natural soils followed by a long dry spell. This method was
published in the ASTM Geotechnical Testing Journal (Puppala et al., 2004), which signifies the
importance of this method being accepted by the researchers and practitioners.
Volumetric shrinkage tests were conducted to measure the decrease in the total volume of soil
specimens due to loss of moisture content from predetermined initial moisture content to a completely dry
state. Another reason for conducting these tests was to study shrinkage strain potentials of treated soils
with Ettringite formed. Two different initial moisture contents (optimum, wet of optimum) were used as
initial compaction conditions, and tests were conducted as per the procedure outline in Puppala et al.
(2004). Specimen preparations were performed by mixing the dry clay with the appropriate amount of
water to achieve the designed water contents, then compacting the soil specimens in 2.26 in. (57 mm)

67
diameter and 5 in. (127 mm) height mold, and measuring the initial height and diameter of the specimen.
The specimens were then extracted and left at room temperature for 12 hours before being transferred to
an oven set at a temperature of 220º F for 24 hours. Upon removal from the oven, the average height and
radial dimensions of the dried soil specimens were manually measured. The volumetric shrinkage strain
was calculated from these measurements. A summary of 3-D shrinkage tests on natural soils is presented
in Table 3.9. The 3-D shrinkage setup is shown in Figure 3.13. 3-D shrinkage results of natural soils are
compared with treated soils.
Table 3.9 Summary of 3-D Shrinkage Tests on Natural Soils
Soil Average Volumetric Shrinkage Strain (%)
OMC WOMC
Austin -8.8 -11.3
Childress -14.1 -15.7
Dallas -19.7 -26.2
FM-1417 -15.6 -20.6
Riverside -12.5 -14.0
US-82 -13.7 -20.2
Figure 3.13 3-D Shrinkage Test

68
3.6.3 One Dimensional Swell Pressure Test (1-D swell pressure)
The pressure swell test was conducted as per ASTM D-4546 specification (Standard Test
Methods for One-Dimensional Swell or Collapse of Cohesive Soils). The swell pressure test measures the
amount of overburden pressure necessary for preventing expansion behavior of soils. The objective of
this test was to determine the maximum swelling pressure of the soil samples at which no volume change
of samples was allowed to anticipate. The preparation procedure and test set up are the same as
mentioned before in the one dimensional swell test section. Same steps were followed to initiate soil
heaving process. However, vertical loads were added to a hanger at regular hourly intervals in order to
reduce the elapsed vertical swell strains to zero magnitudes. Test was continued until the sample did not
exhibit any heaving movements for at least 24 hours. The final load at the end of the test was determined
and used in the calculation of swell pressures. 1-D swell pressure test set up is shown in Figure 3.14. A
summary of swell pressure test results is presented in Table 3.10.
Figure 3.14 1-D Swell Pressure Test Setup

69
Table 3.10 Summary of 1-D Swell Pressure Tests on Natural Soils
Soil Average Swell Pressure
(psi)
OMC WOMC
Austin 46.2 22.4
Childress 6.7 2.2
Dallas 40.7 15.1
FM-1417 37.1 16.2
Riverside 8.3 1.8
US-82 48.9 40.1
3.6.4 Unconfined Compressive Strength Tests (UCS Test)
The Unconfined Compressive Strength (UCS) tests were conducted as per ASTM D 2166
method. This test was conducted on the soil samples under unconfined conditions. The test was
conducted on compacted soil specimens of 2.8 inches in diameter and 5.6 inches in height. The soil
specimen was first placed on a platform and then raised at a constant strain rate, using the controls of the
UCS set up until it came in contact with top plate. Figure 3.5 shows the unconfined compressive strength
test set up and the computer system used for data acquisition. Once the specimen was intact, it was
loaded at a constant strain rate and, as the load approached the ultimate load, failure cracks began to
appear on the surface of the specimen. Both deformation and corresponding axial loads on the specimen
were recorded using a Data Acquisition System (DAS). The data retrieved contained load (Q) and
deformation (δ) data, and the same were analyzed to determine the maximum unconfined compressive
strength (q ) in psi or kPa. The following expressions show the computation of stress (σ) and strain (ε) corresponding to the load-deformation data.
ε = δL; σ = QA ; A = A1 − ε andq = σ
Where, δ = change in length, L = total length of specimen, A = corrected area of cross section of
the specimen and A = initial area of cross section. A typical Stress-Strain curve obtained from UCS test is

presented
is present
d in Figure 3.1
ted in Table 3
15. Figure 3.1
3.11.
Figure 3.15
00
10
20
30
40
50
Stre
ss(lb
/in2 )
16 shows the
5 Stress vs. A
Figure 3.1
2
70
UCS test se
Axial Strain, U
16 UCS Test S
2Axial Strain (%
US-8Na
etup. Summa
S-82, OMC, N
Setup
4%)
82 OMCatural
ary of UCS tes
Natural
6
sts on natura
al soils

71
Table 3.11 Summary of UCS Test Results
Soil Average UCS (psi)
OMC WOMC
Austin 28 21
Childress 22.8 15.9
Dallas 16 9.9
FM-1417 32.3 18.5
Riverside 29.5 17.2
US-82 30 18.2
3.7 Chemical and Mineralogical Tests
Chemical and mineralogical tests include soluble sulfate determination, lime dosage, reactive alumina
and silica, cation exchange capacity, specific surface area and total potassium tests. Following section
describes the procedures followed.
3.7.1 Soluble Sulfate Determination (Modified UTA Method)
The basis of the current method is the standard Gravimetric Method outlined in the seventeenth
edition of Standard Methods for the Examination of Water and Wastewater by Clesceri, Greenberg and
Trussell (1989). Puppala et al. (2002) modified the existing UTA method proposed by Petry (1994). A soil
water dilution ratio of 1:10 is used in this method. Theoretically, 1:10 dilution ratio can extract sulfate
concentrations up to 26000 ppm. In this method, 10 grams of soil is mixed with 100 mL of distilled water
and left overnight. This allows the dissolution of water soluble sulfates into the solution. The sample is
then shaken for 30 minutes on an Eberbach shaker to disintegrate the sulfate salts. Soluble sulfates are
extracted from the solution by centrifuging the sample at 14000 rpm using the IEC-HT centrifuge
machine. A higher rate of centrifuging allows the efficient extraction of soluble sulfates. The supernatant
is then filtered through 0.1μm filter paper, and the filtrate is diluted to 200mL. Use of the 0.1μm filter paper
stops the migration of suspended particles in the soil and de-ionized water solution. This is an
improvement over the previous UTA method. The pH of the dilutant is adjusted between 5 and 7 by

72
adding diluted hydrochloric acid (1:9) HCl to facilitate the further dissolution of sulfates. The solution is
then boiled until the bubbles appear. Warm BaCl (10%) solution is added slowly until the precipitation
process is completed.
The precipitate is then digested in an oven at 80-900C for 12 hours. The precipitate is filtered
through a 0.1μm membrane filter. While filtering, the precipitate is washed with distilled water to make it
free from chlorides. Chlorides can be checked by a silver nitrate-nitric acid reagent. The difference
between the weights of dry filter paper and filter paper with barium sulfate precipitate gives the sulfate
content in the soil. Weight of the barium sulfate is multiplied with a factor 41,156, representing the portion
of sulfate in barium sulfate to obtain the concentration in ppm. It is also suggested to use a finer filter
paper and longer centrifuging time in the case of high montmorillonite soils since most of the soil particles
sizes are smaller than 0.1 μm. In a recent study conducted at The University of Texas at Arlington, two
soils with different classifications and origins were spiked with different sulfate concentrations and tested
using the Modified UTA method, AASHTO method and TxDOT method. Results indicated that the
Modified UTA method gave repeatable and accurate values compared to the other methods (Talluri et.
al., 2012). A pictorial representation of the filtration setup used and final barium sulfate precipitate on filter
paper is given in Figure 3.17. Figure 3.18 shows the step-by-step procedure followed in soluble sulfate
determination by the Modified UTA method.
(a) Filtration Setup (b) Barium Sulfate Precipitate
Figure 3.17 Modified UTA Method for Determination of Soluble Sulfate Content
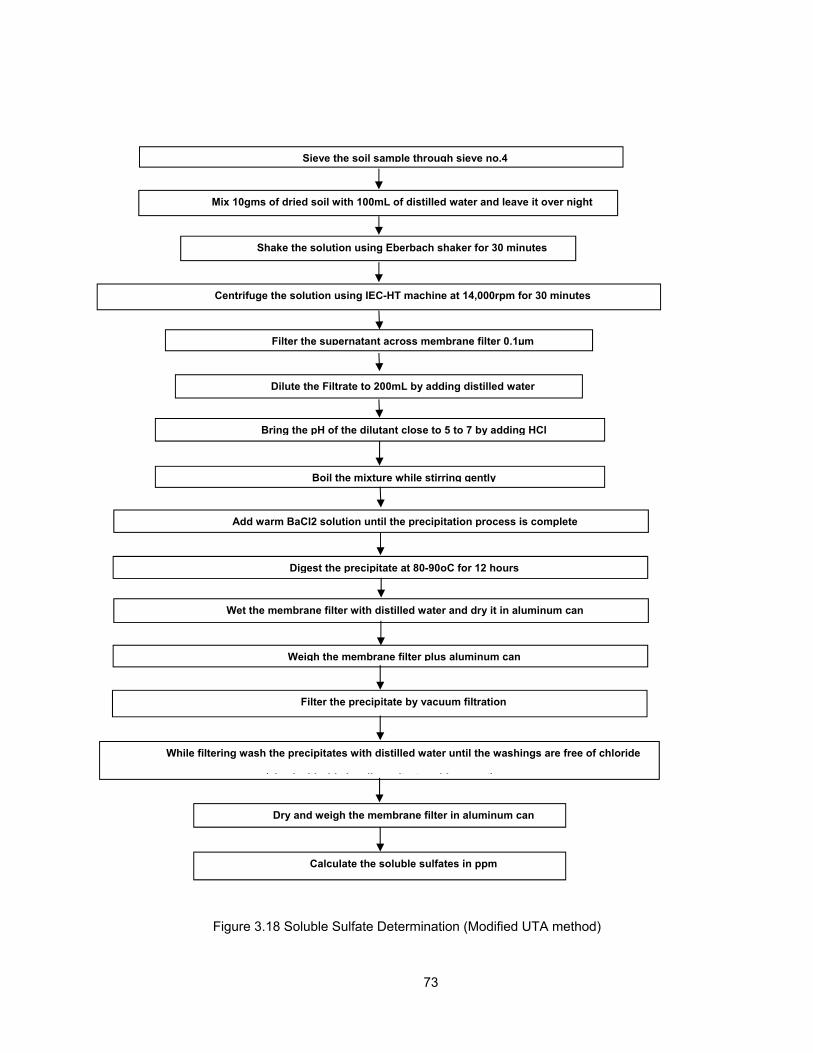
73
Figure 3.18 Soluble Sulfate Determination (Modified UTA method)
Mix 10gms of dried soil with 100mL of distilled water and leave it over night
Sieve the soil sample through sieve no.4
Shake the solution using Eberbach shaker for 30 minutes
Centrifuge the solution using IEC-HT machine at 14,000rpm for 30 minutes
Filter the supernatant across membrane filter 0.1µm
Dilute the Filtrate to 200mL by adding distilled water
Bring the pH of the dilutant close to 5 to 7 by adding HCl
Boil the mixture while stirring gently
Add warm BaCl2 solution until the precipitation process is complete
Digest the precipitate at 80-90oC for 12 hours
Wet the membrane filter with distilled water and dry it in aluminum can
Weigh the membrane filter plus aluminum can
Filter the precipitate by vacuum filtration
While filtering wash the precipitates with distilled water until the washings are free of chloride
( h k hl id b il it t id t)
Dry and weigh the membrane filter in aluminum can
Calculate the soluble sulfates in ppm

74
3.7.2 Lime Dosage Determination
Lime content is determined as per the “Eades-Grim” test (Eades and Grim, 1966), and is fully
described in ASTM D 6276 procedures. The basic objective of this method is to add sufficient lime to the
soil to ensure a pH of 12.4 for sustaining the strength-producing lime-soil pozzolanic reaction. The lowest
percentage of lime in soil that produces a laboratory pH of 12.4 is the minimum percentage for stabilizing
the soil. The procedure is described below.
Weigh to the nearest 0.01gm a series of 30 gm soil samples and place them in separate
containers. Add a series of lime equivalent to 0, 2, 4, 6, 8 and 10% of dry weight of soil. Add one of the
lime percentages to each of the containers, followed by the addition of 150ml of water. Stir the samples
every 15 minutes for about an hour. At the end of hour, record the temperature of the mixture and adjust
the pH meter to that temperature. Standardize the pH meter with distilled water to 7.0. Clean the
electrodes with distilled water. Check the pH of the soil-lime solutions and record. Plot the pH on y-axis
and lime dosage on x-axis. From the curve, read a pH value of 12.4 and record the corresponding lime
dosage. If the pH readings are 12.4 or higher, take the lowest percentage of lime that gives a pH of 12.4.
If the pH readings do not go beyond 12.3 or higher for two different lime dosages, further testing is
required to establish the lime dosage. The minimum strength criterion for lime content is based on an
unconfined compressive strength of 150 psi for bases and 50 psi for soils. As mentioned before, the lime
dosage for all the test soils in the current study is 6% (by dry weight of soil). A graphical representation of
the test is given in Figure 3.19. Table 3.12 shows the results of the pH testing.

3.7.3 Cati
C
soil. For e
amount o
indicates
the capac
Tab
ion Exchange
Cation exchan
example, a so
f expansiven
the presence
city or the abil
Figure 3.1
ble 3.12 Lime
e Capacity (CE
nge capacity o
oil with a hig
ess due to th
e of non-expa
ity of the soil
9 Lime Dosa
e Dosage De
Soil
Austin
Childress
Dallas
FM-1417
Riverside
US-82
EC)
or CEC can b
h CEC value
he presence o
nsive clay mi
to exchange
75
age Determina
termination (E
be used to de
e of 100 meq/
of the clay m
nerals such a
free cations t
ation for Aust
Eades and G
Lime D(% by dry
6
6
6
6
6
6
etermine the
/100gm to 12
mineral Montm
as Kaolinite. C
that are availa
tin Soil
rim Method)
Dosage y weight)
6
6
6
6
6
6
mineral com
20 meq/100g
morillonite’ wh
CEC of a soil
able in the ex
position of a
m indicates a
hereas, a low
can be defin
xchange locat
given
a high
w CEC
ned as
tions.

O
the field
saturating
solution u
specimen
16 hours
ammonium
different 2
that has b
10 mL ad
ammonium
ammonium
different 2
KCl extra
presented
One of the ear
and the met
g solution and
used here is a
(preparation
after shakin
m ion (NH4+)
25 mL additio
been replaced
ditions of 2-p
m is also rem
m ions that re
25 mL additio
act gives the
d in Figure 3.2
Figure 3.20
rliest methods
thod selected
d then remova
ammonium ac
involves trea
g for half ho
). Then the s
ns of NH4OA
d by ammoni
propanol. Now
moved. The C
eplaced all th
ons of 1M po
CEC of the
20.
0 Photograph
s proposed by
d for the cur
al of the adso
cetate (NH4O
ating for organ
our, to ensur
solution was
Ac. This step i
um ions. Exc
w, all the catio
CEC of the so
he exchange
otassium chlo
soil. Photog
s of the vario
76
y Chapman (
rrent researc
orbed cations,
OAc) at pH 7.
nics with 30%
re that all the
filtered thro
s to bring out
cess NH4OAc
on places are
oil sample ca
locations. Th
ride (KCl) so
graphic repre
us steps invo
1965) is the m
ch. The meth
, using an ext
This solution
% hydrogen pe
e exchange
ugh a Buchn
t all the cation
c was remove
e replaced by
an be obtaine
his was done
olution. The c
esentation of
olved in the de
most common
hod involves
tracting solut
n was added
eroxide (H2O2
locations are
ner funnel an
ns from the s
ed by the add
the ammoniu
ed by measur
e by washing
concentration
the different
etermination o
nly used meth
the addition
ion. The satu
to a prepare
2) and set asi
e occupied b
nd washed w
oil sample so
dition of 8 dif
um ion and e
ring the amo
the sample w
of NH4+ ion
t steps involv
of CEC
hod in
n of a
urating
ed soil
de for
by the
with 4
olution
fferent
xcess
unt of
with 8
in the
ved is

77
3.7.4 Specific Surface Area (SSA)
Specific surface area or SSA of a soil sample is the total surface area contained in a unit mass of
soil. This property of the soil is primarily dependent on the particle size of the soil. Soils with smaller
particle sizes have higher specific surface areas. It should be noted here that a soil with a high specific
surface area has a high water holding capacity and greater swell potential.
The most commonly used method in the field of agronomy is adsorption by Ethylene Glycol
Monoethyl Ether (EGME) (Carter et al., 1986) and is implemented in this research. This involves
saturating prepared soil specimens, equilibrating them in vacuum over a calcium chloride – EGME
(CaCl2-EGME) solvate, and weighing them to find the point when equilibrium is reached. Specific surface
is then determined from the mass of retained EGME in comparison to the amount retained by pure
montmorillonite clay, which is assumed to have a surface area of 810 m2/g (Carter et al., 1986). Test
procedures typically take two days to complete. They also indicated that the procedure is repeatable and
gives reliable results. Photographic representation of the different steps involved is presented in Figure
3.21.
Figure 3.21 Photographs of the various steps involved in the determination of SSA

78
3.7.5 Total Potassium (TP)
Potassium is the inter-layer cation in the clay mineral Illite (Mitchell and Soga, 2005). Hence,
measuring the amount of potassium ion in the soil gives a direct indication of the presence of the mineral
Illite. The test procedure, formulated by Knudsen et al. (1982), was followed to obtain the amount of total
potassium present in the soil. The method involves a double acid digestion technique developed by
Jackson (1958), which uses two acids (Hydrofluoric acid and Perchloric acid) to break own the mineral
structure of the soil and extract the potassium ions from the structure. Once the potassium is extracted, its
concentration in the solution can be obtained with the help of a spectrophotometer or any other suitable
device.
The test started by taking 0.1gm of soil in a Teflon digestion vessel. The original method
recommended the use of platinum vessels as the hydrofluoric acid used has the ability to dissolve silica
and glass is 90% silica. However the usage of platinum vessel was not possible due to cost constraints;
hence, other possible alternatives were looked at and a Teflon vessel was found to have resistance to the
acids that are being used in the current test procedure (Hydrofluoric acid, Perchloric acid and
Hydrochloric acid) and high temperature tolerance (200ºC). The Teflon vessel was therefore finally
selected.
An amount of 5 ml of Hydrofluoric acid and 0.5mL of Perchloric acid were added to 0.1gm of the
soil sample. Hydrofluoric acid dissolves the silicate mineral structure and releases the interlayer cations;
Perchloric acid was used as an oxidizing agent to oxidize the organic matter in the soil sample. Then the
vessel was placed on a hot plate and heated to 200ºC and then cooled, and another addition of HF and
HClO4 was made and reheated on the hot plate. The sample was then heated until it was dry. The
process was repeated to make sure all the interlayer cations were released, and then, finally, 6N HCl was
added and the amount of potassium in this solution was obtained by using a spectrophotometer.
Photographic representation of the different steps involved is presented in Figure 3.22.

79
Figure 3.22 Photographs of the various steps involved in the determination of TP
Based on the cation exchange capacity, specific surface area and total potassium measurements
the percent clay mineral distribution of the soils is obtained. Summary of mineralogical tests is given in
Table 3.13. The clay mineral distribution of test soils is presented in Table 3.14.
Table 3.13 Summary of Mineralogical Tests
Soil Cationic Exchange
Capacity (meq/100g)
Specific Surface Area (m2/g)
Total Potassium (%)
Austin 78 242 0.8
Childress 28 140 1.1
Dallas 55 236 0.9
FM-1417 65 280 0.8
Riverside 35 173 1.3
US-82 66 284 0.8

80
Table 3.14 Percent Clay Minerals Observed for Soils under Study
Soil Region % Illite % Kaolinite % Montmorillonite
Austin 14 49 37
Childress 18 66 16
Dallas 15 35 50
FM-1417 13 20 67
Riverside 21 59 20
US-82 14 39 47
3.7.6 Reactive Alumina and Silica
Reactive alumina and silica are the aluminum and silica present in amorphous or poorly
crystalline Al/Si phases, including amorphous alumino silicate, organically complex alumina and hydroxyl-
Al polymers present in montmorillonite interlayers. These measurements were important since alumina
and silica constitute the compositions of Ettringite and Thaumasite respectively. Reactive alumina and
silica measurements were conducted using Inductively Coupled Plasma-Mass Spectroscopy (ICP-MS)
analysis on natural and treated soils at different mellowing periods. These measurements were
conducted by a procedure modified after Foster (1953). To determine the reactive alumina and silica,
15gm of soil was mixed with 150mL of 0.5 N NaOH and boiled. Once boiling was over, the solution was
centrifuged at 8000rpm and filtered using a 0.1µm membrane type filter paper. The extract obtained was
stored in a plastic bottle, and the ICP analysis was performed on the clear extract.
ICP analysis requires a clear solution. If the resultant extract is dark colored, it could be due to
organics or iron oxides in the soils. Organics can be removed by treating the solution with hydrogen
peroxide (H2O2). It was reported that iron oxides (Fe2O3) coat the clay surface, which prevent clay from
releasing alumina to react with lime to form pozzolanic compounds (Joffe, 1949). Iron oxides can be
removed by treating 10 ml of the solution with 1mL of 6N HCl and agitating every hour. The solution is left
overnight and filtered using 0.1µm membrane-type filter paper the next morning. Once a clear extract was
obtained, ICP analysis was performed on the natural and treated soil samples at different dilution ratios.
Table 3.15 gives the reactive alumina and silica of natural soils. Figure 3.23 shows the flow chart for

reactive a
study. Fig
alumina and
gure 16 shows
silica measu
s the colored
Table 3.15
Figure 3.23(*If the extra
A
Ch
D
FM
Ri
U
rements. Fig
extract due to
5 Reactive Alu
3 Reactive Alact is dark col
Soil
Austin
hildress
Dallas
M-1417
verside
US-82
81
gure 14 show
o presence of
umina and Si
umina and Sored further t
Reactive Al (ppm)
58.9
75.8
289.9
279.2
297
323.3
ws the ICP_M
f organics an
lica Measure
ilica Measuretreatment is re
Reactive S(ppm)
15.4
12.6
231.2
137.3
379.8
187.1
MS system u
d iron oxides
ments
ements equired)
Si
sed in the c
.
urrent

82
Figure 3.24 ICP_MS Set up
Figure 3.25 Dark Colored Extract Due to Presence of Organics and Iron Oxides

83
3.8 Summary
This chapter provides a summary of initial properties of natural soils, the experimental program,
test procedures and equipment used in this research study. Testing variables and methodology followed
were explained. Typical particle size distribution, engineering properties and chemical and mineralogical
details of the soils were presented.

84
CHAPTER 4
ANALYSIS OF LABORATORY TEST RESULTS (PHASE I)
4.1 Introduction
In this chapter, physical, engineering and mineralogical test results obtained from the entire
laboratory testing program are provided. The effects of chemical stabilizer, mellowing period, soluble
sulfate content, soil clay mineralogy, reactive alumina and silica content and compaction moisture
contents on the swell and shrinkage characteristics of treated high sulfate soils are explained and
discussed. The discussion findings are based on the majority of the trends noticed in test results of both
untreated (control) soils and treated soils at different mellowing periods. Results of the testing program
are discussed in the subsequent sections.
4.1.1 Volume Change Characteristics
Three-dimensional volumetric swell and shrinkage tests were conducted on untreated soils and were
used as a reference for comparing with volumetric strain changes in treated high sulfate soils at different
periods of mellowing; i.e., the onset of sulfate and stabilization reactions. The following sections describe
the results of the testing program. In the current research study, for each variable condition (moisture
content and mellowing period) two set of tests were conducted. It was observed that the results were
repeatable with minimum standard deviation. An average of the two readings is presented in the
following test results.
4.1.1.1 Three Dimensional Volumetric Swell Test (3-D swell)
The 3-D free swell test measures the potential of the soil to swell in three (3) directions when soaked
under water. The three (3) values measured were vertical, radial, and volumetric strains. Vertical swell
was measured using a dial gauge placed at the top and radial measurements were taken using pi tape at
the end of test. Two identical specimens are used for each variable condition (OMC and WOMC). Table
4.1, 4.2 and 4.3 show the average vertical, radial and volumetric swell strains of the lime treated soils at
0, 3 and 7 day mellowing periods. Volumetric swell strains for lime treated soils at 0, 3 and 7 day
mellowing periods is shown in Table 4.4, 4.5 and 4.6 respectively. Table 4.7 shows the summary of the

85
volumetric swell tests. Vertical swell vs. elapsed for natural and treated soil samples at different mellowing
periods are presented in Figure 4.1 thru 4.6 at OMC condition. Volumetric swell strains of natural and
treated soils at different mellowing periods are shown in Figures 4.7 thru 4.12.
Table 4.1 Vertical, Radial and Volumetric Swell Strains of 6% Lime Treated Soils @ 0 day mellowing
Soil Type Avg. Vertical
Strain (%) Avg. Radial Strain (%)
Avg. Volumetric Swell Strain (%)
OMC WOMC OMC WOMC OMC WOMC
Austin 6.4 5.2 1.2 1.15 8.8 7.5
Childress 5.3 5.0 4.6 4.05 14.6 13.1
Dallas 10.3 8.9 7.1 7.4 24.4 23.7
FM-1417 8.5 5.7 6.8 5.2 22.0 16.1
Riverside 5.6 4.6 5.2 4.0 16.0 12.7
US-82 9.2 8.9 8.5 7.8 26.1 24.4
Table 4.2 Vertical, Radial and Volumetric Swell Strains of 6% Lime Treated Soils @ 3 day mellowing
Soil Type
Avg. Vertical Strain (%)
Avg. Radial Strain (%)
Avg. Volumetric Swell Strain (%)
OMC WOMC OMC WOMC OMC WOMC
Austin 5.3 4.2 3.2 2.8 11.6 9.8
Childress 6.5 5.2 1.8 1.6 10.2 8.5
Dallas 5.0 4.0 2.7 1.2 10.4 6.4
FM-1417 4.7 2.9 2.8 2.0 10.2 7.0
Riverside 3.9 3.7 2.55 2.35 9.0 8.4
US-82 3.6 3.7 3.8 1.5 11.3 6.70
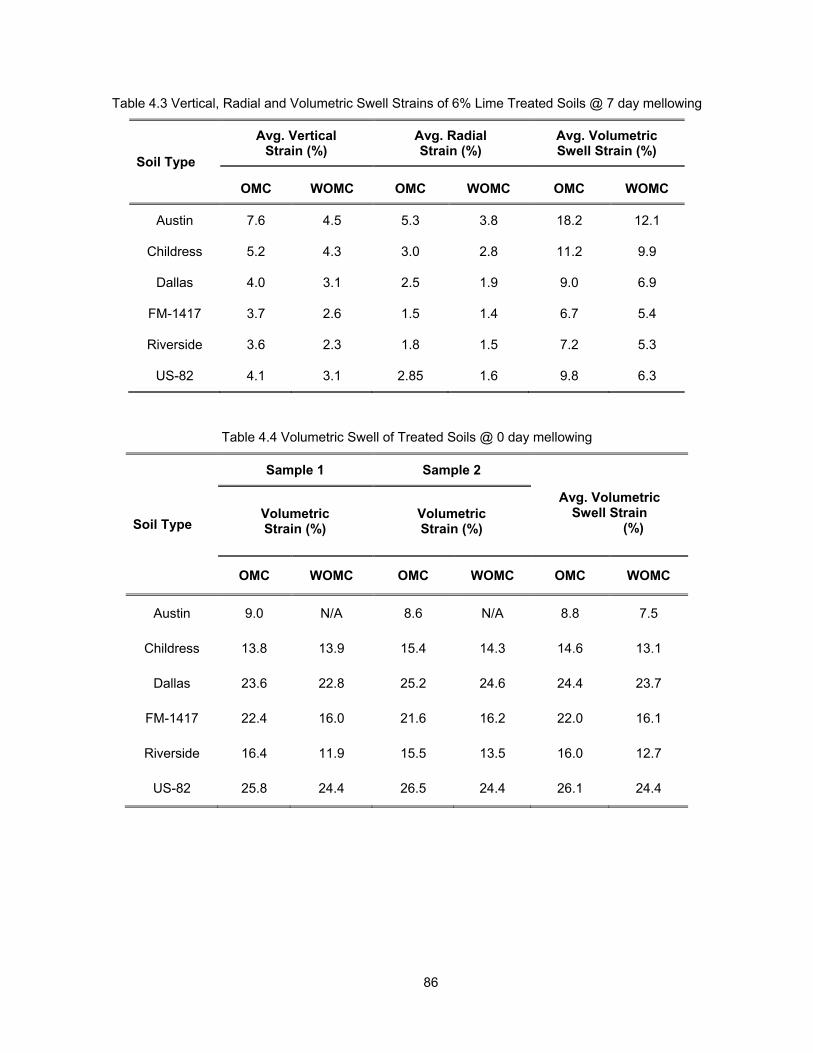
86
Table 4.3 Vertical, Radial and Volumetric Swell Strains of 6% Lime Treated Soils @ 7 day mellowing
Soil Type
Avg. Vertical Strain (%)
Avg. Radial Strain (%)
Avg. Volumetric Swell Strain (%)
OMC WOMC OMC WOMC OMC WOMC
Austin 7.6 4.5 5.3 3.8 18.2 12.1
Childress 5.2 4.3 3.0 2.8 11.2 9.9
Dallas 4.0 3.1 2.5 1.9 9.0 6.9
FM-1417 3.7 2.6 1.5 1.4 6.7 5.4
Riverside 3.6 2.3 1.8 1.5 7.2 5.3
US-82 4.1 3.1 2.85 1.6 9.8 6.3
Table 4.4 Volumetric Swell of Treated Soils @ 0 day mellowing
Soil Type
Sample 1 Sample 2
Avg. Volumetric Swell Strain
(%) Volumetric Strain (%)
Volumetric Strain (%)
OMC WOMC OMC WOMC OMC WOMC
Austin 9.0 N/A 8.6 N/A 8.8 7.5
Childress 13.8 13.9 15.4 14.3 14.6 13.1
Dallas 23.6 22.8 25.2 24.6 24.4 23.7
FM-1417 22.4 16.0 21.6 16.2 22.0 16.1
Riverside 16.4 11.9 15.5 13.5 16.0 12.7
US-82 25.8 24.4 26.5 24.4 26.1 24.4

87
Table 4.5 Volumetric Swell of Treated Soils @ 3 day mellowing
Soil Type
Sample 1 Sample 2 Avg. Volumetric
Swell Strain (%) Volumetric
Strain (%) Volumetric Strain (%)
OMC WOMC OMC WOMC OMC WOMC
Austin 11.8 9.9 11.4 9.7 11.6 9.8
Childress 9.8 8.5 10.4 8.5 10.2 8.5
Dallas 11.2 6.5 9.6 6.3 10.4 6.4
FM-1417 9.8 6.3 10.6 7.7 10.2 7.0
Riverside 9.1 8.5 9.3 8.3 9.0 8.4
US-82 10.8 6.2 11.8 7.6 11.3 6.70
Table 4.6 Volumetric Swell of Treated Soils @ 7 day mellowing
Soil Type
Sample 1 Sample 2 Average Volumetric
Swell Strain (%) Volumetric
Strain (%) Volumetric Strain (%)
OMC WOMC OMC WOMC OMC WOMC
Austin 17.8 11.3 18.4 12.9 18.2 12.1
Childress 10.6 9.8 11.8 10 11.2 9.9
Dallas 8.5 7.3 9.5 6.5 9.0 6.9
FM-1417 6.6 5.2 6.8 5.6 6.7 5.4
Riverside 7.1 5.0 7.3 5.6 7.2 5.3
US-82 9.9 6.1 9.7 6.5 9.8 6.3

88
Table 4.7 Summary of Volumetric Swell
Soil
Natural Soil 6% lime, 0 day mellowing
6% lime, 3 day mellowing
6% lime, 7 day mellowing
Volumetric Swell Strain (%)
OMC WOMC OMC WOMC OMC WOMC OMC WOMC
Austin 16.6 8.7 8.8 7.5 11.6 9.8 18.2 12.1
Childress 7.5 3.7 14.6 13.1 10.2 8.5 11.2 9.9
Dallas 11.0 7.8 24.4 23.7 10.4 6.4 9.0 6.9
FM-1417 16.2 8.9 22.0 16.1 10.2 7.0 6.7 5.4
Riverside 10.0 10.2 16.0 12.7 9.0 8.4 7.2 5.3
US-82 18.1 7.9 26.1 24.4 11.3 6.70 9.8 6.3
Figure 4.1 Vertical Swell vs. Elapsed Time, Austin Soil (36,000 ppm sulfates)
0 40 80 120 160 200Elapsed Time, (Hours)
0
2
4
6
8
10

89
Figure 4.2 Vertical Swell vs. Elapsed Time, Childress Soil (44,000 ppm sulfates)
.
Figure 4.3 Vertical Swell vs. Elapsed Time, Dallas Soil (12,000 ppm sulfates)
0 40 80 120 160 200Elapsed Time, (Hours)
0
2
4
6
8
10

90
Figure 4.4 Vertical Swell vs. Elapsed Time, FM-1417 Soil (24,000 ppm sulfates)
Figure 4.5 Vertical Swell vs. Elapsed Time, Riverside Soil (20,000 ppm sulfates)

91
Figure 4.6 Vertical Swell vs. Elapsed Time, US-82 Soil (12,000 ppm sulfates)
Figure 4.7 Volumetric Swell: Natural and 6% Lime Treated, Austin Soil (36,000 ppm sulfates)
0 40 80 120 160 200Elapsed Time, (Hours)
0
2
4
6
8
10

92
Figure 4.8 Volumetric Swell: Natural and 6% Lime Treated, Childress Soil (44,000 ppm sulfates)
Figure 4.9 Volumetric Swell: Natural and 6% Lime Treated, Dallas Soil (12,000 ppm sulfates)

93
Figure 4.10 Volumetric Swell: Natural and 6% Lime Treated, FM-1417 Soil (24,000 ppm sulfates)
Figure 4.11 Volumetric Swell: Natural and 6% Lime Treated, Riverside Soil (20,000 ppm sulfates)

94
Figure 4.12 Volumetric Swell: Natural and 6% Lime Treated, US-82 Soil (12,000 ppm sulfates)
It can be seen that in untreated condition, Austin, Dallas, FM-1417 and US-82 all have high
swelling potential. These four soils haves a volumetric swell strain (for the OMC condition) value greater
than 10%, and this value indicates a high degree of expansion potential as per the problematic volumetric
swell characterizations mentioned by Chen (1988). In addition, these four soils exhibited a PI value
greater than 40.
With 0 day mellowing, the highest swell magnitude was observed in the US-82 soil (26%),
whereas Austin soil showed the lowest swell (8.8%). The volumetric swell increased due to lime
treatment at 0 day mellowing in all the soils, except for the Austin soil, where the volumetric swell strain
value reduced from 16.6% for natural soil to 8.8% after lime treatment. In Austin soil, mellowing effectively
reduced the swell to a level below 10%. In the rest of the soils, the swell increased beyond the natural
level with 0 day mellowing, indicating the occurrence of sulfate reactions. In 3-day mellowed samples, the
volumetric swell reduced below the natural level for four of the soils tested. Swell magnitudes in these
soils were less than the natural swell, showing the effects of stabilization. All the four soils which
responded positive to 3-day mellowing have sulfate contents below 30,000 ppm. The two soils which
could not be stabilized by 3-day mellowing are Austin and Childress, both with sulfate levels higher than

95
30,000 ppm. With 3-day mellowing, the swell increased in Austin and Childress soils, both with sulfate
contents above 30,000 ppm.
An additional set of 3-D swell tests was performed with a 7-day mellowing period to see the effect
of the increased mellowing period on the swell behavior of high sulfate soils. For the 7-day mellowed
soils, 5% more moisture was provided to cater for the moisture loss during mellowing. With 7-day
mellowing, further reduction in swell was observed in the Riverside, Dallas, US-82 and FM-1417 soils.
The observed volumetric swells in these soils were 7.2%, 9.0%, 9.8% and 6.7% respectively. It can be
observed that in these soils, with a 7-day mellowing period, the volumetric swell reduced to a level below
10%, which is considered non-problematic and indicating that mellowing was effective in these soils. In
Austin and Childress soils, swell further increased beyond the natural swell with 7-day mellowing,
showing the dominance of sulfate reactions with increased mellowing periods. The observed swells at 7-
day mellowing period and optimum moisture content were 18.2% and 11.2% respectively.
From the on-going discussion, it is evident that mellowing was ineffective in soils with sulfate
contents above 30,000 ppm. Reasons for this behavior are addressed in the discussion section.
4.1.1.2 Three Dimensional Volumetric Shrinkage Test (3-D shrinkage)
Volumetric shrinkage tests were conducted to measure the decrease in the total volume of soil
specimens due to the loss of moisture content from the compacted state to a completely dry state. 3-D
shrinkage tests were conducted on all six treated soils at different mellowing periods. Volumetric
shrinkage at 0 day and 3 day mellowing is presented in Tables 4.8 and 4.9 respectively. A summary of
volumetric shrinkage strains is presented in Table 4.11. Variation of volumetric shrinkage with mellowing
is depicted in Figures 4.13 thru 4.18.

96
Table 4.8 Volumetric Shrinkage Strain Test Results (0 day mellowing)
Soil
Sample 1
Sample 2 Avg. Volumetric
Shrinkage Strain (%)
Volumetric Shrinkage Strain (%)
Volumetric Shrinkage Strain (%)
OMC WOMC OMC WOMC OMC WOMC
Austin -4.7 -8.6 -4.9 -8.6 -4.8 -8.6
Childress -2.2 -2.4 -2.6 -2.8 -2.4 -2.6
Dallas -8.6 -10.8 -9.0 -11.3 -8.8 -11.0
FM-1417 -7.5 -8.9 -7.7 -9.0 -7.6 -8.9
Riverside -3.0 -3.2 -3.3 -2.7 -3.1 -3.0
US-82 -6.9 -8.4 -7.3 -8.6 -7.1 -8.5 Note: Negative sign indicate shrinkage.
Table 4.9 Volumetric Shrinkage Strain Test Results (3 day mellowing)
Soil
Sample 1 Sample 2 Average
Volumetric Shrinkage Strain (%)
Volumetric Shrinkage Strain (%)
Volumetric Shrinkage Strain (%)
OMC WOMC OMC WOMC OMC WOMC
Austin -5.4 -9.6 -5.5 -9.8 -5.4 -9.7
Childress -2.9 -4.0 -3.2 -4.0 -3.1 -4.0
Dallas -8.5 -10.8 -8.6 -11.2 -8.6 -11.0
FM-1417 -6.4 -9.6 -6.1 -9.3 -6.3 -9.4
Riverside -4.7 -3.9 -4.5 -3.7 -4.6 -3.8
US-82 -9.8 -10.5 -9.7 -10.4 -9.8 -10.4 Note: Negative sign indicate shrinkage.

97
Table 4.10 Summaries of Volumetric Shrinkage Strains
Soil
Volumetric Shrinkage Strain* (%)
Natural 0 day mellowing 3 day mellowing
OMC WOMC OMC WOMC OMC WOMC
Austin -8.8 -11.3 -4.8 -8.6 -5.4 -9.7
Childress -14.1 -15.7 -2.4 -2.6 -3.1 -4.0
Dallas -19.7 -26.2 -8.8 -11.0 -8.6 -11.0
FM-1417 -15.6 -20.6 -7.6 -8.9 -6.3 -9.4
Riverside -12.5 -14.0 -3.1 -3.0 -4.6 -3.8
US-82 -13.7 -20.2 -7.1 -8.5 -9.8 -10.4
*all the results are average of two trials; Note: Negative sign indicate shrinkage.
Figure 4.13 Volumetric Shrinkage, Austin Soil (36,000 ppm sulfates)

98
Figure 4.14 Volumetric Shrinkage, Childress Soil (44,000 ppm sulfates)
Figure 4.15 Volumetric Shrinkage, Dallas Soil (12,000 ppm sulfates)

99
Figure 4.16 Volumetric Shrinkage, FM-1417 Soil (24,000 ppm sulfates)
Figure 4.17 Volumetric Shrinkage, Riverside Soil (20,000 ppm sulfates)

100
Figure 4.18 Volumetric Shrinkage, US-82 Soil (12,000 ppm sulfates)
It can be seen that the volumetric shrinkage strain is higher at wet of optimum moisture content
than at optimum. The reason for this can be attributed to the presence of a higher percentage of moisture
at wet of optimum when compared to optimum moisture content condition. Also, the soils which shrank
more are high plasticity clays, with plasticity index (PI) greater than 40. These soils are capable of high
swelling during the rainy season, as well as shrinkage during dry summer-like conditions.
In lime treated soils, volumetric shrinkage invariably decreased. In four of the six soils, there was
slight increase in shrinkage with 3 day mellowing compared to the 0 day mellowing. The reason for this
behavior could be due to higher moisture provided (additional 3% to cater for moisture loss during
mellowing) in case of 3-day mellowed soils. Except for the Riverside soil, in all the test soils the volumetric
shrinkage was higher at wet of optimum moisture content compared to optimum moisture content, owing
to more moisture at wet of optimum. Overall, it can be concluded that presence of sulfates do not have
any significant effect on shrinkage behavior of soils since shrinkage reduced in all the cases upon lime
treatment.

101
4.1.2 Strength Characteristics
Unconfined Compression Strength (UCS) tests were conducted on untreated soils and used as a
reference for comparing the strength changes in treated high sulfate soils at different periods of mellowing
and the onset of sulfate and stabilization reactions. The following section describes the results of the
testing program.
4.1.2.1 Unconfined Compression Strength (UCS) Tests
The Unconfined Compression Strength (UCS) tests were conducted as per ASTM D 2166 method. The
tests were conducted on compacted soil specimens of 2.8 inches in diameter and 5.6 inches in height.
UCS tests were conducted on treated soils with different mellowing periods at two moisture conditions
(OMC and WOMC) on two identical specimens. Lime-treated samples were allowed to mellow for 0 and 3
days. After the elapsed time periods, samples were compacted and cured in a 100% humidity room for 7
days. Results of the UCS testing on natural soils are presented in Table 4.11. Table 4.12 and Table 4.13
and show the UCS strengths of treated soils at 0 day and 3 day mellowing. Figures 4.19 to 4.30 show the
load versus deformation curve for natural and treated soils at different mellowing periods.
Table 4.11 UCS Tests Results (Natural Soils)
Soil
Sample 1 Sample 2 Average UCS (psi)
UCS (psi) UCS (psi)
OMC WOMC OMC WOMC OMC WOMC Austin 25.5 20.6 30.5 21.4 28 21
Childress 21.7 16.5 23.8 15.3 22.8 15.9
Dallas 14.5 9.5 17.5 10.3 16 9.9
FM-1417 31.3 19.3 33.3 17.7 32.3 18.5
Riverside 28.8 16.7 30.2 17.7 29.5 17.2
US-82 28.5 18 31.5 18.4 30 18.2

102
Table 4.12 UCS Test Results (6% Lime, 0 day mellowing)
Soil
Sample 1 Sample 2 Average UCS (psi)
UCS (psi) UCS (psi)
OMC WOMC OMC WOMC OMC WOMC
Austin 89.6 54 93.5 58.4 91.5 56.2
Childress 110.7 86.8 115.0 75.4 112.9 81.1
Dallas 94.4 56.0 98.8 61.0 96.6 58.5
FM-1417 80.8 61.8 90.2 64.8 85.5 63.3
Riverside 62.6 49.9 71.0 60.4 66.8 55.1
US-82 72.3 42.7 81.0 50.6 76.6 46.6
Table 4.13 UCS Test Results (6% Lime, 3 day mellowing)
Soil
Sample 1 Sample 2 Average UCS (psi)
UCS (psi) UCS (psi)
OMC WOMC OMC WOMC OMC WOMC
Austin 83.2 52.8 93.2 55.2 88.2 54.0
Childress 99.8 56.62 114.6 60.1 107.2 58.3
Dallas 70.9 62.4 82.1 67.4 76.5 64.9
FM-1417 78.7 47.9 69.8 49.6 74.2 48.7
Riverside 63.5 46.2 58.0 45.5 60.7 45.9
US-82 67.4 42.9 63.4 37.9 65.4 40.4

103
Figure 4.19 UCS Curves for Austin Soil @ OMC
Figure 4.20 UCS Curves for Austin Soil @ w/OMC
0 1 2 3
Axial Strain, (%)
0
20
40
60
80
100
Austin OMCNatural Untreated6% Lime, 0 day6% Lime, 3 days

104
Figure 4.21 UCS Curves for Childress Soil @ OMC
Figure 4.22 UCS Curves for Childress Soil @ w/OMC

105
Figure 4.23 UCS Curves for Dallas Soil @ OMC
Figure 4.24 UCS Curves for Dallas Soil @ w/OMC

106
Figure 4.25 UCS Curves for FM-1417 Soil @ OMC
Figure 4.26 UCS Curves for FM-1417 Soil @ w/OMC

107
Figure 4.27 UCS Curves for Riverside Soil @ OMC
Figure 4.28 UCS Curves for Riverside Soil @ w/OMC

108
Figure 4.29 UCS Curves for US-82 Soil @ OMC
Figure 4.30 UCS Curves for US-82 Soil @ w/OMC

109
UCS strengths for untreated and treated soils varied from 10 psi to 113 psi. For untreated
condition, the highest UCS strength was observed in the FM-1417 soil (32 psi); whereas, the lowest
strength was seen in the Dallas soil (16 psi). For 0 day mellowed soils, Childress showed the highest
strength (113 psi) and the Riverside soil showed the lowest strength (67 psi) is observed in Riverside soil.
At 3-day mellowing, the Childress soil showed the highest strength (107 psi) and Riverside showed the
lowest strength (61 psi).
From the UCS test results, it can be seen that the UCS strengths of lime-treated soils are two to
five times higher than the untreated soils at 0 day and 3 day mellowing period. Another important
observation is that the UCS values of the 3-day mellowed samples are slightly lower than those of the 0
day mellowed samples. This strength loss can be attributed to the higher moisture content provided in
mellowed samples and maximum dry density changes (low compaction density) during the mellowing
process. Similar trends of strength loss were observed in studies conducted at Purdue University (Jung
et. al., 2009). The loss in strength due to mellowing is insignificant since the mellowed strength is
considerably higher than the untreated soils strength.
4.1.2.2 1-D Swell Pressure Tests
The 1-D swell pressure test was conducted using the 1-D consolidation setup as per ASTM method
(D4546-08 Standard Test Methods for One-Dimensional Swell or Collapse of Cohesive Soils). 1-D swell
pressure tests were conducted on all six natural and lime-treated soils at different mellowing periods and
optimum and wet of optimum moisture conditions. Results of swell pressure testing are reported in Table
4.14 and Table 4.15 respectively for 0-day and 3-day mellowed soils. Table 4.16 shows the summary of
swell pressures for natural and lime-treated soils.

110
Table 4.14 Swell Pressure of 6% Lime Treated Soils @ 0 day mellowing
Soil Type
Sample 1 Sample 2 Average
Swell Pressure (psi) Swell Pressure (psi)
Swell Pressure (psi)
OMC WOMC OMC WOMC OMC WOMC
Austin 35.8 12.8 36.6 13.3 36.2 13.0
Childress 39.2 16.0 37.6 16.2 38.4 16.1
Dallas 67.9 33.8 70.7 38.6 69.3 36.2
FM-1417 88.6 27.4 93.2 26.2 90.9 26.8
Riverside 58.3 28.2 53.1 30.6 55.7 29.4
US-82 98.0 62.4 97.4 66.2 97.7 64.3
Table 4.15 Swell Pressure of 6% Lime Treated Soils @ 3 day mellowing
Soil Type
Sample 1 Sample 2 Average
Swell Pressure (psi) Swell Pressure (psi)
Swell Pressure (psi)
OMC WOMC OMC WOMC OMC WOMC
Austin 39.8 18.2 42.4 19.0 41.1 18.6
Childress 32.5 17.8 31.1 16.8 31.8 17.3
Dallas 34.2 9.8 33.6 10.6 33.9 10.2
FM-1417 24.5 9.7 20.3 8.9 22.4 9.3
Riverside 7.4 1.8 7.5 2.0 7.4 1.9
US-82 25.2 12.0 28.0 11.6 26.6 11.8

111
Table 4.16 Summary of Swell Pressures (Natural, 0 day and 3 day mellowed soils)
Swell Pressure (psi)
Soil Type Untreated 0 day mellowing 3 day mellowing
OMC WOMC OMC WOMC OMC WOMC
Austin 46.2 22.4 36.2 13.0 41.1 18.6
Childress 6.7 2.2 38.4 16.1 31.8 17.3
Dallas 40.7 15.1 69.3 36.2 33.9 10.2
FM-1417 37.1 16.2 90.9 26.8 22.4 9.3
Riverside 8.3 1.8 55.7 29.4 7.4 1.9
US-82 48.9 40.1 97.7 64.3 26.6 11.8
From the swell data of the natural soils, it can be seen that except for Childress and Riverside
soils, all the soils showed significant swell pressures upon wetting. Childress soil is high compressible silt
(MH) and Riverside soil is low plasticity clay (CL). In Austin and Childress soils at 3 day mellowing period,
the swell pressures were significantly higher. The swell pressure measurements followed the same trend
as three-dimensional free swell values. From the swell pressure data, it can be concluded that with 0-day
mellowing, all other soils except Austin soil showed higher swell pressures. Observed swell pressures
varied from 36 psi in Austin soil (lowest) to 98 psi in US-82 soil (highest) at 0- day mellowing. The
observed swell pressures are in line with the volumetric swell recorded.
With 3-day mellowing, similar to 3-D swell tests, swell pressures decreased significantly in four of the six
soils (Dallas, FM-1417, Riverside and US-82). Austin soil showed the highest swell pressure (41psi) and
Riverside showed the lowest (7psi). The observed swell pressures in this case were lower than the
untreated swell pressure of the soils. Though all the four soils have dominance of clay minerals in them,
mellowing effectively reduced the swell pressures below natural level. The reason for this could be due to
the plasticity changes occurring during mellowing period. Another cause for this behavior could be
attributed to relatively low sulfate contents in these four soils compared with Austin and Childress soils.
Austin showed an increase in swell pressure which is consistent with the volumetric swell result. Austin is

112
high plasticity clay with very high sulfate content (36,000 ppm). With mellowing, the entire sulfate could
not be consumed and enough sulfate remained in the system for uninterrupted formation and growth of
Ettringite. This could be the reason why mellowing was ineffective in Austin soils. In the case of
Childress soil, though the swell pressure decreased with 3-day mellowing, it was not significant since the
swell pressure at 3day mellowing was considerably higher than the untreated swell pressure. Childress is
high plasticity silt with mineral kaolinite dominance, and the untreated swell of the soil is low compared to
others (6.7%). But due to very high sulfate content and a reasonable amount of Montmorillonite and Illite
(35%), the heave reactions caused swell magnitudes that were higher than the untreated swell
magnitude.
4.1.3 Mineralogical Studies
Reactive alumina and silica measurements were conducted on the natural and treated soils at different
mellowing periods to study the role of alumina and silica in sulfate heave and stabilization reactions.
4.1.3.1 Reactive Alumina and Silica Measurements
Reactive alumina and silica measurements were conducted using ICP_MS (Inductively Coupled Plasma
Mass Spectroscopy) on treated soils at different mellowing periods. Table 4.17 shows the reactive
alumina and silica at 0 day and 3 day mellowing periods. A summary of reactive alumina and silica
measurements is given in Table 4.18.

113
Table 4.17 Reactive Alumina and Silica Measurements @ 0 day and 3 day mellowing
Soil
0 day mellowing 3 day mellowing
Al* (ppm)
Si* (ppm)
Al loss (%)
Si loss (%)
Al* (ppm)
Si* (ppm)
Al loss (%)
Si loss (%)
Austin @ OMC 22.8 6.1 61 63 18.9 5.1 68 68
Austin @ WOMC 23.0 5.8 60 62 19.2 6.0 67 61
Childress @ OMC 28.1 5.9 63 54 32.2 7.2 61 46
Childress @ WOMC 29.2 5.2 62 62 32.1 6.3 58 54
Dallas @ OMC 87.6 68.2 70 71 122.2 69.2 58 70
Dallas @ WOMC 96.1 72.4 67 69 123.8 74.2 57 68
FM-1417 @ OMC 115.9 47.1 58 66 131.9 50.3 53 64
FM-1417 @ WOMC 120.8 49.7 57 64 135.2 50.9 52 63
Riverside @ OMC 108.8 42.8 65 89 183.7 49.4 41 87
Riverside @ WOMC 137.1 44.8 56 88 155.9 47.2 50 88
US-82 @ OMC 94.2 19.9 67 88 135.6 27.3 54 84
US-82 @ WOMC 99.1 19.9 66 88 172.2 23.0 42 87
Table 4.18 Summary of Reactive Alumina and Silica Measurements (at OMC)
Soil Natural 0 day mellowing 3 day mellowing
Al Si Al Si Al Si
Austin 58.9 15.4 22.8 6.1 18.9 5.1
Childress 75.8 12.6 28.1 5.9 32.2 7.2
Dallas 289.9 231.2 87.6 68.2 122.2 69.2
FM-1417 279.2 137.3 115.9 47.1 131.9 50.3
Riverside 297 379.8 108.8 42.8 183.7 49.4
US-82 323.3 187.1 94.2 19.9 135.6 27.3

114
From Table 18, it can be seen that Austin and Childress soils have the lowest reactive alumina
and silica contents among the six soils under study. The percentage loss of alumina and silica due to lime
treatment at different mellowing periods were also calculated and compared with the natural alumina and
silica contents of the soil. In general, the alumina and silica loss was more at OMC compared to WOMC,
with Riverside soil being an exception. It was observed that the highest percentage loss of silica was
seen in the Riverside and US-82 soils at both 0- day and 3-day mellowing. In the rest of the soils, silica
loss was more or less the same, and no specific trend between losses of silica and mellowing time was
observed. Loss of alumina and silica were higher at 3-day mellowing than at 0-day mellowing in all the
soils except Austin soil where, the reverse trend was observed.
The observed volumetric swell in Austin soil was more at 3day mellowing than at 0-day
mellowing. Although Austin soil could be stabilized with 0-day mellowing, with 3-day and 7-day mellowing,
the observed swell magnitudes were higher than previously. In Childress soil, there was no significant
difference between loss of alumina and silica with 0-day and 3-day mellowing. Both Austin and Childress
soils are high sulfate soils with soluble sulfates greater than 30,000 ppm. With lime treatment, stabilizing
reactions and sulfate reactions occur at the same time, which involves dissolution of clay alumina and
silica.
In case of 3-day mellowing, due to its low alumina and high sulfate contents, sulfate reactions
dominated the stabilizing reactions, leading to more heaving than 0-day mellowed samples. This is true in
the case of 7-day mellowing since the volumetric swell in 7-day mellowing is higher than the 0 and 3-day
mellowing. For Childress soil, although the alumina loss was higher at 0-days mellowing compared to 3-
day mellowing, the difference in loss percentage was not significant. It is reported in the literature that
Ettringite formation depends on the amount of reactive alumina present in the system. Low alumina
contents in soils favor the trisulfate hydrate (Ettringite) formation; whereas, high alumina contents lead to
simultaneous formations of pozzolanic and Ettringite reactions. As a result, attractive forces from
pozzolanic reactions will resist the disruptive forces caused by Ettringite formation and hydration
reactions. Low alumina and high sulfate contents in Austin and Childress soils led to more heaving with
increased mellowing periods.

115
An interpretation of the test results and the reasons for ineffectiveness of mellowing in two of the
six soils are provided in the discussion section.
4.2 Analysis of Test Results
Swell tests conducted on lime treated high sulfate soils indicated that these soils are prone to “Ettringite
Induced Heaving” when treated with calcium based stabilizers. In the first part of the research program,
pre-compaction mellowing technique with two different mellowing periods (3 days and 7 days) was used
to stabilize high sulfate soils (sulfate contents > 8,000 ppm). Results of the testing indicated that
mellowing was effective in four of the six soils considered in the current study. The two soils that could not
be stabilized even at higher mellowing periods are Austin and Childress soils. The reason for the
ineffectiveness of mellowing in these two soils was attributed to very high sulfate amounts (> 30,000
ppm), low reactive alumina and silica contents in the treated soils and low compaction void ratios.
From the on-going discussion it is evident that Ettringite induced heaving is a function of the
sulfate content, reactive alumina and silica contents of the native soils and compaction void ratio
conditions. Combined effects of all these parameters manifested in the form of observed volumetric swell
strains when the treated soils were subjected to hydration. The effects of each of these variables need to
be considered separately to understand the mechanisms of swelling in the chemically treated high sulfate
soils.
In the analysis of test results section, the reasons for effectiveness of mellowing of the six soils
are explained using two approaches. In the first approach, Gibbs free energy for the formation of
Ettringite mineral in the treated soil is calculated for the soils at the given sulfate, reactive alumina and
silica contents. Also, Gibbs free energy for the formation of pozzolanic compounds is calculated and this
energy is compared with that of Ettringite formation. Based on the calculated Gibbs free energy, the
favorability of Ettringite reactions over the pozzolanic reactions and vice versa are reported.
In the second approach, mass-volume calculations are performed based on the soil density,
specific gravity and sulfate contents to obtain the maximum amount of Ettringite formed in a given
compacted soil system. Compaction dry density characteristics of treated soils after sulfate induced soil
swelling were used to obtain the void distribution in the treated high sulfate soils. Based on the void ratio
changes from initial to heaving conditions, the assessment of Ettringite induced heaving was made.

116
In the last section of this chapter two swell prediction models are presented. Swell prediction
model developed based on the sulfate content value using an approach outlined by Little et al. (2010) is
presented and comparisons are made between the predicted volumetric swell and measured volumetric
swell strains. Based on the mass volume calculations and initial void ratio of the soils, swell prediction
model based on threshold void ratio frame work is presented in the last section of the chapter.
4.2.1 Analysis of Test Results
As mentioned above six different soils from the State of Texas with varying sulfate contents are collected
for the research study. Lime is used as the stabilizer for treating these soils. These soils were treated with
lime and allowed to mellow for 0, 3 and 7 day followed by volumetric swell testing. Volumetric swell tests
indicated that the mellowing is ineffective in two of the six soils considered. The reasons for
ineffectiveness of mellowing in two of the six soils are explained using the two approaches presented
here.
First approach is based on Gibbs free energy calculations. In this approach, Gibbs free energy for
reactants and products are calculated. As the occurrence and direction of chemical reactions are based
on the energy exchange between reactants and products, the favorability of a chemical reaction and
formation of compounds can be assessed based on the “actual molar volumes” of reactants for the soils
considered in this study.
The second approach is based on the mass-volume calculations of Ettringite formation. In this
approach the amount of Ettringite is assessed from the native soil dry density and sulfate content. Based
on the mass-volume calculations of treated soil swell, the amount of voids, solids and Ettringite per feet
cube of soil can be calculated. If the void volume is higher than the Ettringite volume, the formed Ettringite
could be accommodated in the soil matrix and no Ettringite induced heave is observed in this case. If the
Ettringite volume exceeds void volume, the Ettringite grows out of the void matrix leading to higher swell
magnitudes. Based on these calculations the reasons for ineffectiveness of mellowing in two of the six
soils considered in the current study were explained.

117
4.2.1.1 First Approach: Gibbs Free Energy
The occurrence and direction of geochemical reactions are influenced by the exchange of energy
between reactants and products (Pauling, 1960; Krauskopf et. al., 1995). This energy is expressed in
terms of Gibbs free energy in kJ/mol. A geochemical system with minimum free energy is considered to
be in thermodynamic equilibrium. Standard Gibbs Free Energy of any reaction can be calculated as:
∆ = ∑∆ − ∑∆ (1) Where,
∆Grº = Gibbs Free Energy of the Reaction;
∆GPº = Gibbs Free Energy of Products;
∆GRº = Gibbs Free Energy of Reactants.
In the current analysis, standard Gibbs free energies of both the deleterious (Ettringite formation)
and strength giving (pozzolanic) reactions are calculated from the quantities of reaction constituents.
Gibbs free energies of both the reactions are compared and the reaction with higher free energy tends to
proceed faster than the other. In performing the Gibbs free energy calculations for heave assessment of
lime treated high sulfate soils, the following assumptions were made.
1. Heaving is attributed to formation of Ettringite only.
2. Ettringite formation is effected by the concentrations of Aluminum and sulfate only since the soils
considered in the current study are treated with same amount of lime (6% by dry weight) and
source of water for Ettringite formation is the same in all the cases.
3. Occurrence of deleterious heave is resisted by the formation of strength giving Calcium Silicate
Hydrate (CSH) compounds.
4. CSH is considered in the current analysis since it is the most common occurring pozzolanic
reaction product. (Taylor, 1964).
5. The formations of calcium aluminum hydrates (CAH) and calcium aluminum silicate hydrate
(CASH) compounds are not considered since the portion of alumina entering the Ettringite
reaction and CAH and CASH reactions cannot be quantified exactly.
The governing reactions for the Gibbs free energy calculations are given as:

118
6 + 2 ( ) + 4( ) + 3 + 26 → ( ) . ( ) . 26 (2) (Ettringite Formation Reaction) + 1.7 ( ) + 0.917 → 1.7 . . 2.617 (3)
(Calcium Silicate Hydrate, CSH Formation Reaction)
Flow chart showing the Gibbs free energy approach is presented in Figure 4.31. From the
Ettringite formation reactions it can be seen that 2 moles of aluminum hydroxide and 3 moles of sulfate
react to form 1 mole of Ettringite. Similarly, 1 mole of silicon dioxide reacts to form 1.7 mole of Calcium
Silicate Hydrate. Gibbs free energy of reactants and products for Ettringite and CSH reaction are obtained
(Fujii et al., 1983; Moschner et al., 2009) and presented in Tables 4.19 and 4.20, respectively.

G
reactants
energy ca
ICP analy
Table 4.2
Gibbs free ene
and products
alculations of
ysis and sulfat
1.
Sulfat
FFav
Fig
ergy values re
s for Ettringite
Ettringite and
te contents a
EttrinFormReac
e Content
∆Gf (Ettrinformatioenenrgy
Ettringite Formation is vored (Heave)
True
gure 4.31 Gibb
eported in Tab
e and CSH re
d CSH reactio
re measured
G
A
ngite ation ction
Alumina Co
ngite on y)
If ∆>
119
bs Free Energ
ble 4.19 and 4
eactions pres
ons, natural a
using Modifie
ibbs Free Energy
Approach
ontent
∆Gf (Ettringite)> ∆Gf (CSH)
gy Approach
4.20 are base
sented in Equ
alumina and s
ed UTA meth
CSH FormatioReaction
Silica Conten
∆Gf (CSH formation energy)
Fals
ed on standa
uations 2 and
silica contents
od and the sa
on
nt
CSH FormaFavore
(Strength
se
rd molar volu
3. For Gibb
s are obtained
ame are pres
ation is ed Gain)
ume of
s free
d from
sented

120
Table 4.19 Gibbs free energy of Reactants and Products at 20ºC (Ettringite Reaction)
Ettringite Formation Reaction
Species ∆aGº (kJ/mol)
H2O -236.84
(OH)- -157.32
Ca2+ -553.07
Al(OH)4- -1301.29
SO42- -744.35
Ettringite -15196.53 Note: ∆aGº=Standard Gibbs Free Energy
Table 4.20 Gibbs free energy of Reactants and Products at 20ºC (CSH Reaction)
CSH Formation Reaction
Species ∆aGº (kJ/mol)
H2O -236.83
Ca(OH)2 -897.5
SiO2 -856.3
CaO·SiO2·2.617H2O -2630 Note: ∆aGº=Standard Gibbs Free Energy
Table 4.21 Alumina, Silica and Sulfate contents of the Test Soils in ppm
Note: Al= Alumina Content; Si= Silica Content; SO4=Sulfate Content
Soil Al (ppm) Si (ppm) SO4(ppm)
Austin 58.9 15.4 36,000
Childress 75.8 12.6 44,000
Dallas 289.9 231.2 12,000
FM-1417 279.2 137.3 24,000
Riverside 297 379.8 20,000
US-82 323.3 187.1 12,000

121
Based on the alumina, silica and sulfate concentrations in natural soils, the molar volume of
alumina, silica and sulfates in mol/L are calculated for Austin soil as per the above chemical reactions.
The molar volume amounts of sulfate, alumina and silica are determined and presented in Table 4.22 for
the soils considered. Sample calculation of molar volumes of sulfate, alumina and silica for Austin soil is
presented below:
( ) = . 4 = 36000 100096 = 38 /
( ) = . / ( ) = 58.9 /100095.01 / = 6.2 10 /
= . / = 15.4 /100060.09 / = 2.56 10 /
Where Conc.= Concentration; MW= Molecular weight
Table 4.22 Balanced Amounts of Sulfate, Alumina and Silica in mol/L
Note: SO4 = Sulfate; Al (OH)4 = Aluminum; SiO2 = Silica
Soil SO4 (mol/L) Al(OH)4 (mol/L) SiO2 (mol/L)
Austin 0.3750 0.0006 0.0002
Childress 0.4583 0.0008 0.0002
Dallas 0.1250 0.0030 0.0038
FM-1417 0.2500 0.0029 0.0022
Riverside 0.2083 0.0031 0.0063
US-82 0.1250 0.0034 0.0031

122
Based on the molar concentrations of reactants shown in Table 4.22, the amount of Ettringite and
CSH are calculated by balancing Equations 4 and 5. A balanced Equation for Austin soil is presented
below:
For Austin Soil, amount of SO4, Al(OH)4, SiO2 in mol/L are 0.3750, 0.0006, 0.0002 respectively.
Based on these amounts the final balanced Equation for Ettringite and CSH reactions can be represented
as: 0.00186 + 0.0006 ( ) + 0.0012( ) + 0.0009 + 0.0081→ 0.0003 ( ) . ( ) . 26 (4) (Ettringite Formation Reaction)
0.00025 + 0.0004 ( ) + 0.00023 → 0.0004 . . 2.617 (5) (Calcium Silicate Hydrate, CSH Formation Reaction)
From the Equations 4 and 5, the Gibbs free energy of reactants and compounds are calculated
separately and the Gibbs free energy of Ettringite and CSH formation reactions are calculated for
respective sulfate, alumina and silica concentrations. The calculated final Gibbs free energies for
Ettringite and CSH reactions are shown in Table 4.23 for the six soils considered in the current study.
Table 4.23 Final Gibbs Free Energy of Ettringite and CSH Reactions
Soil ∆fGº (J/mol)
Remarks Ettringite Reaction
CSH Reaction
Austin ‐800 ‐480 Ettringite formation is favored
Childress ‐104 ‐40 Ettringite formation is favored
Dallas ‐390 ‐7100 CSH formation is favored
FM-1417 ‐330 ‐4260 CSH formation is favored
Riverside ‐4070 ‐11780 CSH formation is favored
US-82 ‐450 ‐5820 CSH formation is favored
Note: ∆fGº= Final Gibbs Free Energy in J/mol

123
From the Table 4.23, it can be seen that the Gibbs free energy of Ettringite and CSH formation
reactions are negative. Negative Gibbs free energy of the reaction indicates energy is released
(exothermic) when compounds are formed. Also, since energy is released in the reactions, the reaction
can proceed on its own and does not require energy from outside source. Gibbs free energies of Ettringite
and CSH reactions are tabulated for six soils. It can be seen from the Table that for Austin and Childress
soils, the Gibbs free energy for formation of Ettringite is higher than the CSH reaction implying Ettringite
formation reactions (deleterious) are favored when compared to pozzolanic CSH reactions (strength
giving reactions).The reason for ineffectiveness of mellowing in Austin and Childress soil can be
explained by the free energy calculations since the Ettringite reactions are dominating in these soils when
compared to CSH reactions (very high sulfate contents and low reactive alumina silica contents).
In rest of the four soils the CSH free energies are much higher than the Ettringite free energies,
indicating CSH reactions are favored in these soils. All these four soils could be stabilized successfully
with increased mellowing periods. Higher free energy of Ettringite reactions and lower CSH reactions in
Austin and Childress soils are attributed to high sulfate contents and low alumina and silica contents.
Converse is true in the rest of the soils owing to comparatively low sulfate contents and high alumina and
silica contents. From the on-going discussion it is clear that Ettringite reactions are dependent on the
sulfate content and alumina content of soils and the pozzolanic CSH reactions are dependent on the
silica content of calcium stabilizer treated soils.
4.2.1.2 Second Approach: Mass-Volume Calculations of Ettringite Formation
In the second approach based on mass-volume calculations, the method outlined by Hunter
(1988) is used here. In the first part of the approach the maximum amount of Ettringite that could be
formed at certain sulfate concentration is calculated from the stoichiometric transformation of sulfates to
Ettringite. In the second part, mechanical calculations are done using the natural dry density of soil as
well as the dry density of the treated soils. For a targeted dry density of treated soils, the percentages of
soil and Ettringite are obtained from the specific gravities of soil and Ettringite mineral. Once the
percentages of Ettringite and soil are obtained, the volume of solids, voids and Ettringite per cubic ft. (ft3)
of the treated soil after elapsed swell are calculated from the mass-volume relationships. A pictorial
representation of the Ettringite/Thaumasite growth in the soil matrix and corresponding changes in void

124
volumes are presented in Figure 4.32. Based on the volume of voids, solids and Ettringite, the possibility
of deleterious heave in treated soils can be assessed.
The following assumptions are made in performing the mass-volume calculations.
1. Phase diagram comprising of soil solids and voids (at complete saturation or no air
phase) is considered in the current analysis.
2. The calculations presented below are based on soils subjected to three (3) day mellowing
period.
3. Though 3 day mellowing period is considered in the analysis, the sulfate contents prior to
mellowing are used are natural sulfate contents for the analysis. All of sulfate available in
the natural soil has participated in the chemical reactions.
4. Since all the soils are lime treated, it is assumed that the observed swell is only due to
Ettringite formation and swell due to natural expansiveness of the soil is neglected.
5. Swell due to formation of Thaumasite is neglected since all the swell tests were
conducted in laboratory environment at 20ºC. At the room temperatures formation of
Thaumasite is less favored hence neglected in the analysis.
6. Distressed dry unit weight is obtained from the final moisture content and final sample
dimensions.
7. The decrease in dry density of the treated soils after swell is due to formation of Ettringite
which has a lower dry density compared to the soil itself.
8. Specific gravity, molar weight and molar volume of Ettringite are taken as 1.77g/cc, 1254
g/mole and 708.5cc/mole respectively.
The data required for mass – volume calculations is presented in Table 4.24 for Austin soil.

Figure 4.32 VVolume Channges in Soil M
(Hu
125
Matrix Due to F
unter, 1988)
Formation of Ettringite/Thaaumasite

126
Table 4.24 Data for Mass-Volume Calculations
Parameter Value
maximum dry density of untreated soil ( )
106 pcf
maximum dry density of lime treated soil (before
swelling) ( )
95 pcf
Specific Gravity of Soil Solids ( ) 2.61
Sulfate Content in mg/kg ( ) 36,000
Maximum dry density of damaged soil (after
swelling) ( ) 83.62 pcf
Specific Gravity of Soil Solids (after swelling)( )
2.06
Final moisture content (after swelling)( (%)) 33%
Initial volume ( ) 1 ft3
Final volume (after swelling) ( ) 1.12 ft3
Chemical calculations are performed first to determine the maximum amount of Ettringite formed
using all the sulfate content available. Chemical calculations are given below:
a. Maximum dry density of lime treated soil is95 b. Sulfate content of 36,000 mg/Kg is equivalent to
95 0.454 36000 = 1552 c. 1 mole sulfate is 96 grams, hence total sulfate available is 16.2 moles
/ = 16.2
d. From the Ettringite reactions 3 moles of sulfate reacts to form 1 mole of Ettringite, the
amount of Ettringite formed is 5.4 moles.

127
e. Weight of Ettringite formed is
. = 14.9
f. Based on the sulfate contents and soil compaction density the maximum amount of
Ettringite that could be formed for Austin soil is 14.9 lbs.
The next step is the calculations to determine the void distribution. Mechanical calculations are
given below:
a. From the laboratory data, final dry density of lime treated soil (after swelling) is
obtained as 83.6
b. Specific gravity of heaved soil after swelling is = 2.06
c. To achieve average specific gravity of 2.06, the percentage of soil and Ettringite are
35% and 65% (weighted average of specific gravities of soil and Ettringite).
d. The system has 65% Ettringite, 0.65 83.62 = 54.35 e. In a unit volume, Ettringite volume portion per ft3= ( . . / )( . ) = 0.49
f. In a unit volume, soil solids per ft3= ( . . / )( . ) = 0.18
g. In a unit volume, voids per ft3= (1 − 0.49 − 0.18) = 0.33 h. For every cubic feet of treated soil (after swelling), the approximate percentages of
soil, voids and Ettringite are: 0.49 Ettringite, 0.18 soil solids and 0.33 voids.i. For the soil considered in this example, the void portion is less than the Ettringite
portion indicating the swell could not be accommodated in the soil matrix which leads
to heaving.
Once the portion of Ettringite formed per ft3 of soil is obtained it is multiplied with the specific
gravity and unit weight of water to obtain the maximum amount of Ettringite that could form in a soil
system. The mass-volume calculations performed for all the soils considered in the study are reported in
Table 4.25 thru 4.30 at optimum and wet of optimum moisture contents.

128
Table 4.25 Theoretical Maximum Possible Ettringite in lb/ft3 of Soil Based on
Sulfate Content (@OMC)
oil Sulfate Content (ppm)
Gs (Natural Soil)
Theoretical Maximum Possible Weight of Ettringite
(lbs/ft3 of soil) Austin 36,000 2.61 14.9
Childress 44,000 2.51 18.40
Dallas 12,000 2.71 4.54
FM-1417 24,000 2.66 9.08
Riverside 20,000 2.56 8.53
US-82 12,000 2.65 4.65
Table 4.26 Theoretical Maximum Possible Ettringite in lb/ft3 of Soil Based on
Sulfate Content (@WOMC)
Soil Sulfate Content (ppm)
Gs (Natural Soil)
Theoretical Maximum Possible Weight of Ettringite
(lbs/ft3 of soil) Austin 36,000 2.61 14.1
Childress 44,000 2.51 17.4
Dallas 12,000 2.71 4.3
FM-1417 24,000 2.66 8.7
Riverside 20,000 2.56 8.1
US-82 12,000 2.65 4.4

129
Table 4.27 Phase Distribution Based on Mechanical Calculations (@OMC)
Soil Sulfate Content (ppm)
Per ft3 of Soil
Ve VS VV Austin 36,000 0.49 0.18 0.33
Childress 44,000 0.58 0.11 0.31
Dallas 12,000 0.35 0.21 0.45
FM-1417 24,000 0.4 0.13 0.47
Riverside 20,000 0.36 0.24 0.4
US-82 12,000 0.3 0.27 0.43
Note: Ve = Volume of Ettringite Per ft3 of soil; Vs = Volume of solids per ft3 of soil; Vv = Volume of voids per ft3 of soil
Table 4.28 Phase Distribution Based on Mechanical Calculations (@WOMC)
Soil Sulfate Content (ppm)
Per ft3 of Soil
Ve VS VV Austin 36,000 0.42 0.21 0.37
Childress 44,000 0.46 0.18 0.36
Dallas 12,000 0.3 0.23 0.47
FM-1417 24,000 0.25 0.27 0.48
Riverside 20,000 0.41 0.16 0.43
US-82 12,000 0.25 0.29 0.46
Note: Ve = Volume of Ettringite Per ft3 of soil; Vs = Volume of solids per ft3 of soil; Vv = Volume of voids per ft3 of soil

130
Table 4.29 Mass of Ettringite formed Based on Mechanical Calculations (@OMC)
Soil Final Volume ft3 (based on swell data)
Volume of Ettringite
(ft3)
Mass of Ettringite
(lbs)
Austin 1.116 0.55 60.40
Childress 1.102 0.64 70.59
Dallas 1.104 0.39 42.68
FM-1417 1.102 0.44 48.69
Riverside 1.090 0.39 43.34
US-82 1.113 0.33 36.88
Table 4.30 Mass of Ettringite formed Based on Mechanical Calculations (@WOMC)
Soil Final Volume ft3 (based on swell data)
Volume of Ettringite
(ft3)
Mass of Ettringite
(lbs)
Austin 1.098 0.46 46.39
Childress 1.085 0.50 50.81
Dallas 1.064 0.32 33.13
FM-1417 1.070 0.27 27.61
Riverside 1.084 0.44 45.28
US-82 1.067 0.27 27.61

131
From Table 4.27 and 4.28 it can be seen that the volume occupied by Ettringite formation is very
high in Austin and Childress soils. In both the soils Ettringite volume could not be accommodated in the
soil matrix which result in Ettringite induced heaving. Ettringite induced heave is of concern in these two
soils. In rest of the four soils, the Ettringite volume is lower than the void volume which means even if
there is Ettringite formation; the soil can accommodate it in the void space. Similar type of mass-volume
calculations are performed on the 7 day mellowed soils. The results indicated that 7 day mellowing is
ineffective in Austin and Childress soils. From the on-going discussion it can be seen that, sulfate
contents and compaction void ratios are important in assessing the sulfate induced heave in lime treated
high sulfate soils.
4.3 Discussion
Four of the six high sulfate soils could be stabilized successfully using pre-compaction mellowing
technique. The reasons for ineffectiveness of mellowing in two soils are explained using Gibbs free
energy approach and mass-volume calculations. Also, the two soils that could not be stabilized have
sulfate contents above 30,000 ppm and contain low alumina and silica contents. The effect of clay
mineralogy and compaction void ratios was studied and presented in the following section.
4.3.1 Effect of Compaction Void Ratio on Swell Strains
To study the effect of compaction void ratio (e) on swell behavior, void ratios of the tests soils in
compacted state has to be calculated. Using the specific gravity and maximum dry density from proctor
curve void ratios of the test soils were calculated at both optimum moisture content (OMC) and wet of
optimum moisture content (WOMC). Void ratios of the test soils are presented in Table 4.31.

132
Table 4.31 Void Ratios of Test Soils
Soil Sulfate Level, ppm
Compaction Void Ratio OMC WOMC
Austin 36,000 0.54 0.62
Childress 44,000 0.52 0.60
Dallas 12,000 0.84 0.93
FM-1417 24,000 0.86 0.96
Riverside 20,000 0.61 0.70
US-82 12,000 0.82 0.91
From Table 4.31, it can be seen that both Austin and Childress soils have low void ratios
compared to other soils. Low compaction void ratio means more dense soil matrix. It is known that lime
treatment decreases the maximum dry density. Though there was a decrease in maximum dry density
upon lime treatment it was not significant in these two soils due to low initial compaction void ratios. Due
to the low void ratio the Ettringite formation and growth could not be accommodated in the dense soil
matrix leading to more heaving. Also, Austin and Childress soils have sulfate contents above 30,000 ppm
and the reactive alumina and silica contents in these soils were lower than 100 ppm. Combination of low
void ratios, high sulfate contents and low reactive alumina and silica could be the reasons why mellowing
was ineffective in these two soils.
Another important observation is that Riverside soil has a lower void ratio (0.61) in comparison to
the other soils. Lower void ratio should lead to a denser matrix and hence more swelling similar to the
Austin and Childress soils. Though Riverside soil has a lower void ratio, low sulfate contents (compared
to Austin and Childress) and high reactive alumina and silica contents (297 ppm, 380 ppm) lead to lower
swelling upon mellowing. Due to its low sulfate content all the available sulfate is consumed during the
mellowing process and no further sulfate were available for further Ettringite formation. High alumina and
silica contents helped in pozzolanic reactions leading to a stabilized material hence less swelling.
4.3.2 Effect of Clay Mineralogy on Swell Strains
Clay mineralogy of the test soils was determined from the cation exchange capacity (CEC),
specific surface area and total potassium (TP) measurements. Determination of clay mineralogy gives an

133
insight into what type of clay minerals are present and their reactivity with respect to pozzolanic and
sulfate reactions. Clay mineral distribution of the test soils is presented in Table 4.32.
Table 4.32 Percent Clay Minerals Observed for Soils under Study
Soil Region % Illite % Kaolinite % Montmorillonite
Austin 14.5 48.6 36.9
Childress 18.3 65.9 15.8
Dallas 15.2 34.6 50.2
FM-1417 13.2 20.3 66.5
Riverside 21.2 58.7 20.1
US-82 13.7 39.2 47.1
From Table 4.32 it can be seen that both Austin and Childress soils have mineral Kaolinite
dominance in them. Also, the reactive alumina and silica contents were lowest in Austin and Childless
soils. Dermatas, 1995 reported that mineral Kaolinite releases more alumina during the hydration
reactions compared to other clay minerals. Austin is high plasticity clay whereas Childress is high
plasticity silt, both with mineral Kaolinite dominance over other minerals. High sulfate content and readily
available alumina from mineral Kaolinite could be the reason for ineffectiveness of mellowing in Austin
and Childress soils.
4.4 Conclusions
The following conclusions were drawn from the on-going discussion.
1. Volumetric shrinkage is not a concern in chemically treated high sulfate soils since all the lime
treated soils exhibited low shrinkage strains compared to natural soils.
2. Effect of strength loss during mellowing is insignificant since the treated soil strengths were
significantly higher than the untreated ones.
3. Swell behavior is more important in chemically treated high sulfate soils.

134
4. Four of the six high sulfate test soils could be stabilized using “pre-compaction” mellowing
technique. Swell strains in these soils reduced below natural level with mellowing. Sulfate levels in
these soils were below 30,000 ppm.
5. The soils that could not be stabilized by mellowing have sulfate contents above 30,000 ppm.
6. Gibbs free energy calculations indicated higher probability of Ettringite reactions over stabilizing
reactions in Austin and Childress soils.
7. The above fact is confirmed by the mass-volume calculations showing Ettringite volume exceeding
the void volume.
8. Compaction void ratio has significant influence on the Ettringite growth and subsequent heaving
since soils with higher void ratios can accommodate the initial Ettringite growth.
9. Study of clay mineralogy is important since clay minerals like Kaolinite release more alumina to
during sulfate reactions contributing to heave.
10. Reactive alumina and silica measurements are important since they help in pozzolanic compounds
formation during stabilization reactions.
11. In soils with very high sulfate contents all the sulfate could not be dissolved during mellowing. This
is the reason why soils with sulfate contents above 30,000 ppm could not be stabilized by
mellowing.
12. Presence of high sulfate content, low reactive alumina and silica and low void ratios are the causes
of higher swelling in Austin and Childress soils.
The next section describes combined lime and fly ash treatment to abate heaving in high sulfate
soils.

135
CHAPTER 5
ANALYSIS OF LABORATORY TEST RESULTS (PHASE II)
5.1 Introduction
This chapter is focused on combined lime and fly ash studies on high sulfate soils. Portion of the
lime was replaced with fly ash so as to limit the available calcium for Ettringite reactions. Fly ash is a by-
product from burning coal, and its properties vary significantly with the source of the coal and the steps
followed in burning the coal. Fly ash is broadly classified as class C fly ash and Class F fly ash. The main
difference between the two types of fly ash is the availability of calcium. Class F fly ash has low calcium
content compared to class C fly ash and needs an activator like lime or cement for effective stabilization.
The type of fly ash used in the current study is Class F fly ash.
The Class F fly ash is obtained from Boral Materials technologies and is manufactured in the
Monticello plant, Texas. The class F fly ash used in the current study meets ASTM C618 for Class F fly
ash specification. Upon literature review, it was planned to use 1:2 lime and fly ash ratio. Different lime
and fly ash dosages were tried in the laboratory for optimum performance in terms of strength gain and
volume stability. These studies yielded lime and fly ash dosages of 4% and 8%, respectively.
Stabilization using 4% lime and 8% fly ash will be referred as 4%L+8%FA in this chapter. A list of
variables used in the present experimental program is presented in Table 5.1.
Two soils (Bells and Fm-1417) were chosen for the present combined lime and fly ash
stabilization studies. These soils contained sulfate contents of 27,000 ppm and 24,000 ppm respectively
and are classified as high sulfate soils. In this chapter, basic, chemical, physical, engineering test results
obtained from the entire laboratory testing are provided. Two mellowing periods (0 days and 3 days) were
considered in the current study. All the chemical and engineering tests were conducted on duplicate soil
specimens for each variable condition. The results were averaged, and average values are reported. The
results obtained are repeatable and consistent with minimal variance. The effects of chemical stabilizer,
mellowing period, soluble sulfate content, soil clay mineralogy and compaction moisture contents on the
swell and shrinkage characteristics of treated high sulfate soils are explained and discussed. The

136
discussion findings are based on the majority of the trends noticed in test results of both untreated
(control) soils and treated soils (lime and fly ash) at different mellowing periods. Results of the testing
program are discussed in the subsequent sections.
Table 5.1 List of Variables
Description Variable
Soils Bells and FM-1417
Sulfate Contents Two (27,000 ppm and 24,000 ppm)
Stabilizer One (Lime and Class F fly ash)
Dosage One (4%L+8%FA)
Moisture Contents Two (Optimum, OMC and Wet of optimum, WOMC moisture content)
Mellowing Periods Two (0 days and 3 days)
5.1.1 Basic Properties
The basic tests performed are Atterberg limits, specific gravity, sieve analysis, hydrometer analysis,
sulfate content determination and Proctor compaction tests. Untreated and 4%L+8%FA-treated soils and
Proctor curves are presented in the appendix. Results of the basic testing are summarized in Tables 5.2
thru 5. 5.
Table 5.2 Atterberg Limits and Classification of Soils
Soil Atterberg Limits USCS
Classification LL PL PI
Bells 68 32 36 CH
FM-1417 72 30 42 CH
Table 5.3 Summary of Basic Tests
Soil Gradation, %
Gs Sulfate Content USCS Classification
Gravel Sand Silt Clay
Bells 0 15 18 67 2.65 27,000 CH
FM-1417 0 9 20 71 2.66 24,000 CH

137
Table 5.4 Sulfate Content Determination
Soil Location Soluble Sulfates, ppm Bells 27,000
FM-1417 24,000
Table 5.5 Summary of Proctor Tests on Natural Soils
Soil Type
Natural (Untreated) Soil
Moisture Content (%) Dry Density (lb/ft³)
OMC WOMC OMC WOMC Bells 21 28 93 88.3
FM-1417 27 34 89 84
5.1.2 Chemical Properties
The chemical tests performed were cation exchange capacity (CEC), specific surface area (SSA)
and total potassium (TP). Based on these chemical measurements, clay mineral distribution was
determined. Chemical properties and mineral distribution is presented in Table 5.6 and 5.7.
Table 5.6 Summary of Chemical Tests
Soil Cationic Exchange
Capacity (meq/100g)
Specific Surface Area
(m2/g) Total Potassium
(%)
Bells 76 170 1.4
FM-1417 65 280 0.8
Table 5.7 Percent Clay Minerals Observed for Soils under Study
Soil % Illite % Kaolinite % Montmorillonite
Bells 25 30 45
FM-1417 13 20 67

138
5.1.3 Volume Change Characteristics
Three dimensional volumetric swell and shrinkage tests were conducted on untreated soils and used as
a reference for comparison with volume changes in treated high sulfate soils at different periods of
mellowing and onset of sulfate and stabilization reactions. The following section describes the results of
the testing program.
5.1.3.1 Three Dimensional Volumetric Swell Test (3-D swell)
The 3-D free swell test measures the potential of the soil to swell in three (3) directions when soaked
under water. The three (3) values measured were vertical, radial, and volumetric strains. Vertical swell
was measured using a dial gauge placed at the top, and radial measurements were taken using pi tape at
the end of test. Two identical specimens are used for each variable condition (OMC and WOMC). Table 8
shows the vertical, radial and volumetric swell strains of natural soils. Tables 9 and 10 show the average
vertical, radial and volumetric swell strains of the 4%L+8%FA-treated soils at 0 and 3-day mellowing
periods. Volumetric swell strains for lime-treated soils at 0 and 3-day mellowing periods is shown in
Tables 5.11 and 5.12 respectively. Table 5.13 shows the summary of the volumetric swell tests on natural
and treated soils at different mellowing periods. Vertical strain vs. elapsed time curve for Bells and FM-
1417 soils at natural and treated condition (4%L+8%FA) are presented in Figures 5.1 and 5.2 respectively
for optimum moisture (OMC) condition. Volumetric swell strains of natural and treated soils at different
mellowing periods are shown in Figures 5.3 and 5.4.
Table 5.8 Vertical, Radial and Volumetric Swell Strains-Natural Soils
Soil Type Vertical Strain (%) Radial Strain (%) Volumetric Strain (%)
OMC WOMC OMC WOMC OMC WOMC
Bells 8.2 4.8 5.4 2.3 19 9.4
FM-1417 6.0 6.1 5.1 1.3 16.2 8.9

139
Table 5.9 Vertical, Radial and Volumetric Swell Strains-4%L+8%FA @ 0 days mellowing
Soil Type Avg. Vertical
Strain (%) Avg. Radial Strain (%)
Avg. Volumetric Strain (%)
OMC WOMC OMC WOMC OMC WOMC
Bells 4.7 3.8 2.9 2.4 10.5 8.6
FM-1417 4.6 4.0 2.3 1.9 9.2 7.8
Table 5.10 Vertical, Radial and Volumetric Swell Strains-4%L+8%FA @ 3 days mellowing
Soil Type Avg. Vertical
Strain (%) Avg. Radial Strain (%)
Avg. Volumetric Strain (%)
OMC WOMC OMC WOMC OMC WOMC
Bells 3.6 2.8 2.7 2.0 9 6.80
FM-1417 3.2 2.2 2.0 1.9 7.2 6.0
Table 5.11 Volumetric Swell Strains @ 0 day mellowing (4%L+8%FA)
Soil Type
Sample 1 Sample 2 Average Volumetric Swell Strain
(%) Volumetric Strain (%)
Volumetric Strain (%)
OMC WOMC OMC WOMC OMC WOMC
Bells 10.7 8.8 10.3 8.4 10.5 8.6
FM-1417 9.2 7.4 9.3 8.2 9.2 7.8

140
Table 5.12 Volumetric Swell Strains @ 0 day mellowing (4%L+8%FA)
Soil Type
Sample 1 Sample 2 Average Volumetric Swell Strain
(%) Volumetric Strain (%)
Volumetric Strain (%)
OMC WOMC OMC WOMC OMC WOMC
Bells 8.8 6.2 9.2 7.4 9 6.80
FM-1417 7.3 6.6 7.1 5.4 7.2 6.0
Table 5.13 Summary of Volumetric Swell Strains
Soil
Volumetric Swell (%)
Natural Soil 4%L+8%FA, 0 days Mellowing
4%L+8%FA, 3 days Mellowing
OMC WOMC OMC WOMC OMC WOMC
Bells 19 9.6 10.5 8.6 9 6.80
FM-1417 16.2 8.9 9.2 7.8 7.2 6.0

141
Figure 5.1 Vertical Swell vs. Elapsed Time (Bells Soil - 27,000 ppm)
Figure 5.2 Vertical Swell vs. Elapsed Time (FM-1417 Soil - 27,000 ppm)
0 40 80 120 160 200Elapsed Time, (Hours)
0
2
4
6
8
10
Bells OMCNatural4%L+8%FA 0 days4%L+8%FA 3 days

142
Figure 5.3 Volumetric Swell: Natural and Treated Bells Soil (27,000 ppm)
Figure 5.4 Volumetric Swell: Natural and Treated FM-1417 Soil (24,000 ppm)
It can be seen that in untreated condition, Bells and FM-1417 soils exhibited high swelling
potential, with volumetric strain close to 20%. These two soils have volumetric swell strains (for the OMC
0
5
10
15
20
BellsUntreated4%L+8%FA 0 day4%L+8%FA 3 day
OMC WOMC

143
condition) greater than than 10%, and this value indicates a high degree of expansion potential as per the
problematic volumetric swell characterizations mentioned by Chen (1988). In addition, these four soils
exhibited a PI value greater than 35.
With 0-day mellowing, combined lime and fly ash treatment yielded positive results in both the
soils. Observed volumetric swells in Bells and FM-1417 soils were 10.5% and 9.2% respectively. With 3-
day mellowing, swell strains further reduced in these soils. Measured swell strain values were 9% and
7.2% for Bells and FM-1417 soils, respectively. These swell strain levels can be considered as non-
problematic. Both Bells and FM-1417 soils have sulfate contents below 30,000 ppm and thus responded
positively for the lime and fly ash treatment. One of causes of treatment effectiveness is substitution of
portion of lime with low calcium fly ash. The effects of clay mineralogy and void ratios will be discussed in
the subsequent sections.
5.1.3.2 Three Dimensional Volumetric Shrinkage Test (3-D shrinkage)
Volumetric shrinkage tests were conducted to measure the decrease in the total volumetric
shrinkage strain of soil specimens due to the loss of moisture content from the compacted state to a
completely dry state. 3-D shrinkage tests were conducted on the 4%L+8%FA treated soils at different
mellowing periods. Volumetric shrinkage strains of natural soils are presented in Table 5.14. Volumetric
shrinkage strains at 0 day and 3 day mellowing periods are presented in Tables 5.15 and 5.16
respectively. Summary of volumetric shrinkage strains is presented in Table 5.17. Variation of volumetric
shrinkage strain with the mellowing period is depicted in Figures 5.5 and 5.6 for Bells and FM-1417 soils
respectively.
Table 5.14 Volumetric Shrinkage Strains of Natural Soils
Soil Average Volumetric Shrinkage Strain (%)
OMC WOMC
Bells -14.4 -19.6
FM-1417 -15.6 -20.6

144
Table 5.15 Volumetric Shrinkage Strains of 4%L+8%FA Treated Soils @ 0 day mellowing
Soil
Sample 1 Sample 2
Average Volumetric Shrinkage
Strain (%) Volumetric Shrinkage Strain (%)
Volumetric Shrinkage Strain (%)
OMC WOMC OMC WOMC OMC WOMC
Bells -6.9 -8.4 -7.3 -8.6 -5.3 -8.6 FM-1417 -7.5 -8.9 -7.7 -9.0 -5.8 -8.7
Note: Negative sign indicate shrinkage.
Table 5.16 Volumetric Shrinkage Strains of 4%L+8%FA Treated Soils @ 3 day mellowing
Soil
Sample 1 Sample 2 Average
Volumetric Shrinkage Strain (%) Volumetric Shrinkage
Strain (%) Volumetric Shrinkage
Strain (%)
OMC WOMC OMC WOMC OMC WOMC
Bells -9.8 -10.5 -9.7 -10.4 -6 -10.1
FM-1417 -6.4 -9.6 -6.1 -9.3 -6.3 -9.2 Note: Negative sign indicate shrinkage.
Table 5.17 Volumetric Shrinkage Strains Summary
Soil
Volumetric Shrinkage Strain (%)
Natural 0 day mellowing 3 day mellowing
OMC WOMC OMC WOMC OMC WOMC
Bells -14.4 -19.6 -5.3 -8.6 -6 -10.1 FM-1417 -15.6 -19.9 -5.8 -8.7 -6.3 -9.2

145
Figure 5.5 Volumetric Shrinkage Natural and Treated Bells Soil (27,000 ppm)
Figure 5.6 Volumetric Shrinkage Natural and Treated FM-1417 Soil (47,000 ppm)

146
It can be observed from Tables 5.14 thru 5.17 that the volumetric shrinkage strain is higher at wet
of optimum moisture content condition than at optimum moisture content condition. The reason for this
can be attributed to the presence of higher percentage of moisture availability in the soil specimen at wet
of optimum condition when compared to optimum moisture content condition. Also, both the soils in this
study are high plasticity clays, whose plasticity index (PI) values are greater than 40. These soils are
capable of high swelling during the rainy season, as well as shrinkage during dry, summer-like conditions.
In 4%L+8%FA-treated soils, volumetric shrinkage strains invariably decreased. Shrinkage strains
in Bells and FM-1417 soils were 5.3% and 5.8% respectively. Also, in both Bells and FM-1417 soils, there
was a slight increase in volumetric shrinkage strain with 3-day mellowing when compared to the same at
0-day mellowing. Shrinkage strains in this case were 6% and 6.3% for Bells and FM-1417 soils
respectively. The reasons for higher shrinkage in 3-day mellowed samples could be attributed to higher
moisture content provided (additional 3% to cater for moisture loss during mellowing) for the 3-day
mellowed soils. Overall, it can be concluded that presence of sulfates do not have any significant effect
on volumetric shrinkage strain behavior of soils since shrinkage reduced in all the cases upon combined
lime and fly ash treatment.
5.1.4 Strength Characteristics
Unconfined compression strength (UCS) tests were conducted on untreated soils and used as a
reference for comparing the strength changes in treated high sulfate soils at different periods of mellowing
onset of sulfate and stabilization reactions. Following section describes the results of the testing program.
5.1.4.1 Unconfined Compression Strength (UCS) Tests
The Unconfined Compression Strength (UCS) tests were conducted as per ASTM D 2166 method. The
tests were conducted on compacted soil specimens of 2.8 inches in diameter and 5.6 inches in height.
UCS tests were conducted on treated soils with different mellowing periods at two moisture conditions
(OMC and WOMC) on two identical specimens. 4%L+8%FA-treated samples were allowed to mellow for
0 and 3 days. After the elapsed time periods, samples were compacted and cured in a 100% humidity

147
room for 7 days. Results of the UCS testing on natural soils are presented in Table 5.18. Table 5.19 and
Table 5.20 and show the UCS strengths of treated soils at 0-day and 3-day mellowing. Table 5.21 shows
the summary of UCS tests. Figures 5.7, 5.8, 5.9 and 5.10 show the load versus deformation curve for
natural and treated soils at different mellowing periods.
Table 5.18 UCS Tests Results (Natural Soils)
Soil
Sample 1 Sample 2 Average UCS Strength, psi
UCS Strength, psi
UCS Strength, psi
OMC WOMC OMC WOMC OMC WOMC
FM-1417 31.3 19.3 33.3 17.7 32.3 18.5
Bells 28.5 18 33.1 17.6 30.8 17.8
Table 5.19 UCS Tests Results (4%L+8%FA, 0days mellowing)
Soil
Sample 1 Sample 2 Average UCS, psi UCS , psi UCS psi
OMC WOMC OMC WOMC OMC WOMC
FM-1417 82.8 66.4 91.6 64.8 87.2 65.6
Bells 76.8 51 82.8 54.2 79.8 52.6
Table 5.20 UCS Tests Results (4%L+8%FA, 3 days mellowing)
Soil
Sample 1 Sample 2 Average UCS, psi
UCS Strength, psi
UCS Strength, psi
OMC WOMC OMC WOMC OMC WOMC
FM-1417 79.8 49.6 81.8 55.2 80.8 52.4
Bells 77.4 52.3 71.8 50.1 74.6 51.2

148
Table 5.21 Summary of UCS Test Results
Soil
UCS Strength, psi
Natural
4%L+8%FA_0 days
4%L+8%FA_3 days
OMC WOMC OMC WOMC OMC WOMC
FM-1417 32.3 18.5 87.2 65.6
80.8 52.4
Bells 30.8 17.8 79.8 52.6
74.6 51.2
Figure 5.7 UCS Curve for Bells Soil @ OMC (27,000 ppm)

149
Figure 5.8 UCS Curve for Bells Soil @ wOMC (27,000 ppm)
Figure 5.9 UCS Curve for FM-1417 Soil @ OMC (24,000 ppm)

150
Figure 5.10 UCS Curve for FM-1417 Soil @ WOMC (24,000 ppm)
UCS strengths for untreated and 4%L+8%FA treated soils varied from 30.8 psi to 87.2 psi. For
untreated condition, FM-1417 soil (32 psi) showed higher strength compared to Bells soil (30.8 psi). From
the UCS test results, it can be seen that the UCS strengths of 4%L+8%FA-treated soils were two to three
times higher than the untreated soils. Another important observation is that the UCS values of the 3-day
mellowed samples were slightly lower than those of the 0-day mellowed samples. This strength loss can
be attributed to the higher moisture content provided in mellowed samples and maximum dry density
changes (low compaction density achieved due to mellowing) during the mellowing process. The loss in
strength due to mellowing is still insignificant since the mellowed strength is considerably higher than the
untreated soils strength.
5.1.4.2 1-D Swell Pressure Tests
The 1-D swell pressure test was conducted using the 1-D consolidation setup as per ASTM method
(D4546-08 Standard Test Methods for One-Dimensional Swell or Collapse of Cohesive Soils). 1-D swell
pressure tests were conducted on Bells and FM-1417 soils at natural and treated conditions at optimum

151
and wet of optimum moisture conditions. Untreated swell pressures are presented in Table 5.22. Results
of swell pressure testing are reported in Table 5.23 and Table 5.24 respectively for 0-day and 3-day
mellowed soils. Table 5.25 shows the summary of swell pressures for natural and 4%L+8%FA-treated
soils.
Table 5.22 Swell Pressures of Untreated Soils
Soil Average Swell Pressure, psi
OMC WOMC
Bells 36.4 22.3
FM-1417 37.1 16.2
Table 5.23 Swell Pressure of 4%L+8%FA Treated Soils @ 0 day mellowing
Soil Type
Sample 1 Sample 2 Average Swell Pressure, psi
Swell Pressure, psi
Swell Pressure, psi
OMC WOMC OMC WOMC OMC WOMC
Bells 16.4 7.1
16.5
7.3 16.4 7.2
FM-1417 19.4 9.2
18.7
9.4 19.2 9.3
Table 5.24 Swell Pressure of 4%L+8%FA Treated Soils @ 3 day mellowing
Soil Type
Sample 1 Sample 2 Average Swell Pressure, psi
Swell Pressure, psi
Swell Pressure, psi
OMC WOMC OMC WOMC OMC WOMC
Bells 11.3 3.7
11.1
3.3
11.2
3.5
FM-1417 14.0
5.2
11.6
4.0
12.8
4.6

152
Table 5.25 Summary of Swell Pressures
Soil Type
Swell Pressure, psi
Untreated 4%L+8%FA, 0 day 4%L+8%FA, 3 day
OMC WOMC OMC WOMC OMC WOMC
Bells 36.4 22.3 16.4 7.2 11.2 3.5
FM-1417 37.1 16.2 19.2 9.3 12.8 4.6
It can be seen from the untreated swell data that both Bells and FM-1417 soils showed swell
pressures which are indicative of expansive soils. Both the soils are high plasticity clays (CH) with
plasticity index greater than 35. Bells and FM-1417 soils are dominant in the mineral Montmorillonite,
which is a highly expansive mineral. The observed swell pressures were 36.4psi for Bells soil and 37.1psi
for FM-1417 soil respectively. The observed swell pressures are in line with the volumetric swells
measured from the 3-D swell tests.
In 4%L+8%FA-treated soils, with 0-day mellowing, the swell pressures of both soils were below
the natural swell pressure. Combined lime and fly ash treatment successfully reduced the swell pressure
in this case. The observed sell pressures were 16.4psi and19.1psi for Bells and FM-1417 soils
respectively. With 3-day mellowing, 4%L+8%FA treatment reduced the swell further. The swell pressures
recorded were 11.2 psi and 12.8 psi respectively for Bells and FM-1417 soils. The recorded swell
pressures were in good agreement with the volumetric swell obtained from the 3-D swell tests. Another
important observation is that both Bells and FM-1417 soils have sulfate contents below 30,000 ppm and
responded positively to the 4%L+8%FA treatment.
5.1.5 Mineralogical Studies
Reactive alumina and silica measurements were made on both natural and treated soils at different
mellowing periods to study the role of alumina and silica presence in sulfate heave and chemical
stabilization reactions.

153
5.1.5.1 Reactive Alumina and Silica Measurements
Reactive alumina and silica measurements were conducted using ICP_MS (Inductively Coupled Plasma
Mass Spectroscopy) on treated soils at different mellowing periods. Table 5.26 shows the reactive
alumina and silica of the soils in natural condition. Reactive alumina and silica of 4%L+8%FA- treated
soils at different mellowing periods is presented in Table 5.27. A summary of reactive alumina and silica
measurements is given in Table 5.28.
Table 5.26 Reactive Alumina and Silica Measurements Natural Soils
Soil Reactive Alumina (ppm) Reactive Silica (ppm)
Bells 370.2 434.7
FM-1417 279.2 137.3
Table 5.27 Reactive Alumina and Silica Measurements @ 0 day and 3 day mellowing
Soil
0 day mellowing 3 day mellowing
Al* (ppm)
Si* (ppm)
Al loss (%)
Si loss (%)
Al* (ppm)
Si* (ppm)
Al loss (%)
Si loss (%)
Bells @ OMC 270.2 126.0 27 71 275.6 130.3 25.6 70.0
Bells @ WOMC 281.0 134.8 24.1 69 289.2 141.3 21.9 67.5
FM-1417 @ OMC 182.0 58.6 34.8 57.3 186 63.1 33.4 54.0
FM-1417 @ WOMC 189.0 67.9 32.3 50.5 194 70.2 30.5 48.9
Table 5.28 Summary of Reactive Alumina and Silica Measurements (at OMC)
Soil Natural 0 day mellowing 3 day mellowing
Al Si Al Si Al Si
Bells 370.2 434.7 270.2 126.0 275.6 130.3
FM-1417 279.2 137.3 182.0 58.6 186 63.1

154
From Table 5.26, it can be observed that both Bells and FM-1417 soils have high alumina and
silica contents. Presence of higher alumina and silica indicate higher sulfate and stabilization reactions.
Presence of higher silica content in both the soils causes the dominance of pozzolanic reactions over the
Ettringite formation reactions. It was reported in the literature that silica released during the hydration
reactions consumes the calcium, forming the pozzolanic compounds and thereby robbing the constituents
required for Ettringite reactions (Tasong et al., 1999).
The percentage loss of alumina and silica due to lime treatment at different mellowing periods
was also calculated and compared with the natural alumina and silica contents. The alumina and silica
loss was higher at OMC compared to WOMC for both the soils considered in the study. Also, the loss of
alumina and silica was higher at 0-day mellowing period compared to the 3day mellowing period. The
observed volumetric swells were higher in 0-day mellowed soils than the 3-day mellowed soils.
Another important observation is that the loss of silica in was higher than the loss of alumina in
4%L+8%FA-treated soils at both 0 day 3-day mellowing periods. Both the soils could be stabilized
successfully using the combination of lime and fly ash. In combined lime and fly ash systems, the
availability of calcium is limited by the replacement of lime with fly ash. The presence of higher silica and
high silica losses in treated soils means the stabilization compounds were formed in the early periods of
hydration, leading to the strengthening of the soil matrix in both the soils. This is the reason why both the
soils could be stabilized successfully using 4%L+8%FA.
5.2 Discussion
The two high sulfate soils considered in the current study could be stabilized successfully using the pre-
compaction mellowing technique. These two soils (Bells and FM-1417) have sulfate contents below
30,000 ppm. The effect of clay mineralogy and compaction void ratios was studied and presented in the
following section.
5.2.1 Effect of Compaction Void Ratio on Swell Strains
To study the effect of compaction void ratio (e) on swell behavior, void ratios of the tests soils in
compacted state were calculated. Using the specific gravity and maximum dry density from the Proctor

155
curve, void ratios of the test soils were calculated at both optimum moisture content (OMC) and wet of
optimum moisture content (WOMC). Void ratios of the test soils are presented in Table 5.29.
Table 5.29 Void Ratios of Test Soils
Soil Sulfate Level, ppm
Compaction Void Ratio (e)
OMC WOMC
Bells 27,000 0.80 0.90
FM-1417 24,000 0.86 0.96
From Table 25, it can be seen that both the Bells and FM-1417 soils have high void ratios. High
void ratio means less dense soil matrix. Also due to mellowing, maximum dry density decreases, which
means the soil matrix has more void space to accommodate the Ettringite formation and growth. The
sulfate contents in both the soils are below 30,000 ppm. The reason for effectiveness of combined lime
and fly ash treatment could be attributed to one of the following: either whole sulfate has been consumed
during the mellowing process or combined lime and fly ash treatment resulted in early pozzolanic
reactions which dominated the Ettringite formation reactions leading to lower swell magnitudes.
Combination of high void ratios, sulfate contents below 30,000 ppm are the reasons why mellowing is
effective in these two soils.
5.2.2 Effect of Clay Mineralogy on Swell Strains
Clay mineralogy of the test soils was determined from the cation exchange capacity (CEC),
specific surface area (SSA) and total potassium (TP) measurements. Determination of clay mineralogy
gives an insight into what types of clay minerals are present and their reactivity with respect to pozzolanic
and sulfate reactions. Clay mineral distribution of the test soils is presented in Table 30.

156
Table 5.30 Percent Clay Minerals Observed for Soils under Study
Soil Region % Illite % Kaolinite % Montmorillonite
Bells 25 30 45
FM-1417 13.2 20.3 66.5
From Table 27, it can be seen that both Bells and FM-1417 soils have mineral Montmorillonite
dominance in them. It was reported in the literature that mineral Montmorillonite releases less alumina
during hydration reactions compared to mineral Kaolinite (Dermatas, 1995). Dominance of
Montmorillonite mineral, high void ratios, low calcium availability (due to class F fly ash addition) and
sulfate contents below 30,000 ppm could be the reasons for success of mellowing in Bells and FM-1417
soils.
5.3 Observations
The following observations were drawn from the on-going combined lime and fly ash treatment studies.
1. Volumetric shrinkage decreased with combined lime and fly ash treatment in high sulfate
soils and hence shrinkage is not an issue.
2. Effect of strength loss due to mellowing is insignificant since the 4%L+8%FA treated soils
exhibited much higher strengths than the untreated samples.
3. Two high sulfate soils considered in the current study could be stabilized using “pre-
compaction” mellowing technique. Swell strains in these soils reduced below natural
level with mellowing.
4. The two soils (Bells and FM-1417) have sulfate contents below 30,000 ppm and
contained high void ratios and these also resulted in lesser sulfate induced heaving after
chemical treatment.
5. Montmorillonite dominance is one of the reasons for mellowing effectiveness in both
Bells and FM-1417 soils.

157
CHAPTER 6
SWELL PREDICTION MODELS
6.1 Introduction
Swell tests conducted on lime treated high sulfate soils indicated that these soils are prone to
“Ettringite Induced Heaving” when treated with calcium based stabilizers. In the first part of the research
program, pre-compaction mellowing technique with two different mellowing periods (3 days and 7 days)
was used to stabilize high sulfate soils (sulfate contents > 8,000 ppm). Results of the testing indicated
that mellowing was effective in four of the six soils considered in the current study. The two soils that
could not be stabilized even at higher mellowing periods are Austin and Childress soils. The applicability
of mellowing technique in four of the six soils is explained using the Gibbs free energy calculations and
mass volume relationships.
In the second part of the research program, two soils with sulfate contents above 20,000 ppm are
considered for the combined lime (L) and fly ash (FA) treatment. These soils were treated with 4%L and
8%FA and subjected to swell tests at 0 day and 3 day mellowing periods. Results of the swell tests
indicated that the combined lime and fly ash treatment effectively reduced volumetric swells below natural
levels. The two soils considered in this study contained sulfate contents below 30,000 ppm and hence are
good candidates for this analysis. In addition to effective treatment by lime-fly ash, high void ratios of
these two soils may have contributed to less heaving as such voids could accommodate any Ettringite
formation and its growth within the soil void matrix.
In this section two swell prediction models based sulfate contents and compaction void ratios are
presented. Swell prediction model developed based on the sulfate content value using an approach
outlined by Little et al. (2010) is presented and comparisons are made between the predicted volumetric
swell and measured volumetric swell strains. Based on the mass volume calculations and initial
compaction void ratio of the soils, swell prediction model based on threshold void ratio frame work and
threshold void ratios for 3 day and 7 day mellowing periods are presented in the last section of the
chapter.

158
6.2 Swell Prediction Models
In this section, two models for swell prediction are presented. The first model is based on the
sulfate contents. Since sulfate content is the main constituent of Ettringite formation reactions, it is used
as the limiting reagent for prediction of swell. In the second model, threshold void ratio and sulfate content
of the soil are used to predict the Ettringite-induced heaving in treated high sulfate soils.
6.2.1 Swell Prediction Model Based on Sulfate Content of the Soil
Using sulfates as the limiting reagent, Dallas et al., 2010 calculated maximum possible Ettringite
formation in any soil system using stoichiometric calculations. Their calculations were based on 1%
soluble sulfates (10,000 ppm or 10,000 mg/Kg) of the natural soil. The calculations were also based on
the assumption that the entire available sulfate is consumed during the Ettringite formation reactions,
which may not be true. For higher sulfate concentrations, the maximum possible Ettringite can be
calculated by expressing the sulfate concentration in the order of 10,000 ppm and multiplying. The
following methodology is adopted for calculation of maximum volumetric swell strains: 3 moles of sulfate
(SO4) is consumed in the formation of 1 mole of Ettringite as per the flowing chemical reaction:
6 + 2 ( ) + 4( ) + 3 + 26 → ( ) . ( ) . 26 (1) Based on the molar volume calculations, the maximum possible Ettringite percent based on the dry
weight of soil can be estimated based on the following steps:
Step 1: 1% soluble sulfates is equivalent to 10 g of SO4/1000 g of soil
Step 2: 1 mole of SO4 is equivalent to 96 g of SO4
Step 3: 3 moles of SO4 participates in the reaction to from 1 mole of Ettringite
Step 4: 1 mole of Ettringite, E weighs 1254 gm
Combining Steps 1 to 4 we have,
10 1000 1 96 1 3 1254 1 = 4.36 100 = 4.36%

159
Volume change or volumetric swell/shrinkage strain due to formation of Ettringite mineral can be
calculated as the ratio of difference between the molar volume of products and reagents divided by the
molar volume of reagents and this strain is expressed as a percentage. Based on these calculations it
was observed that if the Ettringite formation reaction consumes water from the soil matrix, then the
resultant volume change in the soil is usually shrinkage since the molar volume of reagents is higher. If
the water required for Ettringite formation is derived from outside the soil matrix then the resultant volume
change in the soil is expansion or soil heave. This is explained by the Dallas et al., 2010 as follows:
Ettringite formation reactions can be shown as:
+ 3 ̅ + 26 → . 3 ̅ . (2) Where, C3A is Tricalcium Aluminate; CSH2 is Gypsum; H is water and C3A.3CSH2.H26 is Ettringite.
From Stoichiometry, for 1 mole of Ettringite formation, 1 mole of C3A (Tricalcium Aluminate), 3
moles of CSH2 (Gypsum) and 26 moles of H (Water) are required. Molar volume of C3A is 89.1cm3/mol,
CSH2 is 74.2cm3/mol, H2O is 18.02cm3/mol and Ettringite is 737.6cm3/mol. The volume change
(Volumetric strain, V %) within the soil matrix when one mole of C3A combines with 3 moles of Gypsum to
form Ettringite by consuming water within the soil matrix can be given as:
= × 100(3)
Where, V = Volumetric Strain (%), MVp = Molar Volume of Products, MVr = Molar Volume of Reagents.
Now, Equation 8 can be used to calculate the volumetric strain for matrix water source (VM) and external
water source (VE) as follows: = (737.6 − 311.7 − 468.52 780.22⁄ ) × 100 = −5%(4) In Equation 9, volumetric strain in negative sign indicates potential shrinkage strain of Ettringite. However,
when the water is consumed, in the Ettringite formation, which is derived from outside the soil matrix, the
molar calculations indicate volume increase (swell) instead of shrinkage. This is represented in Equation
5. = ((737.6 − 311.7) 311.7⁄ ) × 100 = 137%(5)

160
In Equation 5, volumetric strain in positive sign indicates swelling of Ettringite. It can be observed
that the Ettringite formation is accompanied by the expansion of the soil system in which it forms since
the molar volume of products (Ettringite) is greater than the molar volume of reactants. This expansion is
observed as most of the sulfate heave case histories in the literature reported heaving following a
continuous rainfall event after the construction.
Based on this assumption Dallas et al. (2010) calculated the maximum possible volume change
in soil due to the formation of Ettringite mineral as 137% (expansion). For a soil with 10,000 ppm of
sulfates from Equation 7 we have the maximum possible Ettringite that can be formed as 4.36%E. From
volume change calculations it is known that Ettringite mineral formation is accompanied by 137%
expansion. Hence the maximum possible soil swelling from Ettringite mineral formation and expansion is
calculated as = 4.36% X 1.37= 5.97% (10,000 ppm of sulfates lead to formation of 4.36% E and 1 mole of
Ettringite causes 137% expansion). As mentioned above, swell calculations based on sulfate content
alone assuming the entire available sulfates are consumed in the Ettringite formation reaction may not be
practical. With this objective in the current swell prediction model “effective sulfate” content rather than
the actual sulfate content is used. For idealized condition, the maximum possible Ettringite formation and
the corresponding shrinkage/swell strains for the soils considered in the current study are presented in
Table 7.13. The following assumptions are made in the calculation of maximum possible swell strains
using the current model:
1. Sulfate content is the only factor influencing the formation of Ettringite.
2. It is assumed that the amount of sulfates lost during the swelling process is the amount
of sulfates that contributed towards the Ettringite induced soil swelling. Sulfate
measurements were conducted on the treated soil samples after they were subjected to
swell testing. The final sulfate content is deducted from the natural sulfate content to
obtain the “effective sulfate content” that actually participated in the Ettringite formation
reaction.
3. In the current swell prediction model based on the “effective sulfate content” approach,
sulfate contents at 0 day mellowing were not considered since the treated volumetric

161
swell strains at 0 day mellowing (or no mellowing) are higher than the natural swell in all
the soils considered except Austin soil.
Natural sulfate contents and effective sulfate contents at 3 day and 7 day mellowing periods are
presented in Table 6.1and 6.2 at optimum (OMC) and wet of optimum moisture contents (WOMC) and
these results are used in the current modeling analysis.
Based on the effective sulfate contents the maximum possible volumetric swell due to Ettringite
formation is calculated at 3 day and 7 day mellowing periods. Table 6.3 and 6.4 shows the measured
swell strains (from lab studies) and predicted swell strains based on the swell prediction model for 3 day
and 7 day mellowed soils respectively. Comparison of measured and predicted volumetric swell for 0 and
7 day mellowing periods is presented in Figures 6.1 and 6.2.
Table 6.1 Swell/Shrinkage Predictions based on Idealized Model
Soil Natural Sulfate Content (ppm)
Ettringite Formed (%)
Water from the matrix
Water outside the matrix
Unit Volume Change
(%)
Total Shrinkage
Strain (%)
Unit Volume Change
(%)
Total Swell Strain
(%)
Austin 36,000 15.70 -0.05 -0.78 1.37 21.50
Childress 44,000 19.18 -0.05 -0.96 1.37 26.28
Dallas 12,000 5.23 -0.05 -0.26 1.37 7.17
FM-1417 24,000 10.46 -0.05 -0.52 1.37 14.34
Riverside 20,000 8.72 -0.05 -0.44 1.37 11.95
US-82 12,000 5.23 -0.05 -0.26 1.37 7.17

162
Table 6.2 Effective Sulfate Contents of Treated Soils
(@ 3 and 7 day mellowing periods)
Soil Natural Sulfate Content (ppm)
Effective Sulfate Content (ppm) 3 day mellowing 7 day mellowing
OMC WOMC OMC WOMC
Austin 36,000 24480 24520 18720 18900 Childress 44,000 19800 20000 15840 15960
Dallas 12,000 9600 10000 9000 9400
FM-1417 24,000 17280 17500 12000 12400
Riverside 20,000 13800 14000 11600 11800
US-82 12,000 9480 9600 8520 8700
Table 6.3 Measured vs. Predicted Swell Strains
(3 day mellowing period)
Soil 3 day mellowing
Measured Swell (%) Predicted Swell (%)
OMC WOMC OMC WOMC Austin 11.6 9.8 14.6 14.6
Childress 10.2 8.5 11.8 11.9
Dallas 10.4 6.4 5.7 6.0
FM-1417 10.2 7 10.3 10.5
Riverside 9 8.4 8.2 8.4
US-82 11.3 6.7 5.7 5.7

163
Table 6.4 Measured vs. Predicted Swell Strains
(7 day mellowing period)
Soil
7 day mellowing
Measured Swell (%) Predicted Swell (%)
OMC WOMC OMC WOMC
Austin 18.2 12.1 11.2 11.3
Childress 11.2 9.9 9.5 9.5
Dallas 9 6.9 5.4 5.6
FM-1417 6.7 5.4 7.2 7.4
Riverside 7.2 5.3 6.9 7.0
US-82 9.8 6.3 5.1 5.2

164
Figure 6.1 Measured vs. Predicted Swell Strains (OMC); Sulfate Content Based Model

165
Figure 6.2 Measured vs. Predicted Swell Strains (WOMC); Sulfate Content Based Model

166
From the Figures 6.1 and 6.2 it can be seen that at optimum moisture content (OMC) the data
points are scattered with respect to the control 1:1 line whereas at wet of optimum moisture content, the
data points are slightly closer to the control line. Also, in all the test soils at 7 day mellowing the predicted
swell strains decreased when compared to 3 day mellowing periods since the predicted swell strain is
directly related to the sulfate content present in the soil. This is not true in case of measured swell values
since in Austin and Childress soils the measured swell values increased with 7 day mellowing. To
address all the six soils considered for the current study, these two soils are also included in the current
analysis.
Another important observation is that the predicted swell is higher at wet of optimum compared to
optimum moisture content due to higher sulfate contents which is converse to the actual observations.
From the analysis above it can be concluded that the swell prediction based on sulfate contents is only an
indicator but not actual representation of the real field swell.
The above mentioned analysis for prediction of maximum possible swell strain is based on the
reactive sulfate content only. It can be seen from the Equation 1 that Ettringite formation is dependent on
the alumina concentration in the treated soil. To study the effects of alumina content alone on the
Ettringite formation reaction, similar type of analysis is performed in the current study. For the soils
considered in the current study, the maximum amount of Ettringite that could be formed is calculated as
0.196% which is 20 times lower than amount of Ettringite formed based on sulfate content (4.36%).
Hence, it is understood that Ettringite swell strain is more dependent on the sulfate contents than alumina
content. Other important factors such as compaction void ratio that influence Ettringite induced heave are
discussed in the heave assessment studies.
6.2.2 Swell Prediction Model Based on Threshold Void Ratio Frame Work
Based on the experimental data and mass volume calculations the ‘Threshold’ void ratios for
Ettringite induced heaving are derived and presented in the current model. The two most important
factors that influence the Ettringite induced heave are sulfate contents and compaction void ratios. When
the sulfate contents are high and void space is low it is likely that Ettringite induced heave occurs. Hence
the effect of both parameters needs to be included in the analysis. Effect of mellowing on Ettringite

167
induced heaving in lime treated high sulfate soils is included in the current model. The following steps are
followed in establishing the threshold void ratio frame work for treated soils.
Step 1: Sulfate content of the soil in ppm or mg/Kg is converted as the ratios of volume of sulfate
(Vsulfate) and volume of soil (Vsoil) as:
= . ∗ 10 ∗ (6) Step 2: Based on the unit phase diagram approach, initial void volume per ft3 of soil (Vvi) is
calculated from the void ratios at optimum (OMC) and wet of optimum (WOMC) moisture contents
as follows:
( ) = = − (7) − = 1(8) = 1 + 1(9)
= 11 + 1 (10) = 11 + 1 ; ( = 1, )(11)
Step 3: From Table 4.27 and 4.28, the volume of Ettringite per ft3 (Ve) of treated soil at both
optimum and wet of optimum moisture contents are obtained. Ratio of the Ve and Vvi is calculated.
If the ratio is greater than one, the Ettringite cannot be accommodated in the void space of the
soil and hence higher swelling is observed. For ratios less than unity the Ettringite swell is not
observed. Ratio of Ve and Vvi equal to one is considered as the basis for choosing the threshold
void ratio.
Step 4: Ratio between Ve/Vvi and Vsulfate/Vsoil is plotted and a horizontal line is drawn at the Ve/Vvi
equal to one and where the horizontal line touches the trend line, a vertical line is dropped from
that point to the horizontal axis and the value of Vsulfate/Vsoil is read from the plot.

168
A sample calculation of Vsulfate/Vsoil and Ve/Vvi for Austin soil at 3 day mellowing period is given
below:
Sulfate Concentration 36,000 ppm; = 1696.1 kg/m3; = 2300 kg/m3; e = 0.54; Ve= 0.49
(From Table 12)
= 36000 ∗ 102300 ∗ 1696.1 = 0.0265
= 11 + 1 = 11 + 10.54 = 0.35
= 0.490.35 = 1.397
These parameters are presented in Table 6.5 and 6.6 at optimum and wet of optimum moisture contents
for 3 day mellowed soils. Plots between Vsulfate/Vsoil and Ve/Vvi at optimum and wet of optimum moisture
contents are presented in Figures 6.3 and 6.4 respectively. Similar analysis was performed on 7 day
mellowed samples. Vsulfate/Vsoil and Ve/Vvi are presented in Table 6.7 and 6.8 at optimum and wet of
optimum moisture content for 7 day mellowed soils. Plot between Vsulfate/Vsoil and Ve/Vvi at optimum and
wet of optimum moisture contents are presented in Figures 6.5 and 6.6 respectively for 7 day mellowed
soils.
Table 6.5 Vsulfate/Vsoil and Ve/ Vvi at OMC (3 day mellowing)
Soil Vsulfate/Vsoil Ve/Vvi
Austin 0.026 1.397
Childress 0.031 1.695
Dallas 0.007 0.767
FM-1417 0.014 0.908
Riverside 0.013 0.950
US-82 0.007
6
0.666
Note: Vsulfate = Volume of Sulfate; Vsoil = Volume of Soil; Ve = Volume of Ettringite; Vvi = Initial Void Volume

169
Table 6.6 Vsulfate/Vsoil and Ve/ Vvi at WOMC (3 day mellowing)
Soil Vsulfate/Vsoil Ve/Vvi
Austin 0.025 1.097
Childress 0.030 1.227
Dallas 0.007 0.623
FM-1417 0.014 0.510
Riverside 0.012 0.980
US-82 0.007 0.525
Note: Vsulfate = Volume of Sulfate; Vsoil = Volume of Soil; Ve = Volume of Ettringite; Vvi = Initial Void Volume
Table 6.7 Vsulfate/Vsoil and Ve/ Vvi at OMC (7 day mellowing)
Soil Vsulfate/Vsoil Ve/Vvi
Austin 0.026 1.425
Childress 0.031 1.715
Dallas 0.007 0.656
FM-1417 0.014 0.854
Riverside 0.013 0.908
US-82 0.007 0.588
Note: Vsulfate = Volume of Sulfate; Vsoil = Volume of Soil; Ve = Volume of Ettringite; Vvi = Initial Void Volume

170
Table 6.8 Vsulfate/Vsoil and Ve/ Vvi at WOMC (7 day mellowing)
Soil Vsulfate/Vsoil Ve/Vvi
Austin 0.025 1.250
Childress 0.030 1.305
Dallas 0.007 0.598
FM-1417 0.014 0.490
Riverside 0.012 0.945
US-82 0.007 0.485
Note: Vsulfate = Volume of Sulfate; Vsoil = Volume of Soil; Ve = Volume of Ettringite; Vvi = Initial Void Volume

171
Figure 6.3 Vsulfate/Vsoil vs. Ve/Vvi at OMC (3 days mellowing)
Threshold Sulfate Concentration: 24,500 ppm

172
Figure 6.4 Vsulfate/Vsoil vs. Ve/Vvi at WOMC (3 days mellowing)

Figure 6.5 VVsulfate/Vsoil vs.
173
Ve/Vvi at OMC
C (7 days meellowing)

174
Figure 6.6 Vsulfate/Vsoil vs. Ve/Vvi at WOMC (7 days mellowing)

175
From Figures 6.3 and 6.4 it can be seen that for 3 day mellowing, at VEttringite/Vvintial equal to one,
the threshold value of Vsulfate/Vsoil is 0.015 and 0.022 at optimum and wet of optimum moisture contents
respectively. Any point falling beyond the threshold value (on both axes) indicates the risk of Ettringite
induced heaving. The threshold sulfate content is back calculated from the soils unit weight and gypsum
unit weight. The threshold sulfate content at OMC for 3 day mellowing is 24,500 ppm.
Also, in case of 7 day mellowed soils, the threshold value of Vsulfate/Vsoil is 0.016 and 0.020 at
optimum and wet of optimum moisture contents respectively. For 7 day mellowed soils, the threshold
sulfate level at OMC is calculated as 26,000 ppm. Based on Figures 6.3, 6.4, 6.5, 6.6 Austin and
Childress soils fall beyond the threshold values. These are the two soils that could not be stabilized at
both 3 day and 7 day mellowing periods. These Figures are developed based on the experimental studies
conducted on six soils collected from Texas. Experimental data comprising of different soil series and
sulfate contents can be used to develop generic charts for prediction of Ettringite induced heaving in soils
with high sulfate contents.
6.3 Summary & Conclusions
The following conclusions are drawn from the present modeling and analyses.
1. Swell prediction based on sulfate content could be misleading since soils with high
sulfate contents give higher swell values and vice versa which is not true in reality.
2. Threshold void ratio frame work can be used to predict Ettringite induced heaving in
chemically treated high sulfate soils at different mellowing periods.
3. Using the threshold void ratio framework, the threshold sulfate content at 3 day
mellowing is 24,500 ppm.
4. The threshold sulfate content at 7 fay mellowing period is 26,000 ppm.

176
CHAPTER 7
TIME RATE OF ETTRINGITE FORMATION
7.1 Introduction
In the current research, six different soils with varying sulfate contents were collected from the
state of Texas. Soils with sulfate contents below 8,000 ppm were spiked with additional sulfate in the form
of gypsum. These soils were treated with lime and allowed to mellow for a period of 0, 3 and 7 days. After
mellowing, these soils were subjected to swell tests to witness the volumetric changes in treated sulfate-
bearing soils. Swell tests indicated that these soils are prone to Ettringite-induced heaving at 0-day
mellowing. At higher mellowing periods, four of the six soils were stabilized effectively. The reasons for
ineffectiveness of mellowing in two soils were explained as very high sulfate contents (> 30,000 ppm), low
reactive alumina and silica contents and low void ratios. In order to study the time rate of Ettringite
formation and subsequent material softening, the following study was considered, and the study details
are presented here.
A test methodology was used for assessing the time rate of Ettringite formation and subsequent
material property degradation in chemically-treated high sulfate soils. Previous research conducted at
The University of Texas at Arlington (UTA) showed that Ettringite formation and its subsequent growth on
hydration results in reduction of small strain shear moduli properties (Kadam, 2003; Puppala et al., 2006).
Hence, determination of small strain shear moduli (Gmax) could be one way to assess the destabilizing
mechanisms in chemically treated high sulfate soils. Also, the Ettringite reactions were dominant in soils
that were cured by submerging in water (complete saturation) compared to the soils cured in a humidity
room. In the current study, natural and 6% lime treated soils (without mellowing) were compacted at
optimum and wet of optimum moisture contents and small strain shear moduli measurements were
conducted at different time periods. Though the Ettringite reactions are absent in untreated soils, shear
modulus measurements were conducted to compare the untreated and treated shear modulus values.

177
For complete saturation and uninhibited Ettringite growth reactions to occur, the test samples were
submerged in water and shear moduli measurements were conducted periodically.
7.1.1 Small Strain Shear Moduli (Gmax) Measurements
In this section, the calculation of small strain shear moduli using the shear wave velocity is presented.
Test soils were mixed with the moisture content obtained from the proctor test results and compacted
using the Gyratory Compacter Machine. In the lime- treated soils, lime was mixed with soils prior to the
addition of water, then compacted. The compacted samples were 4 inch in dia. and 4.6 inch in height.
These samples were covered with a rubber later membrane, and porous stones were placed at the top
and bottom of the samples and placed in a water bath for complete saturation. Following the saturation,
small strain shear modulus measurements were conducted on the natural and treated soil samples.
The soil samples are taken out of the water bath and porous stones were removed. Bender elements
were immersed into the soil sample at top and bottom to measure the shear wave velocity and shear
moduli. One of the bender elements is connected at the top of the sample and acts as the signal
generator. Other bender element is connected to the base of the sample and acts as a signal receiver.
Sinusoidal pulse is sent from the transmitting end and the receiving signal is collected and analyzed for
the time of travel of the shear wave thru the material (treated high sulfate soil specimen in this case). The
transmitted and received signals are collected and displayed on the computer screen by a digital
oscilloscope connected parallel to the computer. Small strain shear modulus is calculated from the
velocity of shear wave thru the soil sample. Photograph of the set up used in the current research is
shown in Figure 7.1. A sample output of the signal id presented in Figure 7.2.

178
Figure 7.1 Soil Sample with Bender Elements
Figure 7.2 Sample Output from the Computer Screen

179
In general, the first significant inversion of the output signal is considered for calculation of the
travel time. It was observed in the current study that first inversion gives slight error in measurement of
shear modulus. In order to reduce the error, a second significant inversion of the output signal was
considered for calculation of shear modulus in the current study. A sample calculation is presented below
for calculation of shear modulus. Since the Bender elements protrude into the sample, the actual travel
distance is less than the sample height. The protruding distance of the Bender elements at both ends is
deducted from the actual sample height to obtain the true travel distance. Calculation of small strain shear
moduli (Gmax) is presented below.
FromFigure7.2, t = 286.9μs = 286.9x10 sec ShearWaveVelocity, V = Lt (m sec)⁄
whereL = LengthofTravel = 4.46inch. = 0.113m; t = TimeofTravel V = 0.113286.9x10 = 394.8m/s
SmallStrainShearModulus(G ) = ρxV whereρ = MassDensityoftheMaterial = 1700 Kg m G = (1700)x(394.85) = 265.04MPa G = 265.04MPa
In the current study, samples were cured by submerging them in water. As mentioned before, the
stiffness measurements were performed after complete saturation of the sample. It was reported in the
literature that appearance of Ettringite-induced heave ranged from a few days to several weeks, following
the lime treatment (Puppala et. al., 2012). In the current experimental study, the monitoring period was
restricted to 9 days. It was observed that the small strain shear modulus (Gmax) decreased with elapsed
time in both natural and lime-treated soils. Shear moduli reduction in natural soils is attributed to the

180
material softening due to moisture absorbance, while in lime-treated soils, formation of Ettringite and
subsequent expansion are the causes of material softening. Higher shear modulus values are observed
in lime-treated soils compared to natural soils, as pozzolanic reactions occur in lime-treated soils. Initial
and final small strain shear modulus values were calculated to study the reduction in shear modulus with
time in chemically-treated sulfate bearing soils. Initial and final shear modulus values for natural and lime
cement treated soils are presented in Figures 7.3 thru 7.14. Initial and final shear moduli values for the
lime=treated high sulfate soils considered in the current study are presented in Figures 7.15 and 7.16 at
optimum and wet of optimum moisture contents. The shear modulus variation with time is presented in
Figures 7.17 thru 7.40 for natural and lime-treated high sulfate soils considered in the current study.
Figure 7.3 Initial and Final Shear Modulus: Austin Soil @ OMC

181
Figure 7.4 Initial and Final Shear Modulus: Austin Soil @ WOMC Soil
Figure 7.5 Initial and Final Shear Modulus: Childress Soil @ OMC
Smal
lStr
ain
Shea
rMod
ulus
,Gm
ax(M
pa)
Smal
lStr
ain
Shea
rMod
ulus
,Gm
ax(k
si)

182
Figure 7.6 Initial and Final Shear Modulus: Childress Soil @ WOMC
Figure 7.7 Initial and Final Shear Modulus: Dallas Soil @ OMC
Natural 4% Lime
0
50
100
150
200
250
300
350
400
64.3
347.9
56.2
258.8
0
7.25
14.5
21.75
29
36.25
43.5
50.75
58
Childress Soil @ WOMC (44,000 ppm)
Natural 6% Lime
0
50
100
150
200
250
300
350
400
450
500
57.25
447.5
51.03
249.2
0
7.25
14.5
21.75
29
36.25
43.5
50.75
58
65.25
72.5
Dallas Soil @ OMC (12,000 ppm)

183
Figure 7.8 Initial and Final Shear Modulus: Dallas Soil @ WOMC
Figure 7.9 Initial and Final Shear Modulus: FM-1417 Soil @ OMC
Smal
lStr
ain
Shea
rMod
ulus
,Gm
ax(M
Pa)
Smal
lStr
ain
Shea
rMod
ulus
,Gm
ax(k
si)

184
Figure 7.10 Initial and Final Shear Modulus: FM-1417 Soil @ WOMC
Figure 7.11 Initial and Final Shear Modulus: Riverside Soil @ OMC

185
Figure 7.12 Initial and Final Shear Modulus: Riverside Soil @ WOMC
Figure 7.13 Initial and Final Shear Modulus: US-82 Soil @ OMC
Natural 6% Lime
50
100
150
200
250
300
350
400
57
326.7
50.4
258.6
0
7.25
14.5
21.75
29
36.25
43.5
50.75
58
Riverside Soil @ WOMC (20,000 ppm)
Smal
lStr
ain
Shea
rMod
ulus
,Gm
ax(M
Pa)
Smal
lStr
ain
Shea
rMod
ulus
,Gm
ax(k
si)

186
Figure 7.14 Initial and Final Shear Modulus: US-82 Soil @ WOMC

187
Figure 7.15 Initial and Final Shear Modulus @ OMC

188
Figure 7.16 Initial and Final Shear Modulus @ WOMC

189
Figure 7.17 Shear Modulus vs. Elapsed Time: Austin Soil (Natural, OMC)
Figure 7.18 Shear Modulus vs. Elapsed Time: Austin Soil (Natural, WOMC)
0 25 50 75 100 125 150 175 200 225
Elapsed Time, hrs
40
45
50
55
60
65
5.8
6.525
7.25
7.975
8.7
9.425
Austin - Natural Soil @ WOMC
0.012 MPa/hr.

190
Figure 7.19 Shear Modulus vs. Elapsed Time: Austin Soil (6% Lime Treated, OMC)
Figure 7.20 Shear Modulus vs. Elapsed Time: Austin Soil (6% Lime Treated, WOMC)

191
Figure 7.21 Shear Modulus vs. Elapsed Time: Childress Soil (Natural, OMC)
Figure 7.22 Shear Modulus vs. Elapsed Time: Childress Soil (Natural, WOMC)
0 25 50 75 100 125 150 175 200 225
Elapsed Time, hrs
40
45
50
55
60
65
70
5.8
6.525
7.25
7.975
8.7
9.425
10.15
10.875
Childress - Natural Soil @ OMC
0.043 MPa/hr.
0 25 50 75 100 125 150 175 200 225
Elapsed Time, hrs
40
45
50
55
60
65
70
5.8
6.525
7.25
7.975
8.7
9.425
10.15
Childress Natural Soil @ WOMC
0.037 MPa/hr.

192
Figure 7.23 Shear Modulus vs. Elapsed Time: Childress Soil (6% Lime Treated, OMC)
Figure 7.24 Shear Modulus vs. Elapsed Time: Childress Soil (6% Lime Treated, WOMC)

193
Figure 7.25 Shear Modulus vs. Elapsed Time: Dallas Soil (Natural, OMC)
Figure 7.26 Shear Modulus vs. Elapsed Time: Dallas Soil (Natural, WOMC)
0 25 50 75 100 125 150 175 200 225
Elapsed Time, hrs
40
45
50
5.8
6.525
7.25
Dallas - Natural Soil @ WOMC
0.023 MPa/hr.

194
Figure 7.27 Shear Modulus vs. Elapsed Time: Dallas Soil (6% Lime Treated, OMC)
Figure 7.28 Shear Modulus vs. Elapsed Time: Dallas Soil (6% Lime Treated, WOMC)

195
Figure 7.29 Shear Modulus vs. Elapsed Time: FM-1417 Soil (Natural, OMC)
Figure 7.30 Shear Modulus vs. Elapsed Time: FM-1417 Soil (Natural, WOMC)
0 25 50 75 100 125 150 175 200 225
Elapsed Time, hrs
30
35
40
45
50
4.35
5.075
5.8
6.525
7.25
FM-1417 - Natural Soil @ WOMC
0.017 MPa/hr.

196
Figure 7.31 Shear Modulus vs. Elapsed Time: FM-1417 Soil (6% Lime Treated, OMC)
Figure 7.32 Shear Modulus vs. Elapsed Time: FM-1417 Soil (6% Lime Treated, WOMC)

197
Figure 7.33 Shear Modulus vs. Elapsed Time: Riverside Soil (Natural, OMC)
Figure 7.34 Shear Modulus vs. Elapsed Time: Riverside Soil (Natural, WOMC)
0 25 50 75 100 125 150 175 200 225
Elapsed Time, hrs
30
35
40
45
50
55
60
65
4.35
5.075
5.8
6.525
7.25
7.975
8.7
9.425
Riverside - Natural Soil @ WOMC
0.0306 MPa/hr.

198
Figure 7.35 Shear Modulus vs. Elapsed Time: Riverside Soil (6% Lime Treated, OMC)
Figure 7.36 Shear Modulus vs. Elapsed Time: Riverside Soil (6% Lime Treated, WOMC)

199
Figure 7.37 Shear Modulus vs. Elapsed Time: US-82 Soil (Natural, OMC)
Figure 7.38 Shear Modulus vs. Elapsed Time: US-82 Soil (Natural, WOMC)

200
Figure 7.39 Shear Modulus vs. Elapsed Time: US-82 Soil (6% Lime Treated, OMC)
Figure 7.40 Shear Modulus vs. Elapsed Time: US-82 Soil (6% Lime Treated, WOMC)

201
From Figures 7.3 to 7.40, it can be seen that untreated and lime-treated soil samples experienced
major reduction in shear moduli with time. In natural soils, this decrease is attributed to material softening
due to presence of moisture. In lime-treated high sulfate soils, formation and growth of Ettringite and the
subsequent expansion of the soil matrix are the reasons for shear moduli reductions. In untreated soils at
optimum moisture condition (OMC), shear modulus varied from 56 MPa to 70 MPa. The highest shear
modulus value was observed in Childress soil (70MPa), which is high plasticity silt; whereas, the FM-1417
soil, which is high plasticity clay at OMC, showed the lowest shear modulus (56 MPa). At wet of optimum
moisture content (WOMC), shear modulus varied from 46 MPa to 63 MPa. Highest shear modulus at
WOMC is observed in Childress soil (64 MPa) whereas lowest shear modulus is observed in FM-1417
soils.
In 6% lime-treated soils the observed shear modulus values are several times that of the natural
soils. In general, the treated shear modulus values are 6-8 times higher than the untreated ones. In 6%-
lime treated soils at OMC condition, the highest shear modulus was seen in Childress soil (535 MPa);
whereas, the US-82 soil showed the lowest shear modulus (407 MPa). Similarly, at WOMC condition,
highest shear modulus was recorded in the Childress soil (348 MPa); whereas, the FM-1417 soil
recorded the lowest shear modulus (263 MPa). Analysis of the test results is presented in the following
section.
7.2 Analysis of Test Results It was reported in the literature that in treated soils, Ettringite formation and subsequent heave
could take from a few days to several weeks following the chemical treatment. Due to this, in the current
study, shear modulus measurements were conducted on treated soils for a period of 9 days. At the end
of the 9th day, the final shear moduli values were calculated. The difference of the initial and final shear
modulus is termed as the loss of stiffness. For the soils considered in the current study, the highest loss
of stiffness was observed in the Childress and Austin soils, in which sulfate contents are above 30,000
ppm. The loss of stiffness followed the same trend as the sulfate content in the soils, with the highest
sulfate content soils showing the highest stiffness loss with time. In Childress and Austin soils, the
percent loss of stiffness was higher than 50%.

202
The ratio of the difference between the initial and final shear moduli values divided by the elapsed
time period gives the slope of the line in MPa/hr. From the slope of the line, threshold stiffness loss values
due to lime treatment are calculated for the high sulfate soils. Initial and final shear moduli values,
stiffness loss and slope of the line for natural and 6%-lime treated soils at optimum and wet of optimum
moisture contents is presented in Tables 7.1 thru 7.4.
Table 7.1 Stiffness Loss for Natural Soils @ OMC (MPa/Hr.)
Soil
Sulfate Content, ppm
Natural Soils
Initial Final Loss Slope of the Line (MPa/Hr.)
Austin 36,000 59.6 54.2 5.4 0.025
Childress
44,000 70.0 60.7 9.3 0.043
Dallas
12,000 57.2 51.0 6.2 0.028
FM-1417
24,000 53.7 48.9 4.8 0.022
Riverside
20,000 65.9 57.1 8.8 0.041
US-82
12,000 56.0 50.1 5.9 0.027

203
Table 7.2 Stiffness Loss for Natural Soils @ WOMC (MPa/Hr.)
Soil
Sulfate Content, ppm
Natural Soils
Initial Final Loss Slope of the Line (MPa/Hr.)
Austin 36,000 57.5 54.9 2.6 0.012
Childress
44,000 64.3 56.2 8.1 0.038
Dallas
12,000 47.3 42.4 4.9 0.022
FM-1417
24,000 46.6 42.9 3.7 0.017
Riverside
20,000 57.0 50.4 6.6 0.041
US-82
12,000 49.5 44.4 5.1 0.024
Table 7.3 Stiffness Loss for 6% Lime Treated Soils @ OMC (MPa/Hr.)
Soil
Sulfate Content,
ppm
6% Lime Treated Soils
Initial Final Loss Slope of the Line (MPa/Hr.)
Austin 36,000 469.7 223.0 246.7 1.14
Childress
44,000 535.8 219.2 316.6 1.46
Dallas
12,000 447.5 249.2 198.3 0.92
FM-1417
24,000 413.7 198.9 214.8 0.99
Riverside
20,000 504.1 333.2 170.9 0.79
US-82
12,000 407.4 245.7 161.7 0.75

204
Table 7.4 Stiffness Loss for 6% Lime Treated Soils @ WOMC (MPa/Hr.)
Soil
Sulfate Content, ppm
6% Lime Treated Soils
Initial Final Loss Slope of the Line (MPa/Hr.)
Austin 36,000 335.3 234.5 100.8 0.45
Childress
44,000 347.8 258.7 89.1 0.41
Dallas
12,000 273.2 219.3 53.9 0.25
FM-1417
24,000 262.6 217.8 44.8 0.21
Riverside
20,000 326.7 258.6 68.1 0.31
US-82
12,000 316.7 226.3 90.4 0.42
From Table 7.1, it can be seen that highest stiffness loss was observed in the Childress soil
(0.043 MPa/Hr.); whereas, FM-1417 soil (0.022 MPa/Hr.) showed lowest loss of stiffness in untreated
natural condition at optimum moisture content. At wet of optimum moisture condition, the Riverside soil
showed the highest loss of stiffness (0.041 MPa/Hr.); whereas, the Austin soil showed the lowest loss of
stiffness (0.012 MPa/Hr.). For the high sulfate soils considered in the current study, the threshold stiffness
loss in natural condition was 0.03 MPa/hr. at optimum and 0.025 MPa/hr. at wet of optimum moisture
content.
For 6% lime-treated soils at optimum and wet of optimum moisture conditions, the stiffness loss
values were much higher than the same of natural soils. In Austin, Childress and FM-1417 soils, the
percent loss of stiffness was higher than 50%. At optimum moisture condition, the stiffness loss was the
highest in the Childress soil (1.46 MPa/hr.), followed by Austin soil (1.14 MPa/Hr.) and FM-1417 Soil (0.99
MPa/Hr.). At wet of optimum moisture condition, the stiffness loss was highest in Austin soil (0.45
MPa/Hr.) and lowest in FM-1417 soil (0.21 MPa/Hr.). For the high sulfate soils considered in the current
study, the threshold stiffness loss at 6% lime treatment was 1 MPa/Hr. at optimum and 0.34 MPa/Hr. at

205
wet of optimum moisture content. The observed threshold stiffness values are in good agreement with the
sulfate contents since the soils with highest sulfate content (Childress and Austin) experienced the
highest loss of stiffness.
This study clearly demonstrated that stiffness measurements using shear wave velocity-based
techniques can be confidently used to evaluate the on-set of soil heaving. This means that the non-
destructive technique using shear wave measurements can provide quick assessments of sulfate heaving
in the lime-treated soils.
7.3 Observations
In the current research study, six high sulfate soils from the states of Texas in natural and treated
conditions were subjected to shear moduli measurements using the bender elements. Following
conclusions were made from the current study.
1. Bender element technique is successfully used in the current research to measure the
small strain shear modulus (Gmax) of lime treated high sulfate soils. Measurement of
shear modulus in treated sulfate bearing soils is an important indicator of on-going sulfate
heave reactions and subsequent material degradation.
2. Small strain shear modulus is higher at optimum moisture content compared to the wet of
optimum moisture content in both natural and treated soils due to close packing and
denser configuration at optimum moisture content. Small strain shear modulus of lime
treated soils is much higher than the natural soils.
3. Measured stiffness loss is higher in lime treated soils compared to natural soils.
Threshold stiffness loss for natural soils varied from 0.03 MPa/Hr. at optimum and 0.025
MPa/Hr. at wet of optimum moisture contents. For 6% lime treated soils, threshold
stiffness loss is 1 MPa/Hr. at optimum and 0.34 MPa/Hr. at wet of optimum moisture
content.
Overall, soils with high sulfate contents exhibited higher stiffness losses with time during the
monitoring time period. This shows that non-destructive shear wave based technologies could be
good tools to assess sulfate heaving in the treated high sulfate soils.

206
CHAPTER 8
CONCLUSIONS AND RECOMMENDATIONS
8.1 Summary and Conclusions
The main objectives of this research are to study the heaving mechanisms in chemically treated
high sulfate soils (sulfate content > 8,000 ppm) and to develop techniques for stabilization of these soils.
Other objectives are to explore the use of non-destructive shear wave velocity measurements on the
treated sulfate rich soils to assess the on-set of sulfate heaving in relatively short time period.
In order to achieve these objectives, an experimental program was designed and performed at
the geotechnical laboratory of The University of Texas at Arlington. Objectives of the research were
accomplished. Test results from the experimental program were analyzed to understand the effects of
various physical and chemical compositional factors of soils on the volume change behavior of chemically
treated high sulfate soils. Based on the current research, the following conclusions are made:
1. The formation of expansive Ettringite mineral was attributed to the presence of calcium from lime,
reactive alumina from soil, soluble sulfates and moisture availability in the treated soils. It was
observed in the current study that volumetric shrinkage is not a concern in chemically treated high
sulfate soils since all the lime treated soils exhibited low shrinkage strains compared to the natural
soils. It is again the swell behavior of chemically treated high sulfate soils that can distress the civil
infrastructure. Volumetric swell strains of high sulfate soils varied from 8.8% to 24.4%.
2. High sulfate soils in the current study were stabilized using “pre-compaction” mellowing technique.
Mellowing periods considered were 0, 3 and 7 days. It was observed that mellowing is effective in
four of the six soils considered in the current study. Sulfate levels in these soils were below 30,000
ppm. The soils that could not be stabilized by mellowing have sulfate contents above 30,000 ppm.
3. Sulfate content has a significant effect on the stabilization of high sulfate soils. The purpose of
mellowing is to solubilize the entire available sulfates during mellowing period and which in turn

207
contribute to the early formation of Ettringite so that no sulfates will be available for further Ettringite
formation after re-compaction. In two of the six soils considered in the current study, the entire soluble
sulfates could not be dissolved during mellowing period due to large amounts of high sulfate contents
in these soils as well as low solubility of sulfates in these soils. These are some of the reasons that
has resulted in mellowing not being effective on these two soils.
4. The compaction void ratios also have significant influence on the Ettringite growth and subsequent
heaving since soils with higher void ratios can accommodate the initial Ettringite growth. In later
stages even if there is Ettringite growth, strength giving pozzolanic reactions impart strength to the
soils which resists further swelling of the soil. This is not true in soils with low compaction void ratios
as they could not accommodate the initial Ettringite growth leading to weakening of soil and
subsequent swelling.
5. Soil compositional factors such as clay mineralogy, reactive alumina and silica contents play an
important role in stabilizing chemically treated high sulfate soils. It is observed in the current study
that soils with Kaolinite mineral dominance are more prone to Ettringite induced heaving when
compared to the soils with other mineral dominance provided all other factors (sulfate content,
reactive alumina and silica contents) remain the same. Since reactive alumina and silica are major
constituents of the strength related pozzolanic reactions, soils with low reactive alumina, silica and
high sulfate contents showed dominance of Ettringite reactions over the pozzolanic reactions which is
manifested in the form of excessive heaving.
6. The reasons for ineffectiveness of mellowing in two of the six soils are explained by using the mass-
volume calculations and ‘Gibb’s Free Energy’ approaches. It is observed from the mass-volume
calculations that soils with high sulfate contents and low void ratios are the candidates for enhanced
Ettringite reactions and higher swell magnitudes. Gibbs free energy calculations indicated that
deleterious Ettringite reactions dominate the strength related pozzolanic reactions in soils with low
reactive alumina, silica and high sulfate contents.
7. In order to incorporate sustainability principles into soil stabilization, portion of lime is replaced with
class f fly ash and combined lime and fly ash treatment studies were hence conducted on two soils

208
using mellowing technique. The two soils considered for both lime and class f fly ash studies have
sulfate contents below 30,000 ppm. Results showed that combined lime and fly ash treatment
effectively reduced swell strains in these soils below natural soil swell levels.
8. A swell prediction model is developed based on the ‘effective sulfate content’ (difference between the
initial sulfate content and sulfate content after the swell tests). Results obtained by this model
indicated that swell prediction based entirely on effective sulfate contents can give misleading results
since the observed swell is a combination of complex interactions among soil sulfates, alumina, silica
and compaction moisture content.
9. Threshold void ratio frame work comprising of natural soil void ratio (compaction density) and sulfate
content is developed to predict Ettringite induced heaving in chemically treated high sulfate soils at
different mellowing periods. This model provided good predictions for the present test soils. This
model needs to be further evaluated for outside test soils.
10. In the current study, Ettringite formation and growth were assessed successfully using non-
destructive seismic testing. Bender Element tests conducted on chemically treated high sulfate soils
inundated completely in water indicated material degradation and subsequent small strain shear
modulus reductions indicating these soils are prone to Ettringite induced heaving upon lime
treatment.
8.2 Future Research Recommendations
To enhance the knowledge and understanding of heaving mechanisms and to develop
sustainable stabilization techniques for chemically treated high sulfate soils, the following
recommendations are made:
1. Samples in the current research are mellowed at 100% humidity and control temperature
environment. The effectiveness of mellowing technique at higher temperatures as observed in the
real field situations needs to be investigated.

209
2. Method to quantify the amount of alumina and silica participating in the deleterious (Ettringite) and
strength giving (pozzolanic) reactions separately has to be developed.
3. Practical method to calculate the amount Ettringite/Thaumasite formed based on the sulfate, reactive
alumina and silica contents.
4. Effectiveness of pre-compaction mellowing technique in stabilizing ‘cement’ treated high sulfate soils
needs to be assessed.
5. More experimental data comprising of different soil series and mellowing periods can be used to
develop generic charts for prediction of Ettringite induced heaving in lime treated high sulfate soils.
6. Stabilization potential of combined lime and ground granulated blast furnace slag (GGBFS) treatment
with pre-compaction mellowing technique in stabilizing high sulfates can be assessed.
7. Addition of amorphous alumina and silica and their effects on chemical stabilization of high sulfate
soils needs to be studied.

210
APPENDIX A
PROCTOR COMPACTION CURVES

211
Figure A.1 Standard Proctor Compaction Curves for Untreated and Lime Treated Austin Soil
Figure A.2 Standard Proctor Compaction Curves for Untreated and Lime Treated Childress Soil
5 10 15 20 25 30Moisture Content (%)
85
90
95
100
105
110
Dry
Uni
tWei
gth
(lb/ft
3 )
AustinNatural Untreated6% Lime Treated
12 16 20 24 28Moisture Content (%)
88
92
96
100
104
Dry
Uni
tWei
gth
(lb/ft
3 )
ChildressNatural Untreated6% Lime Treated

212
Figure A.3 Standard Proctor Compaction Curves for Untreated and Lime Treated Dallas Soil
Figure A.4 Standard Proctor Compaction Curves for Untreated and Lime Treated FM-1417 Soil
20 30 40Moisture Content (%)
80
84
88
92
Dry
Uni
tWei
gth
(lb/ft
3 )
DallasNatural Untreated6% Lime Treated
15 20 25 30 35 40Moisture Content (%)
76
80
84
88
92
Dry
Uni
tWei
gth
(lb/ft
3 )
FM-1417Natural Untreated6% Lime Treated

213
Figure A.5 Standard Proctor Compaction Curves for Untreated and Lime Treated Riverside Soil
Figure A.6 Standard Proctor Compaction Curves for Untreated and Lime Treated US-82 Soil
12 16 20 24 28Moisture Content (%)
90
92
94
96
98
100
Dry
Uni
tWei
gth
(lb/ft
3 )
RiversideNatural Untreated6% Lime Treated
16 20 24 28 32 36Moisture Content (%)
82
84
86
88
90
92
Dry
Uni
tWei
gth
(lb/ft
3 )
US-82Natural Untreated6% Lime Treated

214
Figure A.7 Standard Proctor Compaction Curves for Untreated and Combined Lime Fly Ash Treated Bells Soil
Figure A.7 Standard Proctor Compaction Curves for Untreated and Combined Lime Fly Ash Treated FM-1417 Soil

215
REFERENCES
1. Adams, A. G., Dukes, O. M., Tabet, W., Cerato, A. B., and Miller, G. A. (2008). “Sulfate
induced heave in Oklahoma soils due to lime stabilization”. GeoCongress 2008, ASCE.
2. Addison, M. B., and Petry, T. M. (1998). “Optimizing Multiagent, Multi-Injected Swell
Modifier”. Transportation Research Record: Journal of the Transportation Research Board,
No. 1611, TRB, National Research Council, Washington, D.C., 1998, pp. 38-45.
3. ASTM (1995). “Annual Book of ASTM Standards,” Section 4, Construction, Vol. 4.08 Soil and
Rock; Dimension Stone; Geosynthetics, American Society of Testing and Materials,
Philadelphia, Pennsylvania.
4. Bagley, A., Cesare, J. A. (2009). “Case history: sulfate-induced heave of lime treated soils
beneath a structure in western Colorado”. Forensic Engineering, 2009.
5. Berger, E., Little, D. N. and Graves, R. (2001). “Technical Memorandum: Guidelines for
Stabilization of Soils Containing Sulfates”. http://www.lime.org/publications.html Accessed
September, 2010.
6. Bolander, P. (1997). “Chemical Additives for Dust Control What We Have Used and What We
Have Learned”. Transportation Research Record: Journal of the Transportation Research
Board, No. 1589, TRB, National Research Council, Washington, D.C., 1997, pp. 42-49.
7. Burkart, B., Goss, G. C. and Kern, J. P. (1999). “The Role of Gypsum in Production of
Sulfate-Induced Deformation of Lime-Stabilized Soils”. Environmental and Engineering
Geoscience, Vol. V, No. 2, 1999, pp. 173-187.
8. Carter, D. L., Mortland, M. M. and Kemper, W. D., (1986). “Specific Surface” In A. Klute(ed),
Methods of Soil Analysis, Part 1, 2nd. ed., Agronomy 9:413-423.
9. Chapman, H. D., (1965). “Cation-exchange capacity” In: C. A. Black ed., Methods of soil
analysis - Chemical and microbiological properties, Agronomy 9, 891-901.
10. Chavva, P. K., Vanapally, S. K., Puppala, A. J. and Hoyos, L. (2005), “Evaluation of Strength,
Resilient Moduli, Swell, and Shrinkage Characteristics of Four Chemically Treated Sulfate
Soils from North Texas”, GSP 136, ASCE Special Publication, Geofrontiers, Austin, 2005.
11. Chakkrit, S., Puppala, A. J., Chikyala, V., Saride, S., and Hoyos, L.R. (2008). “Combined
Lime and Cement Treatment of Expansive Soils with Low to Medium Soluble Sulfate Levels”.
Geocongress, 2008.
12. Chen, F. H. (1988). Foundations on Expansive Soils, Developments in geotechnical
engineering, Vol.12, pp.12.

216
13. Chen, D. H., Harris, P., Scullion, T., and Bilyeu, J. (2005). “Forensic Investigation of a
Sulfate-Heaved Project in Texas”. Journal of Performance of Construction Facilities, ASCE,
November 2005, pp. 324-330.
14. Chittoori, B. C. S. (2008). “Clay mineralogy effects on long-term performance of chemically
treated expansive clays.” Ph.D. dissertation, Univ. of Texas at Arlington, TX, 326.
15. Chittoori, B., and Puppala, A. J., (2011). Quantitative estimation of clay mineralogy in fine-
grained soils. Journal of Geotechnical and Geoenvironmental Engineering, v 137, n 11, p
997-1008, 16 December 2011.
16. Clesceri, L. S., Greenberg, A. E., Trussell, R. R. (Eds), 1989. Standard Methods for the
Examination of Water and Wastewater. 17th ed., American Public Health Association,
American Water Works Association and Water Pollution Control Federation, Washington,
D.C., pp.4-75-4-81.
17. Cohen, M. D., (1983). “Theories of expansion in sulfoaluminate–type expansive cements:
schools of thought”. Cement and Concrete Research, Vol. 13, pp. 809-818.
18. Deepthi, V., Puppala, A. J., and Chakkrit, S. (2007). “Field studies rigid pavement sections
built on stabilized soils”. GSP 169 Soil and Material Inputs for Mechanistic-Empirical
Pavement Design, GeoDenver 2007.
19. Deng, M., and Tang, M. (1994). “Formation and Expansion of Ettringite Crystals”. Cement
and Concrete Research, Vol. 24, No. 1, 1994, pp. 119-126.
20. Dermatas, D. (1995). “Ettringite-induced Swelling in Soils: State-of-the-art.” Applied
Mechanics Rev, Vol. 48, pp. 659-673.
21. Dubbe, D. D., Usman, M. A. and Moulton, L. K. (1997). “Expansive Pyritic Shales”.
Transportation Research Record 993, TRB, National Research Council, Washington, D.C.,
1997, pp. 19-27.
22. Eades, J., L., and Grim, R., E., “A Quick Test to Determine Lime Requirements for Soil
Stabilization.” Highway Research Record 139, HRB, National Research Council, Washington
D.C., 1966, pp. 61-72.
23. Ferris, G. A., Eades, J. L., McClellan, G. H., and Graves, R.E. (1991). “Improved
characteristics in sulfate soils treated with barium compounds before lime stabilization”.
Transportation Research Record 1295, TRB, National Research Council, Washington D.C.,
1991.
24. Floyd, M., Czerewko, M., Cripps, J.C., and Spears, D.A, (2003). Pyrite oxidation in lower
Lias Clay at concrete highway structures affected by thaumasite, Gloucestershire, UK.
Cement and Concrete Composites, 25, pp 1015-1024. ISSN 958-9465(03)00123-9.
25. Foster, M. (1953) Geochemical Studies of Clay Minerals III. The determination of free silica
and free alumina in Montmorillonites, Geochemica Cosmochimica Acta, Vol. 3, pp. 143-154.

217
26. FUJI, K.; KONDO, W. Estimation of thermochemical data for Calcium Silicate Hydrate (C-S-
H). Journal of the American Ceramic Society, 1983, vol. 66, p. C220- C221.
27. Gaily, A. H. (2012). “Engineering Behavior of Lime Treated High Sulfate Soils”. M.S. Thesis,
The Univ. of Texas at Arlington, Arlington, Texas.
28. Giummarra, G. J., Foley, G. and Cropley, S. (1997). “Dust Control Australian Experiences
with Various Chemical Additives”. Transportation Research Record: Journal of the
Transportation Research Board, No. 1589, TRB, National Research Council, Washington,
D.C., 1997, pp. 50-53.
29. Griffin. (2001). ‘‘Evaluation of Sulfate Resistant and Ordinary Portland Cements For Effective
Stabilization Of Natural Sulfate Rich Subgrades”. M.S. Thesis, The Univ. of Texas at
Arlington, Arlington, Texas.
30. Harris, P., T. Scullion, S. Sebesta, and G. Carlos, (2003), “Measuring Sulfate in Subgrade
Soil - Difficulties and Triumphs.” Transportation Research Record, No. 1837, National
Research Council, Washington, D.C., pp. 3-11.
31. Harris, J. P., Sebesta, S., and Scullion, T. (2004). “Hydrated Lime Stabilization of Sulfate-
bearing Vertisols in Texas”. Transportation Research Record 1868, TRB, National Research
Council, Washington, D.C., 2004, pp. 31-39.
32. Harris, J. P., Scullion, T., and Sebesta, S. (2004). “Hydrated Lime Stabilization of Sulfate-
bearing Soils in Texas”. Texas Transportation Institute Research Report 0-4240-2, College
Station, Texas, 2004.
33. Harris, P., Voldt, J. V., Sebesta, S., and Scullion, T. (2005). “Recommendations for
stabilization of high-sulfate soils in Texas”. Technical report 0-4240-3, Texas Transporation
Institute.
34. Harris, J. P., Von Holdt, J., Sebesta, S., and Scullion, T. (2006). “Recommendations for
Stabilization of High-Sulfate Soils in Texas”. Transportation Research Record No. 1952,
TRB, National Research Council, Washington, D.C., 2006, pp. 71-79.
35. Harris, J. P. (2006). Develop Guidelines and Procedures for Stabilization of Sulfate Soils.
Texas Transportation Institute, Project Summary Report 0-4240-S.
36. Hagerty, D. J., Ullrich, C. R., Denton, M. M. (1990). “Microwave drying of soils.” Geotechnical
Testing Journal, v 13, n 2, Jun, 1990, p 138-141.
37. Hausmann, M. R. (1990). “Engineering principles of ground modification”, McGraw–Hill, New
York.
38. Hunter, D. (1988). “Lime-Induced Heave in Sulfate-Bearing Clay Soils,” Journal of
Geotechnical Engineering, ASCE, Vol. 114, pp. 150-167.
39. Hunter, D. (1989). “The Geochemistry of Lime-Induced Heave in Sulfate Bearing Clay Soils”.
(Dissertation) University of Nevada, Reno, 1989.

218
40. Higgins, D. D. (2005). “Soil Stabilization with Ground Granulated Blast furnace Slag”. UK
Cementitious Slag Makers Association (CSMA), September 2005.
41. Inthrasombat, N. (2003). ‘‘Ettringite formation in lime treated sulfate soils: Verification by
mineralogical and swell testing.’’ M.S. Thesis, The Univ. of Texas at Arlington, Arlington,
Texas.
42. Jackson, M. L. (1958). “Soil chemical analysis.” Prentice Hall Inc., Englewood Cliffs, N.J.
43. Joffee, J.S., (1949). Pedology, Pedology Publications, New Brunswick, New Jersey.
44. Jung, S., and M. C. Santagata. (2009). Mitigating the Expansive Behavior of Chemically
Treated Soils.Publication FHWA/IN/JTRP-2009/02. Joint Transportation Research Program,
Indiana.
45. Kadam, R. (2003). “Evaluation of low strain shear moduli of stabilized sulfate bearing soils
using bender elements.” MS thesis, The Univ. of Texas at Arlington, Arlington, Tex, 155.
46. Knudsen D., Peterson G.A. and Pratt P.F. (1982). “Lithium, sodium and potassium.” In: Page
A.L. (ed.,) Methods of Soil Analysis, Part 2. American Society of Agronomy, Madison, WI,
229–231.
47. Kollman, H., Strubel, G., and Trost, F. (1977). "Mineralsynthetische unterSuchungen zu
treibursachen durch Ca-Al-sulfat und Ca-Si-carbonat-sulfat hydrat." Tonindustrie Zeitung,
101(3), Germany, pp. 63-70.
48. Kollman, H. (1978). "Minerlogische untersuchungen uber ausbluhungs
undtreiberscheinungen and baustoffen durch sulfate." Giessener Geologische Schriften, 18,
Giessen, Germany, pp.159
49. Kota, P. B. V. S., Hazlett, D., and Perrin, L. (1996) “Sulfate-Bearing Soils: Problems with
Calcium Based Stabilizers”. Transportation Research Record 1546, TRB, National Research
Council, Washington, D.C., 1996, pp. 62-69.
50. Krauskopf, K. and Bird, D.K., 1995. Introduction to Geochemistry. Third Edition, 647 pp.
51. Lambe, T. W and Whitman R. V. (2000). Soil Mechanics, John Wiley & Sons, New York, pp.
45-51.
52. Little, D. N. (1995). “Stabilization of Pavement Subgrades & Base Courses with Lime.”
Kendall/Hunt Publishing Company, Iowa.
53. Little, D. N., Herbert, B., and Kunagalli, S. N. (2005). “Ettringite formation in lime-treated
soils–Establishing thermodynamic foundations for engineering practice.” Transportation
Research Record. 1936, Transportation Research Board, Washington, D.C., 2005, pp. 51–
59.
54. Little, D. N., Nair, S. (2009). “Validation of Sensitivity of Sulfate-Bearing Soils to Ettringite
Growth by Differential Scanning Calorimetry”. Transportation Research Record: Journal of
the Transportation Research Board, No. 2104, Transportation Research Board of the
National Academies, Washington, D.C., 2009, pp. 63–70.

219
55. Little, D. N., Nair, S., and Herbert, B. (2010). “Addressing Sulfate-Induced Heave in Lime
Treated Soils”. Journal of Geotechnical and Geoenvironmental Engineering, ASCE, January
2010, pp. 110-118.
56. Mallat A. (2006). “LMSSMat”, Retrieved from http://www.mssmat.ecp.fr/Axe-de-
recherche,1529 , accessed on 11/04/2010.
57. Marquart, D. K. (1995). “Chemical Stabilization of Three Texas Vertisols with Sulfonated
Naphthalene”. M.S. Thesis, Texas A&M University, May 1995, 45p.
58. McCarthy, M. J., Laszlo, J. C., Sachdeva, A., Jones, M. R. (2009). “Role of fly ash in
mitigation of swelling in lime-stabilised sulfate bearing soils”. 2009 World of coal ash
conference, May 4-7, 2009, Lexington, KY, USA.
59. McKennon, Hains, N. L., and Hoffman, D. C. (1993). Method for Preventing the Adverse
Effects of Swell in Sulfate Bearing, Expansive Clay Soils. United States Patent-5228808,
1993.
60. Mehta, P. K., and Klein, A. (1966). “Investigation of hydration products in the system
4CaO.3Al2O3.SO3.CaSO4.CaO.H2O”. Highway Research Board, Special report no.90, pp.
328-352.
61. Mehta, P. K., (1973). “Mechanism of expansion associated with Ettringite formation”. Cement
and Concrete Research, 3, pp. 1-6.
62. Mehta, P. K., (1973). “Effect of lime on hydration of pastes containing gypsum and calcium
aluminate or calcium sulfoaluminate”. Journal of America Ceramic Society, 56, pp. 315 - 319.
63. Mehta, P. K., and Wang, S. (1982). Cement Concrete Research, Vol.12, pp. 121-122.
64. Mitchell, J. K. (1986). “Practical Problems from Surprising Soil Behavior.” Journal of
Geotechnical Engineering Division, ASCE, Vol. 112, No. 3, pp. 259-289.
65. Mitchell, J. K., and Dermatas, D. (1992). “Clay Soil Heave Caused By Lime-Sulfate
Reactions.” ASTM Special Publication 1135, pp. 41-64.
66. Mitchell, J. K. and Soga, K. (2005). “Fundamentals of soil behavior.” 3rd Ed., Wiley, New
York.
67. Moschner, G., Lothenbach, B., Winnefeld, F., Ulrich, A., Figi, R., and Kretzschmar, R. (2009).
“Solid solution between Al- Ettringite and Fe-Ettringite”. Cement and Concrete Research, Vol.
39, pp. 482-489.
68. Nelson, D. J. and Miller, J. D. (1992). “Expansive soils: problems and practice in foundation
and pavement engineering,” John Wiley & Sons. 259 p.
69. Ogawa, K., and Roy, D. M. (1982). “C4A3S Hydration, Ettringite Formation and its Expansion
Mechanism: Part II, Microstructural Observation of Expansion”. Cement and Concrete
Research, vol.12, pp. 101-109.
70. Pauling, L., 1960. The Nature of the Chemical Bond. 3rd edition, Cornell University Press,
Ithica, NY.

220
71. Perrin, L. (1992). “Expansion of Lime-Treated Clays Containing Sulfates”. Proceedings of 7th
International Conference on Expansive Soils, Vol. 1, ASCE Expansive Soil Research Council,
New York, 1992, pp. 409-414.
72. Petry, T. M., 1994, “Studies of Factors Causing and Influencing Localized Heave of Lime
Treated Clay Soils (Sulfate Induced Heave),” final report, University of Texas, Department of
Civil Engineering, Arlington, TX, September.
73. Petry, T. M. and Little, D. N., (1992), “Update on Sulfate Induced Heave in TreatedClays:
Problematic Sulfate Levels,” Transportation Research Board, TRR 1362, Washington, DC.
74. Punthutaecha, K., Puppala, A.J., Vanapalli, S., Inyang, H. “Volume Change Behaviors of
Expansive Soils Stabilized with Recycled Ashes and Fibers.” ASCE, Journal of Materials,
March/April, 2006, pp. 295‐306.
75. Puppala, A. J., Hanchanloet, S., Jadeja, M., Burkart, B. (1999). “Sulfate InducedHeave
Distress: A Case Study”. Proceedings, Transportation Research Board Annual Meeting,
Washington D.C, USA.
76. Puppala, A. J., and Musenda, C. (2000). “Effects of Fiber Reinforcement on Strength and
Volume Change Behavior of Expansive Soils.” Transportation research board. 79thAnnual
Meeting, paper No. 00-0716, Washington, D.C.
77. Puppala, A. J., Viyanant, C., Kruzic, A. P., and Perrin, L., (2002). Evaluation of a Modified
Soluble Sulfate Determination Method for Fine-Grained Cohesive Soils, Geotechnical Testing
Journal, Volume 25, Issue 1, pp. 85–94.
78. Puppala, A. J., Wattanasanticharoen, E. and Punthutaecha, K. (2003). “Experimental
Evaluations of Stabilization Methods for Sulphate-rich Expansive Soils.” Ground Improvement
Vol. 7, No. 1, 2003. pp. 25-35.
79. Puppala, A. J., Griffin, J. A., Hoyos, L. R. and Chomtid, S. (2004). “Studies on Sulfate-
Resistant Cement Stabilization Methods to Address Sulfate-Induced Soil Heave.”Journal of
Geotechnical and Geoenvironmental Engineering, 130, pp. 391-402.
80. Puppala, A.J., Katha, B., Hoyos, L.R. (2004). Volumetric Shrinkage Strain Measurements in
Expansive Soils Using Digital Imaging Technology. ASTM Geotechnical Testing Journal, Vol.
27, No. 6, November, 2004, pp.547-556.
81. Puppala, A. J., Intharasombat, N., Vempati, R. (2005). "Experimental Studies on Ettringite
Induced Heaving in Soils.” ASCE Journal of Geotechnical and Geoenvironmental
Engineering, Vol. 31, No. 3, pp. 325-337.
82. Puppala, A. J., Kadam, R., Madhyannapu, R., and Hoyos, L. R. (2006). “Small-Strain Shear
Moduli of Chemically Stabilized Sulfate-Bearing Cohesive Soils”. Journal of Geotechnical and
Geoenvironmental Engineering, ASCE, March 2006, pp.322-336.

221
83. Puppala, A. J., Saride, S., Dermatas, D., Al-shamrani, M., and Chikyala, V. (2010). “Forensic
Investigations to Evaluate Sulfate-Induced Heave Attack on a Tunnel Shotcrete Liner”.
Journal of Materials in Civil Engineering, ASCE, September 2010, pp.914-922.
84. Puppala, A.J., Naga S. Talluri., Bhaskar S. Chittoori and Ahmed Gaily. (2012). Lessons
Learned from Sulfate Induced Heaving Studies in Chemically Treated Soils. Proceedings of
the International Conference on Ground Improvement and Ground Control. Research
Publishing, Vol. 1, November, 2012, pp.85-98.
85. Puppala, A.J., Naga S. Talluri., Ahmed Gaily. And Bhaskar S. Chittoori. (2013). Heaving
Mechanisms in High Sulfate Soils. Proceedings of the 18th International Conference on Soil
Mechanics and Geotechnical Engineering, Paris 2013.
86. Rajasekaran, G. (2005). “Sulphate attack and Ettringite formation in the lime band cement
stabilized marine clays”. Ocean Engineering, 32 (2005), pp. 1133–1159.
87. Raymond, N. Y., and Ouhadi, V. R. (2006). “Experimental study on instability of bases on
natural and lime/cement-stabilized clayey soils”. Applied Clay Science, 35 (2007), pp. 238–
249.
88. Rollings Jr., R. S., Burkes, J. P., and Rollings, M. P. (1999). “Sulfate Attack on Cement
Stabilized Sand.” Journal of Geotechnical and Geoenvironmental Engineering, vol. 125 No.5,
pp. 364-372.
89. Rollings, R. S., Rollings, M. P., and Poole, T., Wong, G. S., and Gutierrez, G. (2006).
“Investigation of Heaving at Holloman Air Force Base, New Mexico”. Journal of Performance
of Constructed Facilities, ASCE, February 2006, pp.54-63.
90. Rauch, A. F., Harmon, J. S., Katz, L. E. and Liljestrand, H. M. (2002). “Measured Effects of
Liquid Soil Stabilizers on Engineering Properties of Clay”. Transportation Research Record:
Journal of the Transportation Research Board, No. 1787, TRB, National Research Council,
Washington, D.C., 2002, pp. 33-41.
91. Schlorholtz, S., and Demirel, T. (1984). “Quick Lime-Gypsum Interactions in Stabilized Soil
Bases for Concrete Highways”. Cement and Concrete Research, Vol. 14, No. 4, April 1984,
pp. 529-532.
92. Santoni, R. L., Tingle, J. S. and Webster, S. L. (2002). “Stabilization of Silty-Sand with
Nontraditional Additives”. Transportation Research Record: Journal of the Transportation
Research Board, No. 1787, TRB, National Research Council, Washington, D.C., 2002, pp.
61-72.
93. Sarkar, S., and Little, D. (1998). “Stabilization of Sulfate-Contaminated Crushed Concrete
Base with Type V Cement and Fly Ash”. Transportation Research Record No. 1611, TRB,
National Research Council, Washington, D.C., 1998, pp. 3-9.
94. Sherwood, P. T. (1962). “Effect of Sulfates on Cement and Lime Treated Soils”. Highway
Research Board, Bulletin 353, pp. 98-107.

222
95. Sherwood, P.T., (1993). Soil Stabilization with Cement and Lime. Transportation Research
Laboratory State of the Art Review. HMSO
96. Solanki, P., Khoury, N., and Zaman, M. M. (2009). “A comparative evaluation of various
additives used in the stabilization of sulfate bearing lean clay”. Journal of ASTM International,
Vol.6, No.8.
97. Talluri, N.S., Gaily, A., Puppala, A.J., Chittoori, B.S. (2012). A Comparative Study of Soluble
Sulfate Measurements. ASCE GeoCongress 2012, Oakland, California, pp. 3372-3381.
98. Talluri, N.S., Puppala, Chittoori, B.S., Gaily, A., (2013). Stabilization of High Sulfate Soils by
Extended Mellowing. Journal of the Transportation Research Board, National Academy of
Science, Transportation Research Board (Accepted).
99. Tasong, W. A., Wild, S. and Tilley, R. J. D. (1999). “Mechanisms by which Ground
Granulated Blastfurnace Slag Prevents Sulphate Attack of Lime-Stabilized Kaolinite”. Cement
and Concrete Research, Vol. 29, 1999, pp. 975-982.
100. Viyanant, C. (2000). “Laboratory Evaluation of Sulfate Heaving Mechanisms in Artificial
Kaolinite Soil”. M.S. Thesis, The University of Texas at Arlington, Arlington, Texas, 2000.
101. Walker, Jr. (1992). Method for improving the characteristics of sulfate bearing soils. United
States Patent. 5,122, 012.
102. Wang, L., Roy, A., Seals, R. K., and Metcalf, J. B. (2003). “Stabilization of Sulfate-Containing
Soil by Cementitious Mixtures: Mechanical Properties”. Transportation Research Record.
1827, Transportation Research Board, Washington, D.C., 2003, pp. 12-19.
103. Wang, L., Roy, A., Tittsworth, R., and Seals, R. K. (2004). “Mineralogy of Soil Susceptible to
Sulfate Attack after Stabilization”. Journal of Materials in Civil Engineering, August 2004, pp.
375-382.
104. Wang, L., Roy, A., Seals, R. K., and Zachary, B. (2005). “Suppression of Sulfate Attack on a
Stabilized Soil”. Journal of American Ceramics Society, 88 [6] , pp. 1600–1606.
105. West, G. (1959). A Laboratory Investigation into the Effects of Elapsed Time after Mixing on
Compaction and Strength of Soil Cement. Geotechnique 9(1), p22, 1959.
106. Wild, S., Kinuthia, J. M., Jones, G. I. and Higgins, D. D. (1998), “Effects of partial
substitution of lime with ground granulated blast furnace slag (ggbs) on the strength
properties of lime-stabilised sulphate bearing clay soils”, Engineering Geology.
107. Wild, S., Kinuthia, J. M., Jones, G. I. and Higgins, D. D. (1999), “Suppression of swelling
associated with Ettringite formation in lime-stabilised sulphate- bearing clay soils by partial
substitution of lime with ground granulated blast furnace slag (ggbs)”, Engineering Geology.
108. Zhiming, S. (2008). “Forensic Investigation of Pavement Premature Failure due to Soil
Sulfate-Induced Heave”. Journal of Geotechnical and Geoenvironmental Engineeirng, ASCE,
August 2008, pp.120-1204.

223
BIOGRAPHICAL INFORMATION
Nagasreenivasu Talluri was born in Khammam, Andhra Pradesh, India. He graduated from
Jawaharlal Nehru Technological University, Anantapur, India, with a Bachelor’ Degree in Civil
Engineering in 2006. He joined Master’s Program at the Indian Institute of Technology Kanpur, India and
graduated in 2008. Subsequently, he worked as a Geotechnical Engineer at Tata Consulting Engineers
Ltd., Bangalore, Karnataka, India for a year. During his work as a Geotechnical Engineer, he was
involved in the deep and shallow foundation design and recommendation; retaining wall design; slope
stability and geotechnical report verification for Thermal Power Plant structures. He decided to go to
United States to pursue PhD in Geotechnical Engineering. He started his Doctoral program in the
Department of Civil Engineering, University of Texas at Arlington with Geotechnical Engineering as the
area of research. At UTA, he performed research in High Sulfate Soil Stabilization under the guidance of
Prof. Anand J. Puppala and successfully defended his dissertation in July 2013. During the course of his
study, he worked in various research areas related to ground improvement, expansive soils and soluble
sulfate measurement.