Embed Size (px)
Citation preview
STABLE ISOTOPE ANALYSIS REVEALS FOOD WEB STRUCTURE ANDWATERSHED IMPACTS ALONG THE FLUVIAL GRADIENT
OF A MESOAMERICAN COASTAL RIVER
KIRK O. WINEMILLER,a* DAVID J. HOEINGHAUS,a,b ALLISON A. PEASE,a PETER C. ESSELMAN,c
RODNEY L. HONEYCUTT,ay DONMALE GBANAADOR,a ELIZABETH CARRERAa and JOSIAH PAYNEa
a Section of Ecology, Evolution and Systematic Biology, Department of Wildlife and Fisheries Sciences, Texas A&M University, College Station, TX 77843-
2258, USAb Department of Biological Sciences and the Institute of Applied Sciences, University of North Texas, 1155 Union Circle #310559, Denton, TX 76203-5017,
USAc Department of Fisheries and Wildlife, Michigan State University, 13 Natural Resources Building, East Lansing, MI 48824-1222, USA
ABSTRACT
Ecosystem processes and biological community structure are expected to change in a relatively predictable manner along fluvialgradients within river basins. Such predictions are heavily based on temperate rivers, and food web variation along fluvial gradients inMesoamerican rivers has received limited attention. In this study, we analyzed carbon and nitrogen stable isotope ratios of basal carbonsources and dominant consumer species to examine aquatic food web structure along the fluvial gradient of the Monkey River Basin,Belize. Similar to previous studies in other regions, consumer species richness and functional diversity increased along thedownstream fluvial gradient, due in part to the addition of estuarine species in lower reaches and increasing diversity of piscivorousspecies along the gradient. Aquatic food webs in upstream reaches were primarily supported by allochthonous production sources, andin-stream sources increased in importance along the downstream gradient. Our study system traversing the Maya Mountain MarineArea Transect also provided a unique opportunity to test the utility of primary consumer d15N as an indicator of watershed impactswithin a tropical basin with a diverse biota and a different type of agricultural impact than typically studied (i.e. banana plantations vs.tilled row cropping). As expected, primary consumer d15N at sites draining impacted watersheds was enriched compared to valuesfrom forested reference sites. Assessment of primary consumer d15N may be a feasible option for monitoring watershed impacts onaquatic food webs in service of the ridge-to-reef conservation strategy adopted for this watershed as well as in other tropical riverbasins. Copyright # 2010 John Wiley & Sons, Ltd.
key words: banana plantation; Belize; Bladen River; fish; fluvial gradient; Maya Mountain Marine Area Transect; pollution; river continuum; trophicecology
Received 15 August 2009; Revised 14 December 2009; Accepted 4 March 2010
INTRODUCTION
Ecologists have long recognized that ecosystem processes
and biological community structure change along fluvial
gradients within river basins (e.g. Hynes, 1970). Availability
of production sources, organismal responses to discharge
variation and species interactions all vary in relation to
abiotic environmental factors that undergo transition from
headwaters to downstream reaches and coastal habitats.
The structure of aquatic food webs also is expected to
change along the course of a river basin from inland
tributaries to the sea (Power and Dietrich, 2002). For
example, the importance of terrestrial versus in-stream
sources of carbon varies with position along the upstream–
downstream fluvial gradient of stream systems (Vannote
et al., 1980; Thorp and Delong, 1994, 2002). In watersheds
exposed to urbanization or agricultural land use, pollution
and anthropogenic nutrient enrichment also can affect
resources and alter aquatic food webs (e.g. Clements et al.,
2000; DeBruyn and Rasmussen, 2002; Anderson and
Cabana, 2005; Simon et al., 2007). A number of studies
have shown that alteration of the surrounding landscape for
agriculture, urban development, and other uses can have
important effects on the ecological integrity of rivers
(reviewed in Allan, 2004).
Ratios of stable carbon (d13C) and nitrogen (d15N)
isotopes have been used extensively to examine aquatic food
webs, and they can reveal variation in food web structure
across longitudinal fluvial gradients (e.g. Hoeinghaus et al.,
2007a; Saito et al., 2007) as well as in relation to
anthropogenic allochthonous inputs from the watershed
(e.g. Cabana and Rasmussen, 1996; Anderson and Cabana,
RIVER RESEARCH AND APPLICATIONS
River. Res. Applic. (2010)
Published online in Wiley InterScience(www.interscience.wiley.com) DOI: 10.1002/rra.1396
*Correspondence to: Kirk O.Winemiller, Section of Ecology, Evolution andSystematic Biology, Department of Wildlife and Fisheries Sciences, TexasA&M University, College Station, TX 77843-2258.E-mail: [email protected] address: Natural Science Division, Seaver College, PepperdineUniversity, 24255 Pacific Coast Highway, Malibu, CA 90263 USA.
Copyright # 2010 John Wiley & Sons, Ltd.
2005; Saito et al., 2008). Here we examine variation in food
web structure in the Monkey River, Belize, at several
locations spanning a longitudinal fluvial gradient from a
headwater stream to the coast. Previous studies have
documented changes in fish assemblage composition and
species diversity along longitudinal fluvial gradients in
Mesoamerican rivers (Winemiller and Leslie, 1992;
Rodiles-Hernandez et al., 1999; Esselman et al., 2006).
However, food web studies of Mesoamerican streams are
scarce, and stable isotope analyses have been conducted for
very few aquatic communities in the region (Kilham and
Pringle, 2000; Verburg et al., 2007). Using stomach contents
of fishes, Winemiller (1990) examined temporal variation in
food web properties in two Costa Rican streams, but little is
known about corresponding changes in tropical fluvial food
webs at the watershed scale.
We employed stable isotope methods to examine aquatic
food web structure and potential local watershed influences
along a longitudinal gradient in the Monkey River Basin.
TheMonkey River Basin in southeastern Belize is the largest
basin in the Maya Mountain Marine Area Transect
(MMMAT; Heyman and Kjerfve, 1999), a corridor of
reserves and private lands extending from the ridge of the
Maya Mountains to the Belize Barrier Reef in the Caribbean
Sea. Sixty-two per cent of the Monkey River Basin is
protected in ecological reserves. The Upper Bladen branch
of the Monkey River drains a nearly pristine forested
landscape within the Bladen Nature Reserve. In contrast, the
Swasey catchment yields more than 50% of the bananas
grown in Belize. In addition to revealing potential influence
of land characteristics on isotopic composition of aquatic
biota, our description of aquatic food webs along this
corridor will provide important basic information for the
unique ‘ridge-to-reef’ conservation strategy that was
adopted for this region (Heyman and Kjerfve, 1999).
METHODS
Study area
The study region is the Monkey River watershed,
including its two largest tributaries, the Bladen and Swasey
Rivers, in southeastern Belize (Figure 1). This watershed
delivers freshwater from the Maya Mountains to the coast
adjacent to the Belize Barrier Reef and the Sapodillas Cayes
Marine Reserve. During December 2005 and January 2006,
seven areas were surveyed: (1) Firetail Creek, a small
tributary of the Upper Bladen River draining pristine
forested hills within the Bladen Nature Preserve; (2) Upper
Bladen River, a segment of pristine aquatic habitat located
just downstream from the southeast border of the Bladen
Nature Preserve; (3) Upper Swasey River 3 km upstream of
Red Bank Village; (4) Lower Swasey River, a segment
adjacent to banana plantations; (5) Lower Bladen River 1–
2 km upstream from the junction with the Swasey River
which delivers waters draining a heavily agricultural
catchment; (6) Lower Monkey River, an estuarine segment
0.25–2 km above the mouth; (7) Mangrove and seagrass
habitats in an area 0.25–2 km north of the Monkey River
mouth.
The most upstream site, Firetail Creek, has a relatively
narrow channel, steep bed gradient, large coarse substrate
and closed canopy. The Upper Bladen River also drains the
pristine forested terrain of the Bladen Nature Reserve, but
has a wider channel, more heterogeneous substrate and
receives more sunlight. The Lower Bladen River has a lower
gradient, finer substrates and a more impacted watershed
than the Upper Bladen. The Upper Swasey is slightly larger
than the Bladen Branch, and flows through a constrained
channel dominated by bedrock and boulder substrates
covered with aquatic macrophytes (Marathrum oxycarpum).
In the coastal plain the river widens, the macrophytes
disappear and substrates gradually change to fine gravel and
sand. Banana agriculture occurs in patches on the floodplain
adjacent to the Bladen and Swasey Branches in the upper
portion of the coastal plain, and is more extensive on the
Swasey branch (Figure 1). The Lower Monkey River is
under tidal influence. Its broad channel is lined with sedges
and has little canopy cover. Sediments are fine, and diverse
freshwater and estuarine fishes and macroinvertebrates
inhabit open waters of the channel, dense beds of floating
plants and lentic secondary channels. Adjacent coastal
mangrove and seagrass habitats at the mouth of the Monkey
River are broad and shallow and contain estuarine and
marine species.
Sample collection and stable isotope analyses
The most conspicuous and abundant fish species,
invertebrates, and in-stream and riparian producers were
collected at each survey site. Benthic algae, detritus, aquatic
and terrestrial plants (including seeds) were crushed and
preserved in salt. For fish and invertebrate specimens,
muscle tissue (taken from large specimens following
euthanasia via whole body immersion in MS 222) or whole
body minus viscera or shell (for small specimens) was
obtained and preserved in salt following Arrington and
Winemiller (2002). In the lab, tissue samples were soaked
and rinsed in distilled water to remove all salt, then dried in
an oven at 608C for 48 h (Arrington and Winemiller, 2002).
Dried samples were ground to a fine powder with mortar and
pestle then stored in clean glass vials. Sub-samples of each
ground sample were weighed to the nearest 0.01mg and
pressed into Ultra-Pure tin capsules (Costech, Valencia,
CA), and sent to the Analytical Chemistry Laboratory of the
Institute of Ecology, University of Georgia, for analysis of
Copyright # 2010 John Wiley & Sons, Ltd. River. Res. Applic. (2010)
DOI: 10.1002/rra
K. O. WINEMILLER ET AL.
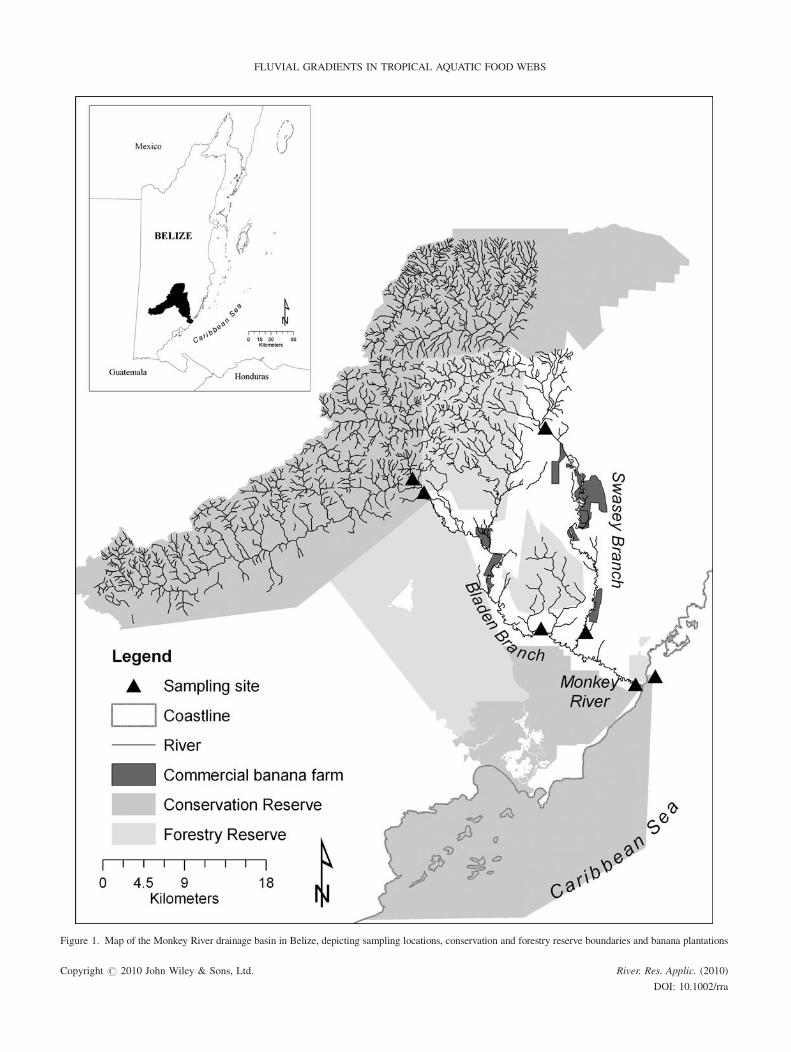
Figure 1. Map of the Monkey River drainage basin in Belize, depicting sampling locations, conservation and forestry reserve boundaries and banana plantations
Copyright # 2010 John Wiley & Sons, Ltd. River. Res. Applic. (2010)
DOI: 10.1002/rra
FLUVIAL GRADIENTS IN TROPICAL AQUATIC FOOD WEBS
carbon and nitrogen stable isotope ratios. Results are
expressed in delta notation (parts per thousand deviation
from a standard material): d13C or d15N¼ [(Rsample/
Rstandard)�1] � 1000; where R¼ 13C/12C or 15N/14N. The
standard material for carbon is Pee Dee Belemnite (PDB)
limestone, and the nitrogen standard is atmospheric
nitrogen. Standard deviations of d13C and d15N analyses
were 0.09 and 0.12%, respectively for animal replicates, and
0.44 and 0.48%, respectively for primary producer
replicates.
Statistical analyses
Carbon isotopic signatures of dietary items are conserved
within 1% in consumer tissues (McCutchan et al., 2003),
and allow evaluation of the relative importance of carbon
sources ultimately supporting secondary production when
source isotopic values are distinct (Peterson and Fry, 1987).
Nitrogen isotope ratios of consumer tissues can be used to
determine consumer trophic position because they are
typically enriched 2.5–3.4% relative to their food (Post
2002; Vanderklift and Ponsard, 2003). Bi-plots of d13C and
d15N values of basal resources and consumers were used to
depict food web structure and patterns of isotopic variation
along the longitudinal fluvial gradient of the Bladen–
Monkey River. Relative positions of taxa on the d13C axis
allow for comparison of the basal carbon sources supporting
secondary production in the species assemblages, and the
positions of taxa within communities for d15N indicate
trophic position (Peterson and Fry, 1987). Carbon and
nitrogen isotope ratios of consumer assemblages (fishes and
invertebrates) were compared among sites using MANOVA.
Bonferroni-corrected pairwise comparisons were calculated
for significant main effects. Observed differences in
assemblage-level C and N isotope ratios of consumers
were interpreted relative to source isotope ratios at each site
along the fluvial gradient.
Differences in baseline d15N among local species
assemblages may indicate anthropogenic nitrogen inputs,
such as from sewage or agricultural practices (Cabana and
Rasmussen, 1996; Anderson and Cabana, 2005). Human
population density and agricultural intensity in watersheds
exhibit a positive correlation with baseline d15N in aquatic
food webs. We used herbivorous and detritivorous fishes as
indicators of the N baseline at each site because they are
generally larger and more mobile primary consumers than
invertebrates, and therefore provide greater temporal and
spatial integration of source N variability (Cabana and
Rasmussen, 1996; Hoeinghaus et al., 2008). Nitrogen
isotope signatures of herbivorous and detritivorous fishes
were compared among sites using ANOVA. Two samples of
white mullet,Mugil curema, collected at the Lower Monkey
River were excluded from this analysis because their carbon
and nitrogen isotope signatures indicated that they recently
moved into this site from the seagrass/mangrove zone
(Tables I and II). Differences in surface geology affect
baseline N conditions between the Bladen and Swasey
watersheds (Esselman et al., 2006). Therefore, in our
comparisons of baseline d15N in aquatic food webs in
relation to watershed impacts, comparatively pristine upper
reaches of each branch (i.e. Upper Swasey, Firetail Creek
and Upper Bladen) are considered reference conditions for
lower portions of the respective watersheds that are
impacted by banana plantations and human populations.
RESULTS
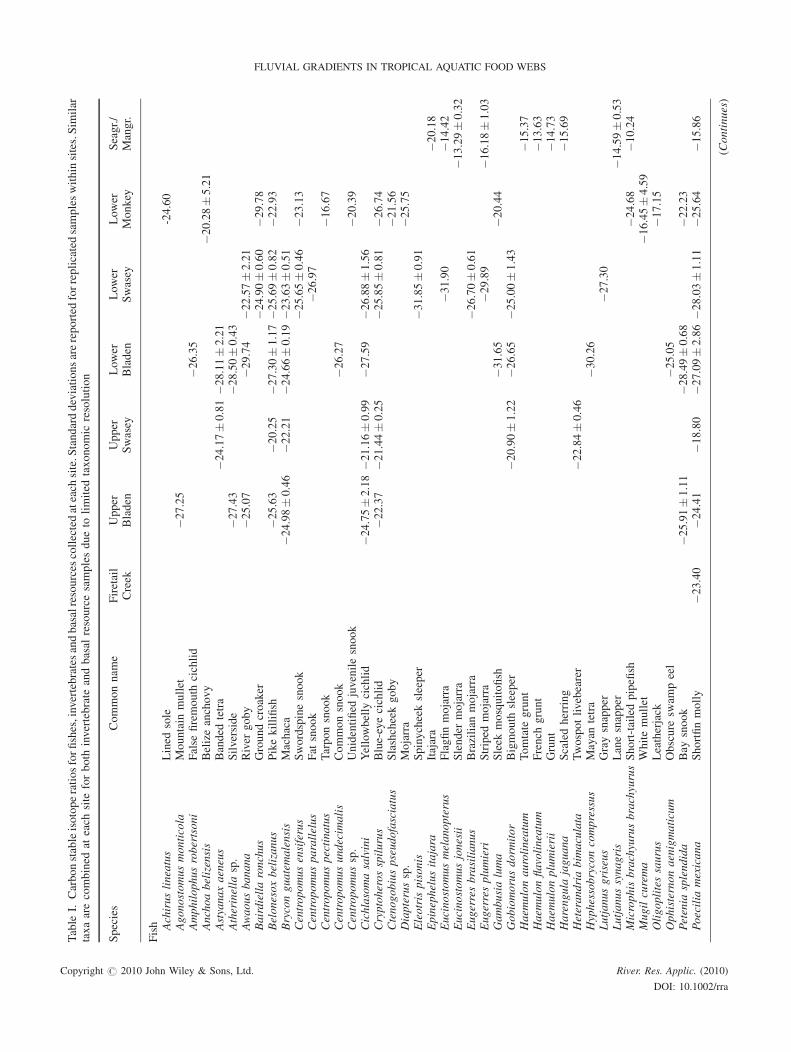
A total of 269 samples were collected for isotope analysis,
comprised by 53 fish species, 6 general invertebrate groups,
and 9 basal carbon source groups (Tables I and II). Fewer
consumer species were present, and thus collected, at upland
sites (Firetail Creek, Upper Bladen and Upper Swasey) than
at middle and lower reaches of the watershed (Tables I
and II, Figure 2). Species and feeding guild composition of
consumer assemblages changed along the fluvial gradient.
Sampling sites located lower in the fluvial gradient (Lower
Monkey River, seagrass/mangrove) had greater numbers of
estuarine and marine species (e.g. Great barracuda, Mayan
sea catfish, several species of grunt), and piscivores became
more conspicuous components of the assemblages when
moving from upland sites towards the coast (Tables I and II,
Figure 2).
The majority of basal sources collected along the fluvial
gradient had carbon isotope ratios between �30 and �20%(Table I). d13C of riparian vegetation was approximately
�30% across all sites, and coarse detritus had similar carbon
isotope ratios indicating that it was derived from leaf fall
from the riparian zone. Aquatic macrophytes had slightly
enriched carbon isotope ratios (between �22 and �29%)
relative to riparian vegetation. Contrary to the consistency
observed for d13C of riparian vegetation along the fluvial
gradient, filamentous algae became more enriched along the
downstream fluvial gradient, ranging from approximately
�38% at Firetail Creek to approximately �14% at the
seagrass/mangrove site. Along with 13C-enriched filamen-
tous algae, other dominant basal carbon sources in the
seagrass/mangrove zone (macroalgae and submerged
aquatic vegetation) were also comparatively 13C-enriched
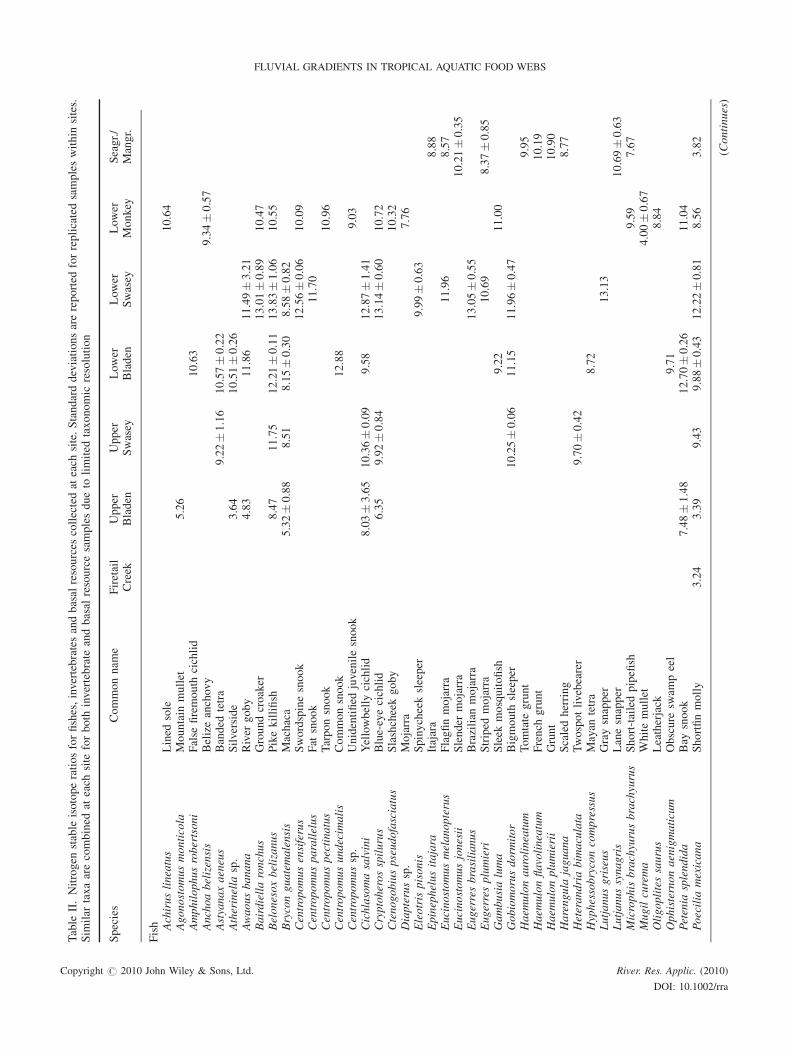
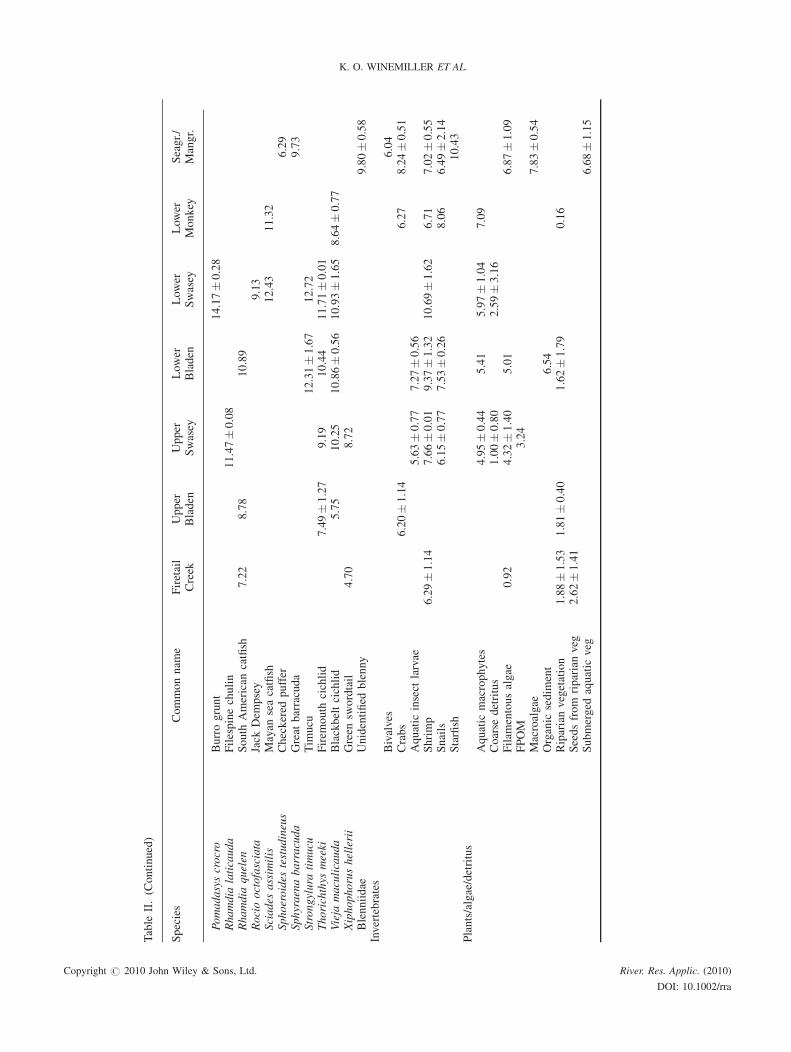
relative to dominant sources in the freshwater sites. d15N of
basal sources was comparable across sites, with the notable
exception that in-stream production sources, namely
filamentous algae and aquatic macrophytes, became
considerably 15N-enriched at middle reaches of the fluvial
gradient relative to upper reaches and riparian sources
(Table II).
Copyright # 2010 John Wiley & Sons, Ltd. River. Res. Applic. (2010)
DOI: 10.1002/rra
K. O. WINEMILLER ET AL.
Table
I.Carbonstableisotoperatiosforfishes,invertebratesandbasalresources
collectedateach
site.S
tandarddeviationsarereported
forreplicatedsampleswithinsites.Sim
ilar
taxaarecombined
ateach
site
forboth
invertebrate
andbasal
resourcesamplesdueto
limited
taxonomic
resolution
Species
Commonnam
eFiretail
Creek
Upper
Bladen
Upper
Swasey
Lower
Bladen
Lower
Swasey
Lower
Monkey
Seagr./
Mangr.
Fish Achiruslineatus
Lined
sole
-24.60
Agonostomusmonticola
Mountain
mullet
�27.25
Amphilophusrobertsoni
False
firemouth
cichlid
�26.35
Anchoabelizensis
Belizeanchovy
�20.28�5.21
Astyanaxaeneus
Banded
tetra
�24.17�0.81�2
8.11�2.21
Atherinella
sp.
Silverside
�27.43
�28.50�0.43
Awaousbanana
River
goby
�25.07
�29.74
�22.57�2.21
Bairdiellaronchus
Groundcroaker
�24.90�0.60
�29.78
Belonesoxbelizanus
Pikekillifish
�25.63
�20.25
�27.30�1.17�2
5.69�0.82
�22.93
Bryconguatemalensis
Machaca
�24.98�0.46
�22.21
�24.66�0.19�2
3.63�0.51
Centropomusensiferus
Swordspinesnook
�25.65�0.46
�23.13
Centropomusparallelus
Fat
snook
�26.97
Centropomuspectinatus
Tarponsnook
�16.67
Centropomusundecimalis
Commonsnook
�26.27
Centropomussp.
Unidentified
juvenilesnook
�20.39
Cichlasomasalvini
Yellowbelly
cichlid
�24.75�2.18�2
1.16�0.99
�27.59
�26.88�1.56
Cryptoherosspilurus
Blue-eyecichlid
�22.37
�21.44�0.25
�25.85�0.81
�26.74
Ctenogobiuspseudofasciatus
Slashcheekgoby
�21.56
Diapterussp.
Mojarra
�25.75
Eleotris
pisonis
Spinycheeksleeper
�31.85�0.91
Epinephelusitajara
Itajara
�20.18
Eucinostomusmelanopterus
Flagfinmojarra
�31.90
�14.42
Eucinostomusjonesii
Slender
mojarra
�13.29�0.32
Eugerresbrasilianus
Brazilian
mojarra
�26.70�0.61
Eugerresplumieri
Striped
mojarra
�29.89
�16.18�1.03
Gambusialuma
Sleek
mosquitofish
�31.65
�20.44
Gobiomorusdorm
itor
Bigmouth
sleeper
�20.90�1.22
�26.65
�25.00�1.43
Haem
ulonaurolineatum
Tomtate
grunt
�15.37
Haem
ulonflavolineatum
French
grunt
�13.63
Haem
ulonplumierii
Grunt
�14.73
Harengula
jaguana
Scaledherring
�15.69
Heterandriabimaculata
Twospotlivebearer
�22.84�0.46
Hyphessobryconcompressus
Mayan
tetra
�30.26
Lutjanusgriseus
Graysnapper
�27.30
Lutjanussynagris
Lanesnapper
�14.59�0.53
MicrophisbrachyurusbrachyurusShort-tailedpipefish
�24.68
�10.24
Mugilcurema
Whitemullet
�16.45�4.59
Oligoplitessaurus
Leatherjack
�17.15
Ophisternonaenigmaticum
Obscure
swam
peel
�25.05
Petenia
splendida
Bay
snook
�25.91�1.11
�28.49�0.68
�22.23
Poecilia
mexicana
Shortfinmolly
�23.40
�24.41
�18.80
�27.09�2.86�2
8.03�1.11
�25.64
�15.86
(Continues)
Copyright # 2010 John Wiley & Sons, Ltd. River. Res. Applic. (2010)
DOI: 10.1002/rra
FLUVIAL GRADIENTS IN TROPICAL AQUATIC FOOD WEBS

Table
I.(Continued)
Species
Commonnam
eFiretail
Creek
Upper
Bladen
Upper
Swasey
Lower
Bladen
Lower
Swasey
Lower
Monkey
Seagr./
Mangr.
Pomadasyscrocro
Burrogrunt
�26.06�0.01
Rhamdia
laticauda
Filespinechulin
�21.42�0.94
Rhamdia
quelen
South
American
catfish
�23.82
�25.84
�25.28
Rociooctofasciata
Jack
Dem
psey
�29.12
Sciades
assimilis
Mayan
seacatfish
�24.14
�23.05
Sphoeroides
testudineus
Checkered
puffer
�16.70
Sphyraenabarracuda
Great
barracuda
�14.51
Strongylura
timucu
Tim
ucu
�24.23�3.20
�25.91
Thorichthys
meeki
Firem
outh
cichlid
�25.18�0.75
�22.78
�28.00
�25.43�0.73
Vieja
maculicauda
Blackbeltcichlid
�24.86
�21.41
�26.22�0.35�2
6.14�0.61�2
6.12�0.83
Xiphophorushellerii
Green
swordtail
�23.25
�21.73
Blenniidae
Unidentified
blenny
� 13.50�2.00
Invertebrates
Bivalves
�21.73
Crabs
�24.60�1.16
�24.28
�11.91�3.40
Aquatic
insect
larvae
�24.25�0.66�2
7.73�3.05
Shrimp
�24.95�3.70
�22.05�0.99�2
7.68�1.47�2
5.33�0.87
�25.51
�14.66�2.38
Snails
�20.49�2.19�2
0.13�1.03
�20.37
�15.05�4.12
Starfish
�17.36
Plants/algae/detritus
Aquatic
macrophytes
�22.16�0.04
�26.68
�28.91�0.52
�28.92
Coarse
detritus
�29.93�0.48
�31.33�1.22
Filam
entousalgae
�37.94
�25.84�1.07
�22.02
� 14.24�0.29
FPOM
�27.85
Macroalgae
�20.31�5.33
Organic
sedim
ent
�23.40
Riparianvegetation
�30.37�0.95�3
0.36�1.43
�30.50�1.50
�29.81
Seedsfrom
riparianveg
�28.37�1.79
Submerged
aquatic
veg
�8.97�1.36
Copyright # 2010 John Wiley & Sons, Ltd. River. Res. Applic. (2010)
DOI: 10.1002/rra
K. O. WINEMILLER ET AL.
Table
II.Nitrogen
stable
isotoperatiosforfishes,invertebratesandbasal
resources
collectedat
each
site.Standarddeviationsarereported
forreplicatedsampleswithin
sites.
Sim
ilar
taxaarecombined
ateach
site
forboth
invertebrate
andbasal
resourcesamplesdueto
limited
taxonomic
resolution
Species
Commonnam
eFiretail
Creek
Upper
Bladen
Upper
Swasey
Lower
Bladen
Lower
Swasey
Lower
Monkey
Seagr./
Mangr.
Fish Achiruslineatus
Lined
sole
10.64
Agonostomusmonticola
Mountain
mullet
5.26
Amphilophusrobertsoni
False
firemouth
cichlid
10.63
Anchoabelizensis
Belizeanchovy
9.34�0.57
Astyanaxaeneus
Banded
tetra
9.22�1.16
10.57�0.22
Atherinella
sp.
Silverside
3.64
10.51�0.26
Awaousbanana
River
goby
4.83
11.86
11.49�3.21
Bairdiellaronchus
Groundcroaker
13.01�0.89
10.47
Belonesoxbelizanus
Pikekillifish
8.47
11.75
12.21�0.11
13.83�1.06
10.55
Bryconguatemalensis
Machaca
5.32�0.88
8.51
8.15�0.30
8.58�0.82
Centropomusensiferus
Swordspinesnook
12.56�0.06
10.09
Centropomusparallelus
Fat
snook
11.70
Centropomuspectinatus
Tarponsnook
10.96
Centropomusundecimalis
Commonsnook
12.88
Centropomussp.
Unidentified
juvenilesnook
9.03
Cichlasomasalvini
Yellowbelly
cichlid
8.03�3.65
10.36�0.09
9.58
12.87�1.41
Cryptoherosspilurus
Blue-eyecichlid
6.35
9.92�0.84
13.14�0.60
10.72
Ctenogobiuspseudofasciatus
Slashcheekgoby
10.32
Diapterussp.
Mojarra
7.76
Eleotris
pisonis
Spinycheeksleeper
9.99�0.63
Epinephelusitajara
Itajara
8.88
Eucinostomusmelanopterus
Flagfinmojarra
11.96
8.57
Eucinostomusjonesii
Slender
mojarra
10.21�0.35
Eugerresbrasilianus
Brazilian
mojarra
13.05�0.55
Eugerresplumieri
Striped
mojarra
10.69
8.37�0.85
Gambusialuma
Sleek
mosquitofish
9.22
11.00
Gobiomorusdorm
itor
Bigmouth
sleeper
10.25�0.06
11.15
11.96�0.47
Haem
ulonaurolineatum
Tomtate
grunt
9.95
Haem
ulonflavolineatum
French
grunt
10.19
Haem
ulonplumierii
Grunt
10.90
Harengula
jaguana
Scaledherring
8.77
Heterandriabimaculata
Twospotlivebearer
9.70�0.42
Hyphessobryconcompressus
Mayan
tetra
8.72
Lutjanusgriseus
Graysnapper
13.13
Lutjanussynagris
Lanesnapper
10.69�0.63
Microphisbrachyurusbrachyurus
Short-tailedpipefish
9.59
7.67
Mugilcurema
Whitemullet
4.00�0.67
Oligoplitessaurus
Leatherjack
8.84
Ophisternonaenigmaticum
Obscure
swam
peel
9.71
Petenia
splendida
Bay
snook
7.48�1.48
12.70�0.26
11.04
Poecilia
mexicana
Shortfinmolly
3.24
3.39
9.43
9.88�0.43
12.22�0.81
8.56
3.82
(Continues)
Copyright # 2010 John Wiley & Sons, Ltd. River. Res. Applic. (2010)
DOI: 10.1002/rra
FLUVIAL GRADIENTS IN TROPICAL AQUATIC FOOD WEBS
Table
II.(Continued)
Species
Commonnam
eFiretail
Creek
Upper
Bladen
Upper
Swasey
Lower
Bladen
Lower
Swasey
Lower
Monkey
Seagr./
Mangr.
Pomadasyscrocro
Burrogrunt
14.17�0.28
Rhamdia
laticauda
Filespinechulin
11.47�0.08
Rhamdia
quelen
South
American
catfish
7.22
8.78
10.89
Rociooctofasciata
Jack
Dem
psey
9.13
Sciades
assimilis
Mayan
seacatfish
12.43
11.32
Sphoeroides
testudineus
Checkered
puffer
6.29
Sphyraenabarracuda
Great
barracuda
9.73
Strongylura
timucu
Tim
ucu
12.31�1.67
12.72
Thorichthys
meeki
Firem
outh
cichlid
7.49�1.27
9.19
10.44
11.71�0.01
Vieja
maculicauda
Blackbeltcichlid
5.75
10.25
10.86�0.56
10.93�1.65
8.64�0.77
Xiphophorushellerii
Green
swordtail
4.70
8.72
Blenniidae
Unidentified
blenny
9.80�0.58
Invertebrates
Bivalves
6.04
Crabs
6.20�1.14
6.27
8.24�0.51
Aquatic
insect
larvae
5.63�0.77
7.27�0.56
Shrimp
6.29�1.14
7.66�0.01
9.37�1.32
10.69�1.62
6.71
7.02�0.55
Snails
6.15�0.77
7.53�0.26
8.06
6.49�2.14
Starfish
10.43
Plants/algae/detritus
Aquatic
macrophytes
4.95�0.44
5.41
5.97�1.04
7.09
Coarse
detritus
1.00�0.80
2.59�3.16
Filam
entousalgae
0.92
4.32�1.40
5.01
6.87�1.09
FPOM
3.24
Macroalgae
7.83�0.54
Organic
sedim
ent
6.54
Riparianvegetation
1.88�1.53
1.81�0.40
1.62�1.79
0.16
Seedsfrom
riparianveg
2.62�1.41
Submerged
aquatic
veg
6.68�1.15
Copyright # 2010 John Wiley & Sons, Ltd. River. Res. Applic. (2010)
DOI: 10.1002/rra
K. O. WINEMILLER ET AL.
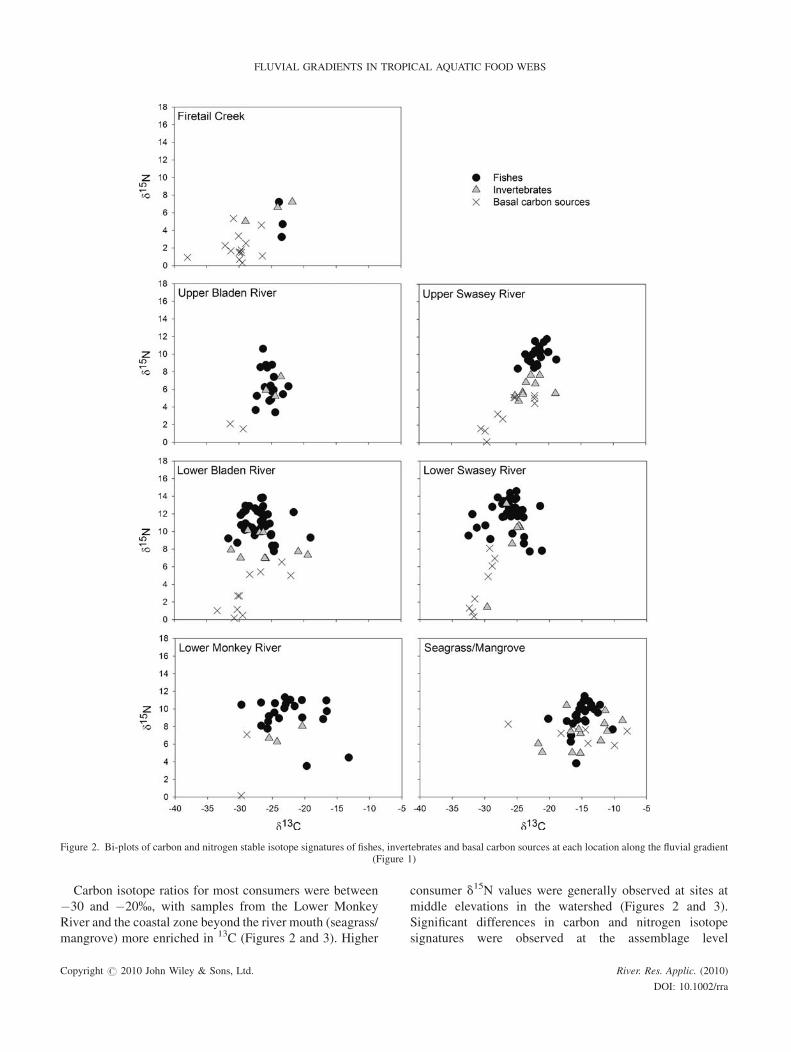
Carbon isotope ratios for most consumers were between
�30 and �20%, with samples from the Lower Monkey
River and the coastal zone beyond the river mouth (seagrass/
mangrove) more enriched in 13C (Figures 2 and 3). Higher
consumer d15N values were generally observed at sites at
middle elevations in the watershed (Figures 2 and 3).
Significant differences in carbon and nitrogen isotope
signatures were observed at the assemblage level
Figure 2. Bi-plots of carbon and nitrogen stable isotope signatures of fishes, invertebrates and basal carbon sources at each location along the fluvial gradient(Figure 1)
Copyright # 2010 John Wiley & Sons, Ltd. River. Res. Applic. (2010)
DOI: 10.1002/rra
FLUVIAL GRADIENTS IN TROPICAL AQUATIC FOOD WEBS
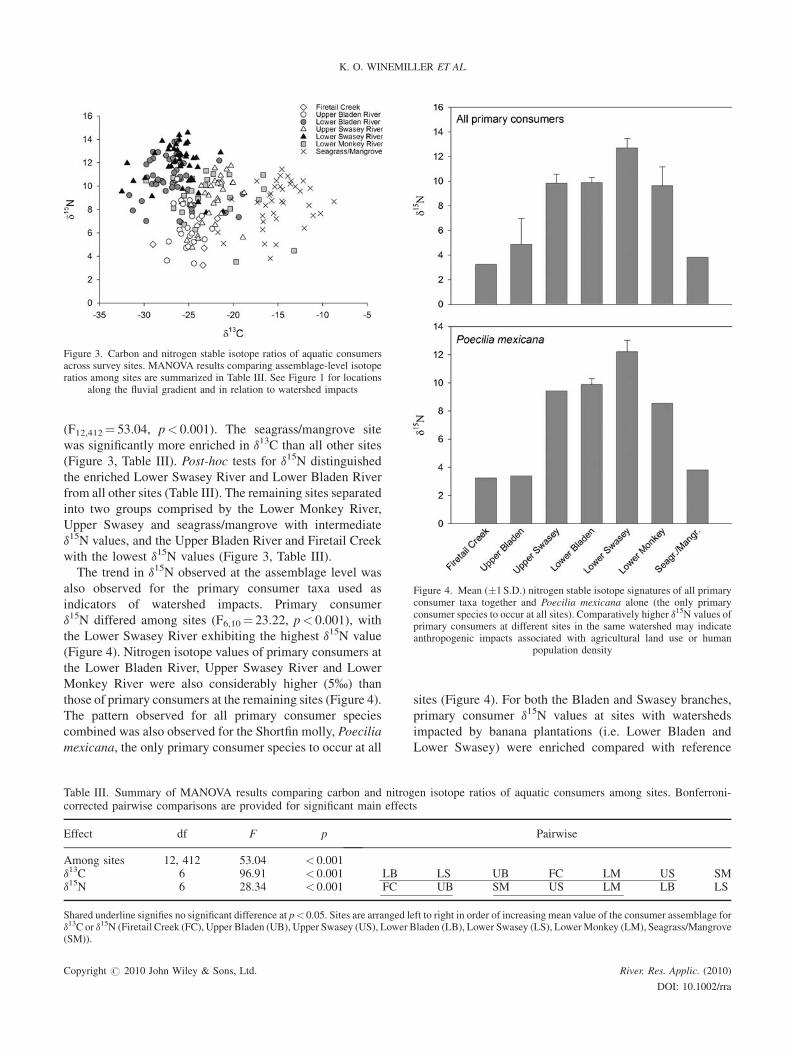
(F12,412¼ 53.04, p< 0.001). The seagrass/mangrove site
was significantly more enriched in d13C than all other sites
(Figure 3, Table III). Post-hoc tests for d15N distinguished
the enriched Lower Swasey River and Lower Bladen River
from all other sites (Table III). The remaining sites separated
into two groups comprised by the Lower Monkey River,
Upper Swasey and seagrass/mangrove with intermediate
d15N values, and the Upper Bladen River and Firetail Creek
with the lowest d15N values (Figure 3, Table III).
The trend in d15N observed at the assemblage level was
also observed for the primary consumer taxa used as
indicators of watershed impacts. Primary consumer
d15N differed among sites (F6,10¼ 23.22, p< 0.001), with
the Lower Swasey River exhibiting the highest d15N value
(Figure 4). Nitrogen isotope values of primary consumers at
the Lower Bladen River, Upper Swasey River and Lower
Monkey River were also considerably higher (5%) than
those of primary consumers at the remaining sites (Figure 4).
The pattern observed for all primary consumer species
combined was also observed for the Shortfin molly, Poecilia
mexicana, the only primary consumer species to occur at all
sites (Figure 4). For both the Bladen and Swasey branches,
primary consumer d15N values at sites with watersheds
impacted by banana plantations (i.e. Lower Bladen and
Lower Swasey) were enriched compared with reference
Figure 3. Carbon and nitrogen stable isotope ratios of aquatic consumersacross survey sites. MANOVA results comparing assemblage-level isotoperatios among sites are summarized in Table III. See Figure 1 for locations
along the fluvial gradient and in relation to watershed impacts
Table III. Summary of MANOVA results comparing carbon and nitrogen isotope ratios of aquatic consumers among sites. Bonferroni-corrected pairwise comparisons are provided for significant main effects
Effect df F p Pairwise
Among sites 12, 412 53.04 < 0.001d13C 6 96.91 < 0.001 LB LS UB FC LM US SMd15N 6 28.34 < 0.001 FC UB SM US LM LB LS
Shared underline signifies no significant difference at p< 0.05. Sites are arranged left to right in order of increasing mean value of the consumer assemblage ford13C or d15N (Firetail Creek (FC), Upper Bladen (UB), Upper Swasey (US), Lower Bladen (LB), Lower Swasey (LS), LowerMonkey (LM), Seagrass/Mangrove(SM)).
Figure 4. Mean (�1 S.D.) nitrogen stable isotope signatures of all primaryconsumer taxa together and Poecilia mexicana alone (the only primaryconsumer species to occur at all sites). Comparatively higher d15N values ofprimary consumers at different sites in the same watershed may indicateanthropogenic impacts associated with agricultural land use or human
population density
Copyright # 2010 John Wiley & Sons, Ltd. River. Res. Applic. (2010)
DOI: 10.1002/rra
K. O. WINEMILLER ET AL.
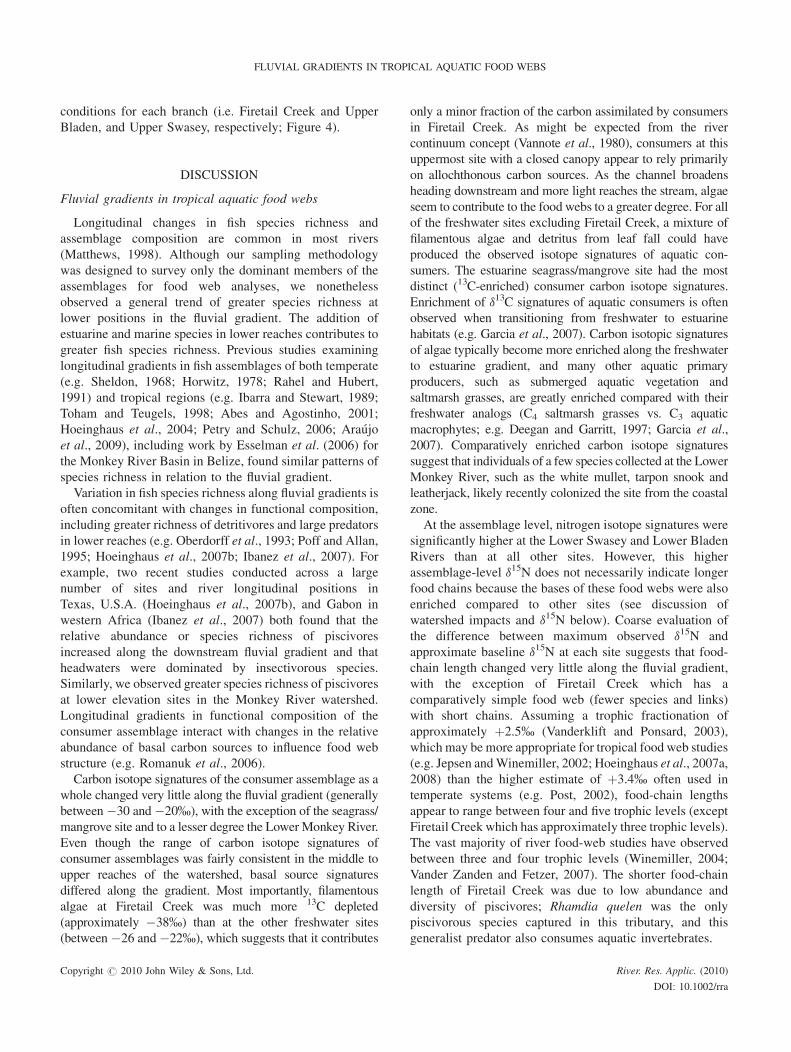
conditions for each branch (i.e. Firetail Creek and Upper
Bladen, and Upper Swasey, respectively; Figure 4).
DISCUSSION
Fluvial gradients in tropical aquatic food webs
Longitudinal changes in fish species richness and
assemblage composition are common in most rivers
(Matthews, 1998). Although our sampling methodology
was designed to survey only the dominant members of the
assemblages for food web analyses, we nonetheless
observed a general trend of greater species richness at
lower positions in the fluvial gradient. The addition of
estuarine and marine species in lower reaches contributes to
greater fish species richness. Previous studies examining
longitudinal gradients in fish assemblages of both temperate
(e.g. Sheldon, 1968; Horwitz, 1978; Rahel and Hubert,
1991) and tropical regions (e.g. Ibarra and Stewart, 1989;
Toham and Teugels, 1998; Abes and Agostinho, 2001;
Hoeinghaus et al., 2004; Petry and Schulz, 2006; Araujo
et al., 2009), including work by Esselman et al. (2006) for
the Monkey River Basin in Belize, found similar patterns of
species richness in relation to the fluvial gradient.
Variation in fish species richness along fluvial gradients is
often concomitant with changes in functional composition,
including greater richness of detritivores and large predators
in lower reaches (e.g. Oberdorff et al., 1993; Poff and Allan,
1995; Hoeinghaus et al., 2007b; Ibanez et al., 2007). For
example, two recent studies conducted across a large
number of sites and river longitudinal positions in
Texas, U.S.A. (Hoeinghaus et al., 2007b), and Gabon in
western Africa (Ibanez et al., 2007) both found that the
relative abundance or species richness of piscivores
increased along the downstream fluvial gradient and that
headwaters were dominated by insectivorous species.
Similarly, we observed greater species richness of piscivores
at lower elevation sites in the Monkey River watershed.
Longitudinal gradients in functional composition of the
consumer assemblage interact with changes in the relative
abundance of basal carbon sources to influence food web
structure (e.g. Romanuk et al., 2006).
Carbon isotope signatures of the consumer assemblage as a
whole changed very little along the fluvial gradient (generally
between�30 and�20%), with the exception of the seagrass/
mangrove site and to a lesser degree the Lower Monkey River.
Even though the range of carbon isotope signatures of
consumer assemblages was fairly consistent in the middle to
upper reaches of the watershed, basal source signatures
differed along the gradient. Most importantly, filamentous
algae at Firetail Creek was much more 13C depleted
(approximately �38%) than at the other freshwater sites
(between �26 and�22%), which suggests that it contributes
only a minor fraction of the carbon assimilated by consumers
in Firetail Creek. As might be expected from the river
continuum concept (Vannote et al., 1980), consumers at this
uppermost site with a closed canopy appear to rely primarily
on allochthonous carbon sources. As the channel broadens
heading downstream and more light reaches the stream, algae
seem to contribute to the food webs to a greater degree. For all
of the freshwater sites excluding Firetail Creek, a mixture of
filamentous algae and detritus from leaf fall could have
produced the observed isotope signatures of aquatic con-
sumers. The estuarine seagrass/mangrove site had the most
distinct (13C-enriched) consumer carbon isotope signatures.
Enrichment of d13C signatures of aquatic consumers is often
observed when transitioning from freshwater to estuarine
habitats (e.g. Garcia et al., 2007). Carbon isotopic signatures
of algae typically become more enriched along the freshwater
to estuarine gradient, and many other aquatic primary
producers, such as submerged aquatic vegetation and
saltmarsh grasses, are greatly enriched compared with their
freshwater analogs (C4 saltmarsh grasses vs. C3 aquatic
macrophytes; e.g. Deegan and Garritt, 1997; Garcia et al.,
2007). Comparatively enriched carbon isotope signatures
suggest that individuals of a few species collected at the Lower
Monkey River, such as the white mullet, tarpon snook and
leatherjack, likely recently colonized the site from the coastal
zone.
At the assemblage level, nitrogen isotope signatures were
significantly higher at the Lower Swasey and Lower Bladen
Rivers than at all other sites. However, this higher
assemblage-level d15N does not necessarily indicate longer
food chains because the bases of these food webs were also
enriched compared to other sites (see discussion of
watershed impacts and d15N below). Coarse evaluation of
the difference between maximum observed d15N and
approximate baseline d15N at each site suggests that food-
chain length changed very little along the fluvial gradient,
with the exception of Firetail Creek which has a
comparatively simple food web (fewer species and links)
with short chains. Assuming a trophic fractionation of
approximately þ2.5% (Vanderklift and Ponsard, 2003),
which may be more appropriate for tropical food web studies
(e.g. Jepsen andWinemiller, 2002; Hoeinghaus et al., 2007a,
2008) than the higher estimate of þ3.4% often used in
temperate systems (e.g. Post, 2002), food-chain lengths
appear to range between four and five trophic levels (except
Firetail Creek which has approximately three trophic levels).
The vast majority of river food-web studies have observed
between three and four trophic levels (Winemiller, 2004;
Vander Zanden and Fetzer, 2007). The shorter food-chain
length of Firetail Creek was due to low abundance and
diversity of piscivores; Rhamdia quelen was the only
piscivorous species captured in this tributary, and this
generalist predator also consumes aquatic invertebrates.
Copyright # 2010 John Wiley & Sons, Ltd. River. Res. Applic. (2010)
DOI: 10.1002/rra
FLUVIAL GRADIENTS IN TROPICAL AQUATIC FOOD WEBS
Watershed impacts and d15N
Previous research in temperate river systems has found
positive correlations between baseline d15N in aquatic food
webs and human population density and agricultural
intensity in the watershed (e.g. Cabana and Rasmussen,
1996; Lake et al., 2001; Anderson and Cabana, 2005).
Nitrogen isotope signatures of primary consumer species
may therefore be useful as indicators of watershed impacts
when compared with a non-impacted reference or historic
condition. Our study system in the Maya Mountain Marine
Area Transect provided a unique opportunity to test this
generalization within a tropical watershed with a diverse
biota and different agricultural impacts relative to temperate
settings (i.e. banana plantations vs. tilled row cropping).
Large tracts of the Monkey River Basin remain in nearly
pristine condition and are protected within reserves (e.g. the
region drained by Firetail Creek and the Upper Bladen
River), providing suitable reference conditions for com-
parison with other sites (e.g. Upper and Lower Swasey River
sites) with watersheds impacted by banana plantations and
human settlement.
As predicted, based on findings from temperate regions,
d15N of primary consumers in impacted sites was
significantly greater than in pristine reference sites. The
Lower Swasey River adjacent to banana plantations had the
highest observed nitrogen isotope values for primary
consumers (approximately 13%), and watershed impacts
appear to continue downstream from the Swasey River into
the Monkey River mainstem. Primary consumers in upper
reaches of the Bladen watershed had d15N values of
approximately 4%, whereas primary consumers in the
Lower Bladen River above the confluence with the Swasey
River had d15N values of approximately 10%. Similarly for
the Swasey branch, d15N values of primary consumers at the
impacted site were enriched compared to the upstream
reference site. Effects of geology on N- versus P-limitation
of aquatic primary production between the Bladen and
Swasey branches (Esselman et al., 2006) may affect the
magnitude of N-enrichment in aquatic food webs at sites
within impacted watersheds. Our findings support previous
research from temperate systems, and highlight the utility of
d15N as an indicator of watershed impacts in diverse tropical
river networks. Continued surveys of target taxa may allow
natural resource managers to identify increases in watershed
impacts or expansion of impacted zones into formerly
unimpacted watersheds.
Conclusions and conservation implications
Fluvial gradients in river networks affect aquatic food
webs through changes in the relative availability of basal
carbon sources and the richness and functional composition
of the consumer assemblage. Our findings from the Monkey
River drainage in Belize are consistent with food web
studies conducted in temperate regions that found similar
patterns of carbon source availability and functional
composition of the consumer assemblage along fluvial
gradients. Stable nitrogen isotope ratios of primary
consumers were strongly associated with the level of
agricultural and human settlement in their watersheds.
Assessment of primary consumer d15N may be a feasible
option for monitoring watershed impacts on aquatic food
webs in service of the ridge-to-reef conservation strategy for
the MMMAT and in other tropical regions.
ACKNOWLEDGEMENTS
Institutional Support in Belize was provided by Jacob and
Kelly Marlin of the Belize Foundation for Research and
Environmental Education (BFREE), the Belize Forestry
Department and the Belize Fisheries Department. Funding
for this project was provided by NSF Undergraduate Men-
toring in Environmental Biology grant #0203992, NSF DEB
grant #0089834 and the International Sportfish Fund.
REFERENCES
Abes SS, Agostinho AA. 2001. Spatial patterns in fish distributions and
structure of the ichthyocenosis in the Agua Nanci stream, Upper Parana
River Basin, Brazil. Hydrobiologia 445: 217–227.
Allan JD. 2004. Landscapes and riverscapes: the influence of land use on
stream ecosystems. Annual Review of Ecology, Evolution & Systematics
35: 257–284.
Anderson C, Cabana G. 2005. d15N in riverine food webs: effects ofN inputs
from agricultural watersheds. Canadian Journal of Fisheries and Aquatic
Sciences 62: 333–340.
Araujo FG, Pinto BCT, Teixeira TP. 2009. Longitudinal patterns of fish
assemblages in a large tropical river of southeastern Brazil: evaluating
environmental influences and some concepts in river ecology. Hydro-
biologia 618: 89–107.
Arrington DA, Winemiller KO. 2002. Preservation effects on stable isotope
analysis of fish muscle. Transactions of the American Fisheries Society
131: 337–342.
Cabana G, Rasmussen JB. 1996. Comparison of aquatic food chains using
nitrogen isotopes. Proceedings of the National Academy of Sciences of
the United States of America 93: 10844–10847.
Clements DH, Carlisle DM, Lazorchak JM, Johnson PC. 2000. Heavy
metals structure benthic communities in Colorado mountain streams.
Ecological Applications 10: 626–638.
Deegan LA, Garritt RH. 1997. Evidence for spatial variability in estuarine
food webs. Marine Ecology Progress Series 147: 31–47.
DeBruyn AM, Rasmussen JB. 2002. Quantifying assimilation of sewage-
derived organic matter by riverine benthos. Ecological Applications 12:
511–520.
Esselman PC, Freeman MC, Pringle CM. 2006. Fish-assemblage variation
between geologically defined regions and across a longitudinal gradient
in the Monkey River Basin, Belize. Journal of the North American
Benthological Society 25: 142–156.
Copyright # 2010 John Wiley & Sons, Ltd. River. Res. Applic. (2010)
DOI: 10.1002/rra
K. O. WINEMILLER ET AL.
Garcia AM, Hoeinghaus DJ, Vieira JP, Winemiller KO. 2007. Isotopic
variation of fishes in freshwater and estuarine zones of a large subtropical
coastal lagoon. Estuarine Coastal and Shelf Science 73: 399–408.
Heyman WD, Kjerfve B. 1999. Hydrological and oceanographic consider-
ations for integrated coastal zone management in Southern Belize.
Environmental Management 24: 229–245.
Hoeinghaus DJ, Winemiller KO, Agostinho AA. 2007a. Landscape-scale
hydrologic characteristics differentiate patterns of carbon flow in large-
river food webs. Ecosystems 10: 1019–1033.
Hoeinghaus DJ, Winemiller KO, Agostinho AA. 2008. Hydrogeomorphol-
ogy and river impoundment affect food-chain length in diverse neotro-
pical food webs. Oikos 117: 984–995.
Hoeinghaus DJ, Winemiller KO, Birnbaum JS. 2007b. Local and regional
determinants of stream fish assemblage structure: inferences based on
taxonomic vs. functional groups. Journal of Biogeography 34: 324–338.
Hoeinghaus DJ, Winemiller KO, Taphorn DC. 2004. Compositional change
in fish assemblages along the Andean piedmont—Llanos floodplain
gradient of the rıo Portuguesa, Venezuela. Neotropical Ichthyology 2:
85–92.
Horwitz RJ. 1978. Temporal variability patterns and the distributional
patterns of stream fishes. Ecological Monographs 48: 307–321.
Hynes HBN. 1970.Ecology of RunningWaters. University of Toronto Press:
Toronto.
Ibanez C, Oberdorff T, Teugels G, Mamononekene V, Lavoue S, Fermon Y,
Paugy D, Toham AK. 2007. Fish assemblages structure and function
along environmental gradients in rivers of Gabon (Africa). Ecology of
Freshwater Fish 16: 315–334.
Ibarra M, Stewart DJ. 1989. Longitudinal zonation of sandy beach fishes in
the Napo River Basin, Eastern Ecuador. Copeia 1989: 364–381.
Jepsen DB, Winemiller KO. 2002. Structure of tropical river food webs
revealed by stable isotope ratios. Oikos 96: 46–55.
Kilham SS, Pringle CM. 2000. Food webs in two neotropical stream systems
as revealed by stable isotope ratios. Verhandlungen Internationale Ver-
einigung fur theoretische und angewandte Limnologie 27: 1768–1775.
Lake JL,McKinney RA, Osterman FA, Pruell RJ, Kiddon J, Ryba SA, Libby
AD. 2001. Stable nitrogen isotopes as indicators of anthropogenic
activities in small freshwater systems. Canadian Journal of Fisheries
and Aquatic Sciences 58: 870–878.
Matthews WJ. 1998. Patterns in Freshwater Fish Ecology. Chapman Hall:
New York.
McCutchan JH Jr, Lewis WM, Kendall C, McGrath CC. 2003. Variation in
trophic shift for stable isotope ratios of carbon, nitrogen and sulfur.Oikos
102: 378–390.
Oberdorff T, Guilbert E, Lucchetta JC. 1993. Patterns of fish species
richness in the Seine River Basin, France. Hydrobiologia 259: 157–167.
Peterson BJ, Fry B. 1987. Stable isotopes in ecosystem studies. Annual
Review of Ecology, Evolution and Systematics 18: 293–320.
Petry AC, Schulz UH. 2006. Longitudinal changes and indicator species of
the fish fauna in the subtropical Sinos River, Brazil. Journal of Fish
Biology 69: 272–290.
Poff NL, Allan JD. 1995. Functional organization of stream fish assem-
blages in relation to hydrologic variability. Ecology 76: 606–627.
Post DM. 2002. Using stable isotopes to estimate trophic position: models,
methods, and assumptions. Ecology 83: 703–718.
Power ME, Dietrich WE. 2002. Food webs in river networks. Ecological
Research 17: 451–471.
Rahel FJ, Hubert WA. 1991. Fish assemblages and habitat gradients in a
Rocky Mountain-Great Plains stream: biotic zonation and additive
patterns of community change. Transactions of the American Fisheries
Society 120: 319–332.
Rodiles-Hernandez R, Dıaz-Pardo E, Lyons J. 1999. Patterns in the species
diversity and composition of the fish community of the Lacanja River,
Chiapas, Mexico. Journal of Freshwater Ecology 14: 455–467.
Romanuk TN, Jackson LJ, Post JR, McCauley E, Martinez ND. 2006. The
structure of food webs along river networks. Ecography 29: 3–10.
Saito L, Redd D, Chandra S, Atwell L, Fritsen CH, Rosen MR. 2007.
Quantifying foodweb interactions with simultaneous linear equations:
stable isotope models of the Truckee River, USA. Journal of the North
American Benthological Society 26: 642–662.
Saito L, Rosen MR, Chandra S, Fritsen CH, Arufe JA, Redd C. 2008. Using
semi-permeable membrane devices and stable nitrogen isotopes to detect
anthropogenic influences on the Truckee River, USA. Environmental
Engineering Science 25: 585–600.
Sheldon AL. 1968. Species diversity and longitudinal succession in stream
fishes. Ecology 49: 193–198.
Simon KS, Niyogi DK, Frew RD, Townsend CR. 2007. Nitrogen dynamics
in grassland streams along a gradient of agricultural development.
Limnology and Oceanography 52: 1246–1257.
Thorp JH, Delong MD. 1994. The riverine productivity model: an heuristic
view of carbon sources and organic processing in large river ecosystems.
Oikos 70: 305–308.
Thorp JH, Delong MD. 2002. Dominance of authochthonous
autotrophic carbon in food webs of heterotrophic rivers. Oikos 96:
543–550.
Toham AK, Teugels GG. 1998. Diversity patterns of fish assemblages in the
Lower Ntem River Basin (Cameroon), with notes on potential effects of
deforestation. Archiv fur Hydrobiologie 141: 421–446.
Vander ZandenMJ, Fetzer WW, 2007. Global patterns of aquatic food chain
length. Oikos 116: 1378–1388.
Vanderklift MA, Ponsard S. 2003. Sources of variation in consumer-diet
d15N enrichment: a meta-analysis. Oecologia 136: 169–182.
Vannote RL, Minshall GW, Cummins KW, Sedell JR, Cushing CE. 1980.
The river continuum concept.Canadian Journal of Fisheries and Aquatic
Sciences 37: 130–137.
Verburg P, Kilham SS, Pringle CM, Lips KR, Drake DL. 2007. A stable
isotope study of a neotropical stream food web prior to the extirpation of
its large amphibian community. Journal of Tropical Ecology 23: 643–
651.
Winemiller KO. 1990. Spatial and temporal variation in tropical fish trophic
networks. Ecological Monographs 60: 331–367.
Winemiller KO. 2004. Floodplain river food webs: generalizations and
implications for fisheries management. In Proceedings of the Second
International Symposium on the Management of Large Rivers for Fish-
eries Volume II. Welcomme R Petr T (eds). Regional Office for Asia and
the Pacific: Bangkok, Thailand; 285–309. RAP Publication 2004/16.
Winemiller KO, Leslie MA. 1992. Fish assemblages across a complex,
tropical freshwater/marine ecotone. Environmental Biology of Fishes 34:
29–50.
Copyright # 2010 John Wiley & Sons, Ltd. River. Res. Applic. (2010)
DOI: 10.1002/rra
FLUVIAL GRADIENTS IN TROPICAL AQUATIC FOOD WEBS


![Medical Isotope Production and Use [March 2009] - National Isotope](https://img.pdfslide.net/doc/110x75/62038cd4da24ad121e4ab7b4/medical-isotope-production-and-use-march-2009-national-isotope.jpg)